Abstract
This paper presents a control method for achieving precise robotic contact on complex and curved surfaces in manufacturing and automation. The method combines smooth trajectory planning with contact force control to improve finishing accuracy while reducing processing time. It integrates a Bézier curve with a simplified hexic polynomial implemented through a position-based impedance controller that is enhanced by a novel force corrector unit. The model is referred to as the Adaptive Bézier–Based Impedance Constant Force Controller (ABBIFC), where the Bézier curve length is calculated using Simpson’s rule, and surface orientations are interpolated using quadratic quaternions. A hexic polynomial velocity profile ensures consistent motion speed throughout the process. This method effectively regulates both contact force and positional accuracy, resulting in high-quality surface finishes. Simulation studies and real-time polishing experiments demonstrate the system’s capability to accurately track path, speed, and force, with significantly reduced force errors. This approach advances robotic automation in applications such as polishing, grinding, and other surface finishing tasks by ensuring smooth motion and precise force control.
1. Introduction
Robotic manipulation presents significant challenges for contact optimization, particularly on curved and complex surfaces, due to the intricacies of contact dynamics. In modern industry, robots are increasingly deployed to meet automation demands, replacing manual labor and conventional machinery. This transition has not only stimulated economic growth but also reduced operational risks, noise, and hazards while ensuring higher precision, efficiency, and safety [1]. As a result, research in robotic finishing and construction systems has increasingly focused on optimizing the interaction between the robot’s end effector and its environment [2].
Achieving high quality finishes on complex geometries requires smooth trajectory planning under constant force control. To address this, advanced algorithms such as B–splines, Non–Uniform Rational B–Splines (NURBS), and Bézier curves are widely used to generate continuous and smooth paths [3,4,5]. However, these methods often rely on interpolation techniques to maintain consistent end effector velocity during motion. Point–to–point trajectory planning in Cartesian space has proven particularly effective in ensuring continuous motion along irregular surfaces [6,7,8].
The effectiveness of such trajectory planning strongly depends on reliable force control, which underpins both the safety and accuracy of robotic operations [9]. Since the precision of the contact force directly influences path accuracy and surface quality [10,11], maintaining a constant force is essential for stable and high quality task execution [12]. Despite notable advances, achieving precise position-based force control on curved and complex surfaces remains a persistent challenge [13]. This gap highlights the need for improved approaches that can simultaneously enhance trajectory generation and ensure robust real–time force regulation. The present research aims to address this challenge by proposing a more accurate, stable, and efficient solution for robotic manipulation on intricate geometries.
This paper proposes a novel integration of position–based impedance control for constant force regulation combining Bézier curve interpolation with a high order hexic polynomial under an impedance controller with damper force correction. Specifically designed for robotic contact tasks such as polishing, the method improves both trajectory smoothness and force control by integrating precise path planning with dynamic force adaptation. With respect to existing approaches in the literature, the main contributions of this paper are as follows:
- This paper introduces a novel method that combines Bézier interpolation with a high order hexic polynomial curve within a force control framework. The proposed approach provides a unified solution that significantly improves the smoothness and precision of robotic motion by leveraging the low acceleration and jerk characteristics inherent to high order polynomial formulations.
- This paper introduces a novel component, termed the damping velocity force corrector, designed to improve constant contact force regulation. By mitigating the force errors commonly observed in conventional impedance controllers, this parameter enables more accurate and stable force control, particularly on complex curved surfaces during robotic operations.
- The proposed method is applicable to a wide range of robotic contact operations involving complex and curved surfaces, including polishing, grinding, deburring, cleaning, and other tasks that demand consistent contact force and high surface quality.
This paper is structured as follows: Section 2 provides an overview of related works, and Section 3 presents a detailed description of the proposed method. The simulation study is presented in Section 4, and the experimental study is described in Section 5. Finally, conclusions and a summary are provided in Section 6.
2. Related Works
Significant research efforts have focused on enhancing force and position tracking through single impedance and admittance control techniques. The integration of impedance methods with adaptive strategies has gained considerable attention. Hu and Cao [14] presented a control strategy combining a variable impedance approach with a trajectory designed for dual arm end effectors, ensuring precise position tracking and accurate contact force control. Zheng et al. [15] introduced a controller–based variable impedance strategy with friction compensation which adjusts stiffness based on contact force, showing effectiveness in fracture reduction. Feng et al. [16] proposed a position-based impedance control method to enhance aeroengine part grinding using a stiffness–damping model and Lyapunov–based trajectory adjustment. Shen et al. [17] introduced an impedance–based fuzzy control method for grinding and polishing workpieces with constant contact force, without requiring prior environmental data, and experiments with a self–developed industrial robot validated its effectiveness. Zheng et al. [18] implemented a fuzzy adaptive impedance-based sliding mode control strategy, combining a force residual observer with a fuzzy sliding mode controller to enhance stability, strengthen disturbance rejection, and minimize the steady state error. Li et al. [19] designed a fuzzy adaptive admittance controller leveraging fuzzy inference rules, with simulations and experiments demonstrating robust force tracking across dynamic environments.
To ensure smooth motion of the robotic end effector during contact applications, some path generation methods under force control have been proposed. Mohsin et al. [20] suggested a method for robotic trajectory planning on curved and complex surfaces that incorporates force control and parameter optimization, evaluated through Design of Experiments. In addition, trajectory planning and force control for mobile robots in road environments are achieved using sensor fusion and active force control, enabling collision free navigation from start to goal using a laser simulator [21]. In another study, Tian et al. [22] suggested a robotic trajectory-planning method for curved surfaces, focusing on controlling the actual position and contact force of the robot tool. Wang et al. [23] developed a robotic tool position generation method that includes global interference avoidance for robotic polishing, enabling efficient and accurate collision detection and avoidance. Recent research [24] proposed a constant force control strategy using B–spline curves for polishing curved surfaces. The method improves force consistency, trajectory accuracy, and surface quality compared to traditional controllers. Chen et al. [25] presented a rational Bézier–Based State Fitting Method (BSFM) to calibrate the nonlinear hysteresis in pneumatic constant force systems used in robot applications. Compared to polynomial methods, the BSFM offers smoother, more accurate calibration with a simpler and continuous model. From the perspective of hybrid position–force control, Rani and Kumar [26] proposed an intelligent optimal control strategy for constrained re-configurable manipulators facing system uncertainties. It integrates linear optimal control with RBF neural networks and adaptive robust components to manage nonlinearity and external interactions while guaranteeing asymptotic stability. The effectiveness of an approach is demonstrated through simulations on a 2-DOF manipulator performing multiple tasks. Also, Chiaverini and Sciavicco [27] presented a parallel force–position control method for manipulators that fully exploits sensor data. Force control is prioritized over position to manage conflicts and ensure collision recovery. The approach is analyzed dynamically, simplified to a PID-type controller, and validated on industrial robots. Wang et al. [28] suggested a hybrid force–position controller using adaptive fuzzy control for manipulators in uncertain environments. Position control is achieved via adaptive fuzzy computed torque, and force control via fuzzy PI. Experiments showed improved position accuracy and reduced interaction forces compared to conventional methods. Also, Zhu et al. [29] developed a 3-DOF 2R1T force controlled end effector for robotic polishing with hybrid orientation force control using contact point compensation. Experiments showed significantly improved force accuracy and orientation control over conventional methods.
The previous research on robotic contact-based tasks has identified several persistent challenges, particularly in achieving accurate position-based contact force control, as demonstrated in studies [14,15,16,17,18,19,27,28,29]. While these methods have proven effective in certain scenarios, they often lack the precision needed for simultaneous position and force tracking in complex tasks such as polishing and grinding on intricate surfaces. Additionally, a few studies have attempted to integrate smooth trajectory planning with force control techniques, as seen in [20,21,23,24,25] and similar approaches, to improve motion performance on curved and irregular geometries. Current methods struggle to maintain accurate position and force control on complex, variable surfaces. There is a clear need for a unified solution that balances position accuracy, force regulation, and speed in real time, especially for finishing tasks on complicated surfaces.
3. Proposed Method
Motion planning is essential for robotic accuracy, enabling smooth end effector movement through multiple points [30,31,32]. Traditionally, many robotic manipulators rely on manufacturer-provided path-planning algorithms, which can be programmed via user-friendly teaching pendants. These interfaces allow operators to define motion paths without requiring advanced technical expertise, as illustrated in Figure 1. However, such methods are often limited in flexibility and may not guarantee smooth trajectories or optimal performance in complex tasks, particularly when operating on curved or irregular surfaces.
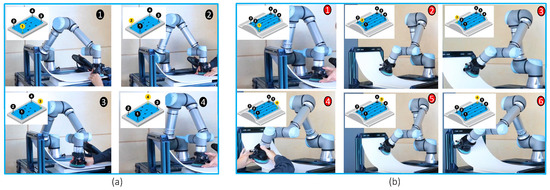
Figure 1.
Panel (a) (1–4, black) shows path planning on a flat surface, while panel (b) (1–6, red) demonstrates how the system adapts to a curved surface.
However, a significant drawback of using teaching pendants for trajectory planning alongside force control is their limited capability to handle complex, adaptive force interactions. Therefore, this paper introduces an alternative approach based on path planning integrated with force control systems, as detailed below:
- First, the Bézier curve method is applied to fit discrete surface points, thereby generating a smooth and continuous trajectory. Subsequently, the arc length parameterization of the curve is computed using Simpson’s rule to ensure accurate path representation and uniform motion along the trajectory.
- Second, a high-order polynomial speed model is employed as an interpolation scheme between the initial and final points, ensuring that the robot’s end effector maintains a nearly constant velocity along the Bézier curve trajectory.
- Third, the Spherical QUADrangles (SQUAD) method, a quaternion-based spline technique, is employed to determine the orientation of the robot’s end effector using Spherical Linear Interpolation (Slerp).
- Finally, the generated trajectory is integrated with an impedance-based constant force controller, incorporating a damping force corrector to simultaneously regulate the end effector’s position and contact force on complex surfaces.
3.1. Rational Bézier Curve
The rational Bézier curve can be employed to fit control points on various types of surfaces, including simple, curved, and complex ones. It can be described by Equation (1) below:
where is a rational Bézier curve of parameter u, are the Bernstein polynomials expressed in Equation (2), are n + 1 control points, and is the weight of these points. The Bernstein polynomials are defined as follows:
The control points in Equation (3) are calculated in reverse, based on specified data points on the surface, and the resulting curve should then be fitted to match the actual shape of a surface. The data points can be specified based on the shape of a surface. To ensure that the fitted Bézier curve closely matches the actual curve, the number of selected data points is typically set to . The control points can then be calculated based on these selected data points as follows:
where z can be expressed by
Assume that represents the p-peripheral basic Bézier curve formula. The length of a Bézier curve, given by , can be approximated using Simpson’s rule:
where is determined by replacing , , , , , , , and . The sample of arc lengths based on all discrete points () can be calculated using Equation (5). Consequently, the parameter of the arc length can be determined as follows:
where , ; and a total Bézier arc length L in Equation (6) is given by .
3.2. Simplified Hexic Curve Model
In this study, maintaining an adjustable and controllable speed for the robot’s end effector along a Bézier curve is crucial for precise path execution. To achieve this, a high–order polynomial algorithm with a trapezoidal smooth speed profile is used. The trapezoidal curve includes three main phases: acceleration, constant speed, and deceleration. The acceleration using a high–order polynomial is described by the following:
In this context, is the acceleration formula, n represents the polynomial degree, t denotes time, and are the polynomial coefficients. To generate the trajectory, solving for the polynomial coefficients in Equation (7) is required. However, this process can be computationally intensive, particularly for high-order polynomials.
To simplify the computational process of trajectory planning, root multiplicity is utilized to construct a polynomial. The joint motion is divided into three phases: acceleration, constant velocity, and deceleration. This approach identifies four key points: the initial point, transition point I (where motion shifts from acceleration to constant velocity), transition point II (where motion shifts from constant velocity to deceleration), and the end point.
For robot end effectors, it is essential that the acceleration is zero at the four key feature points to ensure continuity of acceleration throughout the motion. Consequently, the polynomial used to describe the acceleration profile during an acceleration phase can be expressed as follows:
where is the acceleration during the accelerated phase, B is the polynomial coefficient for this phase, k and l are the root multiplicities, and is the time from the start point to the end of the acceleration phase. To ensure continuity of acceleration at the four key feature points, the polynomial describing an acceleration profile during the acceleration phase includes coefficients B with roots defined by their multiplicities: k at zero and l at transition point I (). In the deceleration phase, the polynomial describing an acceleration profile can be expressed as follows:
where is the acceleration at the declerated phase. In this phase, the polynomial coefficient C is defined, is the time at transition point II, and is the time at the final point. The multiplicities of roots at these points are denoted by m and p, respectively.
Notably, from Equations (8) and (9), it is evident that only one polynomial coefficient needs to be solved for either the acceleration or deceleration phase, irrespective of the polynomial order. The four roots are defined as . Then, after some derivations of accelerations from Equations (8) and (9), the speed model can be obtained as follows:
The position of this trajectory can be obtained by differentiating Equation (10), which results in a sixth–order polynomial. For this reason, we refer to this method as the hexic polynomial curve. As we know, a hexic curve from a high–order polynomial is employed to achieve point–to–point motion. In this paper, the trajectory is extended to incorporate multiple points located between the initial and final points of a Bézier curve. Consequently, the relationship between the parameter u and the arc length parameter s is established using a quintic polynomial. A mathematical model of the Bézier parameter and arc length can be described as follows:
where , are the coefficients determined through the least-squares method, and , are the arc lengths. To obtain , which ensures that speed planning can be achieved, speed interpolation is performed on the designed model described in Equation (11). By sampling the speed interpolation of the designed model, the values that satisfy the high-order polynomial interpolation speed can be calculated. The values are fitted for all data points by the Bézier curve according to the speed planning, allowing it to be generated after determining the speed between and .
3.3. SQUAD Interpolation Method
The SQUAD algorithm is used to maintain the robot’s end effector in a perpendicular orientation relative to the surface during movement. It ensures smooth transitions between curved paths by interpolating rotations, allowing for continuous and seamless changes between successive quaternions of = . The helper quaternion () can be described as follows:
Equation (12) is treated as intermediate control points. Then, the orientation along a sub-curve can be defined by and SQUAD can be described as follows:
The attitude of the end effector is converted into the corresponding quaternion and traversed along . The corresponding intervals are identified in , allowing for the calculation of the attitudes at these points. Assuming that this corresponds to the intervals and for a data point, the interpolation parameter in Equation (13) can be described by Equation (14) below:
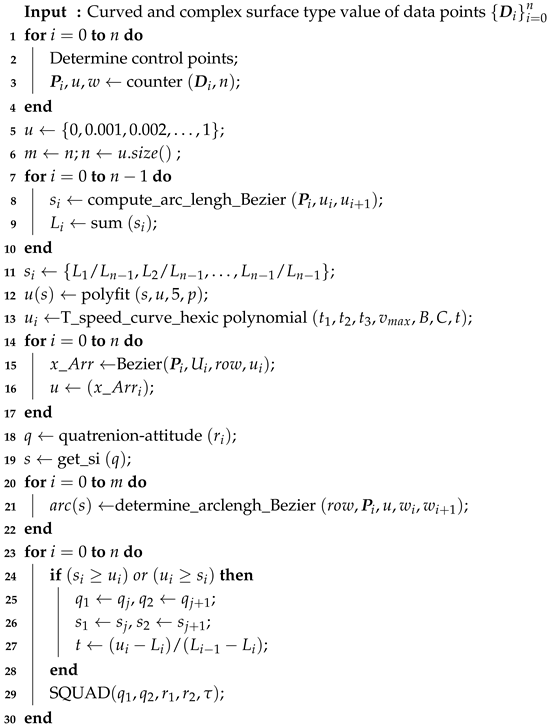
Algorithm 1 combines Bézier curve interpolation, trapezoidal high-order polynomial speed planning, and the SQUAD method to optimize robotic motion. This integration ensures that the robot’s end effector follows a smooth and accurate trajectory while maintaining a stable speed and synchronized pose. The algorithm adjusts the speed and pose dynamically, enabling the robot to move steadily across complex, curved surfaces, enhancing the accuracy of its path, particularly during contact with objects or surfaces.
This method is especially valuable for high precision tasks, like robotic manipulation, and inspection, where both stable velocities and precise orientations are essential. By improving both speed stability and pose synchronization, the algorithm significantly enhances the reliability and accuracy of robotic operations.
3.4. Contact Force Control
The Bézier interpolation algorithm is commonly used for efficient path planning on complex surfaces. However, it may not always achieve the optimal fitting of control points along the path. Ensuring stable contact force during motion is critical for effective operation. By combining teaching mode–based Bézier interpolation with constant force control, we can improve both the accuracy of the robot’s position and the stability of the contact force during motion.
Impedance control is a method that defines the relationship between force and position [33]. This makes it particularly useful in applications like human–robot interaction, where maintaining appropriate force during contact is crucial. Unlike simpler methods such as position or torque control, impedance control provides a more dynamic approach by adjusting the force in relation to position, making it more suitable for maintaining stable contact with objects or surfaces.
| Algorithm 1: Interpolation Interpolation of Bézier curve, hexic polynomials, and the SQUAD approach |
 |
The general form of the position impedance controller, adapted to the position of the Bézier curve, is given by the following:
- denotes the actual interaction force vector between the robot and the environment.
- denotes the desired interaction force vector.
- denotes the actual position vector of the robot end effector.
- denotes the desired position vector of the robot end effector.
- is the desired inertia matrix.
- is the desired damping matrix.
- is the desired stiffness matrix.
- n represents the dimension of the task space (typically for full 6-DOF motion).
The external contact force in Equation (15) in steady state can be represented by the following formula:
where is the environment stiffness, is the environment position, and is the actual position. We assume that robots have ideal model and ; therefore, . By substituting the actual position into Equation (16), we obtain the following:
By putting position error in Equation (17) and then substituting Equation (17) into Equation (15), we obtain the following:
The term in Equation (18) can be re-arranged as follows:
For contact applications like polishing processes, only the steady state is considered. As is known, in the steady state, only position errors are considered, and the position errors in Equation (19) are and . Expression should be stabilized to zero; therefore, the trem [] in the right side should be equal to zero. Thus, Equation (19) can be written in the steady state as follows:
where E is considered the steady-state position error . Then, Equation (20) can be rewritten as follows:
In the rewritten Equation (21), the steady-state position error can be described as follows:
Based on the in Equation (22) and actual contact force , the estimated adaptive stiffness value can be obtained as follows:
Further rewriting Equation (23), the final calculation formula can be obtained in an online manner as follows:
where is the online adaptive stiffness. Using this formula, the robot stiffness can be calculated online while the robot mass parameter and damper parameter are assumed in advance; therefore, Equation (15) can be reformulated as follows:
where F is the force error based on the online adaptive robot stiffness.
Damper Force Corrector
To eliminate force error, a force corrector based on the desired velocity is used. Through a simulation study of the impedance controller described in Equation (15), it is found that the generated force depends on the actual damping value , and the desired velocity () is identically equal to the force error . So, by adding the value of to the formula for force error , the force error will approximately reduce to zero. Then, the new adaptive force tracking error in Equation (25) can be expressed by the following formula:
where is the force error correction, and represents the force corrector. The practical interaction control of the robot and its environment in Equation (26) can be rewritten as
where the control parameters adopted by the system are discrete in the actual control process, and the value of a control trajectory of the robot can be obtained by formula discrete processing and two iterative integrals as follows:
where is the sampling time between a controller and the servo system. Figure 2 presents a schematic diagram of the proposed method, highlighting the integration of two essential components: the adaptive path planning system and the force control system. The combination of these components creates a novel motion–force control framework, which we define as the controller design. This integrated approach enables more precise and adaptive control over both the motion and force during robotic tasks.
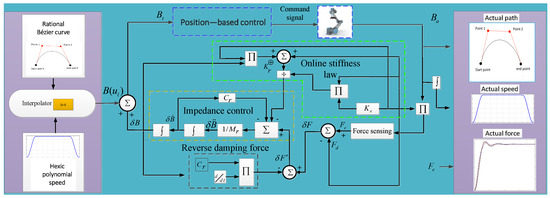
Figure 2.
Schematic diagram of the ABBIFC methodology, which incorporates Bézier–hexic polynomial interpolation and impedance force controller with adaptive stiffness and a force corrector.
3.5. Stability Analysis
The stability conditions of the ABBIFC will be analyzed and discussed in this section using the exponential stability theorem based on the Lyapunov Direct Method (LDM) applied to Equation (29)-(I). The aim of this controller is to reduce the force error in to be as short as possible; therefore, Equation (29)-(I) will come after as the following term:
Multiplying both sides of Equation (30) by v and using the fact that , where v is the Lyapunov parameter and , we can rewrite Equation (30) as follows:
Noticing that we can express the first and last terms as derivatives of simpler quantities, this can be rewritten as follows:
Then, Equation (32) can be rewritten as follows:
The quantity in brackets is the total energy of the system (kinetic plus potential). Since the term is always non–negative, we can rewrite Equation (33) as follows:
Since both , it follows that , with only when . Hence, the system is globally asymptotically stable, and the tracking error and its derivative tend to zero as .
3.6. Learning of Bézier Curve–Based ABBIFC
Impedance control enables real–time adjustments based on contact forces, but it can introduce delays, which may result in discrepancies between the planned and actual paths. Furthermore, when tracking complex surfaces in unknown environments, the gap between the expected and actual contact forces may increase, complicating control and reducing precision.
The description in Figure 3 shows an algorithm that uses a drag–and–teach method to collect data points on curved surfaces, but variable contact forces can reduce position accuracy. To maintain accuracy, a force controller ensures consistent contact force tracking along the polishing path generated by the Bézier interpolation method. In the drag–and–teach method using Bézier interpolation, control data points are fitted to the robot’s position and integrated with a contact force algorithm for smooth movement. The actual contact force and position are measured, and the robot’s position is updated to align with the fitted data when .
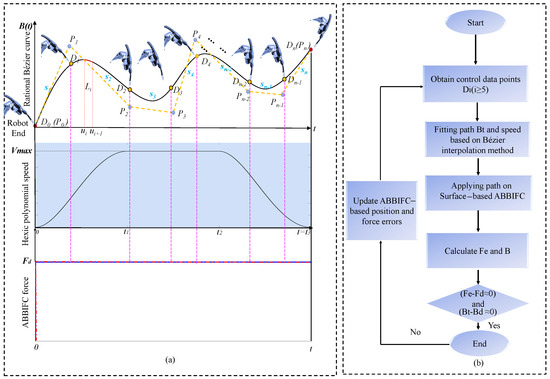
Figure 3.
The proposed method: (a) construction of Bézier−hexic curves under force controller and (b) method for optimization of motion and force accuracy.
In this algorithm, the collected data points are used to generate a Bézier path for planning the robot’s movement. The algorithm calculates the position using interpolation based on a T–speed profile and generates attitude interpolation points using the SQUAD method. By integrating the ABBIFC method, the robot can achieve precise positioning while maintaining constant force application on complex and curved surfaces. This approach is suitable for a wide range of applications that require stable, constant force contact between robots and their environments, such as grinding, polishing, and similar tasks.
4. Simulation Study
To elaborate the ABBIFC methodology, this section presents a simulation example of generating desired paths, force control, and speed planning on curved and complex surfaces. Figure 4 shows a simulation block diagram of the proposed motion and force control.
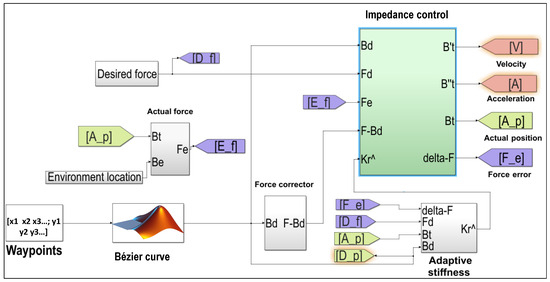
Figure 4.
Simulation block diagram showing the integration of constant force control with a Bézier trajectory to regulate interaction forces during the process.
4.1. Simulation Study in Ideal Conditions (Without External Disturbance)
The simulation parameters were carefully selected to ensure realistic trajectory generation, stable velocity profiles, and effective force regulation during the robotic contact process. The criteria and details are summarized below:
- Bézier Curve Parameters: Weight factor: . Range: , (Simpson’s rule). Additional parameters (, , ) were calculated following Algorithm 1. Control points were set as 5 for the curved surface, 9 for the complex surface, and 11 for the curved–complex surface to accurately represent geometrical complexity.
- Trajectory Modeling: Surfaces were modeled with a modified sine wave function to approximate realistic polishing geometries. Bézier curves and control polygons are presented in Figure 5a–c.
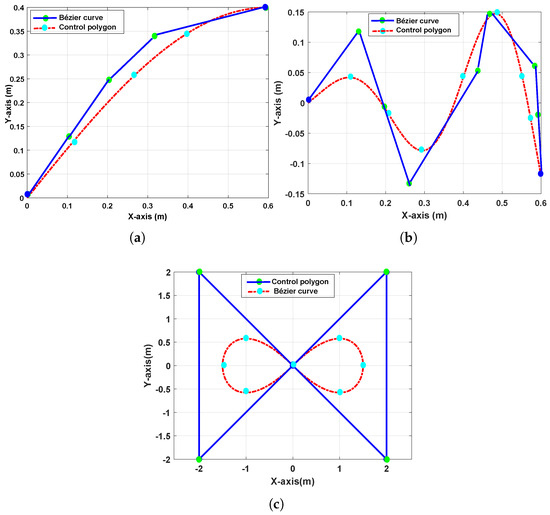 Figure 5. Panels (a–c) show the data and control points on a curved surface, a complex surface, and a curved–complex surface, respectively.
 - Velocity (T–Curve) Parameters: Time intervals: s, s, s. Path length: m for both curved and complex surfaces. These values ensure smooth acceleration/deceleration and stable speed.
- Force Control Parameters: Desired force: N. Virtual mass: N · s2/m. Virtual damping: N · s/m. Transmitted path: based on the generated trajectories.
- Environmental Stiffness Testing: Three stiffness values were tested: = 5000, 3000, and 2000 N/m. These represent different contact conditions and allow robustness evaluation.
4.2. Simulation Results and Discussion of Ideal Conditions
In this simulation, we planned for the robot to move smoothly along the Bézier curve with controllable constant speeds of 0.11 m/s, 0.7 m/s, and 0.65 m/s for curved, complex, and curved–complex surfaces, respectively. These paths served as reference positions for both the proposed ABBIFC and the baseline constant impedance controller.
Initially, the actual positions generated based on contact with the constant impedance controller, shown in Figure 6a–c, exhibited deviations from the planned positions for all three surface types under different environment stiffness conditions.
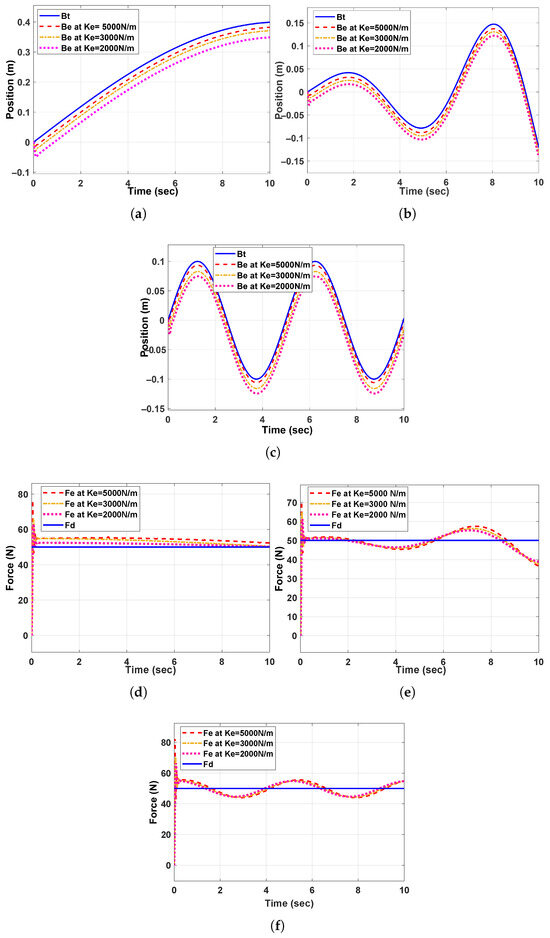
Figure 6.
Panels (a,d) show the position and force tracking based−constant impedance controller for the curved surface, panels (b,e) for the complex surface, and panels (c,f) for the curved–complex surface.
The corresponding contact force tracking errors for the constant-impedance controller are illustrated in Figure 6d–f, with the contact forces for all data points shown in Figure 7a–c. These results indicate that the baseline impedance controller, without reverse damping force, leads to significant force deviations from the desired values. Figure 8a–c show the generated robot stiffness based on the corresponding environment stiffness for the three cases under the constant-impedance controller.
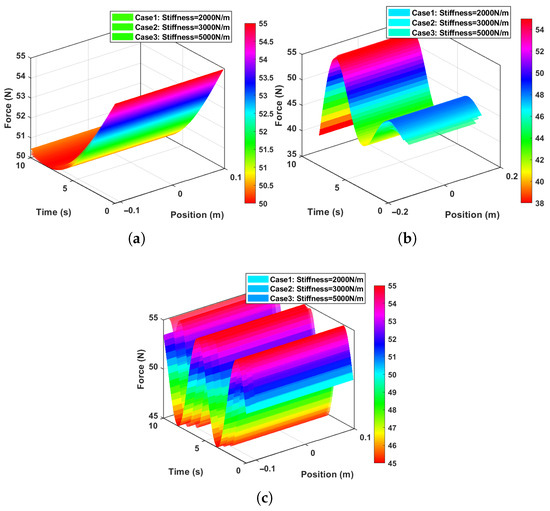
Figure 7.
Panels (a–c) show the force and position tracking based−constant impedance controller for the curved, complex, and curved–complex surfaces, respectively.
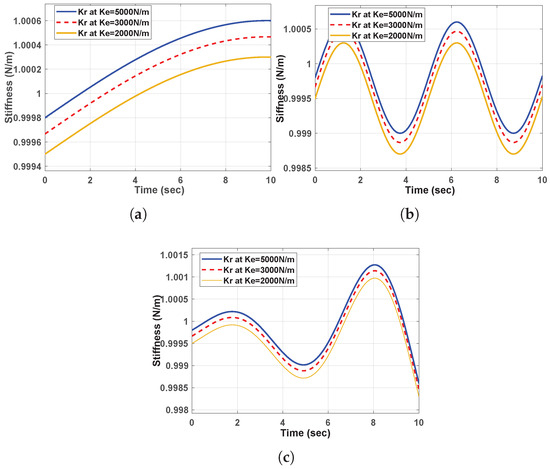
Figure 8.
Panels (a–c) show the robot’s stiffness compensation in response to environment stiffnesses before force correction, for the curved, complex, and curved–complex surfaces, respectively.
Next, we applied the ABBIFC methodology to correct the contact force errors and enhance position accuracy, as shown in Figure 9a–c. After applying the ABBIFC, the force corrections were effectively reduced to zero, as demonstrated in Figure 9d–f, for the three scenarios. The accurate paths, contact forces, and speed tracking for the curved, complex, and curved–complex surfaces using the ABBIFC are shown in Figure 10a–c, Figure 10d–f, and Figure 11a–c, respectively. Accurate contact forces for all data points with the ABBIFC are shown in Figure 12a–c for the three surfaces with varying environment stiffness compared to the baseline controller. Meanwhile, Figure 13a–c represent the stiffness values obtained using the ABBIFC method.
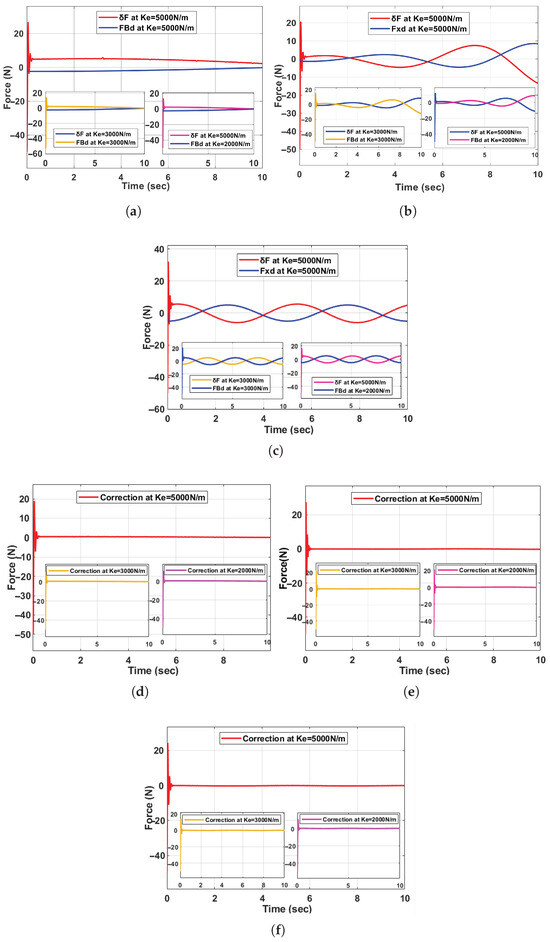
Figure 9.
Panels (a,d) show the corrected force on the curved surface, panels (b,e) on the complex surface, and panels (c,f) on the curved−complex surface.
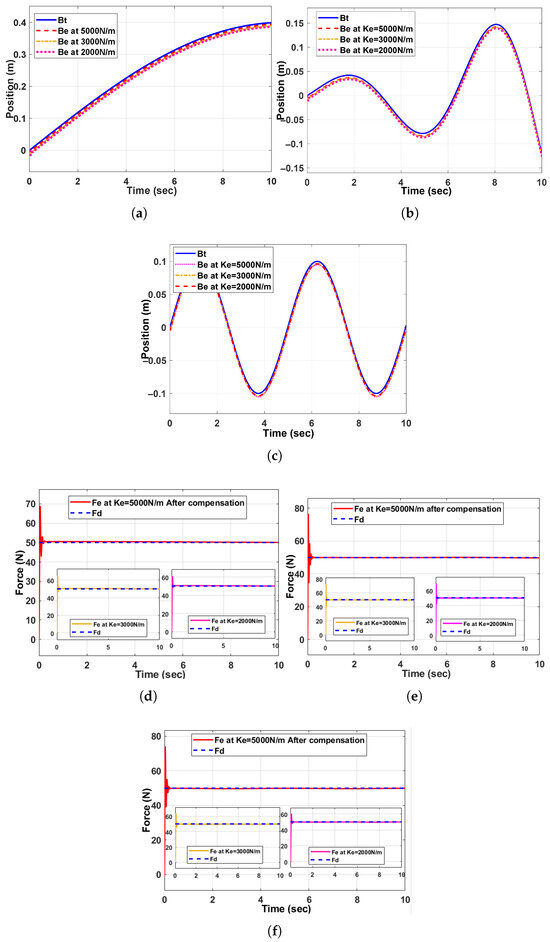
Figure 10.
Panels (a,d) show the position and contact force on the curved surface, panels (b,e) on the complex surface, and panels (c,f) on the curved–complex surface.
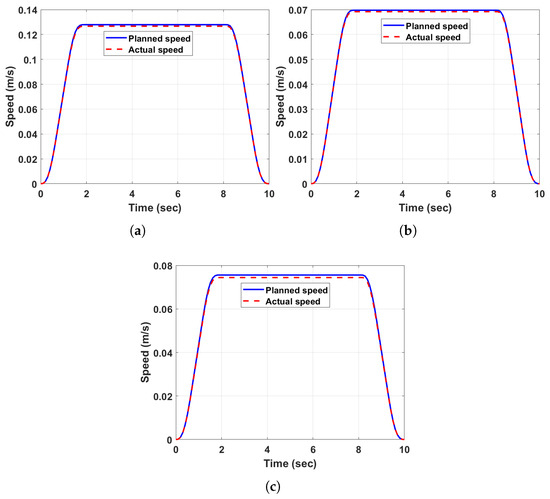
Figure 11.
Panels (a–c) show the hexic curve speed planning on a curved surface, a complex surface, and a curved–complex surface, respectively.
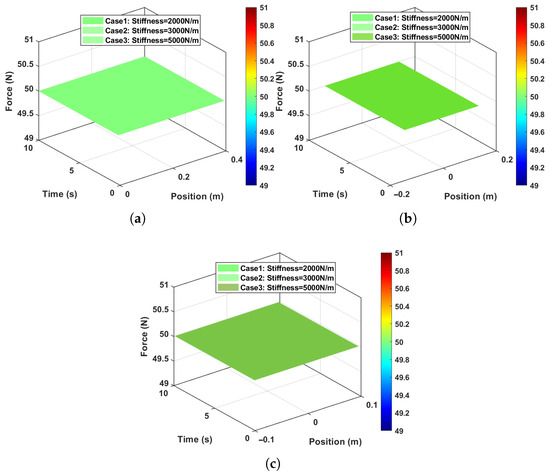
Figure 12.
Panels (a–c) show ABBIFC force control applied to all position points on the curved, complex, and curved−complex surfaces, respectively.
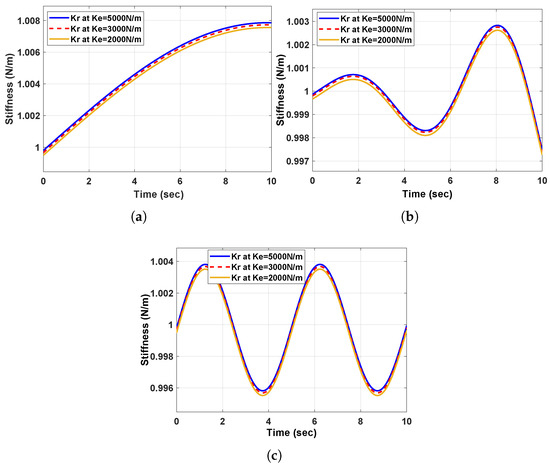
Figure 13.
Panels (a–c) show the robot’s stiffness compensation in response to environment stiffnesses, after force correction, for the curved, complex, and curved−complex surfaces, respectively.
The simulation results demonstrate the ability of the proposed method to produce smooth, stable paths with constant velocities. Although some deviations in force control were observed, they remained within acceptable ranges, ensuring the robot’s performance closely matched the desired trajectory.
4.3. Simulation with Disturbance Case
Disturbances were introduced in the controller model to emulate non ideal operating conditions. A trajectory mismatch was simulated by superimposing a non–uniform random signal on the desired force with an additional +10 N offset, representing deviations between the prescribed path and the actual contact patch and thereby mimicking vibration and sudden contact changes. Furthermore, an external sinusoidal disturbance with a frequency of 0.18 Hz was injected into the trajectory surface to reflect low frequency environmental perturbations. The same impedance, Bézier, and other parameters as in the ideal-condition simulations were used, except with for the ABBIFC and for the impedance baseline controller.
The results, presented in Figure 14a, illustrate the position and force tracking performance achieved without employing the force corrector, whereas Figure 14b shows the improved response when the ABBIFC with force correction is employed. Unlike the simulation results under ideal conditions, the disturbance in this example introduced differences between the actual and desired position and force tracking, mimicking real–time implementations.
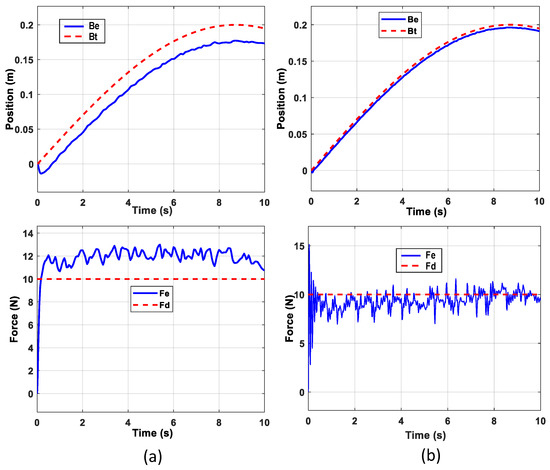
Figure 14.
Position and force tracking under disturbance conditions: (a) without the force corrector, and (b) with ABBIFC including force correction, using the same impedance parameters as in the ideal condition case.
4.4. Comparison Study in Simulation Mode
Accurate force regulation plays a vital role in various force–controlled robotic systems and virtual testing platforms, including in tasks like delicate material manipulation and fine surface finishing. Multiple researchers have introduced distinct techniques aimed at enhancing the precision of contact force tracking in simulated environments. This section presents a comparative analysis of the proposed approach and two existing methods documented in prior works [34,35]. The comparison was conducted using the standardized scenario employed in this study to assess performance consistency and control effectiveness under equivalent conditions.
Two notable approaches from previous studies, namely, the adaptive variable impedance control method [34] and the Wavelet Neural Network (WNN)–based impedance control algorithm [35], were both evaluated under ramp surface conditions for simultaneous position and force tracking. This setup closely resembles the scenario employed in our research, making it a suitable basis for comparative analysis. In this context, we evaluated the performance of our proposed method alongside three control strategies: classical fixed parameter impedance control, adaptive impedance control, and the WNN–based impedance method.
This study evaluated and compared three prominent impedance-based force control strategies: the WNN impedance algorithm, the adaptive impedance method, and the ABBIFC method. All approaches were tested on a sine–shaped surface with a desired contact force of 50 N and an environment stiffness of 5000 N/m. Figure 15 presents a comparative analysis of the position and force control of the proposed ABBIFC, the WNN controller, and the baseline constant impedance controller. In contrast, Figure 16 compares the adaptive impedance controller, the proposed ABBIFC, and the baseline impedance controller. The performance achieved with the ABBIFC is highlighted, and comparable case outcomes are referenced from prior works [34,35].

Figure 15.
Panel (a) shows position tracking performance using ABBIFC compared to the WNN impedance controller, while panel (b) shows the contact force tracking.
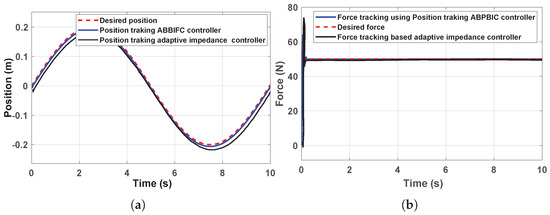
Figure 16.
Panel (a) shows position tracking performance using ABBIFC compared to the adaptive impedance controller, while panel (b) shows the contact force tracking.
The WNN impedance algorithm was initialized with impedance parameters of , , and . As can be seen in Figure 15, this method achieved accurate force tracking after a brief adaptation phase via an integrated Wavelet Neural Network (WNN), and it exhibited a relatively slow response and a significant initial overshoot, reaching approximately 76.48 N, as shown in Figure 15b. Additionally, it showed a notable position error, as shown in Figure 15a, rendering it less suitable for applications demanding high speed precision.
In comparison, the adaptive impedance method, initialized with , , and , demonstrated improved behavior. It maintained stable tracking performance with a reduced overshoot of around 73.63 N, as shown in Figure 16b, and a smaller position error, as shown in Figure 16a. This approach adapts the damping coefficient through an update rule, offering a balance between convergence time and tracking accuracy.
In summary, the comparative analysis clearly indicates that, although both the WNN-based impedance control and the adaptive impedance control methods demonstrate improvements over conventional constant–impedance control, they still encounter limitations in terms of force tracking accuracy and response speed. Specifically, the WNN-based approach achieves acceptable performance only after an adaptation phase, while the adaptive impedance method offers moderate enhancement through parameter adjustment. In contrast, the proposed ABBIFC consistently delivers high force tracking precision and minimal position errors with immediate responsiveness. This is attributed to its ability to estimate stiffness in real time and apply online adaptive control. These findings highlight the superior performance of the ABBIFC in dynamic scenarios, making it a robust and effective solution for precise and responsive force regulation on sloped and complex surfaces.
5. Experimental Study
The experimental study aimed to implement the proposed methodology to execute smooth polishing paths in real time while maintaining constant force control. This section is organized into four parts: the experimental setup, the collected experimental data, a discussion of the results, and an outline of some research questions along with future directions.
5.1. Experimental Setup
The Section 5.1 is divided into three main sections: (1) hardware and software implementation, (2) working principles of hardware/software implementation, and (3) experimental procedures.
5.1.1. Hardware/Software Implementation
The hardware implementation shown in Figure 17a can be described as follows: a UR–10 manipulator; an industrial computer; a UR control unit; a force/torque sensor (type: XLH93003ACN) with 1000 N in the z–direction and an accuracy of 2.3%; a user diagram protocol (UDP) named net F/T; a polishing tool (type S–rima), with a maximum air pressure of 75 psi, no–load speed of 10,000 rpm, air tube of , a mass of 600 g; and the air pressure pump source.
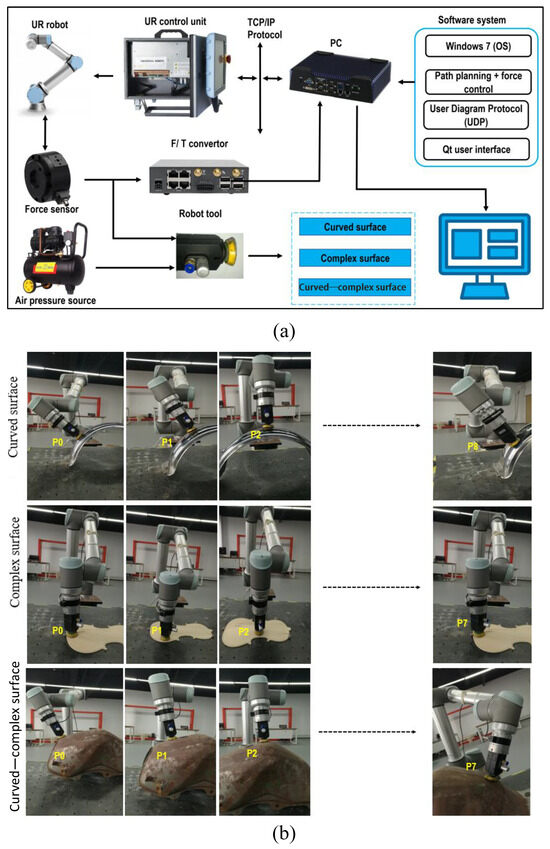
Figure 17.
Panel (a) shows the experimental setup used in the study, while panel (b) illustrates the paths applied on the curved, complex, and curved–complex surfaces.
The software implementation included a Windows 7 operating system, a Qt platform, as shown in Figure 18, UR–10 motion control designed by C++, the INtime® 7, and a user diagram protocol (UDP). UR–10 motion control contains algorithms for path planning, force control, and gravity compensation. The Qt platform graphical user interface (GUI) is used for robot motion control, and the INtime system is used as a real–time methodology for this application.
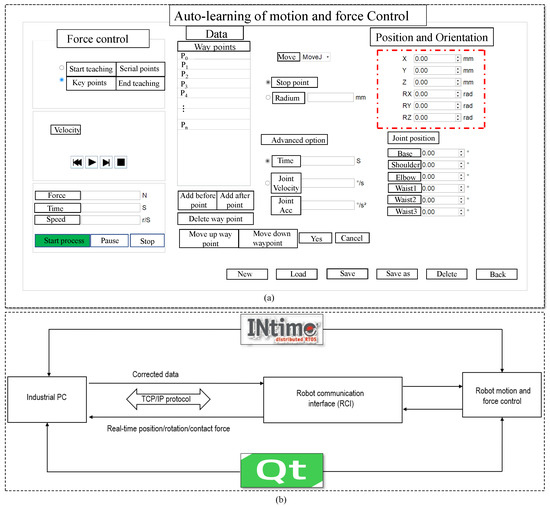
Figure 18.
Panel (a) shows the motion and force control interface using the Qt graphical user interface, while panel (b) illustrates the communication scheme utilizing INtime technology.
5.1.2. Working Principles of Hardware/Software Implementation
The working principles of the robotic system shown in Figure 17a can be described as follows: the Qt GUI is used to collect and save the coordinate system of data points on the workpiece. To control the robot’s motors, the Bézier and T–curves interpolation algorithms were programmed using C++ code. Communication between the industrial computer and the robot controller was established via Transmission Control Protocol/Internet Protocol (TCP/IP) through Ethernet, enabling high-speed processing in real time. The polishing tool was attached to a force sensor and powered by air pressure embedded with a position sensor tracker. During the polishing process, the Qt environment saved the path coordinate system and the force data. The Bézier paths generated by the C++ program can be saved and used for other similar work objects, provided they are placed in the same coordinate system.
5.1.3. Experimental Procedures
The experimental procedure consisted of two stages: Stage One focused on generating smooth paths under force control, while Stage Two involved evaluating the polishing process using experimental parameters.
Stage One: At this stage, polishing paths are generated on three types of surfaces, curved, complex, and curved–complex, as illustrated in Figure 17b using a rational Bézier curve based on the ABBIFC. The end effector speed is determined using the hexic curve method, with a maximum velocity of for the curved surface and for both the complex and curved–complex surfaces. The spatial positions (X, Y, Z) and orientations (, , ) of the end effector at each point are presented in Table 1, Table 2, and Table 3, respectively. The robot learns the polishing path using a teach-and-drag procedure. Following path generation, force control is implemented using the ABBIFC method. The desired contact force applied on the three surfaces is set to .

Table 1.
The collected data points (mm) and attitudes (rad) on a curved surface.

Table 2.
The collected data points (mm) and attitudes (rad) on a complex surface.

Table 3.
The collected data points (mm) and attitudes (rad) on a curved–complex surface.
Stage Two: To ensure the smoothness of the applied polishing paths and the consistency of force application, selecting appropriate polishing parameters is essential. These parameters include polishing speed, abrasive paper type, air pressure, and polishing duration.
- The rotational speed of the polishing tool is set to between 3000 and 4000 r/min for planar and arc surfaces.
- Since the rotational speed of the polishing tool is directly influenced by air pressure, an air regulator with a range of 0–7 bars is used in the experiment to control this parameter. The relationship between air pressure and rotational speed is tested across three experimental groups, as illustrated in Figure 19.
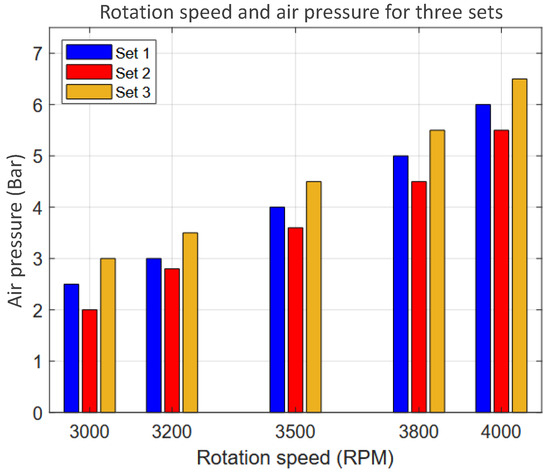 Figure 19. The relationship between air pressure and tool speed during the tests, illustrating how changes in air pressure affect the tool’s performance at varying speeds.
 - The abrasive paper used in this study is aluminum oxide () of P240 grit. The polishing tool is equipped with a sponge–based circular pad measuring 95 mm in diameter and 65 mm in thickness. The selection of P240 was based on optimization tests comparing P600, P120, and P240 grits.
The polishing tests were conducted using different abrasive papers and tool speeds, as detailed in Table 4. In the table, the labels V.H, H, M, L, and V.L correspond to very high, high, medium, low, and very low surface roughness, respectively. Among these, ‘L’ represents the optimal roughness level for polishing. The results indicate that P240 provides the smoothest finish and is therefore the most suitable abrasive paper for high-quality polishing applications.

Table 4.
Polishing process parameters’ effect on level of surface roughness.
5.2. Experimental Testing and Evaluation
In this section, the proposed method is tested and evaluated based on three criteria: simulation, comparative studies, and polishing practical application.
5.2.1. Testing and Evaluation Related to Simulation Parameters
The simulation and experimental studies were conducted using the same parameters as defined for the proposed ABBIFC.
First, the Bézier curve parameters were set as follows: the weight , number of data points n, and the Simpson integration range with and . Additional Bézier algorithm parameters, including , , and , were calculated based on Algorithm 1.
Second, the force control parameters were configured as follows: desired force , virtual mass , damping coefficient , and environment stiffness .
The same procedure implemented in the simulation was applied in the experimental study, including testing the proposed controller against a baseline constant impedance control model. Evaluation metrics included position and force tracking performance, as well as speed planning, using identical procedures in both domains.
This alignment between simulation and experimental setups enabled consistent observations and validated the effectiveness of the proposed method under real and simulated conditions.
5.2.2. Testing and Evaluation Related to Comparative Studies
Firstly, trajectory and force tracking in these fine-grinding experiments were conducted to compare the baseline constant impedance controller with the proposed ABBIFC method. Force tracking and trajectory planning for curved, complex, and curved–complex surfaces were performed using the constant impedance controller, as illustrated in Figure 20a–f by the black curves. The corresponding speed planning results are shown in Figure 21a–c by the red curves. As can be observed, the position tracking shows noticeable deviations from the desired trajectory, and the force tracking appears irregular with large deviations from the target force. These issues arise due to the constant-impedance controller’s limited ability to adjust accurately in real time. Then, the ABBIFC method was applied. Figure 20a–f presents the position and force tracking results for the three surface types, shown by the red curves, demonstrating significantly improved accuracy and reduced deviations from the desired values. The corresponding speed planning results are shown in Figure 21a–c by the black curves.
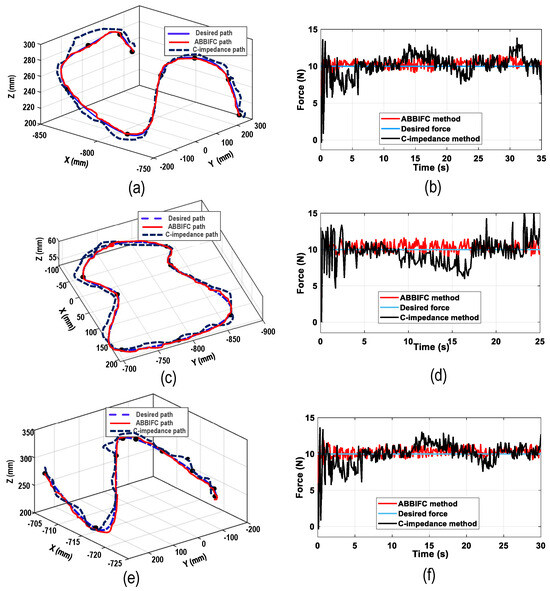
Figure 20.
Panels (a,b) show the real−time polishing paths and contact force on a curved surface. Panels (c,d) illustrate the same parameters on a complex surface, while panels (e,f) show the results on a curved–complex surface for both constant impedance and the ABBIFC method.
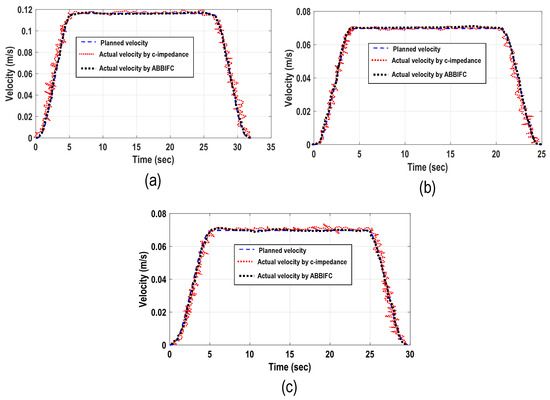
Figure 21.
Panels (a–c) show speed planning on the curved, complex, and curved–complex surfaces, respectively, using the constant impedance controller and the ABBIFC method.
Second, the performance of the proposed control method (ABBIFC) was evaluated compared to the OWSPIF controller presented in [36] specifically on a curved surface, which poses challenges due to continuous variations in geometry and contact dynamics. In path tracking, the proposed controller exhibited significantly higher accuracy. It maintained a stable and precise trajectory across all tested curved surfaces, with notably lower positional errors compared to the OWSPIF model.
The proposed method demonstrated robust adaptation to curvature transitions, showing minimal deviation even on surfaces with tight bends or gradual slopes, as shown in Figure 22b. In contrast, the OWSPIF struggled to maintain trajectory fidelity, particularly during curvature shifts, where it exhibited noticeable path overshoots and drift. For force tracking, the proposed controller also outperformed the OWSPIF. It achieved lower force errors due to the curvature–induced variation in surface, as shown in Figure 22c. The method effectively suppressed oscillations and force overshoot, achieving improved interaction stability. The OWSPIF showed higher force fluctuation and less responsiveness to surface shape variation. Overall, the results confirm that the proposed controller delivers superior accuracy and robustness in both path and force tracking on curved surfaces. Its improved adaptability to geometric variations makes it highly suitable for robotic tasks that require high precision contact, such as curved surface inspection, polishing, or compliant manipulation.

Figure 22.
Panels (a–c) show the experimental setup, path tracking, and contact force, respectively, using the constant AWSPIF controller and proposed ABBIFC method.
5.2.3. Testing and Evaluation Related to Practical Polishing Application
Based on experimental testing and evaluation, the optimal polishing parameters for practical polishing applications were determined, as shown in Table 5, because of the following reasoning: The abrasive paper type P240 is more soft than the other group of tested papers. The criteria for selecting a contact force of 10 N is that this value of force has fewer fluctuations than other values. Also, at an air pressure of 4.0 Bar, the results of the polishing have a good surface appearance.

Table 5.
Optimal selected polishing parameters for smooth motion.
Therefore, the complete polishing process is conducted on the complex surface shown in Figure 17. Trajectory and force tracking are achieved based on the ABBIFC method, as shown in Figure 20, with red curves indicating the accuracy of this method.To further validate the accuracy of the proposed polishing paths under force control, a roughness test was conducted at point (and the other four points described in Table 6) along the complex surface, before and after the polishing process, using the standard baseline constant-impedance controller. The results shown in Figure 23a–c represent the surface shapes in the X–Y plane at this point, before polishing, after using the baseline constant controller, and after using the ABBIFC, respectively. Likewise, Figure 24a–c presents the surface roughness before polishing, after using the baseline constant controller, and after using the ABBIFC, respectively. It is evident that the surfaces improved due to the smooth paths and consistent force tracking.

Table 6.
Surface roughness results (Ra and Rz, mean ± SD, N = 27 per point). Statistical significance tested by paired t–test with Holm–Bonferroni correction.
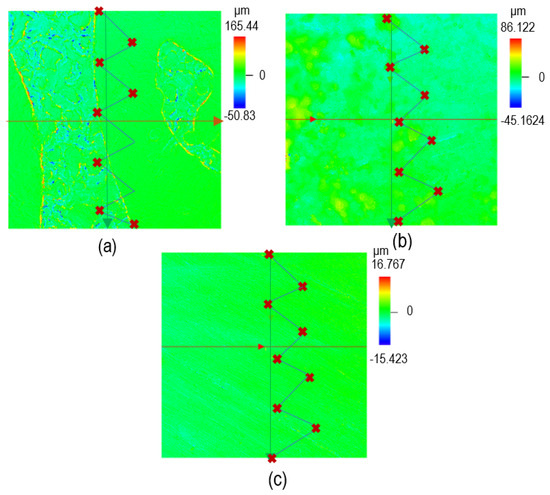
Figure 23.
Surface shapes on complex surface: (a) before polishing, (b) after polishing using the standard baseline method, and (c) after polishing using ABBIFC approach.
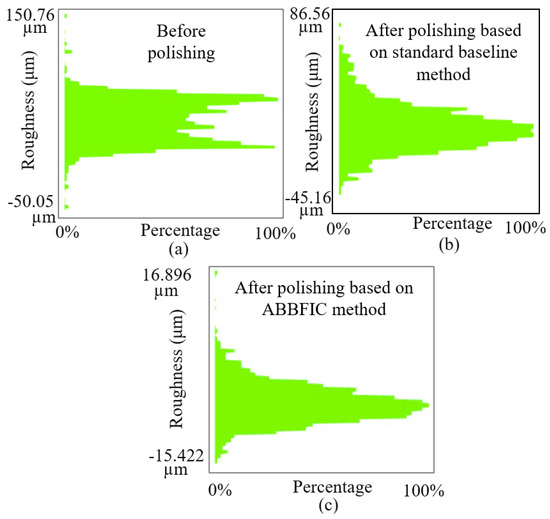
Figure 24.
Surface roughness at selected point 1: (a) before polishing, (b) after polishing using the standard baseline method, and (c) after polishing based on ABBIFC method.
Furthermore, Figure 25a–c illustrates the surface roughness in ± values before polishing, after the baseline constant controller, and after the ABBIFC, respectively. For , the roughness decreased from the range of to µm before polishing to to µm using the baseline impedance controller, and further improvement was observed with the ABBIFC.
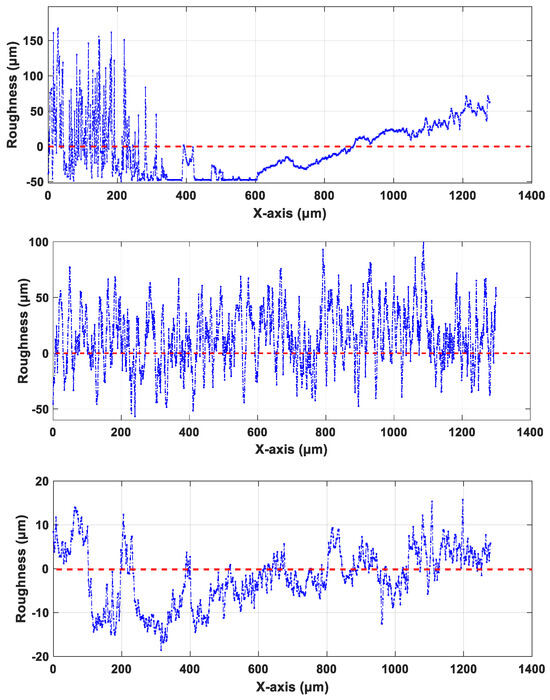
Figure 25.
Surface roughness at selected point 1 of complex surface: (a) before polishing, (b) after polishing using the standard baseline method, and (c) after polishing using ABBIFC method.
Surface roughness measurements were performed using an OLYMPUS LEXT OLS5000 laser scanning microscope (Olympus Corporation, Tokyo, Japan) described in Figure 26. The instrument was calibrated prior to each measurement session using an NIST–traceable step–height standard (1 µm nominal) and a roughness reference specimen (Ra ≈ 0.8 µm). Calibration results were verified to be within the manufacturer’s specified tolerance.
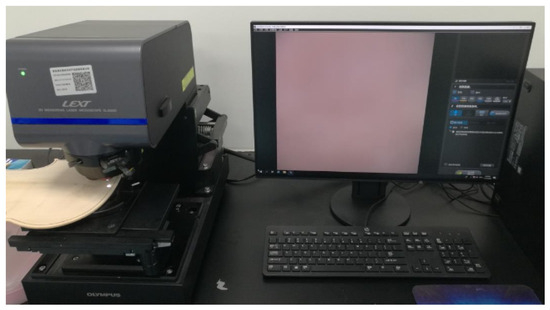
Figure 26.
OLYMPUS LEXT OLS5000 measurement laser device.
To ensure statistical robustness, three surface measuring points were defined on the polished workpiece. At each point, a grid of sub–measurements was taken, corresponding to nine locations. Each location was scanned three times and averaged, yielding a total of observations per point for each condition. This protocol was applied consistently across all measuring points to allow reliable comparison of surface roughness metrics (Ra and Rz).
Table 6 summarizes the surface roughness measurements (Ra and Rz) at five measuring points (MP1–MP5) on the polished complex surface. The point 1 measurement is supported by the display results shown in Figure 23, Figure 24 and Figure 25, while the other four points are described in Table 6. Each point was evaluated using a grid of sub–measurements, yielding observations per point. For each point, the table reports the mean ± standard deviation of Ra and Rz before polishing, after the baseline constant impedance controller, and after the proposed ABBIFC. The results indicate that the ABBIFC consistently reduced both average roughness and peak–to–valley deviations compared with the baseline, with large effect sizes (Cohen’s ) and statistically significant improvements (). These findings demonstrate that the proposed polishing strategy produces stable and uniform surface finishing across multiple locations.
5.2.4. Processing Efficiency
The practical efficiency of the proposed ABBIFC method was analyzed in terms of cycle time, material removal rate (MRR), and throughput for polishing and deburring tasks.
Cycle Time: The total processing time for each surface (curved, complex, and curved–complex) was recorded during both simulation (10 s) and physical experiments (25, 30, 35 s, respectively). The ABBIFC method achieved smooth and continuous motion, reducing idle periods and acceleration/deceleration phases, which improved the overall cycle time compared to conventional controllers.
Material Removal Rate (MRR): The MRR quantifies the volume of material removed per unit time. The removed volume was calculated using surface profiles obtained from a scanning device (e.g., a confocal microscope or laser scanner). Let be the measured surface height at grid point , and define a reference plane (either the original unprocessed surface or the nominal CAD surface). The removed material at each point was calculated as follows:
where and are the spacing between measurement points. The total removed volume is obtained by summing over all points:
The MRR is then computed as follows:
where t is the processing time. Maintaining a near constant contact force along the tool–workpiece interface ensures uniform material removal across the surface, preventing over–polishing or under–polishing and producing a consistent surface finish.
Table 7 presents the material removed (, in mm) and the corresponding material removal rate (MRR, in mm3/s) at nine measurement points along Path 1 of the complex surface for the two polishing methods: the baseline method and the proposed ABBIFC method. The ABBIFC method consistently achieved higher material removal at each point compared to the baseline method, resulting in increased MRR values. For example, at point P01, the material removed increased from 1.00 mm (baseline) to 1.54 mm (ABBIFC), with the MRR rising from 0.017 mm3/s to 0.026 mm3/s. Overall, the data indicate that the ABBIFC method enhances both the efficiency and uniformity of material removal, reflecting improved control of end effector motion and contact force along the curved surface.

Table 7.
Material removed (, mm) and corresponding MRR (mm3/s) at each point for Path 1 using the baseline and ABBIFC methods.
By combining smooth trajectories and adaptive force control, the ABBIFC enhances throughput while maintaining surface quality. This demonstrates that the method improves not only accuracy and stability but also operational efficiency, highlighting its practical relevance for industrial applications.
5.3. Experimental Results and Discussion
Overall, the experimental tests for both trajectory and force tracking confirm that the proposed ABBIFC method outperforms the baseline constant impedance controller and the OWSPIF control model, showing strong alignment with the results obtained from the simulation studies. As illustrated in Figure 20, the comparison clearly demonstrates the superior performance of the ABBIFC approach in terms of path tracking, force regulation, and overall system behavior.
For trajectory tracking, the ABBIFC achieves smoother path following with significantly lower maximum tracking errors, particularly on curved and complex surfaces. In force tracking, the ABBIFC maintains the applied force within a narrower and more stable range, exhibiting reduced fluctuations and noise compared to the constant impedance and OWSPIF controllers.
These findings indicate that the ABBIFC method delivers smoother motion trajectories, more consistent and accurate force control, and enhanced overall system performance. This makes it especially suitable for precision tasks and applications involving interaction with dynamic or delicate surfaces.
Furthermore, applying smooth trajectories under accurately controlled contact force during the robot’s motion is essential for achieving high precision. The Bézier paths generated using the ABBIFC method were smooth and accurate, showing no observable deviations, and were executed under constant speed and stable force conditions. The proposed method is well–suited for a wide range of contact–based robotic applications, including grinding, polishing, deburring, medical diagnostics, and other similar tasks.
The findings underscore the potential of the proposed teaching and learning method to significantly advance robotic automation across polishing processes. By enhancing the precision and adaptability of robotic systems, this approach can enable more accurate and efficient high precision manufacturing, improve the quality of contact–based operations, and offer greater versatility in handling complex geometries and dynamic surfaces. In particular, its ability to maintain constant force while adapting to intricate surface variations and positions make it a valuable solution for industries requiring both high performance and flexibility in automated finishing and maintenance tasks.
5.4. Open Research Questions and Future Directions
The proposed method demonstrates promising performance; however, it faces two primary limitations that open avenues for further research: First, ensuring safe and stable force control during dynamic interaction and learning remains challenging, particularly in environments with unpredictable surface variations or unknown material properties. Second, the high computational cost of real–time adaptation using Bézier–based planning may introduce latency, especially during rapid or complex polishing tasks. These limitations lead to several open research questions:
- How can real–time force control be made more robust in uncertain and unstructured environments without compromising safety? This calls for the development of adaptive or learning-based impedance strategies that can self–tune control parameters in response to real–time variations.
- What strategies can reduce the computational process of smooth trajectory generation while preserving accuracy and responsiveness? Future research may explore lightweight trajectory planning algorithms or the use of parallel processing and embedded optimization techniques.
- How can robotic systems autonomously learn optimal force and motion profiles from experience or human demonstration? Incorporating reinforcement learning or imitation learning could enhance system adaptability and performance in previously unseen scenarios.
- Although the current experiments included inherent vibrations from the polishing tool rotation under real–time conditions, the effect of additional external disturbances on the robot’s performance remains to be studied. Future work will investigate controlled dynamic disturbances (e.g., sinusoidal forces or additional masses) to evaluate robustness while ensuring operational safety.
To address these questions, future work will focus on integrating machine learning techniques to optimize Bézier trajectory shaping and adaptive force correction in real time. Additionally, continuous learning from task–specific data will support long–term system refinement, allowing the controller to generalize across various industrial setups. These advancements would not only improve efficiency and surface quality but also broaden the method’s applicability to high–mix, precision–driven manufacturing environments.
6. Conclusions
This study introduced a novel Adaptive Bézier−Based Impedance Force Controller (ABBIFC) for robotic contact tasks, combining Bézier trajectory generation with adaptive force regulation. Extensive simulations and experimental validations confirmed its ability to achieve smooth motion, stable force tracking, and robust performance across complex surface conditions. By enhancing both trajectory precision and force adaptability, the proposed approach contributes to advancing intelligent, high quality automation in finishing processes.
The ABBIFC demonstrates strong potential for industrial deployment in polishing, grinding, and other continuous contact operations where maintaining constant velocity and accurately regulating contact force are critical for achieving superior surface quality. Its modular architecture also enables straightforward integration into existing robotic platforms with minimal modifications.
As manufacturing industries move toward high–mix, high–precision production, this method offers a scalable and practical solution to enhance consistency, efficiency, and finishing performance, thereby supporting the broader adoption of intelligent robotic automation.
Author Contributions
Conceptualization, software, writing—original draft preparation, H.W.; visualization, software implementation, A.A.; collecting data, formal analysis, G.I.Y.M.; writing—review and editing, validation, M.G.; supervision, revision, L.W. All authors have read and agreed to the published version of the manuscript.
Funding
This research is supported by Quanzhou University of Information Engineering under open projects.
Institutional Review Board Statement
This study was conducted in accordance with the Declaration of the Innovation Research Center and approved by the Institutional Review Board (or Ethics Committee) of the Department of Mechanical and Electrical Engineering, Quanzhou University of Information Engineering.
Informed Consent Statement
Informed consent was obtained from all subjects involved in this study.
Data Availability Statement
Data are contained within the article.
Conflicts of Interest
The authors declare no conflicts of interest.
References
- Zhen, S.; Meng, C.; Xiao, H.; Liu, X.; Chen, Y.H. Robust Approximate Constraint Following Control for SCARA Robots System with Uncertainty and Experimental Validation. Control Eng. Pract. 2023, 138, 105610. [Google Scholar] [CrossRef]
- Heyer, C. Human–Robot Interaction and Future Industrial Robotics Applications. In Proceedings of the 2010 IEEE/RSJ International Conference on Intelligent Robots and Systems (IROS), Taipei, Taiwan, 18–22 October 2010; pp. 4749–4754. [Google Scholar] [CrossRef]
- Liu, Y.; Shi, L.; Tian, X. Weld Seam Fitting and Welding Torch Trajectory Planning Based on NURBS in Intersecting Curve Welding. Int. J. Adv. Manuf. Technol. 2018, 95, 2457–2471. [Google Scholar] [CrossRef]
- Gao, W.; Tang, Q.; Yao, J.; Yang, Y. Automatic Motion Planning for Complex Welding Problems by Considering Angular Redundancy. Robot. Comput. Integr. Manuf. 2020, 62, 101862. [Google Scholar] [CrossRef]
- Lee, S.; Kim, Y. Optimal Output Trajectory Shaping Using Bézier Curves. J. Guid. Control Dyn. 2021, 44, 1027–1035. [Google Scholar] [CrossRef]
- Perumaal, S.; Jawahar, N. Automated Trajectory Planner of Industrial Robot for Pick-and-Place Task. Int. J. Adv. Robot. Syst. 2013, 10, 100. [Google Scholar] [CrossRef]
- Li, B.; Ouyang, Y.; Li, L.; Zhang, Y. Autonomous Driving on Curvy Roads without Reliance on Frenet Frame: A Cartesian-Based Trajectory Planning Method. IEEE Trans. Intell. Transp. Syst. 2022, 23, 15729–15741. [Google Scholar] [CrossRef]
- Amersdorfer, M.; Meurer, T. Equidistant Tool Path and Cartesian Trajectory Planning for Robotic Machining of Curved Freeform Surfaces. IEEE Trans. Autom. Sci. Eng. 2021, 19, 3311–3323. [Google Scholar] [CrossRef]
- Lambrechts, P.; Boerlage, M.; Steinbuch, M. Trajectory Planning and Feedforward Design for Electromechanical Motion Systems. Control Eng. Pract. 2005, 13, 145–157. [Google Scholar] [CrossRef]
- Wahballa, H.; Duan, J.; Dai, Z. An automatic robot polishing control method for compound surface comprising plane and curved surfaces. Int. J. Adv. Manuf. Technol. 2024, 13, 145–157. [Google Scholar] [CrossRef]
- Wahballa, H.; Duan, J.; Wang, W.; Dai, Z. Experimental study of robotic polishing process for complex violin surface. Machines 2023, 11, 147. [Google Scholar] [CrossRef]
- Wahballa, H.; Duan, J.; Dai, Z. Constant force tracking using online stiffness and reverse damping force of variable impedance controller for robotic polishing. Int. J. Adv. Manuf. Technol. 2022, 9, 121. [Google Scholar] [CrossRef]
- Wahballa, H.; Duan, J.; Dai, Z. Controlling robotic contact force on curved and complex surfaces based on an online identification admittance controller. Arab. J. Sci. Eng. 2024, 2, 1625–1641. [Google Scholar] [CrossRef]
- Hu, H.; Cao, J. Adaptive variable impedance control of dual-arm robots for slabstone installation. ISA Trans. 2022, 128, 397–408. [Google Scholar] [CrossRef] [PubMed]
- Zheng, G.; Lei, J.; Hu, L.; Zhang, L. Adaptive variable impedance position/force tracking control of fracture reduction robot. Int. J. Med. Robot. Comput. Assist. Surg. 2023, 19, e2469. [Google Scholar] [CrossRef]
- Feng, H.; Song, Q.; Yin, C.; Cao, D. Adaptive impedance control method for dynamic contact force tracking of robotic excavators. J. Constr. Eng. Manag. 2022, 148, 04022124. [Google Scholar] [CrossRef]
- Shen, Y.; Lu, Y.; Zhuang, C. A fuzzy-based impedance control for force tracking in unknown environment. J. Mech. Sci. Technol. 2022, 36, 5231–5242. [Google Scholar] [CrossRef]
- Zheng, G.; Lei, J.; Hu, L.; Zhang, L. Fuzzy adaptive sliding mode impedance control of fracture reduction robot. IEEE Access 2021, 9, 113653–113665. [Google Scholar] [CrossRef]
- Li, Z.; Huang, H.; Song, X.; Xu, W.; Li, B. A fuzzy adaptive admittance controller for force tracking in an uncertain contact environment. IET Control Theory Appl. 2021, 15, 2158–2170. [Google Scholar] [CrossRef]
- Mohsin, I.; He, K.; Li, Z.; Du, R. Path Planning under Force Control in Robotic Polishing of the Complex Curved Surfaces. Appl. Sci. 2019, 9, 5489. [Google Scholar] [CrossRef]
- Ali, M.A.; Mailah, M. Path Planning and Control of Mobile Robot in Road Environments Using Sensor Fusion and Active Force Control. IEEE Trans. Veh. Technol. 2019, 68, 2176–2195. [Google Scholar] [CrossRef]
- Tian, F.; Li, Z.; Lv, C.; Liu, G. Polishing Pressure Investigations of Robot Automatic Polishing on Curved Surfaces. Int. J. Adv. Manuf. Technol. 2016, 87, 639–646. [Google Scholar] [CrossRef]
- Wang, Y.; Yang, J.; Li, D.; Ding, H. Tool Path Generation with Global Interference Avoidance for the Robotic Polishing of Blisks. Int. J. Adv. Manuf. Technol. 2021, 117, 1223–1232. [Google Scholar] [CrossRef]
- Tan, Q.; Basri, M.A.M.; Wang, J. Constant Force Control and Trajectory Planning of Multi-Axis Polishing Machine Using ADRC and B-Spline Curve Algorithm. IEEE Access 2024, 12, 99851–99871. [Google Scholar] [CrossRef]
- Chen, Y.; Zhao, J.; Jin, Y. An Improved Rational Bézier Model for Pneumatic Constant Force Control Device of Robotic Polishing with Hysteretic Nonlinearity. Int. J. Adv. Manuf. Technol. 2022, 123, 665–674. [Google Scholar] [CrossRef]
- Rani, K.; Kumar, N. Design of intelligent optimal controller for hybrid position/force control of constrained reconfigurable manipulators. J. Ambient. Intell. Humaniz. Comput. 2023, 14, 13421–13432. [Google Scholar] [CrossRef]
- Chiaverini, S.; Sciavicco, L. The parallel approach to force/position control of robotic manipulators. IEEE Trans. Robot. Autom. 2002, 9, 361–373. [Google Scholar] [CrossRef]
- Wang, Z.; Zou, L.; Su, X.; Luo, G.; Li, R.; Huang, Y. Hybrid force/position control in workspace of robotic manipulator in uncertain environments based on adaptive fuzzy control. Robot. Auton. Syst. 2021, 145, 103870. [Google Scholar] [CrossRef]
- Zhu, R.; Yang, G.; Fang, Z.; Dai, J.; Chen, C.Y.; Zhang, G.; Zhang, C. Hybrid orientation/force control for robotic polishing with a 2R1T force-controlled end-effector. Int. J. Adv. Manuf. Technol. 2022, 121, 2279–2290. [Google Scholar] [CrossRef]
- Shu, J.; Li, W.; Gao, Y. Collision-free trajectory planning for robotic assembly of lightweight structures. Autom. Constr. 2022, 142, 104520. [Google Scholar] [CrossRef]
- Schuchert, P.; Karimi, A. High-precision control of a robotic arm using frequency-based data-driven methods. Control Eng. Pract. 2025, 155, 106175. [Google Scholar] [CrossRef]
- Jin, R.; Rocco, P.; Geng, Y. Cartesian trajectory planning of space robots using a multi-objective optimization. Aerosp. Sci. Technol. 2021, 108, 106360. [Google Scholar] [CrossRef]
- Dimeas, F.; Aspragathos, N. Fuzzy learning variable admittance control for human-robot cooperation. In Proceedings of the 2014 IEEE/RSJ International Conference on Intelligent Robots and Systems (IROS), Chicago, IL, USA, 14–18 September 2014; pp. 4770–4775. [Google Scholar] [CrossRef]
- Hamedani, M.H.; Sadeghian, H.; Zekri, M.; Sheikholeslam, F.; Keshmiri, M. Intelligent impedance control using wavelet neural network for dynamic contact force tracking in unknown varying environments. Control Eng. Pract. 2021, 113, 104840. [Google Scholar] [CrossRef]
- Duan, J.; Gan, Y.; Chen, M.; Dai, X. Adaptive variable impedance control for dynamic contact force tracking in uncertain environment. Robot. Auton. Syst. 2018, 102, 54–65. [Google Scholar] [CrossRef]
- Wahballa, H.; Ahmed, A.; Duan, J.; Chen, X.; Weining, L. Force Tracking in Robotic Control Systems Using an Online Work Object Stiffness Hybrid Impedance PI Control Approach. Results Eng. 2025, 17, 105520. [Google Scholar] [CrossRef]
Disclaimer/Publisher’s Note: The statements, opinions and data contained in all publications are solely those of the individual author(s) and contributor(s) and not of MDPI and/or the editor(s). MDPI and/or the editor(s) disclaim responsibility for any injury to people or property resulting from any ideas, methods, instructions or products referred to in the content. |
© 2025 by the authors. Licensee MDPI, Basel, Switzerland. This article is an open access article distributed under the terms and conditions of the Creative Commons Attribution (CC BY) license (https://creativecommons.org/licenses/by/4.0/).