Abstract
This study investigates the leakage vortex influence on pressure pulsation characteristics within a vertical axial flow pump. Three impeller configurations with blade root clearance (δ) of 2.7–8.0 mm were designed to analyze geometric effects on internal flow dynamics. Unsteady RANS simulations predicted flow structures under multiple operating conditions (0.8–1.2Qdes). Fast Fourier Transform (FFT) extracted frequency–domain and time–frequency characteristics of pressure pulsations in critical flow regions. Key results reveal: (1) δ enlargement expands low-pressure zones within blade channels due to enhanced leakage vortices; (2) leading-edge pulsation shows 8.2–11.7% reduction in peak-to-peak amplitude and fundamental frequency magnitude with increasing δ; (3) trailing-edge response exhibits non-monotonic behavior, with maximum amplitude at δ = 5.0 mm (42.2% increase at design flow). These findings demonstrate that blade root clearance optimization requires condition-dependent thresholds to balance leakage management and pulsation control.
1. Introduction
Vertical axial flow pumps are extensively employed in hydraulic engineering for critical applications such as agricultural irrigation, urban drainage, and hydropower generation, owing to their high fluid transport capacity, operational adaptability, and reliability [1,2]. These pumps play a pivotal role in supporting a wide range of engineering projects and socio-economic development. One of the key features of vertical axial flow pumps is the ability to adjust the impeller blade angle, which significantly enhances their operational efficiency range. However, this adjustment requires the presence of a blade root clearance between the blade root and the hub. By modifying the impeller blade angles, the pump can adapt to diverse working conditions and flow requirements, thereby improving overall efficiency and performance. Despite these advantages, the design of the blade root clearance is of paramount importance. Insufficient clearance limits the adjustment range, thereby reducing operational efficiency. On the other hand, excessive clearance can induce leakage flow near the hub, leading to flow field instability, water pressure fluctuations, and a decline in pump stability. Consequently, optimizing the root clearance is essential to mitigate water pressure pulsations caused by leakage flow, ensuring the reliable and widespread application of vertical axial flow pumps in hydraulic engineering.
The root clearance flow (RCF) [3] and tip clearance flow (TCF) [4] are collectively termed blade leakage flow, arising from the pressure differential between the blade pressure side and suction side. Although RCF and TCF occur at distinct locations—RCF near the impeller hub and TCF near the impeller rim—they share similar formation mechanisms. Given the limited research currently available on RCF, findings from TCF studies can inform its investigation. Recent advancements in computational fluid dynamics (CFD) technology [5,6] and experimental instrumentation [7,8] have enabled researchers to explore the impact of leakage flow on internal flow field structures and energy characteristics. In mixed-flow pumps, Li et al. [9] numerically investigated the effect of blade tip clearance size on rotational stall characteristics. They found that while reducing the clearance size improves hydraulic efficiency, it also increases the flow rate at the critical stall point, implying a narrower stable operating range; the underlying reason is that smaller tip clearances intensify internal backflow and secondary flow within the impeller passage. Ji et al. [10] proposed altering the impeller blade tip structure shape to achieve consistent stall condition formation. They predicted through numerical simulation that the bulge-tip structure and double-rib-tip structure can reduce the secondary flow intensity at the impeller outlet, thereby suppressing stall vortex formation and narrowing the stall operating range. Han et al. [11] were the first to observe a double-hump-shaped blade tip clearance cavitation morphology, dividing its evolution into four stages: incepting, growing, merging, and propagating. Furthermore, they proposed that the trajectory of the leakage vortex formed during inception directly influences the tip leakage flow intensity. In axial flow pumps, Zhang et al. [12] found through numerical simulation that under low cavitation number conditions, leakage flow in the blade tip gap alters the circumferential and radial velocity distribution of the nearby flow field, promoting secondary blade tip gap vortex formation. Wang et al. [13] numerically determined that the cavitation length caused by TLV in a bidirectional axial flow pump with a large clearance (1 mm) was significantly longer than with a small clearance (0.5 mm); reverse shear cavitation (RSC) also occurred earlier. Lin et al. [14] observed that pressure, vorticity, and turbulent kinetic energy in the low-pressure region at the tip clearance decrease with increasing flow rates, with TLV strength being higher at low flow rates but attenuating and becoming controlled by the main flow at higher rates. In contrast to the extensive research on TCF, studies on RCF remain limited. Although RCF shares a similar formation mechanism with TCF, its occurrence near the impeller hub may result in distinct flow characteristics and performance impacts, particularly on water pressure pulsation.
The key to studying water pressure pulsation in pumps lies in extracting the time–domain and frequency–domain characteristics of pressure signals [15,16]. Fast Fourier Transform (FFT) [17] is commonly used to extract average frequency distributions over time intervals, while wavelet transform (WT) [18] captures time-varying frequency features. Using FFT, Liu et al. [19] analyzed pressure pulsation frequency–domain characteristics in a bidirectional axial flow pump under cavitation conditions. They found that during reverse operation, inflow distortion induced by anti-arch guide vanes and quasi-periodic vertical cavitation flow significantly amplified the main frequency amplitude near the blade tip clearance. Jiang et al. [20] revealed that the main frequency of the impeller inlet flow field corresponds to blade passing frequency (BPF), with high-amplitude frequencies concentrated within 0–1.5 × BPF; decreasing flow rate or increasing rotational speed enhances turbulent energy dissipation, elevating amplitudes in this range. Employing WT, Lu et al. [21] observed that during the transition from quasi-steady cavitation to initial unstable cavitation in a centrifugal pump, pressure pulsation at the impeller inlet initially increases, then decreases, while amplitudes at the outlet rise steadily. Combining numerical simulations of flow field structures further elucidates the origins of these time–frequency and frequency–domain characteristics [22,23]. For example, Shi et al. [24] compared pressure pulsation at different radial positions in a full-flow pump impeller channel, finding that the main frequency amplitude—influenced by backflow clearance—gradually increases from hub to rim. Therefore, FFT and WT effectively extract pressure signal characteristics in pumps, establishing clear links between flow structures and pressure fluctuation behavior.
In this paper, four kinds of vertical axial flow pumps with three blade root clearances are taken as research objects. The internal flow field structure is predicted by solving the unsteady Reynolds-averaged Navier–Stokes (RANS) equations, and FFT are used to study the influence of leakage flow in the blade root clearance on water pressure pulsation characteristics. The research conclusions can provide a theoretical reference for the optimal design of vertical axial flow pumps.
2. Research Methods
2.1. Test Bench
To verify the suitability of the numerical simulation boundary conditions and the accuracy of the calculation results, an external characteristic test of the vertical axial flow pump was conducted. The test setup is illustrated in Figure 1. The test bench is a closed vertical structure, divided into upper and lower layers. The flow rate is measured using a German KOLONG intelligent electromagnetic flowmeter, positioned in the lower layer to prevent cavitation in the working medium from affecting the measurement accuracy of the inlet pressure. The measurement uncertainty of the flowmeter is 0.2%. The head and input power are measured using a Japan Yokogawa EJA intelligent differential pressure transmitter and a China JCL2/500Nm intelligent torque-speed sensor, respectively. These instruments are located in the upper layer, with measurement uncertainties of less than 0.1% for both head and input power. This setup ensures high-precision measurements and reliable validation of the numerical simulation results.
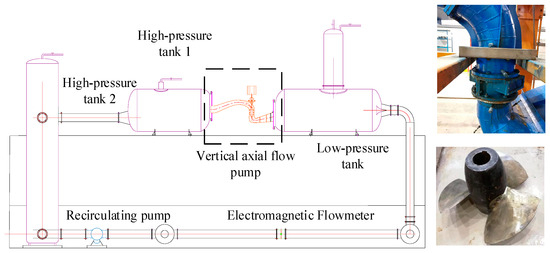
Figure 1.
Schematic of experimental test rig.
2.2. Three-Dimensional Model
In this study, the vertical axial flow pump system comprises an inflow channel, impeller, guide vanes, and an outflow channel, as illustrated in Figure 2. To investigate the influence of root clearance on the internal flow structure and pressure pulsation, three blade root clearance δ were designed, 2.7 mm, 5 mm, and 8 mm, as shown in Figure 3. The primary geometric and hydraulic design parameters are as follows: the impeller diameter is 300 mm, the blade tip clearance is 0.3 mm, the number of blades is 3, the impeller hub diameter is 120 mm, and the number of guide vanes is 6. The design flow rate Qdes is 0.308 m3/s, the design head H is 4.3 m, and the design efficiency is 77.3%. The rotational speed n is set at 1340 rpm.
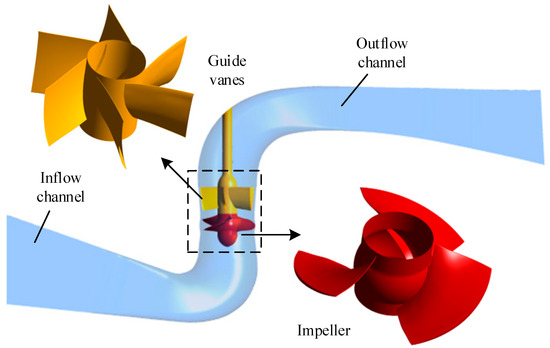
Figure 2.
Three-dimensional computational model of the vertical axial flow pump device.
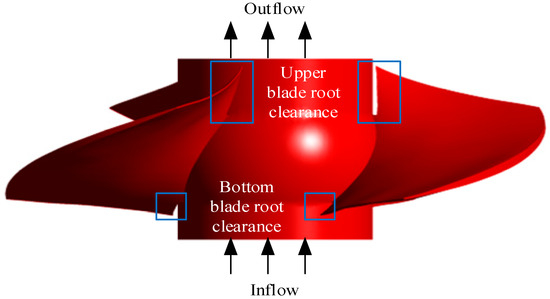
Figure 3.
Schematic of blade root clearance geometry.
2.3. Numerical Simulation
2.3.1. Mesh Generation
The inflow channel, impeller, and outflow channel were discretized into hexahedral meshes using ICEM CFD 2020 R2, while the guide vane was meshed into hexahedral elements using Turbogrid 2020 R2. To accurately capture the surface flow structures, an O-grid topology was applied to the blade and guide vane surfaces. The specific grid division is illustrated in Figure 4. To determine the optimal number of grids, a balance was sought between computational accuracy and resource efficiency. The grid independence analysis is presented in Table 1. As shown in the table, the efficiency gain of Scheme 4 over Scheme 3 becomes negligible (0.1%) when grid nodes exceed 5,617,724. Therefore, balancing computational accuracy and resource utilization, the final mesh comprises 1,332,635 nodes for the inlet channel, 1,908,105 for the impeller, 1,226,352 for the guide vane, and 1,150,632 for the outlet channel. Additionally, for the final grid scheme, the average Y+ values for the inflow channel, impeller, guide vanes, and outflow channel are 5.0, 10.4, 10.4, and 16.0, respectively. The spatial distribution of Y+ for impeller and guide vanes is shown in Figure 5.
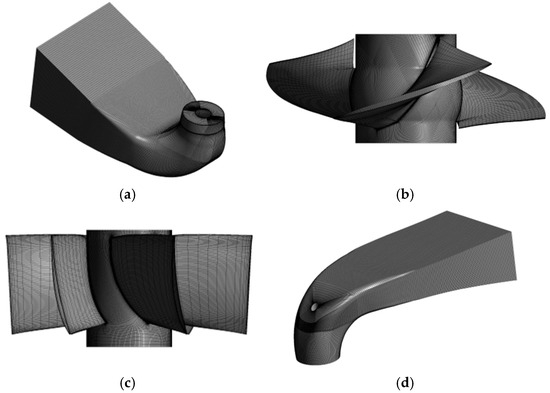
Figure 4.
Computational mesh of domain components: (a) inflow channel, (b) impeller, (c) guide vanes, and (d) outflow channel.

Table 1.
Grid independence analysis of vertical axial flow pump under 2.7 mm blade root clearance (1.0Qdes).
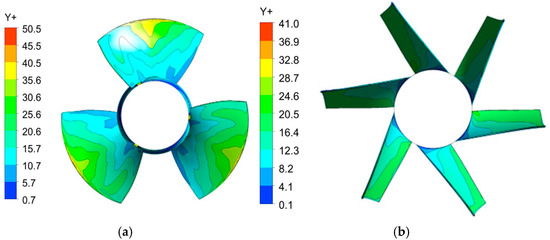
Figure 5.
The distribution of Y+ values for (a) impeller and (b) guide vanes.
2.3.2. Boundary Condition
In this study, the unsteady Reynolds-averaged Navier–Stokes (RANS) equations are solved by software ANSYS CFX 2020 R2 to numerically predict the internal flow field structure of the vertical axial flow pump device. The unsteady numerical calculations utilize the steady-state numerical results as initial conditions. For the numerical setup, the inlet boundary condition is set to “Mass Flow Rate” [25], the outlet boundary condition is set to “Opening Pressure” [26], and the dynamic–static interface condition is set to “Stage Average Velocity” [27]. The wall boundary condition is defined as non-slip, with roughness values of 0.05 mm for the inflow channel, impeller, guide vanes, and outflow channel. In the unsteady calculations, all boundary conditions remain unchanged except for the dynamic–static interface condition, which is modified to “Transient Rotor Stator” [28]. The time step is set to 0.000373134 s [29], corresponding to a 3° rotation per step [30], and the total simulation time is 0.0447761 s, equivalent to 10 full rotations of the impeller.
3. Test Verification
Figure 6 presents a comparison between the external characteristic curves obtained from numerical simulations and experimental measurements for an axial flow pump with blade root clearance δ = 2.7 mm. Hydraulic efficiency and head can be calculated according to the following formula:
where and are the outlet total pressure and relative inlet total pressure, is density, is acceleration due to gravity. is mass flow rate, is shaft power.
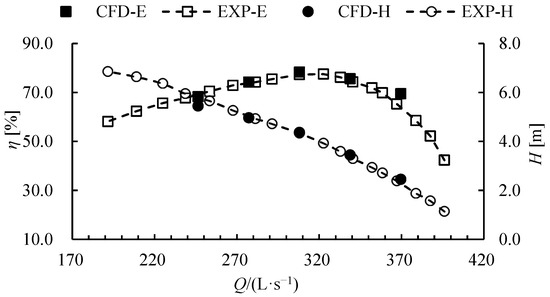
Figure 6.
External characteristic curves for numerical simulation and experimental measurements.
As shown in the figure, the external characteristic curves derived from both methods exhibit similar trends. For the efficiency curve, both the simulated and experimental efficiencies initially increase and then decrease with increasing flow rate, reaching their peak efficiency at a flow rate of 0.308 m3/s. Under this condition, the deviation between the simulated and experimental efficiencies is less than 1.4%. For the head curve, both the simulated and experimental heads decrease as the flow rate increases, with a deviation of no more than 0.8% under the design condition. These comparison results demonstrate that the boundary conditions used in the numerical simulations are reasonable and that the calculation results are reliable.
4. Results and Discussion
To elucidate the internal relationship between the leakage flow in the blade root clearance, the internal flow field structure, and the pressure pulsation characteristics, this chapter is divided into two main sections: (1) the impact analysis of the blade root clearance on the spatial distribution characteristics of internal pressure pulsation intensity, and (2) the impact analysis of the blade root clearance on the time-frequency domain characteristics of pressure pulsation.
4.1. Spatial Distribution Characteristics of Internal Pressure Pulsation Intensity
The impeller leading edge and trailing edge are positioned at axial coefficients of S* = 0.13 and S* = 0.96, respectively. The axial coefficient S* is defined as follows:
where S is the axial coordinate value for calculating the cross-section, Sin and Sout are the axial coordinate values for the inlet and outlet of the impeller.
To quantify the influence of blade root clearance on impeller inlet and outlet pressure pulsation intensity, this study adopts the pressure pulsation standard deviation Psd as the evaluation metric and utilizes the radial coefficient R* to characterize radial position. The defining equations for Psd and R* are
where i denotes the time step index, n represents the total number of time steps, Pi is the instantaneous pressure at time step i, and denotes the phase-averaged pressure over one rotation cycle. Additionally, Rhub is the hub radius, Rrim is the tip radius (rim radius), and R is the radial coordinate of the cylindrical section.
Figure 7 illustrates the methodology for determining the radial distribution of pressure pulsation intensity at the impeller inlet/outlet. The cross-section is divided radially into 20 concentric rings of equal width. The average pressure pulsation intensity within each ring represents the value at its radial position. This procedure yields the radial distribution profile of pressure pulsation intensity across the flow passage.
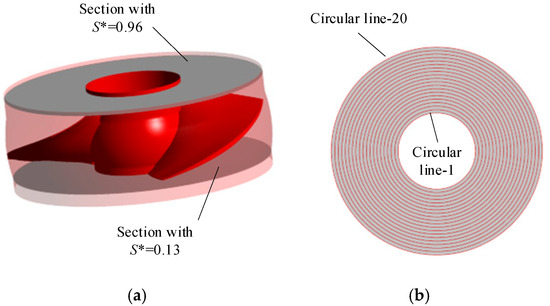
Figure 7.
Probe location schematic: (a) axial cross-section, (b) equidistant radial rings at impeller interface.
Figure 8 presents the radial distribution of pressure pulsation intensity in an axial section near the impeller blade leading edge. Under 0.8Qdes, Psd exhibits non-monotonic variation (initial decrease followed by increase) with radial coefficient R*, while 1.0Qdes and 1.2Qdes show monotonic increases with R*. Blade root clearance δ demonstrates condition-dependent effects: at 0.8Qdes, increasing δ from 2.7 mm to 5.0 mm significantly reduces Psd across all radial positions, though further increase to 8.0 mm yields diminishing returns; at 1.0Qdes, Psd increases with R* but decreases with δ; at 1.2Qdes, δ variations show negligible impact. Quantitatively, the δ = 2.7 mm configuration reduces hub-region Psd by 17.8% (low flow) and 16.9% (design flow) relative to δ = 8.0 mm. This paradoxical suppression effect at larger clearances originates from reduced fluid resistance, which diminishes adverse pressure gradients and associated vortex formation, thereby enhancing flow stability.
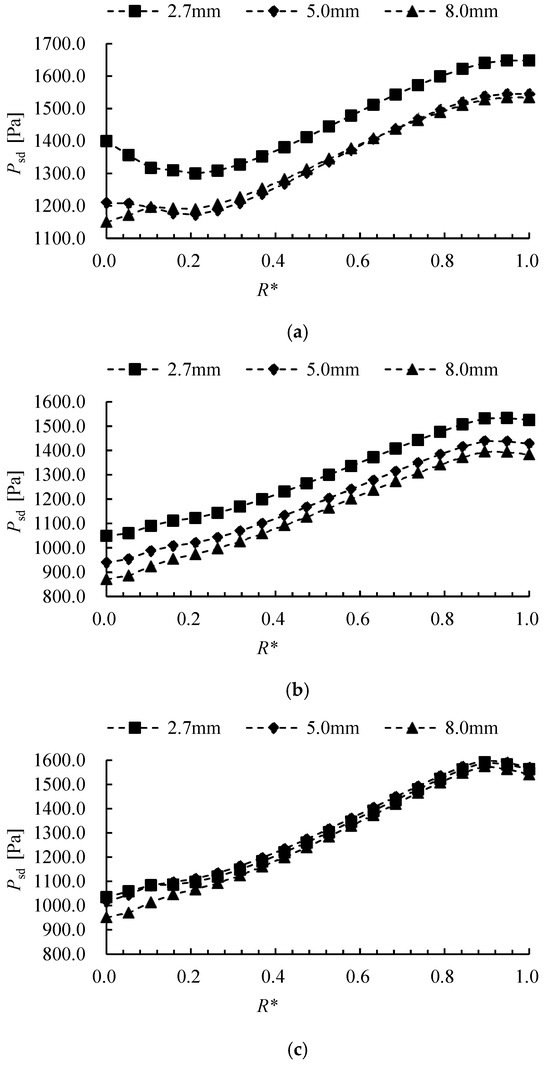
Figure 8.
Radial distribution of Psd at impeller inlet with S* = 0.13 under (a) 0.8Qdes, (b) 1.0Qdes, and (c) 1.2Qdes.
Figure 9 presents the radial distribution of pressure pulsation intensity in an axial section near the impeller blade trailing edge. Under low-flow conditions (0.8Qdes), intensity exhibits non-monotonic variation (decreasing then increasing) with both radial coefficient R* and blade root clearance δ. At design flow (1.0Qdes), it shows non-monotonic behavior (increasing then decreasing) with R* but decreases monotonically with increasing δ. During high-flow operation (1.2Qdes), intensity becomes insensitive to R* variations while maintaining a monotonic decrease with δ. These significant condition-dependent differences in δ’s influence stem from disruption of the optimal impeller outlet angle—guide vane inlet attack angle matching: leakage flow induced by δ enlargement alters the actual outflow angle, causing deviation from the optimal matching point, flow matching deterioration, and consequent pulsation amplification. Therefore, blade root clearance δ requires performance-driven optimization to identify its condition-specific operational threshold.
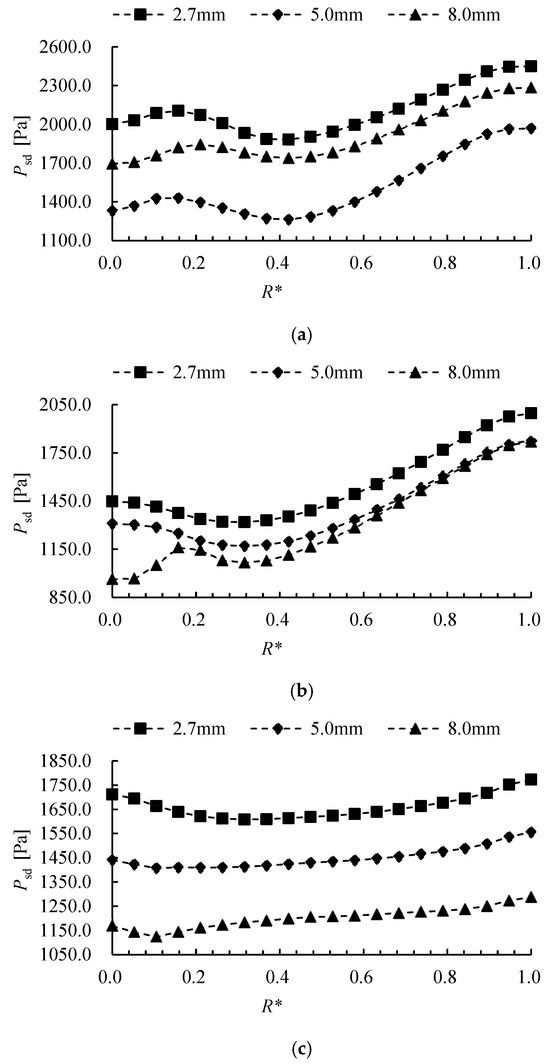
Figure 9.
Radial distribution of Psd at impeller outlet with S* = 0.96 under (a) 0.8Qdes, (b) 1.0Qdes, and (c) 1.2Qdes.
To characterize blade root clearance δ’s influence on pressure pulsation intensity along the impeller outflow path, Figure 10 displays the cylindrical section at radial coefficient R* = 0.01, while Figure 11 shows the cylindrical expansion of pressure pulsation intensity inside the impeller passage under three flow conditions. Distinct high-intensity zones emerge at blade leading edges—attributed to inflow-blade impact—and near the impeller outlet due to rotor–stator interaction with guide vanes. Concurrently, extensive low-intensity regions develop within blade channels from leakage-flow-induced vortex structures. These vortex-dominated regions exhibit clearance-dependent behavior: under low flow, the low-intensity area first expands, then contracts with increasing δ; at design flow, it expands progressively with δ; high flow conditions show minimal δ sensitivity. This non-uniform area response demonstrates that δ enlargement variably modulates leakage vortex coherence rather than exerting a consistent influence. Consequently, outflow field modifications must be integrated into blade root clearance optimization protocols.
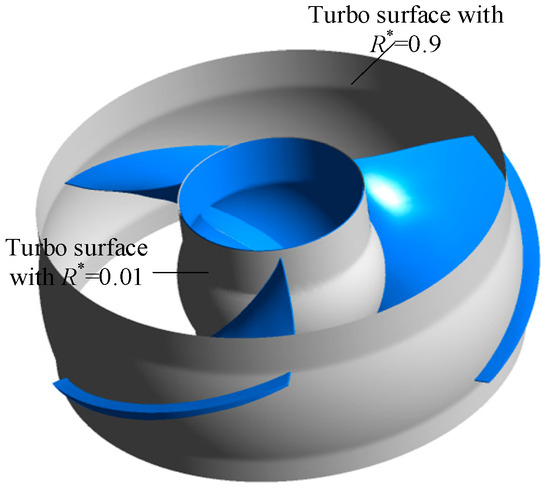
Figure 10.
Schematic of turbo surface in impeller flow channel.
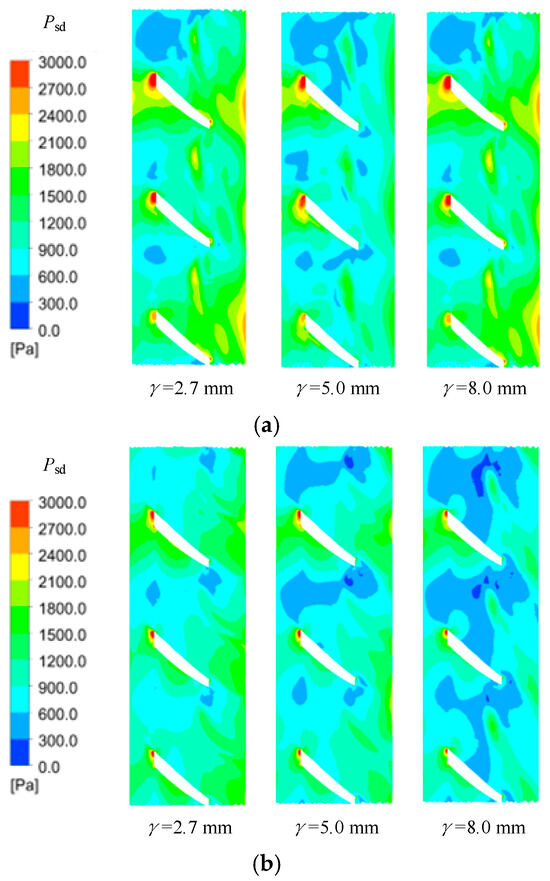
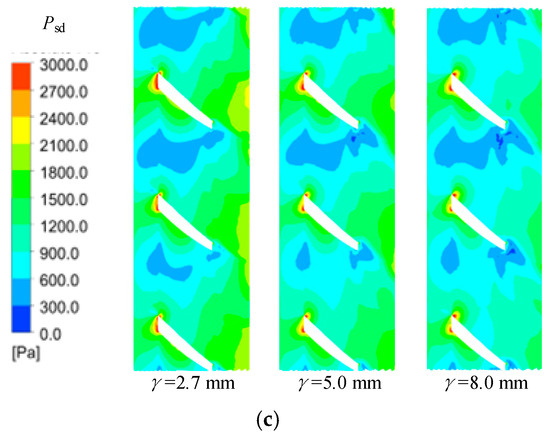
Figure 11.
The spatial distribution of pressure pulsation intensity inside the cylindrical expansion surface of the impeller channel at (a) 0.8Qdes, (b) 1.0Qdes, and (c) 1.2Qdes.
4.2. Time and Frequency Domain Characteristics of Pressure Pulsation
Building on the observed spatial dominance of blade root clearance δ on hub-region pressure pulsation, Figure 12 defines monitoring points P1 (impeller hub leading edge) and P2 (impeller hub trailing edge). FFT analysis of these points reveals the time–frequency characteristics of clearance-induced pressure pulsations at critical impeller locations.
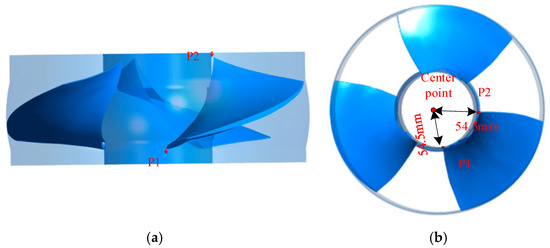
Figure 12.
Locations of pressure pulsation monitoring points within the impeller: (a) front view and (b) top view.
Figure 13 presents the time–domain pressure pulsations at monitoring point P1 under three flow conditions. Within two rotation cycles, all three blade root clearance schemes exhibit six distinct peaks and six troughs—indicating that the number of pressure oscillations per cycle corresponds to the number of blades. Notably, the number of these features remains constant despite increasing clearance values. Furthermore, both peak and trough amplitudes progressively increase with flow rate. Table 2 quantifies blade root clearance δ influence on impeller hub leading edge pressure pulsation (peak-to-peak amplitude) during the final simulation revolution. Under all flow conditions, 0.8Qdes, 1.0Qdes, 1.2Qdes, peak-to-peak pulsation amplitude decreases progressively with increasing δ. The δ = 2.7 mm configuration exhibits reductions of 10.5%, 8.2%, and 9.4%, respectively, compared to δ = 8.0 mm. This attenuation originates from reduced clearance flow resistance, which weakens leakage vortex intensity and consequently diminishes interference between leakage vortices and impeller inlet preswirl.
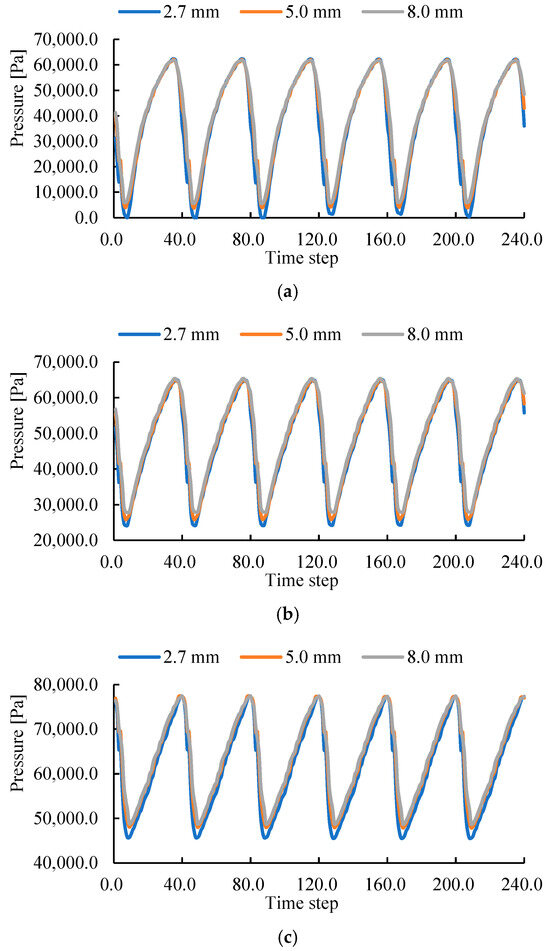
Figure 13.
Time diagram of pressure pulsation at monitor P1 under (a) 0.8Qdes, (b) 1.0Qdes, and (c) 1.2Qdes.
Table 2.
Peak-to-peak pressure pulsation amplitude at monitoring point P1 versus blade root clearance δ across flow conditions (final revolution).
Figure 14 presents the time–domain pressure pulsations at monitoring point P2 under three flow conditions. Under the 0.8Qdes condition, significant wake vortices near the impeller outlet resulted in 12 distinct peaks and troughs in the pressure curve over two rotation cycles. Peak amplitudes decreased progressively with increasing blade root clearance. Conversely, at 1.0Qdes and 1.2Qdes, flow stabilization near the outlet restored the characteristic six peaks and troughs per cycle. Under these conditions, peak amplitudes were highest for the 5.0 mm clearance scheme and lowest for the 8.0 mm scheme. Table 3 presents corresponding data for the hub trailing edge. At low flow (0.8Qdes), peak-to-peak pulsation amplitude decreases monotonically with δ. Conversely, design (1.0Qdes) and high-flow (1.2Qdes) conditions exhibit non-monotonic variation (initial increase followed by decrease) with increasing δ. This differential response stems from clearance-induced impeller outflow angle reduction: at low flow, the original excessive impeller outflow angle (relative to guide vane inlet angle) is beneficially corrected by leakage flow, improving matching performance. At design and high flows, however, leakage-induced angle deviation degrades the initially optimal impeller-guide vane matching.
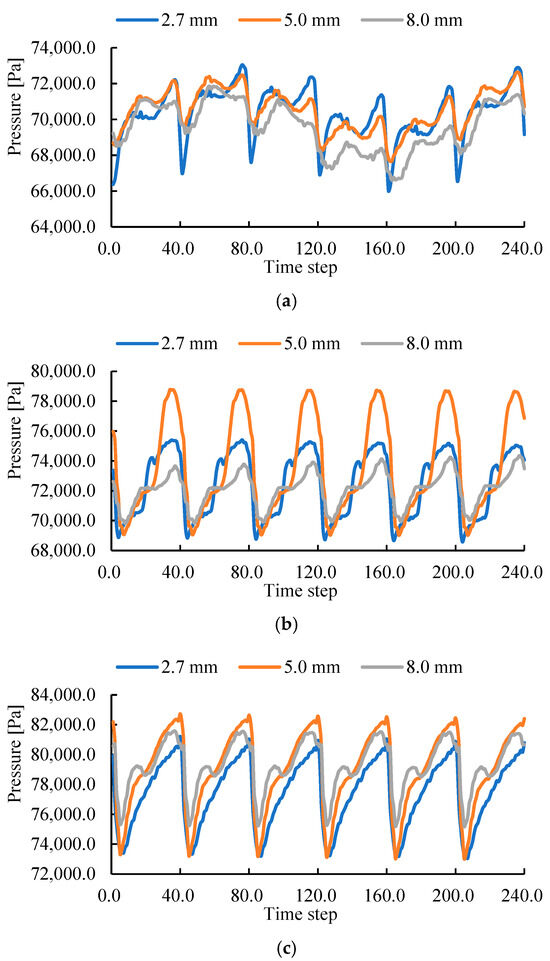
Figure 14.
Time diagram of pressure pulsation at monitor P2 under (a) 0.8Qdes, (b) 1.0Qdes, and (c) 1.2Qdes.
Table 3.
Peak-to-peak pressure pulsation amplitude at monitoring point P2 versus blade root clearance δ across flow conditions (final revolution).
Figure 15 presents the frequency–domain characteristics of pressure pulsation near the impeller hub’s leading and trailing edges under low-flow conditions (0.8Qdes). At the leading edge (Figure 15a), the dominant blade-passing frequency (3 × 1340/60 = 67 (Hz)) presents the peak amplitude, with the high-amplitude region concentrated within the 0–300 Hz range, confirming that pressure pulsation originates primarily from leakage vortex-preswirl interaction at the blade root. Conversely, the trailing edge (Figure 15b) displays significantly lower fundamental amplitude but broader high-amplitude distribution (0–400 Hz), reflecting complex flow structures from enhanced rotor–stator interaction. Notably, the component at half the shaft frequency (0.5 × 1340/60 = 11.17 (Hz)) peaks in amplitude, indicating symmetric vortex shedding at the impeller outlet. Table 4 data further reveals opposing clearance effects: increasing blade root clearance δ reduces leading-edge fundamental amplitude (8.0 mm configuration shows 11.7% reduction versus 2.7 mm), while amplifying trailing-edge fundamental amplitude by 101.7% under equivalent comparison.
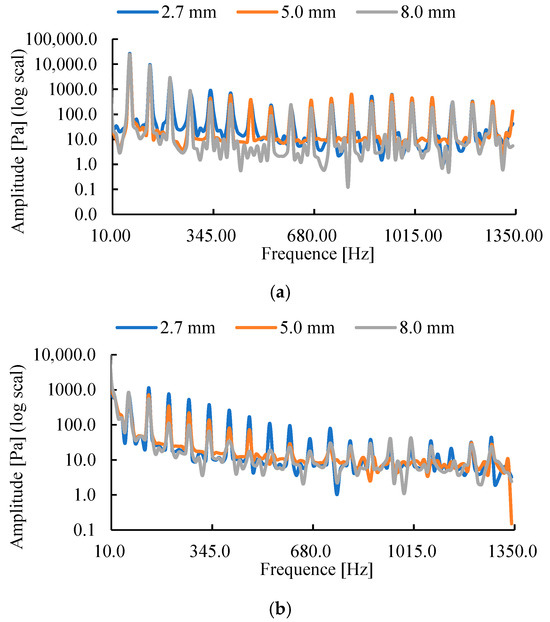
Figure 15.
Frequency domain diagram of pressure pulsation under 0.8Qdes at (a) monitoring point P1 and (b) monitoring point P2.
Table 4.
Fundamental frequency amplitude at monitoring points P1 (impeller hub LE) and P2 (impeller hub TE) versus blade root clearance δ under 0.8 Qdes.
Figure 16 and Figure 17 display the frequency–domain characteristics of impeller leading-edge (LE) and trailing-edge (TE) pressure pulsations under design (1.0Qdes) and high-flow (1.2Qdes) conditions. The LE spectral energy concentrates primarily within 0–300 Hz, with blade-passing frequency dominating the response. As quantified in Table 5 and Table 6, LE fundamental amplitude (blade-passing frequency ) decreases with increasing blade root clearance δ, though less markedly than at low flow: the δ = 2.7 mm configuration exhibits 4.7% (1.0Qdes) and 6.9% (1.2Qdes) reductions relative to δ = 8.0 mm. Conversely, TE spectral energy distributes across 0–600 Hz, while its fundamental amplitude demonstrates non-monotonic variation (initial increase followed by decrease) with δ. This response stems from clearance-induced modifications to rotor–stator interaction. At 1.0Qdes, TE amplitude changes by +42.2% (δ = 5.0 mm) and −55.9% (δ = 8.0 mm) relative to δ = 2.7 mm; corresponding 1.2Qdes variations are +7.2% and −37.0%.
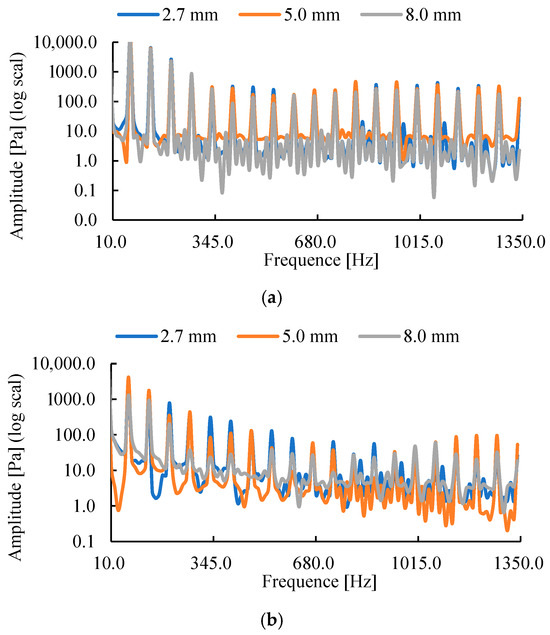
Figure 16.
Frequency domain diagram of pressure pulsation under 1.0Qdes at (a) monitoring point P1 and (b) monitoring point P2.
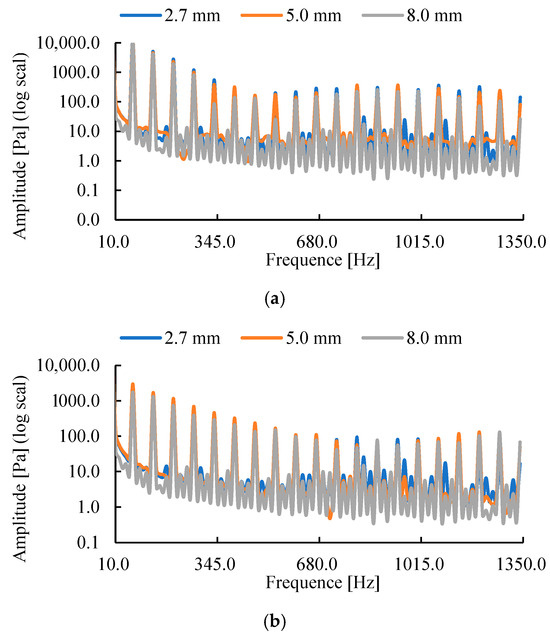
Figure 17.
Frequency domain diagram of pressure pulsation under 1.2Qdes at (a) monitoring point P1 and (b) monitoring point P2.
Table 5.
Fundamental frequency amplitude at monitoring points P1 (impeller hub LE) and P2 (impeller hub TE) versus blade root clearance δ under 1.0 Qdes.
Table 6.
Fundamental frequency amplitude at monitoring points P1 (impeller hub LE) and P2 (impeller hub TE) versus blade root clearance δ under 1.2 Qdes.
5. Conclusions
This study investigates the influence of blade root clearance (δ) on pressure pulsation characteristics in vertical axial flow pumps through three clearance configurations. Unsteady RANS simulations reveal the spatial distribution of pressure pulsation intensity, while Fast Fourier Transform (FFT) analysis characterizes time–frequency domain behavior at impeller leading (LE) and trailing edges (TE). Key findings demonstrate the following:
- (1)
- Leakage flow exerts dominant influence on hub-region pressure pulsation. At the impeller inlet, pulsation intensity increases monotonically with δ, whereas the outlet exhibits non-monotonic variation (initial increase followed by decrease). Concurrently, δ enlargement expands the low-intensity region within blade channels due to enhanced leakage vortex structures.
- (2)
- Time–domain pressure pulsations near the impeller hub leading edge (LE) exhibit peak/trough counts per cycle matching the blade number. LE peak-to-peak amplitude progressively decreases with increasing clearance δ, indicating damped leakage vortex-preswirl interactions. Conversely, trailing edge (TE) peak-to-peak amplitude responds non-monotonically to δ variation, peaking at intermediate clearances (δ = 5.0 mm) due to clearance-modulated rotor–stator interactions.
- (3)
- LE pressure pulsation consistently demonstrates blade-passing frequency dominance, with fundamental amplitude attenuating by 4.7–11.7% across flow rates as δ increases from 2.7 mm to 8.0 mm. TE spectral response is flow-dependent: under low flow (0.8Qdes), 0.5× shaft frequency dominates with amplitude amplification up to 101.7% at δ = 8.0 mm compared with δ = 2.7 mm; at design/high flows (1.0Qdes/1.2Qdes), blade-passing frequency prevails with amplitude variations of 42.2% (δ = 5.0 mm) to −55.9% (δ = 8.0 mm) relative to minimal clearance.
Given the condition-dependent optimal δ thresholds identified, these results establish a physics-informed framework for blade root clearance optimization in vertical axial flow pump design.
Author Contributions
Conceptualization, F.M.; methodology, F.M. and Y.L.; software, F.M., M.L. and C.N.; validation, FM., Y.L. and C.N.; formal analysis, F.M. and Y.L.; investigation, F.M. and M.L.; resources, F.M. and Y.L.; data curation, F.M. and C.N.; writing—original draft preparation, F.M.; writing—review and editing, F.M., M.L. and C.N.; visualization, F.M.; supervision, F.M.; project administration, F.M.; funding acquisition, F.M. All authors have read and agreed to the published version of the manuscript.
Funding
This research was funded by the Changzhou Science and Technology Project (grant number CJ20235074). The Open Research Subject of Key Laboratory of Fluid Machinery and Engineering (Xihua University), Sichuan Province (grant number LTJX-2025003).
Data Availability Statement
Data is contained within the article.
Conflicts of Interest
The authors declare no conflicts of interest.
Nomenclature
The following nomenclature is used in this manuscript:
| RCF | Root clearance flow |
| TCF | Tip clearance flow |
| FFT | fast Fourier transform |
| WT | wavelet transform |
| n | Rotation speed |
| Qdes | Design flow rate |
| E | Efficiency |
| H | Head |
| δ | Blade root clearance |
| RANS | Reynolds-averaged Navier–Stokes |
| EXP | Experiment |
| CFD | Computational fluid dynamics |
| Sin | Axial coordinate value of impeller inlet |
| Sout | Axial coordinate value of impeller outlet |
| S* | Axial coefficient |
| Psd | Pressure standard deviation |
| Rhub | Hub radius |
| Rrim | Rim radius |
| R* | Radial coefficient |
References
- Zhang, X.; Tang, F.; Liu, C.; Shi, L.; Liu, H.; Sun, Z.; Hu, W. Numerical simulation of transient characteristics of start-up transition process of large vertical siphon axial flow pump station. Front. Energy Res. 2021, 9, 706975. [Google Scholar] [CrossRef]
- Yang, F.; Li, Z.; Hu, W.; Liu, C.; Jiang, D.; Liu, D.; Nasr, A. Analysis of flow loss characteristics of slanted axial-flow pump device based on entropy production theory. R. Soc. Open Sci. 2022, 9, 211208. [Google Scholar] [CrossRef] [PubMed]
- Meng, F.; Li, Y.; Chen, J. Investigation of energy losses induced by non-uniform inflow in a coastal axial-flow pump. J. Mar. Sci. Eng. 2022, 10, 1283. [Google Scholar] [CrossRef]
- Shen, J.; Xu, F.; Cheng, L.; Pan, W.; Ge, Y.; Li, J.; Zhang, J. Simulation of internal flow characteristics of an axial flow pump with variable tip clearance. Water 2022, 14, 1652. [Google Scholar] [CrossRef]
- Gu, Y.; Bian, J.; Wang, Q.; Stephen, C.; Liu, B.; Cheng, L. Energy performance and pressure fluctuation in multi-stage centrifugal pump with floating impellers under various axial oscillation frequencies. Energy 2024, 307, 132691. [Google Scholar] [CrossRef]
- Gu, Y.; Zhu, Q.; Bian, J.; Wang, Q.; Cheng, L. Novel sealing design for high-speed coolant pumps: Impact on energy performance, axial thrust and flow field. Energy 2025, 321, 135511. [Google Scholar] [CrossRef]
- Li, W.; Ji, L.; Shi, W.; Li, E.; Yang, Z. Particle image velocimetry measurement of flow fields in a mixed-flow pump with non-uniform tip clearance. J. Vis. 2021, 24, 29–45. [Google Scholar] [CrossRef]
- Ji, L.; Liu, Z.; Li, W.; Shi, W.; Tian, F.; Pu, W.; Yang, Y.; Xiao, C.; Agarwal, R. PIV investigation of stalled flow field near the blade rim region of mixed-flow pump under different tip clearances. Flow Meas. Instrum. 2024, 99, 102668. [Google Scholar] [CrossRef]
- Li, W.; Ji, L.; Li, E.; Zhou, L.; Agarwal, R.K. Effect of tip clearance on rotating stall in a mixed-flow pump. J. Turbomach. 2021, 143, 091013. [Google Scholar] [CrossRef]
- Ji, L.; Li, S.; Li, W.; Huang, Y.; Shi, W.; Yang, Y.; Li, H.; Yang, Y.; Agarwal, R.K. Study on passive suppression method of rotating stall in mixed-flow pump: Using different impeller rim structures. Proc. Inst. Mech. Eng. Part A J. Power Energy 2023, 237, 965–984. [Google Scholar] [CrossRef]
- Han, Y.; Tan, L. Spatial-temporal evolution of tip leakage cavitation with double-hump in a mixed flow pump with tip clearance. Phys. Fluids 2023, 35, 045152. [Google Scholar]
- Zhang, H.; Zang, J.; Zhang, D.; Shi, W.; Shen, J. Analysis of the formation mechanism of secondary tip leakage vortex (S-TLV) in an axial flow pump. Machines 2022, 10, 41. [Google Scholar] [CrossRef]
- Wang, L.; Tang, F.; Liu, H.; Zhang, X.; Sun, Z.; Wang, F. Investigation of cavitation and flow characteristics of tip clearance of bidirectional axial flow pump with different clearances. Ocean Eng. 2023, 288, 115960. [Google Scholar] [CrossRef]
- Lin, Z.; Yang, F.; Guo, J.; Jian, H.; Sun, S.; Jin, X. Leakage flow characteristics in blade tip of shaft tubular pump. J. Mar. Sci. Eng. 2023, 11, 1139. [Google Scholar] [CrossRef]
- Ye, D.; Wu, J.; Liu, A.; Chen, J.; Zhai, F.; Lai, X. Investigation of unsteady pressure pulsations of reactor coolant pump passage under flow coast-down. Machines 2023, 11, 55. [Google Scholar] [CrossRef]
- Sun, Z.; Zeng, Q.; Wan, L.; Dai, H. Control and dynamic characteristics analysis for the double-compound axial piston pump based on working conditions. Machines 2022, 10, 411. [Google Scholar] [CrossRef]
- Zhou, Q.; Li, H.; Dong, J.; Zhong, Z.; Sun, S. Experimental investigation on the unsteady pressure pulsation and vibration of a nuclear pump test loop. Energy Sci. Eng. 2022, 10, 2877–2891. [Google Scholar] [CrossRef]
- Zheng, X.; Li, H.; Zhang, S.; Zhang, Y.; Li, J.; Zhao, W. Hydrodynamic feature extraction and intelligent identification of flow regimes in vaneless space of a pump turbine using improved empirical wavelet transform and Bayesian optimized convolutional neural network. Energy 2023, 282, 128705. [Google Scholar] [CrossRef]
- Liu, H.; Tang, F.; Shi, L.; Dai, L.; Shen, J.; Liu, J. The analysis of cavitation flow and pressure pulsation of bi-directional pump. J. Mar. Sci. Eng. 2023, 11, 268. [Google Scholar] [CrossRef]
- Jiang, D.; Yang, F.; Cai, Y.; Xu, G.; Tang, F.; Jin, Y. Cross influence of rotational speed and flow rate on pressure pulsation and hydraulic noise of an axial-flow pump. Phys. Fluids 2023, 35, 095144. [Google Scholar] [CrossRef]
- Lu, J.; Liu, J.; Qian, L.; Liu, X.; Yuan, S.; Zhu, B.; Dai, Y. Investigation of pressure pulsation induced by quasi-steady cavitation in a centrifugal pump. Phys. Fluids 2023, 35, 025119. [Google Scholar] [CrossRef]
- Zhang, X.; Tang, F. Investigation on hydrodynamic characteristics of coastal axial flow pump system model under full working condition of forward rotation based on experiment and CFD method. Ocean Eng. 2022, 253, 111286. [Google Scholar] [CrossRef]
- Liang, S.; Pang, S.; Liu, J.; Chen, Z.; Sun, D.; Li, C. Unsteady internal flow characteristics study of a hydrogen circulation pump under different pressure differential conditions. Int. J. Hydrogen Energy 2024, 60, 1147–1156. [Google Scholar] [CrossRef]
- Shi, L.; Yuan, Y.; Jiao, H.; Tang, F.; Cheng, L.; Yang, F.; Jin, Y.; Zhu, J. Numerical investigation and experiment on pressure pulsation characteristics in a full tubular pump. Renew. Energy 2021, 163, 987–1000. [Google Scholar] [CrossRef]
- Zheng, Y.; Li, Y.; Zhu, X.; Yuan, S.; Zhang, H.; Wang, H. Hydraulic performance improvement of a two-way pump station through bell mouth shape design. Phys. Fluids 2024, 36, 035119. [Google Scholar] [CrossRef]
- Zheng, Y.; Li, Y.; Yuan, S.; Zhu, X.; Wang, M. Improvement of energy performance of a two-way pump station based on controllable diffusion technology. Phys. Fluids 2024, 36, 075188. [Google Scholar] [CrossRef]
- Yang, Y.; Zhou, L.; Bai, L.; Xu, H.; Lv, W.; Shi, W.; Wang, H. Numerical investigation of tip clearance effects on the performance and flow pattern within a sewage pump. J. Fluids Eng. 2022, 144, 081202. [Google Scholar] [CrossRef]
- Li, Y.; Zheng, Y.; Meng, F.; Wang, M.; Li, Y. Numerical simulation on the influence of root clearance on the hydraulic performance of axial flow pump device. J. Braz. Soc. Mech. Sci. Eng. 2022, 44, 161. [Google Scholar] [CrossRef]
- Wang, H.; Wu, X.; Xu, X.; Bian, S.; Meng, F. Size Effect on Energy Characteristics of Axial Flow Pump Based on Entropy Production Theory. Machines 2025, 13, 252. [Google Scholar] [CrossRef]
- Wang, M.; Ni, X.; Chen, J.; Li, X.; Meng, F.; Yang, Y.; Gu, Y. Energy performance improvement of mixed flow pump based on coupling of geometric and hydrodynamic parameters. Energy 2025, 332, 137243. [Google Scholar] [CrossRef]


Disclaimer/Publisher’s Note: The statements, opinions and data contained in all publications are solely those of the individual author(s) and contributor(s) and not of MDPI and/or the editor(s). MDPI and/or the editor(s) disclaim responsibility for any injury to people or property resulting from any ideas, methods, instructions or products referred to in the content. |
© 2025 by the authors. Licensee MDPI, Basel, Switzerland. This article is an open access article distributed under the terms and conditions of the Creative Commons Attribution (CC BY) license (https://creativecommons.org/licenses/by/4.0/).