1. Introduction
The evolution of Additive Manufacturing has radically altered the product manufacturing landscape. There is no doubt that AM capabilities are an essential aspect of Industry 4.0. A variety of industries have already embraced this innovative technology, e.g., aerospace, automotive, and medical [
1]. AM allows for customized designs, improved performance, increased efficiency, and more complex structures and geometries compared to traditional manufacturing processes. Due to the latter characteristics, this disruptive manufacturing technology is currently adopted not only for prototyping, but also for end-use and spare parts production [
2,
3,
4]. AM technologies are more material- and energy-efficient compared to traditional manufacturing techniques, making them more sustainable for use at a time where environmental pollution and climate change are major concerns across the globe [
5]. Considering that AM technologies generate nearly no waste, they have the potential to transform many heavy polluting industries, such as the automotive industry, into more environmentally friendly ones [
6]. Additionally, it can boost the “circular economy” by giving small-scale producers the opportunity to decentralize the supply chain of goods, repair and create new competitive products, and extend the life cycle of polymers [
7]. It is feasible that an increasing number of products will be made with AM technologies.
The current study focuses on the development of end-use components for turbomachinery applications. Impellers are considered a core component of turbomachinery. Several studies have been conducted on the utilization of Additive Manufacturing technologies to develop contemporary consumer components. Zirak N. et al. studied the use of different AM methods to fabricate centrifugal impellers and compressors. AM impellers demonstrated increased efficiency and performance, especially when using SLA and MJF technologies, where the final component had greater surface quality. However, the polymeric materials’ limitations regarding their strength and lifespan have been highlighted [
8]. Hernandez F. et al. fabricated a closed vane pump impeller using binder jetting 3D-printing to create the impeller’s sand mold. The final impeller was cast in 316 stainless steel and tested in real time. The results showed a 1% reduction in average current consumption, while the pump characteristics, pressure, and flow remained almost unchanged [
9]. In another study, Popa I. et al. studied and fabricated a 3D-printed closed vane impeller for use in space-active thermal control systems in satellites. The manufacturing time of the impeller manufactured with additive manufacturing methods decreased by 75%, while its dimensional accuracy increased [
10]. Chang H. et al. presented a multi-objective optimization algorithm for reducing energy loss from centrifugal pumps. The study achieved a 1.37% increase in efficiency after the optimization of eight impeller design variables. The main energy loss in centrifugal pumps arises from turbulent kinetic energy, which increases with impeller diameter, while total loss increases with the flow rate. By increasing the flow, the optimized impeller demonstrated enhanced internal flow stability, characterized by more coherent vortex structures aligned with the flow path and reduced pressure pulsation frequencies [
11]. S. Fernández et al. [
12] manufactured an impeller using additive manufacturing, replicated from the original impeller provided by the water pump’s manufacturer. The 3D-printed impeller was tested under operating conditions to evaluate its performance and efficiency in comparison to the original one. The 3D-printed impeller exhibited an increase in efficiency of approximately 2% due to the reduced surface roughness achieved through AM. In addition, the experimental results demonstrated that the AM impeller is approximately one-third less expensive than its metal counterpart. Adiaconitei A. et al. also studied the use of additive manufacturing to produce a close vane impeller for space applications. The study concluded that the fabricated AM impeller showed satisfactory results in terms of dimensional accuracy and roughness [
13]. In another research study, Nelson S. Andres [
14] fabricated an AM impeller for a solar-powered water pump to reduce the machine’s energy consumption. Measurements and calculations showed that the pump with a polymer impeller used less power than the pump with a metal impeller. The electric current was reduced by 15.38% when the AM plastic impeller replaced the water pump’s original metal impeller. The AM plastic impeller was also shown to be as strong and reliable as a regular metal impeller after more than 300 h of operation. The latter studies show that the use of AM to manufacture centrifugal impellers can be beneficial in terms of dimensional accuracy and roughness, while keeping manufacturing time and associated costs relatively low.
In terms of performance, the impellers manufactured using AM demonstrate slightly better surface roughness when compared to sandcast impellers. This characteristic has a major impact on the pump’s overall performance. The AM impeller’s performance has been compared to a cast impeller through a series of Computational Fluid Dynamics (CFD) simulation studies and performance tests [
15,
16,
17]. Polak M. compared the performance of several types of centrifugal pump impellers fabricated with additive manufacturing. The hydraulic performance characteristics were compared to those of traditional impellers made using sand mold casting. The AM impellers demonstrated higher flow and increased efficiency compared to conventional cast impellers [
18]. Lim, S. L. et al. studied the performance of a double-suction centrifugal pump using CFD analysis to investigate the effect of surface roughness on the centrifugal pump’s hydraulic performance. Results verified the strong connection between the impeller’s surface roughness and the pump’s performance. The difference between smooth and rough models reached 3%, whereas the surface quality of the outward shroud of the impeller is responsible for greater power loss than any other surface [
19]. In a similar study, He, X. et al. studied the influence of surface roughness on pump performance based on computational fluid dynamics. According to the latter study, as surface roughness increases, the pump’s efficiency diminishes gradually. Surface roughness is found to have a bigger impact on the pump’s efficiency than the head. Additionally, the roughness of the outward surfaces of the impeller influence is responsible for losses in the pump’s mechanical efficiency, while the inner wall roughness is responsible for the losses in the pump’s hydraulic efficiency [
20].
Apart from losses in pump performance, surface roughness can cause cavitation on the impeller’s blades. Cavitation is a common phenomenon in turbomachinery, which causes significant performance losses and damages the flow passage components. Xu, W. et al. investigated the influence of surface roughness on the cavitation performance of centrifugal pumps. The increase in wall roughness caused the cavitation phenomenon to escalate up to 2.14% on average at cavitation development and by 1.31% on average at fracture cavitation. By increasing the roughness of the impeller’s surface, the low-pressure region of the impeller expands, creating bubbles, which cause flow loss, resulting in decreasing performance [
21]. Lipej, A. et al. studied the influence of surface roughness on the NPSH characteristics of centrifugal pumps through a series of CFD numerical models. The study also concludes that the pump’s performance is significantly decreasing as the wall roughness increases, due to cavitation and turbulent flow near the rough surfaces [
22]. Since centrifugal pumps are widespread in all branches of industry, their development is essential for operating efficiently and consuming less power.
The aim of the present study is to develop two centrifugal impellers by using additive manufacturing technology with enhanced performance. Knowing the factors that cause poor performance and shorten the pump’s lifespan, the present research focuses also on minimizing these factors to enhance the pump’s efficiency. Two impellers were studied, an open vane and a closed vane, both made of GG-18 cast iron. For each impeller, a composite polymer counterpart was fabricated using the material extrusion (MEX) AM method. The 3D-printed impellers were made of PPS-CF15 composite. The surface roughness of every impeller was measured, as well as their final characteristics, weight, and dimensions. A CFD model was also developed to calculate the estimated performance and the efficiency of each impeller. Subsequently, the hydraulic performance and efficiency of each of the two impellers of the same design were tested in real-time operation. After the evaluation of the results, in both designs, the polymer composite impellers were found to be superior to their cast iron counterparts both in terms of performance and efficiency.
2. Materials and Methods
2.1. Impellers’ Design
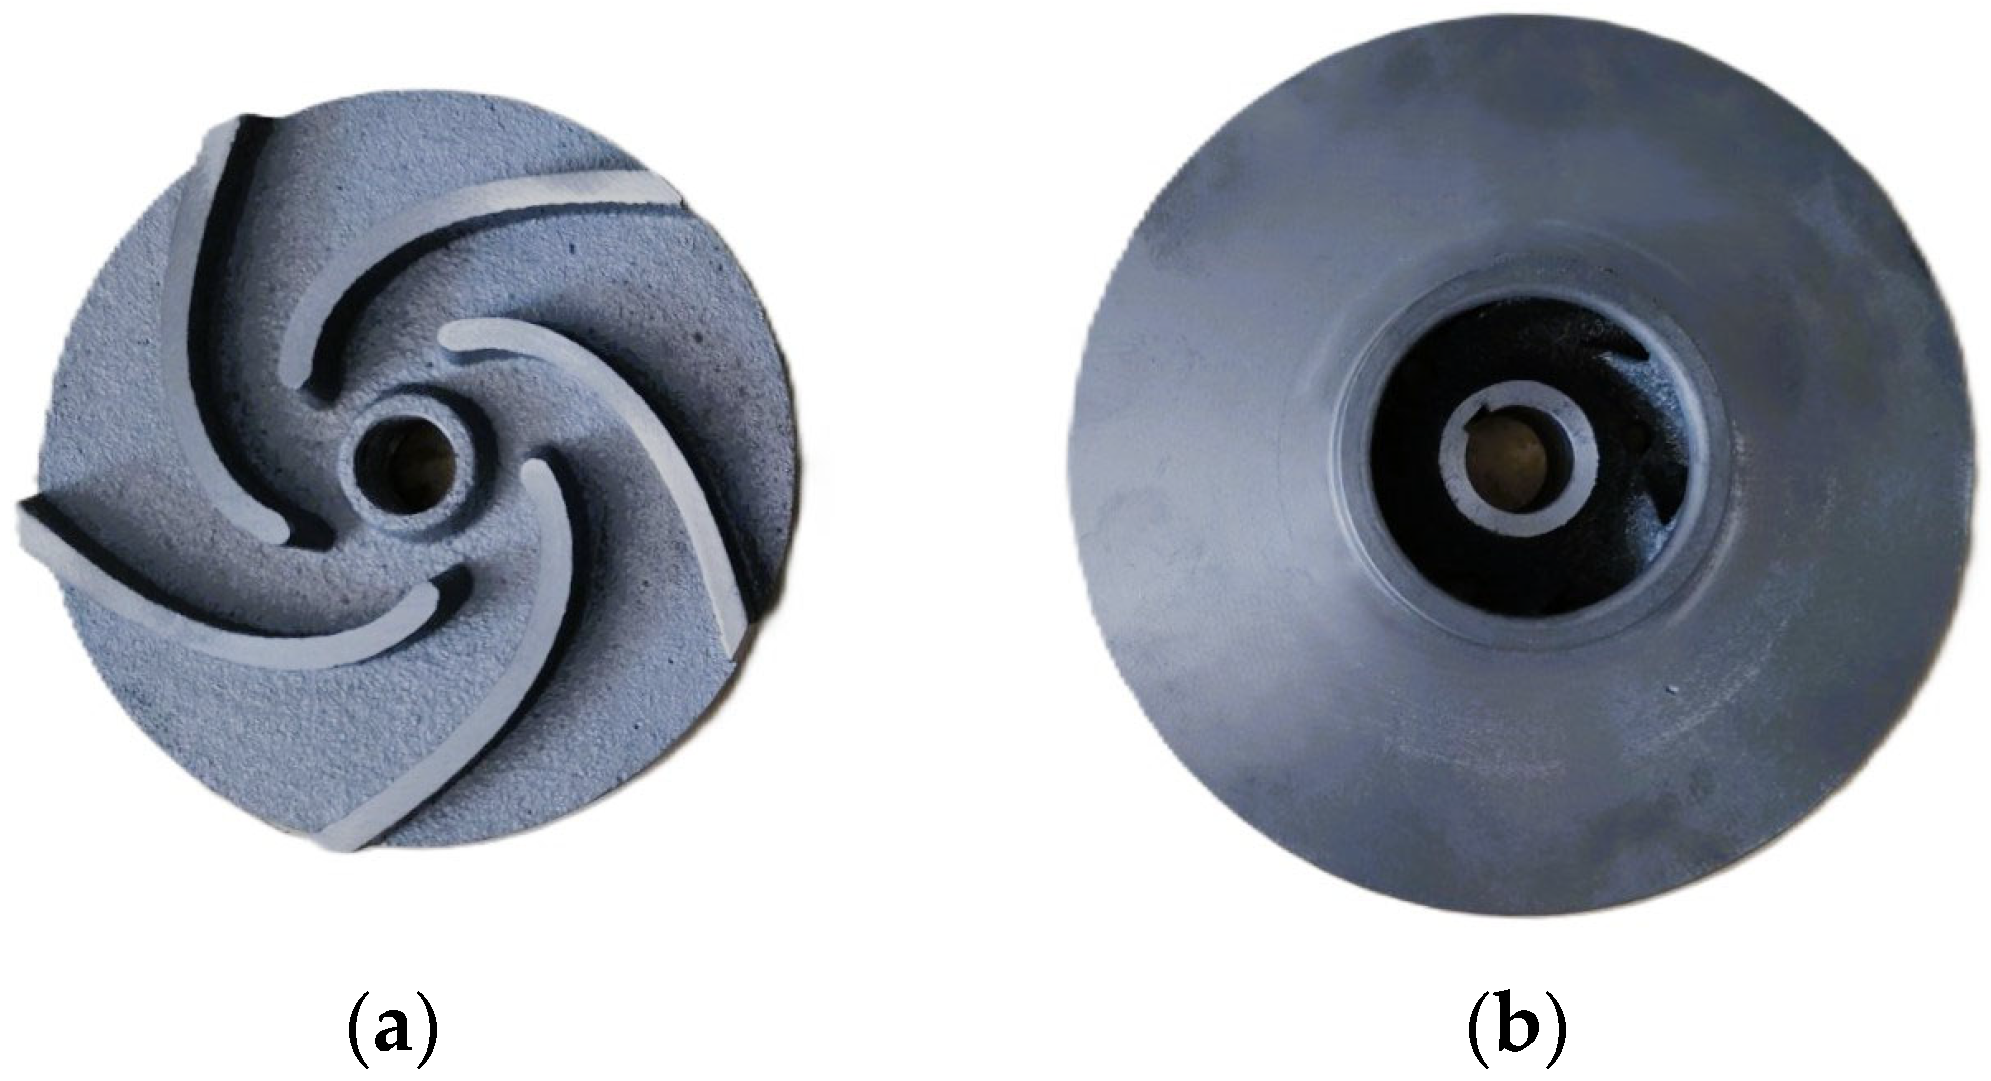
Two cast iron impellers were studied in the present research: a semi-open vane and a closed vane impeller, as shown in
Figure 1. Both impellers are designed for operation with water, mainly for irrigation purposes and cool water transport, using a 5.5 kW three-phase asynchronous electric motor. Their performance characteristics are summarized in
Table 1.
The specific speed of each impeller is calculated by the following equation:
where n is rotational speed (rpm), Q is the optimal flow rate (m
3/s), and H is the optimal pump head (m).
The impellers were 3D-scanned using an Einscan HX 3D Scanner (Shinning 3D, Hangzhou, China) at 0.05 mm resolution. The digital twin of the original impellers was designed in SolidWorks 2023 (v. SP05) software. The final 3D model of each impeller had a less than 0.1 mm deviation from the original part.
2.2. Material and Fabrication Parameters
The material used for the impeller fabrication is Polyphenylene Sulphide reinforced with carbon fibers (Treed PPS-CF15, TreeD Filaments, Seregno, Italy) at a weight percentage of 15%. PPS-CF 15 boasts excellent mechanical and thermal properties. It is characterized by high stiffness, strength, and exceptional resistance to solvents, corrosion, and low water absorption, which helps maintain its mechanical and thermal properties even in humid conditions, such as inside a water pump. The composite filament properties can be availed from Mansour G. et al. [
23] and are summarized in
Table 2.
The fabrication of the 3D-printed specimens was achieved through a Raise Pro 2 3D printer (Raise 3D Technologies, Inc., Shanghai, China) via the material extrusion (MEX) method. Ideamaker software v4.4.3 Alpha (Raise 3D Technologies, Inc., Irvine, CA, USA) was used to define the printing parameters of the fabricated parts. Considering that composite filaments are extremely abrasive, a 0.80 mm hardened steel nozzle was used for their fabrication. The printing parameters used for the composite impellers’ fabrication were chosen according to the filament manufacturer’s recommendations [
1] and are presented in
Table 3. To ensure the best overall mechanical properties, the filament was dried at 90 °C for 6 h before printing. The printed impellers are presented in
Figure 2.
The AM impellers were compared to the original cast iron ones in terms of their dimensional accuracy and weight. For the impeller’s dimensional evaluation, a CMM machine (Hexagon Brown and Sharpe, Scirocco 102009, Stockholm, Sweden) was used. Four measurements were made for each impeller: the inlet and outlet diameter, the spline bore diameter, and the impeller’s width. Results indicated a maximum 0.12 mm deviation from the original parts. The small deviation between the original and the 3D-printed components indicates that the geometry of each impeller would not affect its performance in subsequent performance tests. The impellers’ weight is summarized in
Table 4. The AM impellers have 7–8-times less weight compared to their cast iron counterparts.
2.3. Surface Roughness Measurement
The impeller’s surface roughness is a crucial performance factor. As the surface roughness increases, the flow near the walls of the impeller becomes turbulent, which has a significant impact on the pump’s performance. A confocal optical microscope (μsurf, NanoFocus AG 2003, Oberhausen, Germany) was used to extract a three-dimensional roughness profile and measure the surface roughness of the two materials used: cast iron and PPS-CF15.
2.4. Computational Fluid Dynamics Structural and Performance Analysis
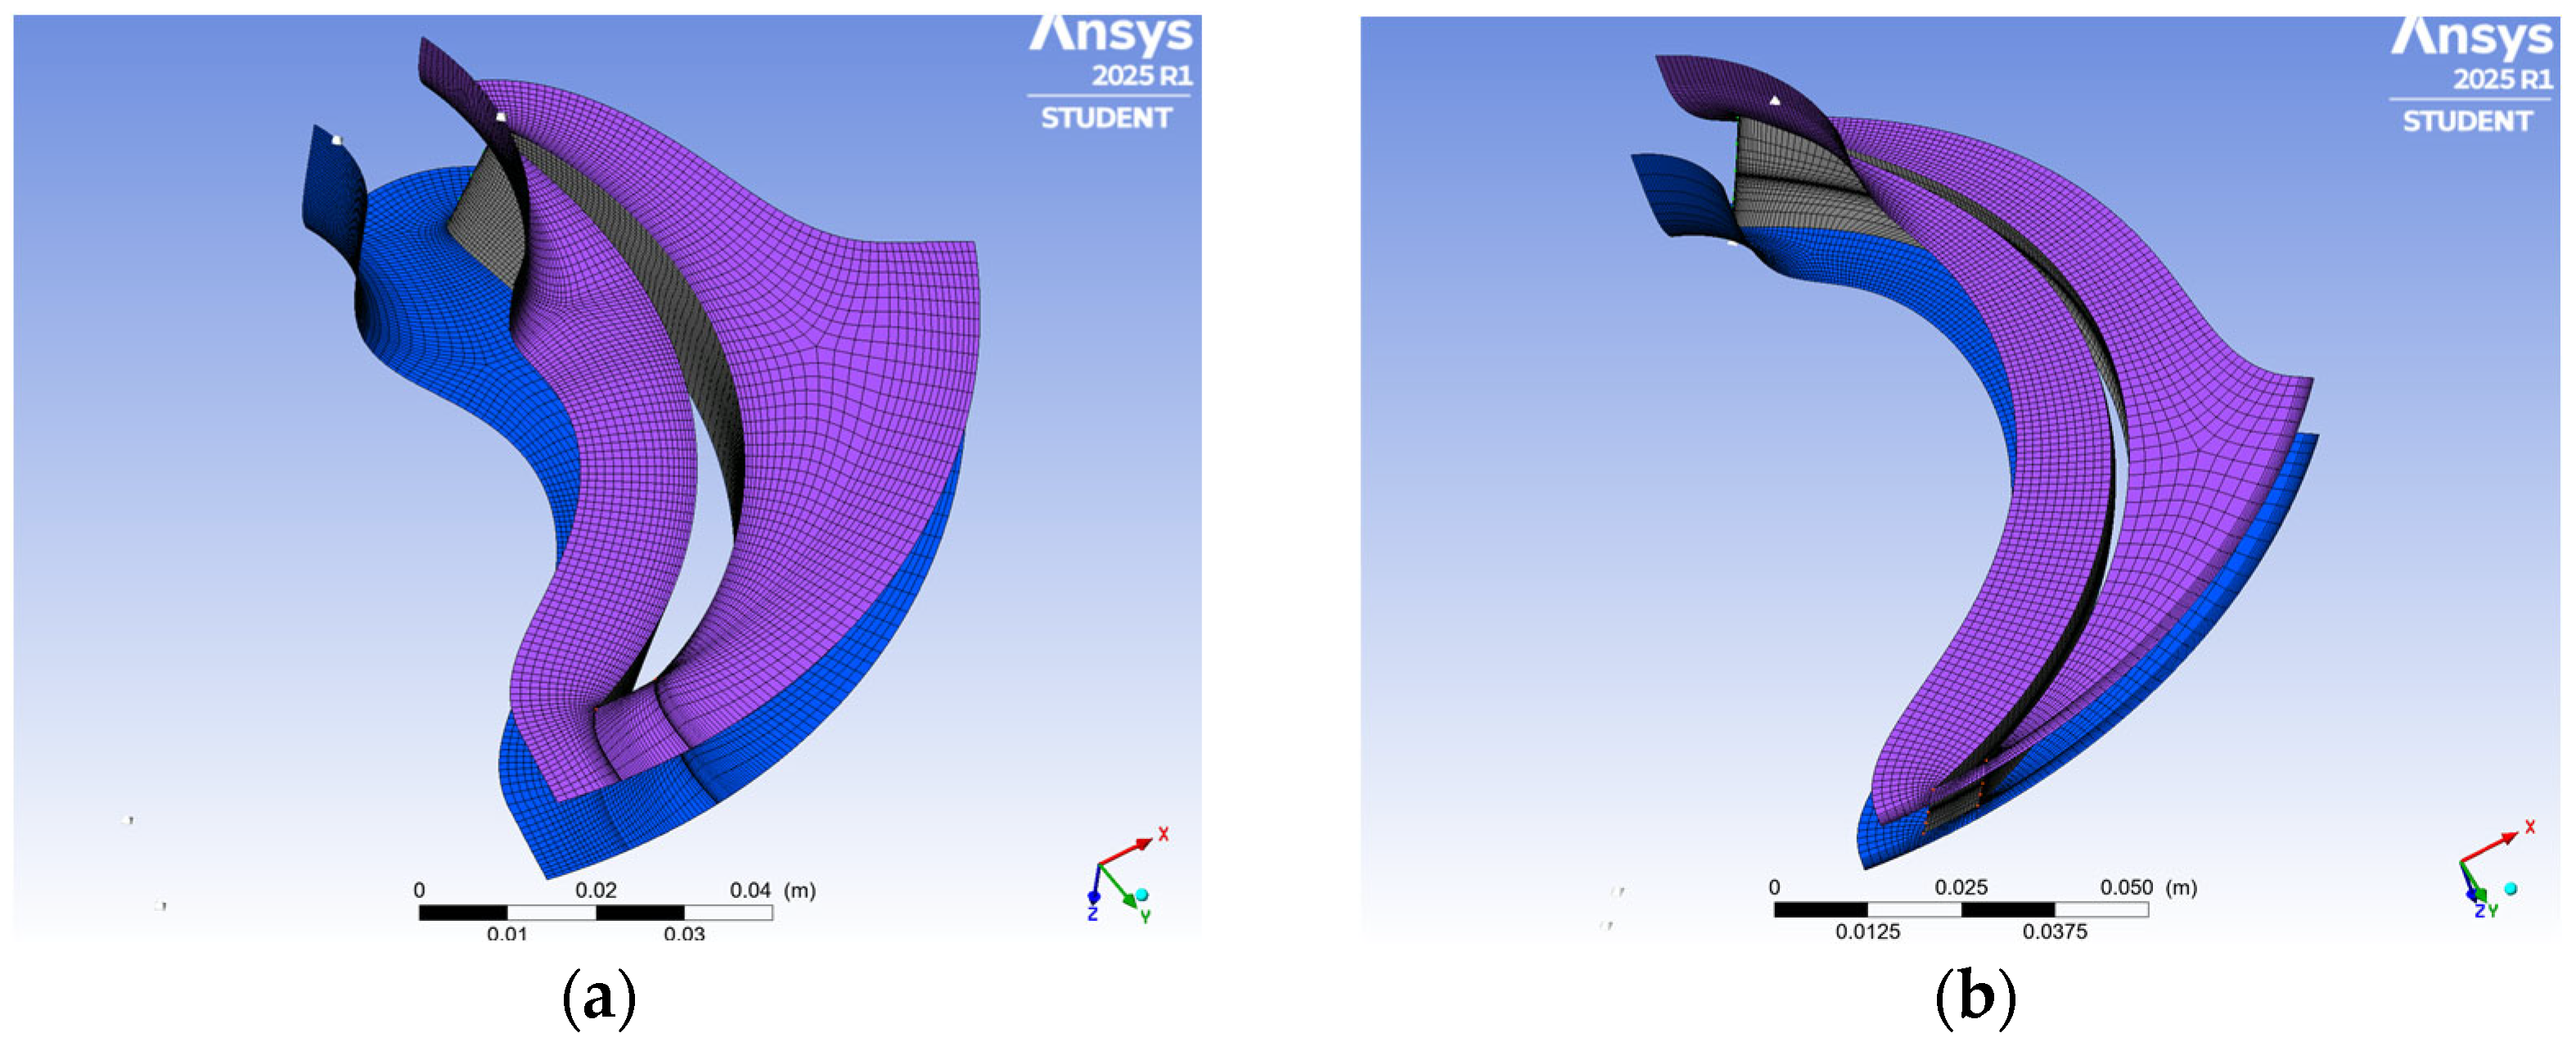
Both 3D models of the impellers were exported for further computational and simulation testing using ANSYS 2025 R1 software. The impellers’ geometry, as well as the inlet, outlet, high-periodic, and low-periodic surfaces, were meshed using ANSYS Turbogrid 2025 R1. To achieve greater accuracy in the subsequent computational simulations, only one section was isolated from each impeller’s overall geometry, as illustrated in
Figure 3a and 3b. The generated mesh contained hexahedral, tetrahedral, and prism shapes. The first grid distance from the wall was adjusted between 20 and 200 to apply rough wall functions near the wall. Furthermore, the mesh near the impeller’s wall was densely created with a global size factor expansion coefficient of 1.2. The final mesh consists of 98,428 elements for the closed vane impeller and 170,222 elements for the semi-open one.
The density of the fluid, the rotational speed, the inlet pressure of the fluid, and the mass flow rate in the outlet were inserted for each impeller. For the CFD model, the Reynolds-averaged Navier–Stokes equation was used, and the Shear Stress Transport (SST) model was applied to the turbulence model. The SST combines the k-ω model near walls and the k-ε in the free stream. This hybrid model is considered more accurate in predicting flow separation recirculation and near-wall behavior. Furthermore, it produces more accurate results for complex geometries such as impellers.
The mass conservation equation is given by:
where
ρ(
x,
t) is the density of a particle and
σ(
x,
t) is the rate of mass production per volume at time
t and position
x.
The general form of the Navier–Stokes equation is given by:
where ρ is the fluid density, u the velocity vector, p the pressure, μ the dynamic viscosity, and F the body forces.
The transport equations used for solving the transport variables k and ε are as follows:
For turbulent kinetic energy k,
For turbulence dissipation
ε,
where
Pkb and
Pεb represent the influence of buoyancy forces and
Pk is the turbulence pro- duction due to viscous forces. The model constants possess the values
Cε1 = 1.44,
Cε2 = 1.92,
Cμ = 0.09,
σε = 1.3, and
σk = 1 [
24].
The k-ω model solves the turbulence kinetic energy k and the ω, turbulence dissipation rate. This method provides near-wall treatment for low Reynolds numbers without involving nonlinear damping functions. The turbulence viscosity is associated with the turbulence kinetic energy and dissipation by the equation [
25]:
The transport equations used for solving the transport variables k and ε are as follows:
For turbulent kinetic energy k,
For turbulence dissipation rate
ω,
P is the turbulence production due to the viscous forces and is given by:
α = 0.55, β = 0.075, β′ = 0.09, σ
ω = 0.5, and σ
κ = 0.5 are the enclosure coefficients [
26].
The equivalent sand-grain roughness (
differs from the measured arithmetic mean roughness (R
a). According to Adam, T. et al. [
27], sand-grain roughness can be calculated using the equation:
On the impeller’s inlet, the zero-pressure boundary condition was applied, while the mass flow rate of the pump was applied to the outlet boundary condition. Convergence criteria for mass, momentum, and turbulence parameters were set to 10
−4. The equivalent sand-grain roughness was obtained and calculated for each material and surface type and inserted into the corresponding mesh surfaces. The computational and boundary conditions are summarized in
Table 5. During the CFD analysis, four different mesh sizes were examined for reassurance that the results were independent of the mesh quality. Among the examined grids, the deviation in the results did not exceed 5–7%, a percentage that is considered acceptable.
The power input to the impeller is given by:
where ρ is the density of the fluid, g is the gravitational constant, Q is the flow rate of the pump, H is the head of the pump, and
the pump’s efficiency. The section
of Equation (7) constitutes the pump’s output power, P
Q.
According to Bernoulli, the equation for the pump’s pressure head is:
where the subscripts d and s refer to the pump’s discharge and suction.
Pump efficiency (η) is also referred to as overall efficiency and characterizes the ratio of pump power output (P
Q) to power input (P) for the operating point in question:
2.5. Hydraulic Performance Test
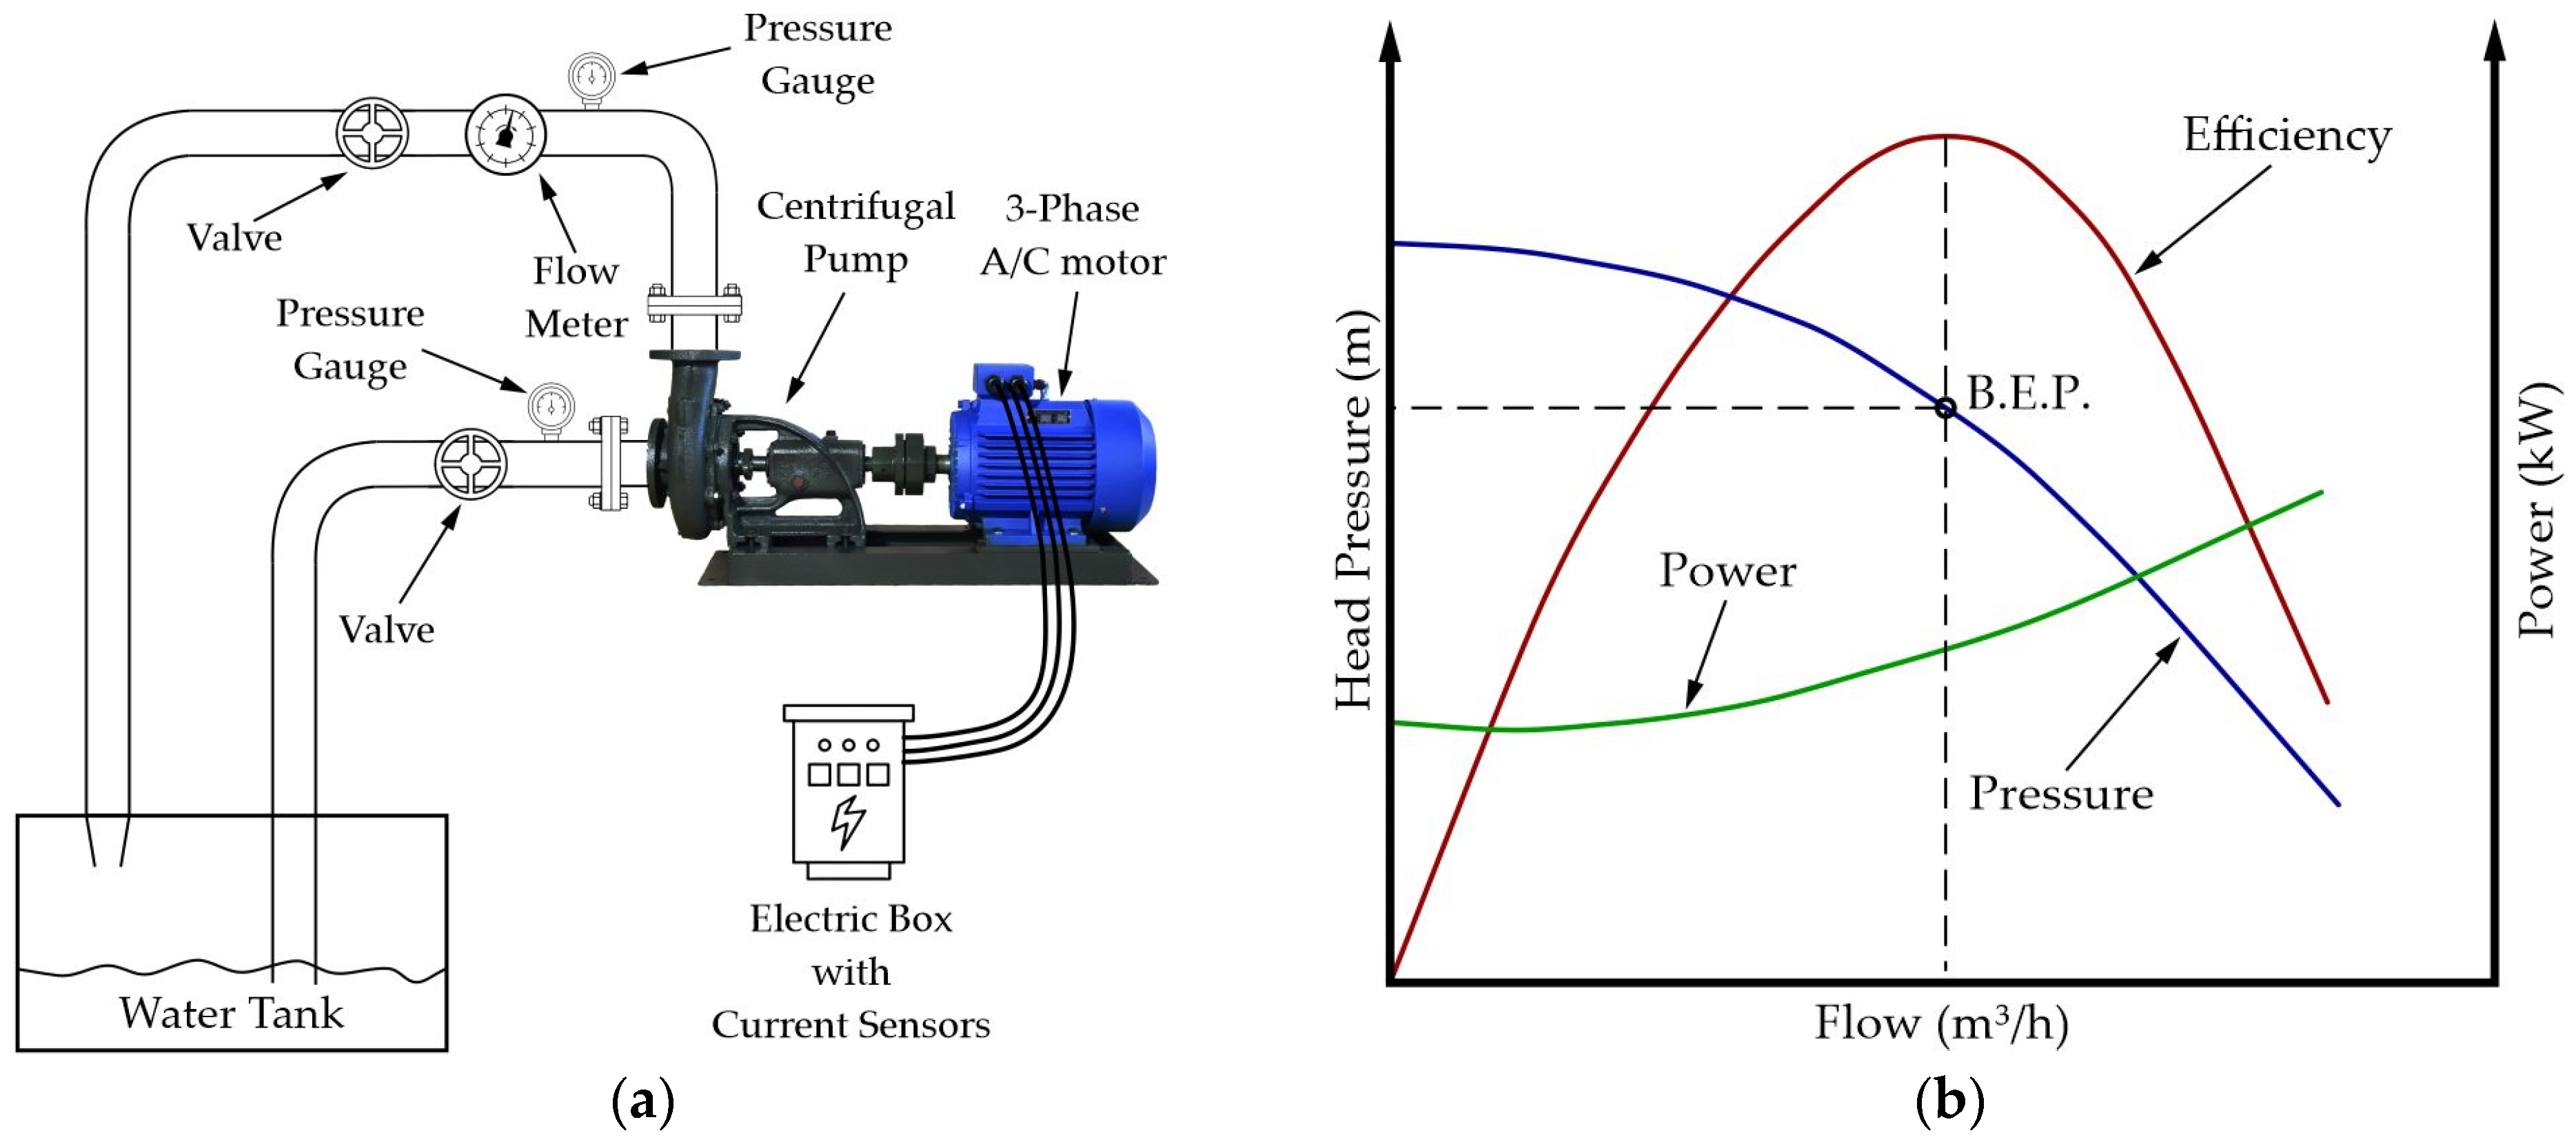
The hydraulic performance test is a crucial operation test for a centrifugal pump to evaluate its reliability and efficiency under various operating conditions. This procedure examines the relationship between electric power consumption, volumetric flow rate, pressure head, and efficiency to ensure that the machine, pump, and electric motor perform according to their design specifications. The centrifugal pump is connected to a closed-loop test rig equipped with several sensors, as depicted in
Figure 4a. The utilized sensors are capable of accurately measuring the pump’s flow rate, inlet and outlet pressure, and input electric power. The test rig used to calculate the performance of the pumps included two gate valves (ISO228/1) [
28] to regulate the flow during testing, two pressure gauges (PCE-DPG 3) to measure the relative pressure on the inlet and outlet of the pump, and a flow meter (Arkon MagX2 PN16 DN80, Brno, Czech Republic). The electric power of the asynchronous motor was measured using a digital multimeter (Schneider EasyLogic DM6X00H NC, Rueil-Malmaison, France). During the test, the water flow varies from shut off to maximum capacity, while the sensors are constantly recording the changes in pressure, flow, and power consumption. The performance test commenced with both gate valves in the fully open position, and the pump was operated for a duration of one minute. Subsequently, the outlet valve opening was reduced in 5% increments, with the test repeated at each increment until the valve was fully closed. Pressure, flow, and power consumption data were obtained at the end of each test. The pump’s performance and efficiency curves are created after the hydraulic performance test is completed. The collected data is compared to the theoretical performance model to identify possible performance deviations that are related to cavitation, impeller wear, or improper assembly.
The pump’s Best Efficiency Point (BEP) constitutes an essential factor that indicates the operating point where the pump works at maximum efficiency, as demonstrated in
Figure 4b. BEP refers to an exact point on the pump’s performance curve where the pump operates with maximum hydraulic efficiency. This point is usually located near the middle of the pump’s performance curve and is expressed as a volumetric flow rate at which maximum efficiency can be achieved. When a pump operates away from its BEP, either at very low flow (left of the BEP) or very high flow (right of the BEP), it can lead to inefficiencies or mechanical problems such as cavitation, overheating, vibration, and failure. Centrifugal pumps have to operate as close as possible to their BEP to ensure not only high efficiency but also reduced mechanical stresses and longer service life.
3. Results
3.1. Surface Roughness Measurements
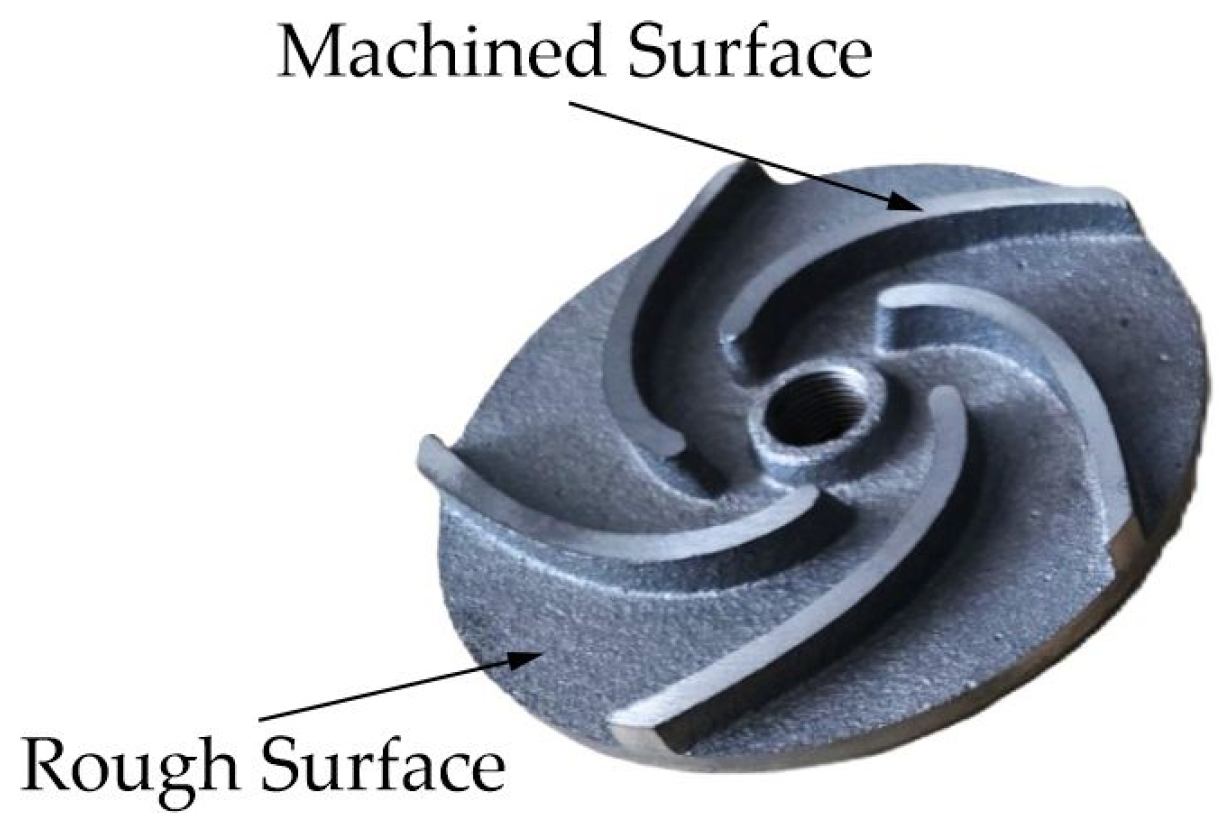
For the cast iron impeller, two measurements were made: one on the machined surface of the impeller and one on the rough surface of the blade, as demonstrated in
Figure 5. The roughness profile of the measurements made on the rough cast iron impeller can be viewed in
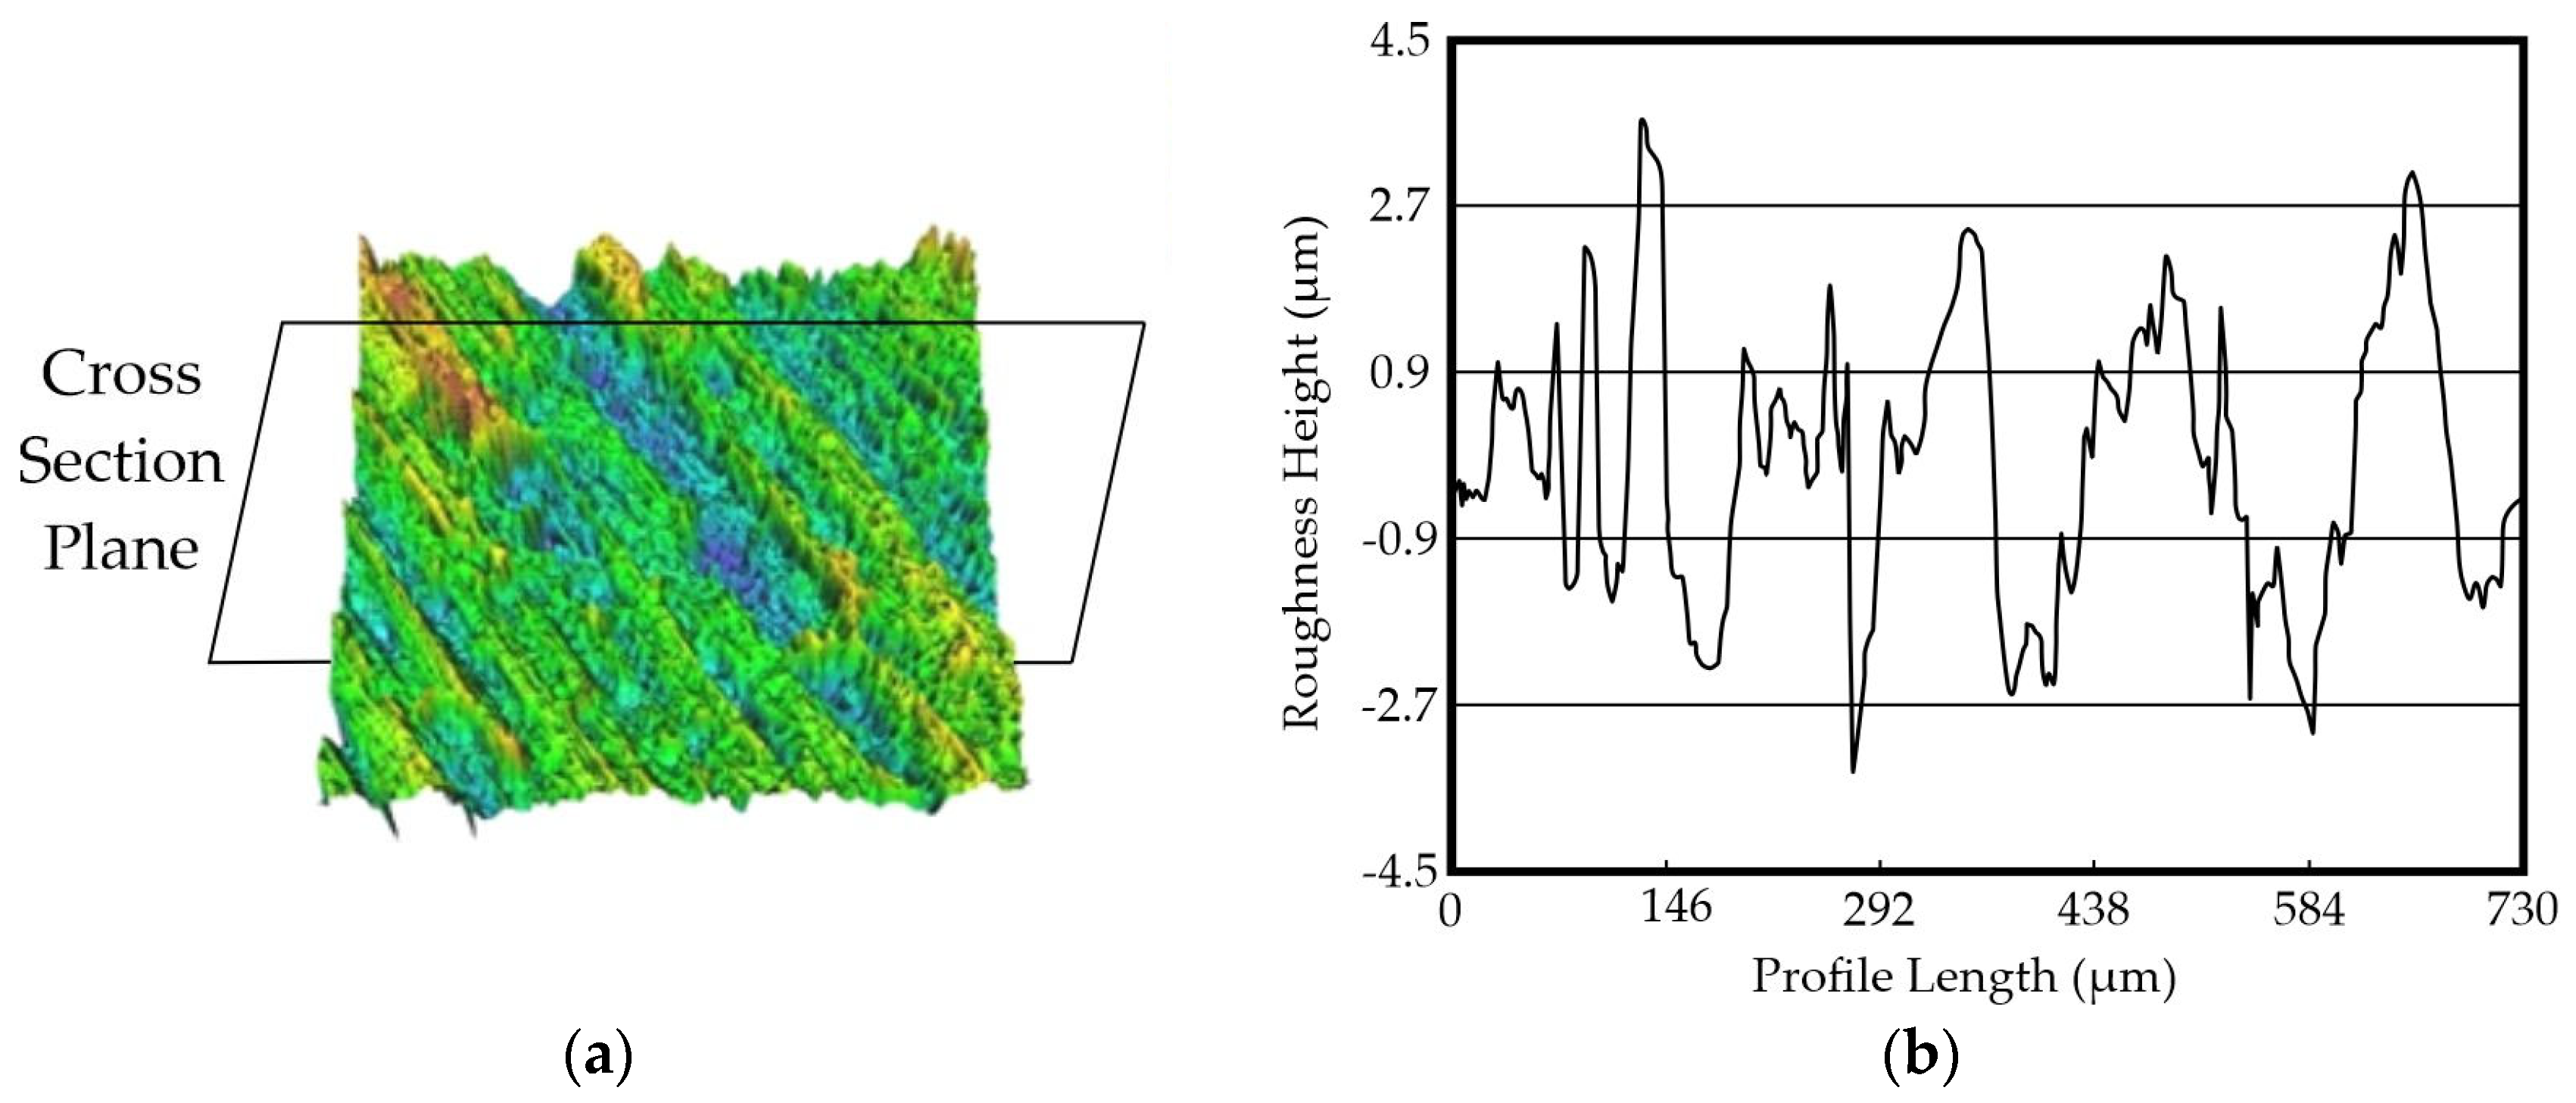
Figure 6a,b. The unprocessed surface has intense peaks and valleys throughout the tested surface. The latter characteristic is common in sand-casted surfaces, as the molding sand’s granulometry is relatively high. After machining, most of the peaks and valleys are eliminated, and the remaining roughness is due to imperfections during the material removal process.
The CNC-machined surface roughness profile is presented in
Figure 7a,b. Results indicated that the rough surface’s roughness was substantially higher compared to the machined one. The rough surface has a mean roughness (Ra) of 81.72 μm, while the machined surface was only 1.276 μm, as summarized in
Table 6. In conjunction with the 3D roughness profile, the intense peaks and valleys are also reflected in the measurement where the distance from the higher peak to the lowest valley (Rt) was measured at 732.771 μm, which was reduced after machining to 6.136 μm.
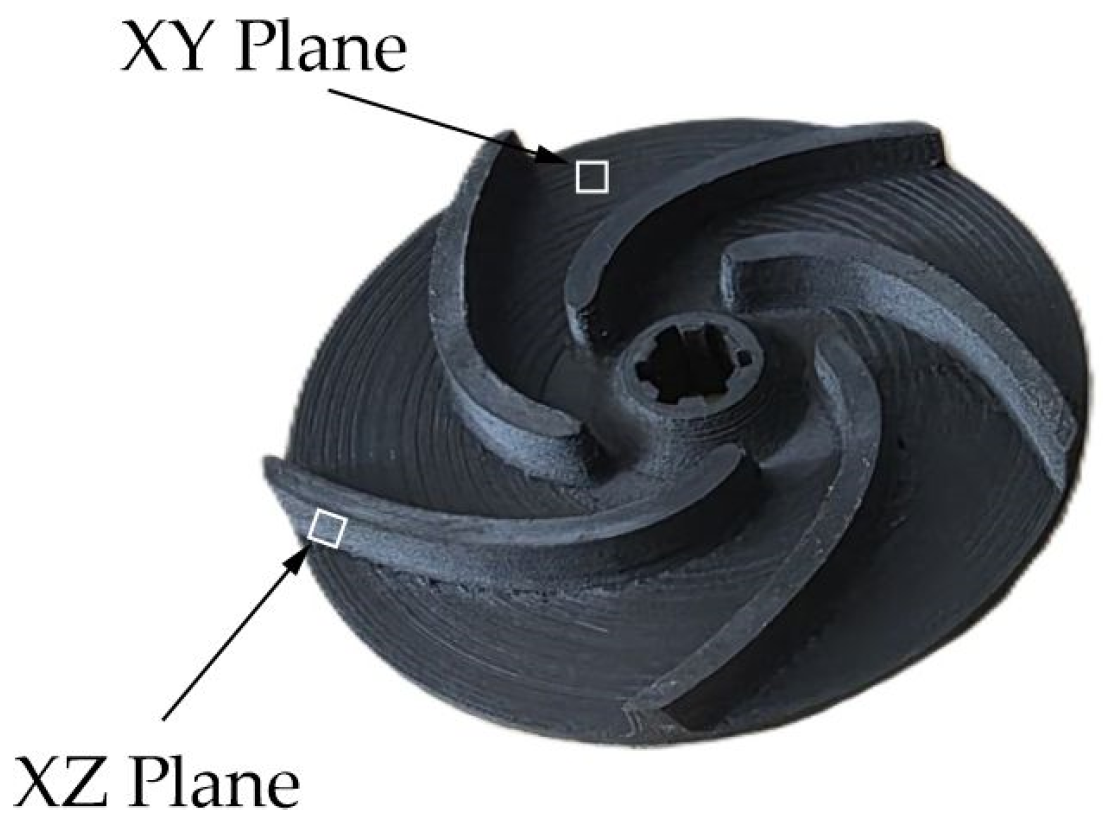
The 3D-printed impeller was also measured to calculate its surface roughness. Two measurements were conducted, in the XY plane and the XZ plane of the printed component, as depicted in
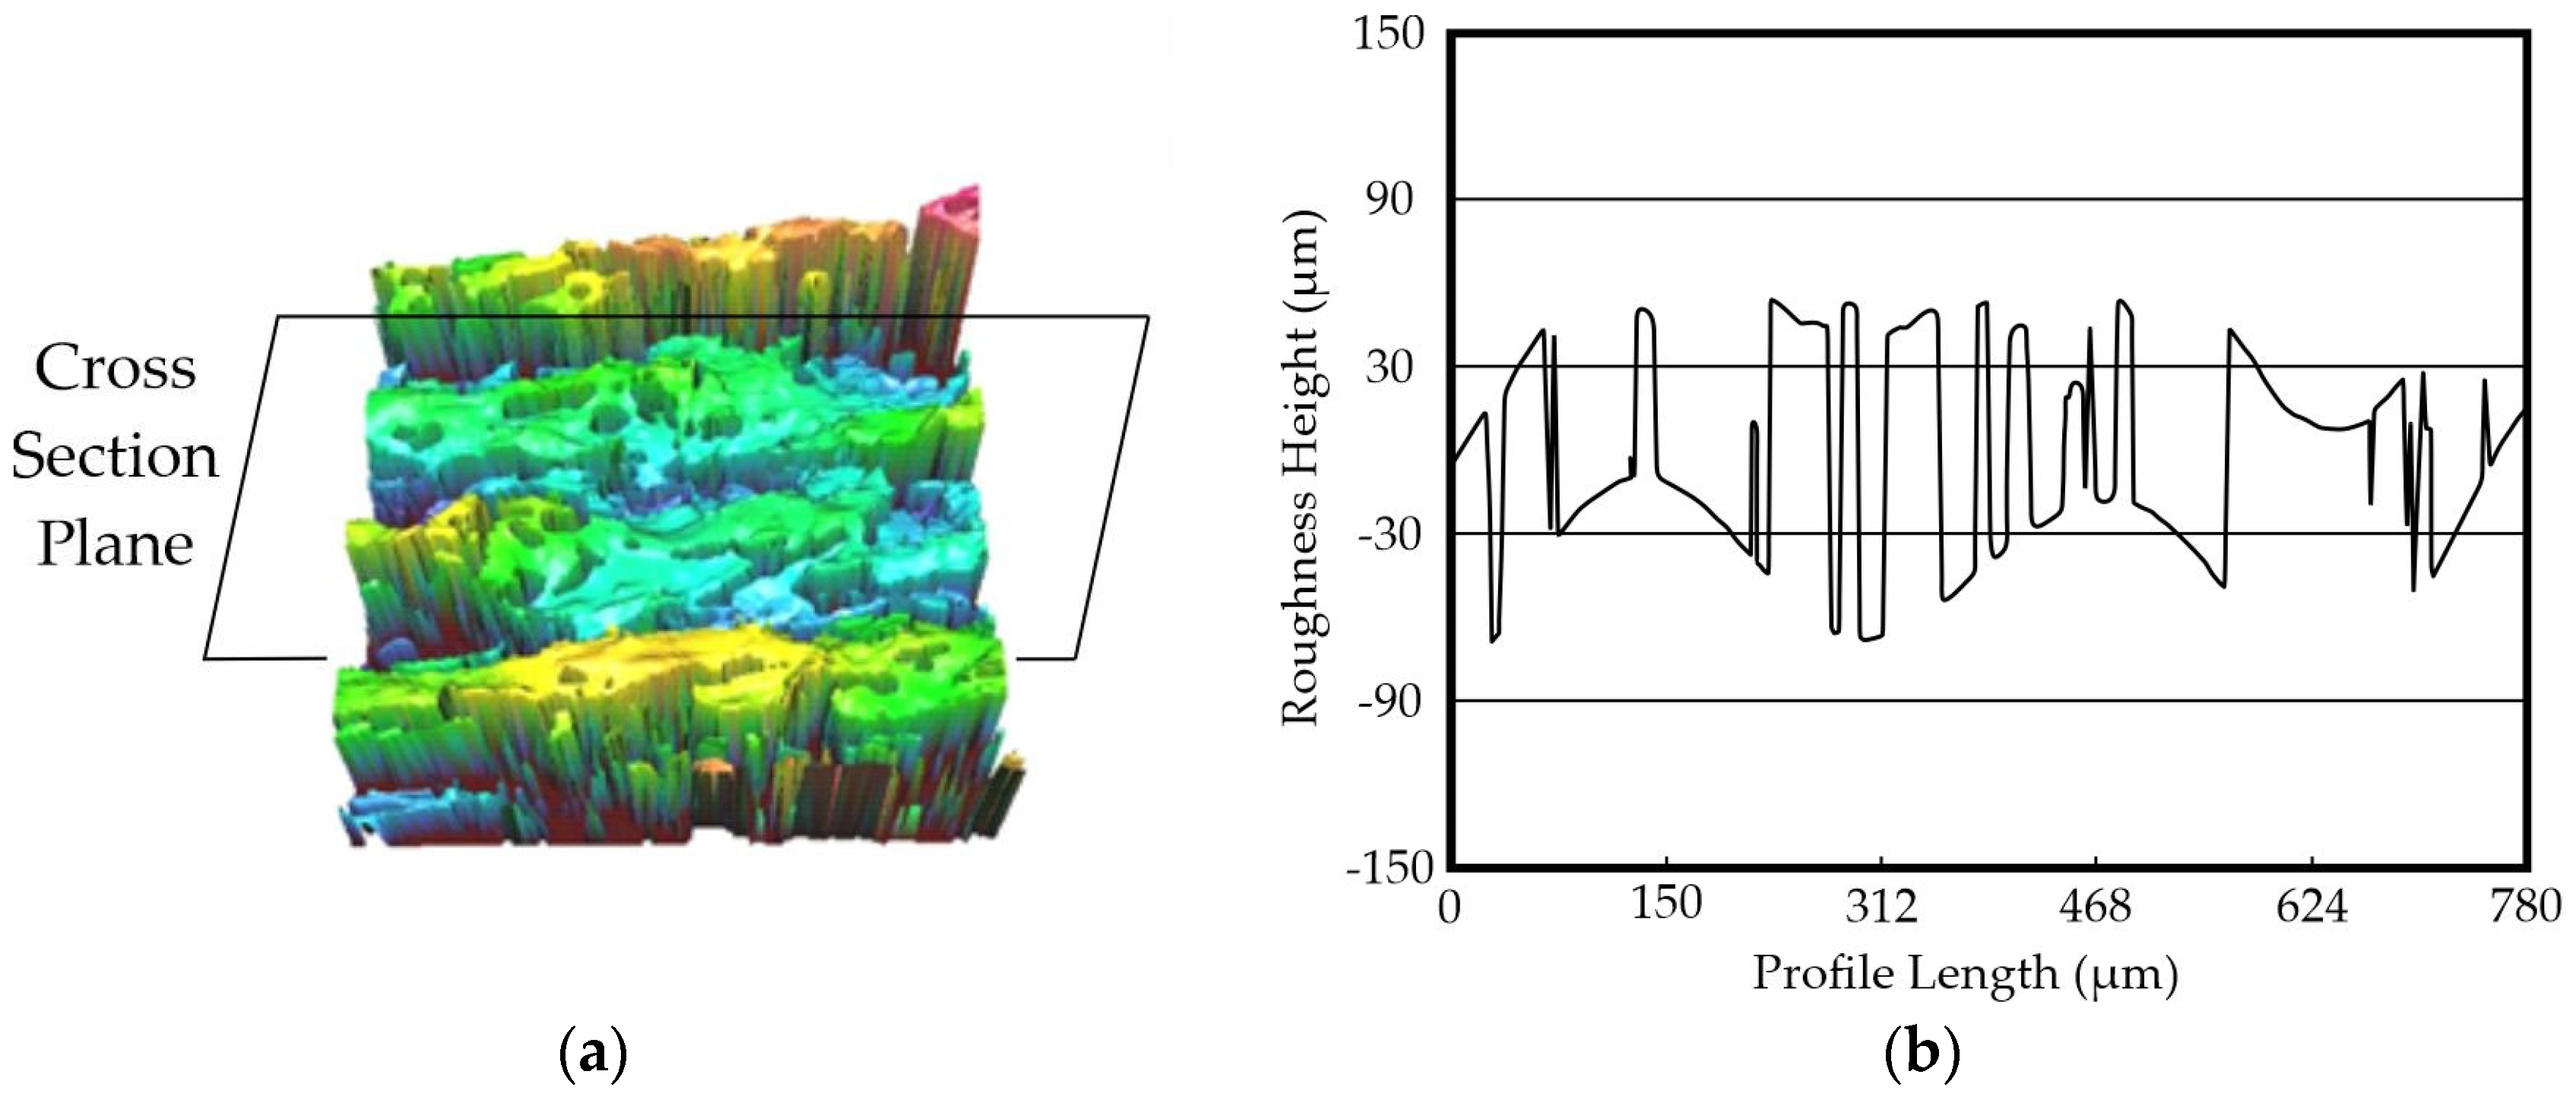
Figure 8. The 3D roughness profiles on the XZ plane are presented in
Figure 9a,b, while
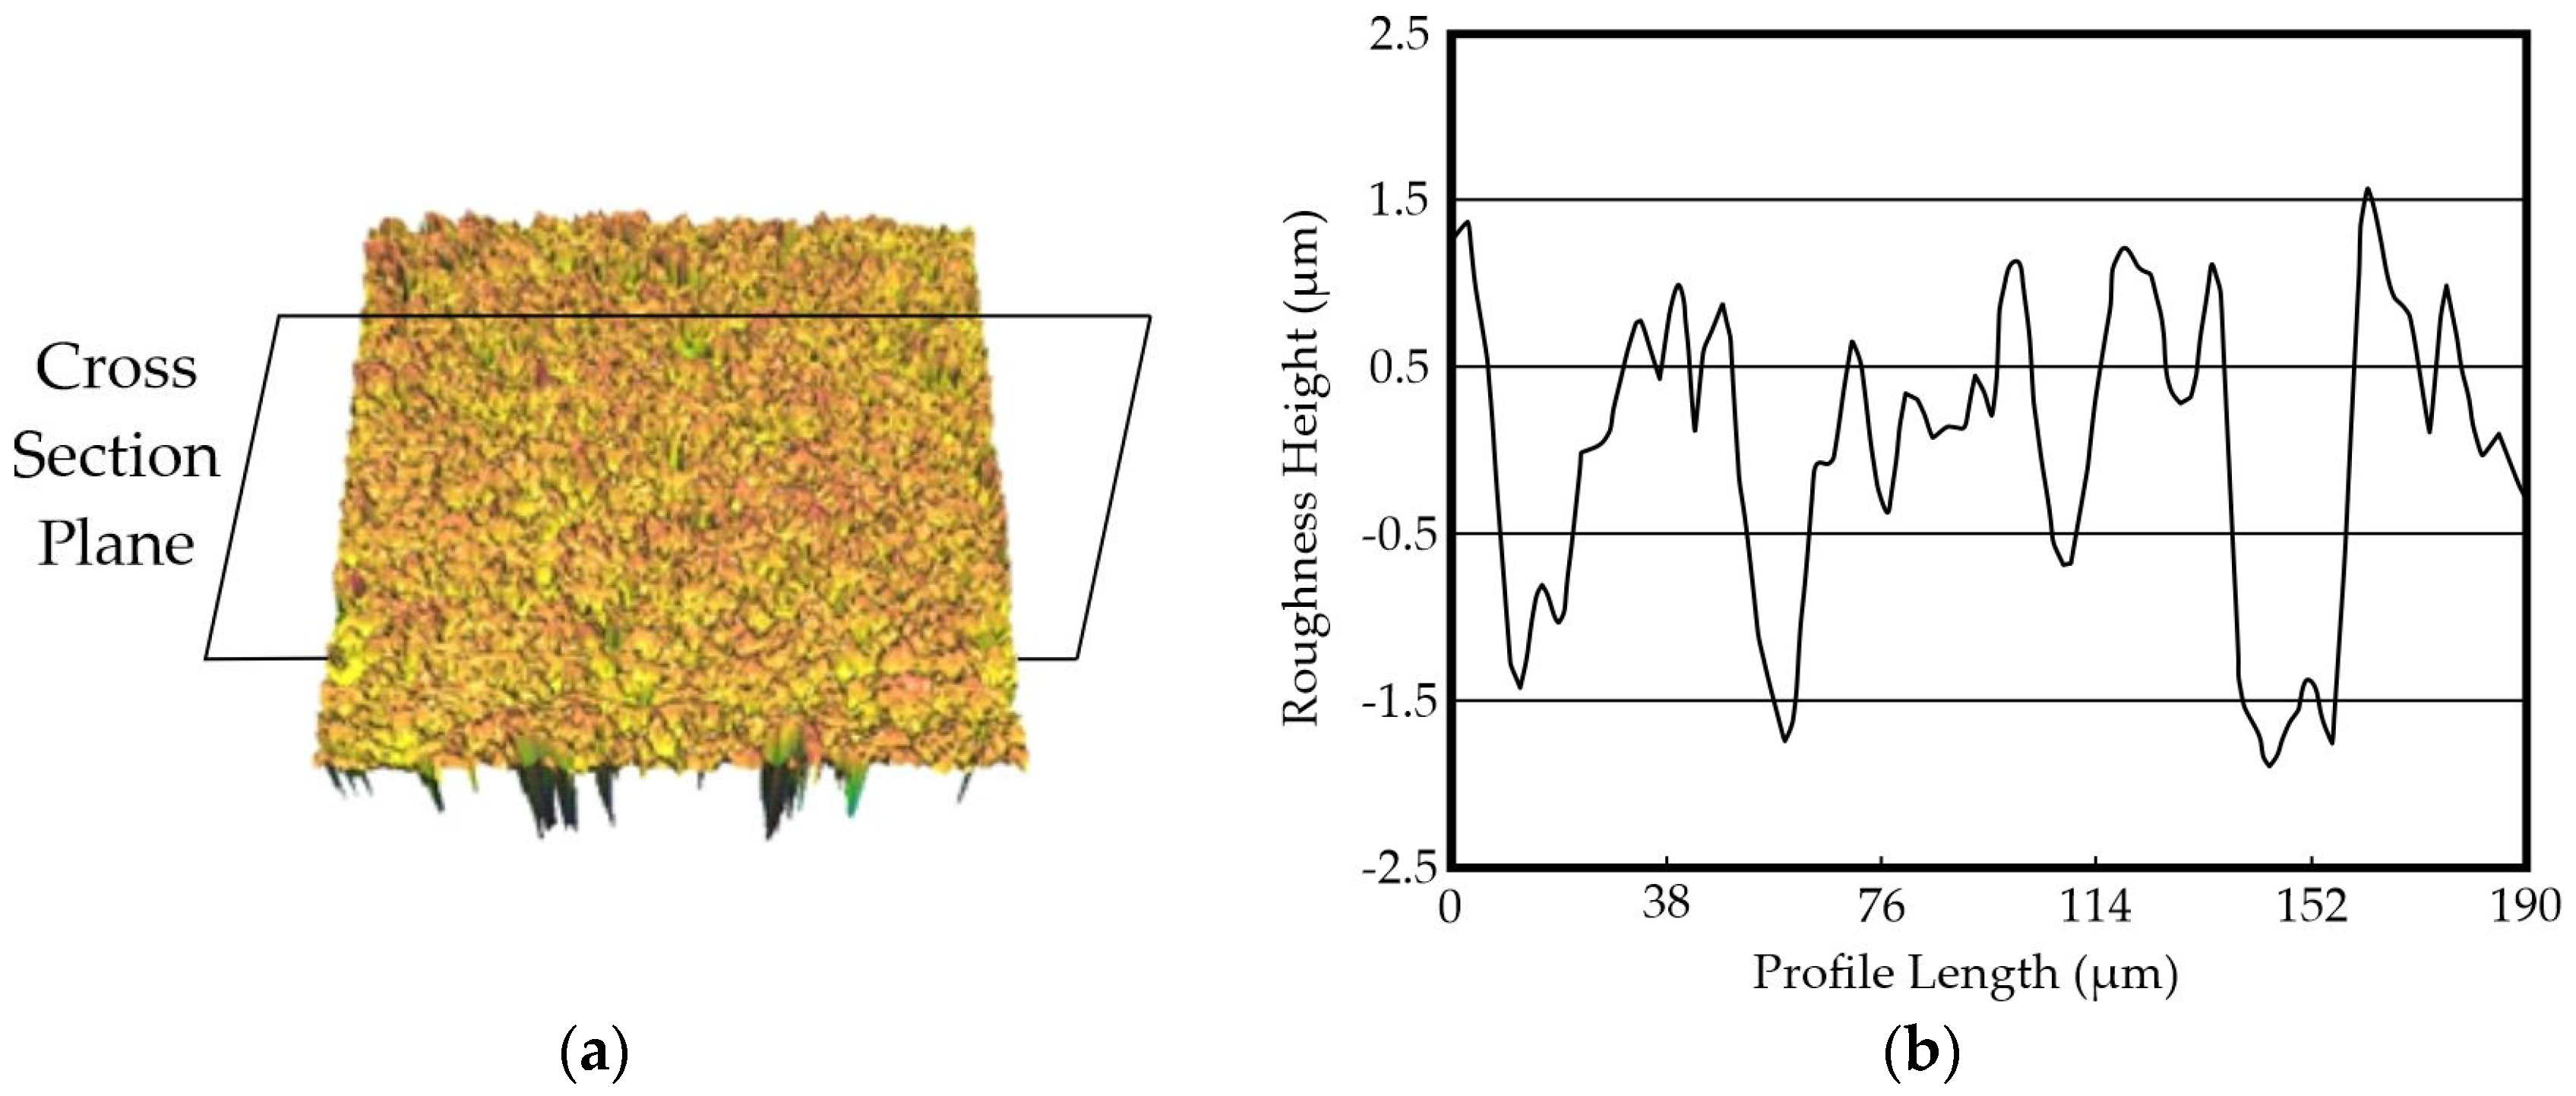
Figure 10a,b present the roughness profile on the XY plane. In
Figure 10a, the XZ profile of the print is depicted. Four layers of the 3D-printed part can be recognized. Each layer forms a peak, while near the connection of two layers, there is a shortage of material forming valleys. On the other side of the print, on the XY plane, the surface is obviously smoother; the material was laid evenly, without creating gaps or peaks.
The measurement results for the 3D-printed surfaces are presented in
Table 7. In the XZ plane, the mean roughness was found to be higher, at 29.29 μm, while in XY, it was measured at only 0.728 μm. The roughness caused by the layer-by-layer material deposition significantly worsens the XZ plane’s roughness, measuring a maximum peak-to-valley roughness of 114.933 μm. In the XY plane, the Rt was measured at 3.191 μm.
In conclusion, in both materials, two types of surfaces have been observed: one coarse and one smooth. Overall, the composite polymer has lower roughness compared to its cast iron counterpart. The cast iron unprocessed surface showed a mean roughness of 81.72 μm, where the PPS-CF in the XZ plane was 29.29 μm. In the XY plane, the composite polymer demonstrated a mean roughness of 0.728 μm, lower than the machined cast iron, which was around 1.276 μm.
3.2. CFD Performance Analysis
Upon the completion of the surface roughness measurement of the two materials, the calculated equivalent surface roughness is used to predict via a CFD model the performance of the two impellers. First, the semi-open impeller is tested with cast iron as a construction material. On each surface of the impeller, the corresponding sand-grain roughness is assigned. For the impeller’s blade and inner hub, the roughness of the cast iron’s unprocessed surface is assigned. The CFD simulation results are summarized in
Table 8. The composite impeller achieved higher head pressure and consumed less power for the same flow rate compared to the cast iron. The cast iron impeller consumed 3807 watts, whereas the composite impeller consumed approximately 300 watts less. The PPS-CF15 impeller achieved 27.8 m head pressure—1.7 m more than its counterpart. Overall, the cast iron impeller demonstrated 65.87% efficiency, while the composite impeller showed 71.49%.
Consequently, the closed vane impeller design was studied via a similar CFD study. For the impeller’s blade, the XZ plane roughness is assigned, and for the hub and shroud, the XY plane equivalent roughness is assigned. The CFD simulation results for the closed vane impeller are summarized in
Table 9. The cast iron impeller was found to be less efficient than its counterpart, achieving 58.64% efficiency, while the composite impeller demonstrated 69.12% efficiency. The composite impeller consumed 4056.22 watts, 400 watts less than the cast iron impeller, and achieved 27.4 m head pressure, 0.6 m more than its counterpart, for the same flow rate.
In both cases, the 3D-printed composite impeller was found to be superior to the cast iron impeller. The PPS-CF15 impeller achieved greater head pressure, while consuming less power, for the same flow rate. It is also worth noting that the difference in power consumption between the two materials for the same impeller design is attributed to the materials’ density and to losses due to surface roughness.
3.3. Hydraulic Performance Tests
To verify the computational study results, four performance tests were conducted, one for each impeller type and material. Results are congruent with the CFD study, indicating that the 3D-printed impellers have superior performance in both configurations, closed and semi-open. Upon the completion of the hydraulic performance tests, the power and performance curves are generated.
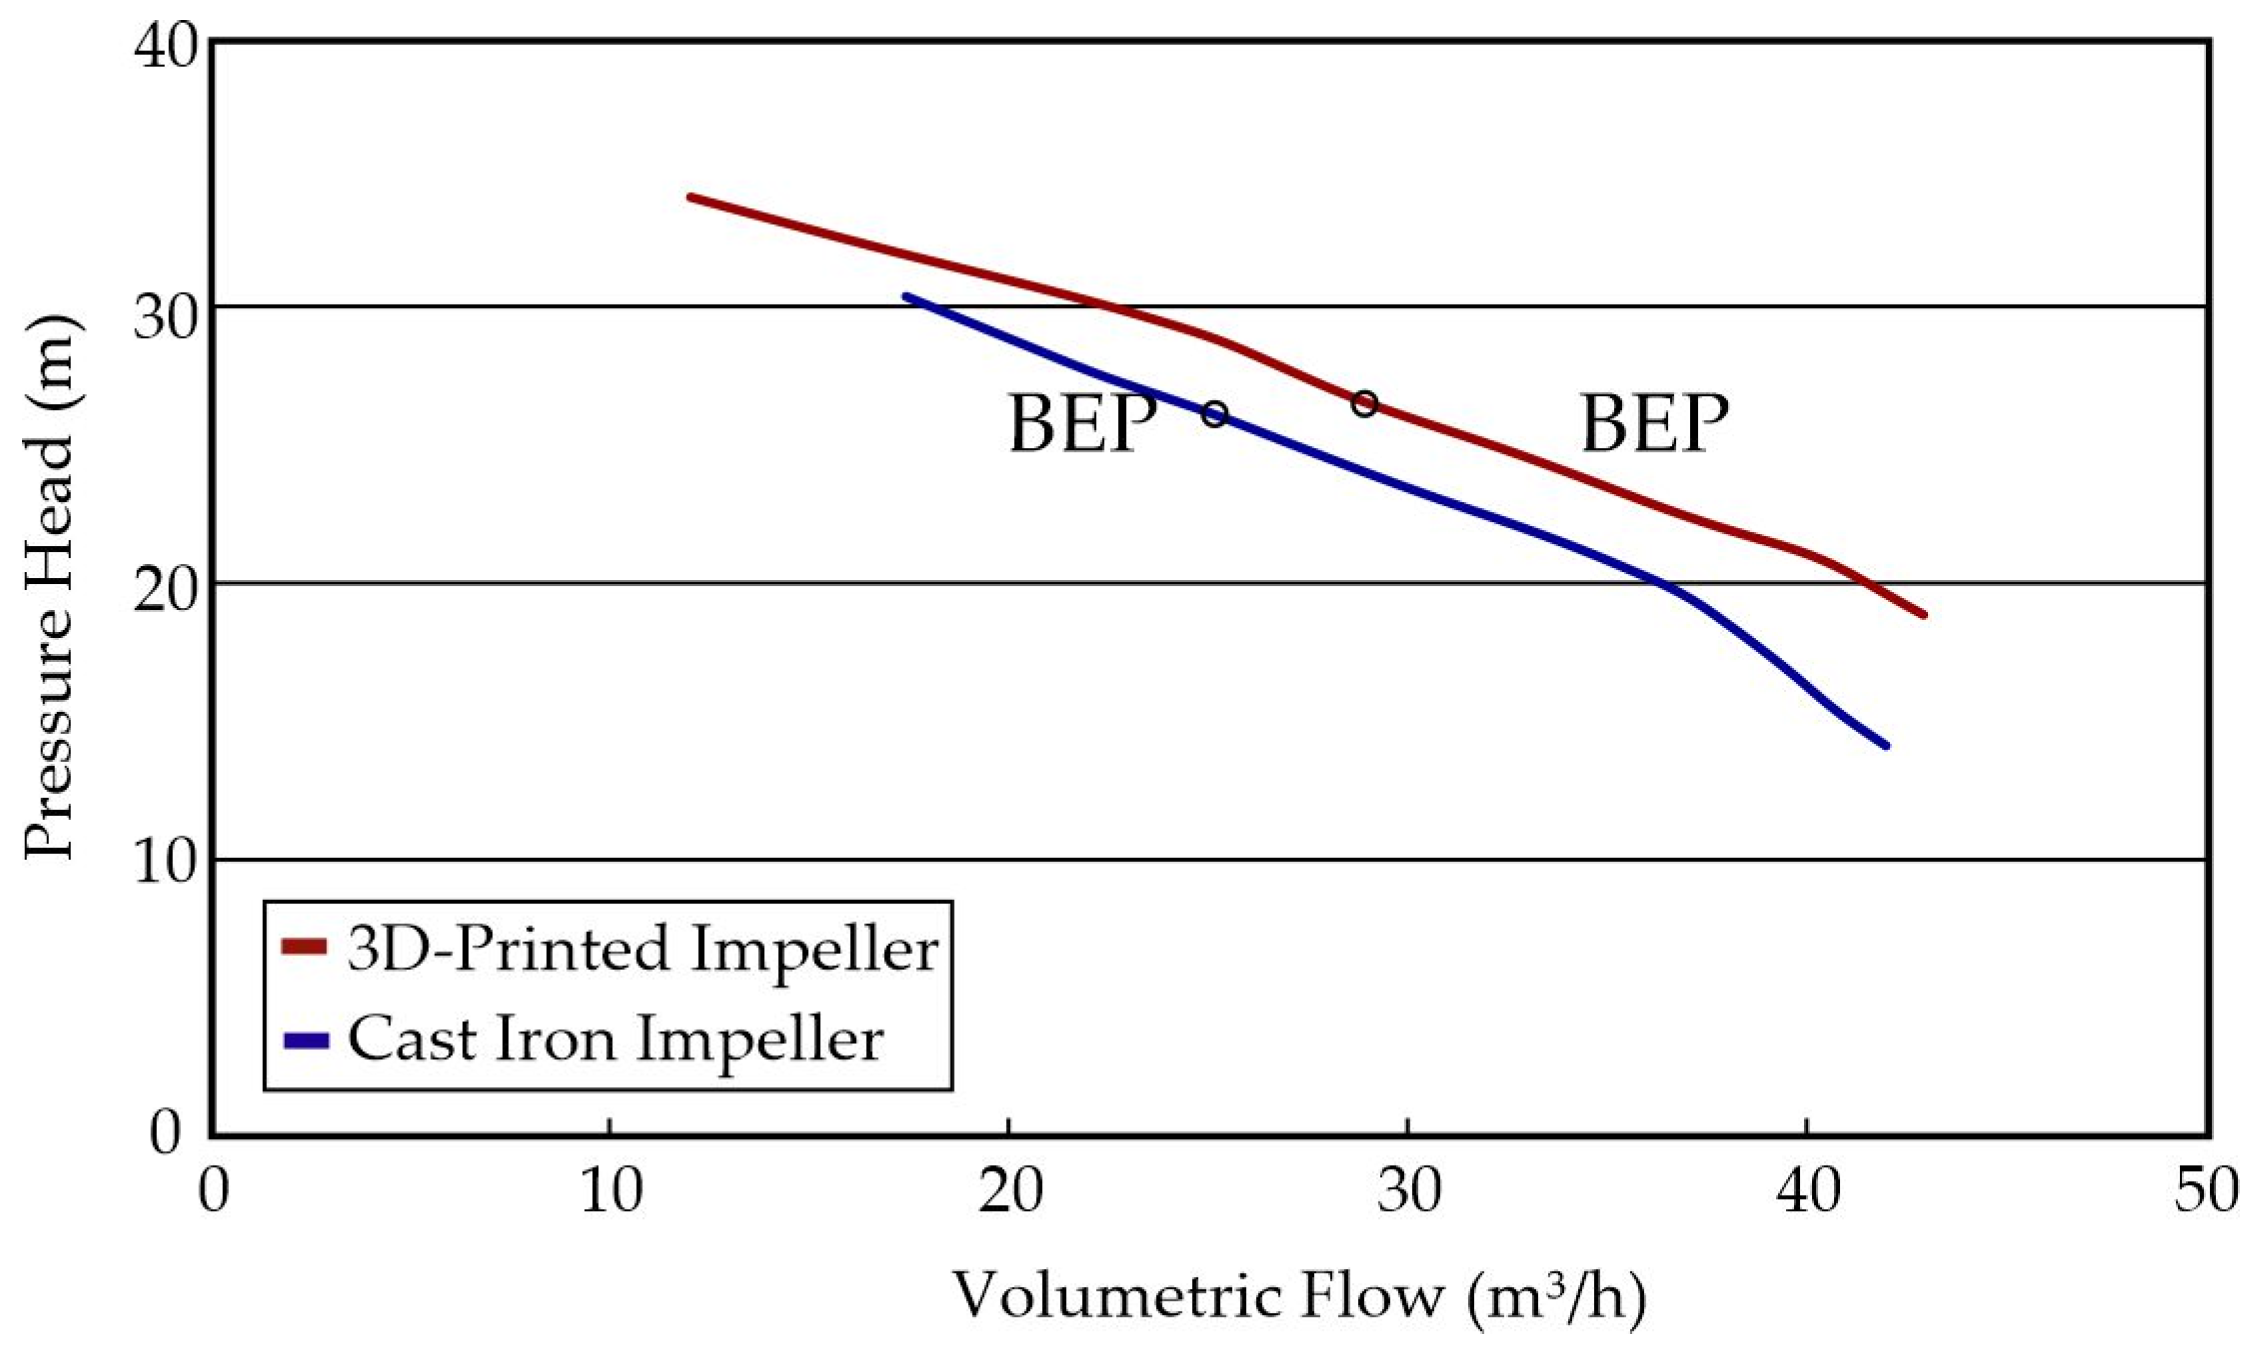
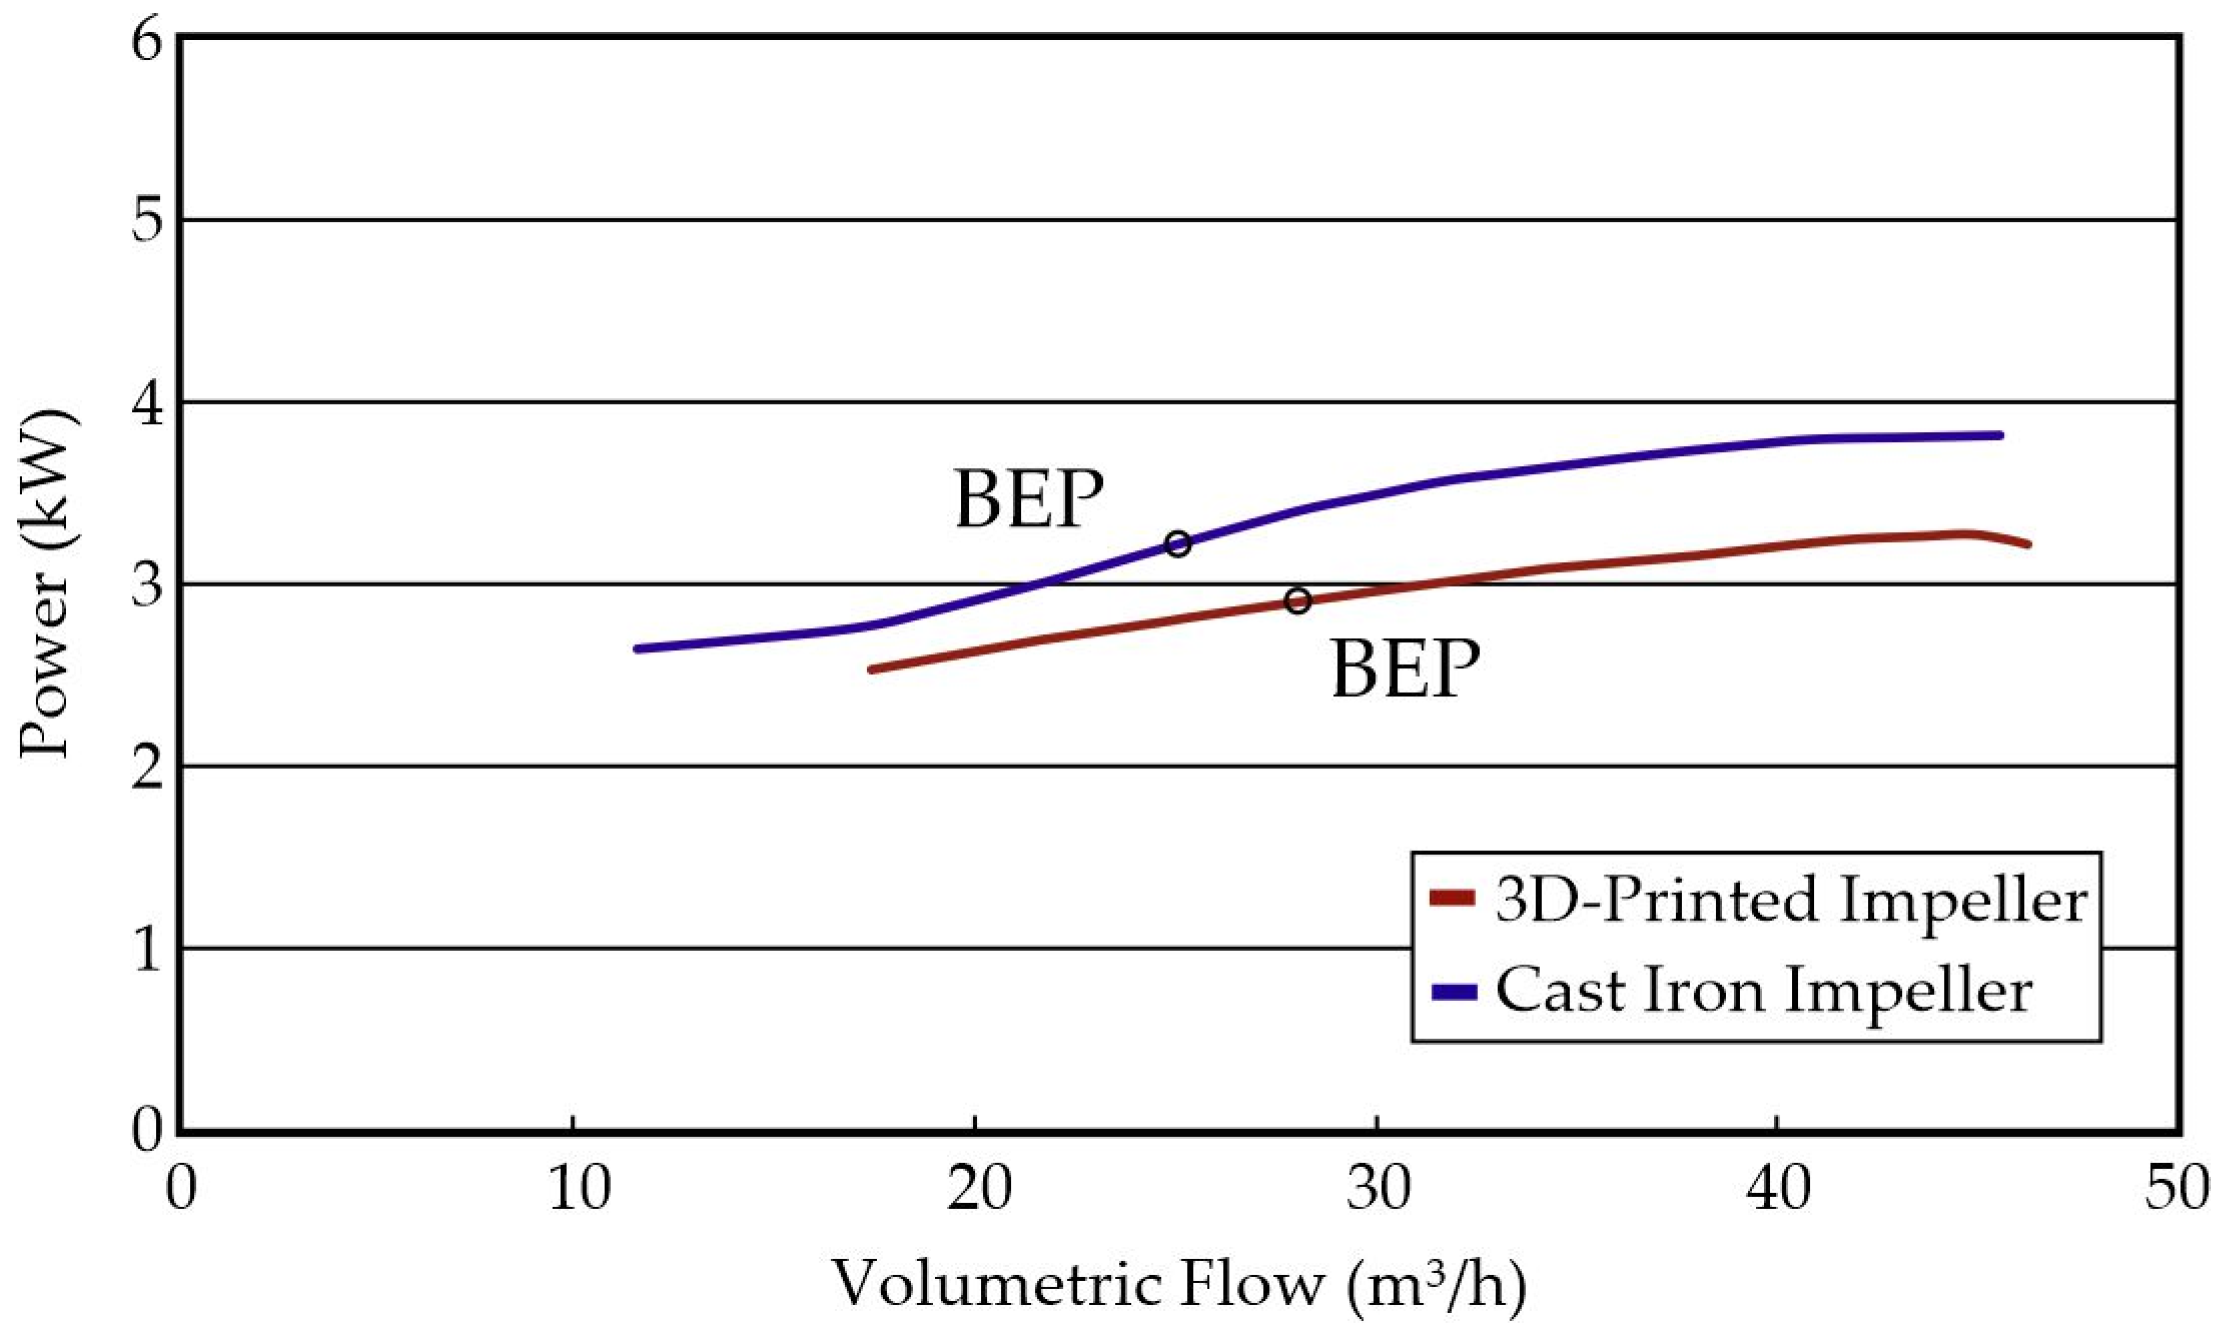
Figure 11 depicts the performance curve and
Figure 12 the power consumption curve of the semi-open impeller for the two materials. The 3D-printed impeller demonstrated better performance through its operating curve and lower power consumption than the cast iron impeller. Furthermore, the cast iron impeller BEP was found at 25 m
3/h and the 3D-printed impeller at 28 m
3/h.
Table 10 summarizes the performance data of semi-open impellers per material at their BEP. The PPS-CF15 impeller achieved a 14.72% increase in overall efficiency at BEP.
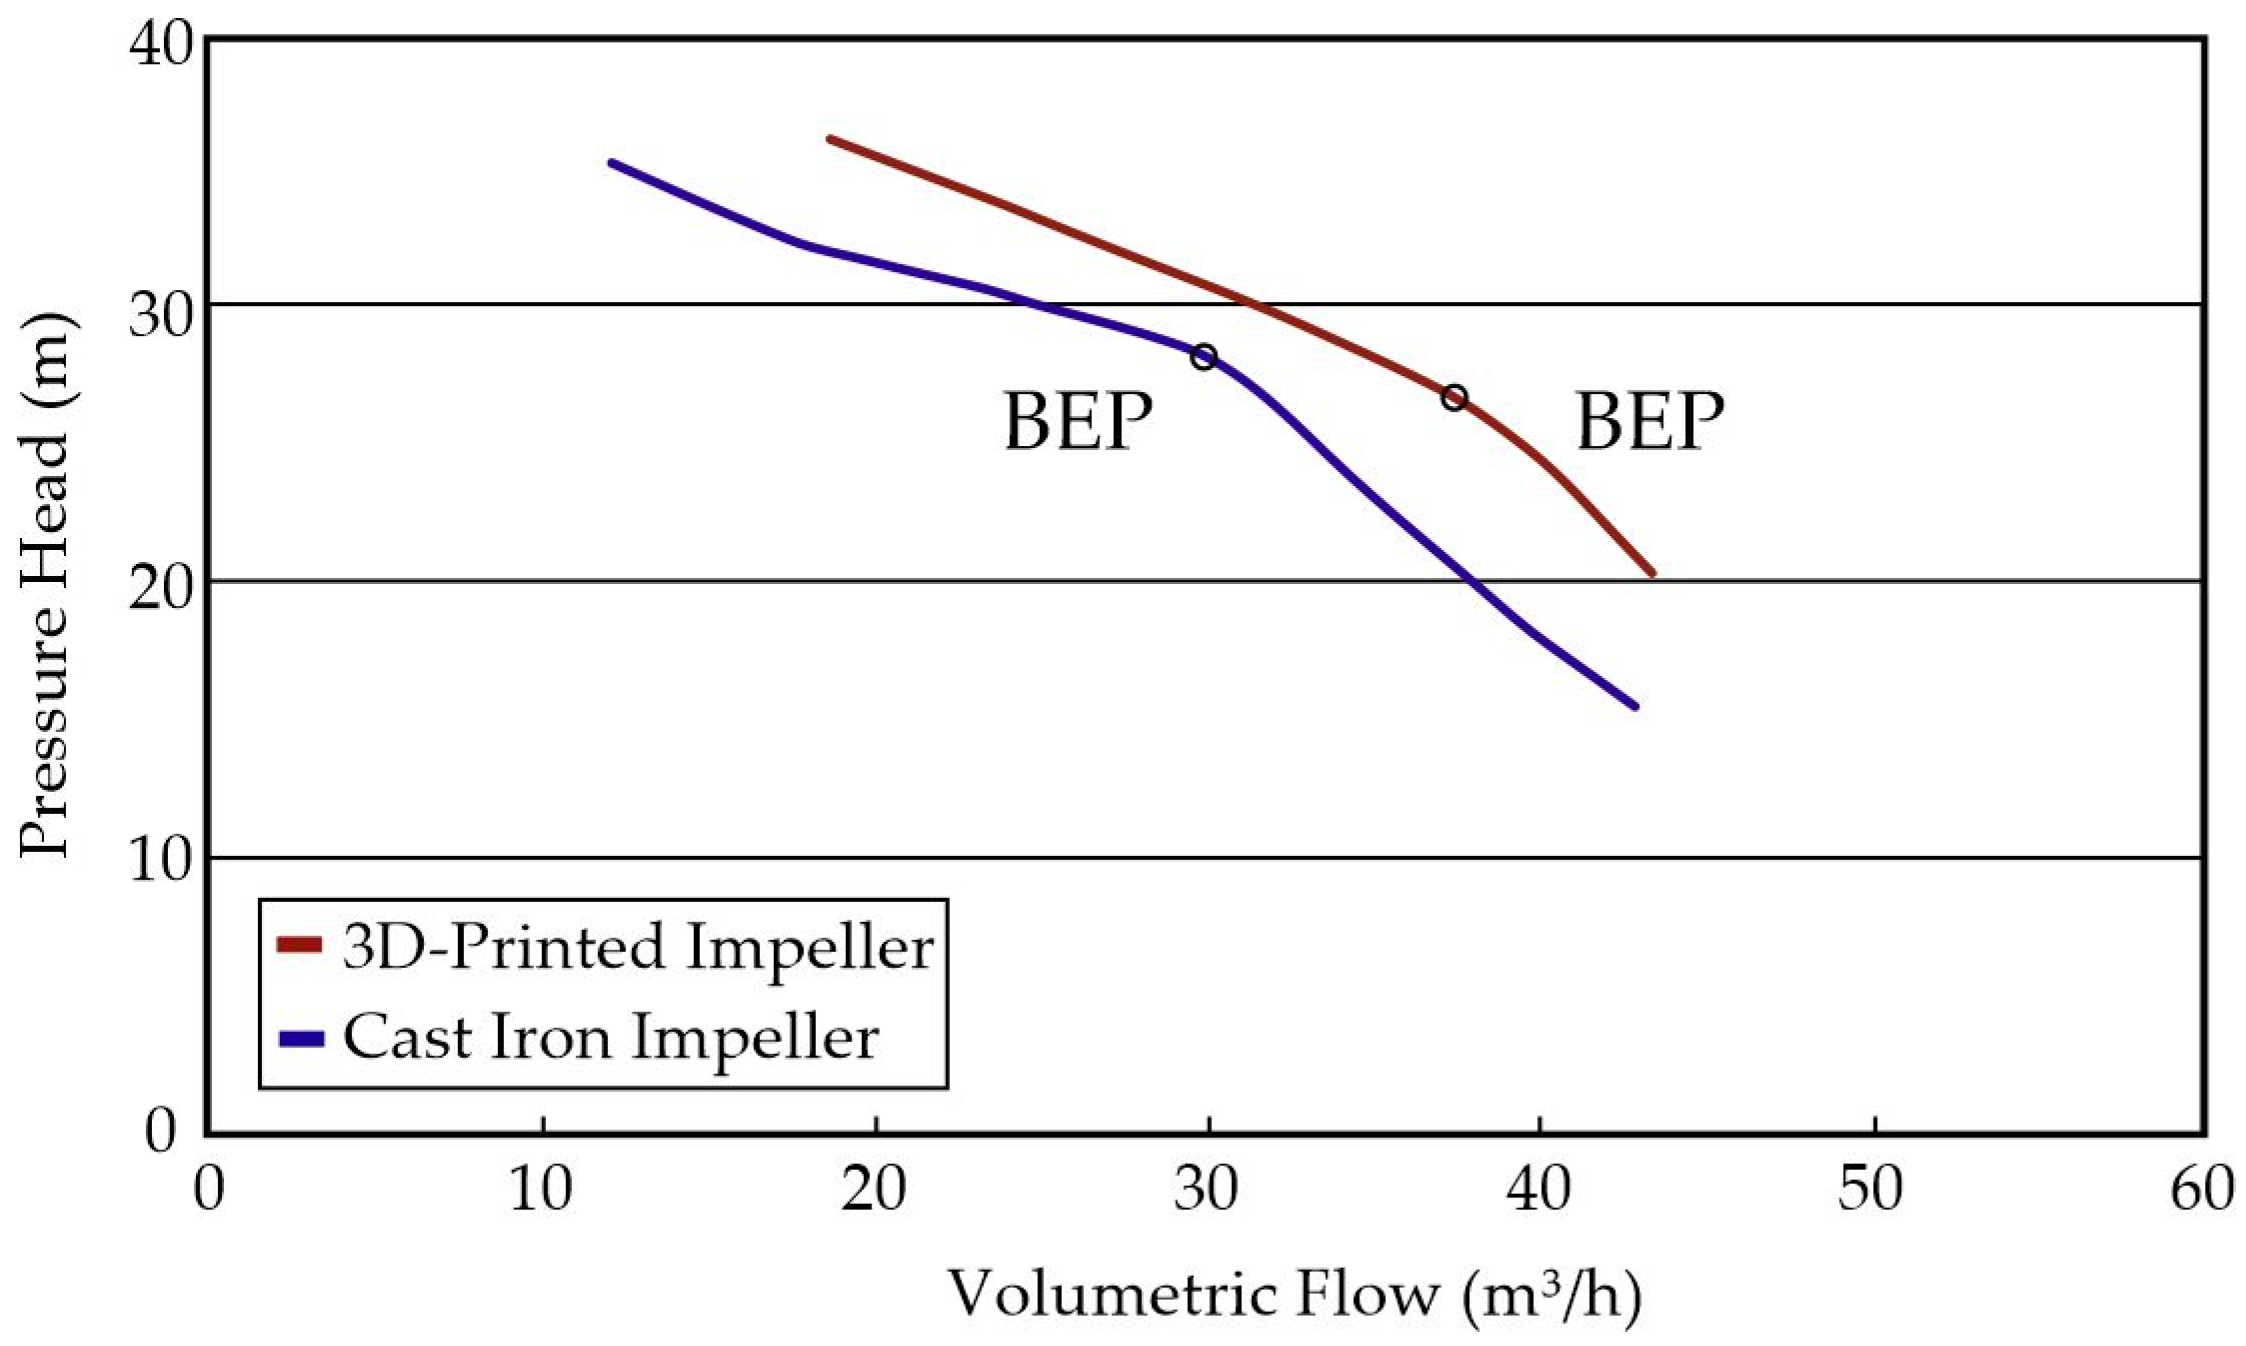
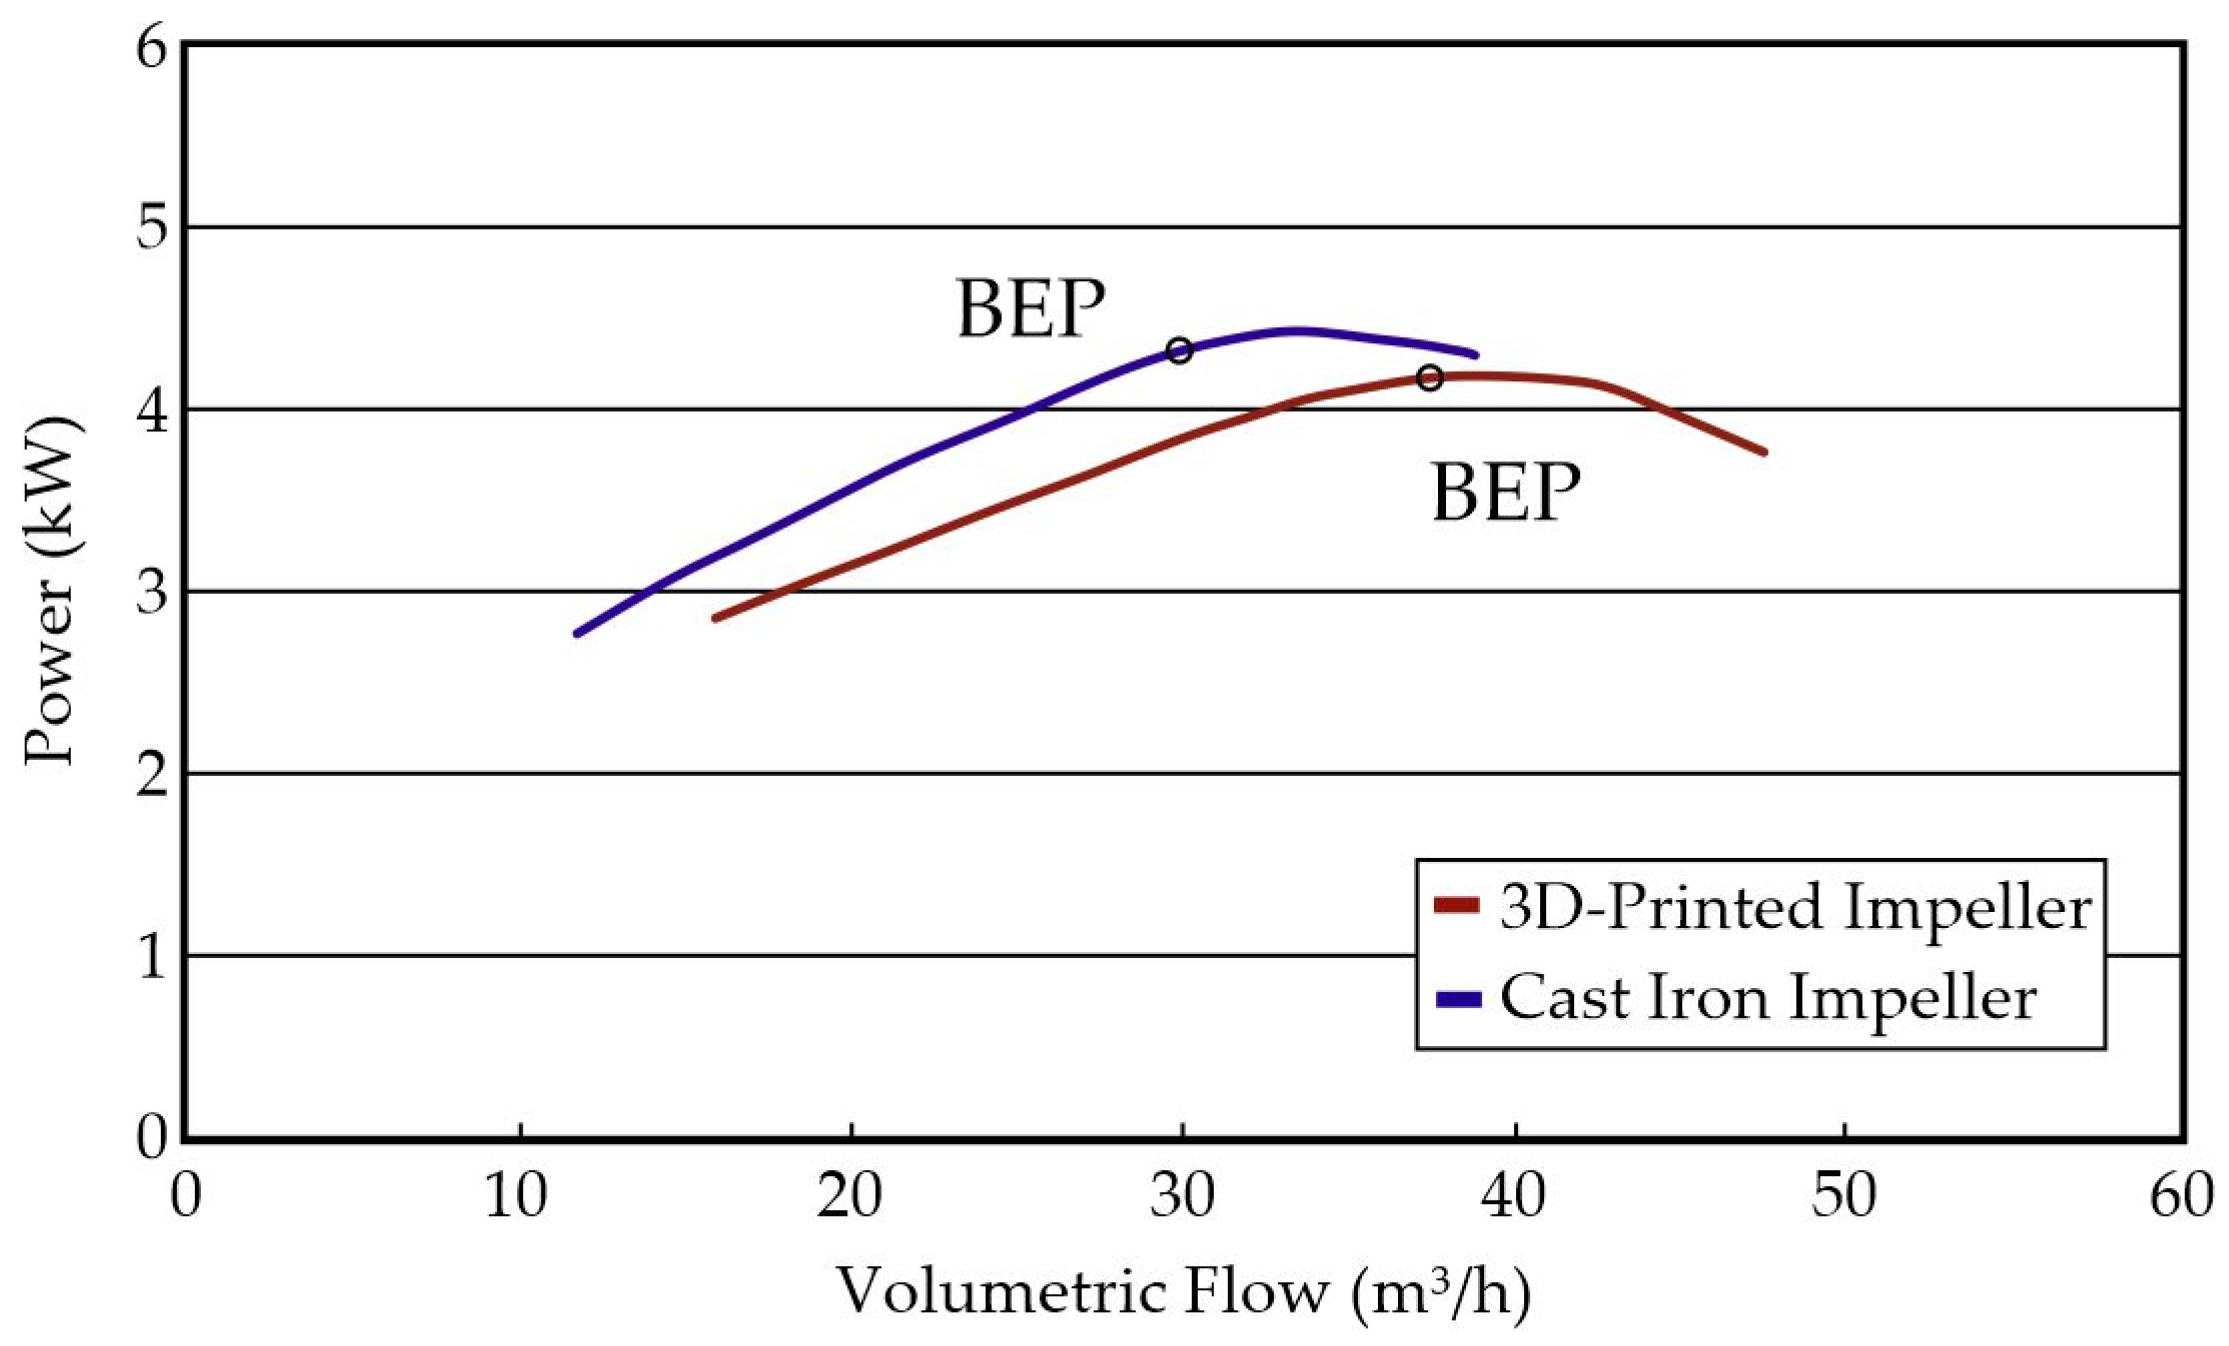
Figure 13 depicts the performance curve, and
Figure 14 the power consumption curve of the closed impeller for the two materials. The 3D-printed impeller demonstrated better performance through its operating curve and lower power consumption than the cast iron impeller. The BEP for the 3D-printed impeller was found at 38 m
3/h, while for the cast iron impeller, it was at 30 m
3/h.
Table 11 summarizes the performance data of closed impellers per material at their BEP. The PPS-CF15 impeller demonstrated a 16.13% efficiency increase compared to the cast iron. It is also worth noting that the experimental results for both types of impellers agree with the CFD analysis data within a 20% result deviation in efficiency. The deviation between the estimated efficiency and the experimental one can be attributed to the fact that in experimental conditions, additional friction losses are detected, such as gland packing friction and mechanical losses.
In addition to improved performance, 3D-printed impellers also demonstrated some secondary advantages over the metal ones. 3D-printed impellers achieved a faster start-up, minimizing the time delay for the star-delta starter of the electric motor. The startup was smoother due to the composite impellers’ reduced rotational inertia compared to the cast iron impellers. Moreover, the operation of a pump when working with a 3D-printed impeller was 9 dB quieter than the original cast iron pump, which produces 83 dB when operating. A previous study measured the vibration behavior of PPS-CF15 composite. The findings conclude that composite polymers have enhanced hysteretic and damping behavior capabilities [
29]. These characteristics allow for enhanced vibration damping of the impeller during operation, achieving low-noise operation.
Upon the completion of the hydraulic test, all four impellers were examined for corrosion, wear, and cavitation.
Figure 15 depicts the impellers after the hydraulic test. Surface corrosion has started to occur on the cast iron impellers, while the composite ones do not seem to present any type of corrosion. The impellers’ spline bores or hubs were also measured to detect possible fatigue deformations. All the bores were within tolerance limits. Additionally, the inspection of the blades for cavitation phenomena on the impellers’ leading and trailing edges showed that in none of the four impellers cavitation was observed. The latter advantages in conjunction with the enhanced performance demonstrate the supremacy of the AM impellers over the cast iron ones.
4. Discussion
Impeller fabrication using additive manufacturing offers several advantages compared to traditional impeller production techniques. In applications where performance, customization, corrosion resistance, and cost efficiency are critical, additive manufacturing offers significant advantages. Cast iron is the standard material for impeller fabrication using sand casting due to its strength and durability. On the other hand, the evolution of additive manufacturing technology, in conjunction with the utilization of high-performance composite materials, makes it capable of prevailing against traditional manufacturing methods in many areas.
One of the most significant advantages of 3D-printed impellers is the complex design opportunities. Traditional casting methods impose many design restrictions to ensure compatibility with molds and machining tools. Conversely, additive manufacturing allows for the development of highly complex internal geometries, structures, curved blades, and optimized flow paths that improve the fluid flow, resulting in enhancing the pump’s efficiency. This leads to better overall performance, lower energy consumption, and the potential to tailor the impeller to very specific operating conditions and performance specifications. Whether for low-volume production, prototyping, or custom builds, additive manufacturing provides unmatched design flexibility, which outperforms traditional methods.
Three dimensional-printed impellers are fabricated from thermoplastics, composite materials, or lightweight resins, making them significantly lighter than cast iron impellers. In the present study, the fabricated impellers weighed 7–8-times less than the cast iron impellers. This reduction in mass decreases rotational inertia, which leads to quicker start-up and stop times, lower energy usage, and less mechanical stress on motors, bearings, and the shaft–hub connection. Additionally, in systems where efficiency and weight reduction are crucial, such as in drones, portable pumping equipment, or electric vehicles, the weight advantage offered by AM is particularly valuable.
Despite the cast iron’s durability, it is prone to rust and corrosion, especially in highly corrosive environments, such as when exposed to water, salt, or chemicals. To protect cast iron from corrosion, protective coatings are used but raise maintenance complexity and cost. Nylon, PEEK, or carbon-reinforced composites are some of the materials used in AM, which offer excellent resistance to corrosion and chemical degradation even in highly corrosive environments. The latter characteristics make 3D-printed impellers especially suitable for corrosive environments such as marine, chemical processing, or water treatment applications. In such applications, the reduced maintenance cost requirements and the machine’s long-term reliability are crucial benefits.
One of the greatest advantages of AM is the ability to rapidly prototype and fabricate designs. Traditional cast iron impellers require time-consuming and costly mould-making processes in addition to foundry facilities and machining operations. Any design change requires an entirely new mould, which delays development and increases expenses. Conversely, when using additive manufacturing, the impeller’s design and fabrication time shrinks to a few hours or days. The significant advantage of high-speed prototyping, offered by AM, allows pump manufacturing industries to optimize the machines’ performance through testing multiple designs, achieving better results in less time and at a lower cost.
Furthermore, AM technology is more cost-efficient than the traditional casting production method. AM does not require molds or large production lines; it reduces machining and tooling costs while minimizing waste. Producing an impeller using AM requires only a 3D printer and polymer raw material. The post-process of an AM part does not require extra machining tools and equipment, keeping the manufacturing cost in a range of a few thousand dollars. On the other hand, producing an impeller with the traditional method requires molds and a whole foundry facility. Additionally, a sand-casted impeller requires extensive post-processing including CNC machining, drilling, spline boring, dynamic balancing, etc., driving the cost up to hundreds of thousands of dollars. Centrifugal impellers can be printed on demand or upon request, reducing the need for large inventories and storage. This approach is especially beneficial for industries that need spare parts for outdated equipment or low-volume custom components. On-demand production also shortens supply chains and improves responsiveness to customer needs.
Additive manufacturing is far more sustainable compared to traditional manufacturing methods; it generates less waste and pollutes the environment much less compared to traditional subtractive methods like casting and machining. By using only the material needed for the final product, AM contributes to more sustainable manufacturing practices, avoiding the highly polluting foundry industries. Moreover, many materials used in additive manufacturing are recyclable or derived from sustainable sources, which further enhances its environmental benefits. Even though cast iron remains a durable and time-tested material, 3D-printed impellers offer compelling advantages in terms of design complexity, manufacturing speed and cost, weight, corrosion resistance, and sustainability. For many demanding applications, particularly those requiring customization, efficiency, and low maintenance, an impeller fabricated using additive manufacturing is not only a viable alternative, but frequently a superior choice. As materials and AM technologies continue to improve, the gap between traditional and additive manufacturing will only grow wider in favor of additive manufacturing.
5. Conclusions
Additive manufacturing has radically altered the way new products are fabricated. This new technology gives the opportunity to manufacturing companies, regardless of their scale, to create complex and innovative products. Water pumps constitute a crucial machine for a variety of applications, including aerospace, automotive, and industrial applications, irrigation, farming, etc. The aim of the present study was the fabrication of an innovative impeller using additive manufacturing for use in a centrifugal pump. The traditional material, cast iron, of which impellers are made, was found to have a higher surface roughness than the 3D-printed parts. To evaluate the influence of the impeller’s roughness on the pump’s performance, a CFD model was created. Results of the fluid dynamics model showed that the composite impeller will have 5–10% better performance compared to the cast iron counterpart. The results of the CFD study were verified during the real-time operation of the pump. The 3D-printed composite impeller surpassed the cast iron’s impeller both in performance and in power consumption efficiency. In particular, the PPS-CF15 impeller achieved 15% better overall efficiency in real-time operation, giving a significant advantage to this new fabrication technology for impeller manufacturing.
The present study provided promising results regarding the utilization of AM to produce end-use parts. AM could redefine the way impellers are designed because it offers the ability to produce complex parts. The findings lay the groundwork for future research into mechanical wear behavior, advanced fluid–structure interactions and the lifecycle durability of composite polymer-based impellers.
Although cast iron has long been preferred for impeller production due to its mechanical strength and durability, recent developments in additive manufacturing (AM) offer viable alternatives with distinct advantages. Impellers fabricated via AM technology, such as selective laser melting, fused deposition modeling, or vat polymerization, demonstrate superior design flexibility, reduced mass, better surface quality, enhanced corrosion resistance, shortened production lead times, and improved environmental sustainability. The latter characteristics are essential in applications requiring complex structures, enhanced efficiency, performance optimization, and reduced maintenance, such as turbomachinery, marine applications, HVAC systems, aerospace, and more. As AM technologies continue to evolve and high-performance polymeric and metallic materials emerge, the functional and economic superiority of AM components over traditionally cast ones are expected to become increasingly pronounced.
Author Contributions
Conceptualization, G.M. and V.P.; methodology, G.M. and V.P.; software, G.M., V.P. and I.C.; validation, G.M., V.P. and I.C.; formal analysis, G.M., V.P. and I.C.; investigation, G.M., V.P. and I.C.; resources, G.M., V.P. and I.C.; data curation, G.M., V.P. and I.C.; writing—original draft preparation, G.M., V.P. and I.C.; writing—review and editing, G.M., V.P. and I.C.; visualization, G.M., V.P. and I.C.; supervision, G.M. and V.P.; project administration, G.M. and V.P.; funding acquisition, G.M. and V.P. All authors have read and agreed to the published version of the manuscript.
Funding
This research received no external funding.
Data Availability Statement
Data will be available upon request from the corresponding authors.
Acknowledgments
The authors would like to thank Chrysafi Pumps for providing the impellers for the present study, as well as technical information about the centrifugal pump impeller characteristics.
Conflicts of Interest
The authors declare no conflicts of interest.
References
- Raja, S.; Rajan, A.J. Challenges and Opportunities in Additive Manufacturing Polymer Technology: A Review Based on Optimization Perspective. Adv. Polym. Technol. 2023, 2023, 8639185. [Google Scholar] [CrossRef]
- Prashar, G.; Vasudev, H.; Bhuddhi, D. Additive Manufacturing: Expanding 3D Printing Horizon in Industry 4.0. Int. J. Interact. Des. Manuf. IJIDeM 2023, 17, 2221–2235. [Google Scholar] [CrossRef]
- Gibson, I.; Rosen, D.; Stucker, B.; Khorasani, M. Additive Manufacturing Technologies; Springer: Cham, Switzerland, 2020. [Google Scholar]
- Yan, Y.; Li, S.; Zhang, R.; Lin, F.; Wu, R.; Lu, Q.; Xiong, Z.; Wang, X. Rapid Prototyping and Manufacturing Technology: Principle, Representative Technics, Applications, and Development Trends. Tsinghua Sci. Technol. 2009, 14, 1–12. [Google Scholar] [CrossRef]
- Rouf, S.; Raina, A.; Irfan, M.; Haq, U.; Naveed, N.; Jeganmohan, S.; Kichloo, A.F. 3D Printed Parts and Mechanical Properties: Influencing Parameters, Sustainability Aspects, Global Market Scenario, Challenges and Applications. Adv. Ind. Eng. Polym. Res. 2022, 5, 143–158. [Google Scholar] [CrossRef]
- Ruiz, L.E.; Pinho, A.C.; Ruiz, L.E.; Pinho, A.C.; Resende, D.N. Citation: 3D Printing as a Disruptive Technology for the Circular Economy of Plastic Components of End-of-Life Vehicles: A Systematic Review. Sustainability 2022, 14, 13256. [Google Scholar] [CrossRef]
- Sauerwein, M.; Doubrovski, E.; Balkenende, R.; Bakker, C. Exploring the Potential of Additive Manufacturing for Product Design in a Circular Economy. J. Clean. Prod. 2019, 226, 1138–1149. [Google Scholar] [CrossRef]
- Zirak, N.; Shirinbayan, M.; Deligant, M.; Tcharkhtchi, A. Toward Polymeric and Polymer Composites Impeller Fabrication. Polymers 2021, 14, 97. [Google Scholar] [CrossRef] [PubMed]
- Hernández, F.; Fragoso, A. Fabrication of a Stainless-Steel Pump Impeller by Integrated 3D Sand Printing and Casting: Mechanical Characterization and Performance Study in a Chemical Plant. Appl. Sci. 2022, 12, 3539. [Google Scholar] [CrossRef]
- Popa, I.-F.; Dobromirescu, C.; Sebastian Vintila, I.; Tinca, I.; Mihai, D.; Canache, A.M.; Crunteanu, D.E. Hydraulic Performance Comparison of Centrifugal Closed Impellers Fabricated by Means of Additive Manufacturing and Classical Machining for Space Active Thermal Control Systems of Satellites. Appl. Sci. 2024, 14, 9448. [Google Scholar] [CrossRef]
- Chang, H.; Yang, J.; Wang, Z.; Peng, G.; Lin, R.; Lou, Y.; Shi, W.; Zhou, L. Efficiency Optimization of Energy Storage Centrifugal Pump by Using Energy Balance Equation and Non-Dominated Sorting Genetic Algorithms-II. J. Energy Storage 2025, 114, 115817. [Google Scholar] [CrossRef]
- Fernandez, S.; Jimenez, M.; Porras, J.; Romero, L.; Espinosa, M.M.; Dominguez, M. Additive Manufacturing and Performance of Functional Hydraulic Pump Impellers in Fused Deposition Modeling Technology. J. Mech. Des. 2016, 138, 024501. [Google Scholar] [CrossRef]
- Adiaconitei, A.; Sebastian Vintila, I.; Mihalache, R.; Paraschiv, A.; Frigioescu, T.F.; Popa, I.F.; Pambaguian, L. Materials Manufacturing of Closed Impeller for Mechanically Pump Fluid Loop Systems Using Selective Laser Melting Additive Manufacturing Technology. Materials 2021, 14, 5908. [Google Scholar] [CrossRef]
- Andres, N.S. Development of Solar-Powered Water Pump with 3D Printed Impeller. Open Eng. 2021, 11, 249–253. [Google Scholar] [CrossRef]
- Rajenthirakumar, D.; Jagadeesh, K.A. Analysis of Interaction between Geometry and Efficiency of Impeller Pump Using Rapid Prototyping. J. Adv. Manuf. Technol. 2009, 44, 890–899. [Google Scholar] [CrossRef]
- Yadav, K.K.; Mendiratta, K.; Gahlot, V.K. Optimization of the Design of Radial Flow Pump Impeller Though CFD Analysis. IJRET Int. J. Res. Eng. Technol. 2016, 5, 2321–7308. [Google Scholar]
- Selamat, F.E.; Wan Izhan, W.H.I.; Baharudin, B.S. Design and Analysis of Centrifugal Pump Impeller for Performance Enhancement. J. Mech. Eng. 2018, 5, 36–53. [Google Scholar]
- Polák, M. Behaviour of 3D Printed Impellers in Performance Tests of Hydrodynamic Pump. In Proceedings of the 7th TAE 2019, Prague, Czech Republic, 17–20 September 2019. [Google Scholar]
- Lim, S.E.; Sohn, C.H. CFD Analysis of Performance Change in Accordance with Inner Surface Roughness of a Double-Entry Centrifugal Pump. J. Mech. Sci. Technol. 2018, 32, 697–702. [Google Scholar] [CrossRef]
- He, X.; Jiao, W.; Wang, C.; Cao, W. Influence of Surface Roughness on the Pump Performance Based on Computational Fluid Dynamics. IEEE Access 2019, 7, 105331–105341. [Google Scholar] [CrossRef]
- Xu, W.; He, X.; Hou, X.; Huang, Z.; Wang, W. Influence of Wall Roughness on Cavitation Performance of Centrifugal Pump. J. Braz. Soc. Mech. Sci. Eng. 2021, 43, 314. [Google Scholar] [CrossRef]
- Lipej, A.; Muhič, S.; Mitruševski, D. IOP Conference Series: Earth and Environmental Science You May Also like A Comparison of Electric Motors for Electrical Submersible Pumps Used in the Oil and Gas Industry Wall Roughness Influence on the NPSH Characteristics of Centrifugal Pumps. IOP Conf. Ser. Earth Environ. Sci. 2019, 240, 032019. [Google Scholar] [CrossRef]
- Mansour, G.; Papageorgiou, V.; Tzetzis, D. Carbon Fiber Polymer Reinforced 3D Printed Composites for Centrifugal Pump Impeller Manufacturing. Technologies 2024, 12, 48. [Google Scholar] [CrossRef]
- Acharya, R. Investigation of Differences in Ansys Solvers CFX and Fluent. Master’s Thesis, School of Engineering Sciences (SCI), Stockholm, Sweden, 2016. [Google Scholar]
- Nikuradse, J. National Advisory Committee for Aeronautics Technical Memorandum 1292 Laws of Flow in Rough Pipes, Laws of Flow in Rough Pipes; NACA: Washington, DC, USA, 1950. [Google Scholar]
- Celik, I.B. Introductory Turbulence Modeling Lectures Notes 1999. Available online: https://sites.fem.unicamp.br/~im450/palestras&artigos/ASME_Tubulence/cds13workbook.pdf (accessed on 20 July 2025).
- Adams, T.; Grant, C.; Watson, H. A Simple Algorithm to Relate Measured Surface Roughness to Equivalent Sand-Grain Roughness. Int. J. Mech. Eng. Mechatron. 2012, 2, 66–71. [Google Scholar] [CrossRef]
- ISO 228-1. Available online: https://cdn.standards.iteh.ai/samples/33777/842b7c5409454ceba69c7dad9c308be1/ISO-228-1-2000.pdf (accessed on 10 July 2025).
- Papageorgiou, V.; Tsongas, K.; Mansour, M.T.; Tzetzis, D.; Mansour, G. Mechanical Properties and Vibrational Behavior of 3D-Printed Carbon Fiber-Reinforced Polyphenylene Sulfide and Polyamide-6 Composites with Different Infill Types. J. Compos. Sci. 2025, 9, 59. [Google Scholar] [CrossRef]
Figure 1.
(a) Semi-open and (b) closed vane impeller.
Figure 1.
(a) Semi-open and (b) closed vane impeller.
Figure 2.
(a) 3D-printed semi-open and (b) closed vane impeller.
Figure 2.
(a) 3D-printed semi-open and (b) closed vane impeller.
Figure 3.
Single blade mesh: (a) semi-open vane impeller; (b) closed vane impeller.
Figure 3.
Single blade mesh: (a) semi-open vane impeller; (b) closed vane impeller.
Figure 4.
(a) Water pump performance test setup; (b) Water pump’s performance curve and best efficiency point (BEP).
Figure 4.
(a) Water pump performance test setup; (b) Water pump’s performance curve and best efficiency point (BEP).
Figure 5.
Roughness measurements on the cast iron impeller.
Figure 5.
Roughness measurements on the cast iron impeller.
Figure 6.
Unprocessed cast iron: (a) 3D roughness profile; (b) Cross-section plane roughness profile.
Figure 6.
Unprocessed cast iron: (a) 3D roughness profile; (b) Cross-section plane roughness profile.
Figure 7.
CNC machined cast iron: (a) 3D roughness profile; (b) Cross-section plane roughness profile.
Figure 7.
CNC machined cast iron: (a) 3D roughness profile; (b) Cross-section plane roughness profile.
Figure 8.
Roughness measurements on the 3D-printed impeller.
Figure 8.
Roughness measurements on the 3D-printed impeller.
Figure 9.
XZ plane of 3D-printed PPS-CF15 composite: (a) 3D roughness profile, (b) Cross-section plane roughness profile.
Figure 9.
XZ plane of 3D-printed PPS-CF15 composite: (a) 3D roughness profile, (b) Cross-section plane roughness profile.
Figure 10.
XY plane of 3D-printed PPS-CF15 composite: (a) 3D roughness profile, (b) Cross-section plane roughness profile.
Figure 10.
XY plane of 3D-printed PPS-CF15 composite: (a) 3D roughness profile, (b) Cross-section plane roughness profile.
Figure 11.
Semi-Open Impeller Performance Curve.
Figure 11.
Semi-Open Impeller Performance Curve.
Figure 12.
Semi-Open Impeller Power Curve.
Figure 12.
Semi-Open Impeller Power Curve.
Figure 13.
Closed Impeller Performance Curve.
Figure 13.
Closed Impeller Performance Curve.
Figure 14.
Closed Impeller Power Curve.
Figure 14.
Closed Impeller Power Curve.
Figure 15.
Impellers after hydraulic test: (a) Cast iron, (b) PPS-CF15 composite.
Figure 15.
Impellers after hydraulic test: (a) Cast iron, (b) PPS-CF15 composite.
Table 1.
Impellers’ characteristics.
Table 1.
Impellers’ characteristics.
Impeller
Type | Inlet Diameter (mm) | Outlet Diameter (mm) | Designed Flow Rate (m3/h) | Head
(m) | Number of Blades | Specific Speed |
|---|
| Semi-open | 62 | 147 | 25 | 20 | 5 | 25.55 |
| closed | 60 | 175 | 30 | 25 | 6 | 23.67 |
Table 2.
Mechanical Properties of PPS-CF15.
Table 2.
Mechanical Properties of PPS-CF15.
| Material | Tensile Strength (MPa) | Strain (%) | Modulus of
Elasticity (GPa) | Specific Gravity (g/cm3) | Hardness (MPa) |
|---|
| Cast Iron | 314.53 | 20.22 | 216 | 7.2 | 613.17 |
| PPS-CF15 | 79.8 | 1.32 | 5.13 | 1.49 | 26.16 |
Table 3.
AM Impeller printing parameters.
Table 3.
AM Impeller printing parameters.
| Material | Nozzle
Temperature | Bed
Temperature | Layer
Height | Printing
Speed | Infill
Ratio | Infill Pattern | Wall Lines |
|---|
| PPS-CF15 | 310 °C | 110 °C | 0.2 mm | 60 mm/s | 100% | Grid | 4 |
Table 4.
Impeller fabrication parameters.
Table 4.
Impeller fabrication parameters.
| Cast Iron Impeller | Weight (g) | Composite Impeller | Weight (g) |
|---|
| Semi-Open | 813 | Semi-Open | 114 |
| Closed | 1869 | Closed | 237 |
Table 5.
Boundary conditions for pump simulation per impeller type.
Table 5.
Boundary conditions for pump simulation per impeller type.
| Parameters | Semi-Open Vane Impeller | Closed Vane Impeller |
|---|
| Inlet Pressure (Pa) | 0 | 0 |
| Outlet Mass Flow Rate (Kg/s) | 6.94 | 8.33 |
| Rotational speed (rev/min) | 2900 | 2900 |
| Working Fluid | Water (20 °C) | Water (20 °C) |
| Wall Roughness | | |
Table 6.
Cast iron roughness.
Table 6.
Cast iron roughness.
| Surface | Ra | Rt | Rz | Sand Grain
Roughness, ks |
|---|
| Unprocessed | 81.72 | 732.771 | 446.734 | 479.12 |
| Machined | 1.276 | 7.435 | 6.136 | 7.481 |
Table 7.
PPS-CF15 roughness.
Table 7.
PPS-CF15 roughness.
| Surface | Ra | Rt | Rz | Sand Grain
Roughness, ks |
|---|
| XZ plane | 29.29 | 126.522 | 114.933 | 171.723 |
| XY plane | 0.728 | 3.323 | 3.191 | 4.268 |
Table 8.
CFD calculation results for different materials for the semi-open vane impeller.
Table 8.
CFD calculation results for different materials for the semi-open vane impeller.
| Semi-Open Impeller Material | Flow Rate (m3/h) | Head (m) | Power (W) | Efficiency (%) |
|---|
| Cast Iron | 25 | 25.4 | 3103.4 | 56.83 |
| PPS-CF15 | 25 | 28.7 | 2678.6 | 74.44 |
Table 9.
CFD calculation results for different materials for the closed vane impeller.
Table 9.
CFD calculation results for different materials for the closed vane impeller.
| Closed Impeller Material | Flow Rate (m3/h) | Head (m) | Power (W) | Efficiency (%) |
|---|
| Cast Iron | 30 | 30.2 | 4056.4 | 60.74 |
| PPS-CF15 | 30 | 33.5 | 3645.8 | 77.08 |
Table 10.
Experimental results for different materials for the semi-open vane impeller at BEP.
Table 10.
Experimental results for different materials for the semi-open vane impeller at BEP.
| Closed Impeller Material | Flow Rate (m3/h) | Head (m) | Power (W) | Efficiency (%) |
|---|
| Cast Iron | 25 | 26.8 | 3256.6 | 56.37 |
| PPS-CF15 | 28 | 27.5 | 2945.4 | 71.09 |
Table 11.
Experimental results for different materials for the closed vane impeller at BEP.
Table 11.
Experimental results for different materials for the closed vane impeller at BEP.
| Closed Impeller Material | Flow Rate (m3/h) | Head (m) | Power (W) | Efficiency (%) |
|---|
| Cast Iron | 30 | 27.9 | 4330.2 | 52.5 |
| PPS-CF15 | 38 | 27.3 | 4110.3 | 68.63 |
| Disclaimer/Publisher’s Note: The statements, opinions and data contained in all publications are solely those of the individual author(s) and contributor(s) and not of MDPI and/or the editor(s). MDPI and/or the editor(s) disclaim responsibility for any injury to people or property resulting from any ideas, methods, instructions or products referred to in the content. |
© 2025 by the authors. Licensee MDPI, Basel, Switzerland. This article is an open access article distributed under the terms and conditions of the Creative Commons Attribution (CC BY) license (https://creativecommons.org/licenses/by/4.0/).
