Article

Numerical Investigation of Hydrodynamic Coefficients and Wake Characteristics of a Deep-Sea Mining Vehicle

College of Mechanical and Electrical Engineering, Central South University, Changsha 410083, China
*
Authors to whom correspondence should be addressed.
Machines 2025, 13(8), 699; https://doi.org/10.3390/machines13080699
Submission received: 4 July 2025 / Revised: 1 August 2025 / Accepted: 6 August 2025 / Published: 8 August 2025
(This article belongs to the Special Issue Advances in Dynamics and Control of Vehicles)

Abstract

The hydrodynamic resistance experienced by deep-sea mining vehicles (DSMV) during underwater operations and deployment/retrieval processes has a significant impact on maneuverability and operational safety. Therefore, accurate determination of the vehicle’s hydrodynamic coefficients is essential for motion control and system design. In this study, computational fluid dynamics (CFD) methods are utilized to calculate the transverse and vertical drag forces acting on the DSMV, as well as the corresponding added mass in both directions. The unsteady Reynolds-averaged Navier–Stokes equations were employed to analyze the vehicle’s dynamic behavior and the development of its wake flow structures. under uniform and accelerated motion conditions is analyzed. The time-averaging technique is applied to extract steady-state drag forces and drag coefficients, while the added mass and added mass coefficients are estimated by isolating viscous and inertial forces during acceleration. To verify the accuracy of the CFD methodology, simulations of regularly shaped bodies are performed, and the results are compared with theoretical solutions. The results show a high degree of agreement, confirming the reliability of the numerical approach used in this study.

1. Introduction

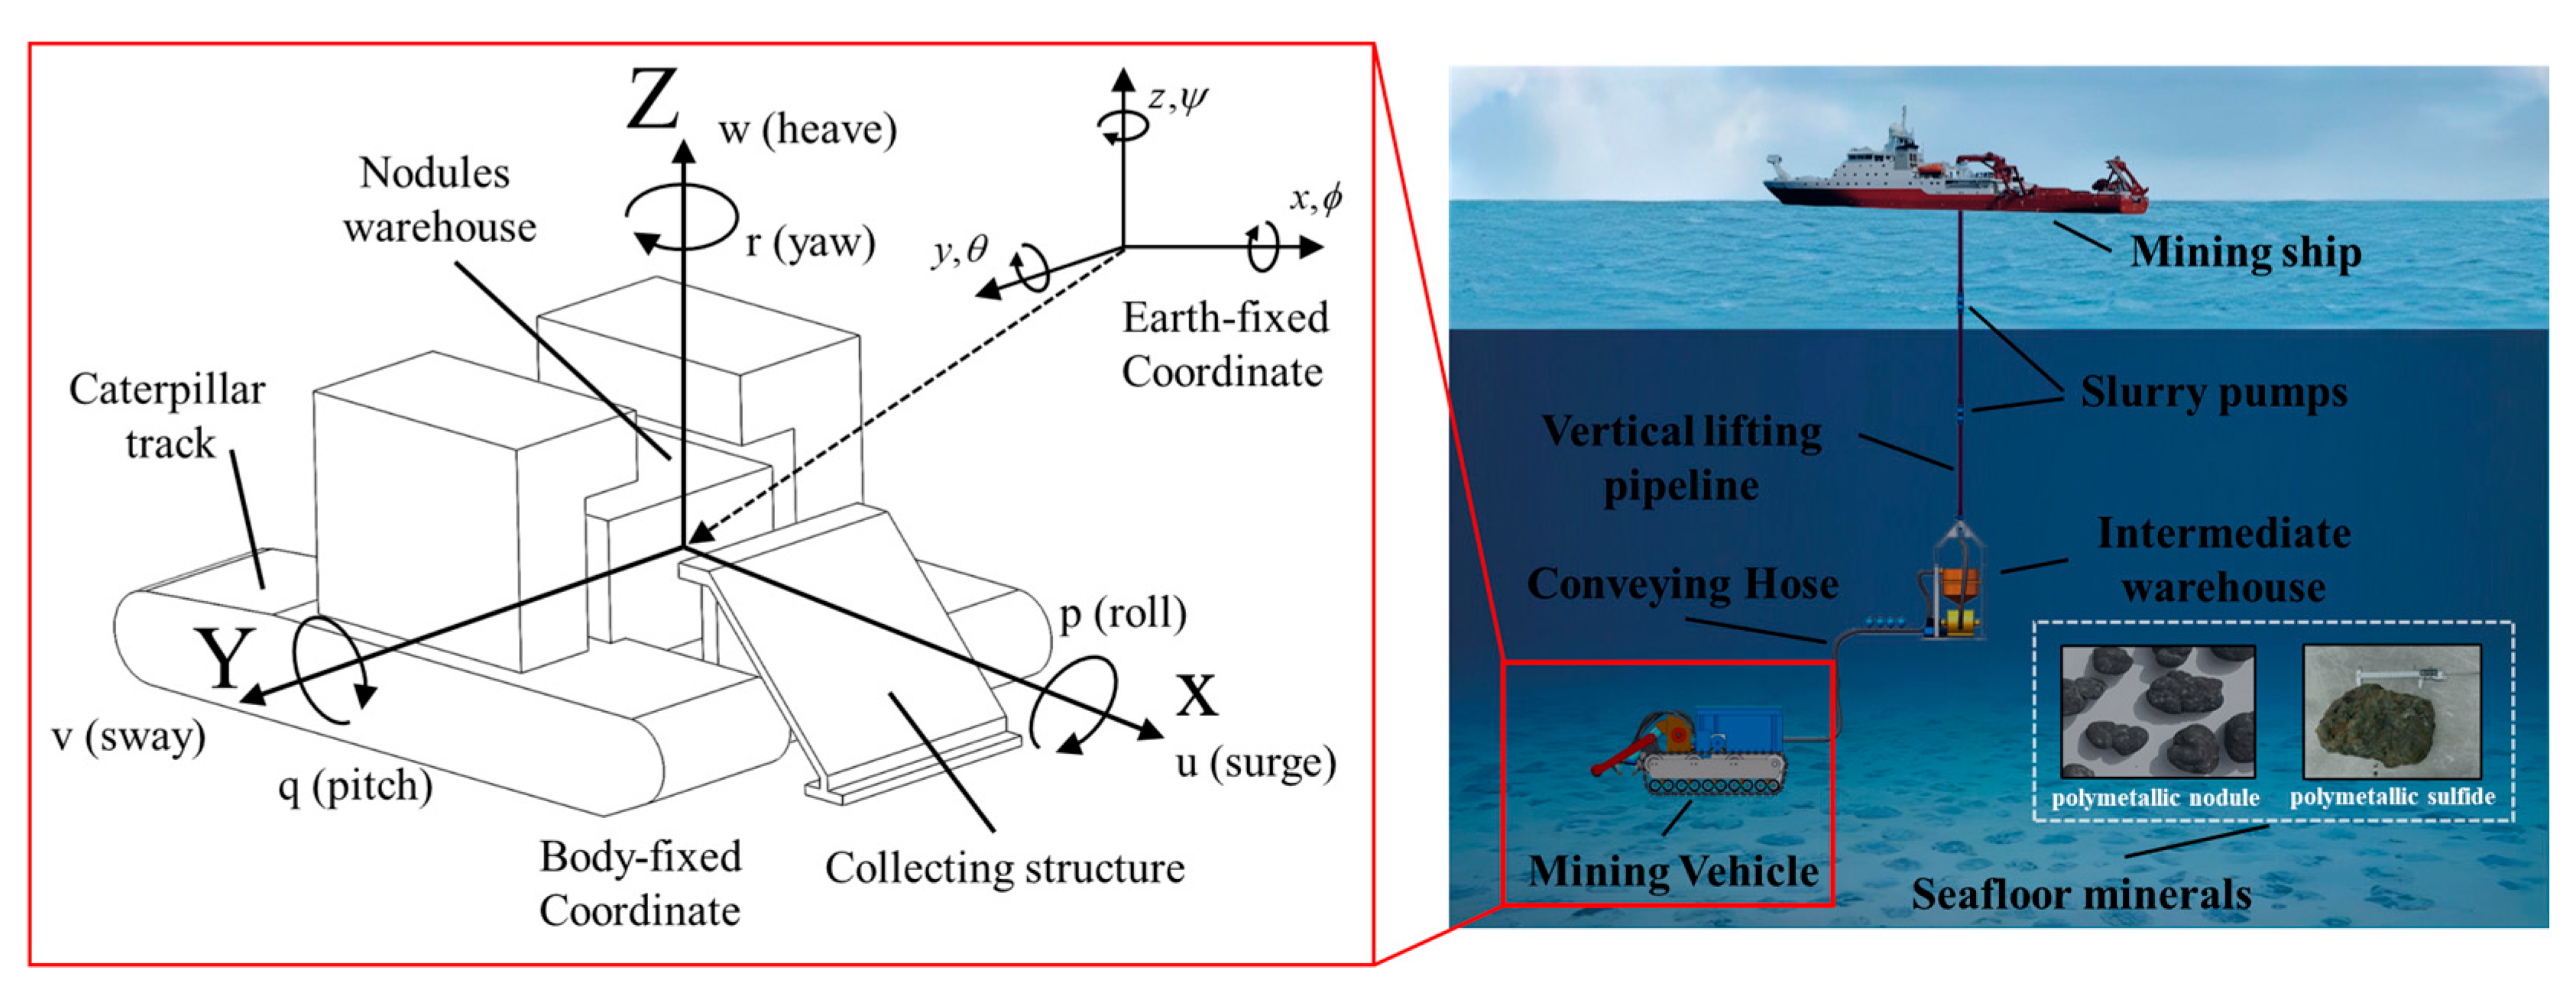
Hydrodynamic coefficients are fundamental dimensionless parameters that characterize the interaction between a body and the surrounding fluid. These coefficients are essential for accurate hydrodynamic modeling. This study focuses on a deep-sea mining vehicle (DSMV) designed for collecting polymetallic nodules from seabed depths of approximately 5000 m (Figure 1). Its complex geometry, required for seabed operations, leads to significant hydrodynamic interactions during prolonged deployment and retrieval phases. During these phases, the vehicle is significantly influenced by hydrodynamic forces. Therefore, the primary objective of this study is to determine the hydrodynamic load coefficients of the DSMV under submerged conditions, providing a theoretical basis for achieving stable motion control during deployment and retrieval operations. For the Deep-Sea Mining Vehicle (DSMV), these coefficients constitute the foundation for formulating the equations of motion and performing hydrodynamic predictions required for control system development [1,2,3].
Among them, the drag coefficient and added mass coefficient are key components that quantify the hydrodynamic resistance and inertial force experienced by the vehicle during steady and accelerating motions, respectively, thereby capturing its dynamic response under complex underwater flow conditions. Accurately obtaining these hydrodynamic coefficients helps to optimize the structural design of the deep-sea mining vehicle and improves its control stability and operational safety during deployment and retrieval.
In the hydrodynamic analysis of a DSMV, two reference coordinate systems are utilized: the global coordinate system, which is fixed relative to the Earth, and the local coordinate system, which is fixed relative to the DSMV. The origin of the body-fixed coordinate system (X, Y, Z) is located at the vehicle’s center of buoyancy. This coordinate system translates with the vehicle’s center of mass and maintains a fixed orientation relative to the vehicle’s structure. The linear and angular velocities of the vehicle are expressed in this reference frame. In the Earth-fixed coordinate system (x, y, z), the position and orientation of the vehicle are defined relative to a fixed origin in space, and the origin of this global coordinate system is a stationary reference point. As depicted in Figure 1, the DSMV exhibits six-degrees-of-freedom (6DOF) motion, which is characterized by using both a body-fixed coordinate system and an Earth-fixed global coordinate system. Within this framework, the hydrodynamic loads acting on the DSMV can be utilized to determine its motion characteristics [4].
Figure 1. Body-fixed coordinate system and Earth-fixed global coordinate system of DSMV [3,5].
Machines 13 00699 g001
The hydrodynamics of a DSMV is typically analyzed using a 6DOF dynamic model. This model characterizes the hydrodynamic forces and moments acting on the DSMV in all directions. These loads are time-dependent and influenced by the vehicle’s velocity, acceleration, and geometry [6]. Consequently, the hydrodynamic loads are generally expressed as the products of hydrodynamic coefficients with linear and angular velocities and accelerations. Equations (1)–(6) present the linearized 6DOF motion equations of the DSMV under hydrodynamic loads. These equations incorporate hydrodynamic derivatives and serve as the foundation for the DSMV dynamic model [7,8].
X n e t = X u u + X u ˙ u ˙ + X q q
Y n e t = Y v v + Y r r + Y v ˙ v ˙ + Y r ˙ r ˙ + Y δ r δ r
Z n e t = Z w w + Z q q + Z w ˙ w ˙ + Z q ˙ q ˙ + Z δ s δ s
K n e t = K p P + K p ˙ p ˙
M n e t = M w w + M q q + M w ˙ w ˙ + M q ˙ q ˙ + M δ s δ s
N n e t = N v v + N r r + N v ˙ v ˙ + N r ˙ r ˙ + N δ r δ r
The hydrodynamic coefficients in Equations (1)–(6) are typically categorized into two groups: damping coefficients and added-mass coefficients. Damping loads are primarily related to the velocity of the vehicle and depend on its geometry and fluid properties. The corresponding coefficients are referred to as damping coefficients. Added mass loads represent the inertial response of the surrounding fluid to the vehicle’s acceleration, and the associated coefficients are called added mass coefficients.
According to the dynamic model described in Equations (1)–(6), the coefficients X u , X q , Y v , Y r , Y δ r , Z w , Z q , Z δ s , K p , M w , M q , M δ s , N v , and N r are classified as damping coefficients. These coefficients represent the hydrodynamic forces and moments associated with the vehicle’s translational and rotational velocities, and they mainly reflect viscous and pressure-induced resistance due to steady motion in water. In contrast, when the vehicle undergoes acceleration or changes in its motion direction, additional hydrodynamic loads arise due to the inertial reaction of the surrounding fluid. These loads are related to translational and angular accelerations as well as Coriolis effects. The coefficients corresponding to these inertial effects are referred to as added mass coefficients, which include X u ˙ , Y v ˙ , Y r ˙ , Z w ˙ , Z q ˙ , K p ˙ , M w ˙ , M q ˙ , N v ˙ and N r ˙ . Accurate determination of hydrodynamic coefficients is a critical step for conducting hydrodynamic analysis and ensuring reliable prediction of the vehicle’s hydrodynamic behavior.
In previous studies, numerous researchers have investigated methods for calculating the hydrodynamic coefficients of underwater bodies, primarily employing Analytical and Semi-Empirical (ASE) approaches and Computational Fluid Dynamics (CFD) techniques [9]. De Barros et al. [10] employed analytical and semi-empirical (ASE) methods to estimate hydrodynamic derivatives and compared the results with CFD-based lift force evaluations on a fully submerged hull. The approach was applied to the AUV, with predicted derivatives successfully used to estimate its turning diameter during sea trials. Kepler et al. [11] proposed an approximation method for estimating hydrodynamic coefficients of underwater vehicles using only geometric data. Allotta et al. [12] conducted a case study on identifying key hydrodynamic parameters of the AUV using a simplified identification approach based on limited sea trial data. Barati et al. [13] developed highly accurate drag coefficient correlations for smooth spheres across a wide Reynolds number range (up to 106) using multi-gene Genetic Programming (GP). Lin and Liao [14] used FMBEM to efficiently compute added mass coefficients for complex 3D bodies, demonstrating its effectiveness and speed over traditional BEM through SUBOFF submarine simulations. Ferreira et al. [15] presented the dynamic characterization of an AUV, detailing the main hydrodynamic parameters and the methods used for their identification. Jones et al. [16] used the Datcom method to calculate hydrodynamic coefficients for four torpedo-shaped vehicles, showing good agreement with experiments. Numerous researchers have also employed analytical and semi-empirical methods to estimate the hydrodynamic derivatives of underwater vehicles [17,18,19,20].
Numerous researchers have successfully employed the CFD method to determine hydrodynamic coefficients of underwater bodies with high accuracy, establishing CFD as a widely adopted methodology in this field [21,22,23]. Javanmard et al. [24,25] used unsteady RANS-based CFD to estimate added mass coefficients under linear acceleration, showing good accuracy and acceleration independence, providing a reliable, efficient alternative to oscillatory simulations and experiments. Nakamura et al. [26] conducted forced oscillation tests and validated hydrodynamic coefficients through simulation comparisons. Phillips et al. [27] used the CFD method to estimate AUV stability coefficients, showing good agreement with yawing and rotating arm test data. Raza et al. [28] presented a novel CFD method for determining the added mass of complex underwater objects. Mishra et al. [29] developed a CFD-RANS method computing directional added mass coefficients for axisymmetric bodies, validated using spheres and cylinders. Pan et al. [30] determined appended submarine hydrodynamic coefficients via RANS simulations of Planar Motion Mechanism (PMM) and validated experimentally. Leong et al. [31] employed RANS CFD to predict SUBOFF hydrodynamic coefficients during maneuvers, validating against experiments. Mesh quality, boundary conditions, and turbulence models critically impacted results. Du et al. [32] analyzed submarine flow effects on AUV hydrodynamic coefficients during recovery using RANS-based CFD. Results demonstrated significant dependence on AUV attack and sideslip angles, while the Reynolds number influence was negligible. Despite extensive computational fluid dynamics studies of hydrodynamic coefficients for underwater bodies, research specific to the Deep-Sea Mining Vehicle remains absent. Considering the accuracy and cost-effectiveness, this study employs the CFD method to predict hydrodynamic coefficients of the DSMV. Given the geometric complexity of the deep-sea mining vehicle (DSMV), a simplified CFD model was adopted, retaining the key hydrodynamic features such as the collecting structure, nodule warehouse, and caterpillar track. These dominant structures primarily determine the flow separation and wake behavior, while finer geometric details have a negligible influence on overall drag [3]. The results of this study will provide critical data for the optimization of hull design and maneuvering control.

2. Methodology Description

2.1. Analytical Method

To determine the drag coefficients and added mass coefficients of the deep-sea mining vehicle (DSMV) in the transverse (X) and vertical (Z) directions, this study conducts unsteady computational fluid dynamics (CFD) simulations. The DSMV is subjected to prescribed non-uniform motions along a single degree of freedom, inducing unsteady flow responses in the surrounding fluid. During the simulation process, the total hydrodynamic force is decomposed into viscous and inertial components. By isolating the inertial component and fitting it against the known acceleration data, the study accurately extracts the directional drag and added mass coefficients of the DSMV.
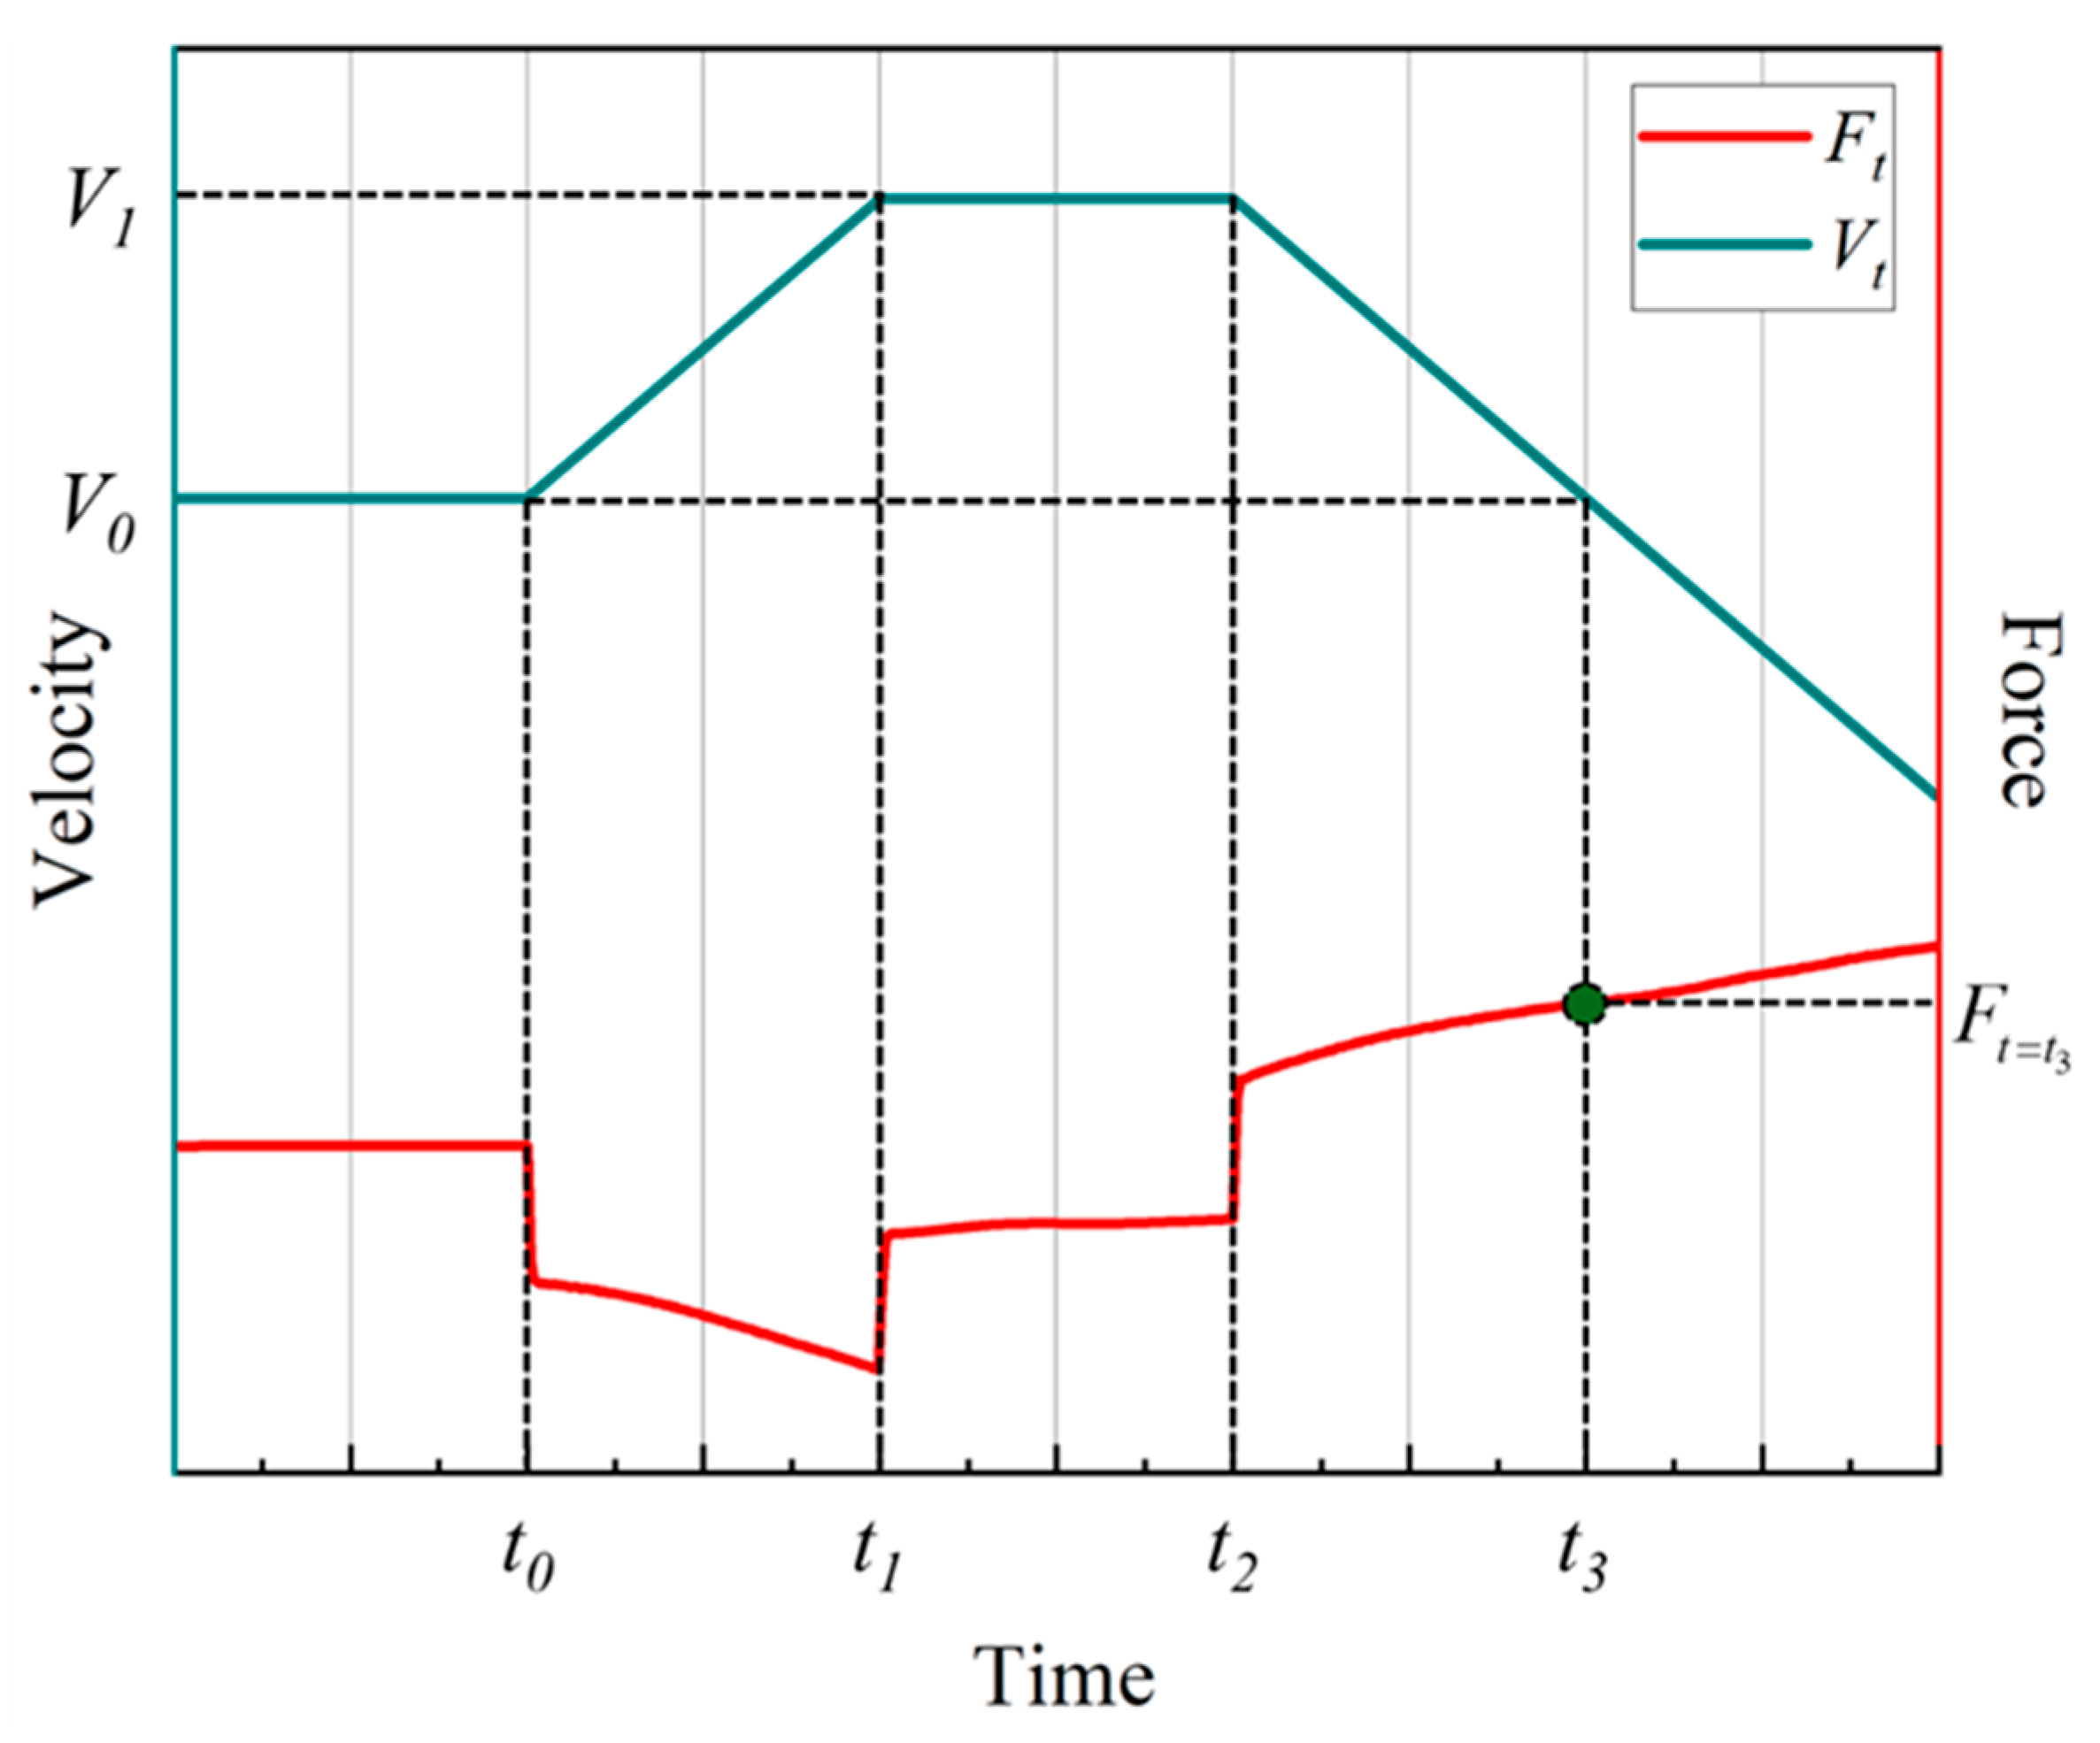
The drag coefficient of the vehicle can be determined by simulating uniform motion in the fluid, while the evaluation of the added mass coefficient requires the vehicle to undergo accelerated motion. As illustrated in Figure 2, this study simulates non-uniform motion by varying the inlet flow velocity, thereby inducing an accelerating motion of the vehicle within the fluid to extract the added mass. When t < t 0 , the vehicle moves at a constant velocity, the hydrodynamic force acting on it is the drag force F d . During the interval t 0 < t < t 1 , the vehicle accelerates, and the total hydrodynamic force F t o t a l comprises both the viscous drag and inertial force, which is proportional to the vehicle’s acceleration. The inertial force F m expression is given in Equation (7):
F m = ( ρ + m a ) a
where ρ represents the mass of the fluid displaced by the vehicle, m a denotes the added mass in the prescribed direction and a is the acceleration in that direction.
The analysis of the velocity profile in Figure 2 indicates that at t = t 3 , the vehicle reaches its initial velocity V 0 after experiencing acceleration and deceleration phases. Nevertheless, owing to the inertial effects present in the fluid, the total hydrodynamic force F t = t 3 acting on the vehicle at this instant deviate from the drag force F d observed during uniform motion. At this time, the total hydrodynamic force on the vehicle body consists of the drag force and the inertia force, so the difference between F t = t 3 and F d is the fluid inertia force on the vehicle body.
F t = t 3 F t < t 0 = ( ρ + m a ) a
m a = F t = t 3 F t < t 0 a ρ

2.2. Validation

2.2.1. Drag Coefficient

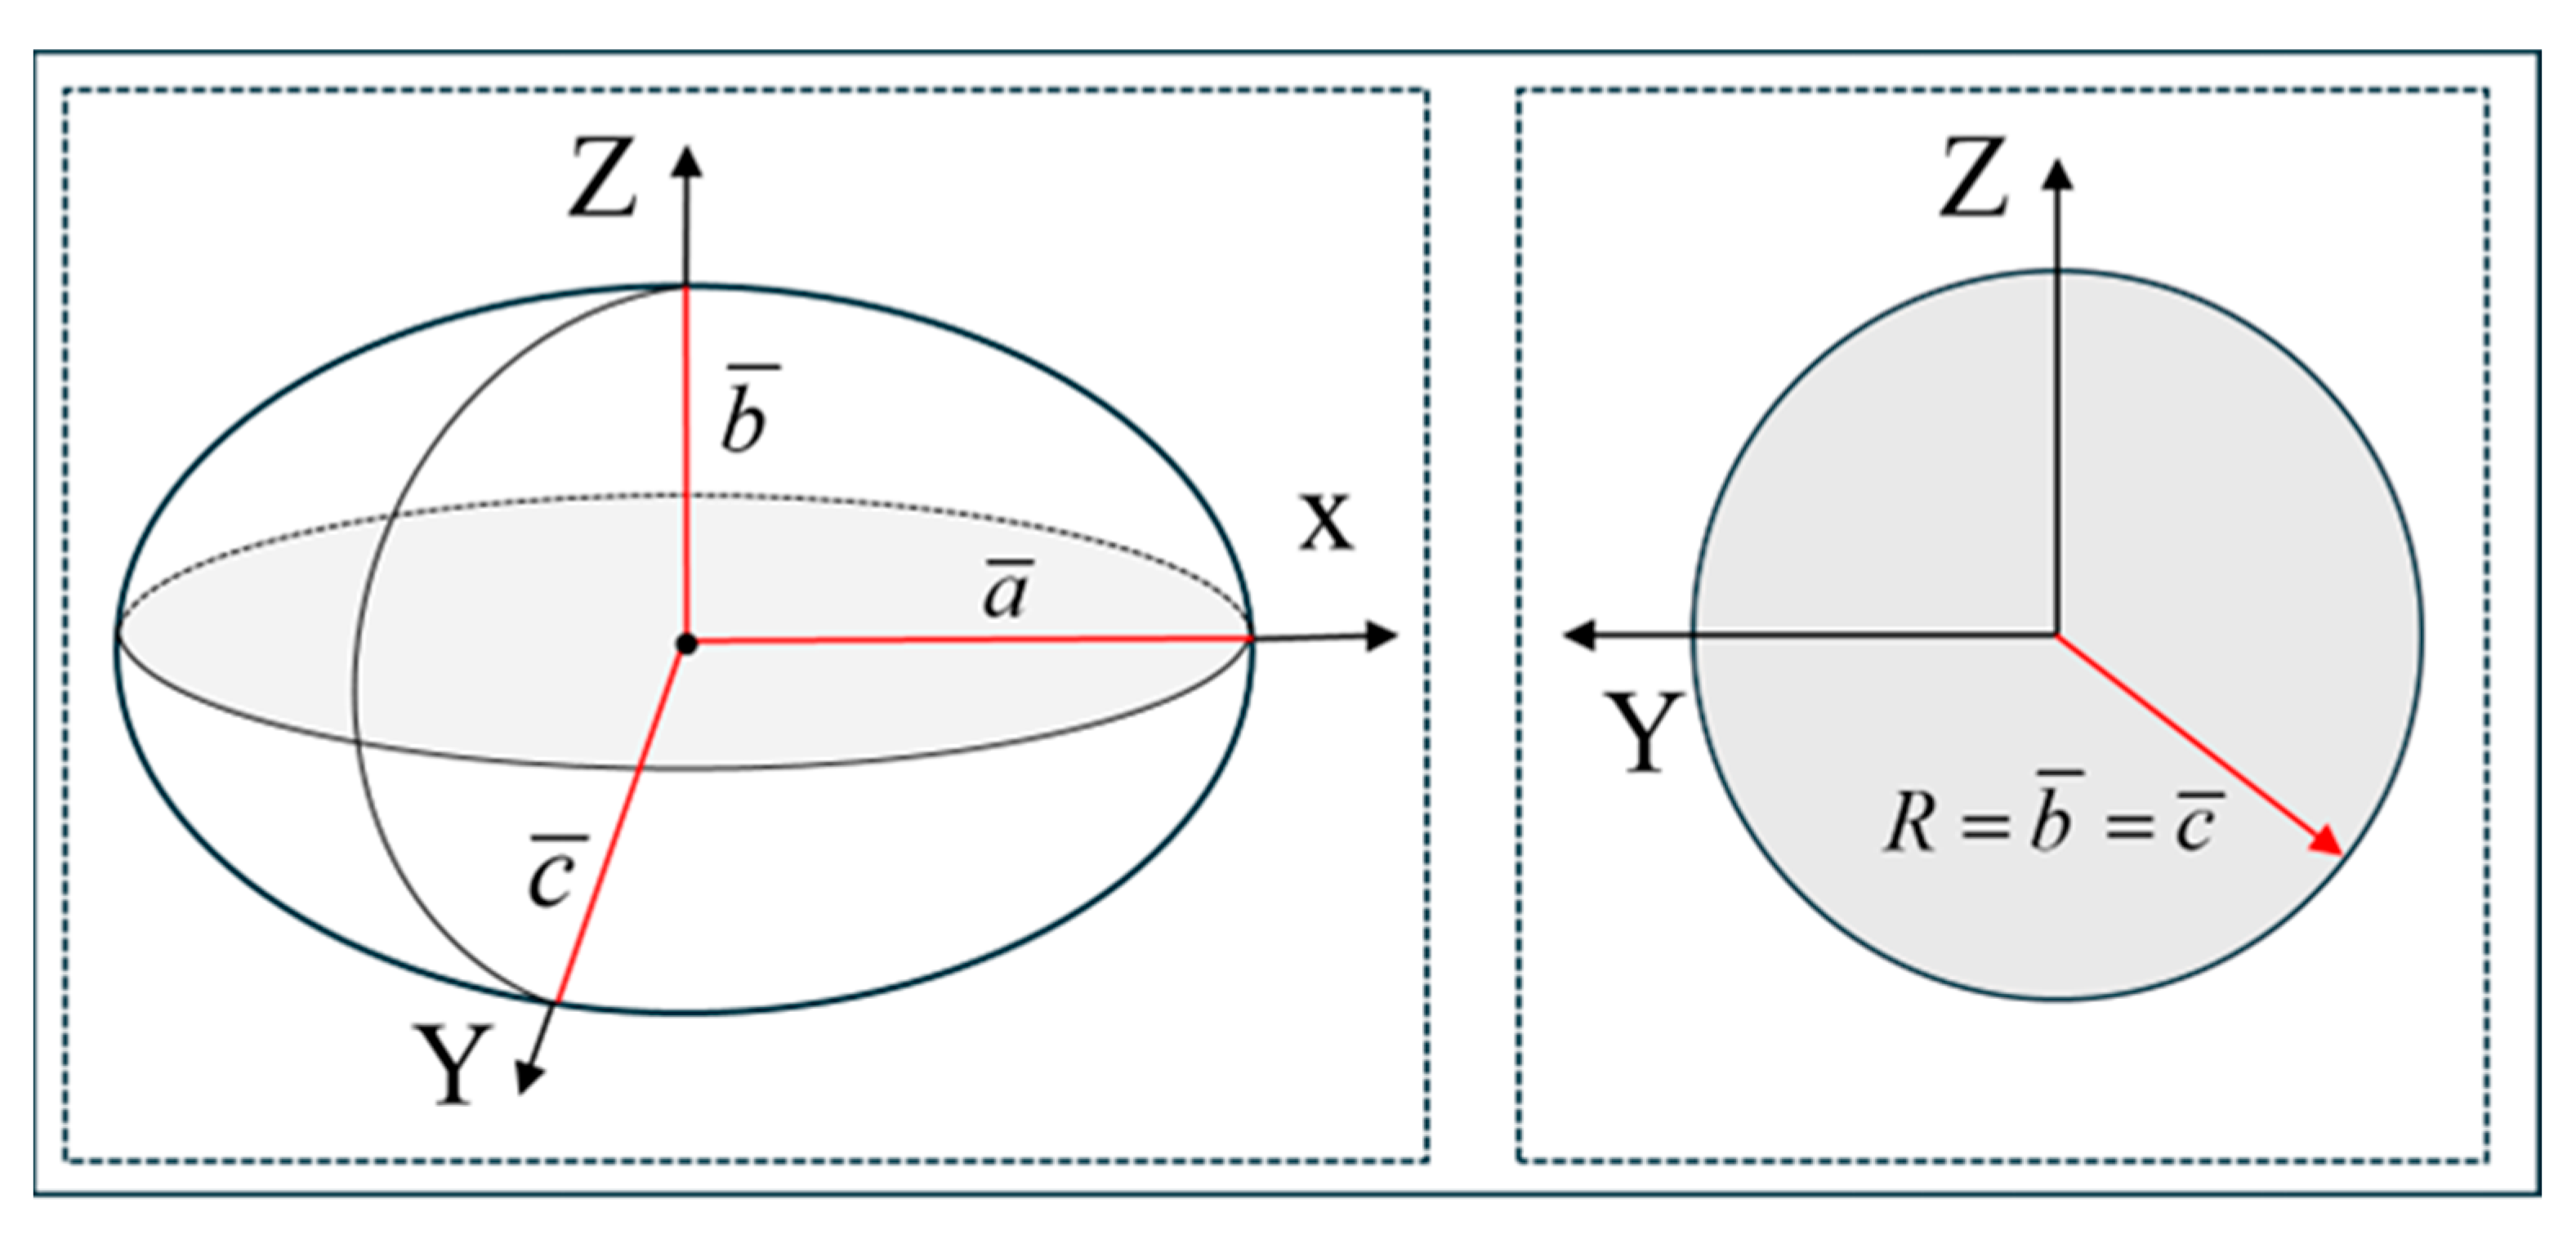
Regular objects, such as the drag coefficient and added mass coefficient of ellipsoidal spheres, can be calculated through relevant theoretical methods. This study calculates and compares the hydrodynamic coefficients of ellipsoidal spheres to verify the adopted CFD method. The geometry of the ellipsoid with b ¯ = c ¯ = 0.2 m and a ¯ = 1 m is shown in Figure 3 and its geometry satisfies the following relationship:
x 2 a ¯ 2 + y 2 b ¯ 2 + z 2 c ¯ 2 = 1
Assume that the ellipsoidal sphere is fully submerged in water, and the direction of the water flow is in the x-direction. According to Hoerner’s (1965) [33] formula, the drag coefficient of the ellipsoid can be calculated as Equation (11):
C d = C f ( 4 λ ( 1 / 3 ) + 6 λ ( 7 / 6 ) + 24 λ ( 8 / 3 ) ) C f = 0.455 ( log 10 Re ) 2.58 = 0.045 Re ( 1 / 6 )
where λ = a ¯ b ¯ and Re = ρ V L v , L = 2 a ¯ ; ρ represents the density of the water; v represents the kinematic viscosity of the water; and V represents the flow velocity.

2.2.2. Added Mass Coefficient

Lamb (1945) [34] calculated the added mass coefficient of an ellipse by defining the k factors. The definition of k is shown in Equation (12):
k 1 = a 0 2 a 0 k 2 = β 0 2 β 0
where a 0 and b 0 are derived from the intrinsic geometric properties of the ellipse.
a 0 = 2 ( 1 e 2 ) e 2 ( 1 2 ln 1 + e 1 e e ) β 0 = 1 e 2 1 e 2 2 e 2 ln 1 + e 1 e
where e represents the eccentricity and e = 1 b ¯ a ¯ 2 .
Analytical formulation to calculate added mass derivatives of an ellipsoid in both longitudinal and transverse directions are as follows:
X u ˙ = k 1 m Y v ˙ = Z w ˙ = k 2 m
where m represents the mass of the displaced volume of the fluid around the ellipsoid, and m = ρ = 4 3 ρ π a ¯ b ¯ 2 .
Based on the geometric dimensions of the ellipsoid illustrated in Figure 3 and Equations (12)–(14), added mass coefficients of the ellipsoid in longitudinal X u ˙ = 9.682 kg, added mass coefficients of the ellipsoid in transverse Y v ˙ = Z w ˙ = 150.23 kg.

2.2.3. Validation of CFD Method

In addition to the theoretical calculation methods for determining drag and added mass coefficients of ellipsoidal spheres, CFD methods can now be utilized to compute these coefficients based on the analytical approach presented in Section 2.1. Javanmard et al. [25] computed the drag coefficient of an ellipsoidal sphere at flow velocities of 1.5 m/s and 3 m/s, corresponding to Reynolds numbers of 2.99 × 10⁶ and 5.98 × 10⁶, respectively. Additionally, the added mass under an acceleration of a = 1 m/s2, by simulating variable-speed motion of an ellipsoid in water and separating inertial and viscous forces through CFD analysis.
The drag coefficients of the ellipsoidal spheres at longitudinal velocities of 1.5 m/s and 3 m/s were computed using Hoerner’s (1965) [33] empirical formula, yielding values of 0.02803 and 0.02505, respectively. Under the same conditions, Javanmard et al. [25] obtained drag coefficients of 0.03032 and 0.027 through CFD simulations, with deviations from Hoerner’s results remaining below 8.2% in both cases. In addition, Javanmard et al. [25] used CFD simulations to calculate the added mass coefficients of the ellipsoid under an acceleration of a = 1 m/s2, obtaining values of 10.04 kg in the longitudinal (x) direction and 143.48 kg in the transverse (y) direction. This result has a maximum error of less than 4.7% compared to the calculation result of Lamb (1945) [34].
By comparing the CFD results with theoretical predictions, it is evident that separating viscous and inertial forces through numerical simulation enables more accurate estimation of drag and added mass coefficients. Accordingly, this study adopts the CFD approach to calculate the hydrodynamic drag and added mass coefficients of the DSMV in water.

3. Numerical Methods

3.1. Numerical Setup

The hydrodynamic behavior of deep-sea mining vehicles involves a typical three-dimensional bluff body flow, with the total resistance primarily resulting from pressure drag caused by flow separation and surface friction. In this study, the k ω shear stress transport (SST) turbulence model is employed to predict the drag coefficient of the vehicle. The k ω SST model combines the advantages of both the k ω and k ε models by utilizing the k ω formulation near the wall to improve boundary layer resolution, while adopting the k ε formulation in the far field to enhance numerical stability in free shear flows. Compared with conventional turbulence models, the k ω SST model provides improved accuracy in predicting flow separation and capturing wake structures, making it particularly suitable for high-Reynolds-number flows around large-scale bluff bodies. Furthermore, the model exhibits flexibility with respect to wall y⁺ requirements, supporting both high-resolution near-wall modeling and the use of wall functions at moderate y⁺ levels. This makes it a practical and robust choice for balancing computational cost and predictive fidelity in resistance estimation.
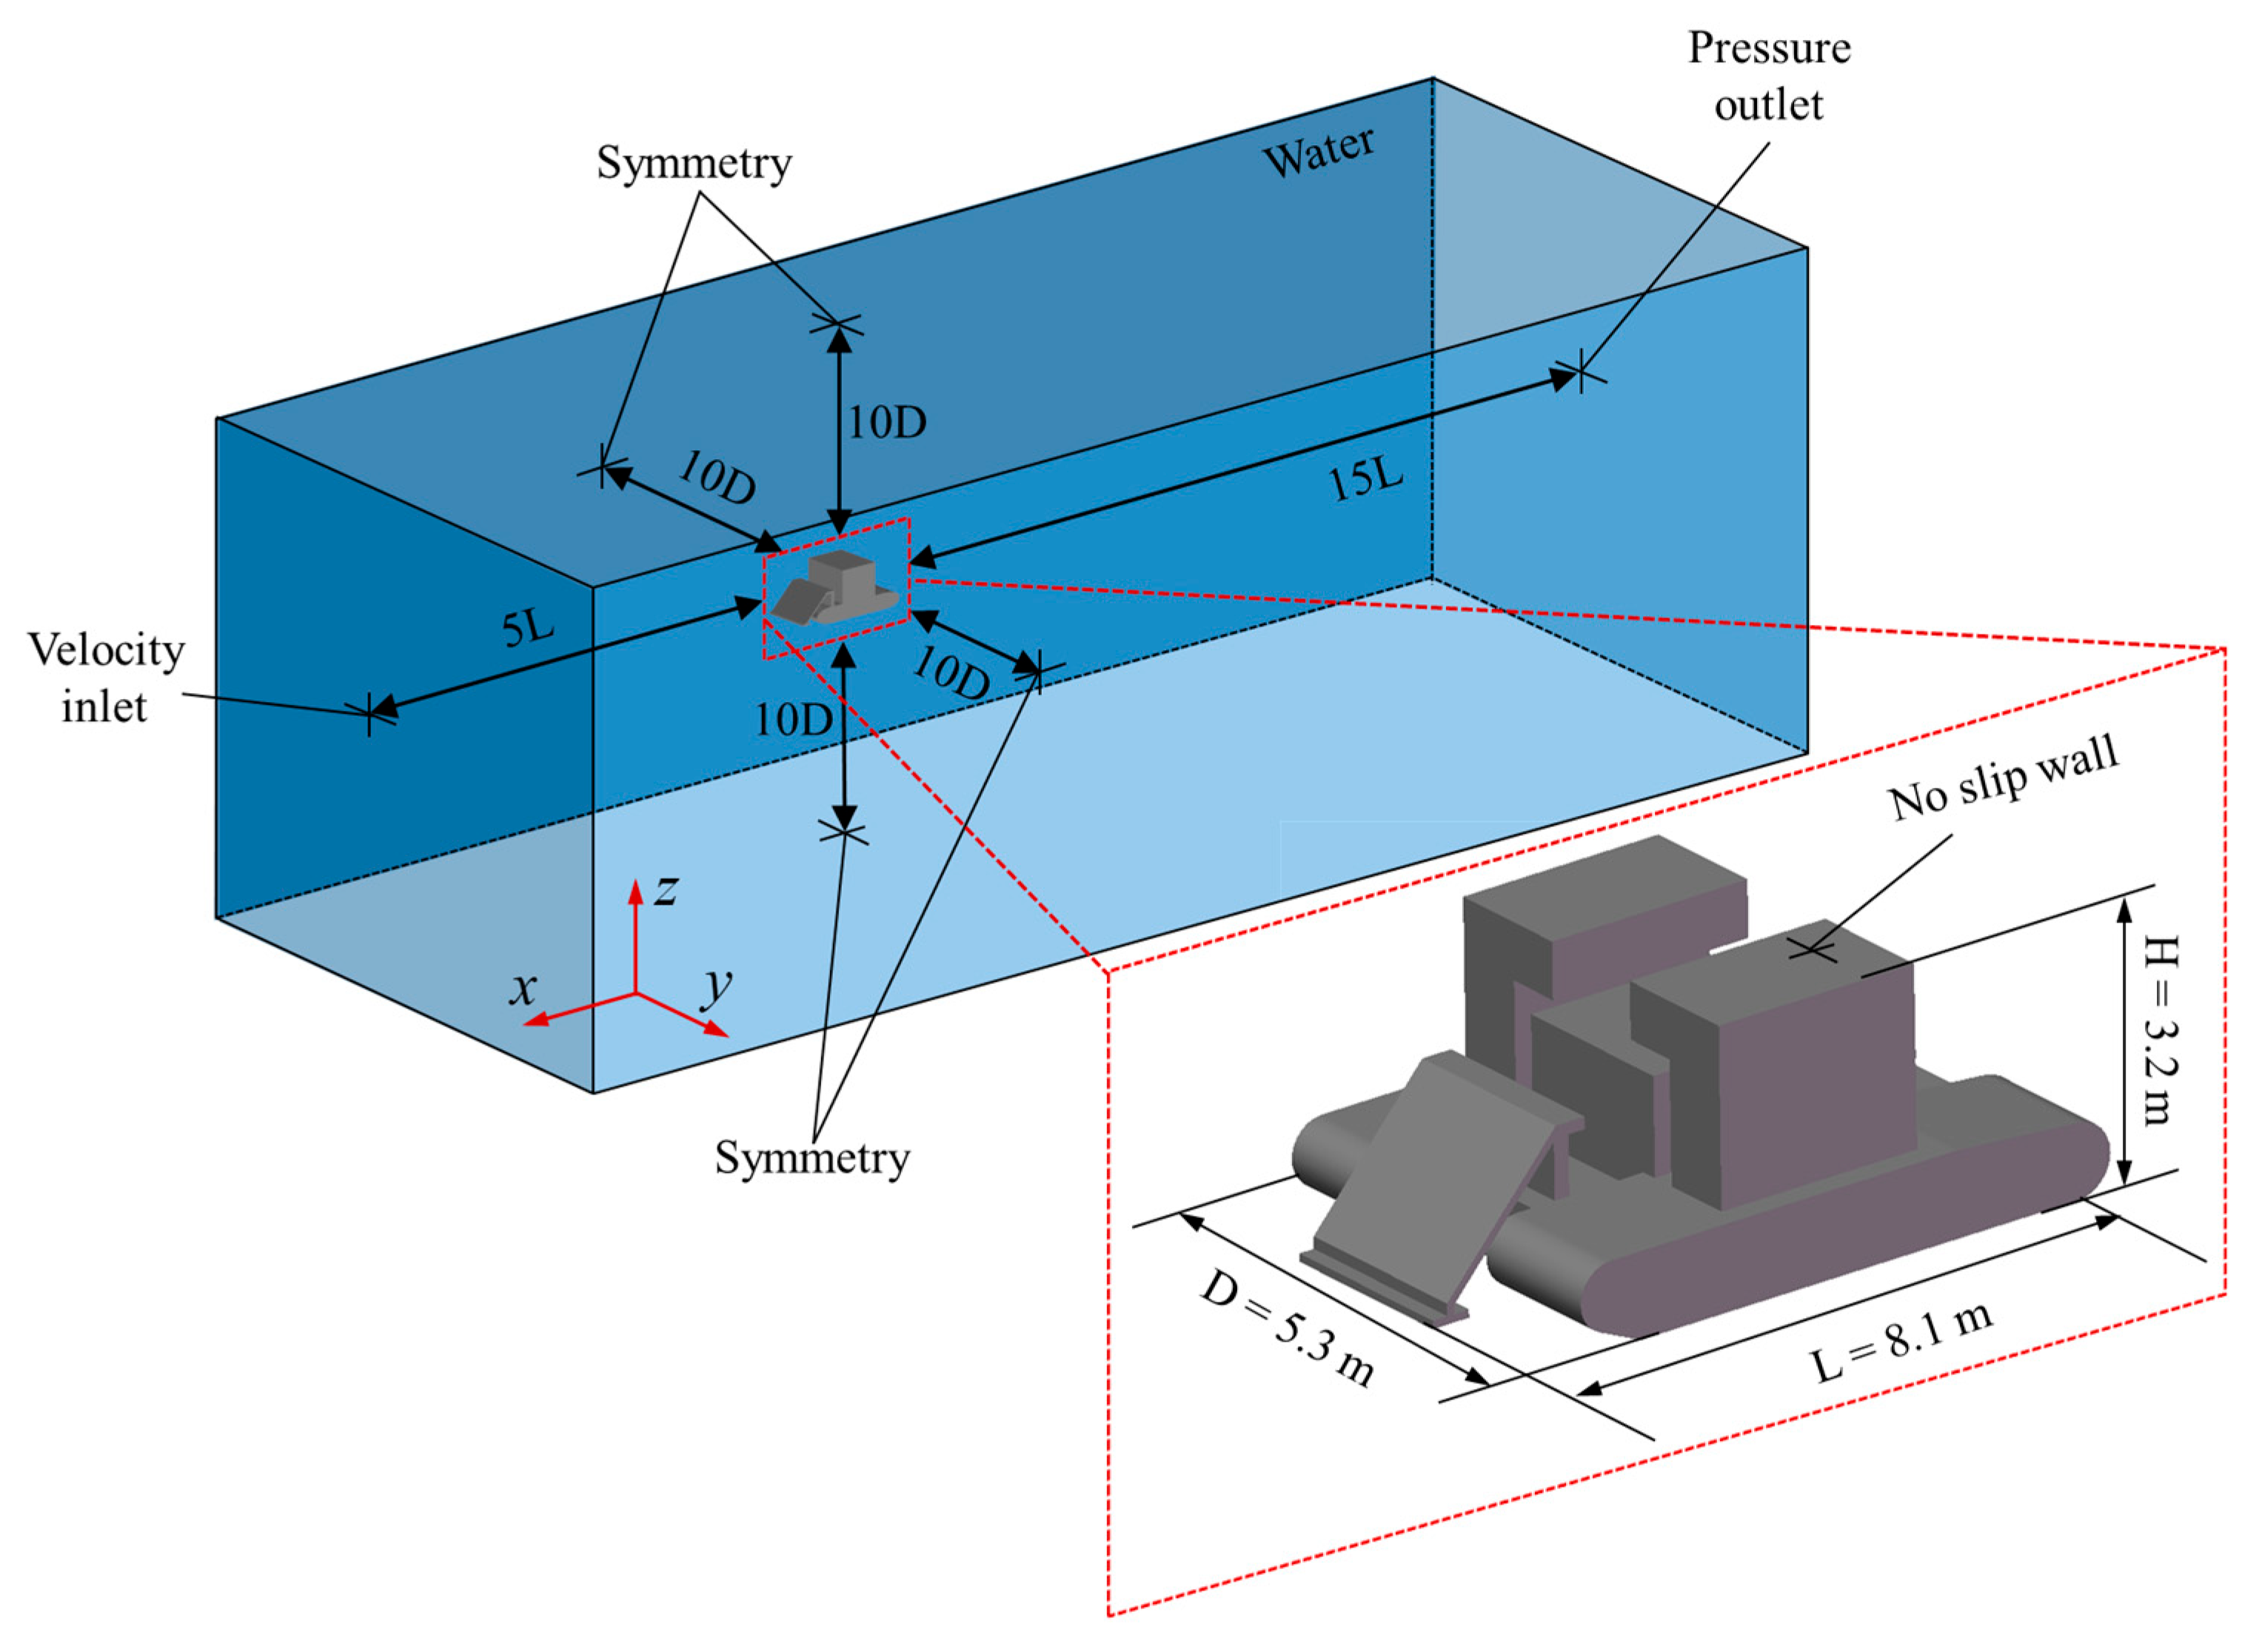
As shown in Figure 4, the computational domain and the geometry of the deep-sea mining vehicle (DSMV) are presented. The upstream boundary is defined as a velocity inlet, while the downstream boundary is set as a pressure outlet, and the fluid is water with a density ρ of 997.56 kg/m3. All other domain boundaries are specified as symmetry planes, and the DSMV surface is modeled as a no-slip wall. To accurately capture the variation in hydrodynamic resistance, the distance between the velocity inlet and the DSMV is set to 5L, ensuring a fully developed and uniform inflow. The distance from the DSMV to the pressure outlet is extended to 15L to allow for full wake development behind the bluff body. Additionally, the minimum distance between the DSMV and the remaining boundaries of the domain is set to 10D to eliminate potential boundary interference effects.
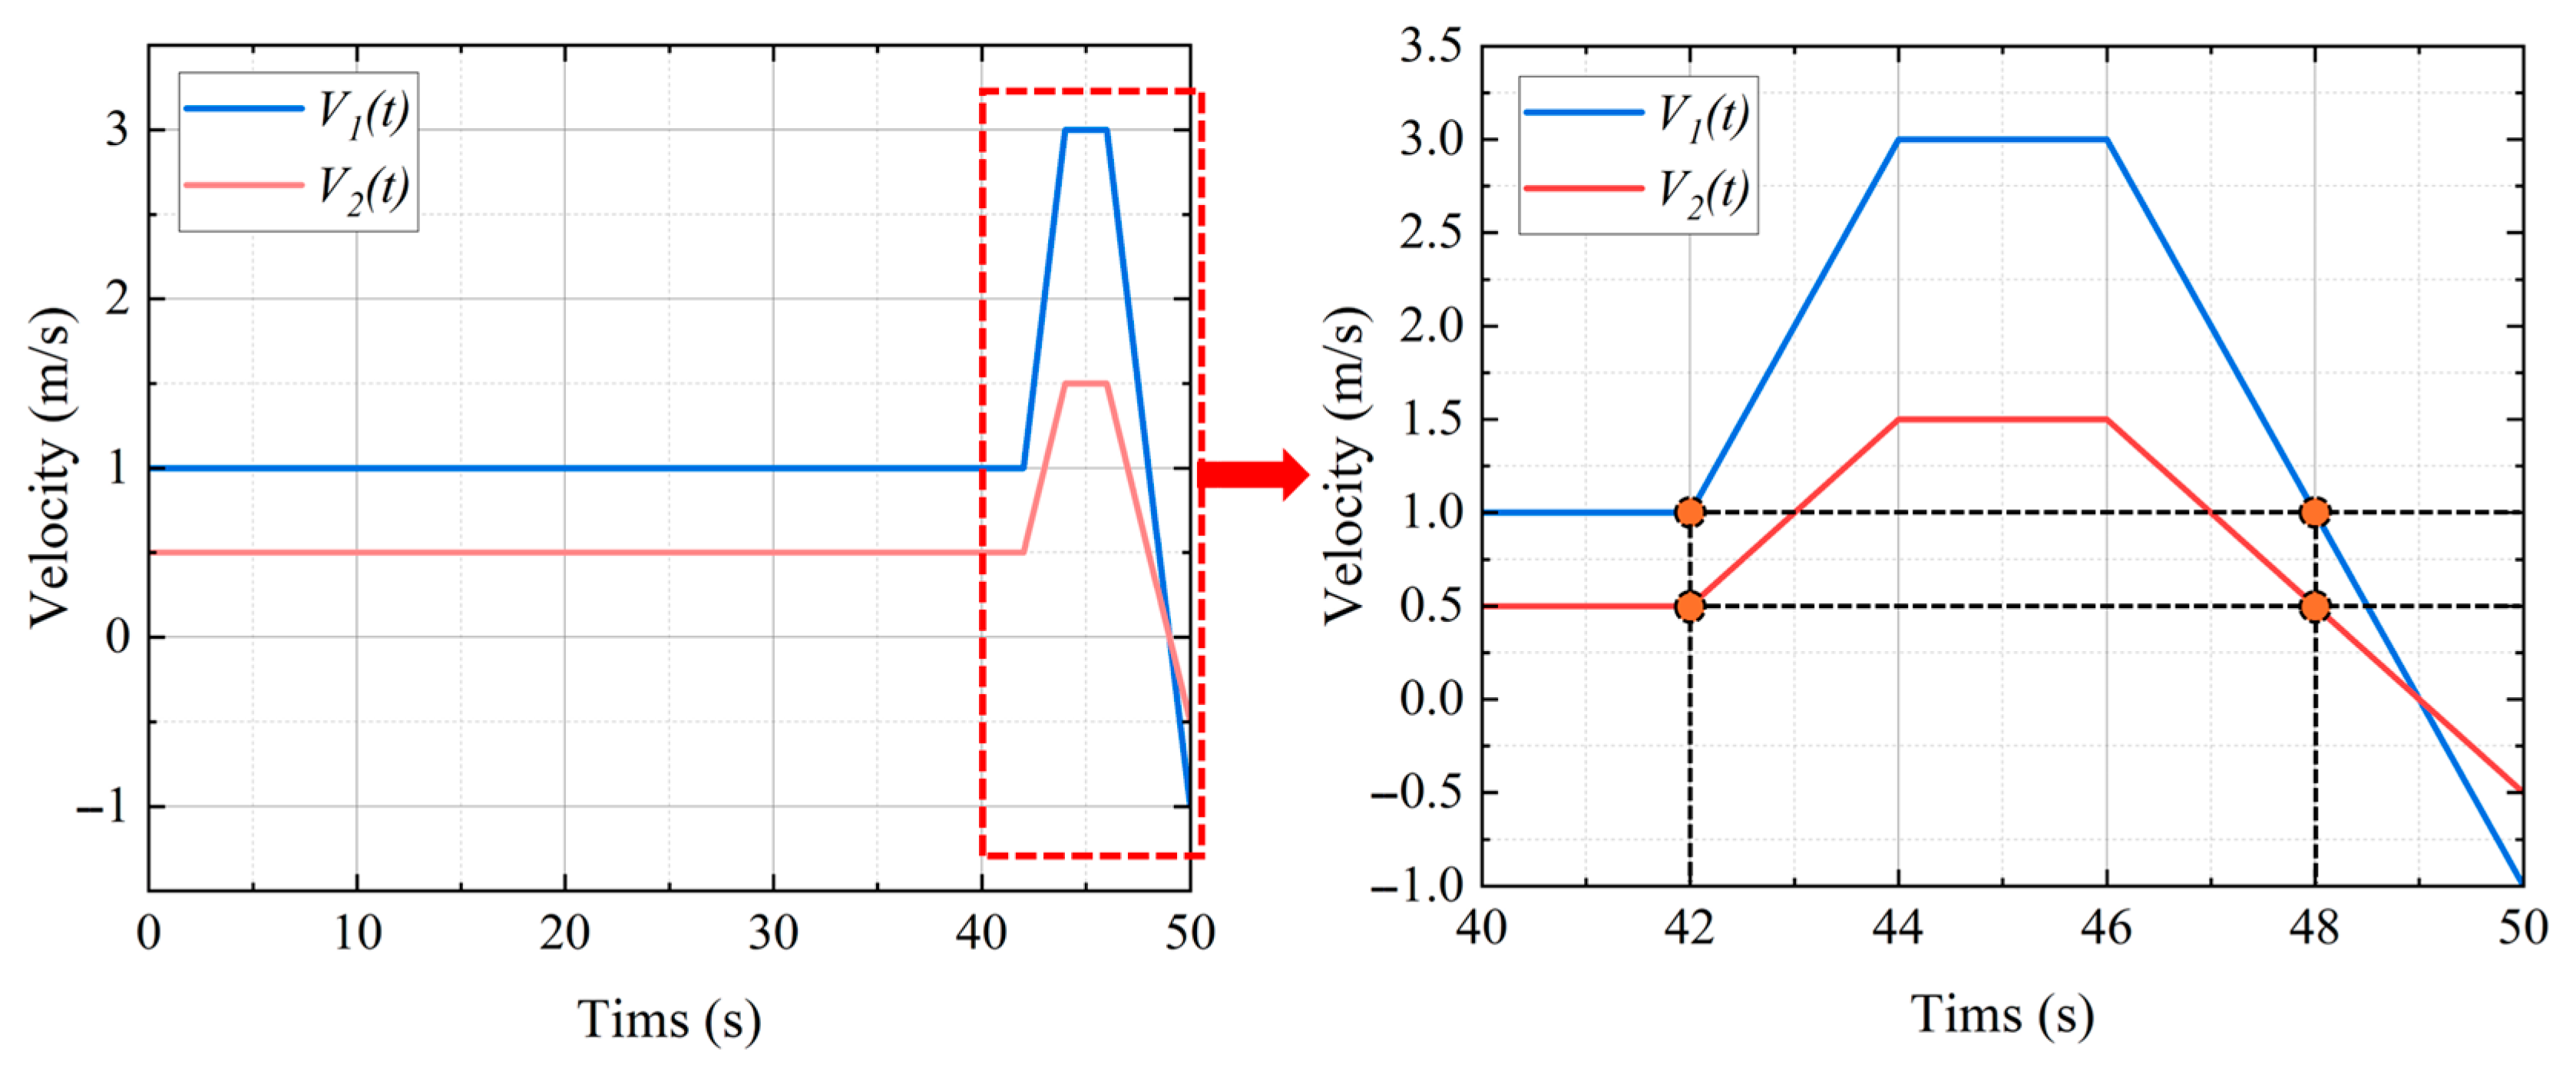
To ensure the accurate calculation of hydrodynamic coefficients, this study divides the simulation process into two phases: the first 40 s is the uniform motion stage, and the final 10 s are the variable speed motion stage. During the uniform phase of motion, the fluid moves at a constant velocity, and the flow field can fully develop and reach a steady state. The recorded hydrodynamic forces are then used to extract the steady-state drag coefficient. During this period, periodic tail vortex shedding occurs in the wake flow of the vehicle, resulting in deviations in time-averaged drag. To enhance the accuracy of drag prediction, it is essential to simulate extended physical time durations and suppress the periodic disturbances induced by tail vortices through time averaging. Subsequently, the vehicle acceleration process is simulated by controlling the flow rate variations during the variable speed phase, which induces a non-stationary fluid response. During this phase, the hydrodynamic forces acting on the vehicle consist of viscous drag and inertial force components, and the added mass is determined based on Equation (9).
To isolate the added mass force acting on the vehicle, velocity fields with different acceleration profiles and identical target velocities are designed. As shown in Figure 5 and defined by Equations (15) and (16), the vehicle was first subjected to a uniform inflow to obtain the steady-state drag force averaged over time. Subsequently, the vehicle underwent acceleration and deceleration phases, during which the decelerating motion matched the instantaneous velocity of the uniform inflow. The corresponding hydrodynamic force was recorded and the added mass force was derived by comparing the results of these two conditions. The velocity V 1 ( t ) has an initial velocity of 1 m/s and an acceleration a of 1 m/s2 and the velocity V 2 ( t ) has an initial velocity of 0.5 m/s and an acceleration a of 0.5 m/s2.
V 1 ( t ) = 1 0 t < 42 t 41 42 t < 44 3 44 t < 46 t + 49 46 t < 50
V 2 ( t ) = 0.5 0 t < 42 0.5 t 20.5 42 t < 44 3 44 t < 46 0.5 t + 24.5 46 t < 50

3.2. Validation of Numerical Method

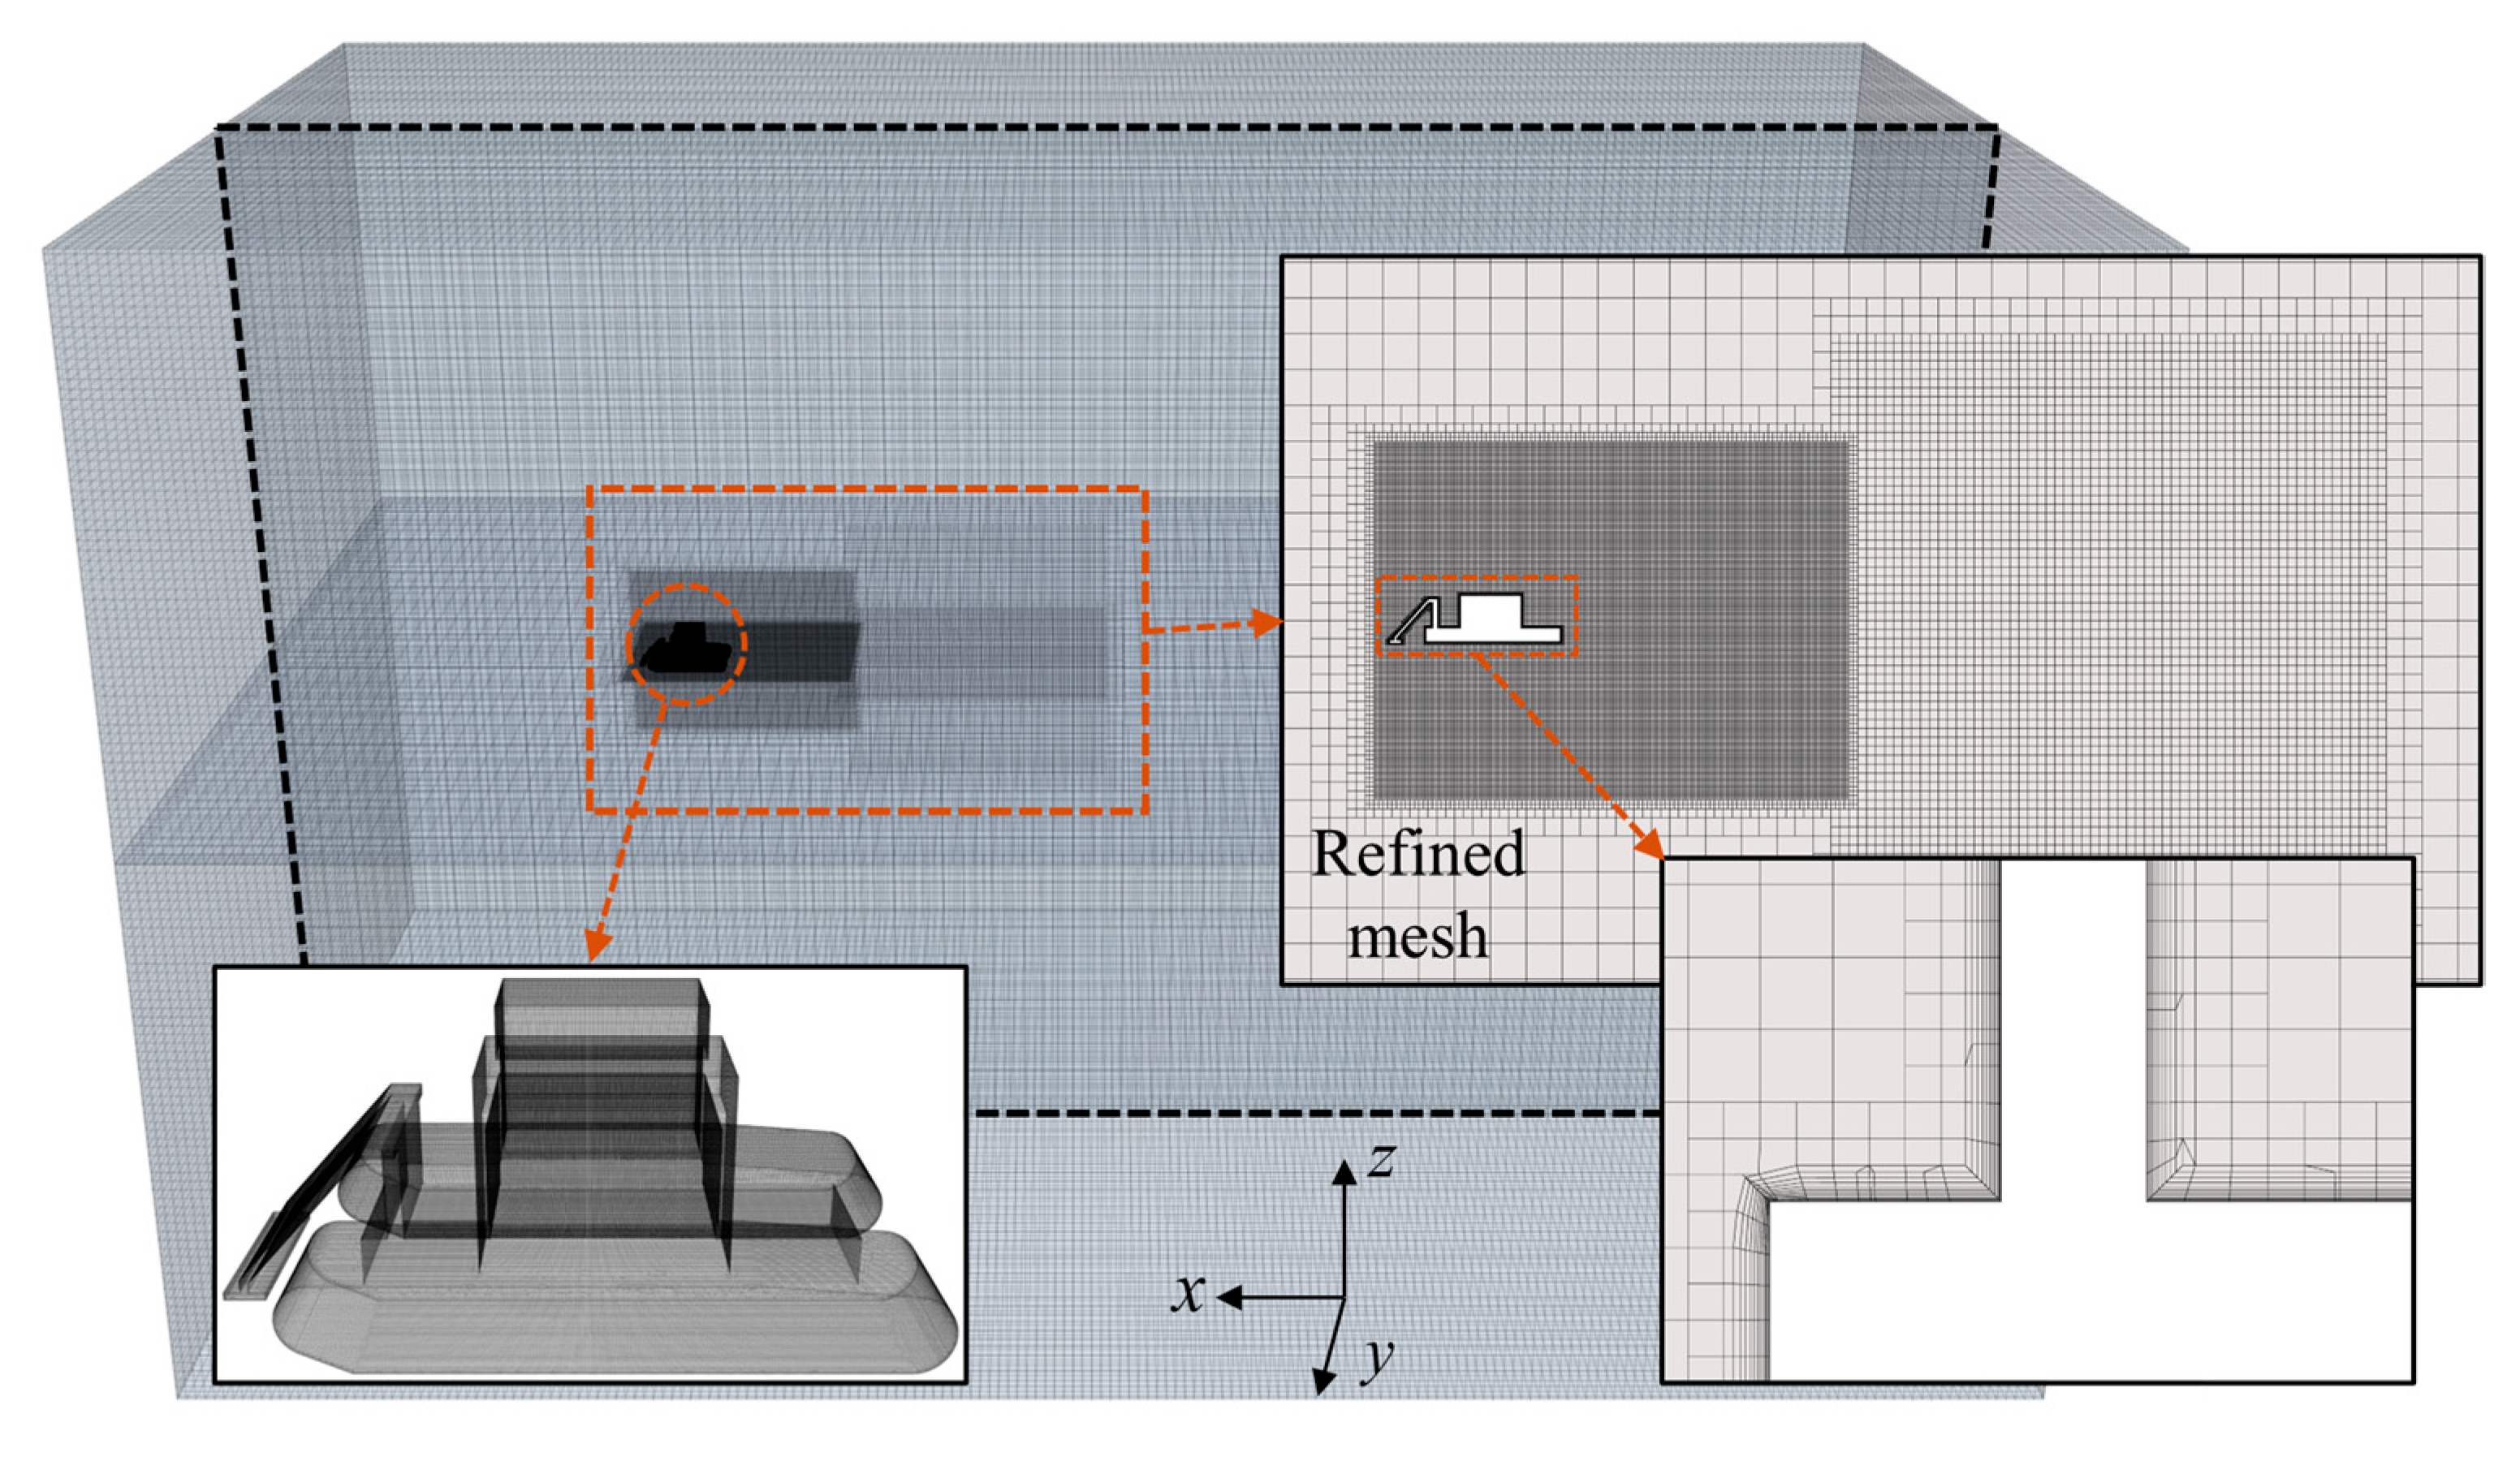
As shown in Figure 6, the mesh generation scheme adopted in the simulation includes a two-level nested refinement strategy downstream of the body to ensure the adequate development of wake structures. The near-wake region, with dimensions of 2.5L × 3D × 3D, is used to capture the initial flow separation and vortex formation. The far-wake region, extending over 3L × 5D × 5D, is designed to resolve the evolution and dissipation of the wake vortices. Local mesh controls are applied within each region to progressively refine the mesh, thereby achieving a balance between solution accuracy and overall computational cost.
To achieve a reasonable balance between computational accuracy and efficiency in resolving the near-wall flow behavior dominated by viscous effects, the all y + wall treatment was employed in this study. The dimensionless wall distance y + near the vehicle surface was maintained at approximately 30 to ensure the validity of the wall function approach. The thickness of the first prism layer was set to 0.00167 m in order to adequately resolve the boundary layer near the wall. To ensure numerical stability and temporal accuracy, the time step was determined based on the Courant–Friedrichs–Lewy (CFL) condition. Given an inflow velocity of 1 m/s and the minimum cell size, a target Courant number below 1 was established, resulting in a calculated maximum time step of 0.00167 s. Consequently, a conservative time step of 0.001 s was adopted for the simulation, corresponding to a CFL number of approximately 0.6.
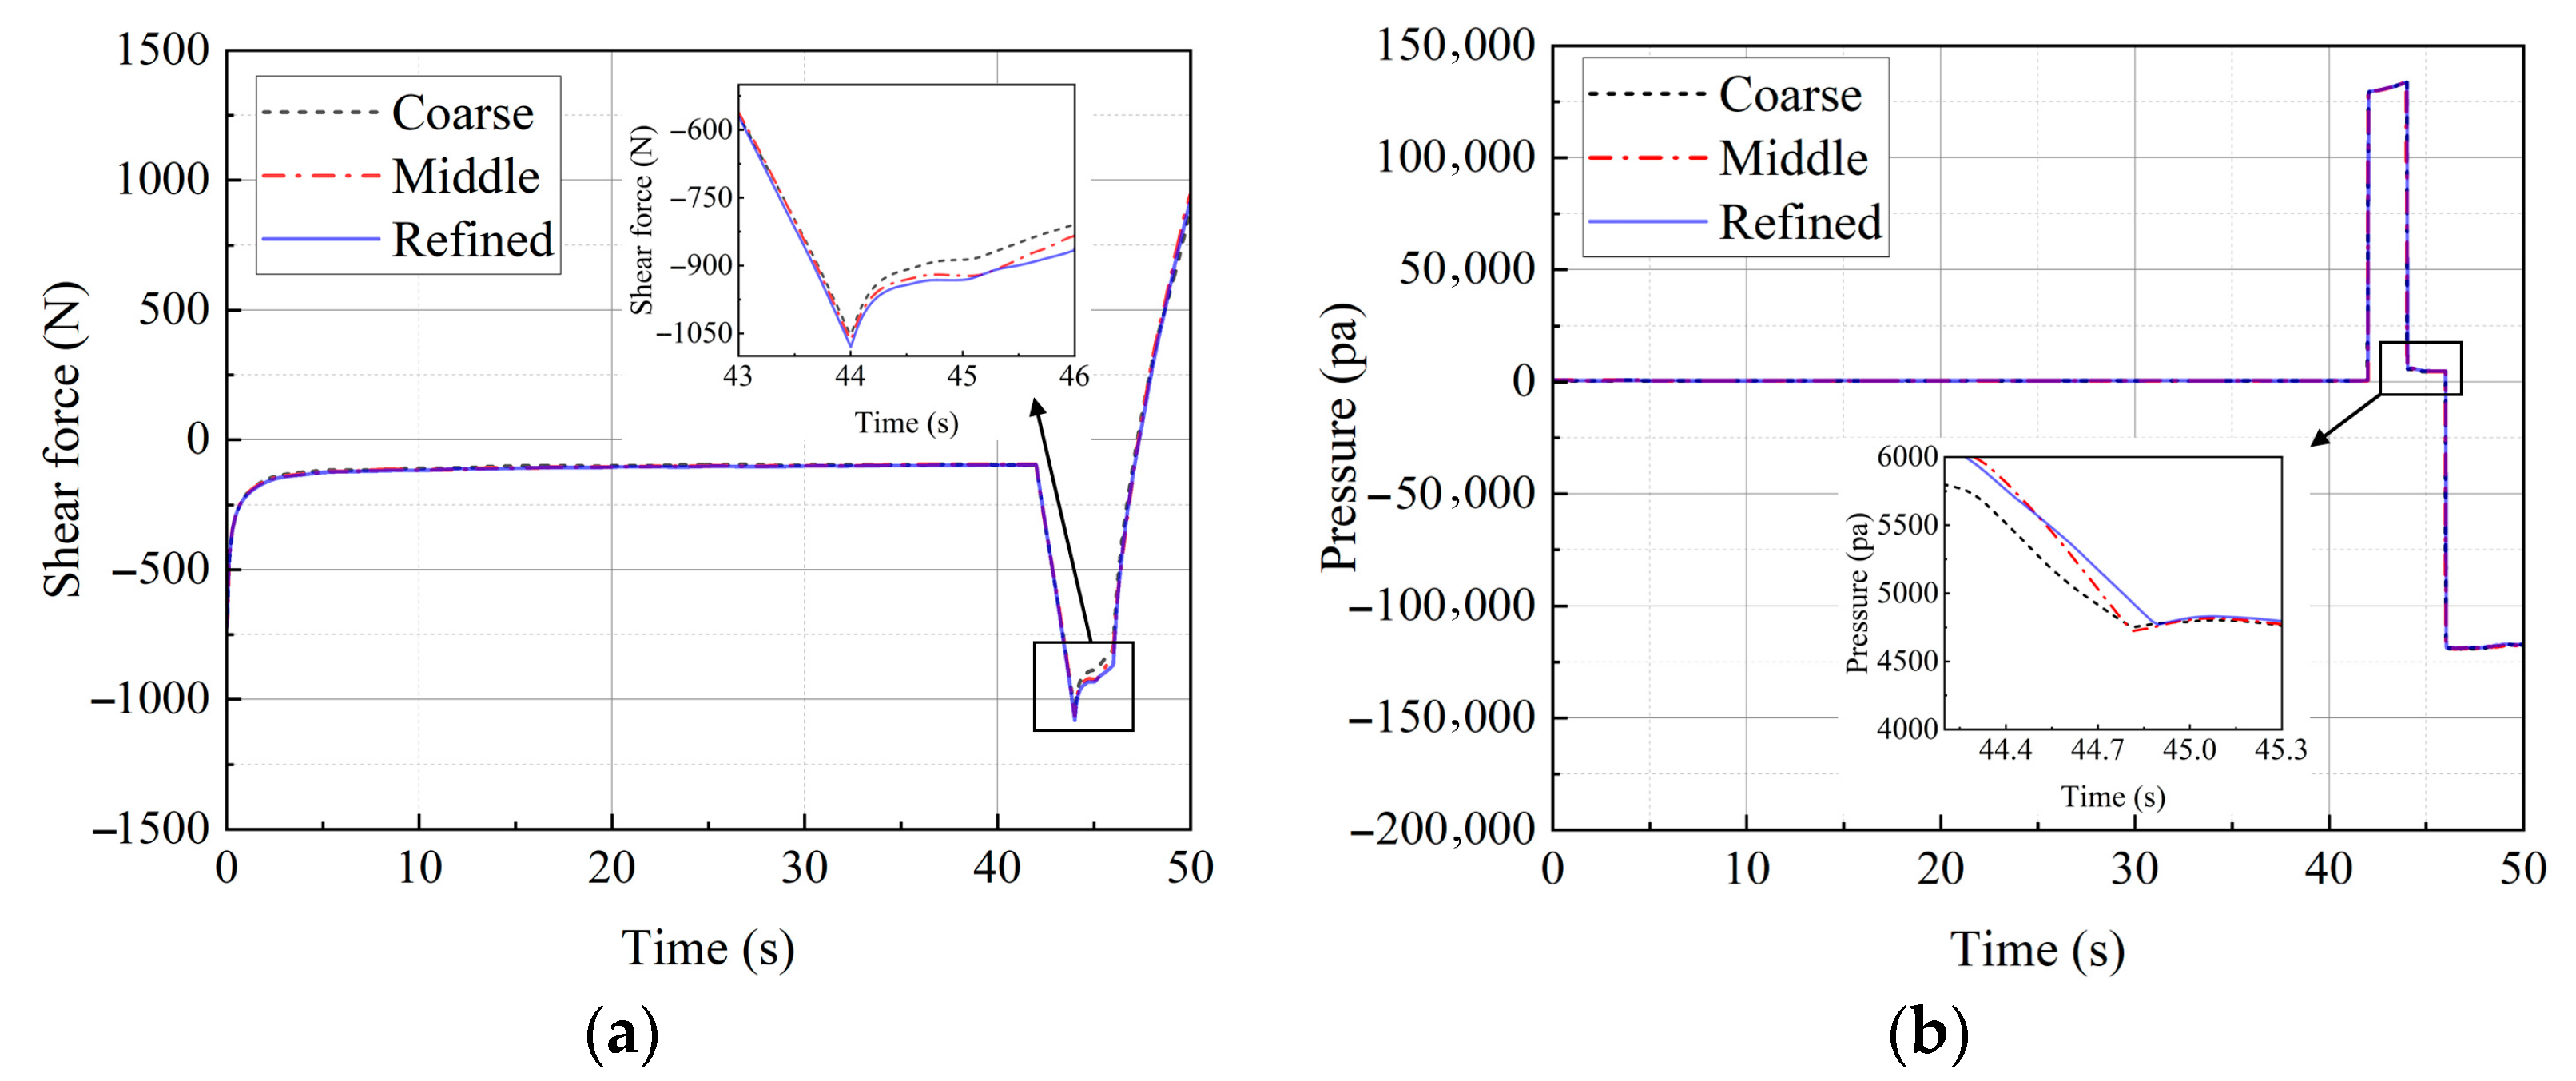
To ensure the accuracy and reliability of the numerical simulations, three mesh configurations with different resolutions were constructed by refining the wake region. Specifically, the coarse mesh consisted of approximately 6 million cells, the middle mesh comprised around 10 million cells, and the refined mesh included roughly 15 million cells. The comparison of simulation results under different mesh densities is presented in Figure 7. The coarse mesh overestimates the shear force magnitude, indicating inadequate resolution to accurately capture wake dynamics and boundary layer development. In contrast, the middle and refined meshes produce results that are in close agreement over the entire simulation period, with only minor discrepancies observed in regions of high gradient. The coarse mesh is unable to resolve these transient phenomena with sufficient accuracy, as evidenced by the over-smoothing of pressure peaks and delayed onset. The middle mesh accurately tracks the refined mesh in both peak amplitude and timing, demonstrating that it offers adequate resolution for capturing pressure transients.
The discrepancies between the coarse and refined results reflect discretization errors arising from insufficient spatial resolution in regions with high flow gradients. The convergence of both shear force and pressure profiles from the middle mesh toward those of the refined mesh confirms grid convergence. Given that the relative difference between the middle and refined meshes remains within an acceptable range, this indicates that the middle mesh achieves a suitable balance between computational cost and solution accuracy. Balancing computational accuracy and efficiency, the middle mesh was selected for all subsequent simulations in this study.
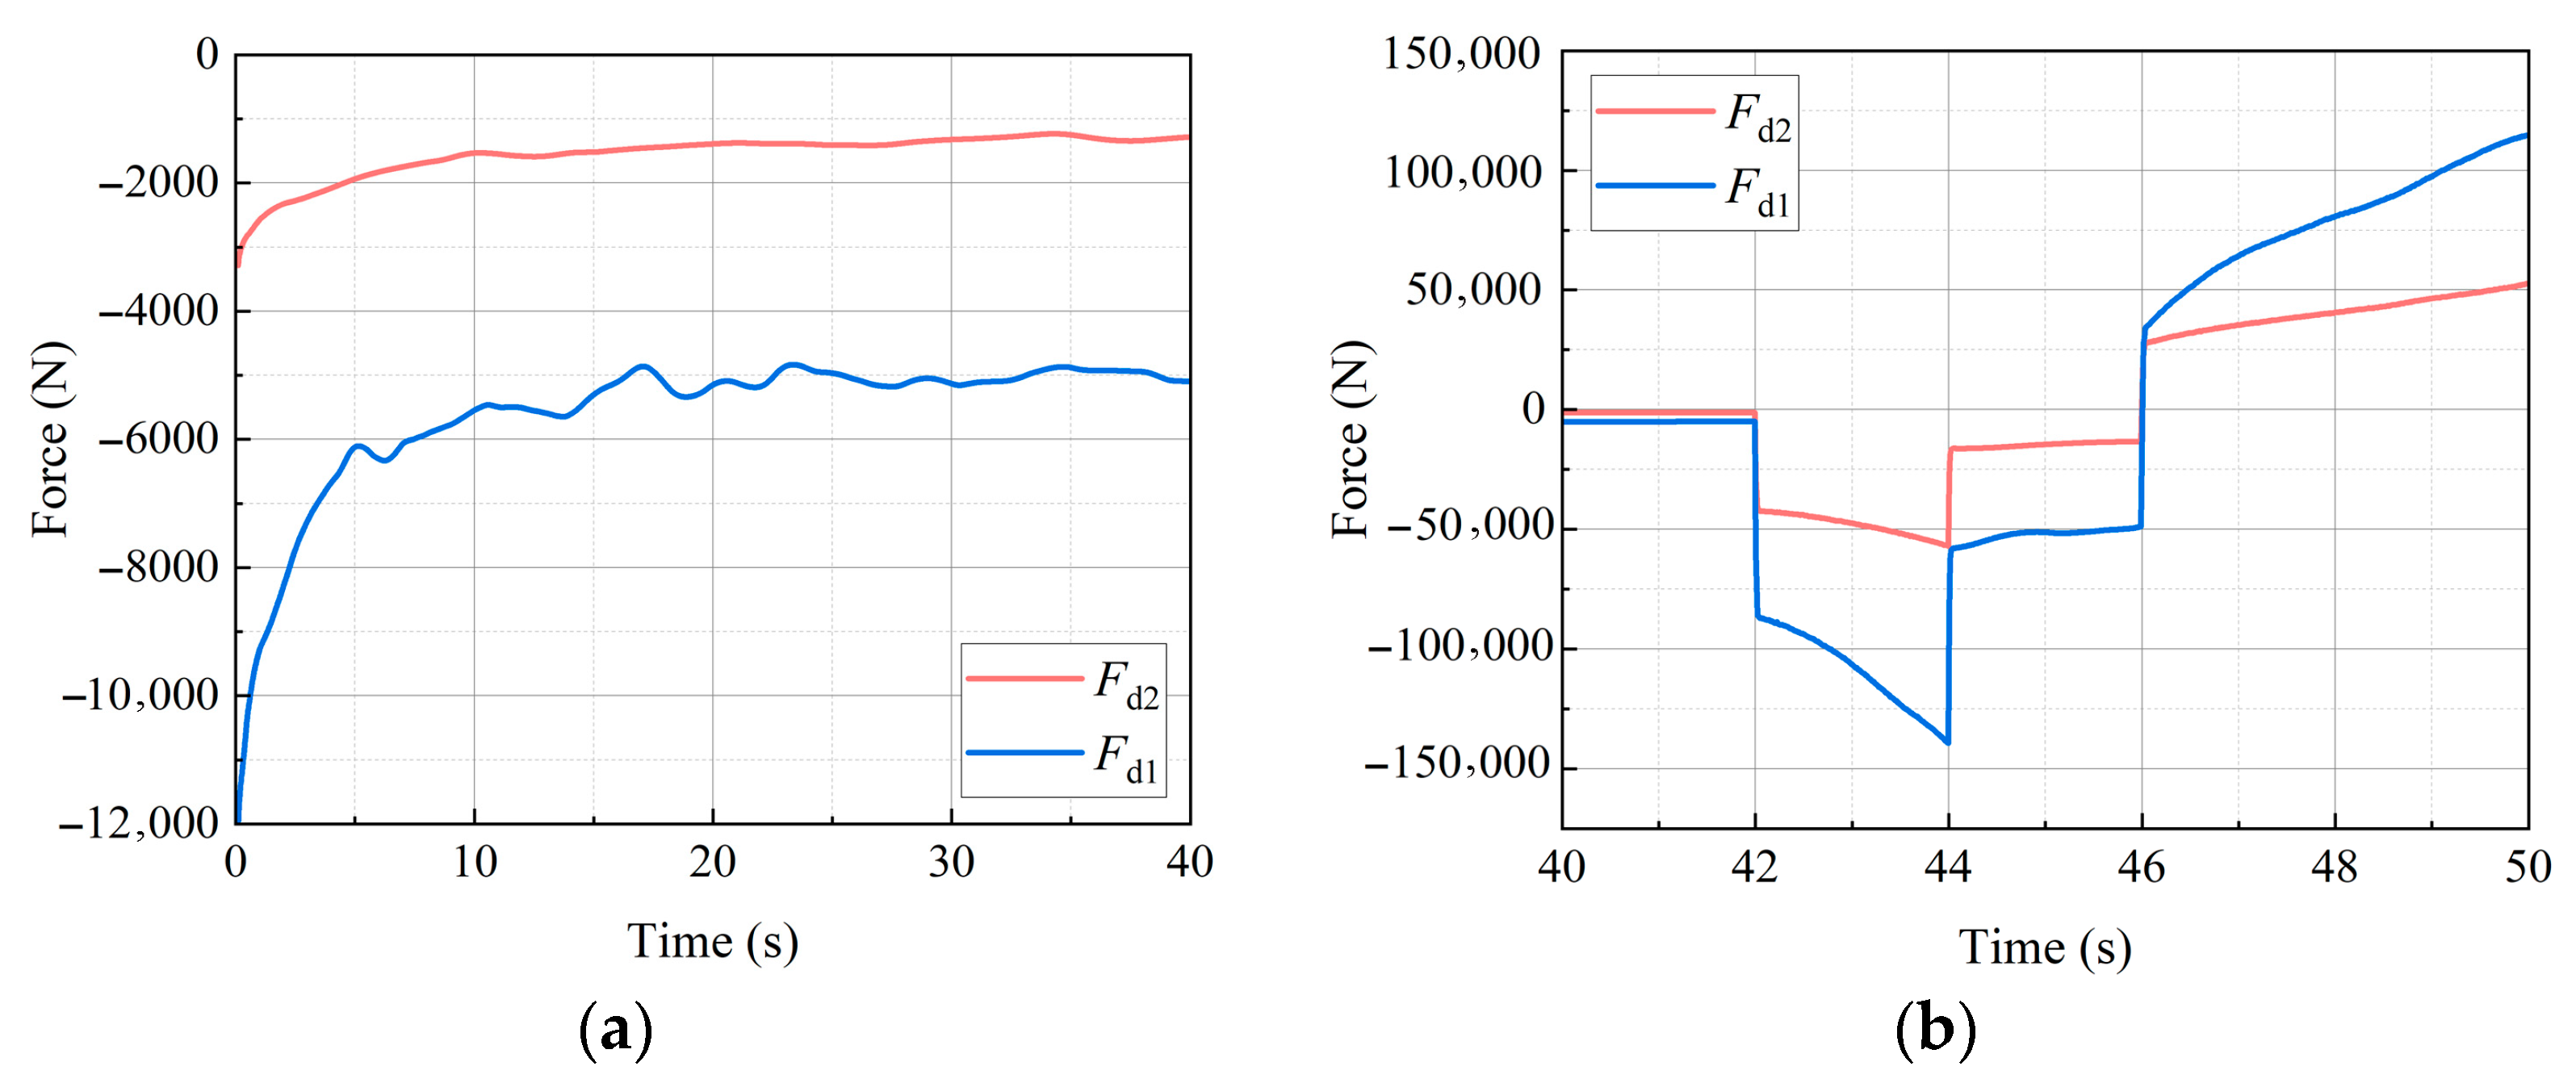
As shown in Figure 8, the drag force curves of the vehicle under different flow velocities are compared, where drag force F d 1 corresponds to flow velocity V 1 ( t ) , and F d 2 corresponds to flow velocity V 2 ( t ) . By applying the force decomposition method under different acceleration conditions to separate the viscous and inertial components, the added mass is extracted. When the acceleration is a = 1 m/s2, the added mass is calculated to be 85,761.24 kg, whereas at a = 0.5 m/s2, it is 83,908.75 kg. The relative difference between the two results is approximately 2.16%, indicating that the influence of acceleration variation in the added mass estimation is minimal. Therefore, the subsequent analysis in this study adopts the flow velocity V 1 ( t ) as the reference condition for the hydrodynamic field.

4. Results and Discussion

4.1. Analysis of the Transverse Drag Force

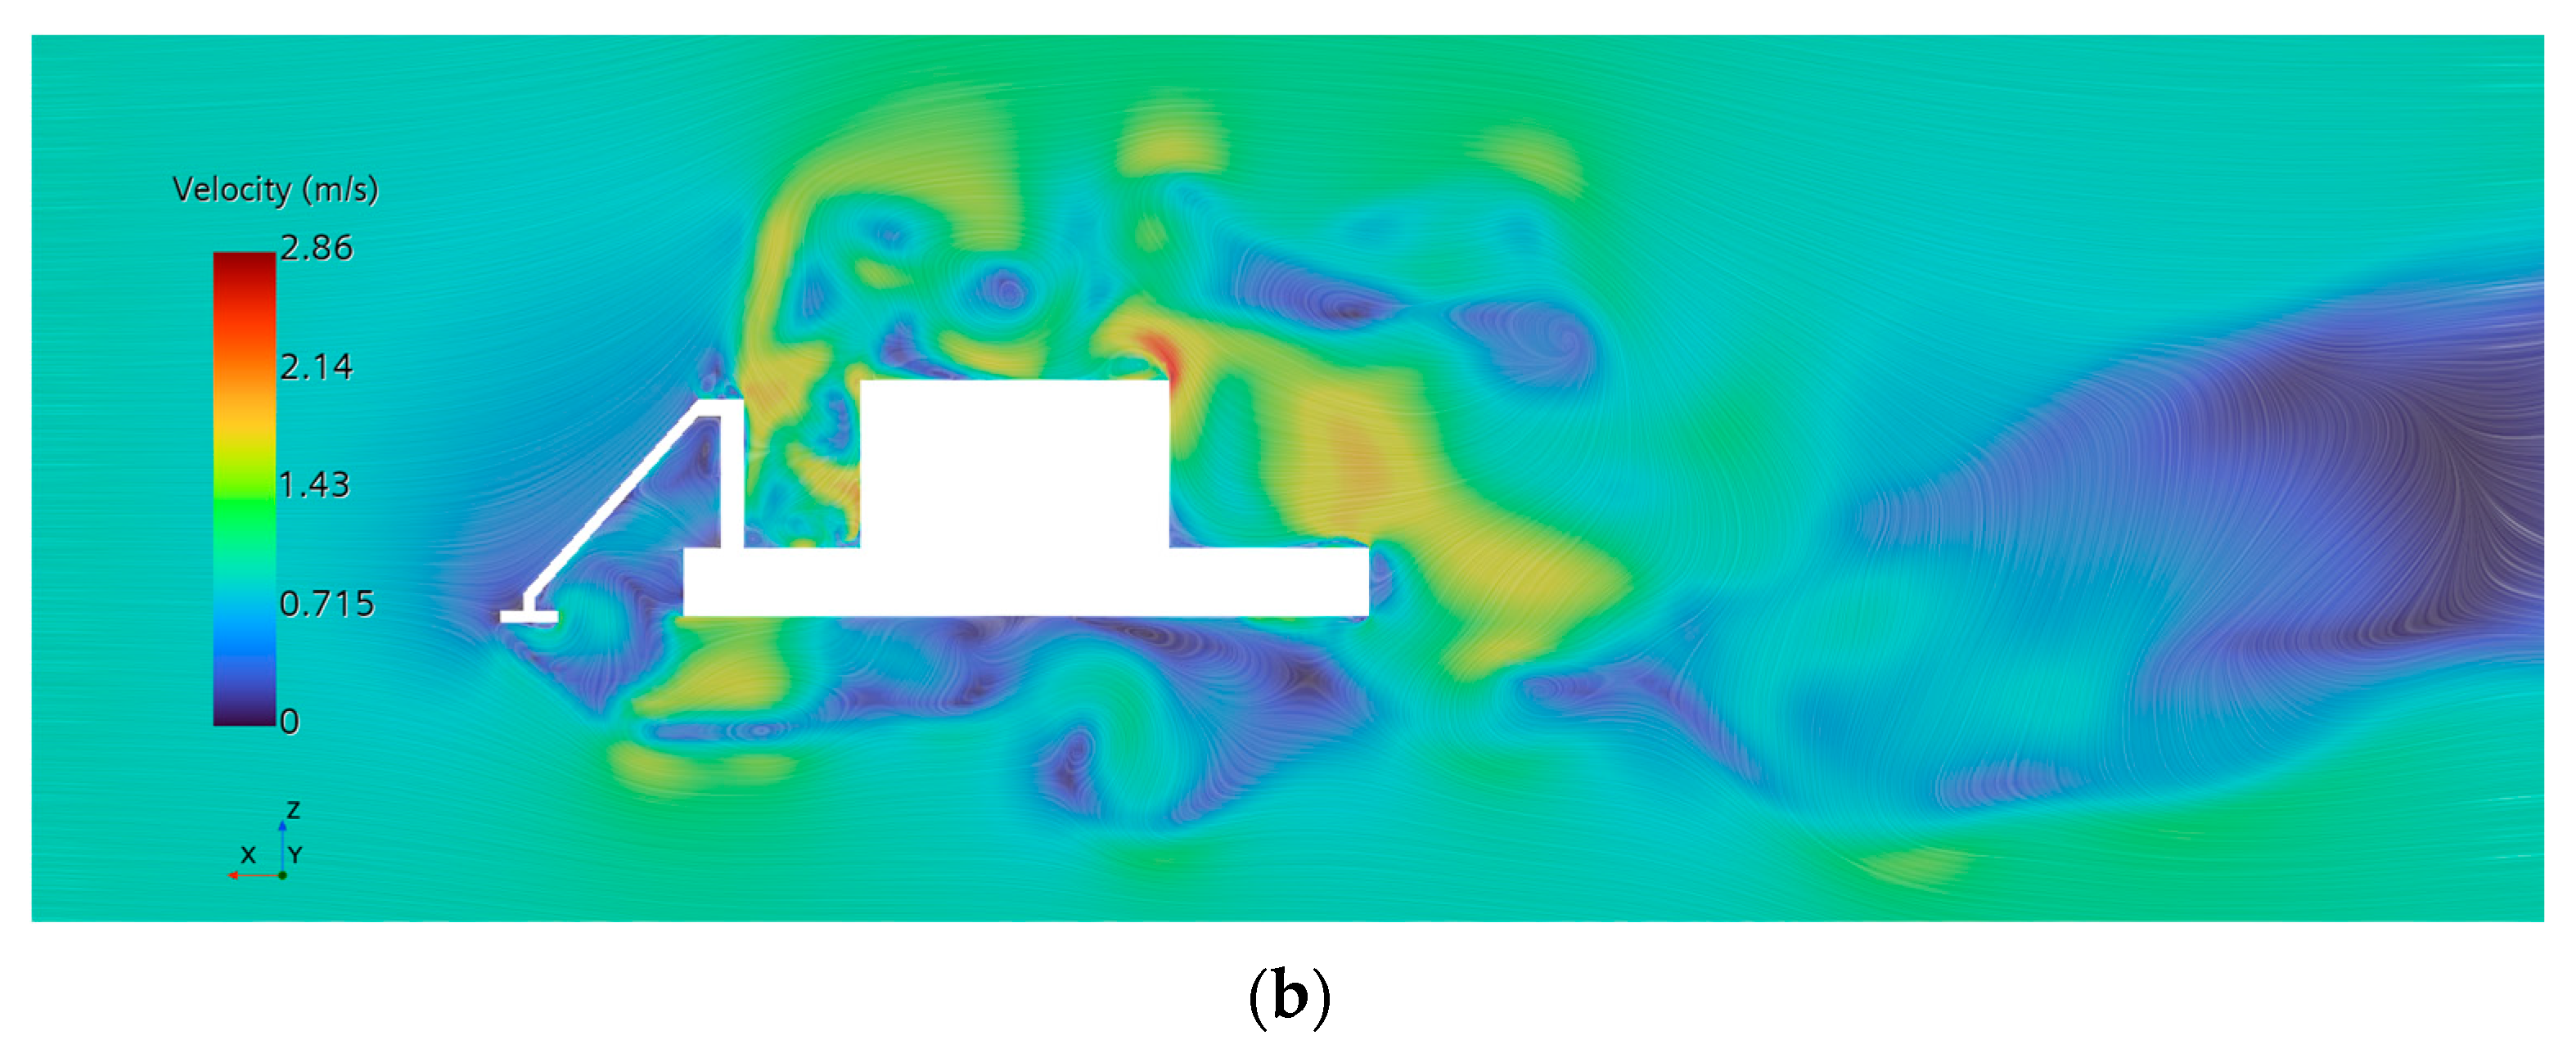
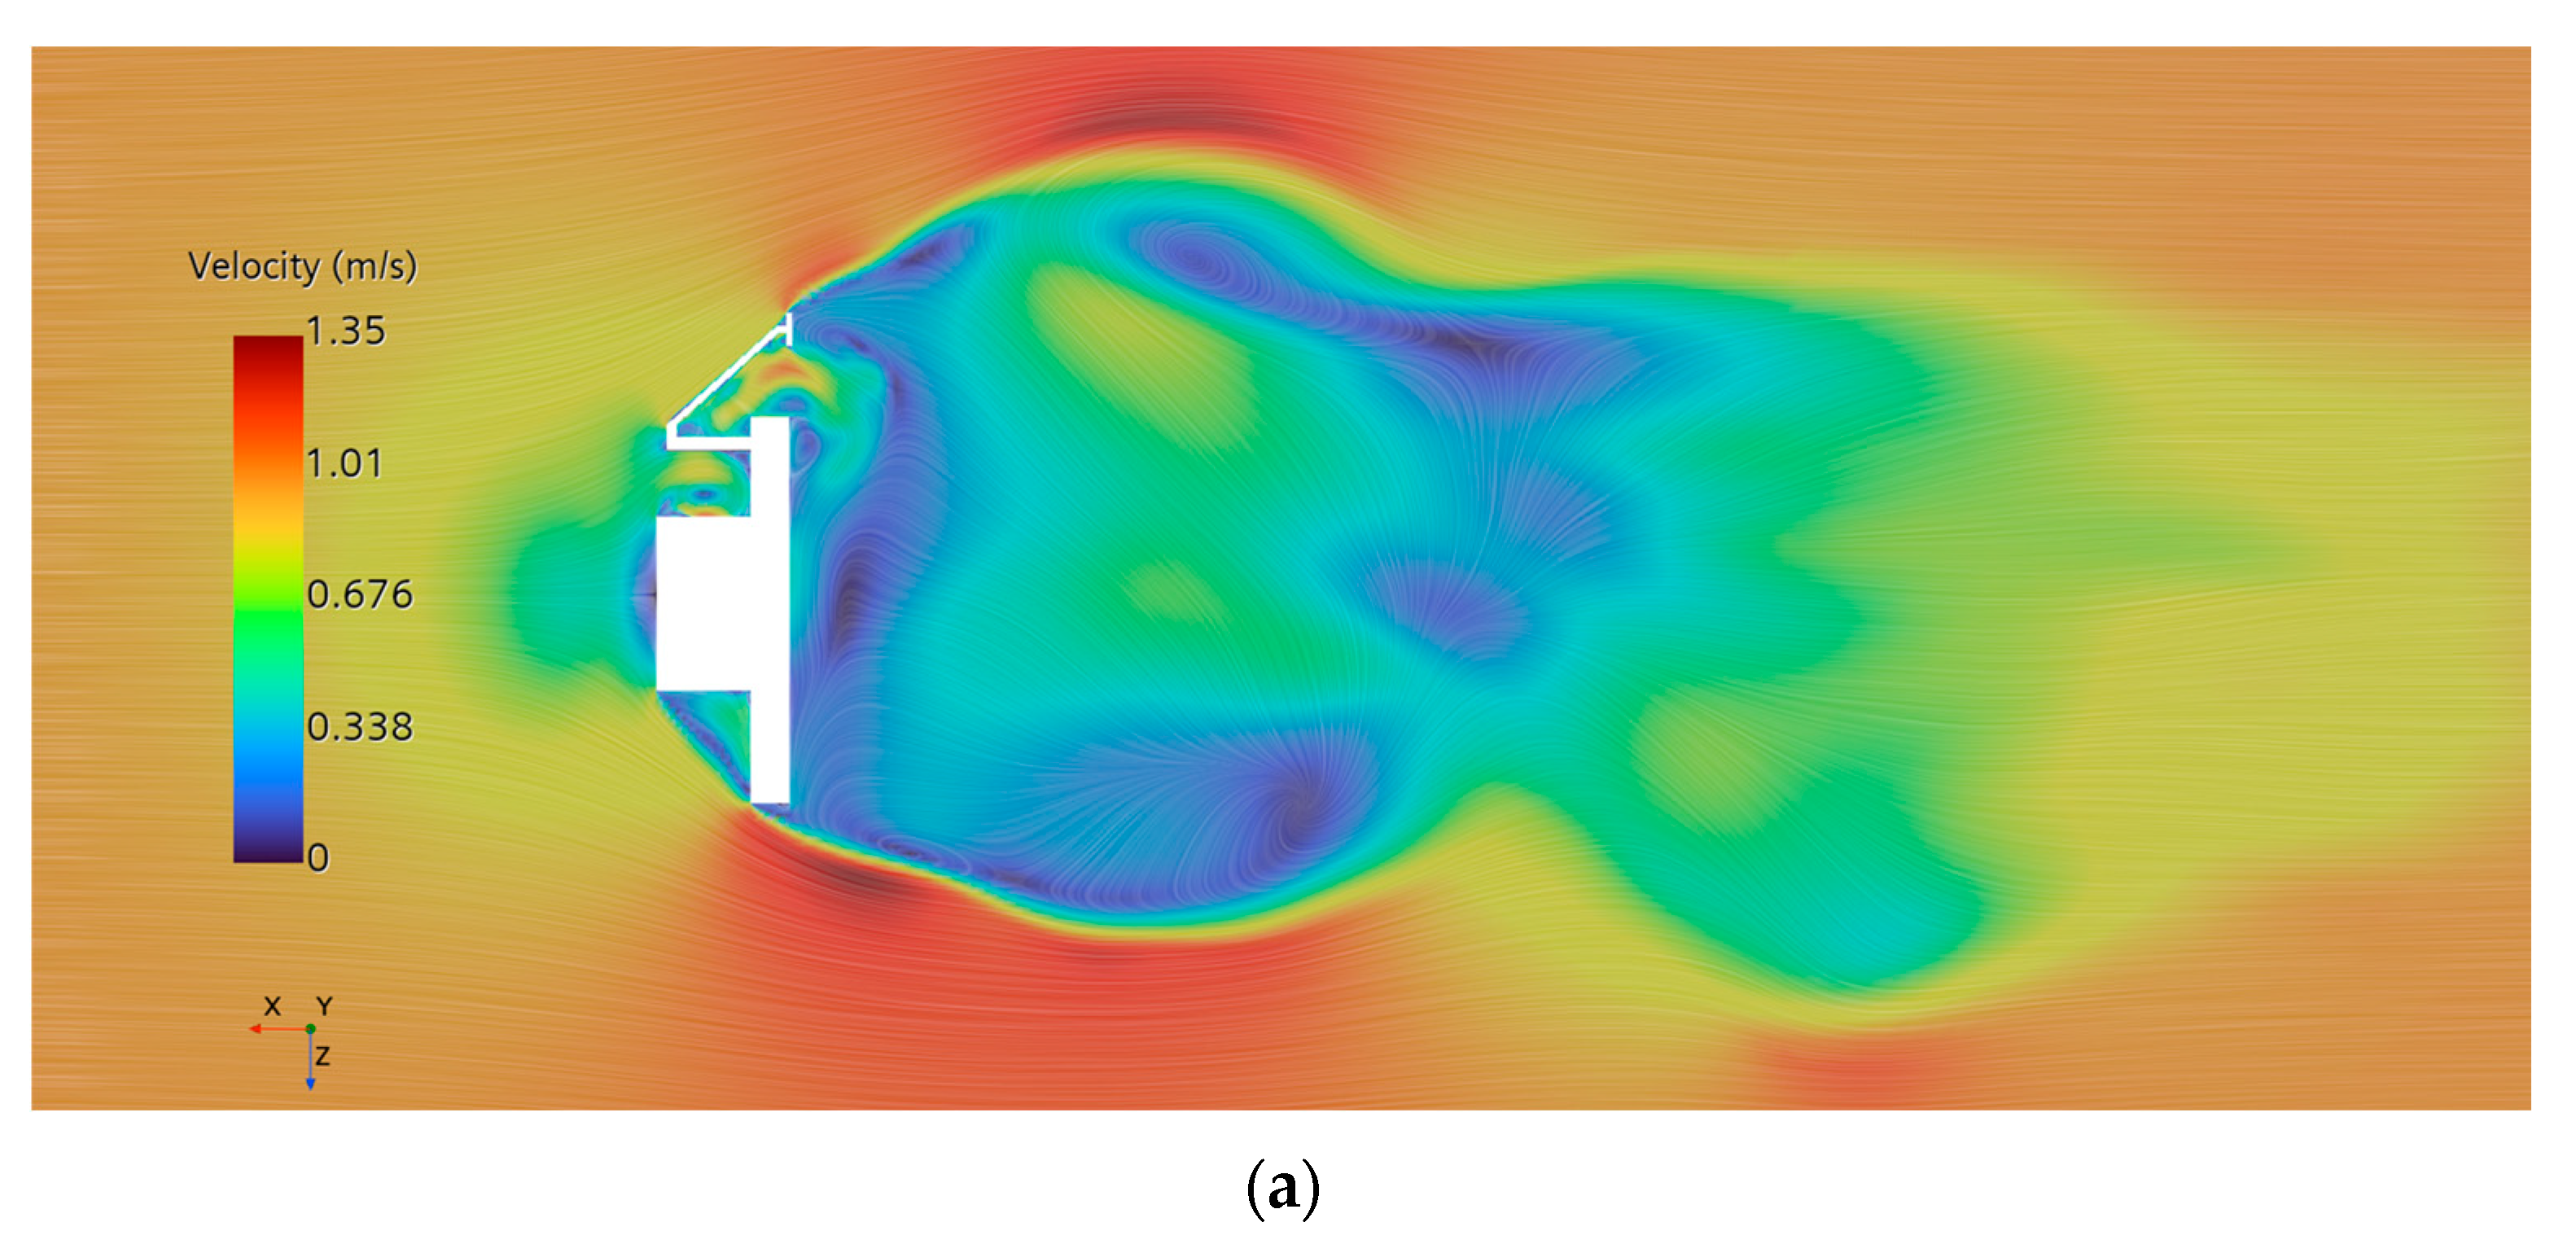
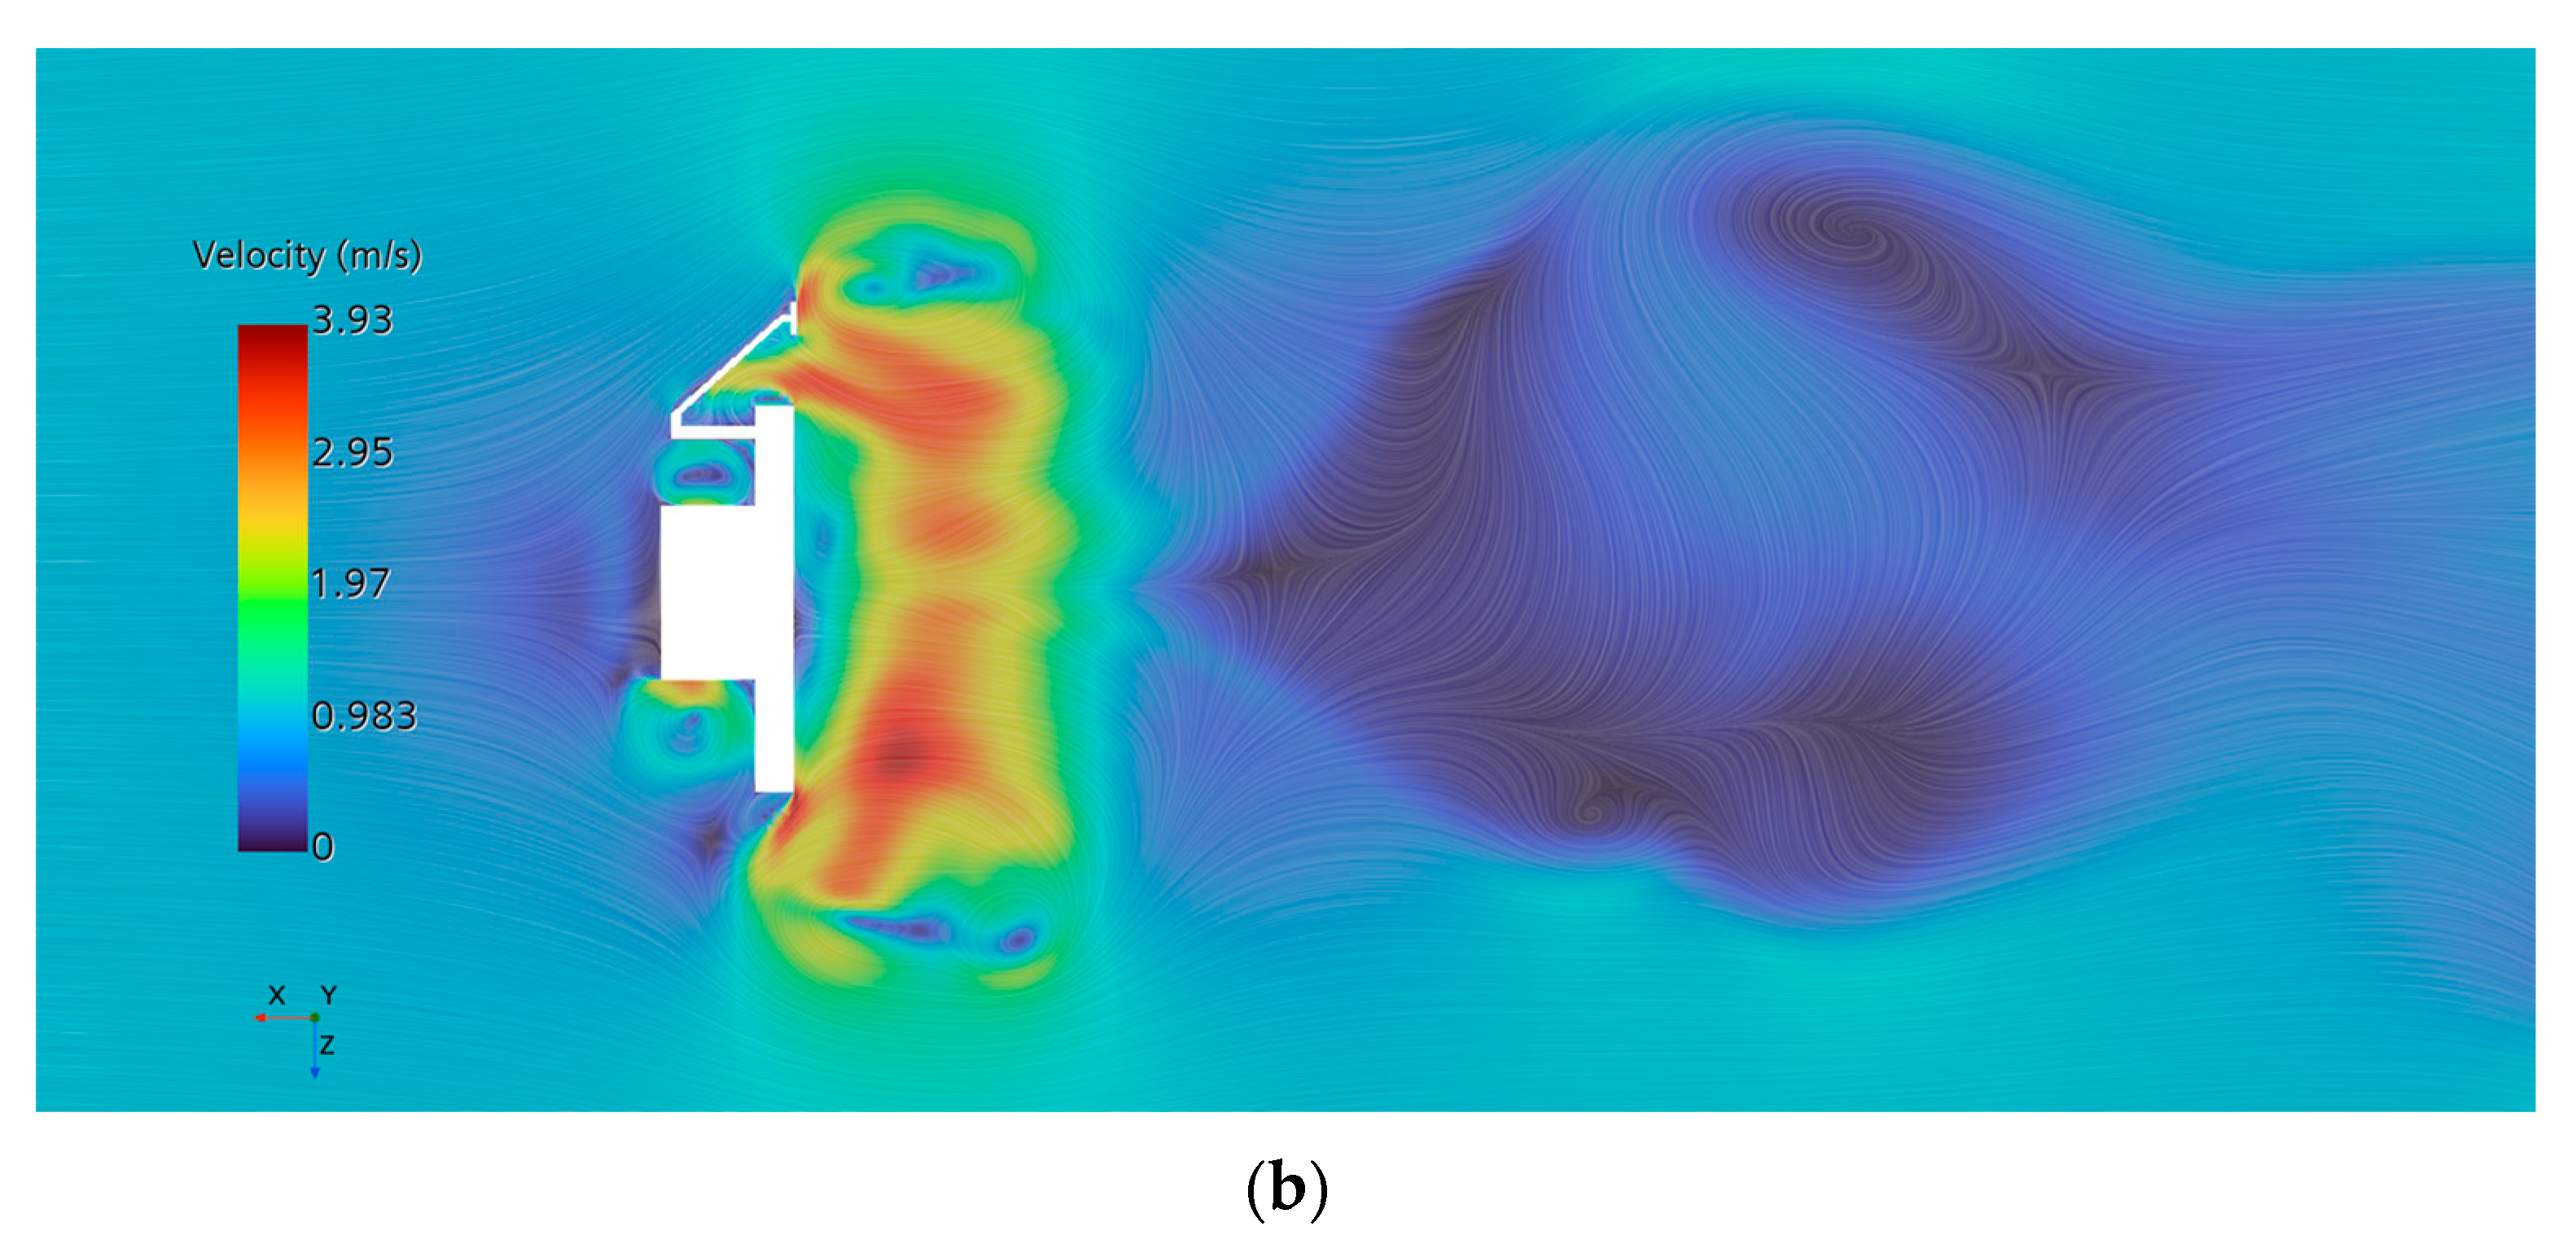
The DSMV exhibits significant differences in wake structure between uniform motion at 1 m/s and deceleration to 1 m/s. During steady motion, the flow remains relatively stable, characterized by the formation of regular vortex structures in the wake region, with the velocity field gradually reaching a stable state, as shown in Figure 9a. In contrast, during deceleration, changes in vehicle speed induce transient and unsteady interactions between the fluid and the vehicle body, leading to irregular vortex shedding and greater fluctuations within the velocity field, as illustrated in Figure 9b. These variations are primarily attributed to the inertial response of the fluid and the transient effects caused by changes in the vehicle’s speed on the surrounding flow field.
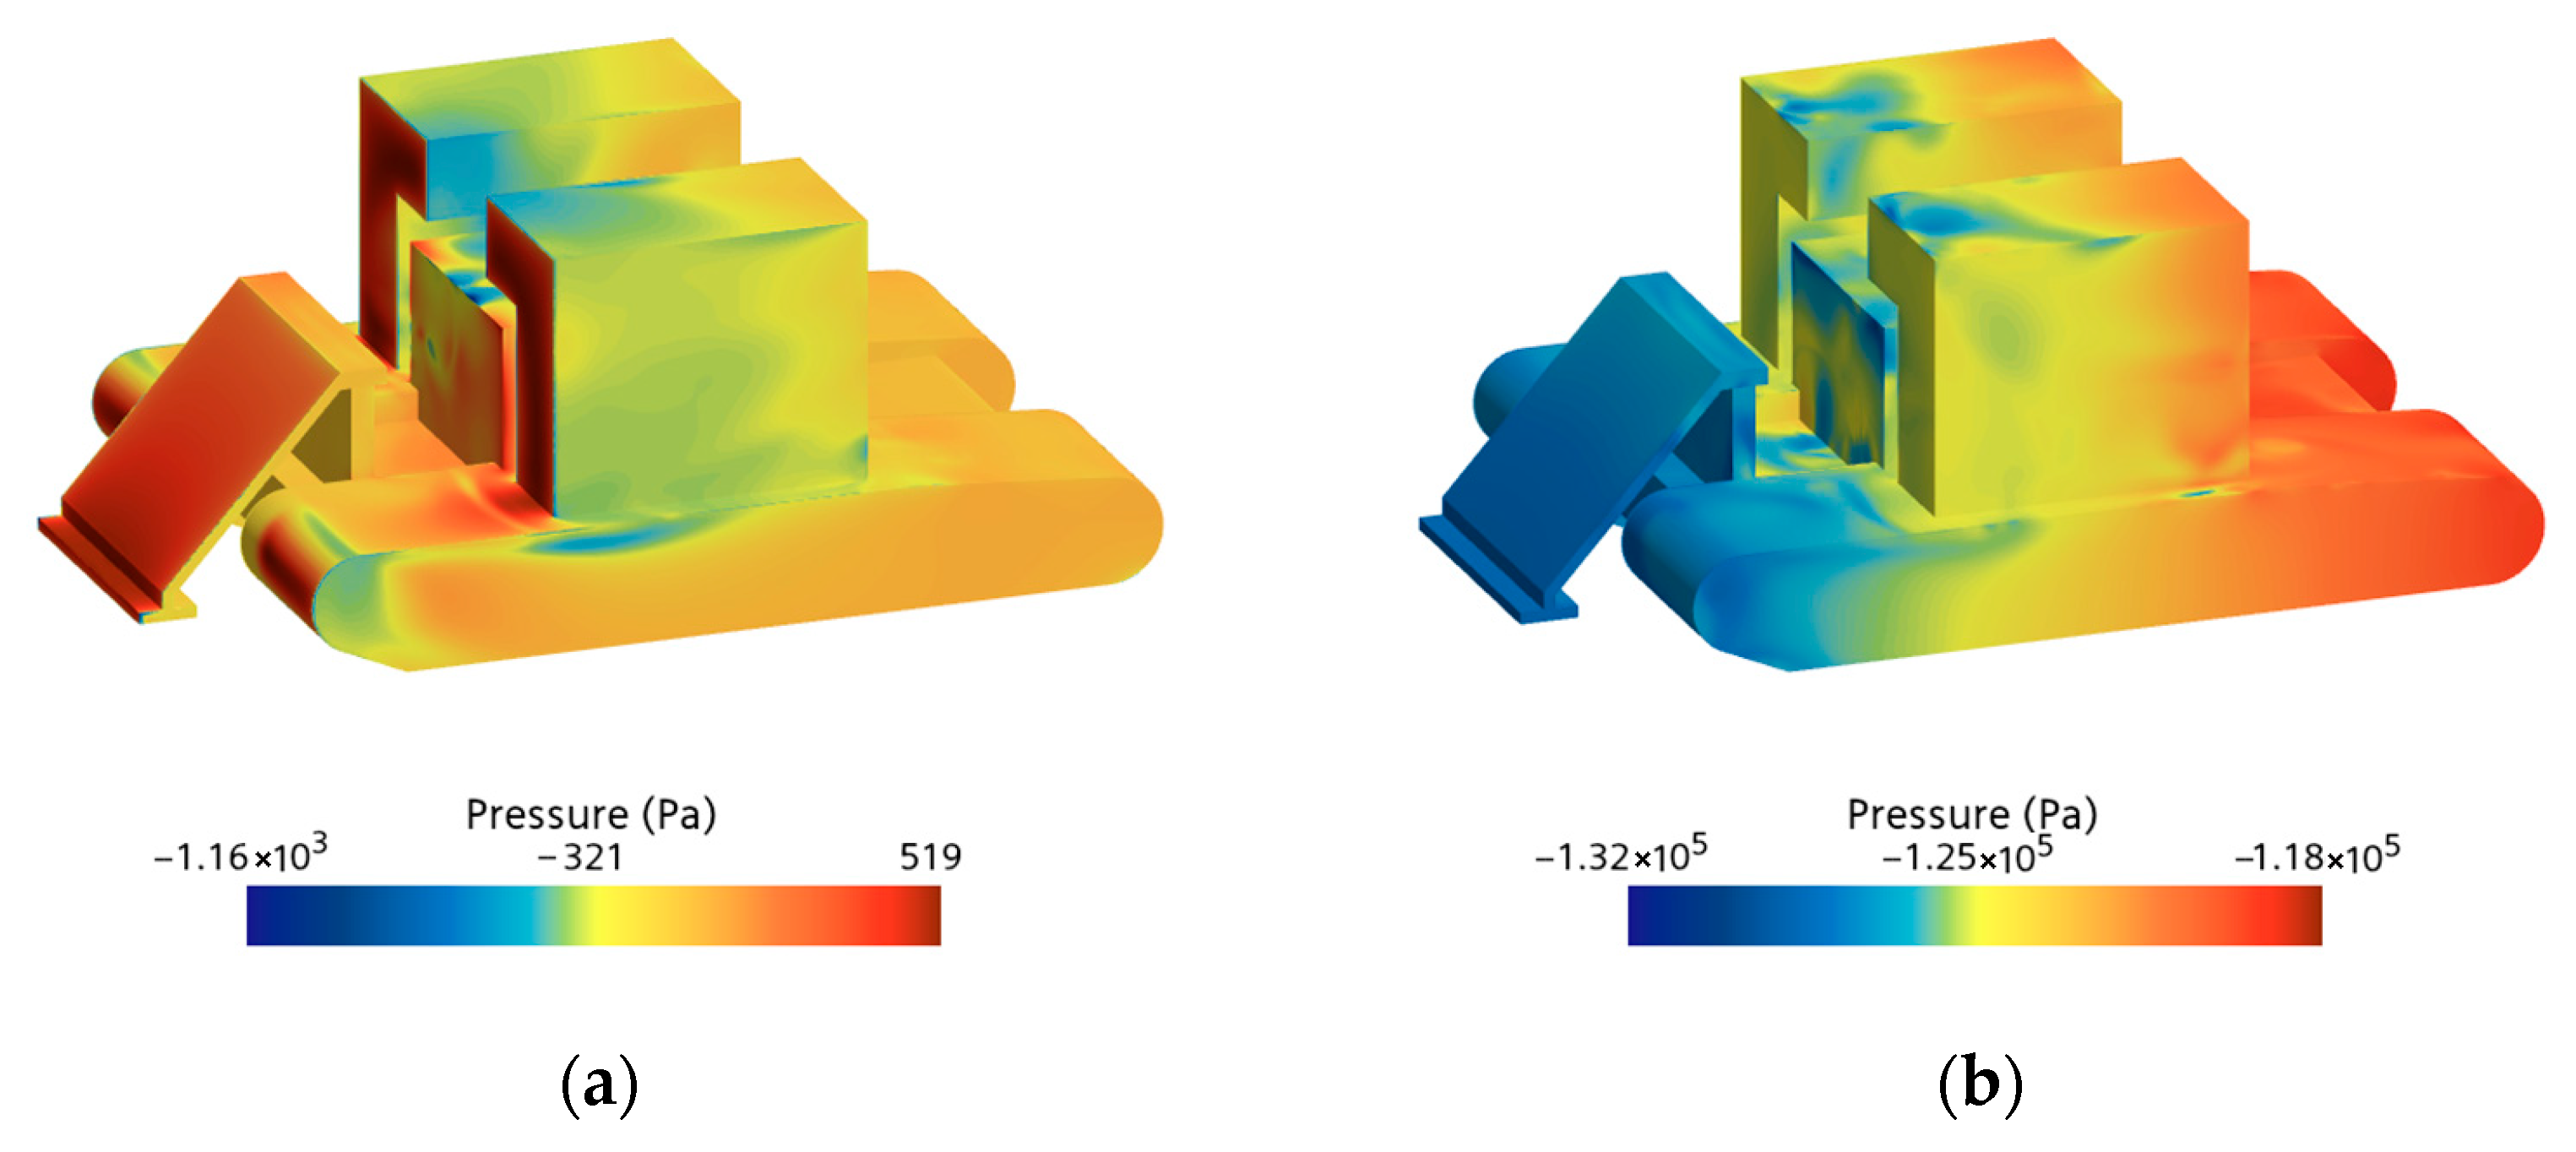
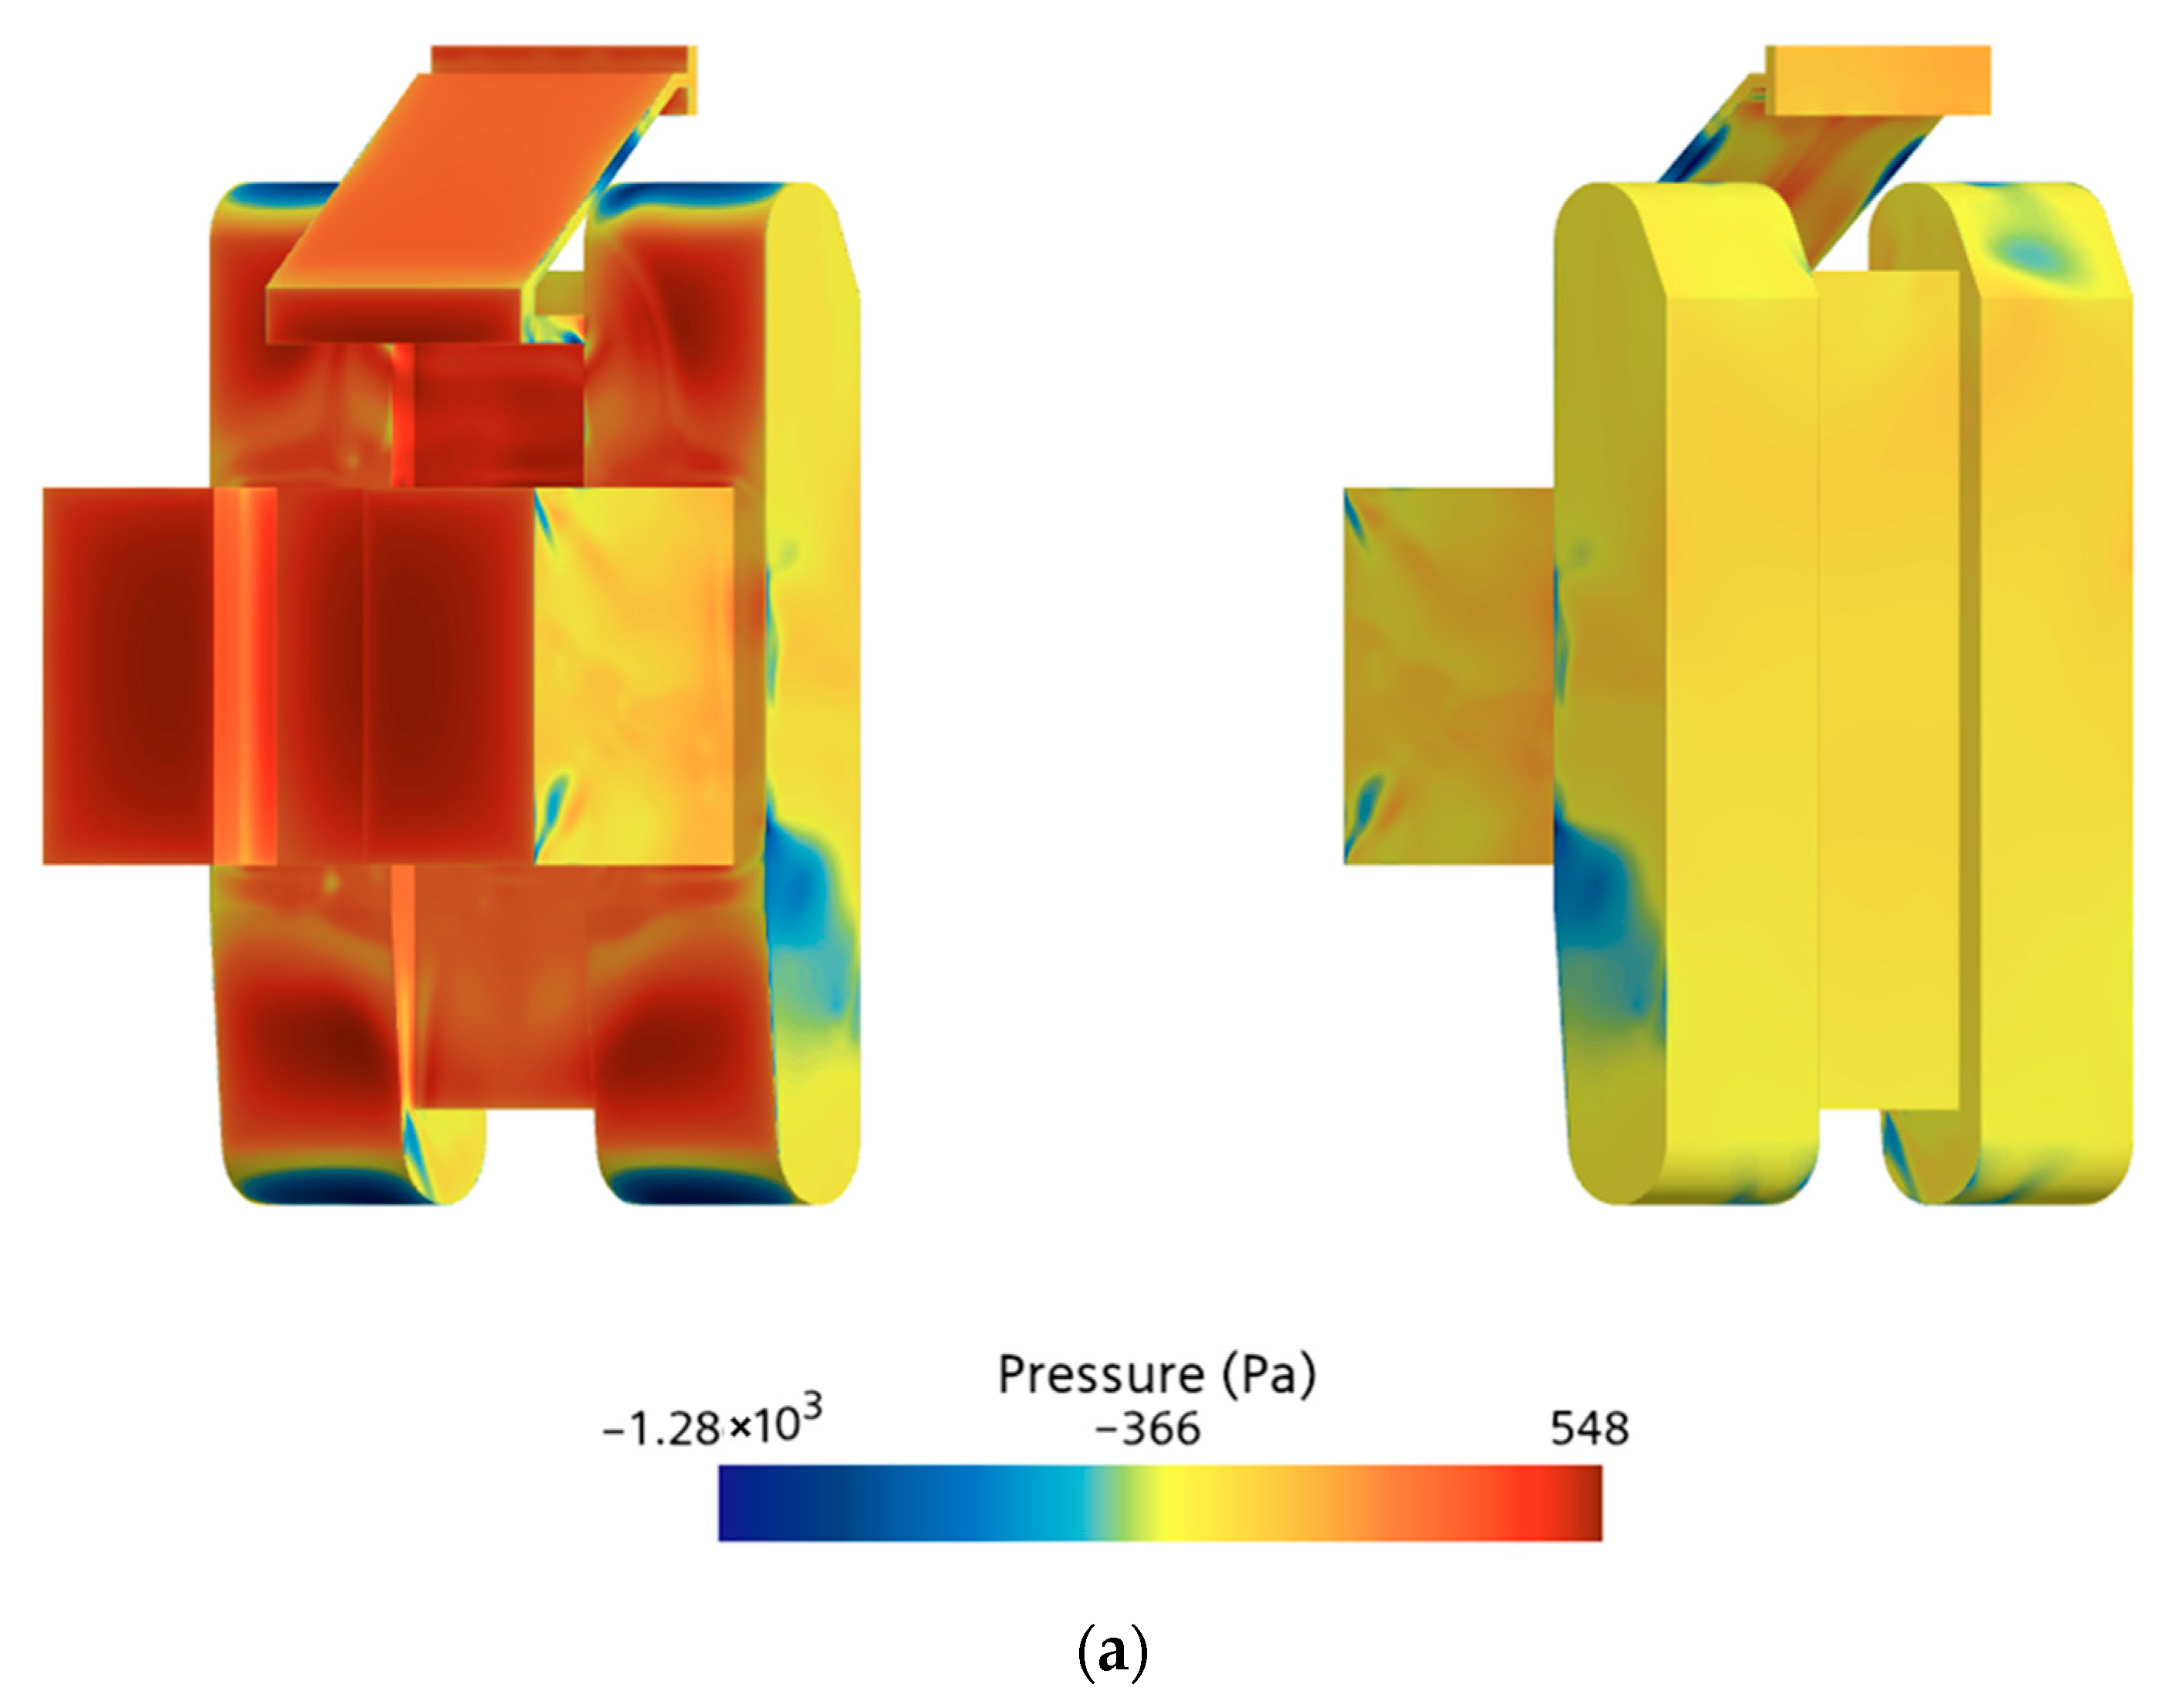
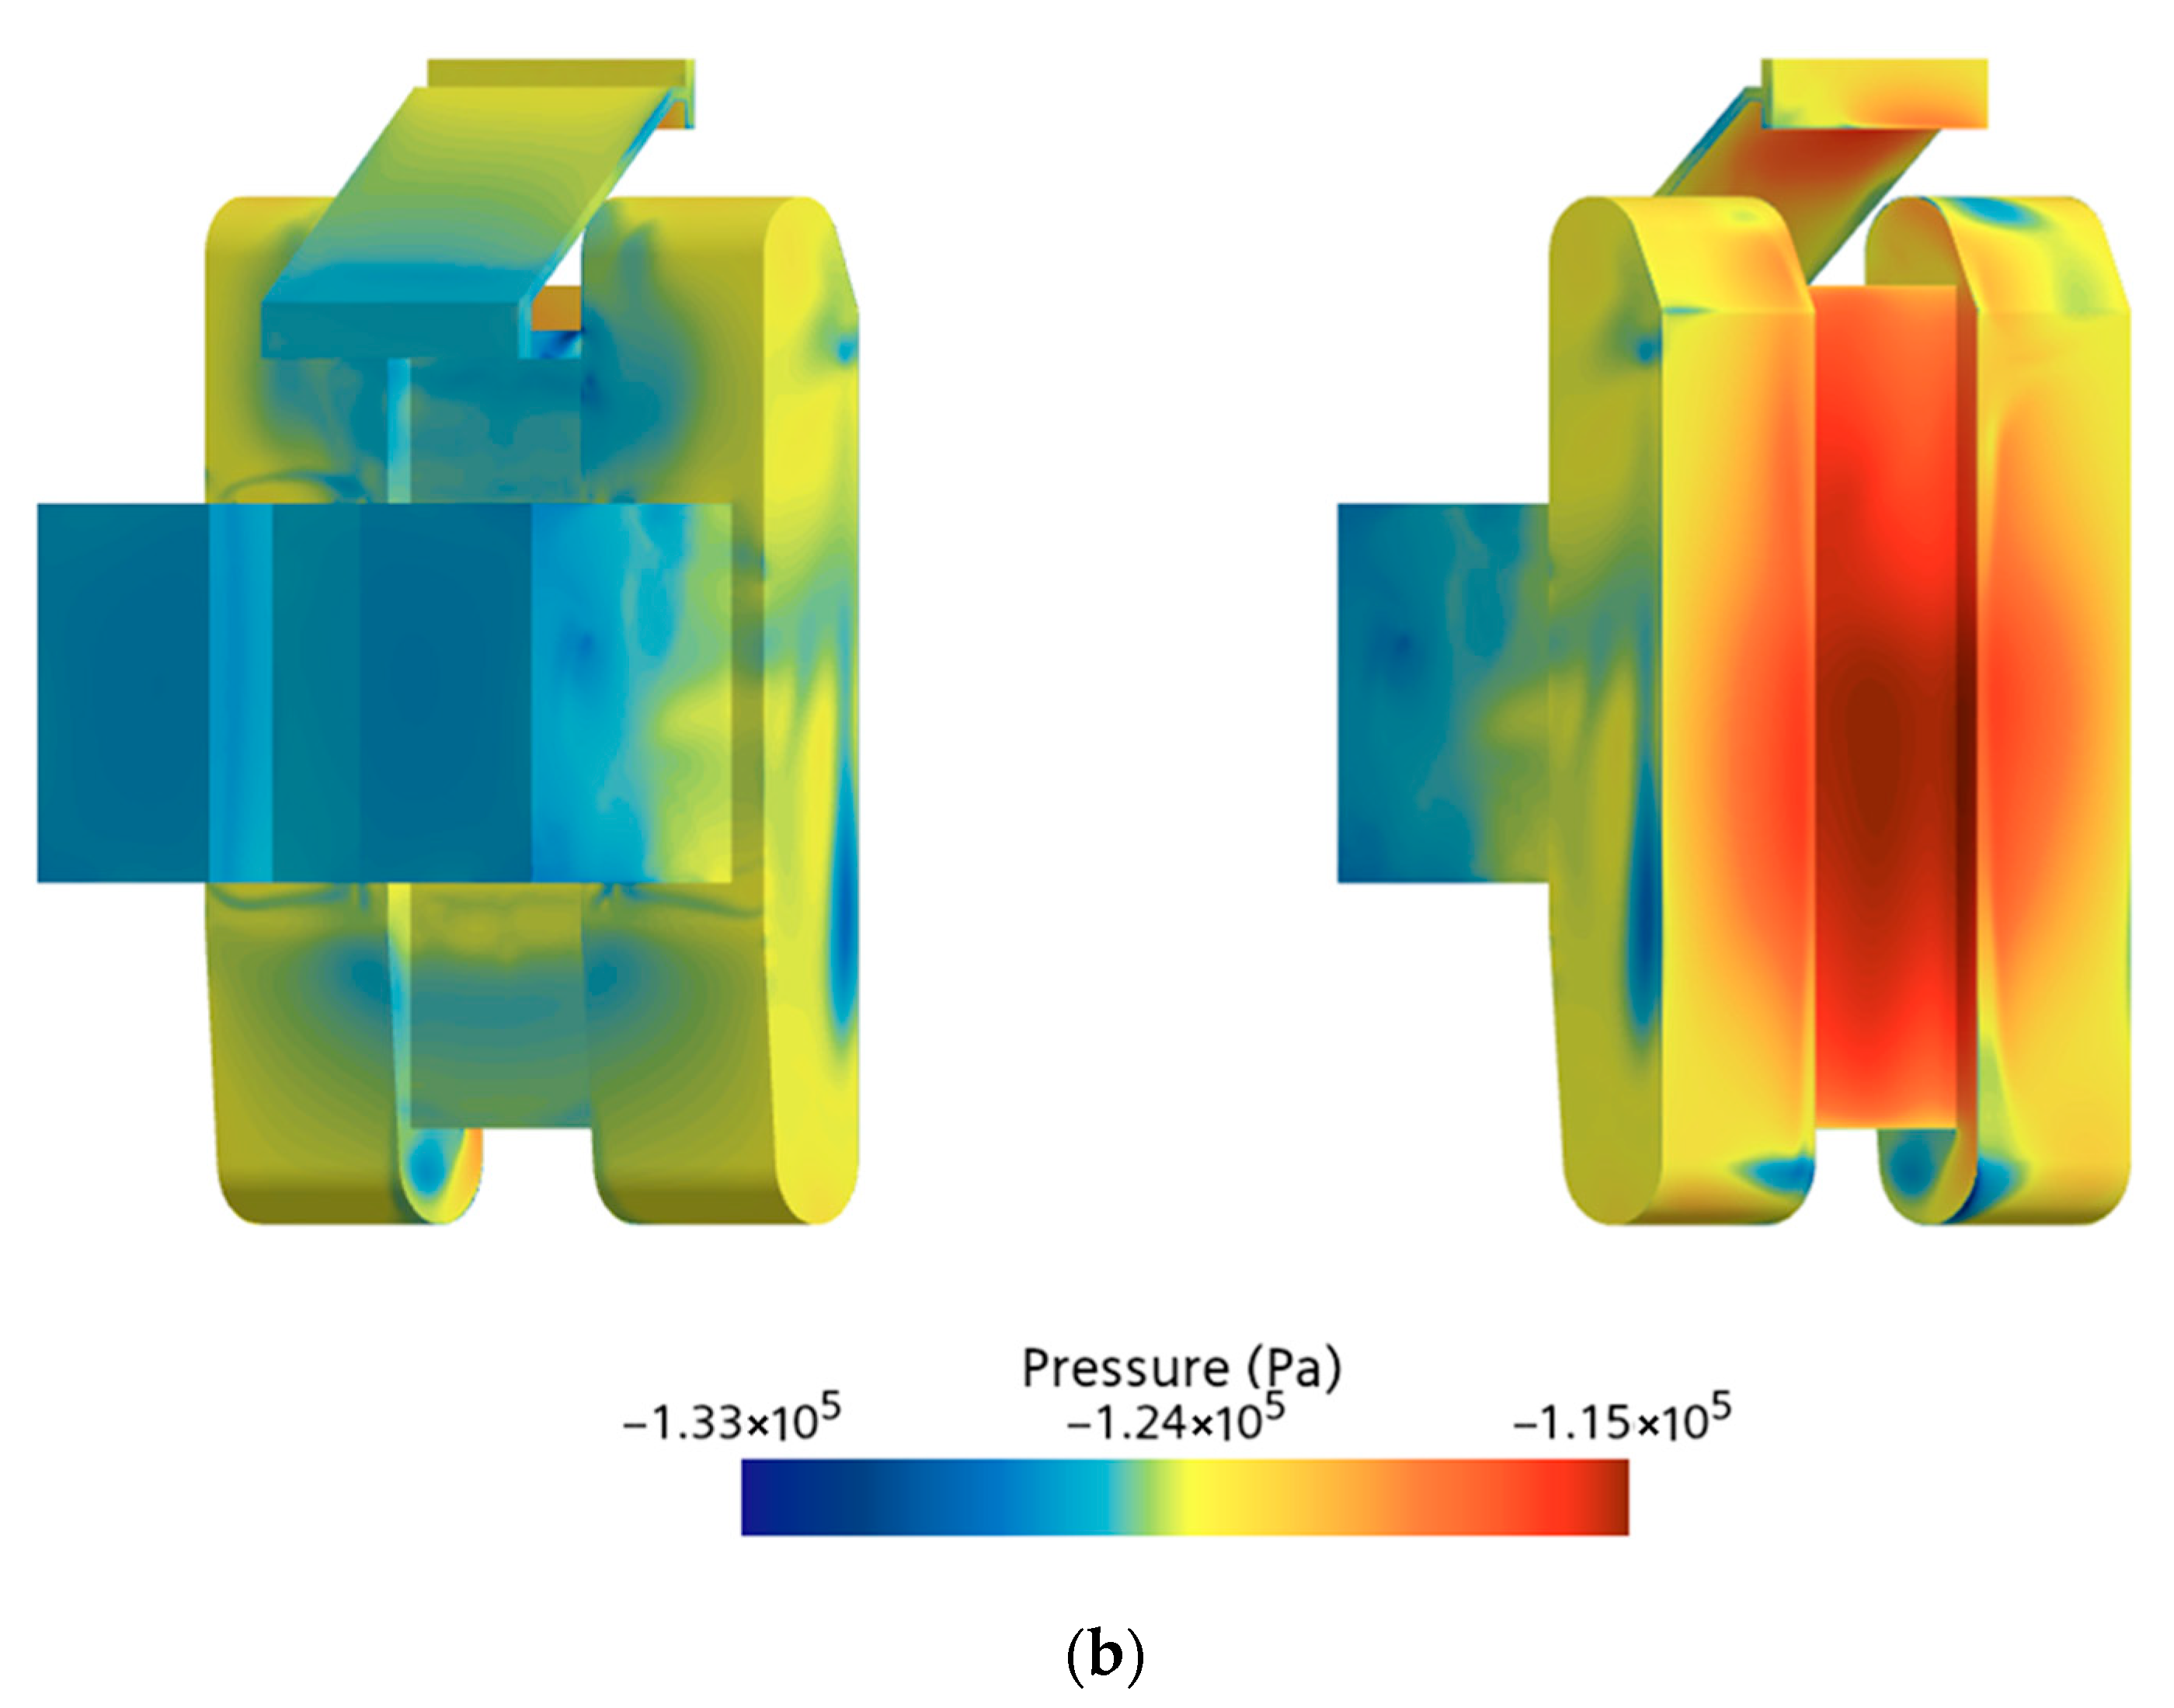
As shown in Figure 10a, the pressure distribution on the vehicle surface at the steady-state flow field (t = 42 s) exhibits a distinct pattern. A high-pressure zone forms on the upstream-facing surface due to direct impingement by the incoming flow. In contrast, regions of high-speed flow along the inclined plane, roof, sidewalls, and bottom surface generally exhibit pronounced negative pressure. Figure 10b shows the surface pressure distribution during the vehicle’s deceleration phase. This stage is characterized by extensive negative pressure regions covering the sloped surface, top, sides, and bottom of the vehicle. Deceleration induces significant fluid inertia and added mass effects, making it difficult for the surrounding fluid to respond instantaneously to the rapid change in velocity. As a result, substantial momentum deficits and isolated fluid regions develop, resulting in a significant decrease in static pressure. Furthermore, the presence of high-speed jets along the slope and sidewalls, the stretching of shear layers, and the continuous shedding of recirculation bubbles and vortices at the rear serve to further intensify both the magnitude and extent of negative pressure zones. The vehicle’s complex geometry also contributes to pronounced spatial nonuniformity and heterogeneity in localized low-pressure regions.
During the deceleration process, a strong correlation exists between the vehicle’s added mass and its wake dynamics. The added mass coefficient quantifies the surrounding fluid’s inertial response to the vehicle’s acceleration or deceleration. During this phase, the fluid’s response lags behind the vehicle’s motion. When the added mass coefficient is high, the fluid’s inertial effects become more pronounced, resulting in irregular vortex shedding, greater flow instability, and increased complexity in the wake region. Higher added mass indicates that the fluid requires more time to adapt its flow state, thereby amplifying unsteady wake behavior.
Figure 11 illustrates the variation in the hydrodynamic drag force F d acting on the vehicle under flow velocity V 1 ( t ) . Figure 11a presents the drag force experienced by the vehicle during the steady velocity phase (at t = 0–42 s), while Figure 11b shows the drag force under the variable velocity phase (at t = 42–50 s).
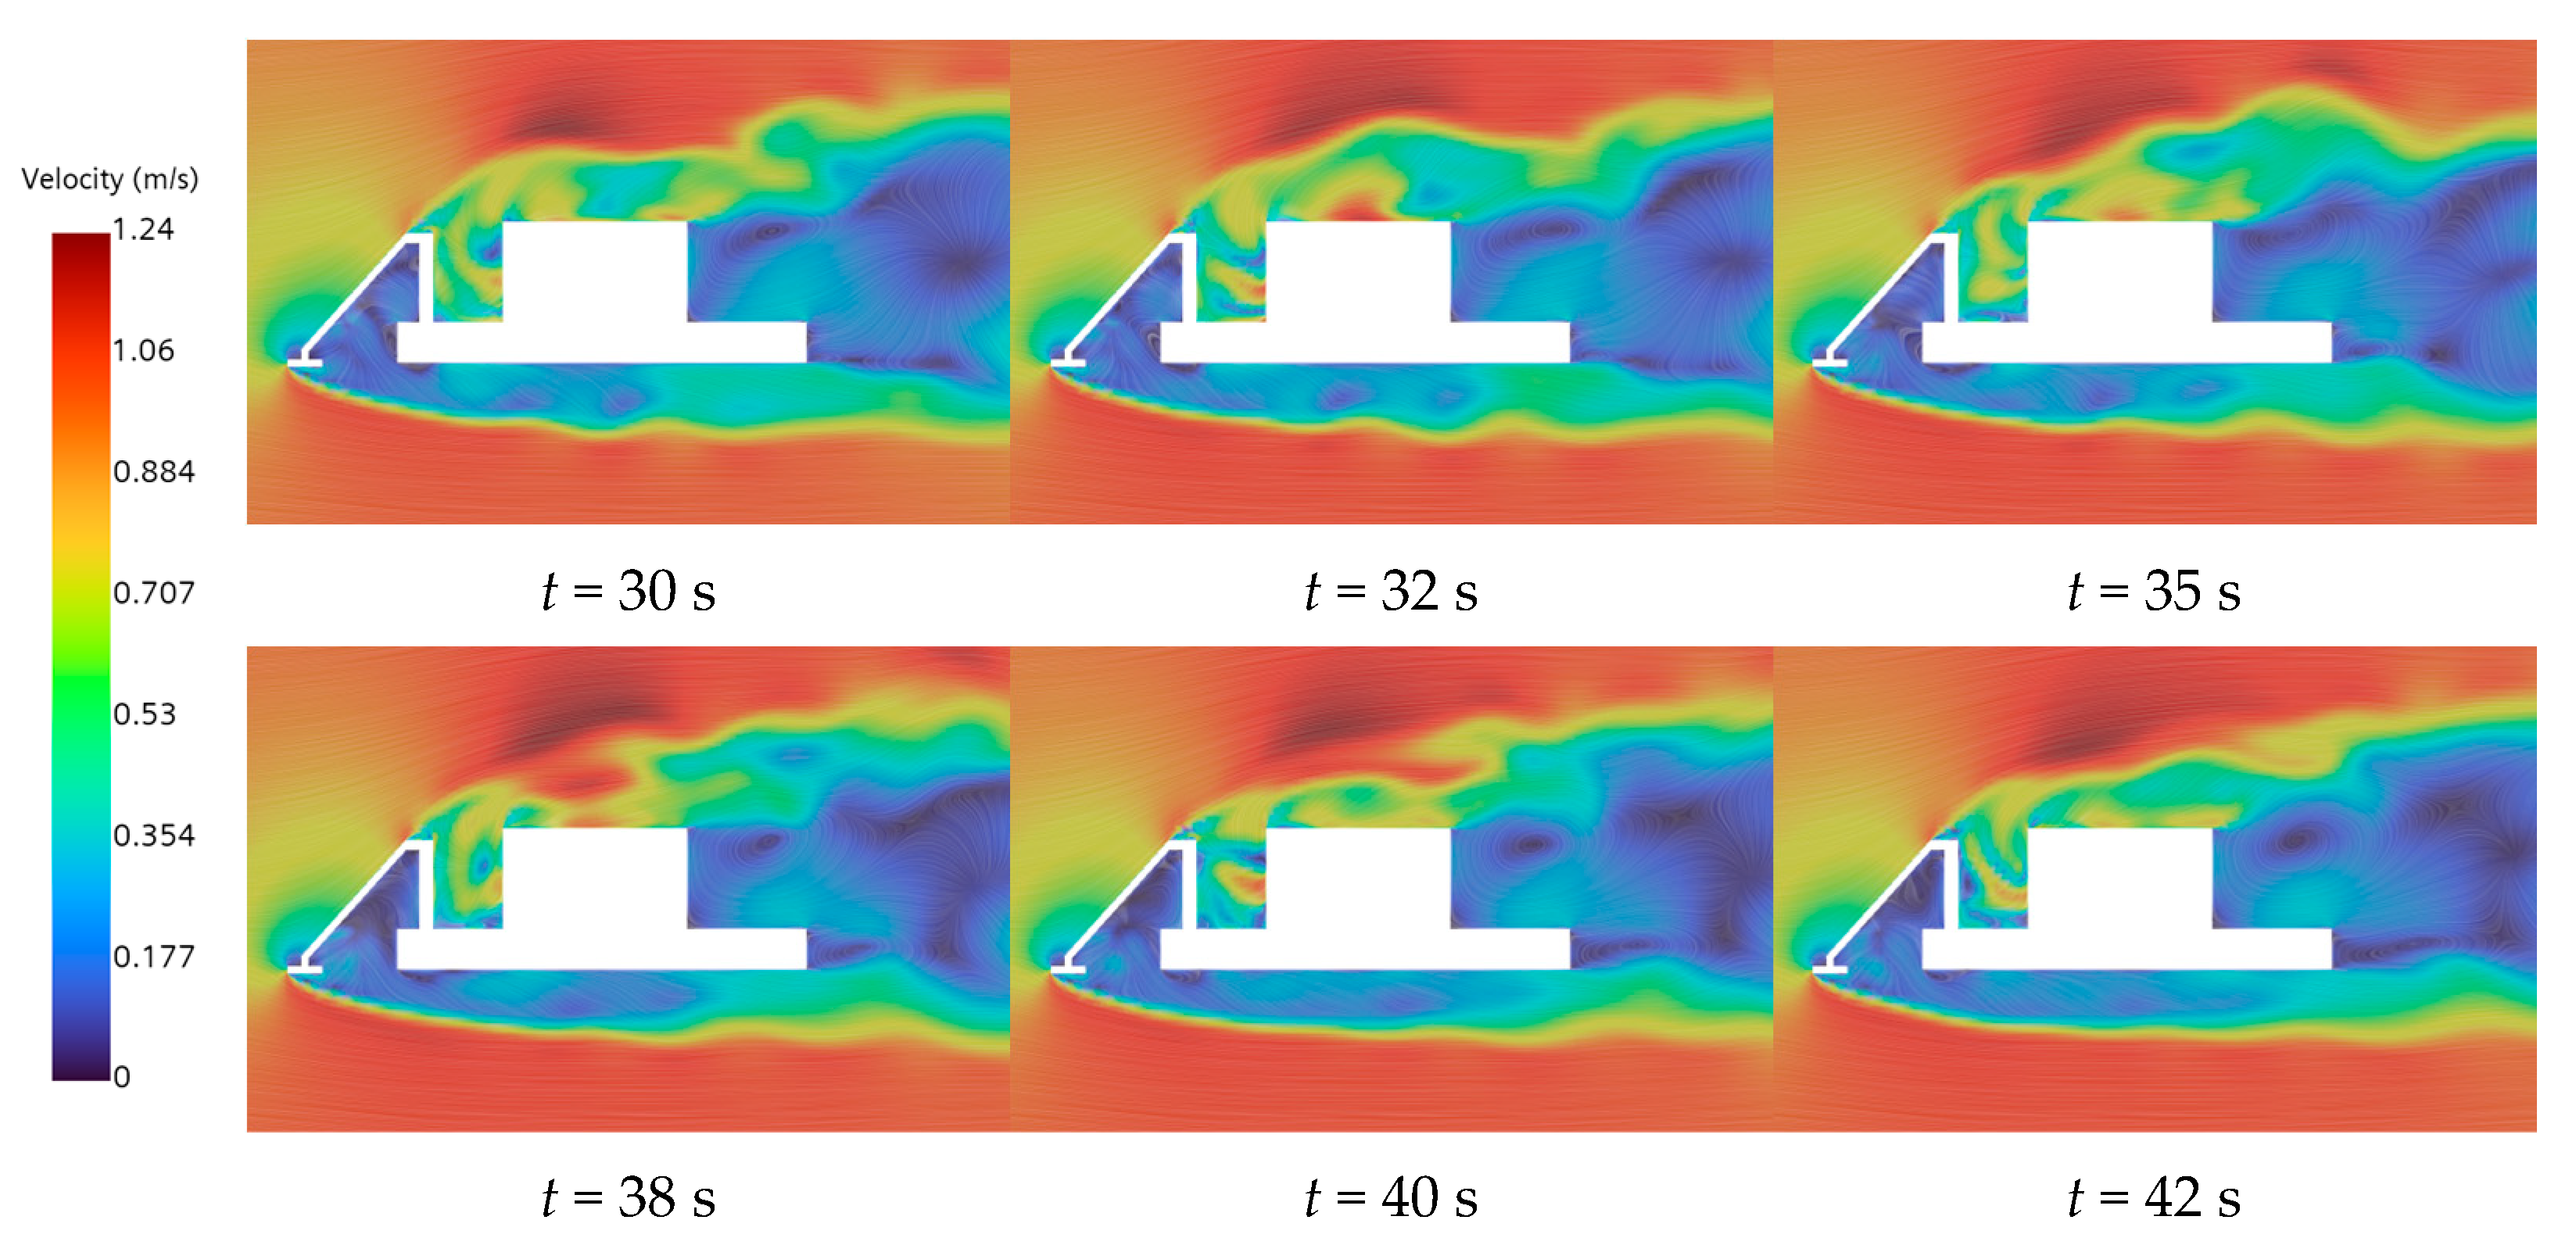
As shown in Figure 11b, after the DSMV operates under steady flow conditions for a certain duration, the hydrodynamic drag stabilizes and begins to oscillate within a relatively narrow range. These oscillations are closely linked to unsteady flow phenomena such as boundary layer separation and vortex shedding, as illustrated in Figure 12, which captures the wake evolution and vortex dynamics around the transverse vehicle body. Flow field snapshots from t = 30–42 s demonstrate periodic vortex shedding from both the upper and lower trailing edges of the vehicle. The presence of swirling streamlines, along with temporally evolving velocity contours in the near-wake region, indicates the development of a vortex street pattern, which exhibits increasing asymmetry as time progresses. A distinct boundary layer separation is observed at the upper trailing edge, where regions of high velocity gradients detach from the vehicle surface into the wake. At later time instants (at t = 40–42 s), partial flow reattachment is observed in the downstream region, as indicated by a narrowed wake and the emergence of more organized and symmetric flow structures. Furthermore, the shear layers originating from the vehicle’s sharp lateral edges become unstable and roll up into vortices that propagate downstream, contributing to the unsteady pressure drag experienced by the vehicle.
During the steady phase, as the flow field gradually stabilizes, the drag force acting on the vehicle also tends to become stable. However, due to the periodic shedding of wake vortices, the drag force exhibits oscillations within a certain range. Therefore, a time-averaged value of the drag force is calculated during the steady-state period of the flow field, and the drag force F ¯ d acting on the vehicle at a steady flow velocity of 1 m/s is −5030.64 N.
During the variable-speed stage with an imposed acceleration of a = 1   m / s 2 , the added mass of the vehicle in water is determined using Equation (17), which separates the viscous force and the inertial force acting on the vehicle.
m a X = F t = 48 F t < 42 a ρ = 31629.18   kg

4.2. Analysis of the Vertical Drag Force

The same fluid velocities V 1 ( t ) were used to perform numerical simulations of the drag force and the added mass in the vertical direction of the vehicle body. The resulting flow field distribution is shown in Figure 13. During vertical motion, the vehicle exhibits a relatively stable wake structure in the uniform-speed stage, with an overall orderly wake profile and slow kinetic energy dissipation. However, upon entering the deceleration phase, the wake structure shows significant differences compared to the transverse motion, as shown in Figure 13b. This distinction primarily arises from the geometric transformation of the inflow-facing surface—from a “ramp–platform” configuration to a “narrow vertical wall–ramp” combination, which induces abrupt changes in the separation point location and the formation mechanism of the shear layer, leading to distinct separation patterns and reattachment processes. The change in vehicle attitude not only alters the characteristic length in the inflow direction but also modifies the curvature of the side walls, making inertial pressure pulses more likely to concentrate along the sides during deceleration, thereby strengthening the coupling between the shear layer and the wake.
As a result, the evolution of the added mass layer’s volume and thickness becomes more intense during vertical motion. This rapid variation intensifies the unsteadiness of the wake and enhances the momentum exchange. Under these combined effects, the wake during vertical deceleration becomes more concentrated, vortex shedding occurs more frequently, and the amplitude of unsteady fluctuations significantly surpasses that observed during lateral motion, ultimately resulting in a considerable increase in added mass.
As shown in Figure 14a, the surface pressure distribution of the vehicle under vertical orientation in a uniform flow field reveals distinct hydrodynamic characteristics. A high static pressure region is formed on the upstream-facing surface due to direct impingement of the incoming flow, while accelerated flow along the sloped surface and sidewalls results in a significant reduction in static pressure. Vortex structures at the vehicle’s rear and in the recirculation, zone further reduce local surface pressure, creating extensive low-pressure regions. During the deceleration phase (Figure 14b), the vehicle surface experiences widespread negative pressure, mainly due to fluid inertia, added mass effects, and unsteady flow structures. The most significant low-pressure regions appear on the upstream face, sidewalls, and sharp geometrical transitions. This occurs because the surrounding fluid cannot instantly adjust to the vehicle’s speed reduction, causing a pressure imbalance. The added mass effect further lowers pressure by requiring the vehicle to decelerate the adjacent fluid. Accelerated flow along sloped and edged surfaces intensifies shear and reduces pressure via Bernoulli’s principle, and the vortex shedding at the rear also generates sustained low-pressure zones. These effects collectively amplify local stress concentrations and may impact system layout and vehicle stability.
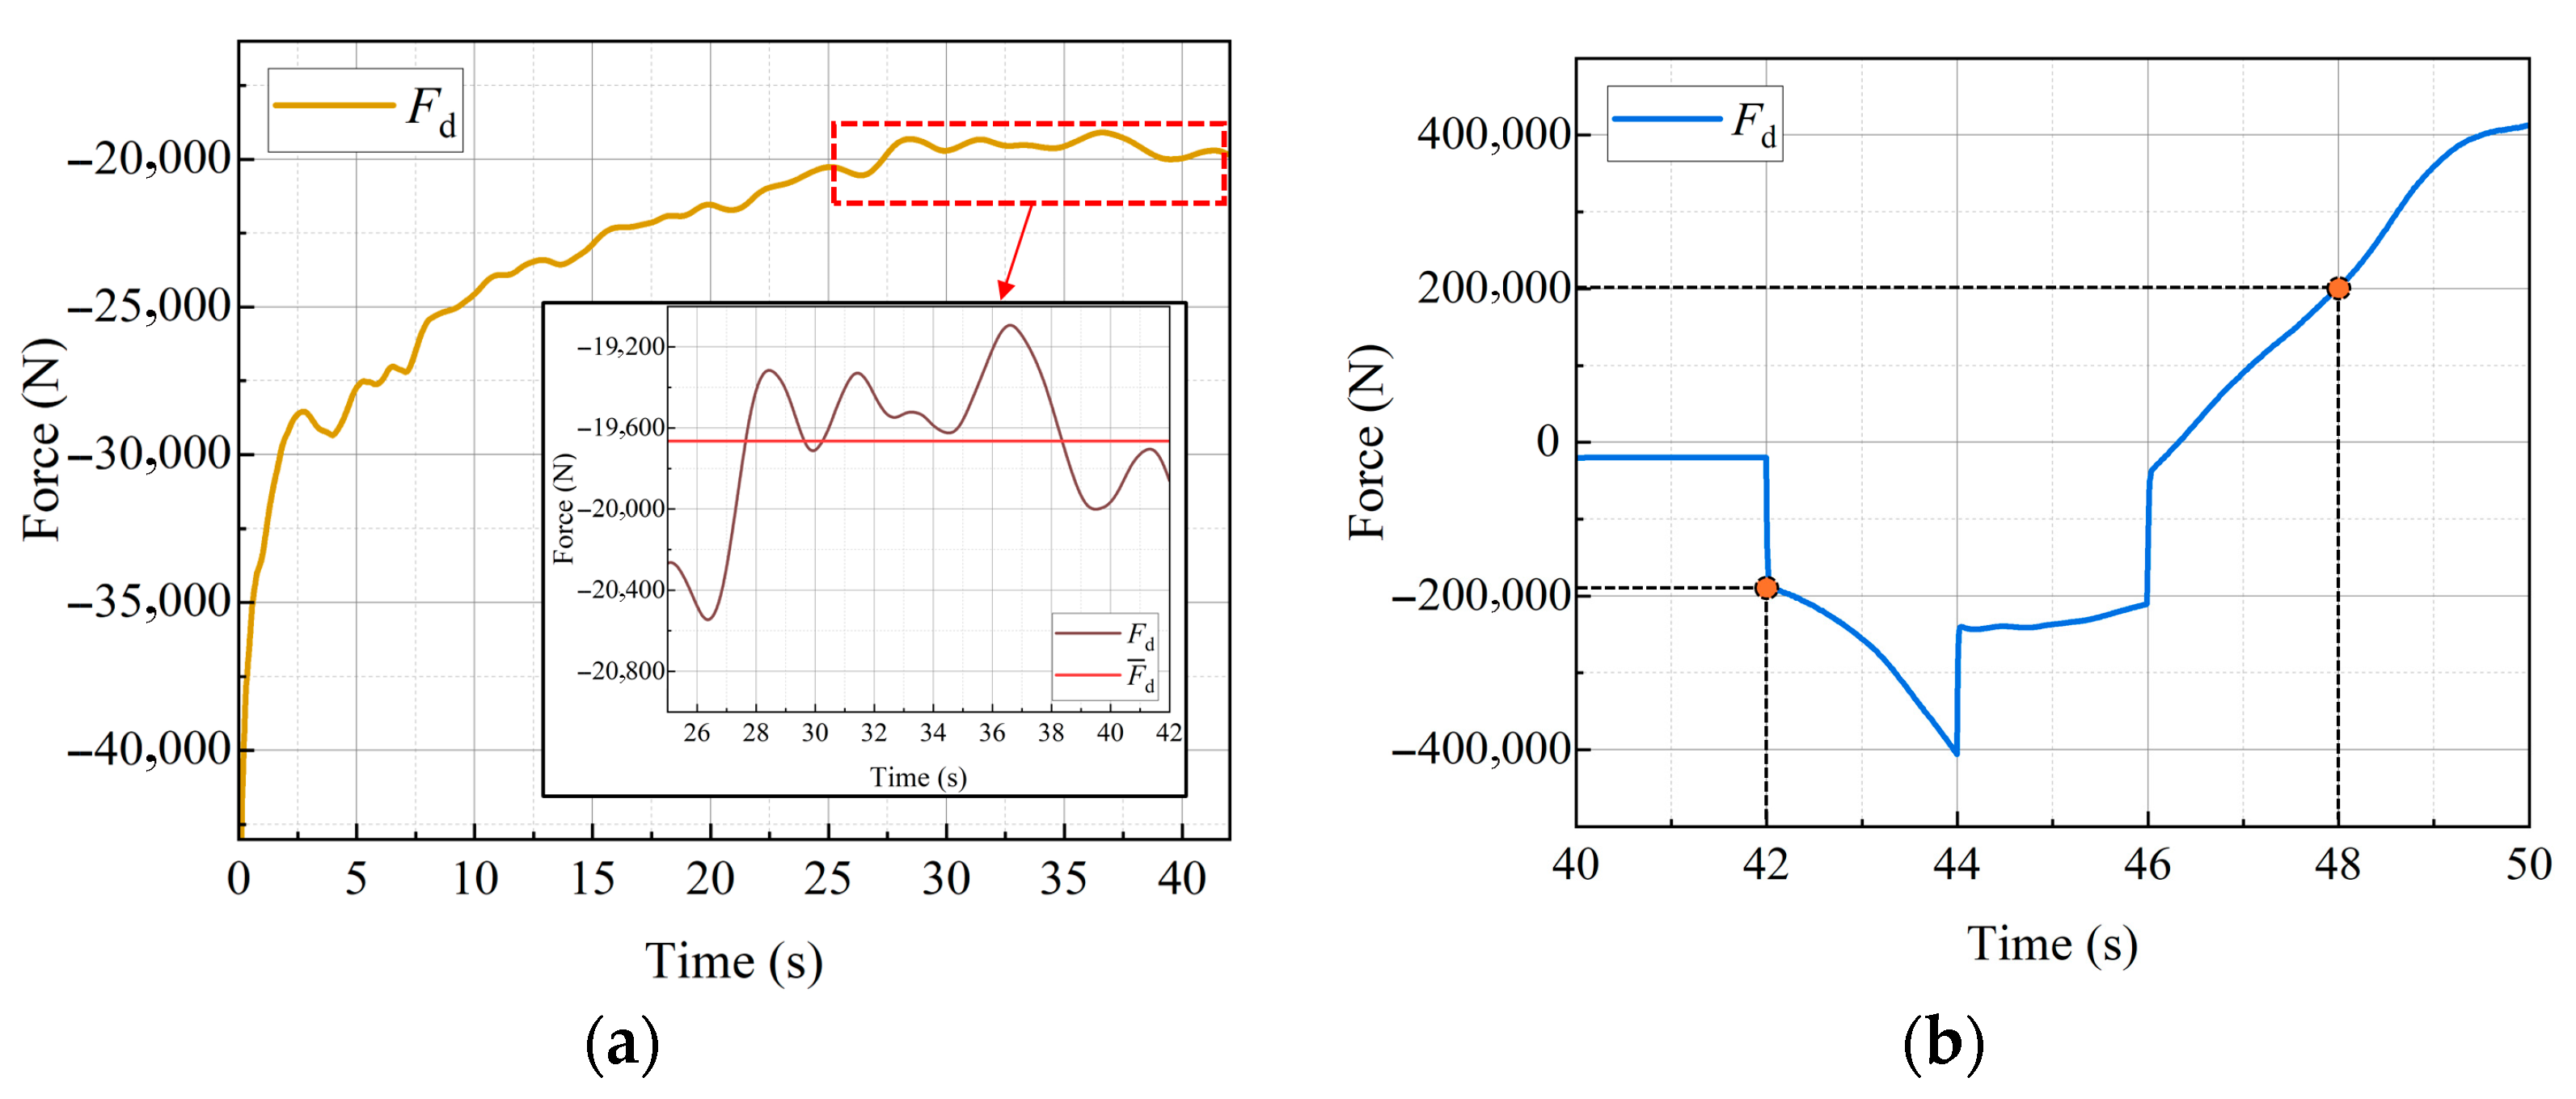
Figure 15 shows the variation trend of the hydrodynamic force acting on the vehicle in the vertical direction. Similarly, the time-averaging method is employed to calculate the hydrodynamic force of the vehicle in a steady uniform flow field, while the added mass is estimated using Equation (9). As illustrated in Figure 15a, the vertical hydrodynamic force increases significantly, and it takes a longer time to reach a steady state.
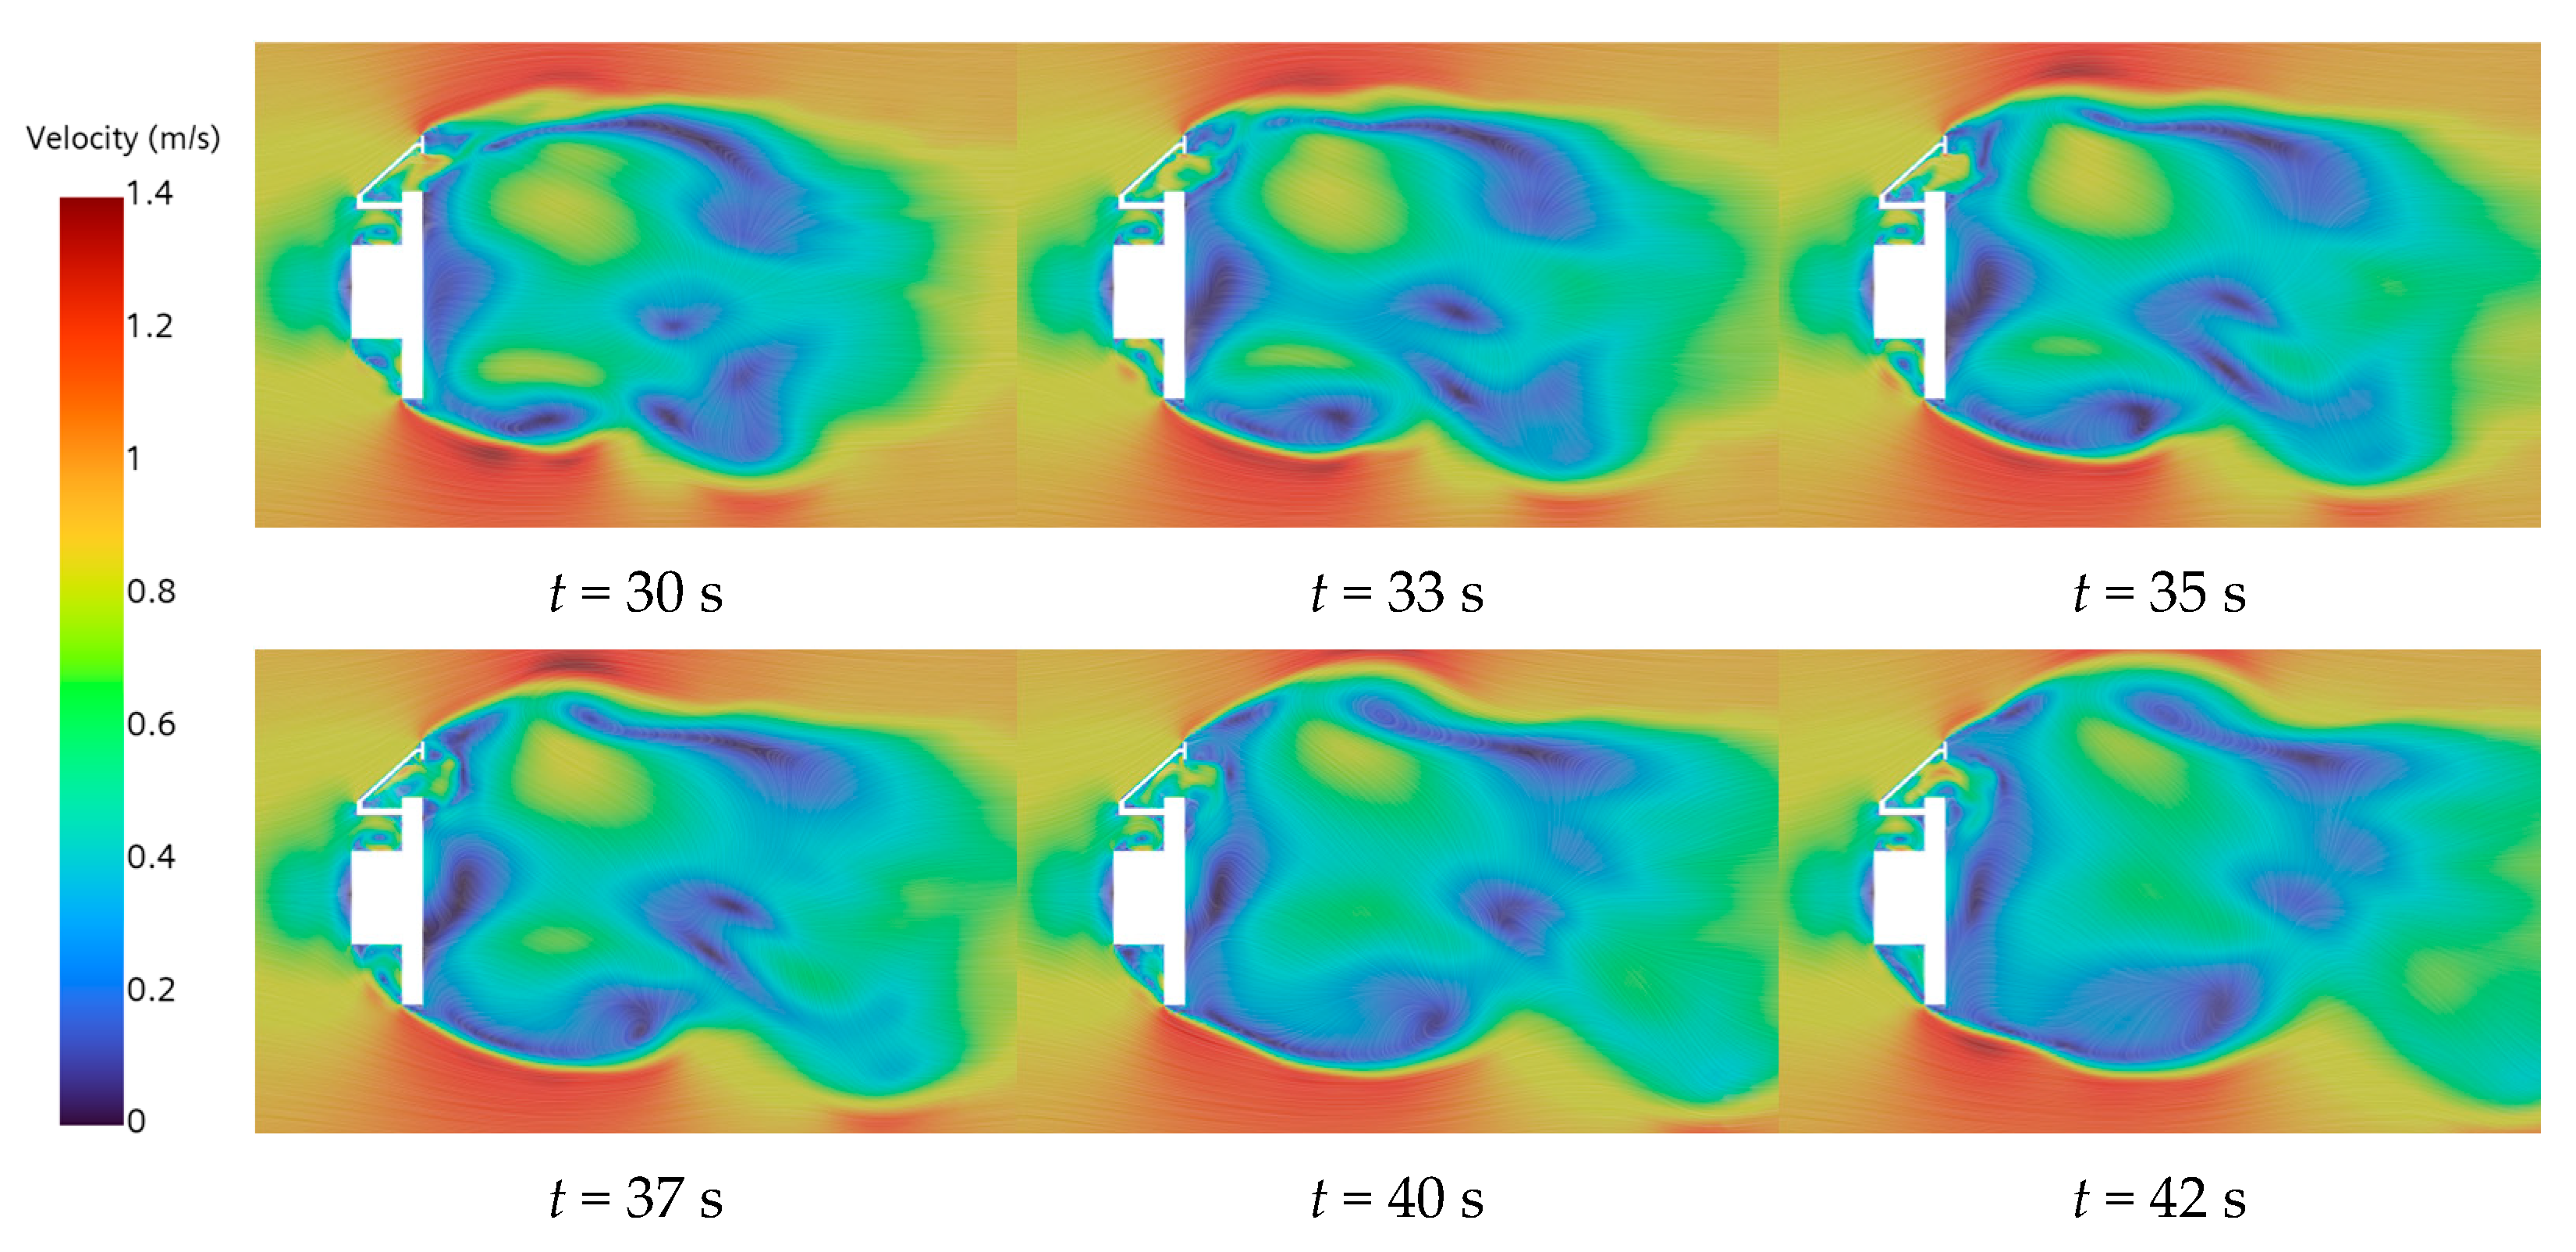
Figure 16 illustrates the wake evolution and vortex shedding of the vertical vehicle body. Compared with the results shown in Figure 12, it can be observed that due to the limited surface length in the streamwise direction, the boundary layer on the vertical body has not developed sufficiently to reach a state where flow separation is likely to occur. As a result, no significant boundary layer separation is observed. However, during the time interval from t = 30–42 s, although the flow along the body surface remains largely attached, the wake behind the rear edge exhibits asymmetric vortex structures and localized recirculation zones. These features indicate that the wake has entered an early stage of flow instability. The unsteady nature of the shear layers, along with the periodic shedding of weak trailing-edge vortices, induces slight variations in the pressure distribution within the wake region. Consequently, the hydrodynamic drag acting on the vehicle body fluctuates within a limited amplitude range, even in the absence of full boundary layer separation.
After stabilization, the time-averaged drag force F ¯ d is −19,664.45 N. Furthermore, by utilizing the variable-speed motion to separate viscous and inertial forces, the added mass of the vehicle in the vertical direction m a Z is extracted and found to be 167,581.13 kg.
m a Z = F t = 48 F t < 42 a ρ = 167581.13   kg

4.3. Drag Coefficient and Added Mass Coefficient

The analysis of the wake structure and variation in hydrodynamic forces acting on the deep-sea mining vehicle (DSMV) in both transverse and vertical orientations demonstrates notable differences in hydrodynamic responses depending on the direction of motion. Specifically, the vertical drag force is approximately 3.909 times higher than that observed in the transverse direction, accompanied by a significant increase in added mass. To facilitate a more precise comparison and quantification of drag and added mass characteristics across different orientations, this study computes the respective drag and added mass coefficients using geometric characteristic lengths specific to each orientation.
Drag force and added mass represent two distinct concepts in fluid dynamics, corresponding to the steady viscous effects and the unsteady inertial response of the fluid to a moving body, respectively. As a result, the characteristic length scales employed in their evaluation differ accordingly. Drag force is primarily determined by flow separation and the development of wake structures in the region adjacent to the body’s frontal area, with its characteristic length generally defined as the dimension perpendicular to the direction of the incoming flow. In contrast, added mass arises from the fluid’s inertial response to the body’s acceleration, which is directly related to the volume of fluid displaced during motion. As a result, the characteristic scale for added mass is typically quantified using the displaced volume of the body or an equivalent volumetric length.
The drag coefficient of the vehicle body is defined as shown in Equation (19):
C d = F d 1 2 ρ U 2 A r e f
where U is the incoming flow velocity; A r e f is the projected area of the headward flow.
As shown in Figure 17, the DSMV projection onto the transverse x-axis A r e f x and the vertical z-axis A r e f z is 13.061 m2 and 39.166 m2, respectively. At a flow velocity of 1 m/s, the corresponding Reynolds numbers are 4.07 × 10⁶ and 7.04 × 10⁶, respectively. The drag coefficient C d x of the vehicle body is 0.7722 in the transverse direction and the drag coefficient C d z of the vehicle body is 1.0066 in the vertical direction. The added mass coefficient of the DSMV is calculated by Equation (20), the transverse added mass coefficient C a x = m a x ρ = 0.584 and a vertical added mass coefficient C a z = m a z ρ = 3.096 .
C a = m a ρ
where ρ denotes the mass of the displaced volume of the water occupied by the DSMV, in this study ρ = 54,132.06 kg.
There are significant differences in the hydrodynamic responses of the deep-sea mining vehicle (DSMV) between the transverse and vertical directions, particularly in terms of drag coefficients and added mass coefficients. As shown in Figure 17, the projected area of the vehicle in the transverse (x-axis) direction is 13.061 m2, whereas in the vertical (z-axis) direction, it reaches 39.166 m2—approximately three times greater. The corresponding drag coefficients are 0.7722 and 1.0066, respectively. These values indicate that, despite the larger vertical projected area, the associated flow separation and wake structures are more complex, leading to a significantly higher drag force and an elevated drag coefficient. Furthermore, the added mass coefficient in the transverse direction is 0.584, while in the vertical direction, it increases to 3.096. This suggests that the fluid’s inertial response during vertical acceleration is considerably stronger. The observed difference primarily stems from variations in the vehicle’s geometric configuration under different orientations: the vertical inflow surface includes large vertical wall structures that induce a broader range of fluid disturbance and inertial coupling, thereby causing a rapid increase in both the volume and thickness of the added mass layer. In contrast, the transverse inflow surface exhibits a more streamlined shape, resulting in weaker inertial effects.
5. Conclusions

In this study, a CFD-based numerical method was developed to calculate the hydrodynamic coefficients of a Deep-Sea Mining Vehicle (DSMV), with a particular focus on drag and added mass in both transverse and vertical directions. Considering the complexity of the DSMV operation and retrieval processes under unsteady flow conditions, accurately evaluating hydrodynamic responses is essential for ensuring operational safety and improving system control performance.
By simulating the DSMV’s motion in uniform and accelerated flows, this work successfully decouples viscous and inertial forces, enabling the precise estimation of added mass coefficients. Validation through comparison with theoretical predictions for ellipsoidal bodies confirms the reliability and accuracy of the proposed CFD approach. Unlike experimental methods, which are limited by technical complexity and high cost, this simulation-based method offers a more practical and efficient alternative for early-stage design and control algorithm development. The results reveal pronounced differences in the hydrodynamic coefficients between the transverse and vertical orientations of the DSMV, primarily attributed to variations in the projected area and flow separation behavior. Specifically, the drag coefficient in the vertical direction reaches 130.36% of that in the transverse direction, indicating enhanced pressure drag due to more complex wake structures. Moreover, the added mass coefficient in the vertical direction is approximately 529.9% of its transverse counterpart, highlighting significantly stronger fluid inertia coupling. These findings underscore the necessity of accounting for directional hydrodynamic disparities in the structural design and control strategies of the DSMV, particularly during deployment and retrieval operations.

Author Contributions

Conceptualization, Y.D. and X.H.; methodology, G.W. and X.Z.; software, X.H. and C.L.; validation, Y.D. and X.H.; formal analysis, X.H. and C.L.; investigation, X.H. and C.L.; resources, G.W. and Y.D.; data curation, G.W. and X.H.; writing—original draft preparation, X.Z.; writing—review and editing, G.W. and X.H.; visualization, X.Z. and C.L.; supervision, G.W., X.Z. and Y.D.; project administration, G.W. and Y.D.; funding acquisition, Y.D. All authors have read and agreed to the published version of the manuscript.

Funding

This research was funded by the science and technology innovation Program of Hunan Province: [grant number 2024RC1001], National Key Research and Development Program of China: [grant number 2022YFC2806804-1], National Key Research and Development Program of China: [grant number 2023YFC2811300].

Institutional Review Board Statement

Not applicable.

Informed Consent Statement

Not applicable.

Data Availability Statement

The original contributions presented in the study are included in the article, further inquiries can be directed to the corresponding author.

Conflicts of Interest

The authors declare no conflicts of interest.

References

  1. Huang, X.; Dai, Y.; Liu, C.; Su, Q.; Zhu, X. Water-exit impact of deep-sea mining vehicles: Experimental and numerical investigations. Ocean Eng. 2024, 302, 117444. [Google Scholar] [CrossRef]
  2. Xiang, X.; Yu, C.; Lapierre, L.; Zhang, J.; Zhang, Q. Survey on fuzzy-logic-based guidance and control of marine surface vehicles and underwater vehicles. Int. J. Fuzzy Syst. 2018, 20, 572–586. [Google Scholar] [CrossRef]
  3. Huang, X.; Dai, Y.; Zhu, X. Numerical study of vehicle motion during water exit under combined lifting force and wave action. Phys. Fluids 2024, 36, 107144. [Google Scholar] [CrossRef]
  4. Carrasco, G.R.; Martínez, A.V.; Toledo, A.C. Coefficient estimation in the dynamic equations of motion of an AUV. In Proceedings of the Sixth International Workshop on Marine Technology, Martech 2015, Cartagena, Spain, 15–17 September 2015. [Google Scholar]
  5. Dai, Y.; Yu, C.; Huang, X.; Li, Z.; Zhu, X. Research on path planning of deep-sea mining vehicles integrating improved theta∗ algorithm with dynamic window method. Ocean Eng. 2025, 330, 121281. [Google Scholar] [CrossRef]
  6. Yu, C.; Xiang, X.; Wilson, P.A.; Zhang, Q. Guidance-error-based robust fuzzy adaptive control for bottom following of a flight-style AUV with saturated actuator dynamics. IEEE Trans. Cybern. 2019, 50, 1887–1899. [Google Scholar] [CrossRef]
  7. Javanmard, E.; Mansoorzadeh, S.; Pishevar, A.; Mehr, J.A. Determination of drag and lift related coefficients of an auv using computational and experimental fluid dynamics methods. Int. J. Marit. Eng. 2020, 162, 177–192. [Google Scholar] [CrossRef]
  8. Foroushani, J.A.; Sabzpooshani, M. Determination of hydrodynamic derivatives of an ocean vehicle using cfd analyses of synthetic standard dynamic tests. Appl. Ocean Res. 2021, 108, 102539. [Google Scholar] [CrossRef]
  9. Ahmed, F.; Xiang, X.; Jiang, C.; Xiang, G.; Yang, S. Survey on traditional and AI based estimation techniques for hydrodynamic coefficients of autonomous underwater vehicle. Ocean Eng. 2023, 268, 113300. [Google Scholar] [CrossRef]
  10. De Barros, E.A.; Pascoal, A.; De Sa, E. Investigation of a method for predicting AUV derivatives. Ocean Eng. 2008, 35, 1627–1636. [Google Scholar] [CrossRef]
  11. Kepler, M.E.; Pawar, S.; Stilwell, D.J.; Brizzolara, S.; Neu, W.L. Assessment of AUV hydrodynamic coefficients from analytic and semi-empirical methods. In Proceedings of the OCEANS 2018 MTS/IEEE Charleston, Charleston, SC, USA, 22–25 October 2018. [Google Scholar]
  12. Allotta, B.; Costanzi, R.; Pugi, L.; Ridolfi, A. Identification of the main hydrodynamic parameters of Typhoon AUV from a reduced experimental dataset. Ocean Eng. 2018, 147, 77–88. [Google Scholar] [CrossRef]
  13. Barati, R.; Neyshabouri, S.A.A.S.; Ahmadi, G. Development of empirical models with high accuracy for estimation of drag coefficient of flow around a smooth sphere: An evolutionary approach. Powder Technol. 2014, 257, 11–19. [Google Scholar] [CrossRef]
  14. Lin, Z.; Liao, S. Calculation of added mass coefficients of 3D complicated underwater bodies by FMBEM. Commun. Nonlinear Sci. Numer. Simul. 2011, 16, 187–194. [Google Scholar] [CrossRef]
  15. Ferreira, B.; Pinto, M.; Matos, A.; Cruz, N. Hydrodynamic modeling and motion limits of AUV MARES. In Proceedings of the 2009 35th Annual Conference of IEEE Industrial Electronics, Porto, Portugal, 3–5 November 2009; pp. 2241–2246. [Google Scholar]
  16. Jones, D.A.; Clarke, D.B.; Brayshaw, I.B.; Barillon, J.L.; Anderson, B. The Calculation of Hydrodynamic Coefficients for Underwater Vehicles; Technical Report; Defence Science and Technology Organization Victoria (Australia) Platform: Melbourne, Australia, 2002. [Google Scholar]
  17. De Barros, E.A.; Pascoal, A.; De Sa, E. AUV dynamics: Modelling and parameter estimation using analytical, semi-empirical, and CFD methods. IFAC Proc. Vol. 2004, 37, 369–376. [Google Scholar] [CrossRef]
  18. Dantas, J.L.D.; de Barros, E.A.; da Cruz, J.J. AUV control in the diving plane subject to waves. IFAC Proc. Vol. 2012, 45, 319–324. [Google Scholar] [CrossRef]
  19. Sahoo, A.; Dwivedy, S.K.; Robi, P.S. Advancements in the field of autonomous underwater vehicle. Ocean Eng. 2019, 181, 145–160. [Google Scholar] [CrossRef]
  20. Perrault, D.; Bose, N.; O’young, S.; Williams, C.D. Sensitivity of AUV added mass coefficients to variations in hull and control plane geometry. Ocean Eng. 2003, 30, 645–671. [Google Scholar] [CrossRef]
  21. Lee, S.K.; Joung, T.H.; Cheo, S.J.; Jang, T.S.; Lee, J.H. Evaluation of the added mass for a spheroid-type unmanned underwater vehicle by vertical planar motion mechanism test. Int. J. Nav. Archit. Ocean Eng. 2011, 3, 174–180. [Google Scholar] [CrossRef]
  22. Min, F.; Pan, G.; Xu, X. Modeling of autonomous underwater vehicles with multi-propellers based on maximum likelihood method. J. Mar. Sci. Eng. 2020, 8, 407. [Google Scholar] [CrossRef]
  23. Bandara, G.; Ratnaweera, D.; Maithripala, D.H.S. Modeling and control approach for a complex-shaped underwater vehicle. Am. J. Mech. Eng. 2019, 7, 158–171. [Google Scholar]
  24. Javanmard, E.; Mansoorzadeh, S. A computational fluid dynamics investigation on the drag coefficient measurement of an AUV in a towing tank. J. Appl. Fluid Mech. 2019, 12, 947–959. [Google Scholar] [CrossRef]
  25. Javanmard, E.; Mansoorzadeh, S.; Mehr, J.A. A new CFD method for determination of translational added mass coefficients of an underwater vehicle. Ocean Eng. 2020, 215, 107857. [Google Scholar] [CrossRef]
  26. Nakamura, M.; Asakawa, K.; Hyakudome, T.; Kishima, S.; Matsuoka, H.; Minami, T. Hydrodynamic coefficients and motion simulations of underwater glider for virtual mooring. IEEE J. Ocean. Eng. 2013, 38, 581–597. [Google Scholar] [CrossRef]
  27. Phillips, A.B.; Turnock, S.R.; Furlong, M. The use of computational fluid dynamics to aid cost-effective hydrodynamic design of autonomous underwater vehicles. Proc. Inst. Mech. Eng. Part M J. Eng. Marit. Environ. 2010, 224, 239–254. [Google Scholar] [CrossRef]
  28. Raza, N.; Mehmood, I.; Rafiuddin, H.; Rafique, M. Numerical simulation of added mass determination of standard ellipsoids. In Proceedings of the 2012 9th IEEE International Bhurban Conference on Applied Sciences & Technology (IBCAST), Islamabad, Pakistan, 9–12 January 2012; pp. 270–273. [Google Scholar]
  29. Mishra, V.; Vengadesan, S. Translational added mass of axisymmetric underwater vehicles with forward speed using computational fluid dynamics. J. Ship Res. 2011, 55, 185–195. [Google Scholar] [CrossRef]
  30. Pan, Y.; Zhang, H.; Zhou, Q. Numerical prediction of submarine hydrodynamic coefficients using CFD simulation. J. Hydrodyn. 2012, 24, 840–847. [Google Scholar] [CrossRef]
  31. Leong, Z.Q.; Ranmuthugala, D.; Penesis, I.; Nguyen, H.D. RANS-based CFD prediction of the hydrodynamic coefficients of DARPA SUBOFF geometry in straight-line and rotating arm manoeuvres. Int. J. Marit. Eng. 2015, 157, A41–A51. [Google Scholar] [CrossRef]
  32. Du, X.; Zheng, Z.; Guan, S. Numerical calculation of hydrodynamic interactions of submarine flow on AUV. In Proceedings of the 2018 OCEANS-MTS/IEEE Kobe Techno-Oceans (OTO), Kobe, Japan, 28–31 May 2018; pp. 1–5. [Google Scholar]
  33. Hoerner, S.F. Fluid Dynamic Drag; Author: Midland Park, NJ, USA, 1965; pp. 16–35. [Google Scholar]
  34. Lamb, S.H. Hydrodynamics, 6th ed.; Dover Publications: Mineola, NY, USA, 1945; pp. 152–155. [Google Scholar]
Figure 2. Fluid velocity change and hydrodynamic change in the DSMV.
Machines 13 00699 g002
Figure 3. Schematic diagram of an ellipsoid.
Machines 13 00699 g003
Figure 4. The deep-sea mining vehicle utilized in this study and the computational domain with specified boundary conditions.
Machines 13 00699 g004
Figure 5. Fluid flow velocity of the inlet boundary.
Machines 13 00699 g005
Figure 6. Grid scheme of computational domain.
Machines 13 00699 g006
Figure 7. Grid independence verification of the computational domain: (a) Shear force; (b) Presser.
Machines 13 00699 g007
Figure 8. The drag force of the vehicle in different fluid flow velocities: (a) steady velocity phase; (b) variable velocity phase.
Machines 13 00699 g008
Figure 9. Flow field velocity distribution around the transverse vehicle body: (a) t = 42 s; (b) t = 48 s.
Machines 13 00699 g009aMachines 13 00699 g009b
Figure 10. Pressure distribution on the transverse vehicle body surface: (a) t = 42 s; (b) t = 48 s.
Machines 13 00699 g010
Figure 11. The drag force of the transverse vehicle body: (a) steady velocity phase; (b) variable velocity phase.
Machines 13 00699 g011
Figure 12. Wake evolution and vortex Shedding of the transverse vehicle body.
Machines 13 00699 g012
Figure 13. Flow field velocity distribution around the vertical vehicle body: (a) t = 42 s; (b) t = 48 s.
Machines 13 00699 g013aMachines 13 00699 g013b
Figure 14. Pressure distribution on the vertical vehicle body surface: (a) t = 42 s; (b) t = 48 s.
Machines 13 00699 g014aMachines 13 00699 g014b
Figure 15. The drag force of the vertical vehicle body: (a) steady velocity phase; (b) variable velocity phase.
Machines 13 00699 g015
Figure 16. Wake evolution and vortex Shedding of the vertical vehicle body.
Machines 13 00699 g016
Figure 17. Diagram of the vehicle body projection area.
Machines 13 00699 g017
Disclaimer/Publisher’s Note: The statements, opinions and data contained in all publications are solely those of the individual author(s) and contributor(s) and not of MDPI and/or the editor(s). MDPI and/or the editor(s) disclaim responsibility for any injury to people or property resulting from any ideas, methods, instructions or products referred to in the content.