Article

Drastically Accelerating Fatigue Life Assessment: A Dual-End Multi-Station Spindle Approach for High-Throughput Precision Testing

1
Department of Machinery and Metal Technology, Vocational School of Technical Sciences, Gaziantep Islam Science and Technology University, Gaziantep 27470, Türkiye
2
Aerospace Engineering Department, Faculty of Aeronautics and Aerospace, Gaziantep University, Gaziantep 27310, Türkiye
*
Author to whom correspondence should be addressed.
Machines 2025, 13(8), 665; https://doi.org/10.3390/machines13080665
Submission received: 18 June 2025 / Revised: 21 July 2025 / Accepted: 25 July 2025 / Published: 29 July 2025

Abstract

This study introduces a time-efficient rotating bending fatigue testing system featuring 11 dual-end spindles, enabling simultaneous testing of 22 specimens. Designed for high-throughput fatigue life (S–N curve) assessment, the system theoretically allows over 93% reduction in total test duration, with 87.5% savings demonstrated in validation experiments using AISI 304 stainless steel. The PLC-based architecture provides autonomous operation, real-time failure detection, and automatic cycle logging. ER16 collet holders are easily replaceable within one minute, and all the components are selected from widely available industrial-grade parts to ensure ease of maintenance. The modular design facilitates straightforward adaptation to different station counts. The validation results confirmed an endurance limit of 421 MPa, which is consistent with the established literature and within ±5% deviation. Fractographic analysis revealed distinct crack initiation and propagation zones, supporting the observed fatigue behavior. This high-throughput methodology significantly improves testing efficiency and statistical reliability, offering a practical solution for accelerated fatigue life evaluation in structural, automotive, and aerospace applications.

1. Introduction

Fatigue failure is a dominant degradation mechanism in structural materials subjected to cyclic or fluctuating loads. It constitutes a major cause of mechanical failure across multiple engineering domains, notably in the aerospace, automotive, marine, energy, and defense industries [1,2]. Unlike static failure, fatigue initiates and propagates through microscopic cracks under stress levels well below the material’s yield or ultimate strength [3]. These cracks often originate from surface irregularities or geometric discontinuities and can lead to catastrophic fracture after a sufficient number of cycles. This phenomenon is particularly critical in components exposed to variable loading throughout their service life, such as aircraft wings, turbine blades, steel bridges, vehicle chassis, and chassis-mounted assemblies (e.g., suspension and steering components). These systems experience complex, fluctuating stress profiles, making fatigue resistance a fundamental requirement for ensuring structural reliability and operational safety. Consequently, a robust understanding of fatigue behavior is essential for both material qualification and mechanical design.
Therefore, fatigue testing is essential not only for characterizing the intrinsic properties of materials but also for validating their long-term structural reliability [4]. Testing actual components is often unfeasible because of their geometric complexity, high cost, and time-consuming nature. Consequently, empirical fatigue data remain limited in many engineering applications. Furthermore, theoretical formulations frequently fail to fully capture the real-world fatigue response of materials, making experimental validation indispensable. Notably, fatigue cracks can initiate at nominal stress levels far below the material’s tensile or yield strength, reinforcing the need for dedicated fatigue life assessments [5].
A variety of standardized fatigue testing methods have been developed to address different loading conditions. Low-cycle fatigue (LCF) testing, which is based on strain-controlled loading, is used to evaluate material performance under large plastic deformations and relatively short lifespans [6]. In contrast, high-cycle fatigue (HCF) tests apply stress-controlled loading within the elastic range, which reflects typical service conditions for most engineering components. Since these components are generally exposed to repetitive subyield stresses, understanding HCF behavior is essential for ensuring long-term durability.
Rotating bending fatigue testing remains a widely adopted approach in HCF research because of its experimental simplicity, high sensitivity to surface integrity, and ability to produce consistent and interpretable stress conditions. These experiments typically employ smooth, hourglass-shaped specimens that concentrate stress within a narrow gauge section, promoting controlled crack initiation and improving reproducibility. Standard guidelines, such as those outlined in the ASM Handbook [7], classify these specimens as unnotched owing to their geometry and low notch sensitivity (KT ≈ 1). This classification helps ensure consistency across experimental datasets. Owing to its inherently probabilistic nature, fatigue behavior often displays substantial variability, even when tests are conducted under nominally identical loading parameters. To ensure statistically robust results, standard experimental protocols require testing at a minimum of five distinct stress levels. Each stress level typically involves at least ten repeated measurements to account for variability [8,9]. However, conventional fatigue testing is highly time-consuming. A single test may require millions of cycles, often extending over weeks or even months. This inefficiency poses a major obstacle in industrial and academic environments where rapid, high-fidelity data acquisition is essential.
Recent research efforts have responded to this limitation by introducing multi-specimen fatigue testing systems designed to increase throughput without compromising reliability [10,11,12]. These systems allow multiple samples to be tested simultaneously, significantly reducing the experimental duration while enhancing the statistical robustness of the fatigue life estimations. Two primary machine configurations have emerged in the literature: four-point bending systems, which ensure uniform stress distribution through symmetrical loading [13,14,15,16,17], and cantilever-type rotating bending systems, which offer compactness and design flexibility [18,19,20].
Yamamoto et al. [11,12], for example, developed a dual-spindle rotating bending system capable of conducting parallel tests under varying stress levels. Their design demonstrated significant reductions in testing time without sacrificing accuracy. Similarly, Gentile et al. [10] introduced a machine that enables simultaneous testing of five specimens, further optimizing test efficiency. For full-scale structural components, Isakov et al. [16] proposed a large-scale system that replicates service-like loading conditions, thus enabling direct simulation of real-world fatigue behavior.
The choice of clamping mechanism significantly affects the precision and repeatability of fatigue tests. Traditional systems frequently utilize drill chucks for specimen fixation because of their low cost and ease of use [13,15,18,19,20]. However, such fixtures are often susceptible to axial misalignment, leading to undesirable stress variations and data scatter. To address this issue, several studies have adopted collet-based systems, which offer improved concentricity and mechanical stability [10,11,12,17]. In large-scale setups, Isakov et al. [16] implemented a conical locking design using a shaft nut to maintain load uniformity and alignment under elevated stress conditions.
In addition to clamping, load application and power transmission methods vary considerably across fatigue systems. While early setups often relied on static dead weights, more recent designs incorporate hydraulic pistons and closed-loop load cell systems to deliver dynamic and precisely controlled force profiles [10,16]. These advances allow for better load regulation and real-time feedback, which are vital for accurate fatigue life prediction. Similarly, drive systems range from direct-drive electric motors, which are valued for their simplicity, to belt-driven configurations that minimize vibration and enhance control. Notably, Yamamoto et al. [11,12] employed a dual-motor V-belt system that enabled independent control of each spindle. In contrast, Gentile et al. [10] utilized a single-motor timing belt mechanism to simultaneously drive five spindles, aiming to minimize energy losses and mechanical noise.
Despite these advancements, current systems still face several limitations. Most notably, challenges remain in scaling up specimen capacity without compromising mechanical stability. The synchronization of multiple rotating axes, especially under high-frequency conditions, also presents ongoing technical hurdles. Furthermore, the lack of real-time monitoring and adaptive load control in many existing systems restricts their responsiveness to material behavior under cyclic loads.
Compared with prior multi-specimen testing configurations such as those introduced by Yamamoto et al. and Gentile et al., the current system distinguishes itself through a markedly simplified and modular architecture. While Yamamoto’s approach employs independently motor-driven spindles, Gentile’s configuration uses a timing belt system combined with custom spindle geometries. In contrast, the design presented in this study adopts commercially available ER collet holders and a crowned flat pulley. Such a configuration enables synchronized rotation while maintaining minimal mechanical complexity. Notably, the modular design incorporates industrial-standard collet holders to facilitate ease of maintenance. As a result, critical spindle components such as collet holders and the central pulley can be installed or replaced in less than one minute. This feature not only streamlines the initial setup but also facilitates rapid maintenance interventions without requiring advanced technical skills. Furthermore, the direct deadweight loading mechanism is implemented via precision-machined CNC components. This setup enables straightforward, Newton-based force application without the need for calibration procedures or algebraic corrections. Collectively, these design decisions emphasize manufacturability, maintainability, and accessibility, offering a practical solution to longstanding engineering challenges in scalable fatigue testing.
In light of these challenges, the present study introduces a novel high-throughput rotating bending fatigue testing machine. The system employs eleven dual-end spindle assemblies, allowing for the simultaneous testing of twenty-two specimens. This configuration not only shortens the experimental timeframes but also enhances the statistical reliability of the fatigue data. The following sections present a detailed description of the system’s mechanical design, experimental methodology, and case study conducted using AISI 304 stainless steel specimens, which were fully machined and supplied by Demir Torna (Gaziantep Organized Industrial Zone, Gaziantep, Türkiye) to validate the platform’s performance. This material is commonly employed in various industries, including aerospace and food processing, because of its favorable mechanical and corrosion resistance properties.

2. Materials and Methods

2.1. Specimen Design

The technical dimensions of the specimen, which was machined from 8 mm bar material and reduced to a body diameter of 6 mm, are shown in detail in Figure 1. The notch sensitivity coefficient of the hourglass-type specimen with the specified dimensions was determined to be 1.02 [21]. Since such values are approximately 1, they are considered smooth (unnotched) specimens.
The specimens used in this study were manufactured from AISI 304 stainless steel, which is widely used in the food, aerospace, and machinery industries. The chemical composition of the material is detailed in Table 1. In addition, its mechanical properties (yield strength, tensile strength, modulus of elasticity, etc.) are presented in Table 2.

2.2. Machine Design and Assembly

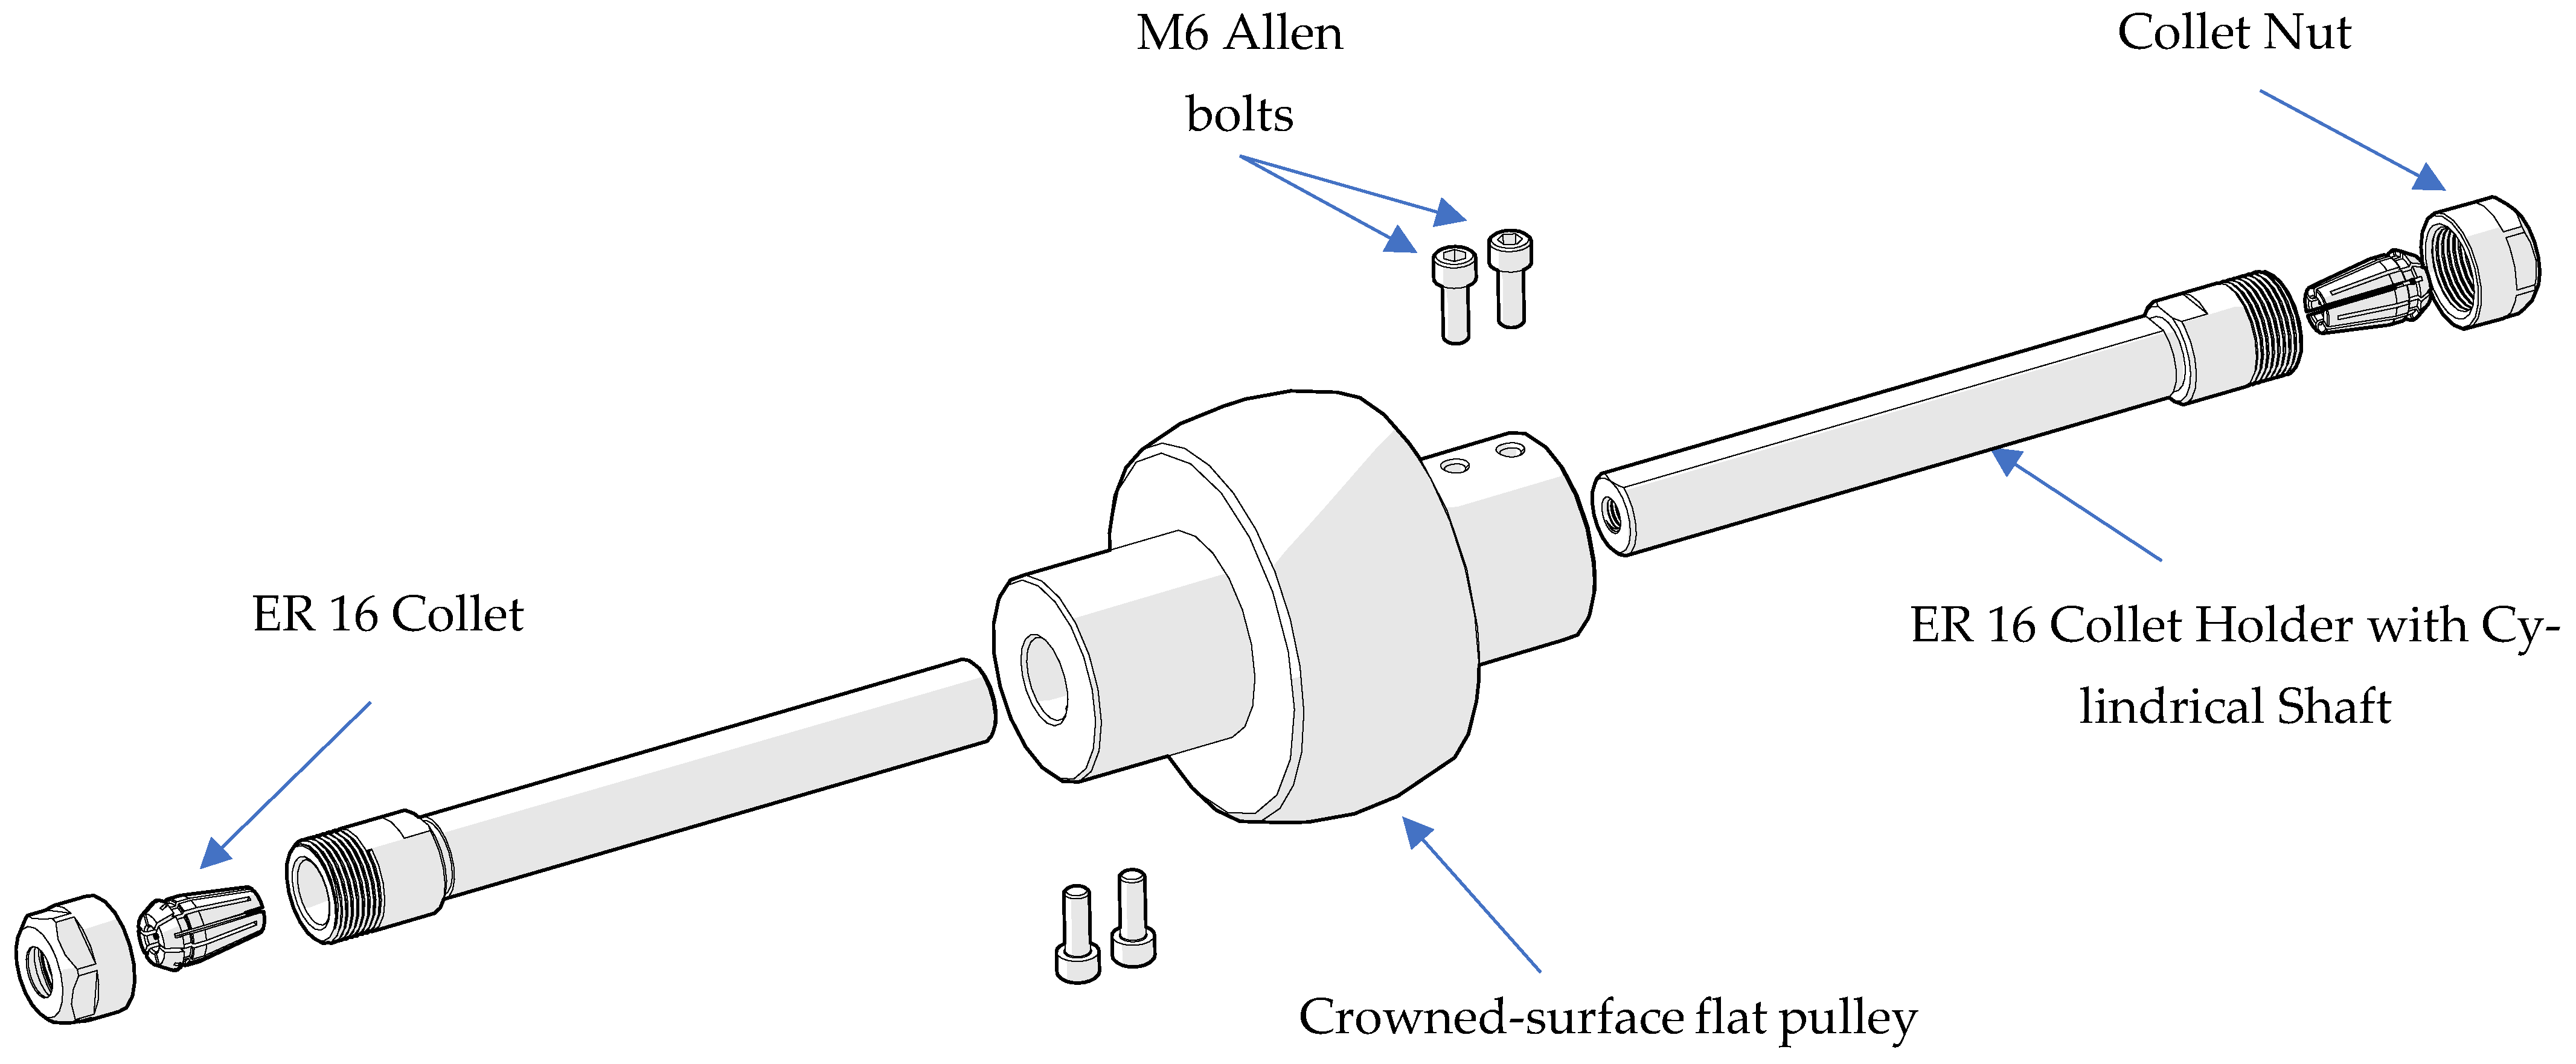
Rotating bending fatigue tests of cylindrical specimens are best performed via ER16 collets, which provide concentric alignment and secure clamping under cyclic loads. In this setup, two ER16 collet holders (Ø20 mm, 150 mm length) were mounted back-to-back inside a shared pulley, forming a dual-end spindle. This configuration enables synchronized rotation of two specimens, as illustrated in Figure 2.
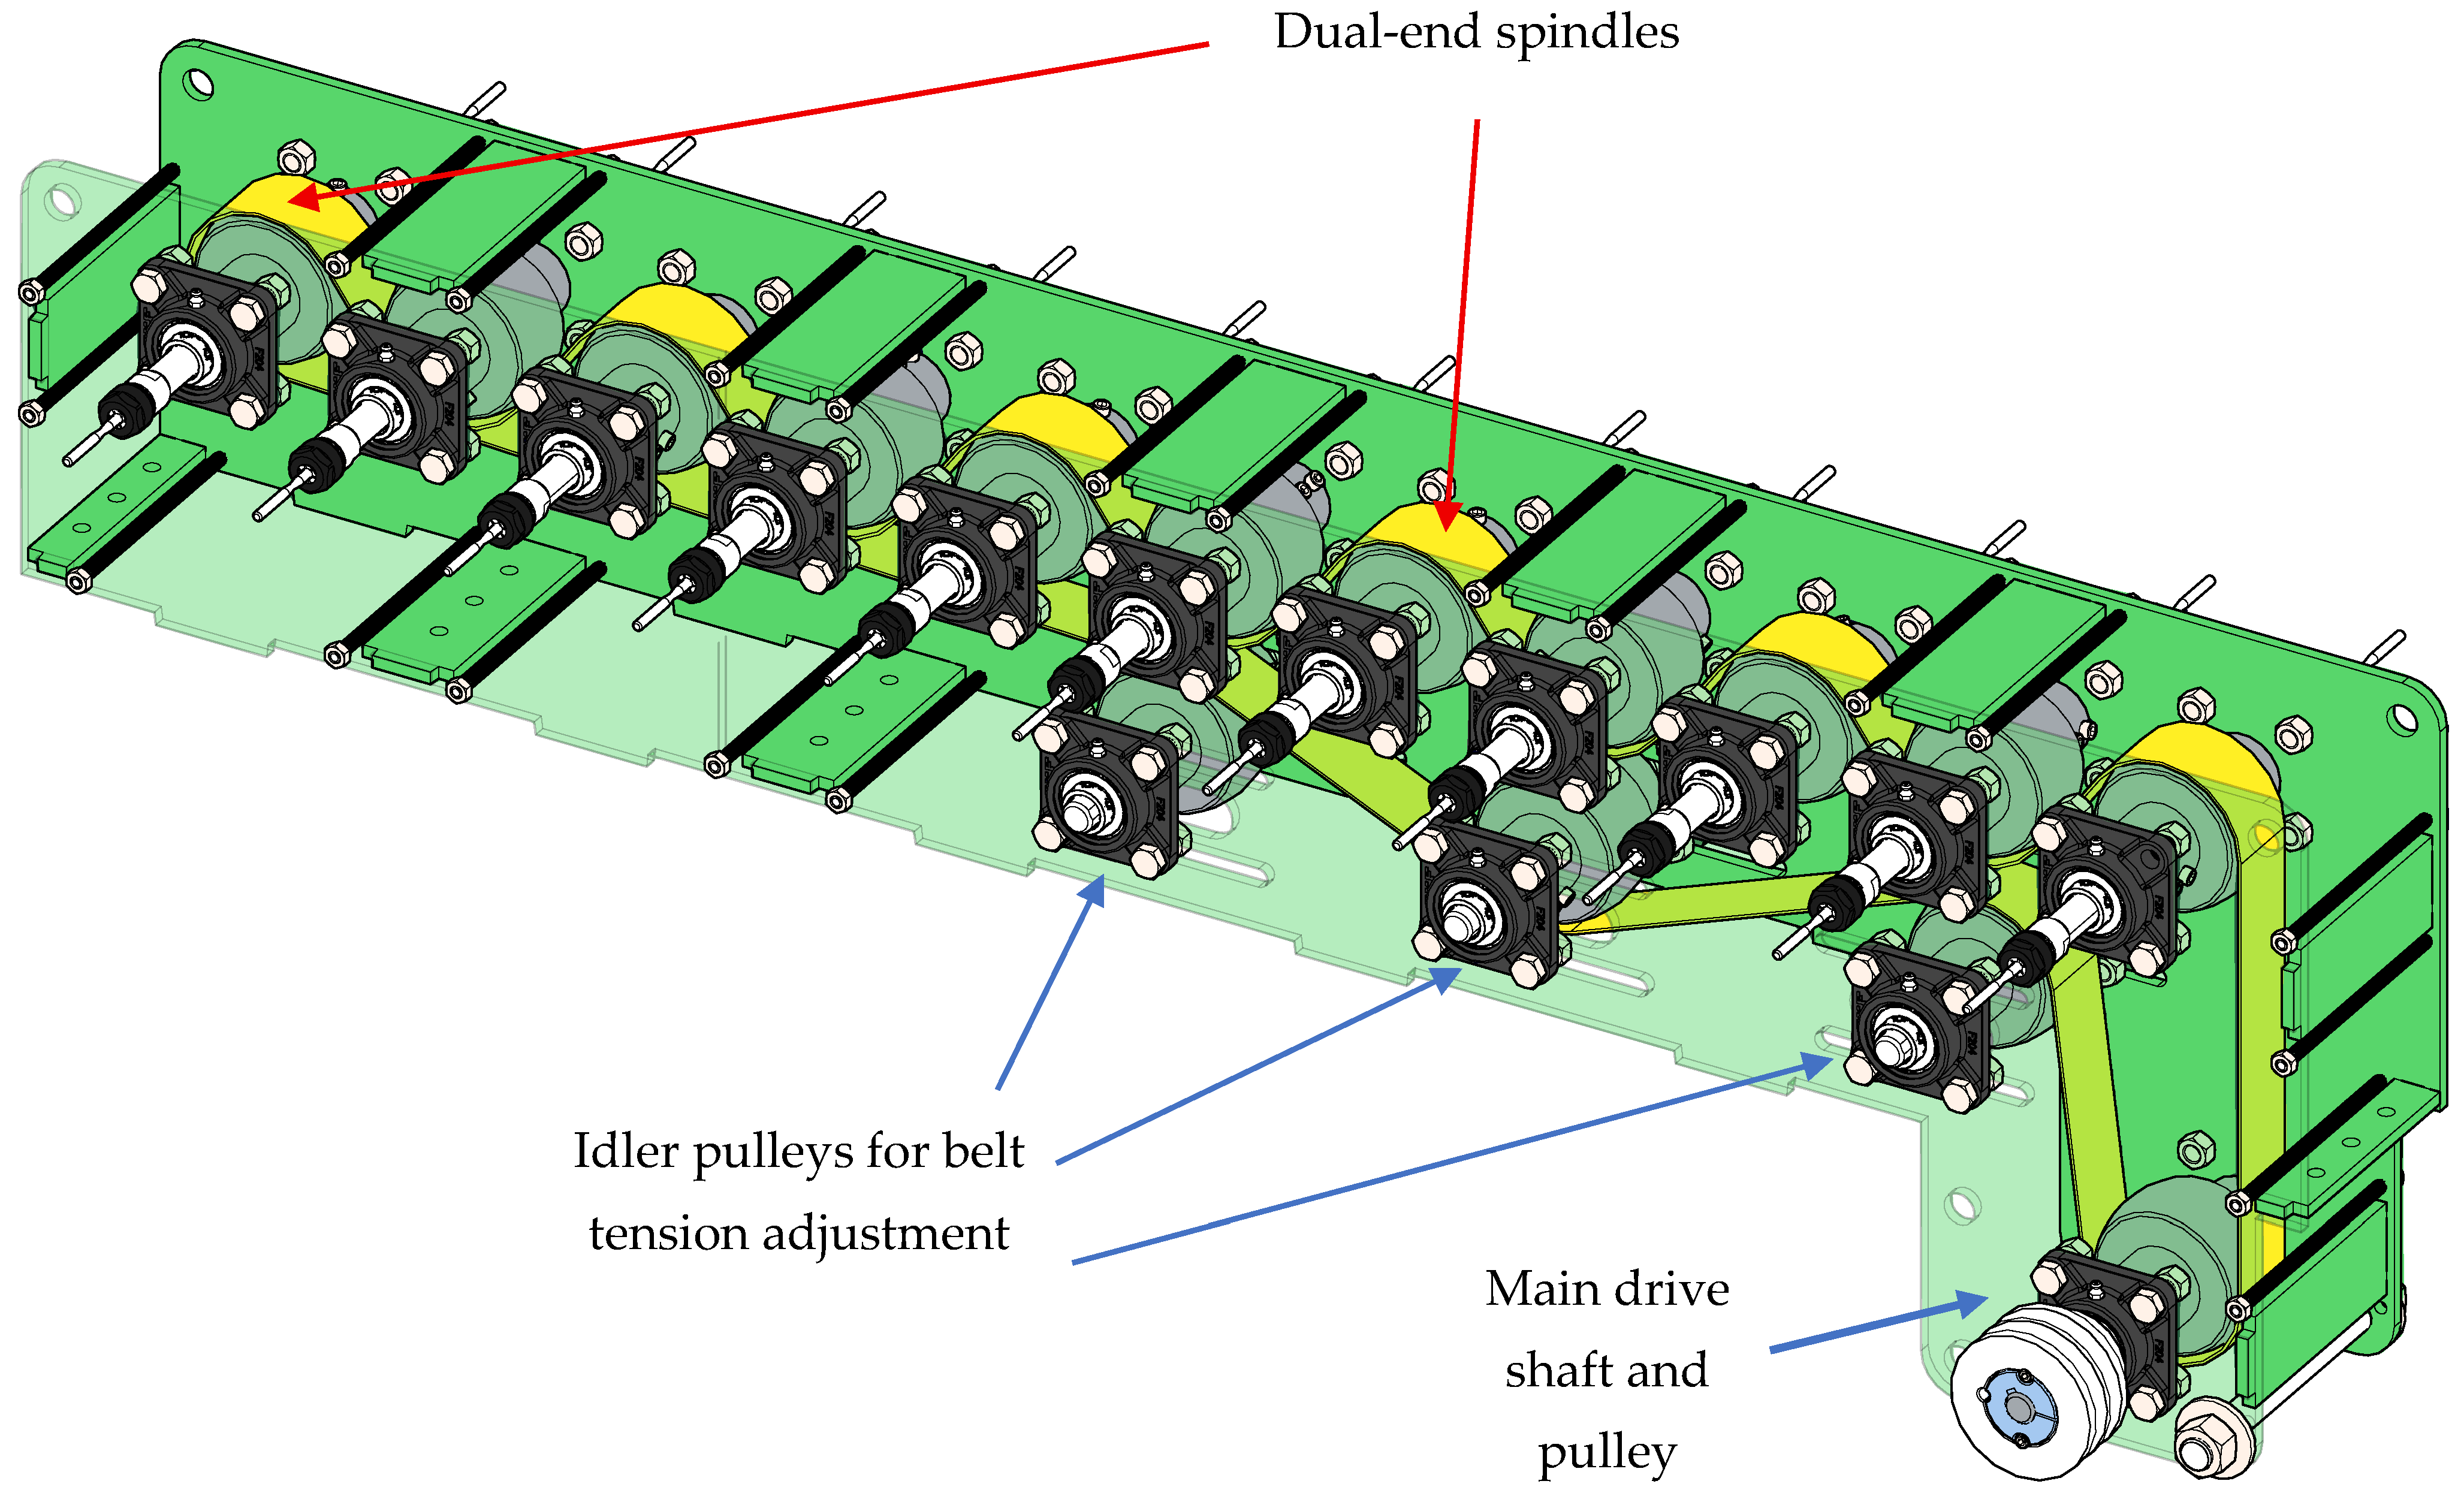
The system includes eleven dual-end spindles driven by a 50 × 2 mm flat belt, allowing 22 specimens to be tested in parallel. The belt tension is controlled by three idler pulleys. Beyond rotational precision, ease of maintenance was a design priority. Each spindle unit can be removed and replaced in approximately one minute because of its modular structure [22]. This feature reduces downtime and supports rapid recovery during multi-specimen test campaigns. The complete mounting configuration is shown in Figure 3.
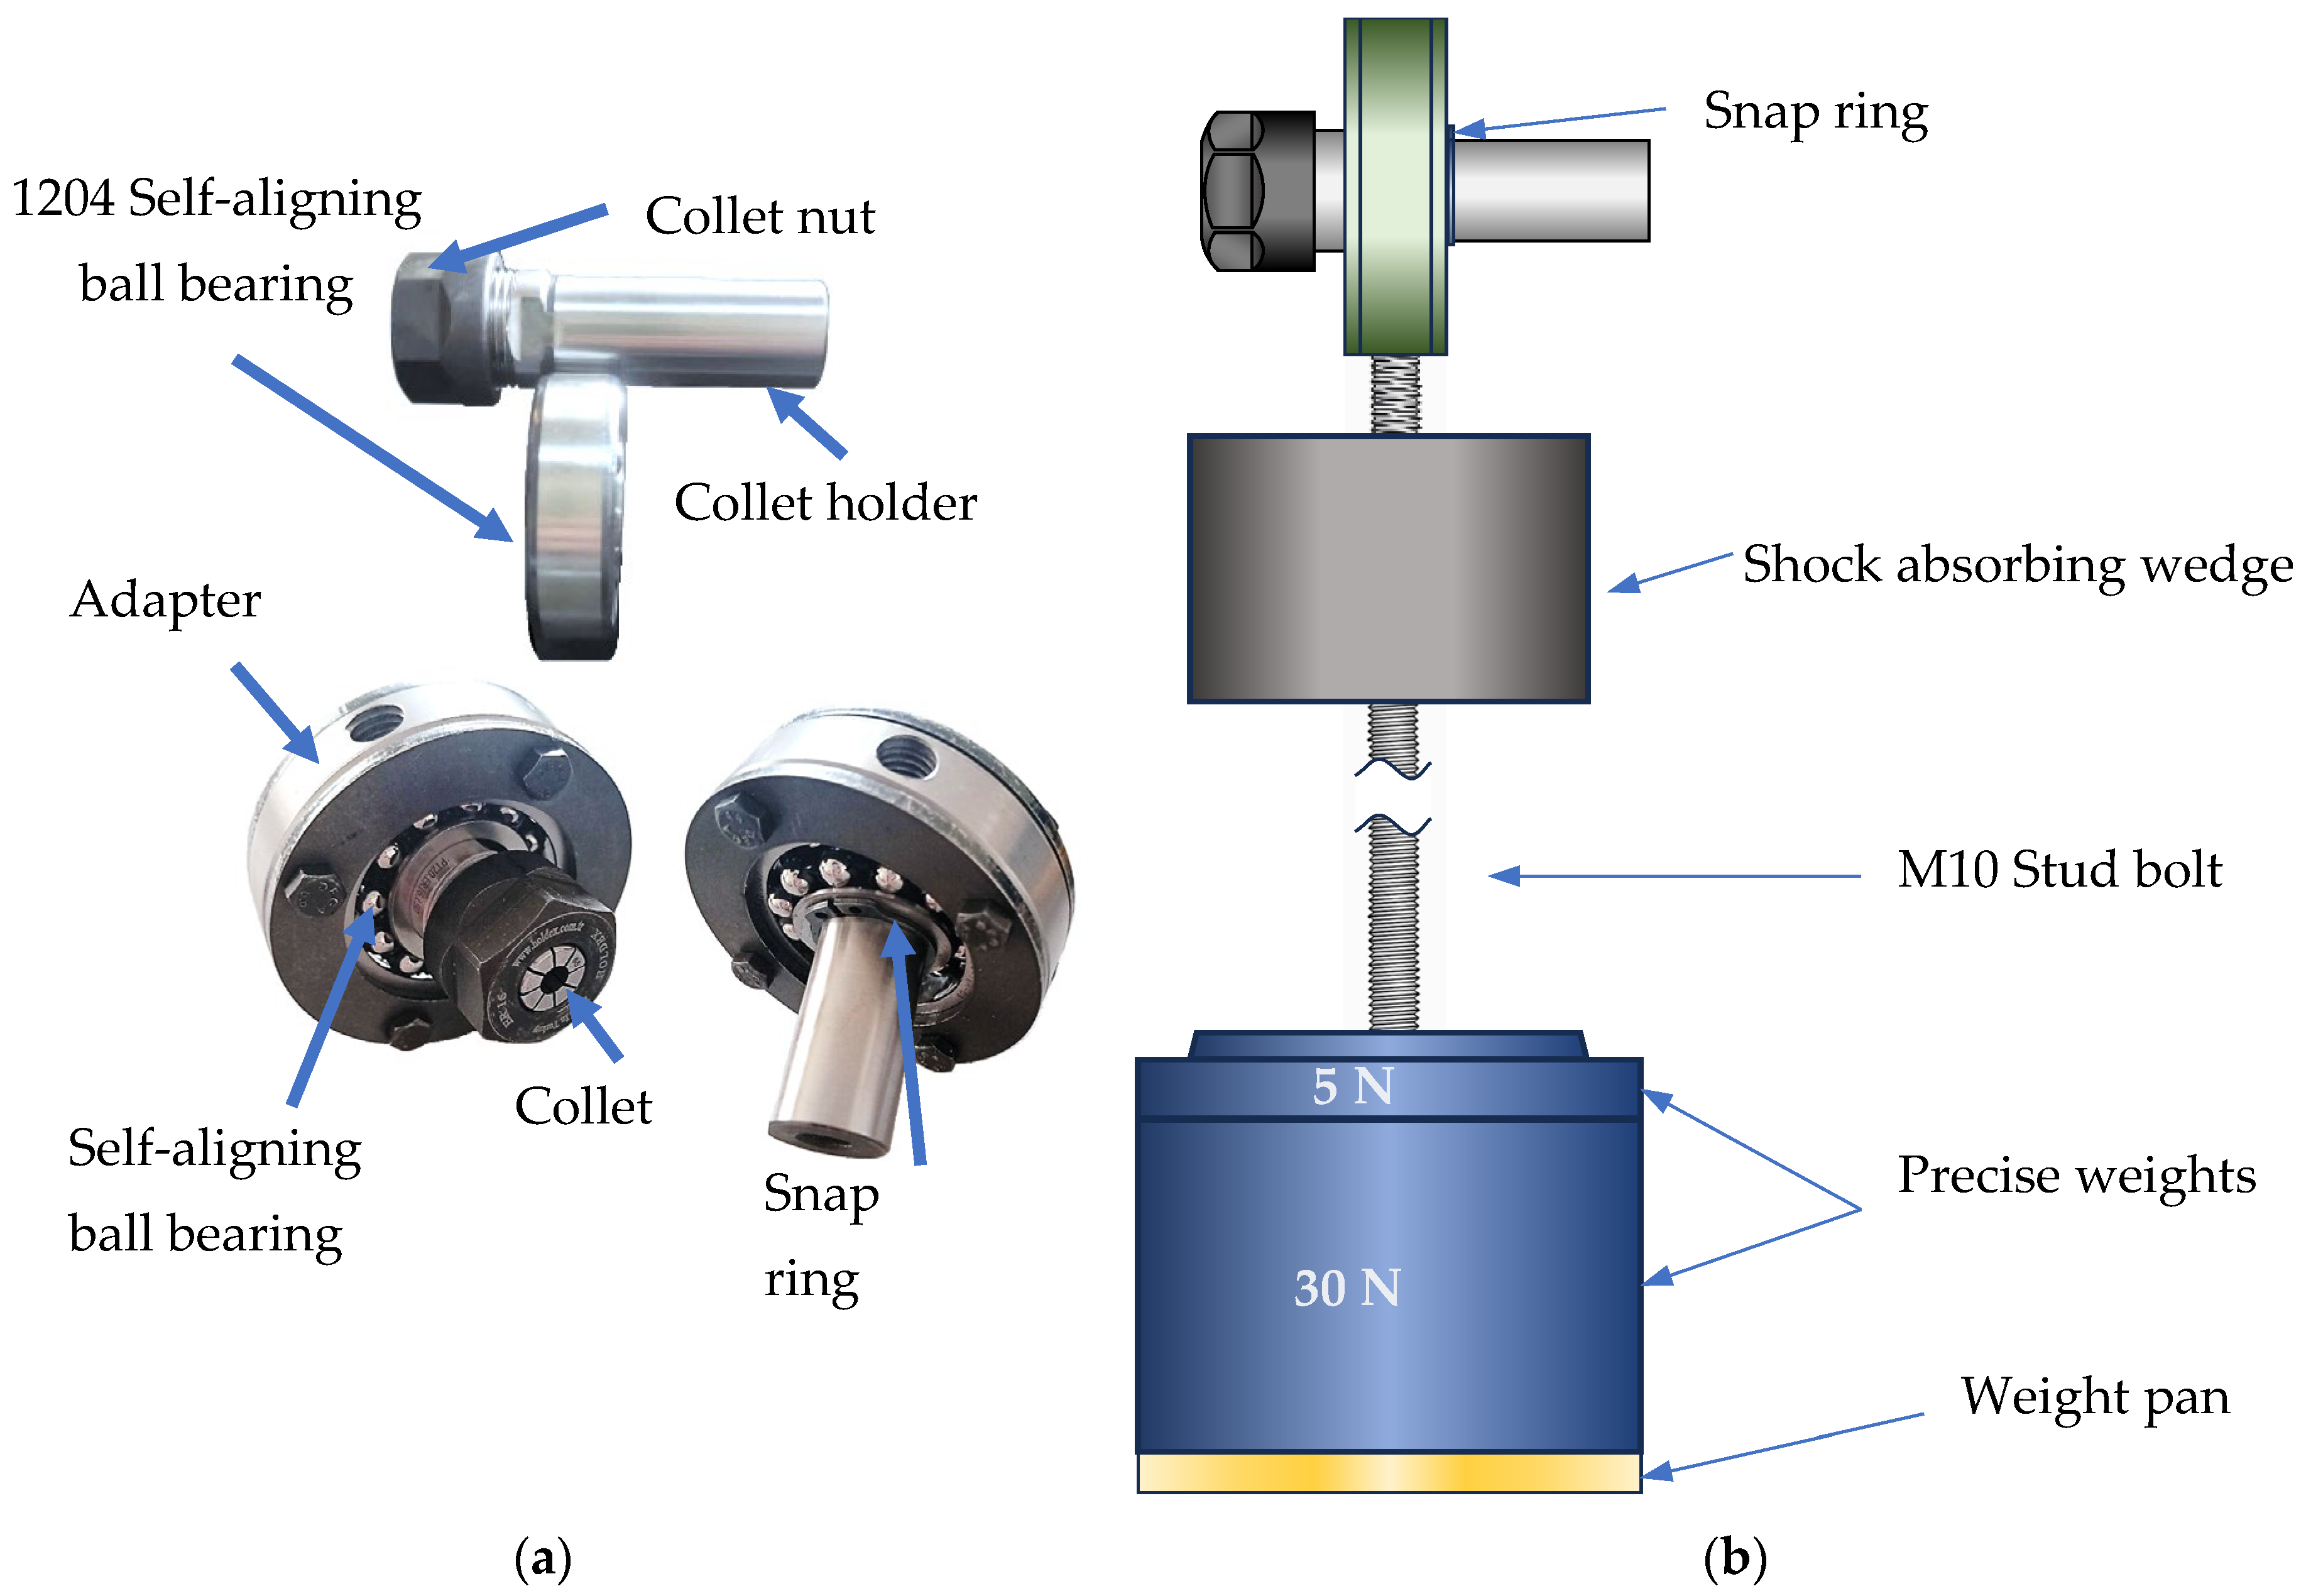
To facilitate suspended weight loading during fatigue testing, an idle weight assembly was developed on the idler side. A precision ER16 collet holder with a 20 mm diameter and 50 mm shaft length was employed to anchor the loading interface. A 1204 self-aligning ball bearing was mounted onto the collet shank to accommodate rotational misalignment and was axially secured via a snap ring seated within the inner race. An adapter fitted to the outer race provided a mounting point for the weight hanger, forming a compact and stable connection between the rotating support and the applied load. The complete idle weight assembly is illustrated in Figure 4a.
External loading was applied via a modular idler weight pan, which was affixed to the adapter by means of an M10 threaded stud. To prevent impact damage in the event of a sudden specimen fracture, a polymer-based shock-absorbing wedge was positioned between the weight assembly and the collet interface. The idle weight assembly was precisely balanced to a self-weight of 17.5 N. Additional test-specific loading was introduced via standardized precision weights of 5 N and 30 N, with each CNC machined with a tolerance of ±5 g. The complete load application sequence, including the weight attachment strategy and axial configuration, is schematically illustrated in Figure 4b.
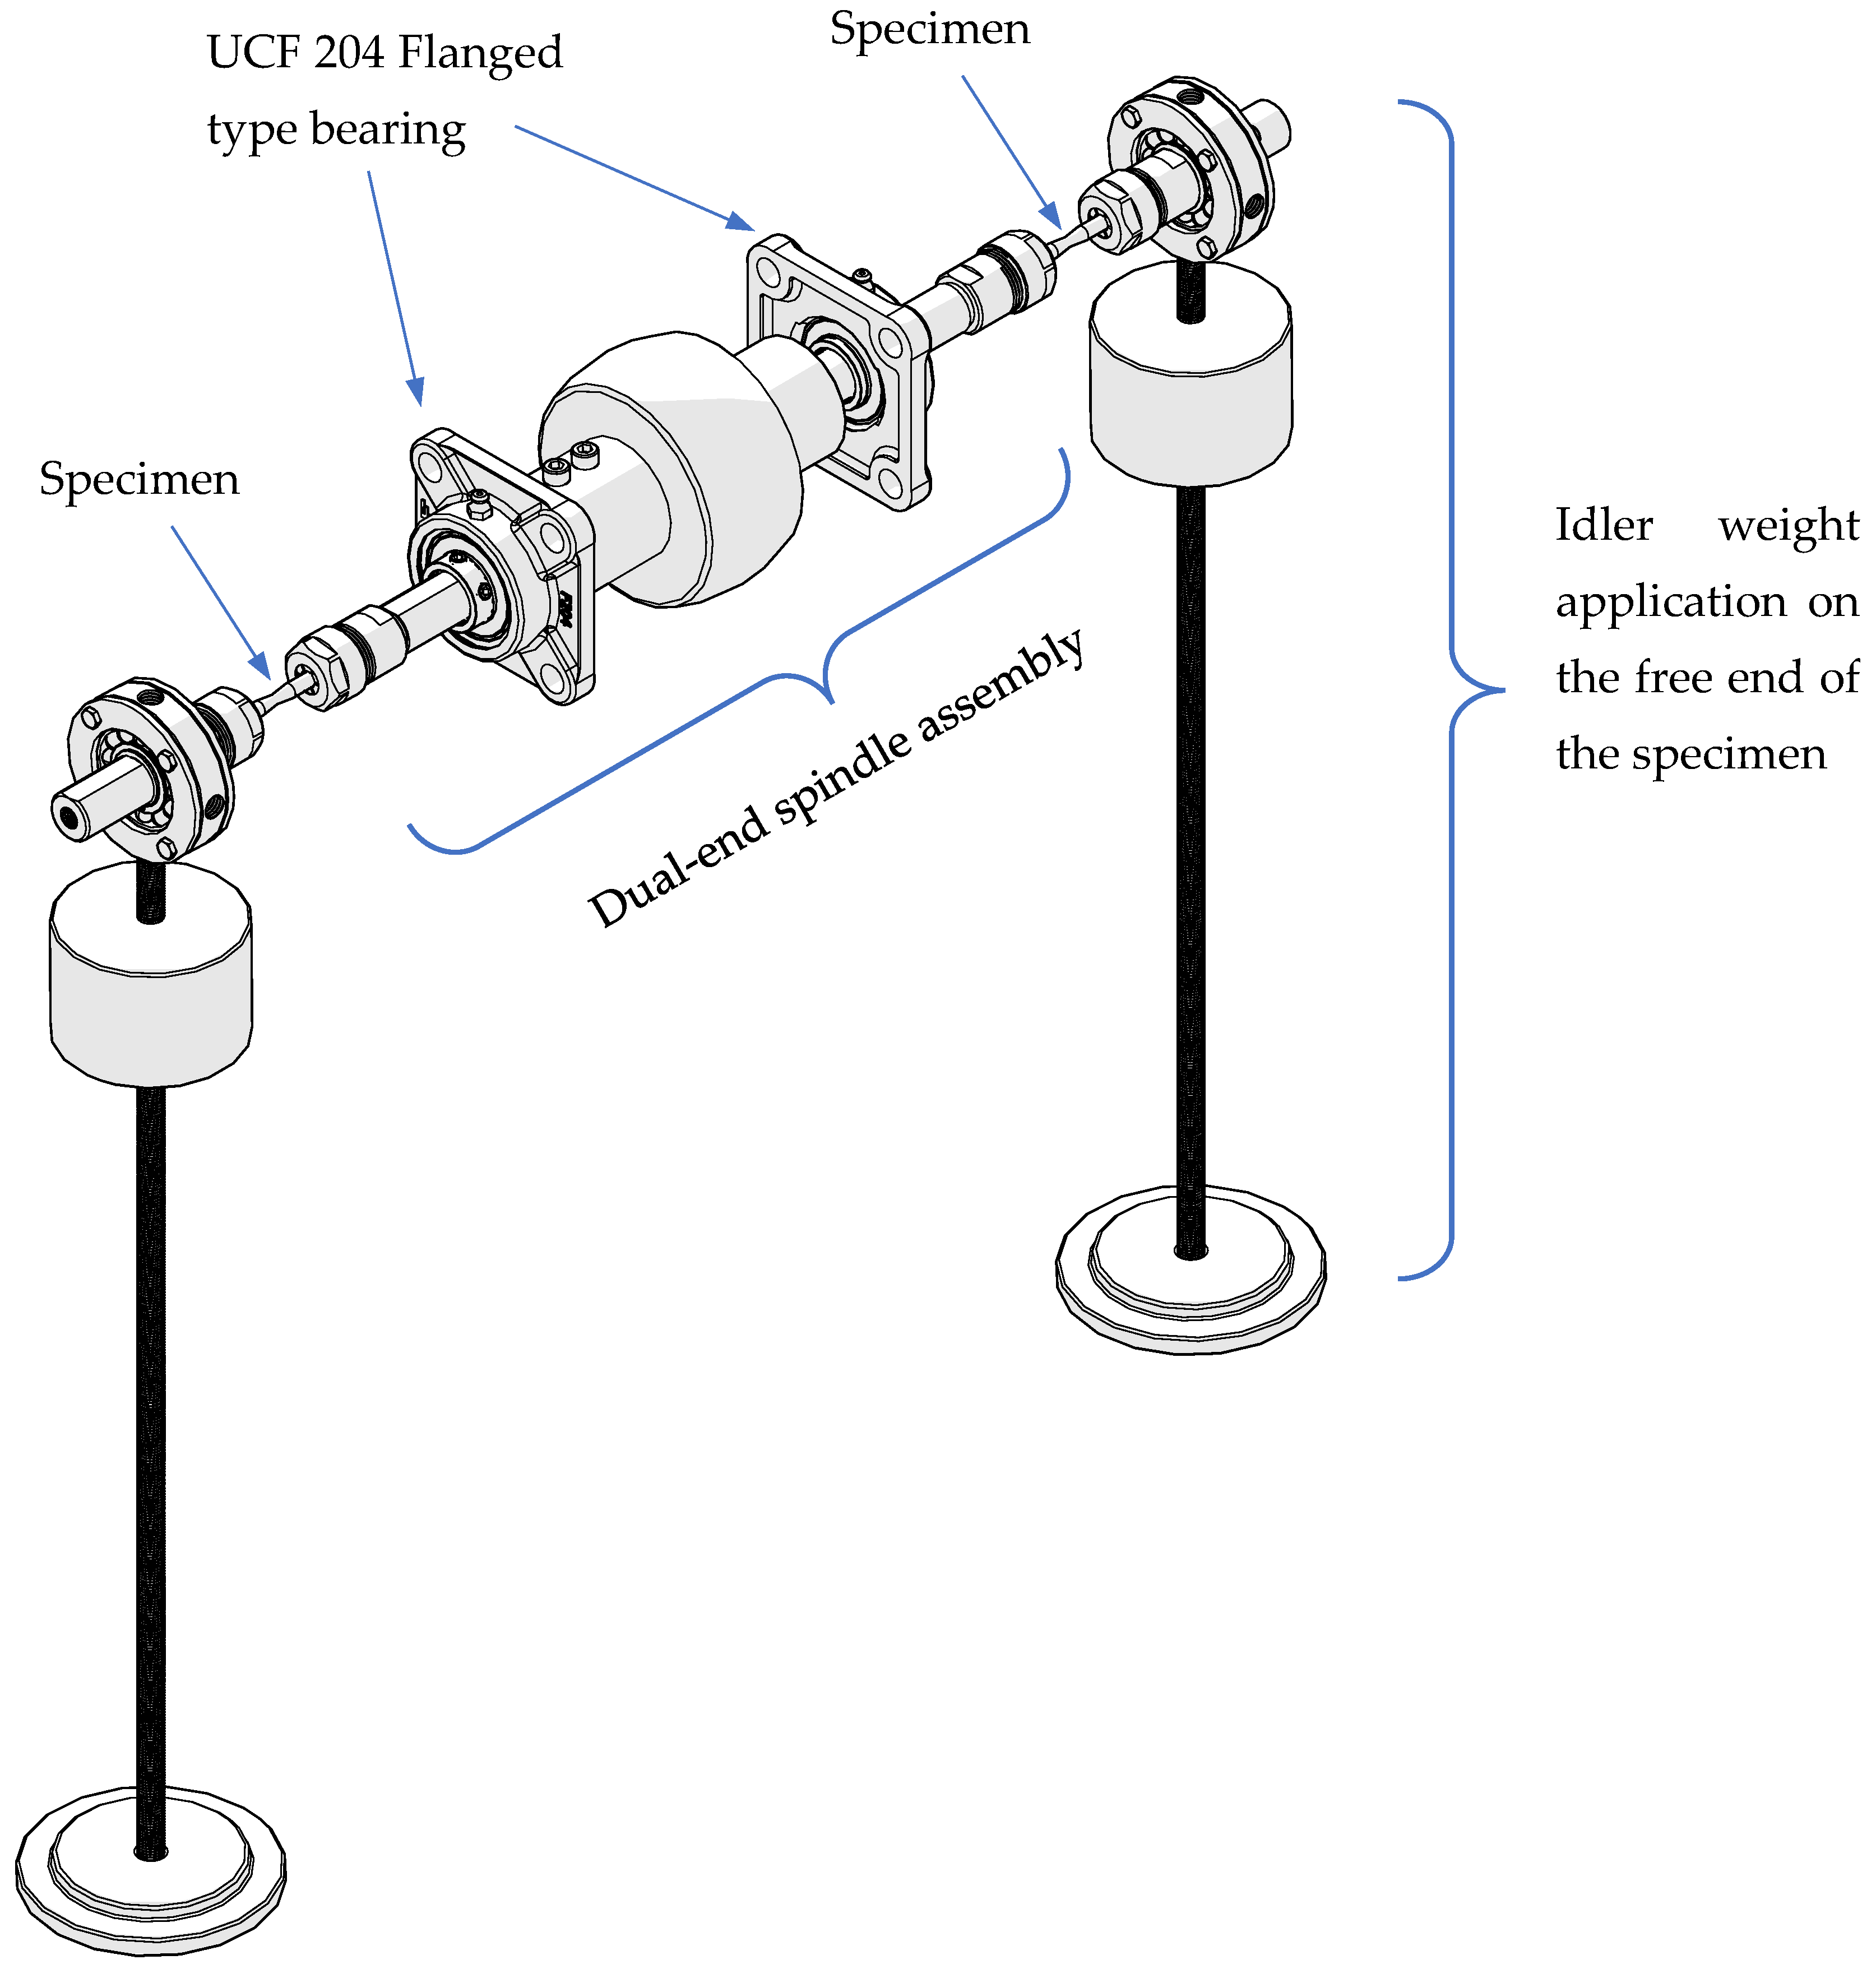
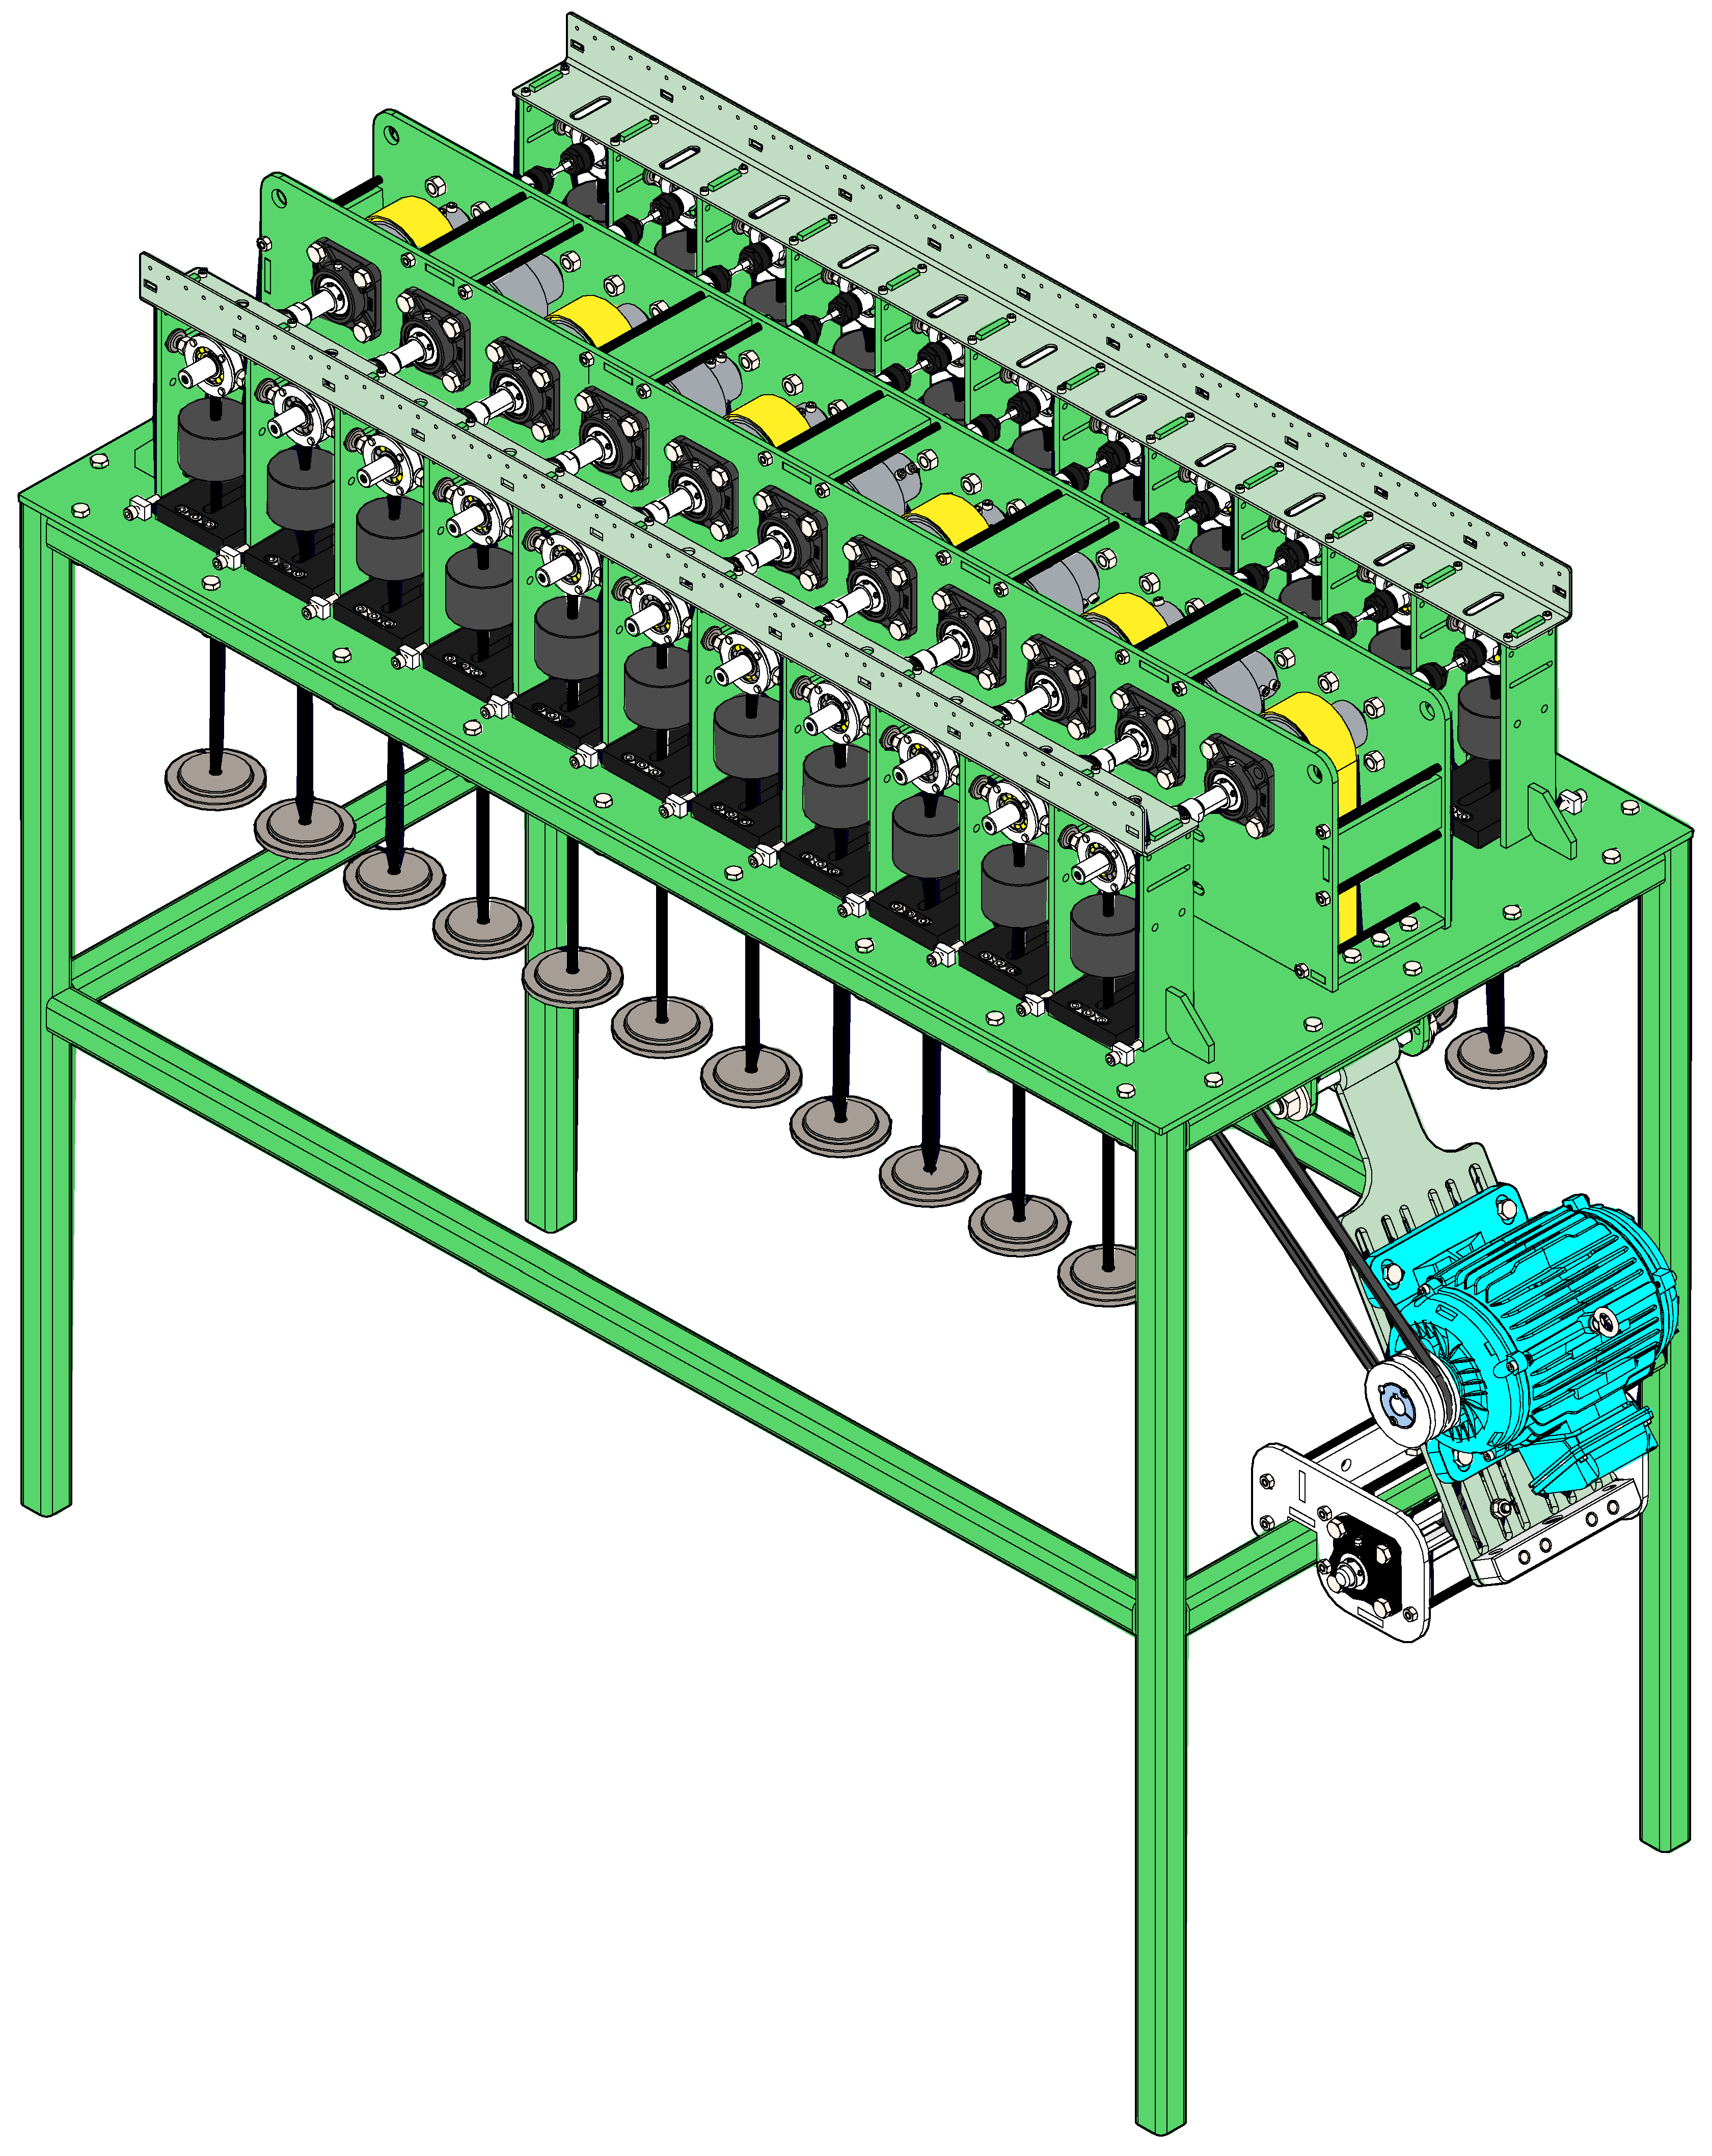
The implementation of the idler weight configuration, initially described in Figure 4, is illustrated in Figure 5 as applied to the dual-end spindle architecture. On the basis of this schematic layout, the complete mechanical assembly of the fatigue testing platform, which consists of eleven dual-end spindle units, is presented in Figure 6. Notably, the control system components are not included in this illustration as the figure focuses exclusively on the mechanical aspects of the setup.
Detailed descriptions of the control system architecture, including sensor integration, PLC logic, and interface design, have been thoroughly documented in a previous study by Doğan et al. (2025) [23]. Readers interested in the control framework and automation strategy are encouraged to consult that publication for further technical information.

2.3. Scientific Basis and Calculation

The points where the stress occurs on the specimen can be analyzed, and the point where the highest stress occurs can be determined via calculations. The calculation applications to be made with reference to the loading scheme shown in Figure 7 are expressed in Table 3.

2.4. Design Considerations Behind the Number of Test Stations

The selection of 22 test stations was based on a deliberate optimization balancing the experimental scope, mechanical design, and operational efficiency. While standard fatigue protocols recommend at least five stress levels with ten specimens per level to ensure statistical validity [8,9], the present study employed a more refined plan: seven stress levels with ten specimens each, totaling 70 tests.
The machine uses a dual-end spindle configuration, where each spindle holds two specimens simultaneously. To enable two full sets (i.e., 20 specimens) to be tested concurrently, ten dual-end spindles were needed. This setup allowed continuous testing of two stress levels in parallel, thereby increasing the statistical efficiency while minimizing operator intervention.
To account for potential fixture or spindle failures during long-duration experiments, a 10% redundancy was added to the number of dual-end spindles. As a result, the system was equipped with 11 spindles, providing 22 test stations in total. This additional capacity supports fault tolerance, ensuring uninterrupted test execution without compromising throughput.
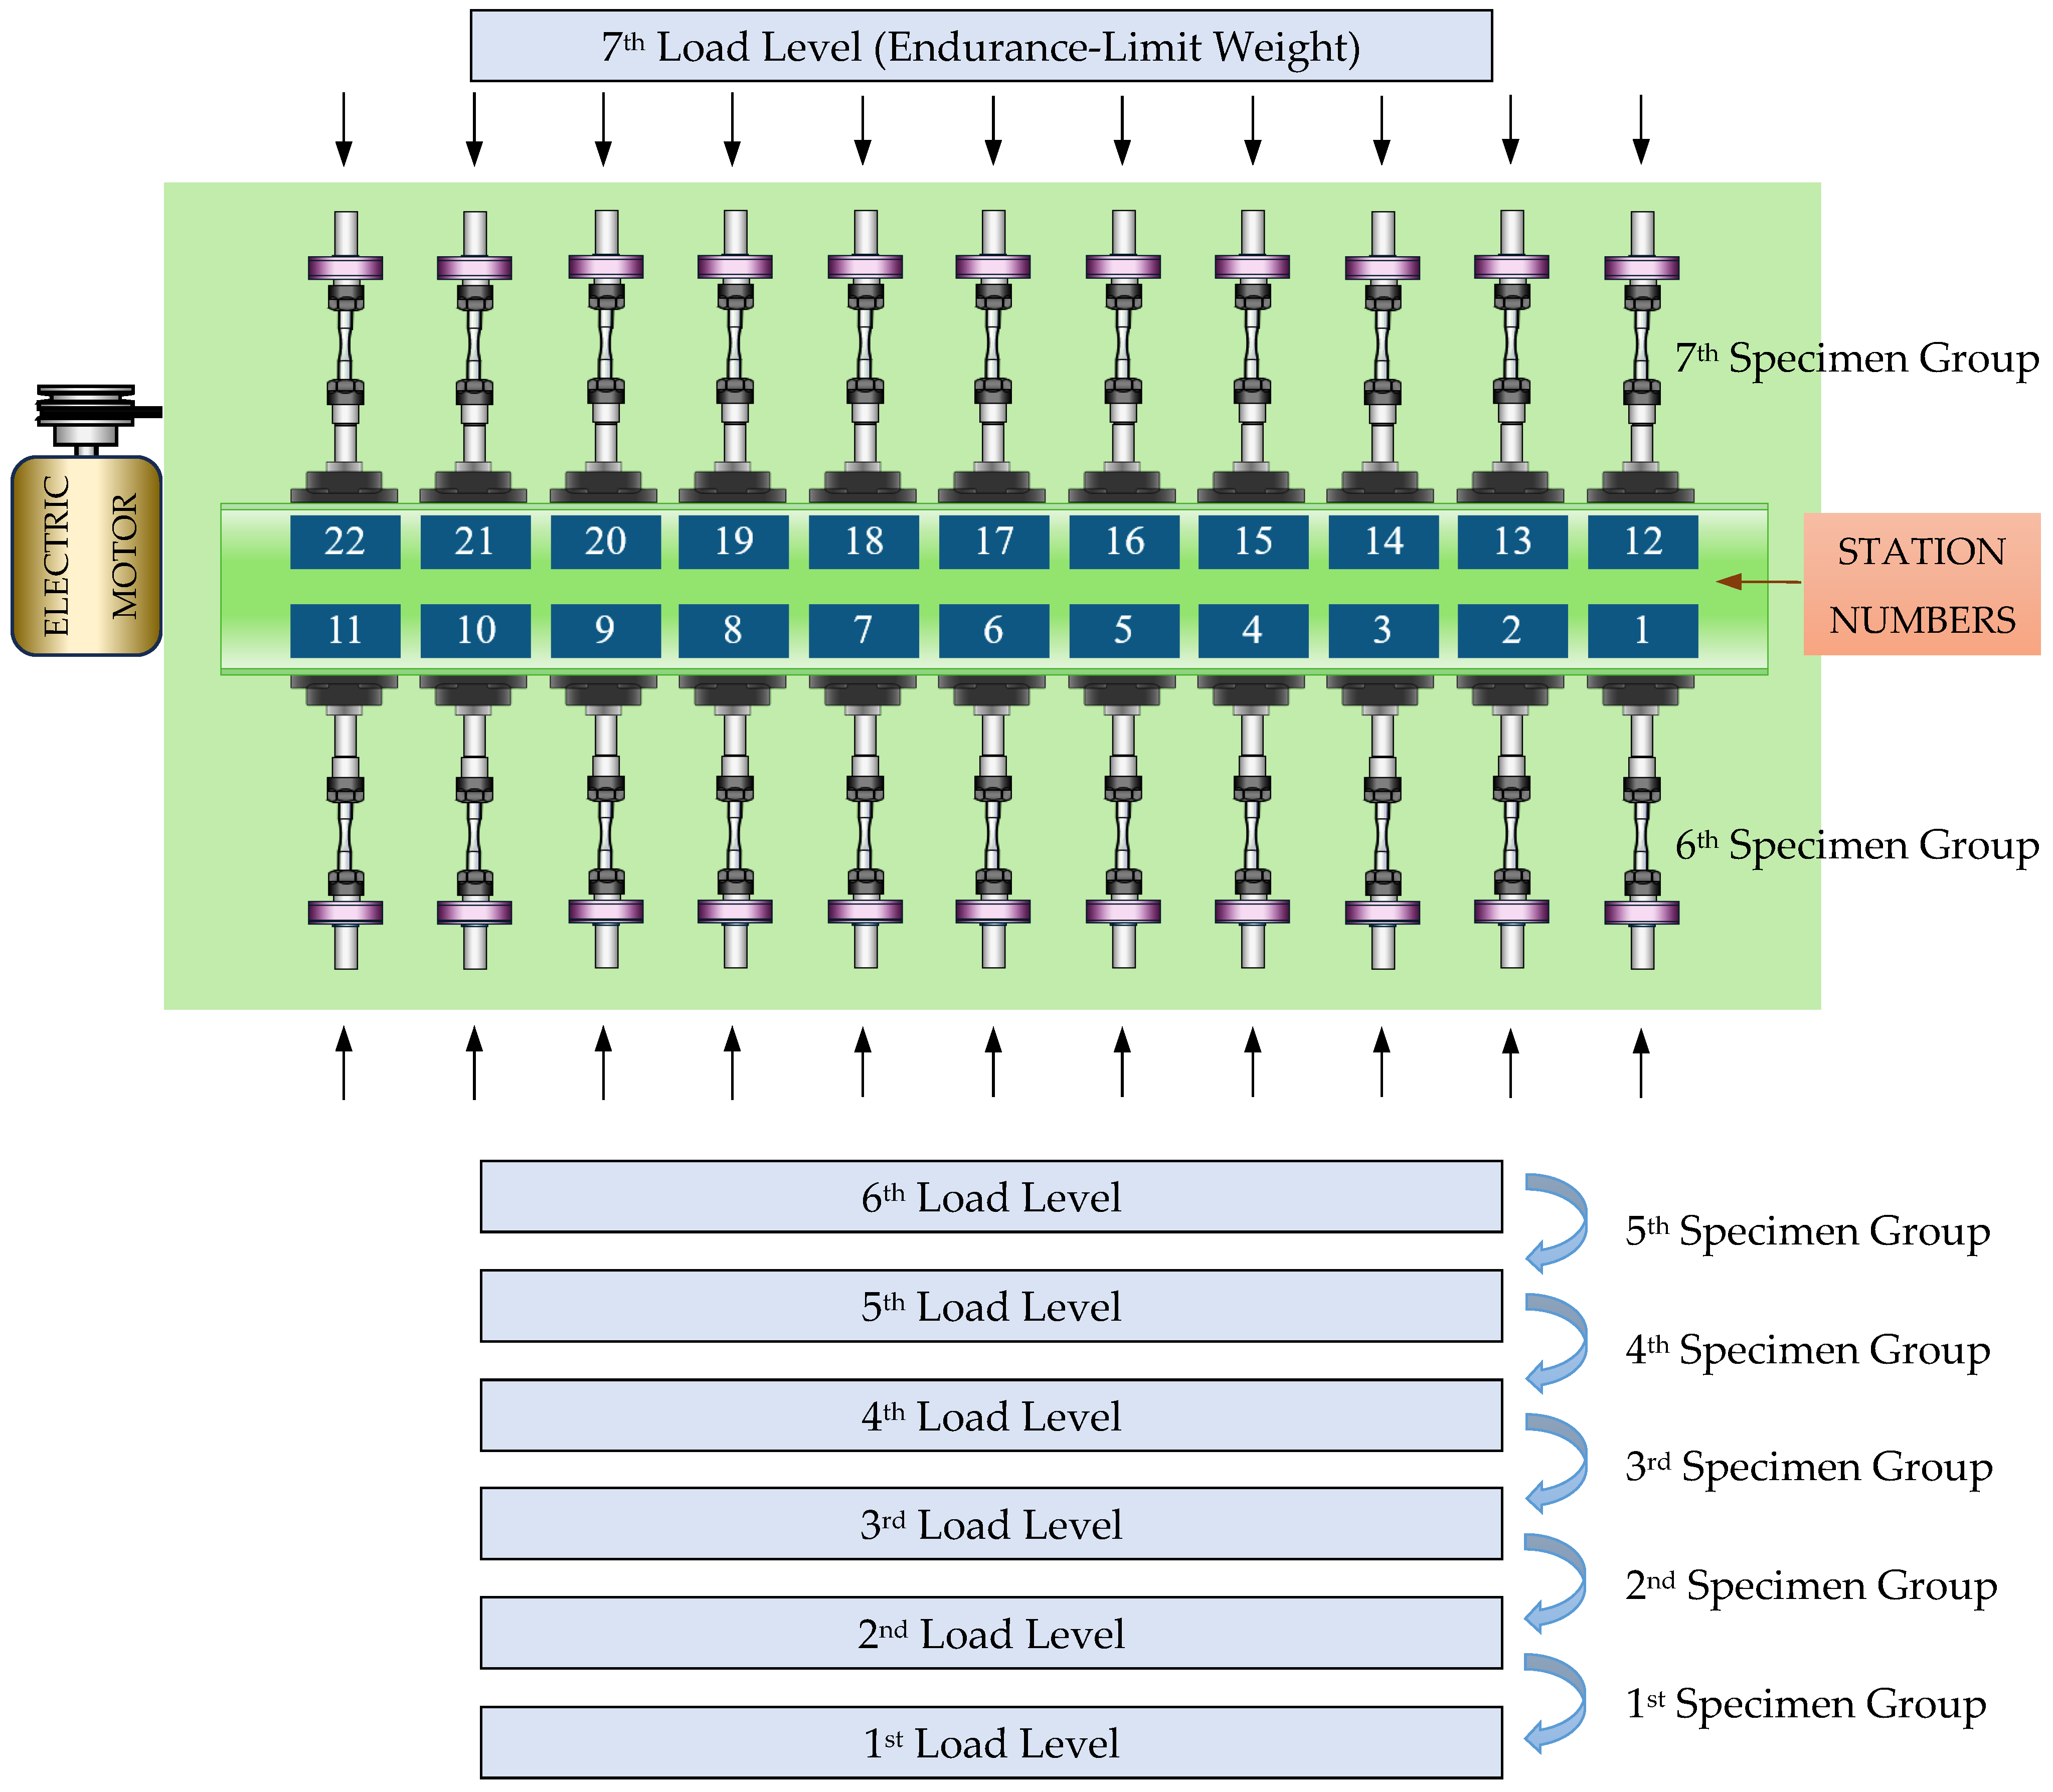
A central goal in system planning was to synchronize the total test duration with the longest test cycle—namely, the endurance-limit condition. This was achieved by initiating the long-life tests first, whereas the opposite set of spindles was used for sequential short-life tests. When the specimens failed, they were replaced with the next group in the test matrix (Figure 8). The aim was to complete all 70 tests within the same time window as a single endurance-limit test, maximizing temporal efficiency.

3. Experimental Results

The ASTM E466 standard provides foundational guidance for fatigue testing and specifies a frequency range of 10−2 Hz to 102 Hz for such applications [24]. In alignment with these recommendations and the ASM Handbook Vol. 19, which prescribes a rotational bending fatigue test speed between 0 and 10,000 rpm [5], a fixed operating speed of 1000 rpm was selected for all the experiments. This speed selection complies with ASTM E466 and ASM Handbook recommendations and was found to produce stable operation without any observable dynamic instabilities or resonance throughout the experimental campaign. All tests were conducted under stable laboratory conditions (25 ± 2 °C), and ambient temperature and humidity fluctuations were considered negligible.
To identify the endurance limit of the material, a stepwise preliminary testing protocol was adopted. This protocol involved initiating fatigue tests at a high load level, near the yield strength of the material, and progressively decreasing the applied load in subsequent trials. After each reduction, fatigue tests were performed to observe whether specimens failed around 106 cycles. If failure occurred, the load was further reduced, and the process was repeated. Once a stress level was reached at which no failures were observed, even after extended cycling, that level was considered a candidate for the endurance limit. Under ideal laboratory conditions, the endurance limit refers to the highest completely reversed stress level under which the material can theoretically endure an infinite number of cycles without failure.
These preliminary tests were conducted on AISI 304 stainless steel specimens following the systematic experimental plan illustrated in Figure 8. The loading levels were configured by combining a fixed pan weight with incrementally varied additional weights, as detailed in Table 4. Notably, at a total applied load of 47.5 N, mixed results were observed: while some specimens failed between 106 and 107 cycles, others exhibited runout behavior, surviving the entire test duration without failure. At the next lower load level of 42.5 N, none of the specimens failed, even after prolonged testing. These outcomes indicate that 47.5 N corresponds to the threshold stress marking the transition between finite and infinite fatigue life and thus represents the endurance limit for the tested material under the given experimental conditions.
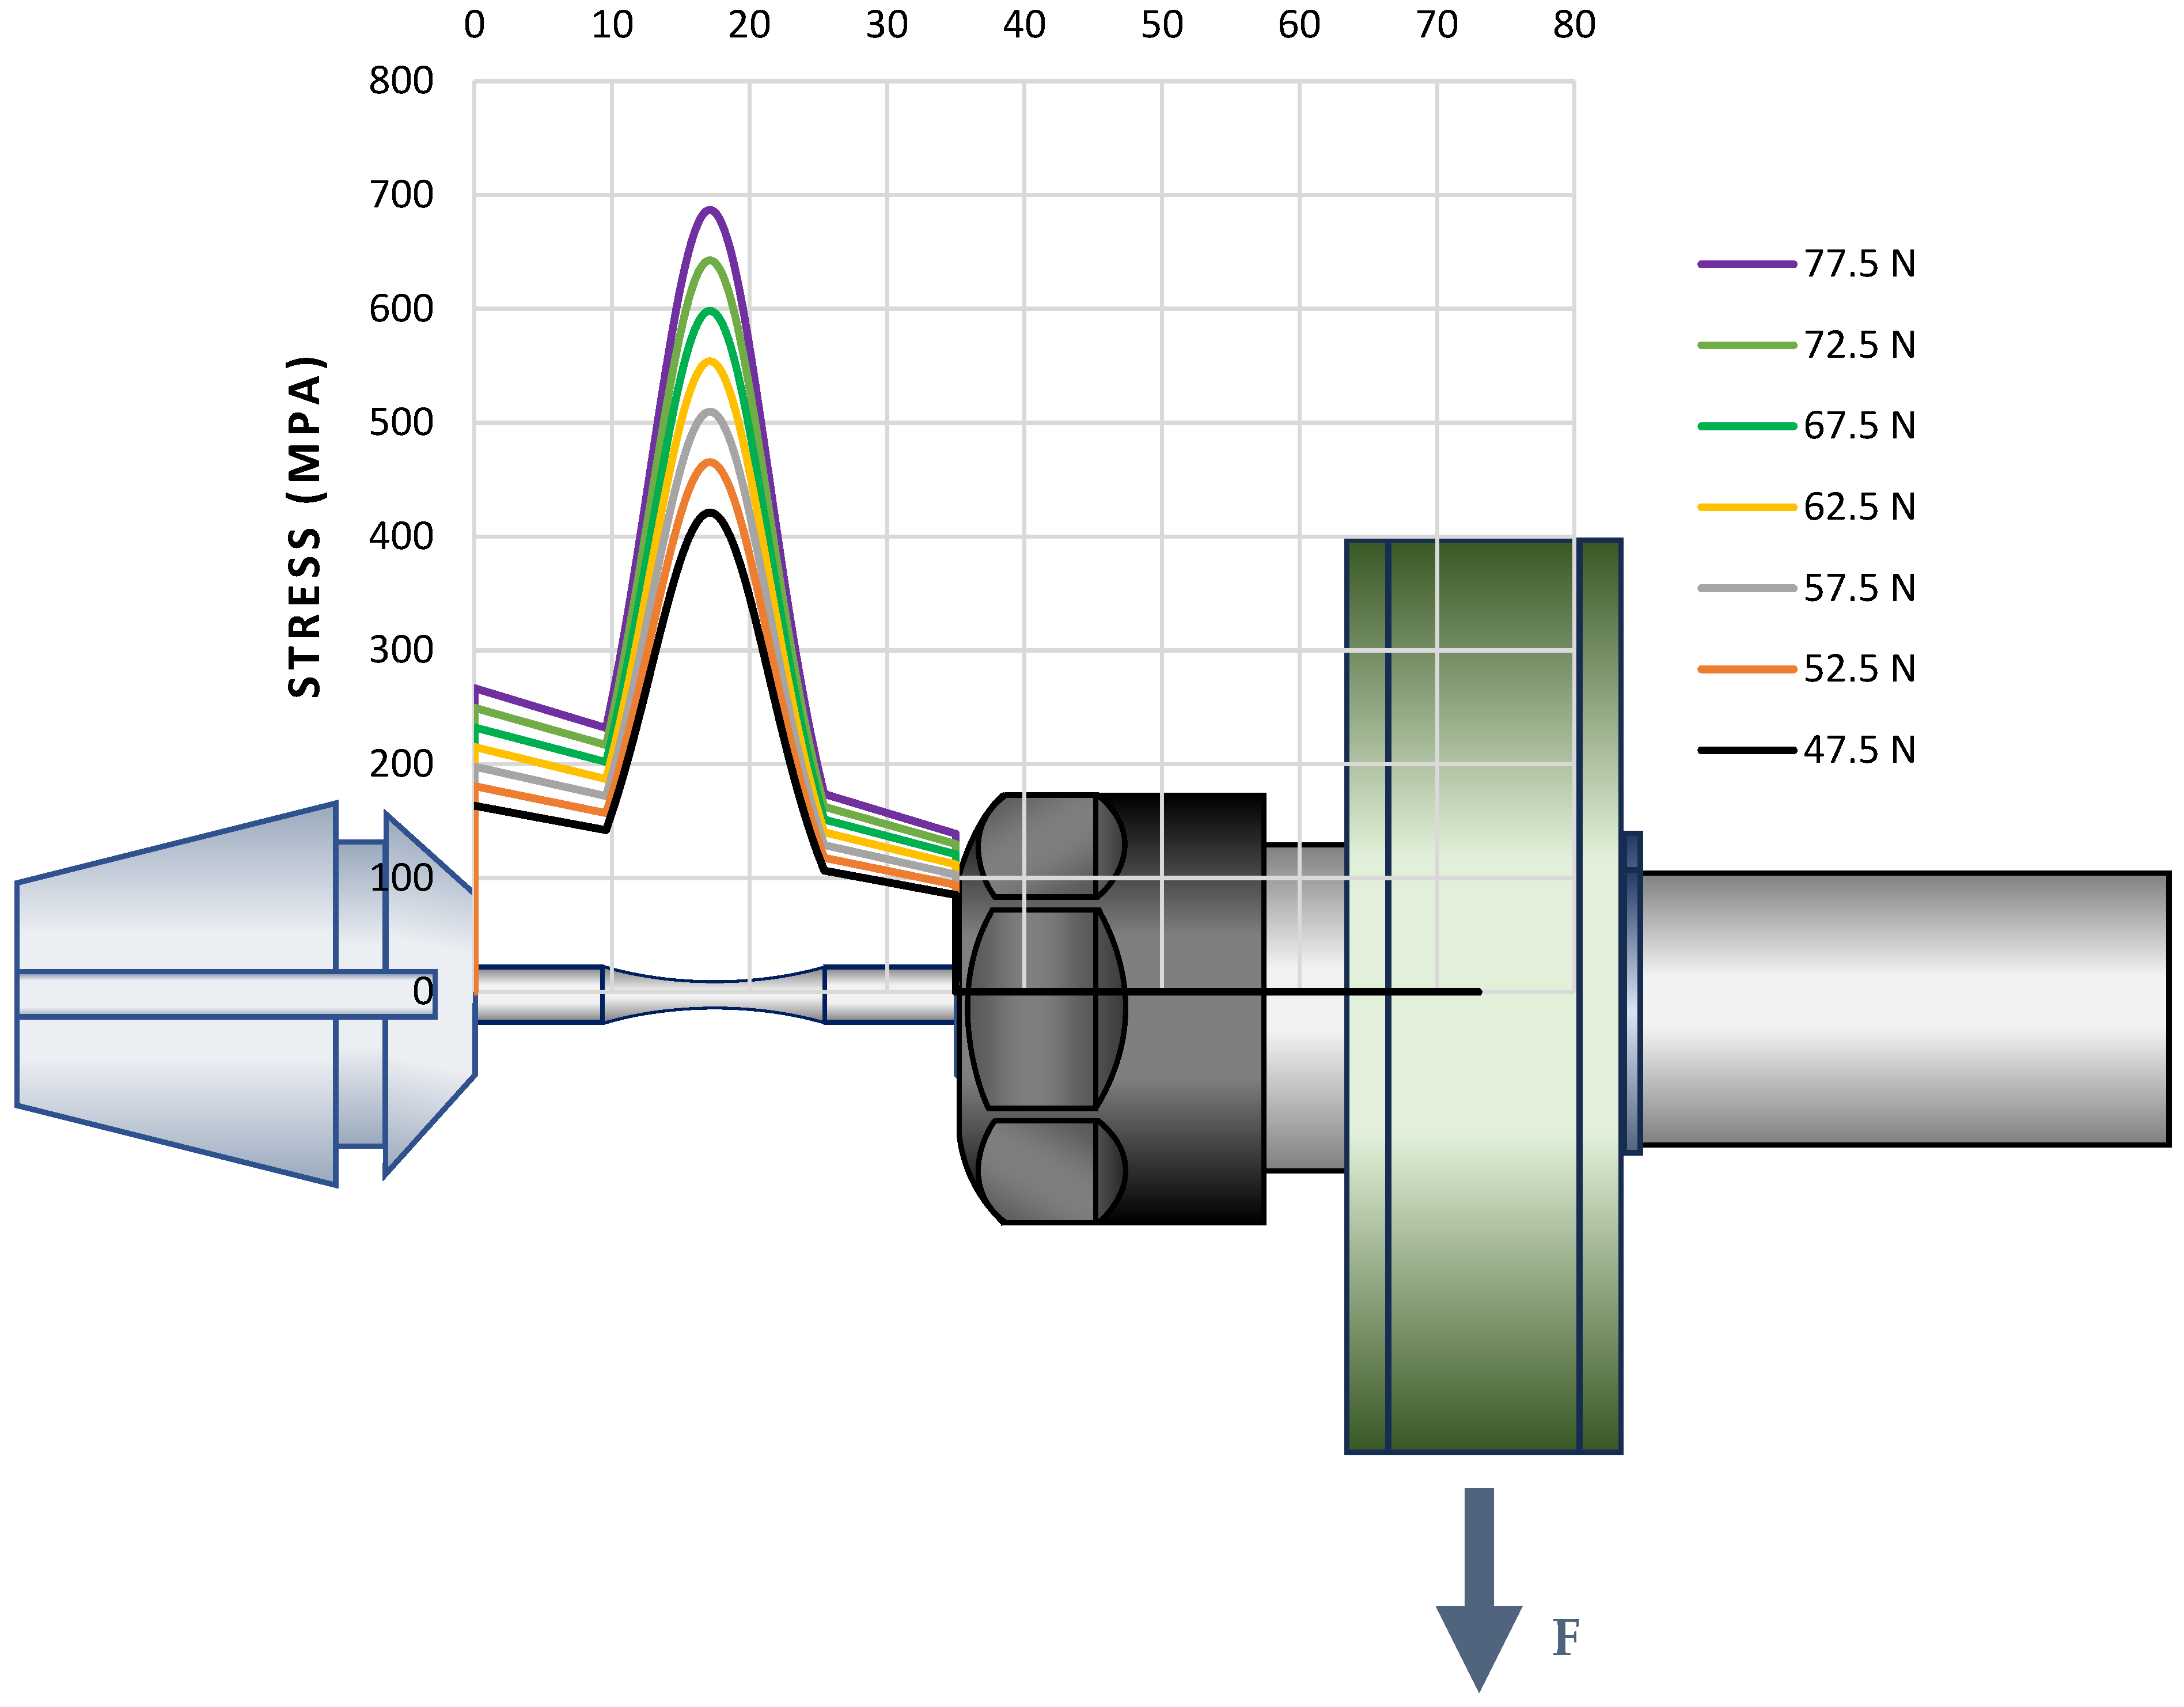
Following the completion of these assessments, seven distinct load sets (sets 1 through 7)—corresponding to total loads ranging from 77.5 N to 47.5 N—were selected for the main fatigue testing program. These loading conditions were deliberately chosen to span the transition from finite-life to infinite-life regimes. The experimental procedure was conducted in accordance with the test plan presented in Figure 8, and the corresponding nominal stress distributions were calculated for each load group. These results are graphically illustrated in Figure 9.
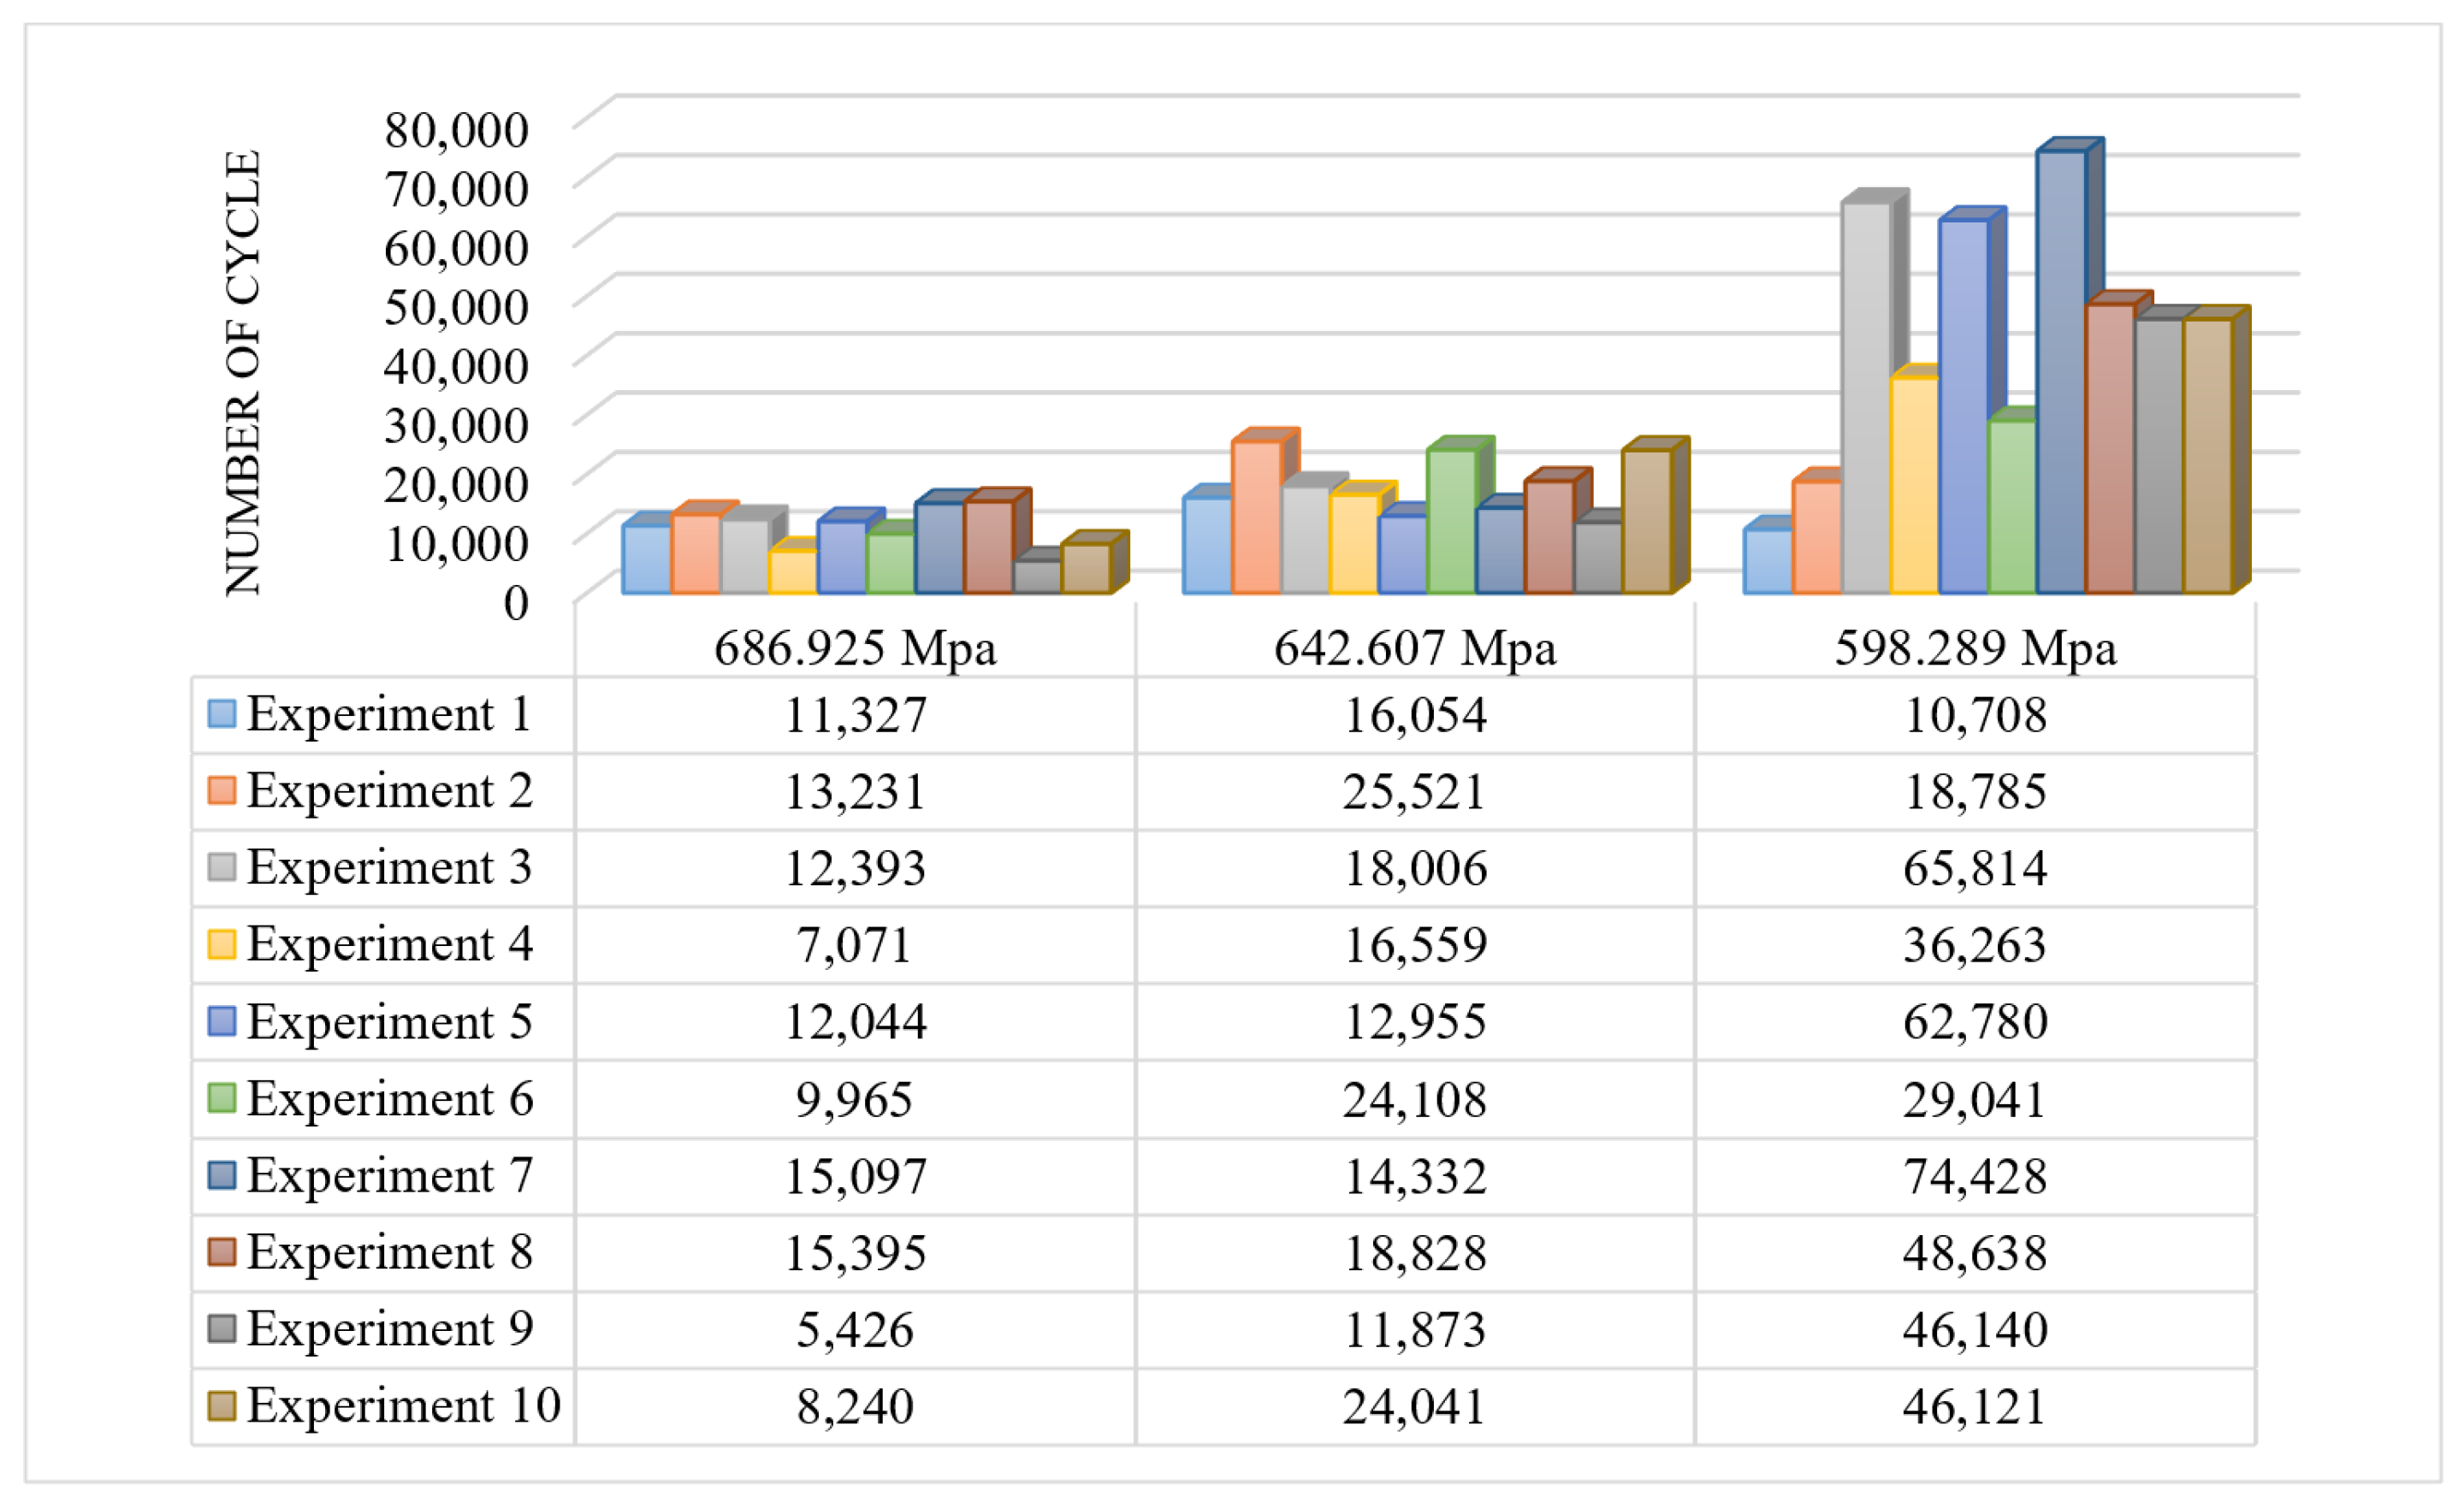
When high-, medium-, and short-life data are plotted on the same graph, the large disparity in cycle counts reduces overall readability and interpretability. To overcome this, the experimental data were categorized into distinct life groups and visualized across multiple separate plots.
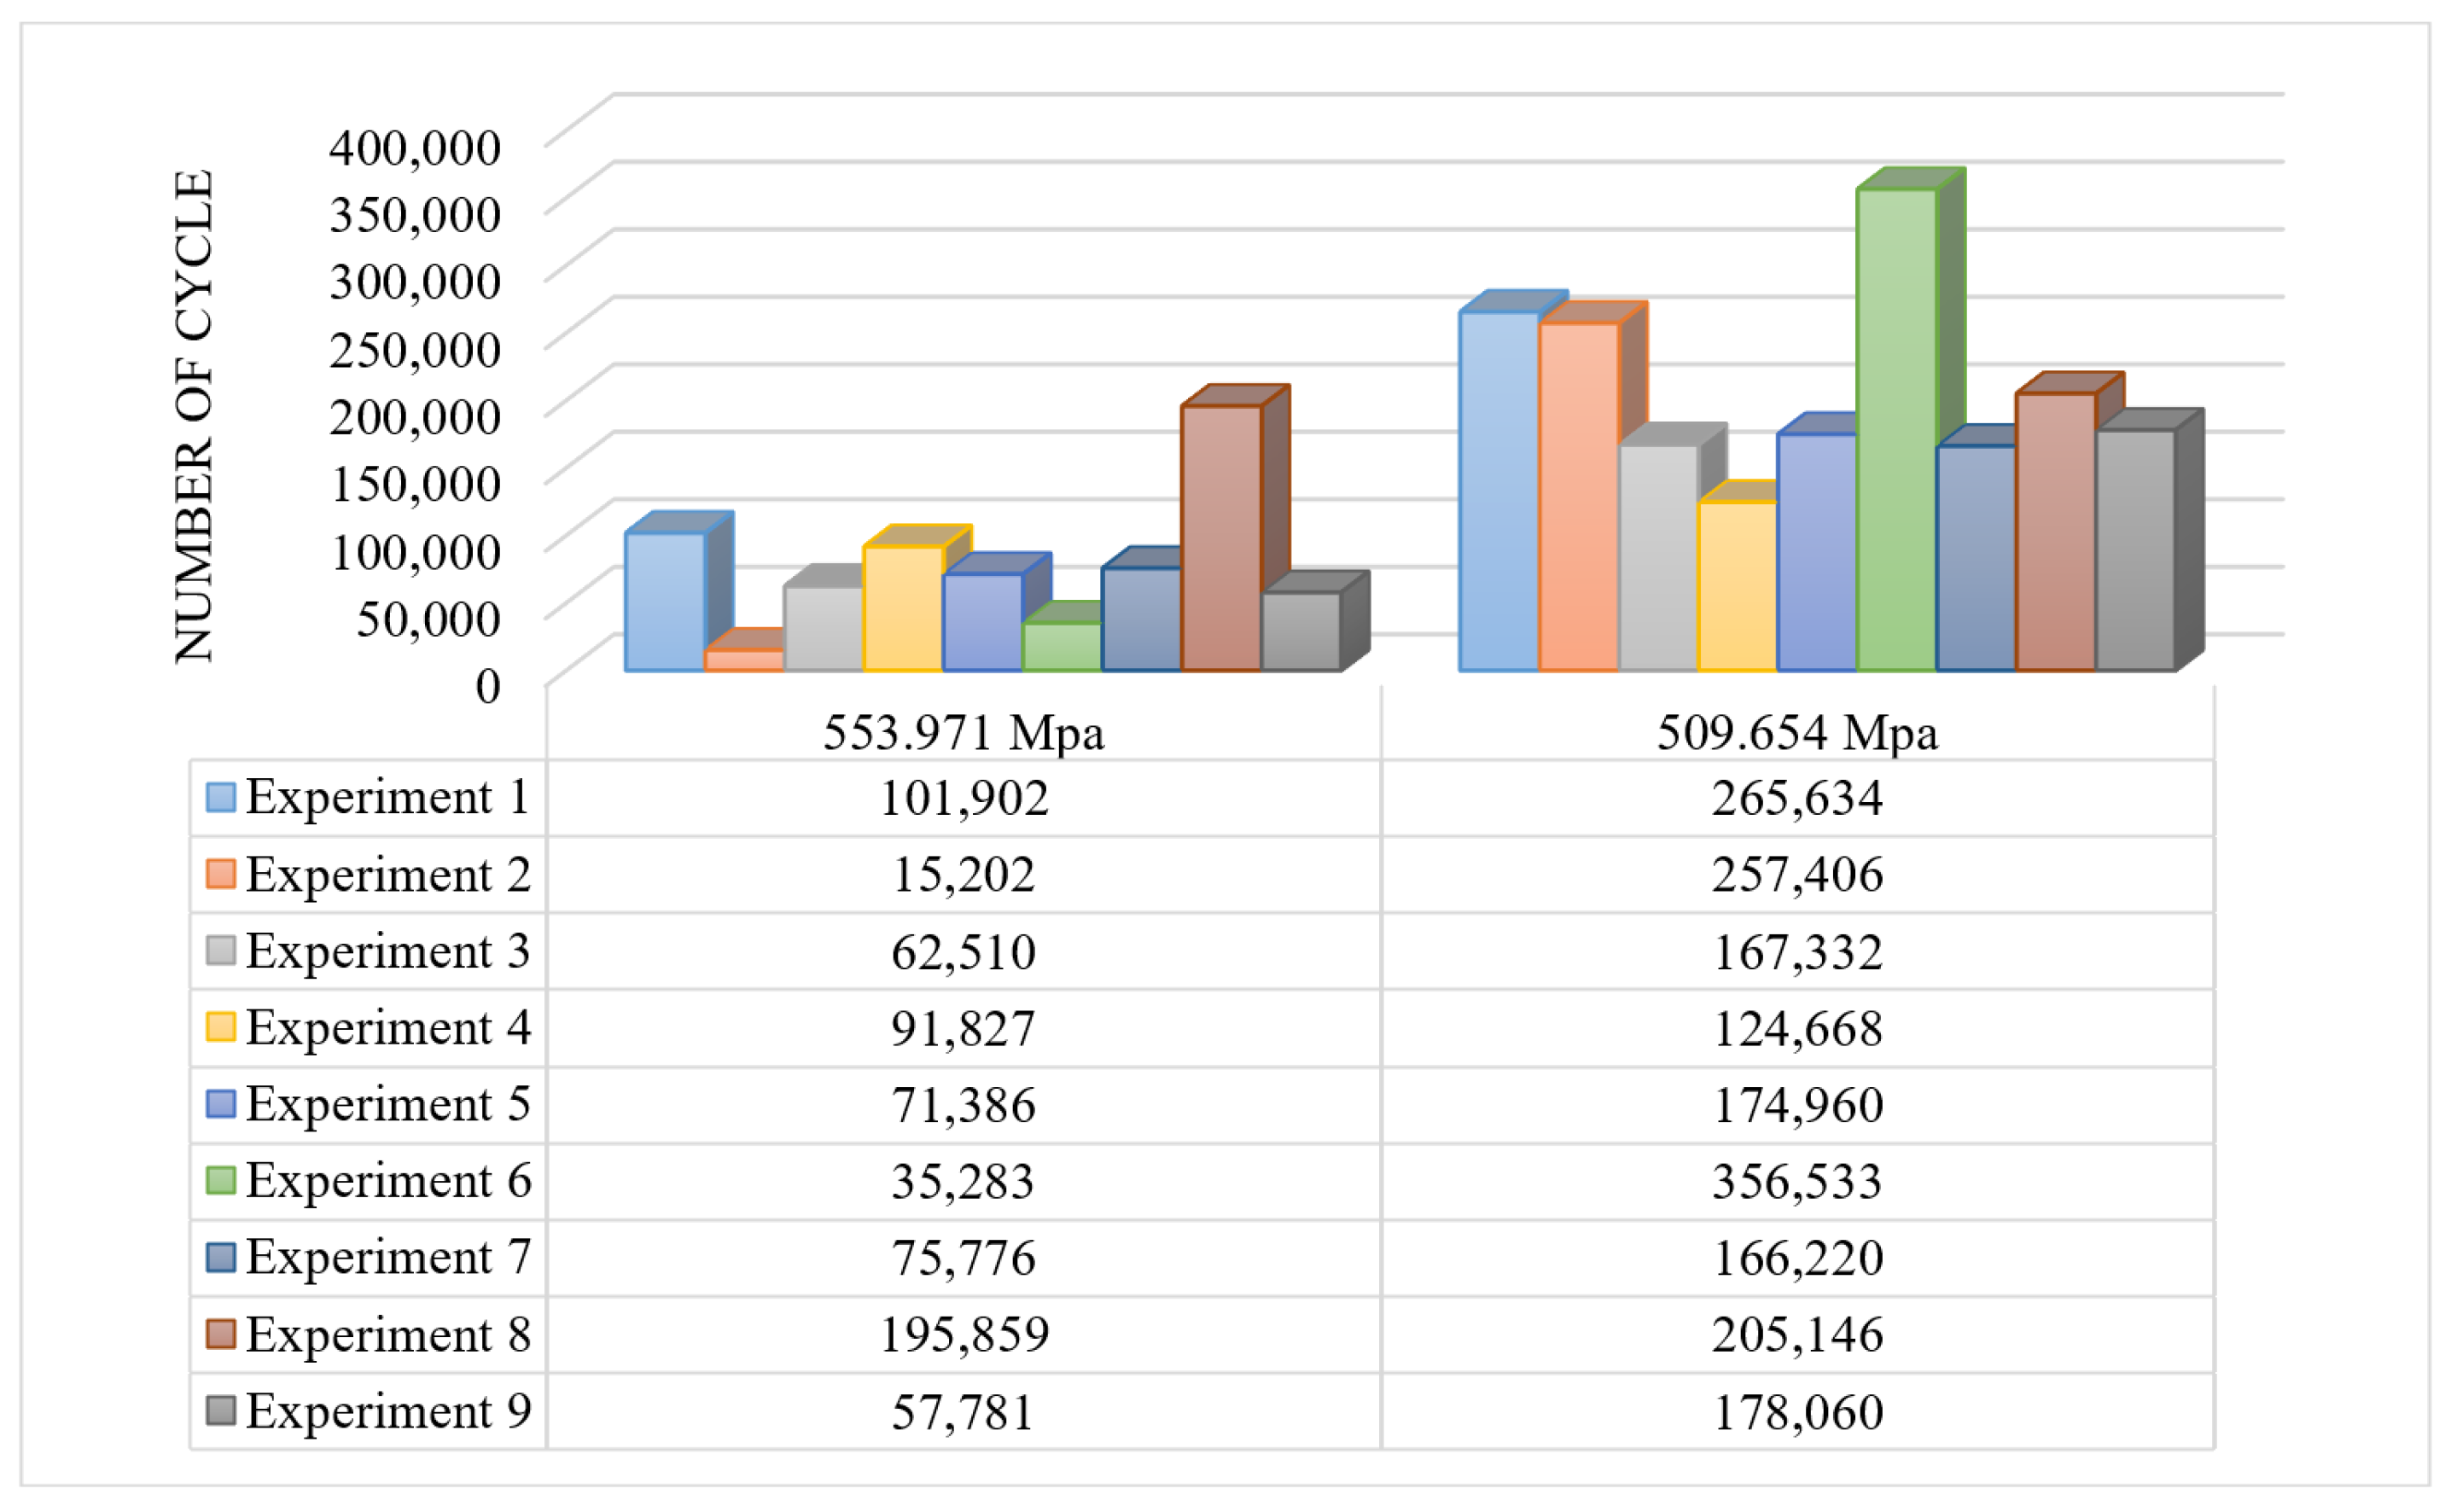
Figure 10 presents the results for load sets 1, 2, and 3, corresponding to high-stress, short-life conditions. These tests resulted in rapid specimen failure, with the number of cycles to fracture being plotted against the nominal stress level.
Figure 11 shows the results for load sets 4 and 5, which represent the mid-range fatigue life behavior under moderate loading conditions.
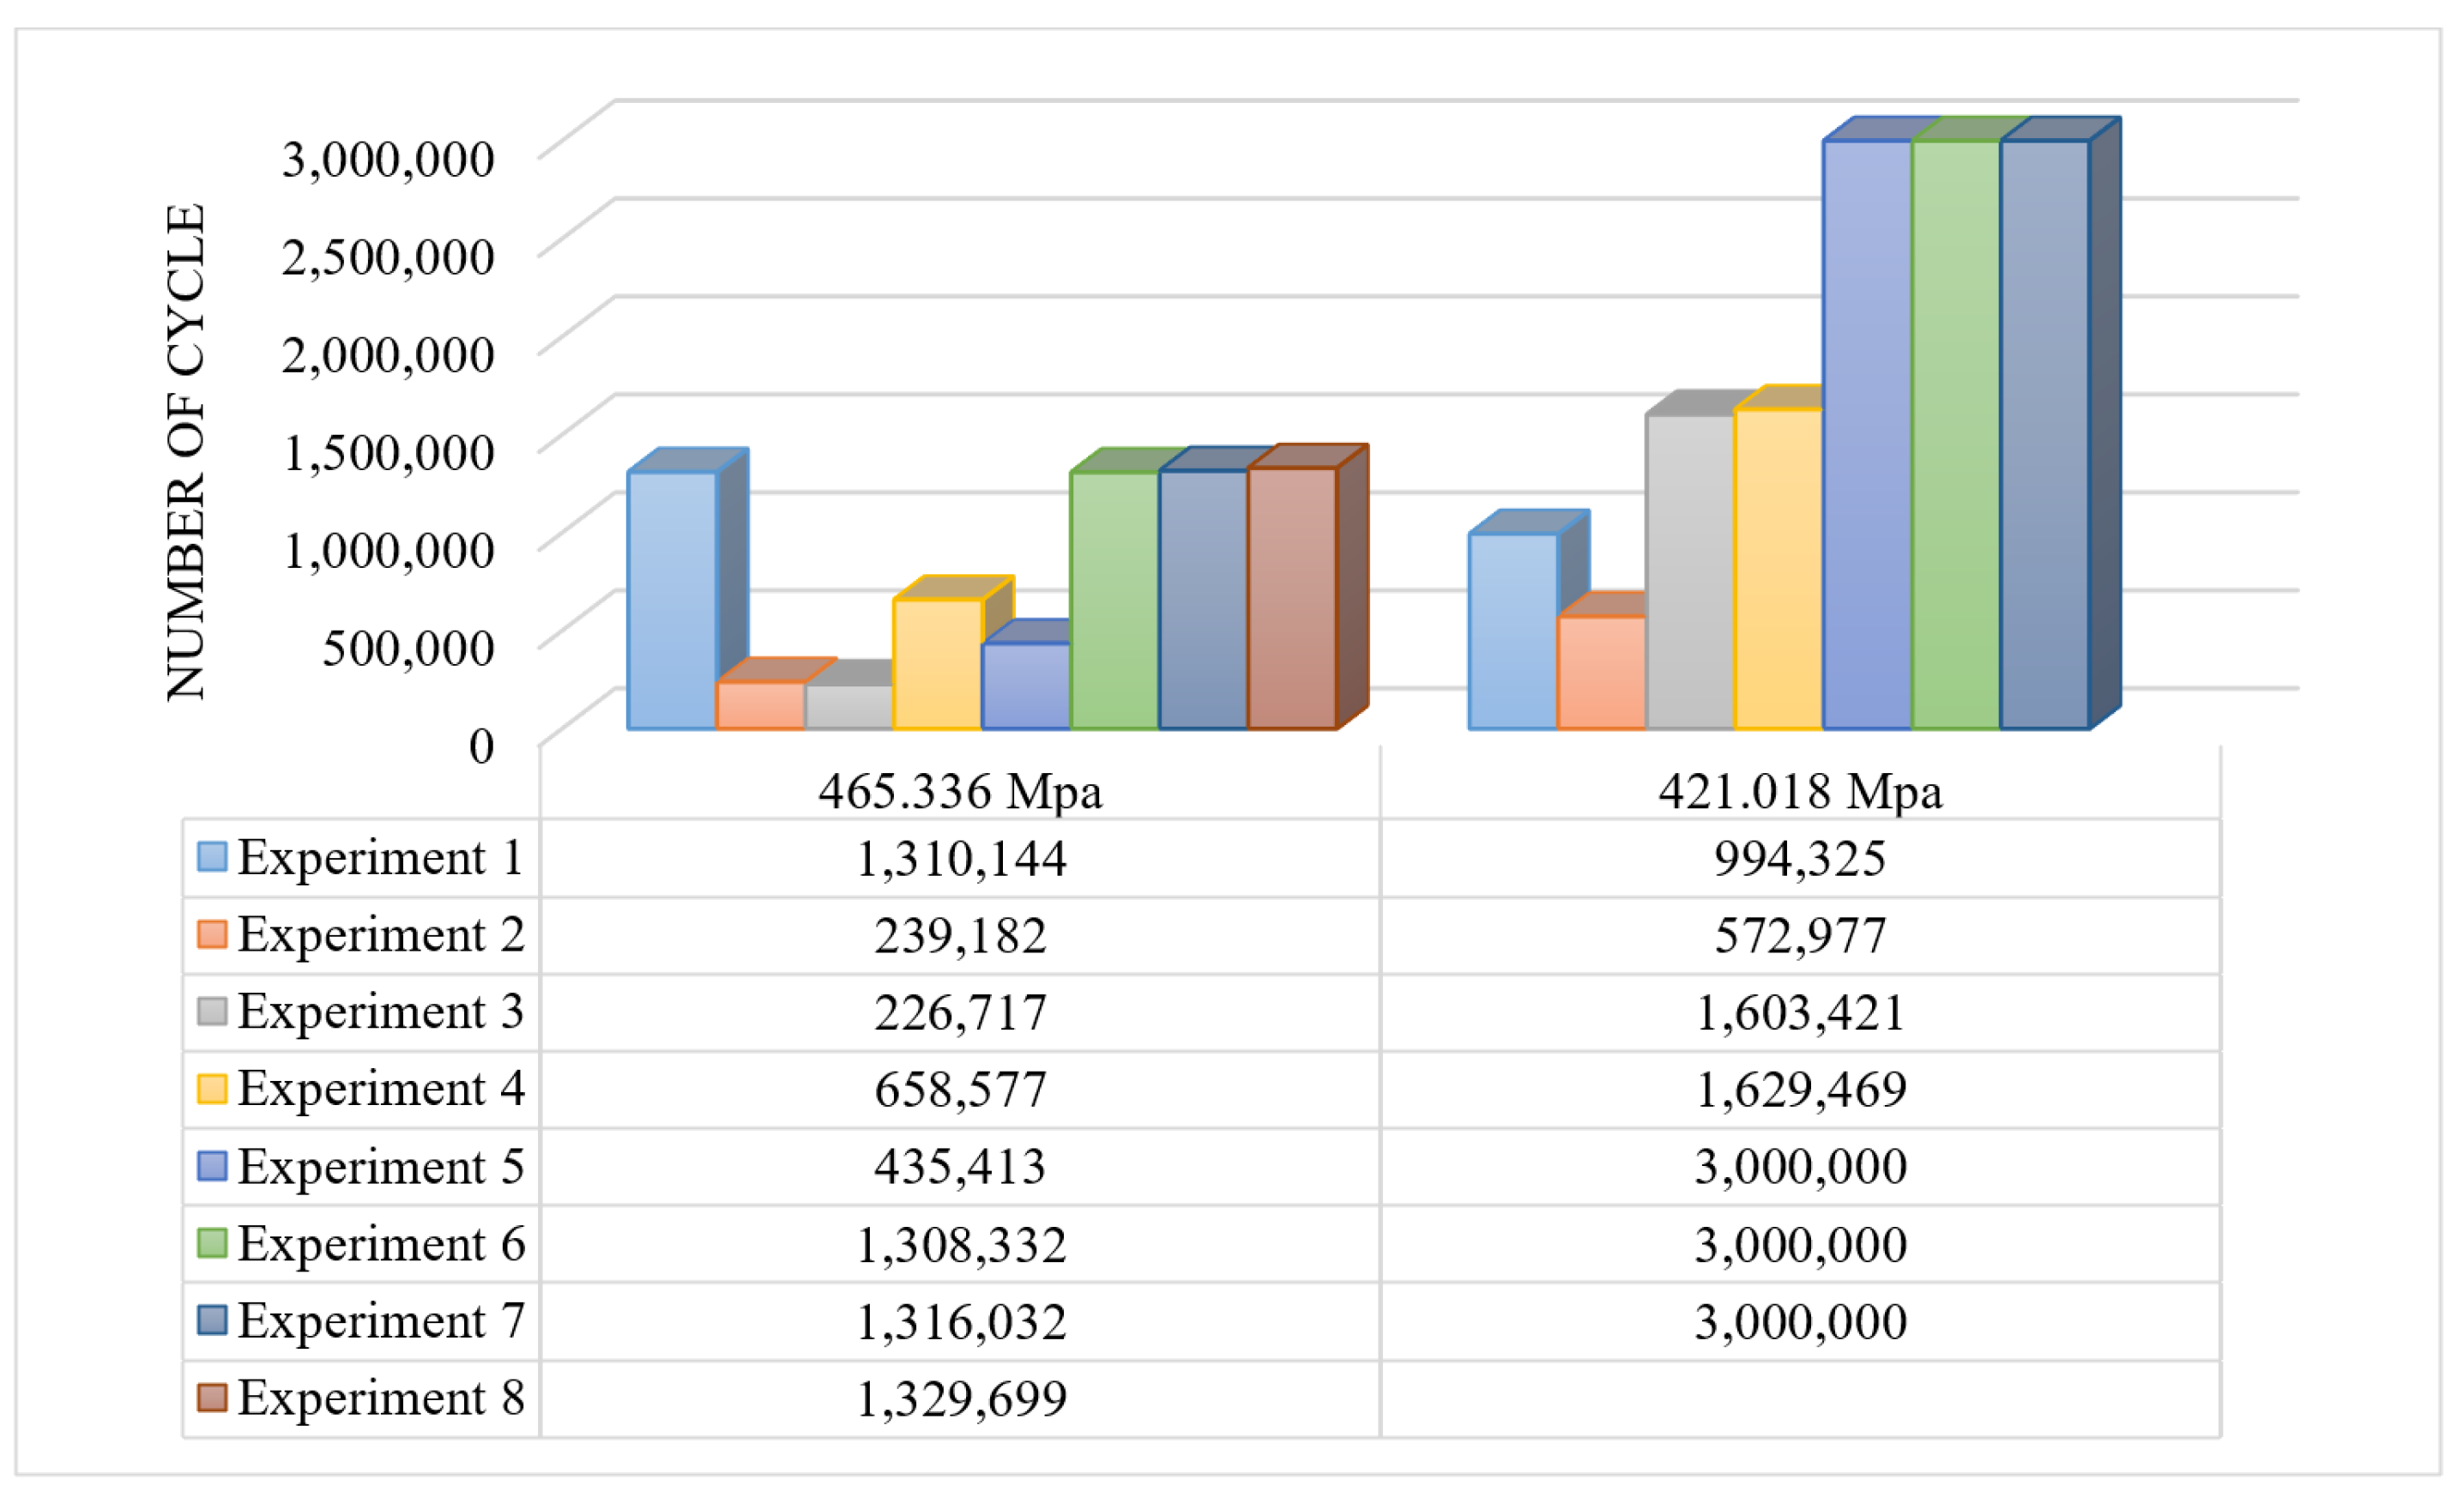
Figure 12 displays the test results for Load Sets 2 and 1, which involved the lightest loading scenarios and consequently yielded long-life outcomes in terms of cycles to failure.
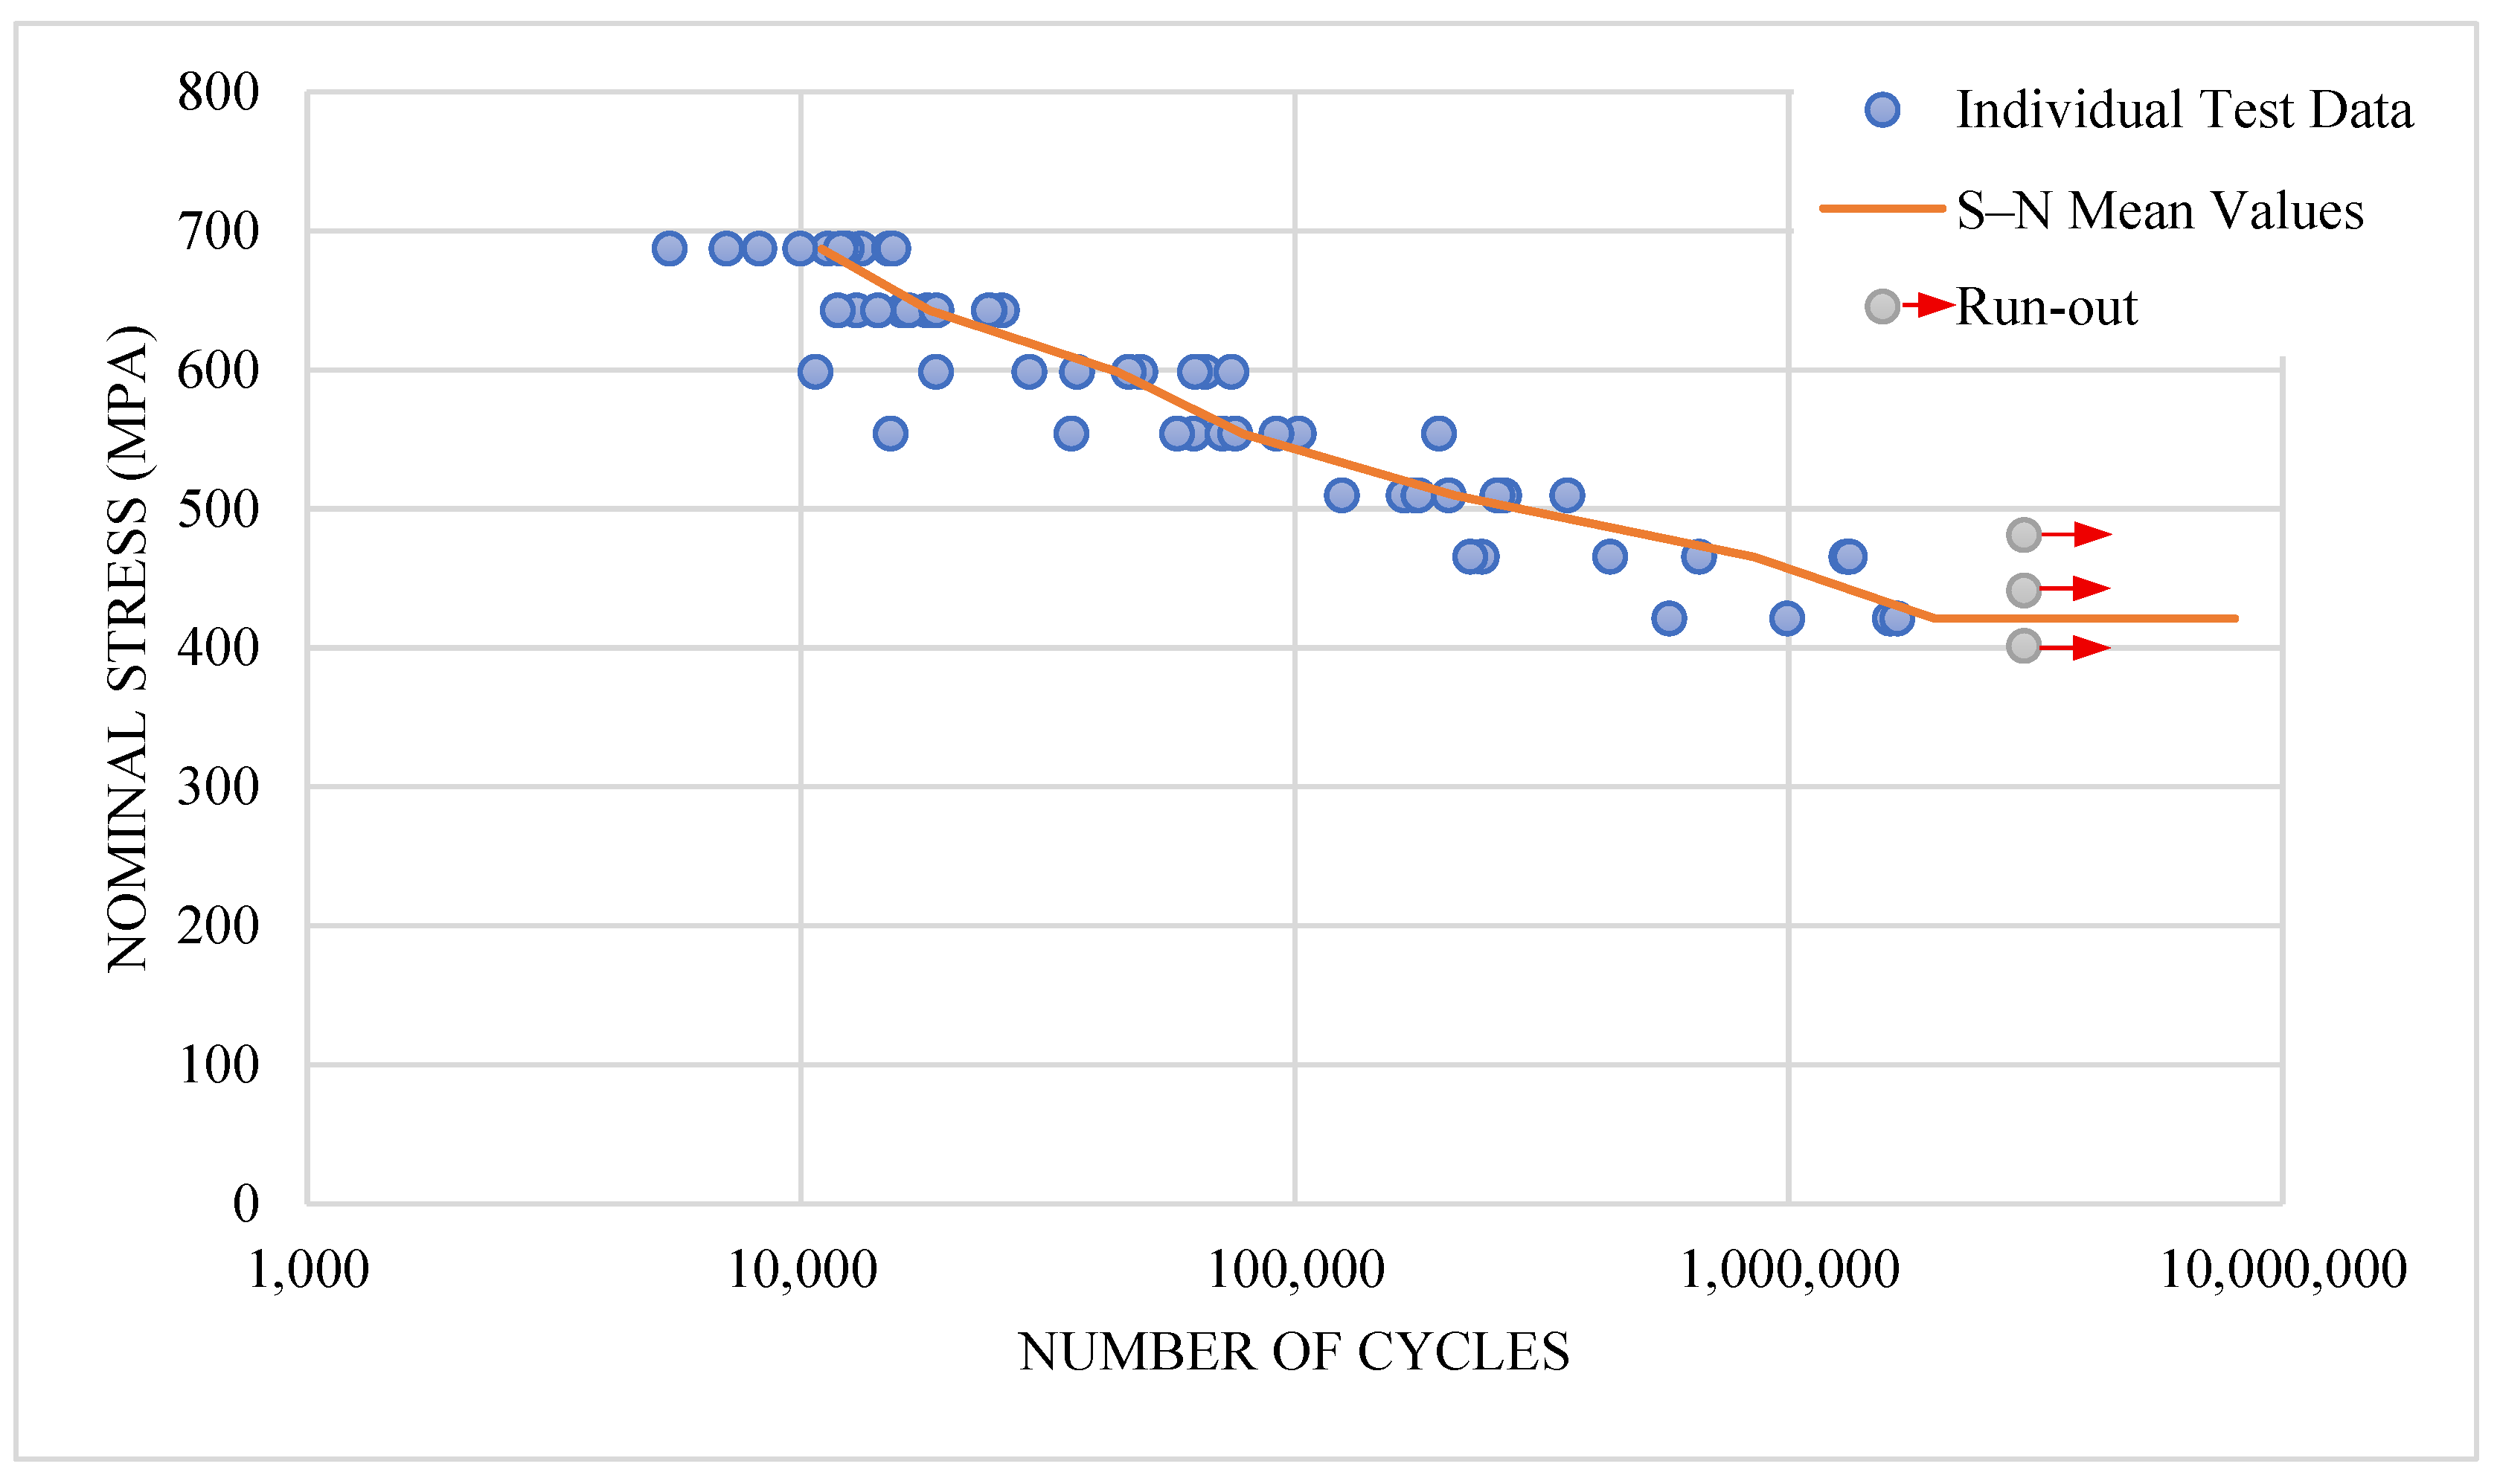
The S–N diagram was constructed via the fatigue test results presented in the preceding figures. For each nominal stress level, the number of cycles to failure from repeated tests was averaged to determine the corresponding fatigue life. This averaging process inherently represents a 50% failure probability, as is commonly defined in the fatigue literature [3,6,9]. The resulting mean values were used to generate the S–N curve, which is later presented and discussed in detail in Section 4.2.2.

4. Discussion

4.1. Comparative Analysis of the Mechanical Design

This section presents a comparative evaluation of the proposed high-throughput fatigue testing system against previously reported designs, with a particular focus on the mechanical configuration, transmission strategy, specimen fixation, load application, and automation. The discussion is structured to highlight the key innovations, performance improvements, and practical advantages introduced by the current design. Quantitative and qualitative comparisons are summarized in Table 5, offering a comprehensive benchmarking reference for future developments in fatigue testing machinery.

4.1.1. Multi-Specimen Testing Efficiency

Traditional fatigue testing setups are primarily configured for single-specimen evaluation, which significantly limits the experimental throughput and extends the testing duration. This limitation is particularly pronounced in high-cycle fatigue applications, where individual tests may require millions of loading cycles. Although multi-specimen systems have been developed to overcome this constraint, most reported designs accommodate only four to five specimens simultaneously [10,11,12].
The present system incorporates a dual-end spindle configuration capable of testing up to 22 specimens simultaneously, offering a 4.4-fold increase in capacity compared with the most advanced multi-specimen fatigue platforms reported in the literature. This expanded configuration enhances the statistical robustness of the experimental datasets, reduces manual intervention, and significantly accelerates the rate of data acquisition.

4.1.2. Transmission System

The transmission system plays a pivotal role in maintaining synchronized motion and delivering stable power across multiple spindles in high-cycle fatigue testing applications. Conventional configurations frequently utilize V-belts or timing belts, which are generally optimized for short-distance transmission and single-axis drive systems [11,12,14].
In the present study, a flat-belt transmission mechanism was employed to actuate 11 dual-end spindle sets via a single high-power motor. This arrangement was selected on the basis of its capacity to transmit consistent torque over extended distances while accommodating nonlinear spindle layouts. In addition, the integration of crowned-surface flat pulleys facilitates precise belt tracking and minimizes slippage, even under sustained cyclic loading conditions.
In contrast to prior approaches that utilize dedicated motors for each spindle [11,12], the centralized drive architecture introduced here offers substantial economic and operational advantages. Cost reductions stem not only from a significant decrease in the number of high-power drive units required but also from the simplified mechanical layout, which alleviates complexity in alignment, reduces installation demands, and minimizes long-term maintenance overhead. This design paradigm provides a robust, scalable, and cost-effective transmission solution tailored for high-throughput fatigue testing platforms.

4.1.3. Specimen Fixation and Alignment

The correct fixation of a test specimen is very important for rotating bending fatigue tests. Even the slightest misalignment can cause unwanted stress concentrations, compromising the accuracy and repeatability of the test. Two common fixation methods are highlighted in the literature: drill chucks [13,15,17,18,19,20] and collet systems [10,11,12,17,25].
Drill chucks grip the specimens at separate points, which can cause uneven compression pressure and axial misalignment, especially under high loads [26]. In contrast, collet systems provide full-surface circumferential clamping, ensuring concentric alignment and stable fixation during high-speed rotation. Prior studies have demonstrated the superior mechanical performance of collet-based configurations, especially in minimizing slippage and maintaining geometric consistency. Accordingly, the present system employs precision-grade ER16 collet holders to mount the hourglass-type specimens.
This choice minimizes eccentricity and significantly enhances the repeatability of fatigue life measurements. The use of industrial-standard collet holders also simplifies specimen replacement, contributing to improved operational efficiency in multi-batch test campaigns.

4.1.4. Ease of Load Application

The method by which loads are applied to fatigue specimens directly affects both the accuracy of stress calculations and the practicality of the test setup. In most conventional systems, loading is achieved through dead weights specified in grams or kilograms [11,12,13,14,15,18,20]. However, these values often require manual conversion into newtons via gravitational acceleration. Furthermore, the mass of auxiliary components such as idler assemblies must be accounted for algebraically during stress computation. This adds both procedural complexity and the potential for numerical error.
To streamline this process, the present study adopts precision-engineered weights directly calibrated in Newtons (5 N and 30 N), thereby eliminating the need for additional conversions. These weights were manufactured with a ±5 g tolerance via high-accuracy CNC machining to ensure consistency across test stations.
During the early development phase of idler weight assembly, the use of low-grade self-aligning ball bearings led to intermittent frictional resistance, especially under insufficient lubrication. These frictional effects occasionally resulted in transient torque transmission to the specimens because of improper free rotation of the idler pulleys. The issue was identified through test anomalies and resolved by replacing the low-grade components with high-quality FAG-brand self-aligning ball bearings. Proper reassembly procedures were also implemented to prevent bearing misalignment. Following these improvements, the loading mechanism operated consistently, and no further torque-related deviations were observed during testing.
Additionally, the self-weight of the idler assemblies was standardized at 17.5 N for all stations. The direct use of Newton-calibrated components not only simplified the experimental workflow but also enhanced the accuracy and repeatability of stress-level assignments, reducing the uncertainty in fatigue life assessment.

4.1.5. Integration of Real-Time Monitoring and PLC Control

Automation and real-time monitoring capabilities have become indispensable in modern fatigue testing systems, particularly in high-throughput experimental settings where efficiency and precision are paramount. In conventional uniaxial fatigue setups, specimens are typically tested sequentially, with digital or mechanical counters employed to monitor the number of loading cycles [15,18,20]. Although such methods are functionally reliable, they are inherently limited in throughput and often require posttest intervention to retrieve and process fatigue life data. These limitations can delay analysis and reduce the overall experimental efficiency.
In contrast, the present system features a fully integrated PLC-based control architecture that enables continuous cycle tracking, real-time fracture detection, and automated data logging throughout the testing process. This architecture is further supported by an industrial-grade human–machine interface (HMI), which provides comprehensive visual diagnostics, fault logging, and remote operability, significantly enhancing both usability and oversight.
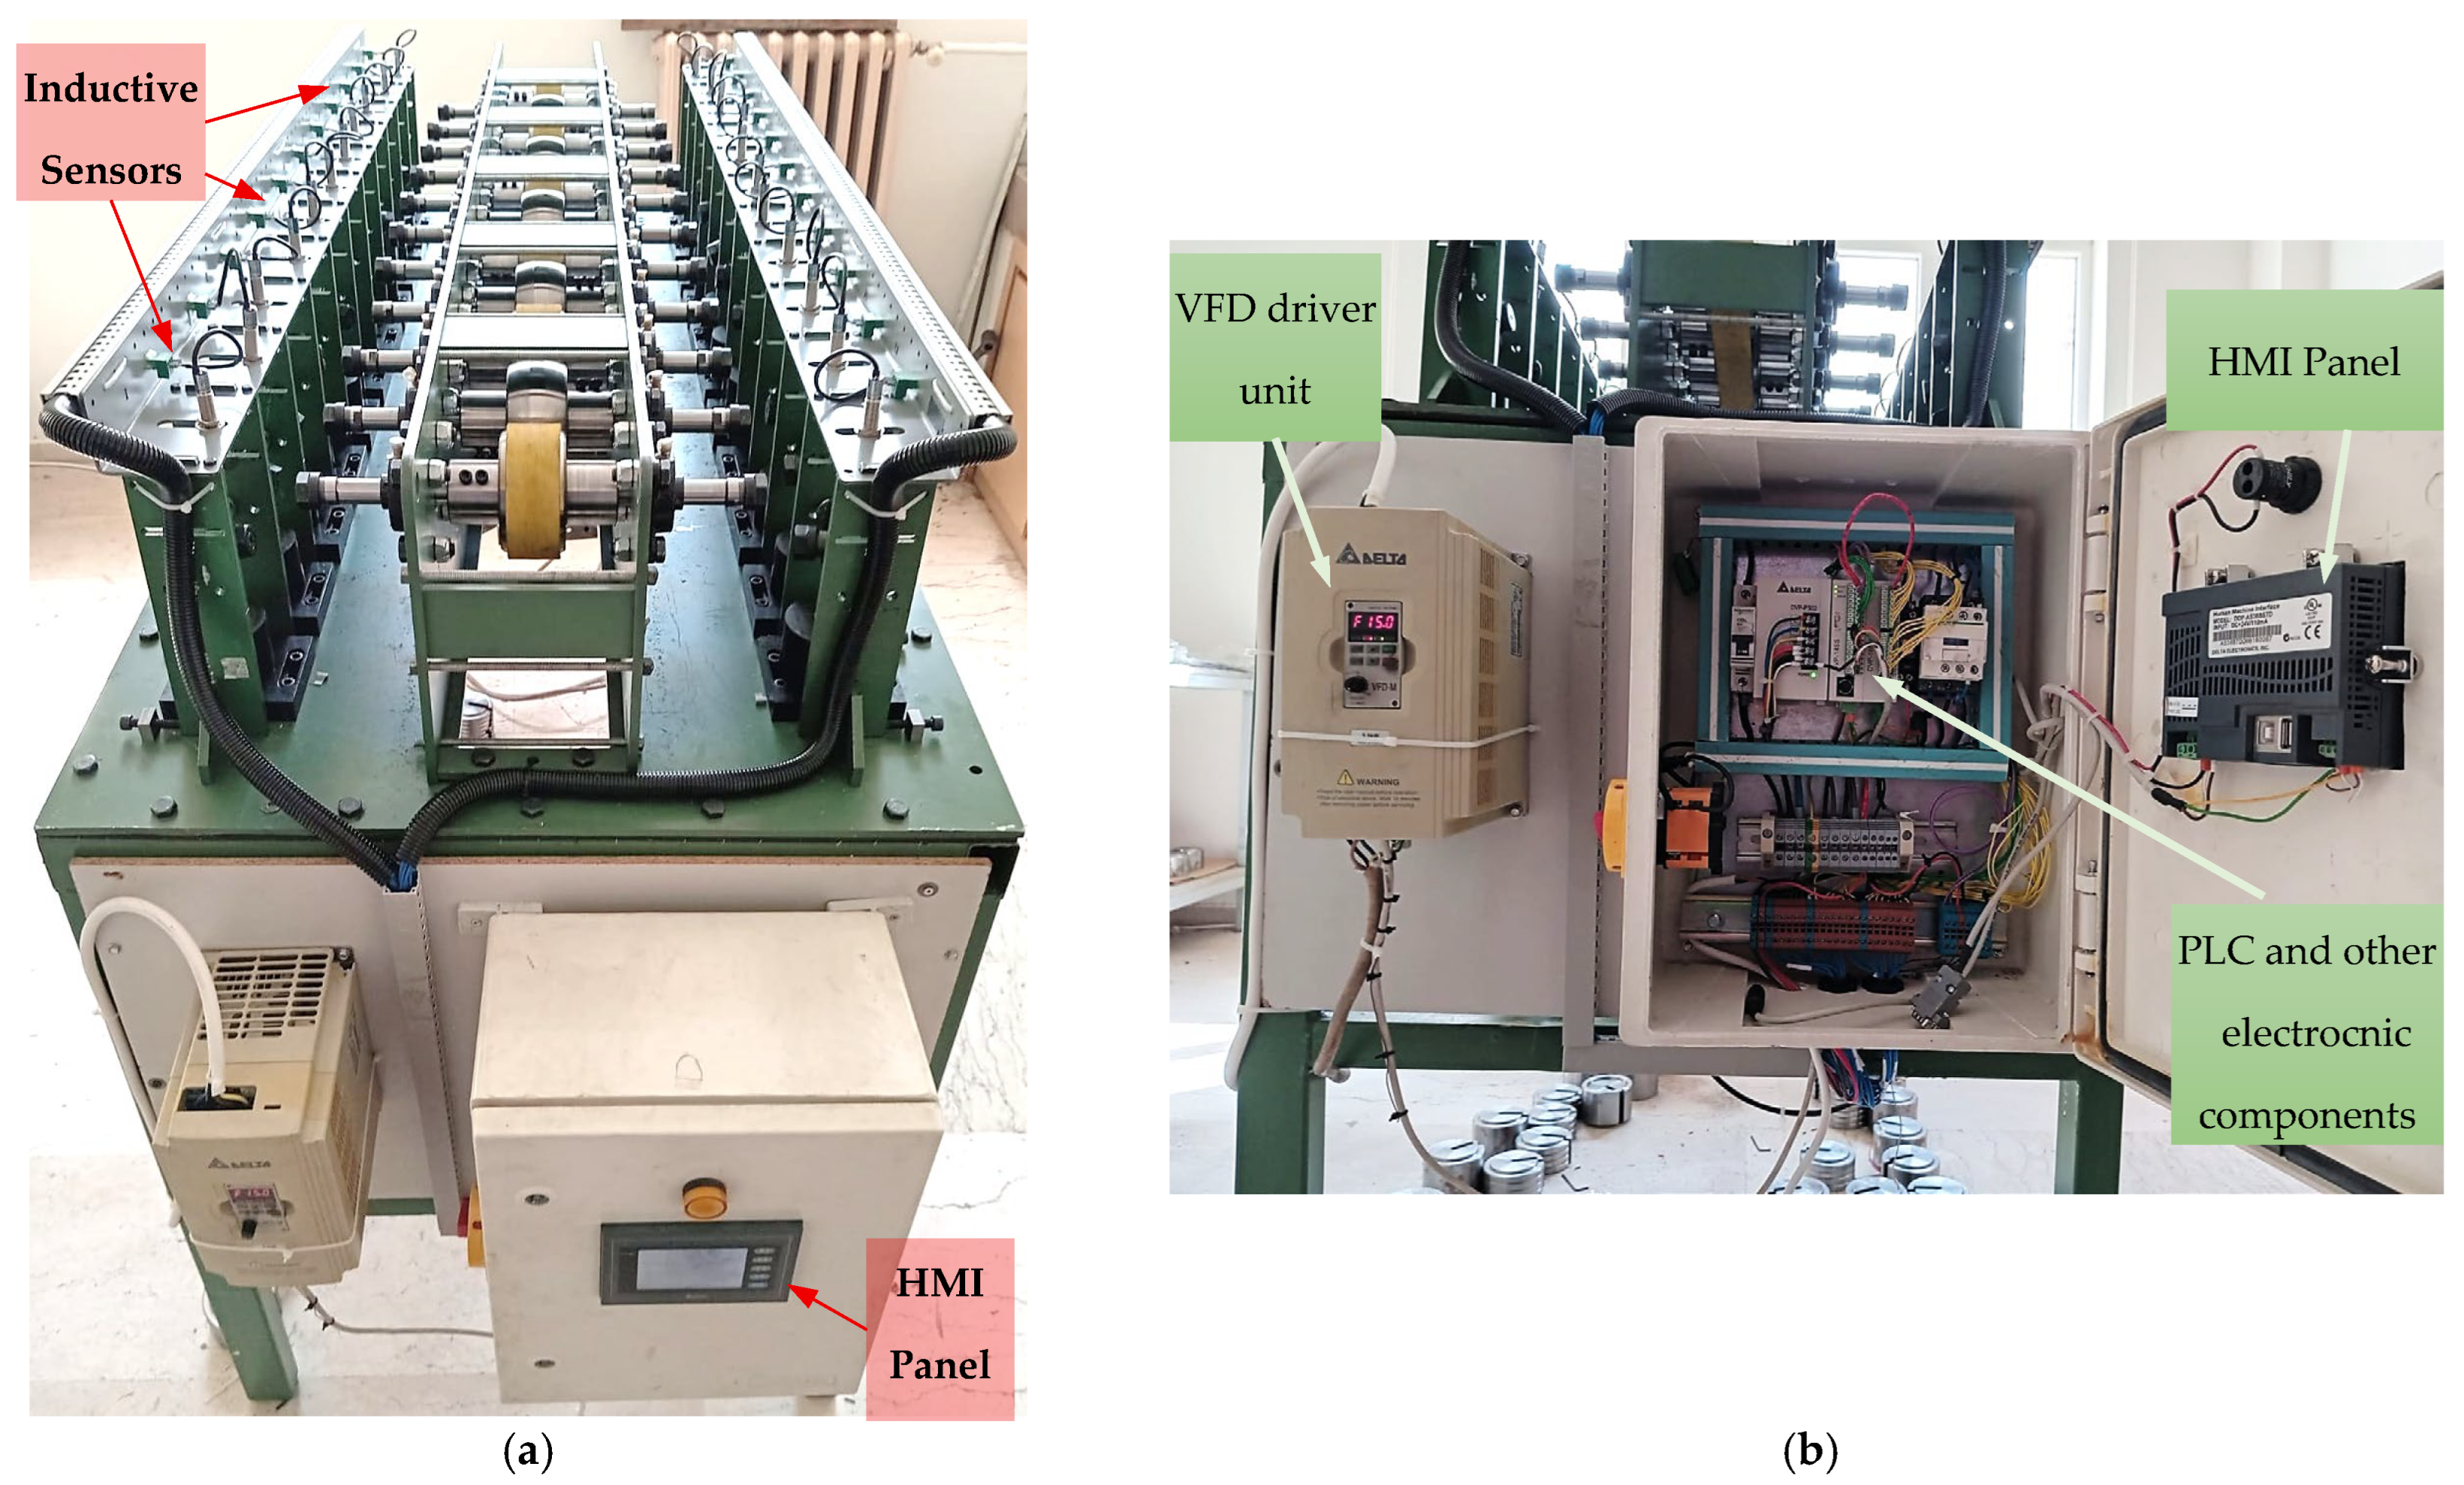
As illustrated in Figure 13b, the control cabinet houses a Delta VFD-M series variable frequency drive, a dedicated PLC unit, and an intuitive HMI panel. The modular design of the control system ensures easy accessibility, operational safety, and streamlined maintenance, making it well suited for both laboratory-scale and industrial fatigue testing environments.
In the present system, the number of applied loading cycles is tracked via a rotary encoder mounted on the central drive shaft. All test stations are mechanically coupled to this shaft through identical pulleys, ensuring perfectly synchronized rotation and enabling a single encoder to reliably reflect the cycle count for all specimens. When a specimen fractures, an inductive proximity sensor positioned at its station detects the physical separation and sends a signal to the PLC controller (Figure 13a). At that precise moment, the encoder’s cycle count is automatically and permanently assigned to the relevant specimen’s data log, effectively freezing its value. Moreover, the system continues operation for the remaining intact specimens, allowing uninterrupted counting. As each subsequent specimen fails, the same process is repeated—sensor-triggered data capture followed by local cycle count locking. Once all specimens have fractured, the system initiates a full stop and finalizes the data logging.
Importantly, all the captured data are stored in nonvolatile memory, ensuring persistence even if the system is powered off and restarted. This feature allows operators to safely resume or review test results without data loss unless a manual reset is performed.
The main benefits of this approach include the following:
  • Automated failure detection through real-time sensor feedback enables the immediate identification of fracture events.
  • The automation unit maintains a uniform rotational speed across all specimens, ensuring a consistent cycle frequency. Since this speed can be adjusted via the control interface, the loading frequency for each specimen can be precisely set. This functionality ensures highly uniform and repeatable fatigue loading across all test conditions.
  • Real-time logging of the fatigue cycles allows uninterrupted data acquisition throughout the experiment.
  • User-friendly operation through an HMI-based control interface that facilitates intuitive command input and system oversight.
  • An autonomous system is shut down, wherein the machine continuously monitors all test stations and automatically stops operating once fatigue failure has been detected across all specimens.
  • Automated data preservation ensures that all critical test parameters, failure events, and operational logs are securely stored without requiring manual intervention.
While the above summary outlines the essential features of the automated control system, the complete technical details—including the PLC architecture, sensor layout, and HMI integration—have already been extensively documented in a previous study by Doğan et al. [23].
In contrast, the present study emphasizes the overall mechanical design, fatigue performance characterization, and multi-specimen testing strategy enabled by the dual-end spindle system. Readers interested in the full automation logic and electrical schematics are referred to the aforementioned publication for comprehensive insight.

4.2. Analysis of the Fit of the Experimental Data at a Defined Interval

4.2.1. Surface Roughness Analysis of the Specimens

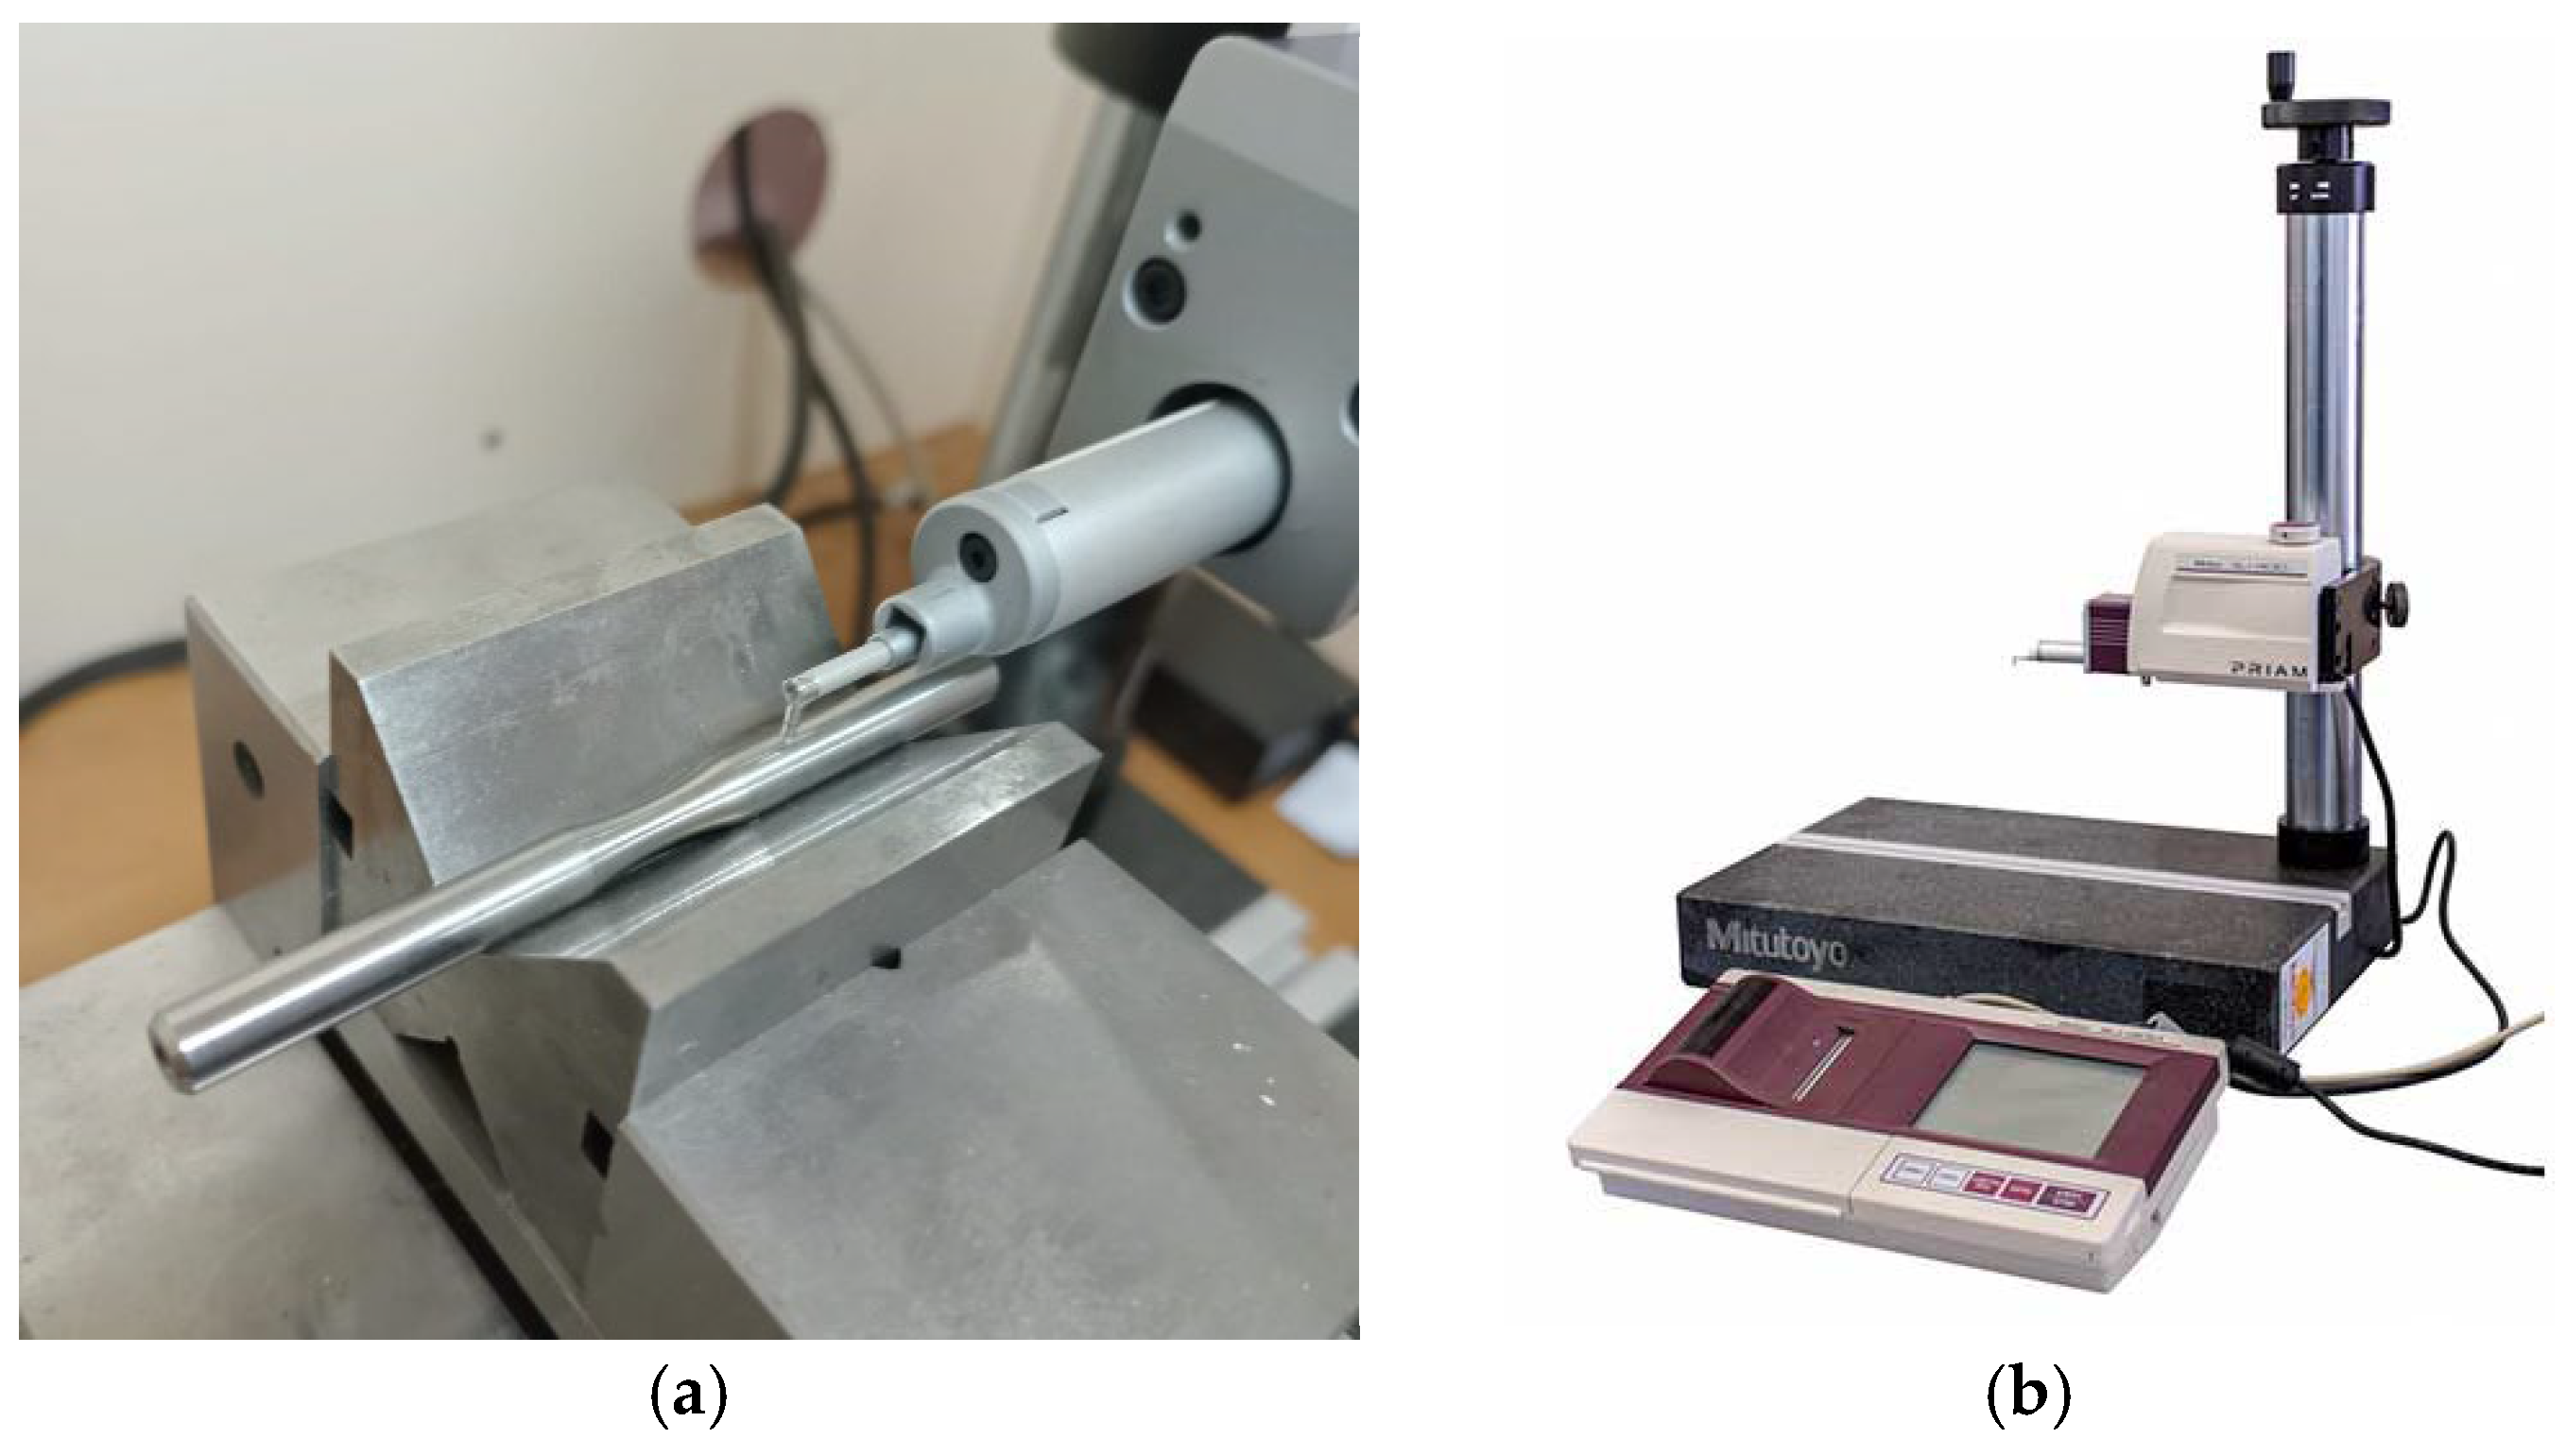
Surface roughness plays a crucial role in fatigue performance, influencing crack initiation and propagation. The measurements were taken along the longitudinal direction of the specimens (Figure 14a). This measurement was performed via a Mitutoyo SJ-400 profilometer, located in the Materials Laboratory of the Department of Mechanical Engineering at Gaziantep University, Gaziantep, Türkiye, as shown in Figure 14b.
In the present study, an average surface roughness (Ra) value of approximately 0.46 µm was obtained for each specimen. This value represents the arithmetic mean of five replicate measurements taken along the longitudinal direction at different angular positions around the specimen’s circumference. The measured Ra values for all specimens are presented in Figure 15.
This value reflects a high-precision CNC turning process, ensuring a relatively smooth machined surface. However, according to ASTM E466 standards, an additional polishing step should be applied to reduce Ra below 0.2 μm, as higher surface roughness can serve as microcrack initiation sites, leading to premature fatigue failure. While the obtained surface quality is considered highly refined in industrial applications, it does not meet the optimal threshold for fatigue testing. The absence of polishing may have contributed to a slightly lower endurance limit than some values reported in the literature, where a more refined surface finish was achieved.

4.2.2. Endurance-Limit Analysis

The obtained S/N curve effectively shows the relationship between the nominal stress and the number of cycles to failure and provides critical information about the fatigue performance of the tested material. The curve exhibited a characteristic downwards trend, indicating the expected decrease in fatigue strength with an increasing number of cycles. At high stress levels, failure occurs at a relatively low number of cycles, reflecting the inability of the material to withstand significant cyclic loads over long periods of time. Conversely, as the applied stress is reduced, the material shows a significantly improved fatigue life, with failure occurring at higher cycle counts (Figure 16).
At very high cycle counts, the S–N curve tends to asymptotically approach a constant stress level. This horizontal asymptote is referred to as the endurance limit (also known as the fatigue limit), representing the maximum completely reversed stress amplitude that the material can theoretically withstand for an infinite number of cycles without failure. In the present study, the experimentally determined endurance limit was approximately 421.018 MPa.
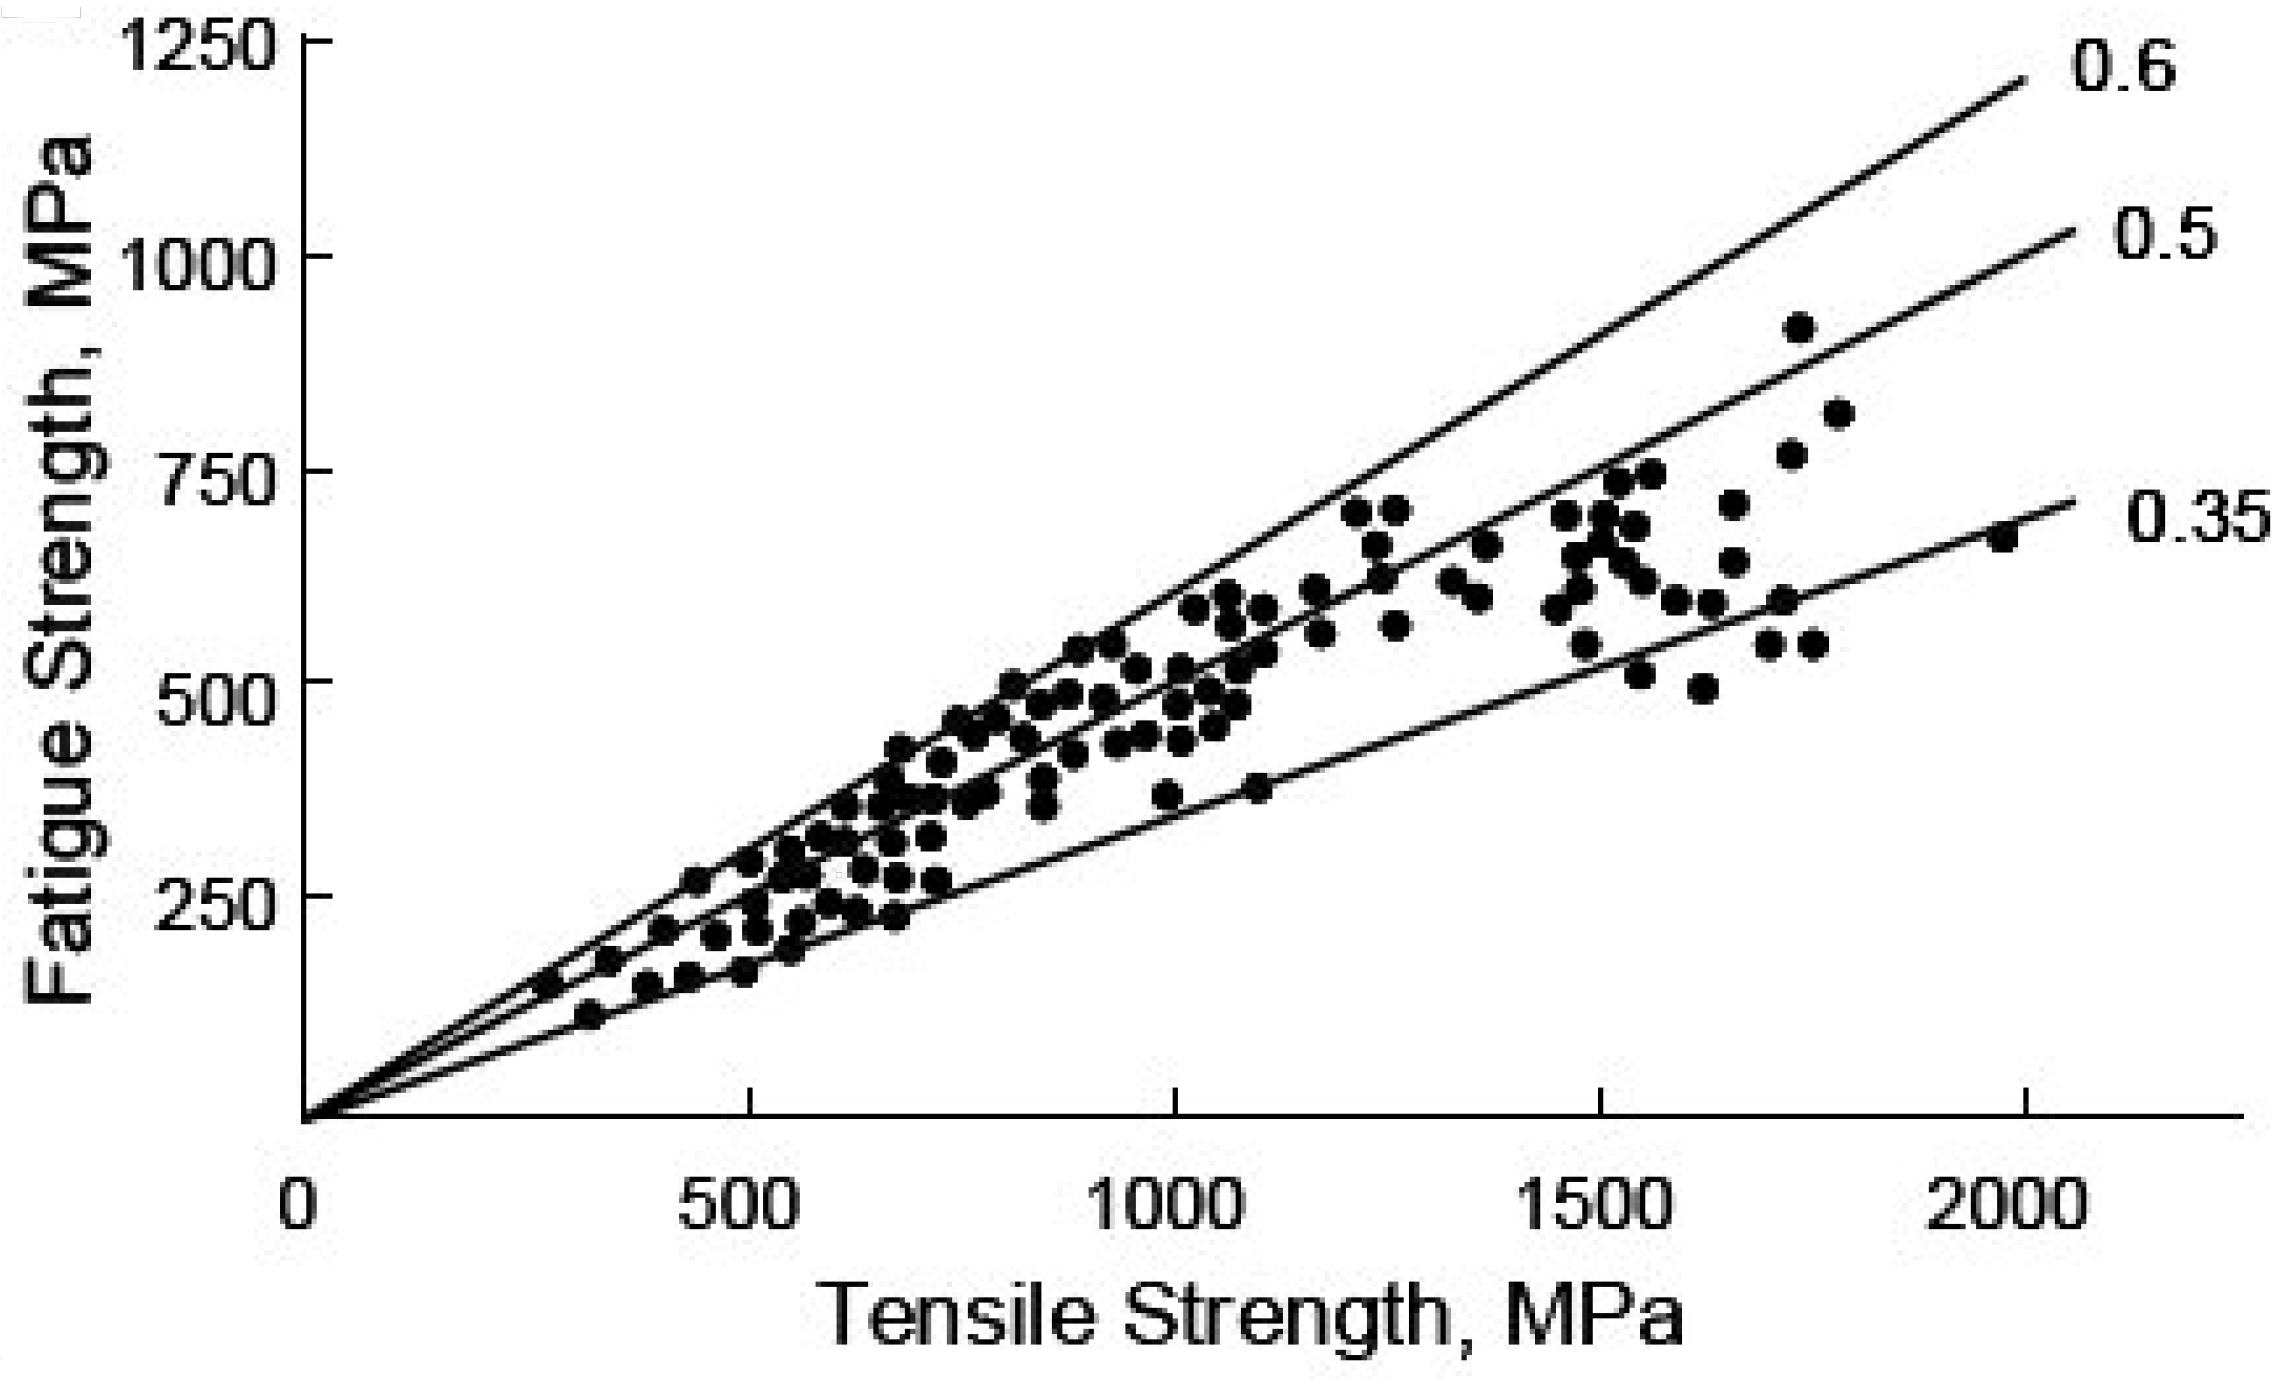
The primary objective of long-life fatigue testing is to identify this endurance limit, where the material behavior transitions to a theoretically infinite life regime. To assess the accuracy and consistency of these experimentally obtained values, they were compared against empirical data from the literature. A widely recognized correlation exists between the ultimate tensile strength (Sut) and the fatigue limit (Sf) for fully reversed loading conditions and unnotched specimens. This ratio, defined as the fatigue ratio (Sf/Su), has been derived from numerous experimental studies, especially for carbon and low-alloy steels [27]. This empirical relationship is graphically presented in Figure 17.
The reported fatigue ratios for smooth steel specimens under fully reversed bending typically range between 0.35 and 0.6, with values clustering at approximately 0.5 for materials with ultimate tensile strengths below 1400 MPa. In this study, the experimentally obtained fatigue ratio was 0.57 on the basis of an ultimate tensile strength of 734 MPa, which yields a theoretical endurance limit ranging between 256.9 MPa and 440.4 MPa. The measured value of 421.018 MPa falls well within this expected range, reinforcing the reliability and validity of the test results. Although material variability and testing uncertainties are inevitable, the observed agreement with the theoretical predictions and empirical data suggests that the determined endurance limit is both consistent and scientifically robust.
A comparison of the 304 stainless steel test results obtained via the developed rotating bending test machine with literature findings is presented in Table 6. On the basis of this comparative evaluation, the following assessments can be made regarding the accuracy of the results:
  • The ASM Metals Handbook, Volume 19: Fatigue and Fracture [5] states that the endurance limit for 10% CW AISI 304 stainless steel in rotating bending fatigue tests is 60 ksi (≈413.7 MPa); the present study corresponds to a 1.76% higher endurance limit.
  • Behvar et al. [25] reported an endurance limit of 405 MPa for hourglass-type AISI 304 stainless steel specimens tested at room temperature. Compared with this result, the endurance limit found in the present study is 3.95% greater.
  • Maximov et al. [28] reported that the endurance-limit value of 304 stainless steel material was 440 MPa. The present study’s endurance limit is 4.32% lower than this reference.
  • Nahm et al. [29] and Strzelecki et al. [30] performed rotating bending fatigue tests on AISI 304 stainless steel specimens and reported an endurance limit of 400 MPa. In comparison, the endurance limit obtained in the present study deviates from this value by 5.25%.
Despite these discrepancies, the obtained results remain within an acceptable deviation range (1–5.25%) from the well-established literature, underscoring the robustness of the experimental data.
In addition to endurance limits, Table 6 also includes information regarding the surface finish techniques applied in each referenced study. For example, Strzelecki et al. [30] utilized turning with Ra ≈ 1.25 µm, whereas Maximov et al. [28] employed turning followed by polishing, resulting in Ra ≈ 0.32 µm. In the present work, precision turning produced an Ra value of approximately 0.46 µm. Although this does not meet the ASTM E466 ideal of Ra < 0.2 µm, it represents a realistically achievable surface finish within standard machining practices. Notably, the endurance limit observed in our study (421 MPa) remains consistent with the literature, underscoring that polishing is not an absolute prerequisite for reliable fatigue testing when the machining quality is controlled. This finding reinforces the industrial relevance and validity of the presented data.

4.3. Quantitative Assessment of Experimental Time Efficiency: Theoretical Projections and Empirical Outcomes

4.3.1. Theoretical Time Efficiency Modeling

A predictive time-efficiency model was developed to estimate the total duration of the fatigue testing campaign under varying degrees of parallelization. This modeling effort aimed to evaluate how effectively the custom-built testing system can accommodate long-duration experiments, particularly at lower stress levels where the fatigue life significantly increases.
The core dataset used in this modeling is summarized in Table 7. These values were not arbitrarily chosen but were instead derived from experimental fatigue results obtained using AISI 304 stainless steel in the present case study. For each stress level, the corresponding fatigue life was either directly observed or reasonably approximated on the basis of the experimental outcomes shown in Figure 16. These values were then used to compute test durations by converting the number of cycles to minutes, assuming a constant rotational speed of 1000 rpm.
A particular challenge arose at the endurance-limit region (421 MPa), where the test results exhibited bimodal behavior: approximately half of the specimens experienced run-out (no failure up to 3 million cycles), whereas the other half failed after approximately 1.5 million cycles. To reflect this experimentally observed divergence, the endurance-limit group was split into two entries in Table 7—each with five specimens, one for the high-end (run-out) and one for early fracture behavior. This 5–5 split was not an inconsistency or experimental deviation but rather a deliberate modeling strategy to capture the statistical nature of the fatigue performance near the endurance limit. The average fatigue lives used for each subgroup reflect the realistic spread in the results and provide a balanced estimate for the total test time without overstating or understating the machine’s efficiency.
While standard fatigue testing protocols typically require testing at five stress levels with ten specimens each [8,9], the present study adopted a more detailed approach by using seven stress levels, with ten specimens per level, to allow for finer resolution in constructing the S–N curve. As such, a total of 70 specimens were tested, and the time-efficiency model was built upon this comprehensive matrix.
The model’s time estimates support scheduling and resource planning while also enabling a practical evaluation of system throughput and capacity under realistic laboratory constraints.
The model also accounted for practical constraints, including a fixed 5 min interruption for each specimen replacement and standard weekday working hours (08:30–12:00 and 13:30–17:00). The machine itself was allowed to operate continuously outside working hours, but specimen mounting was strictly limited to working periods. Furthermore, the latest possible mounting times were defined as 11:55 in the morning and 16:55 in the afternoon. Any unmounted specimens beyond these cut-off values were deferred to the next work session. These constraints are summarized in Table 8.
Additionally, during any specimen replacement, the entire system is paused—regardless of which stations remain active. Thus, a scenario with four specimens requiring replacement would lead to a 20 min pause for the entire setup.
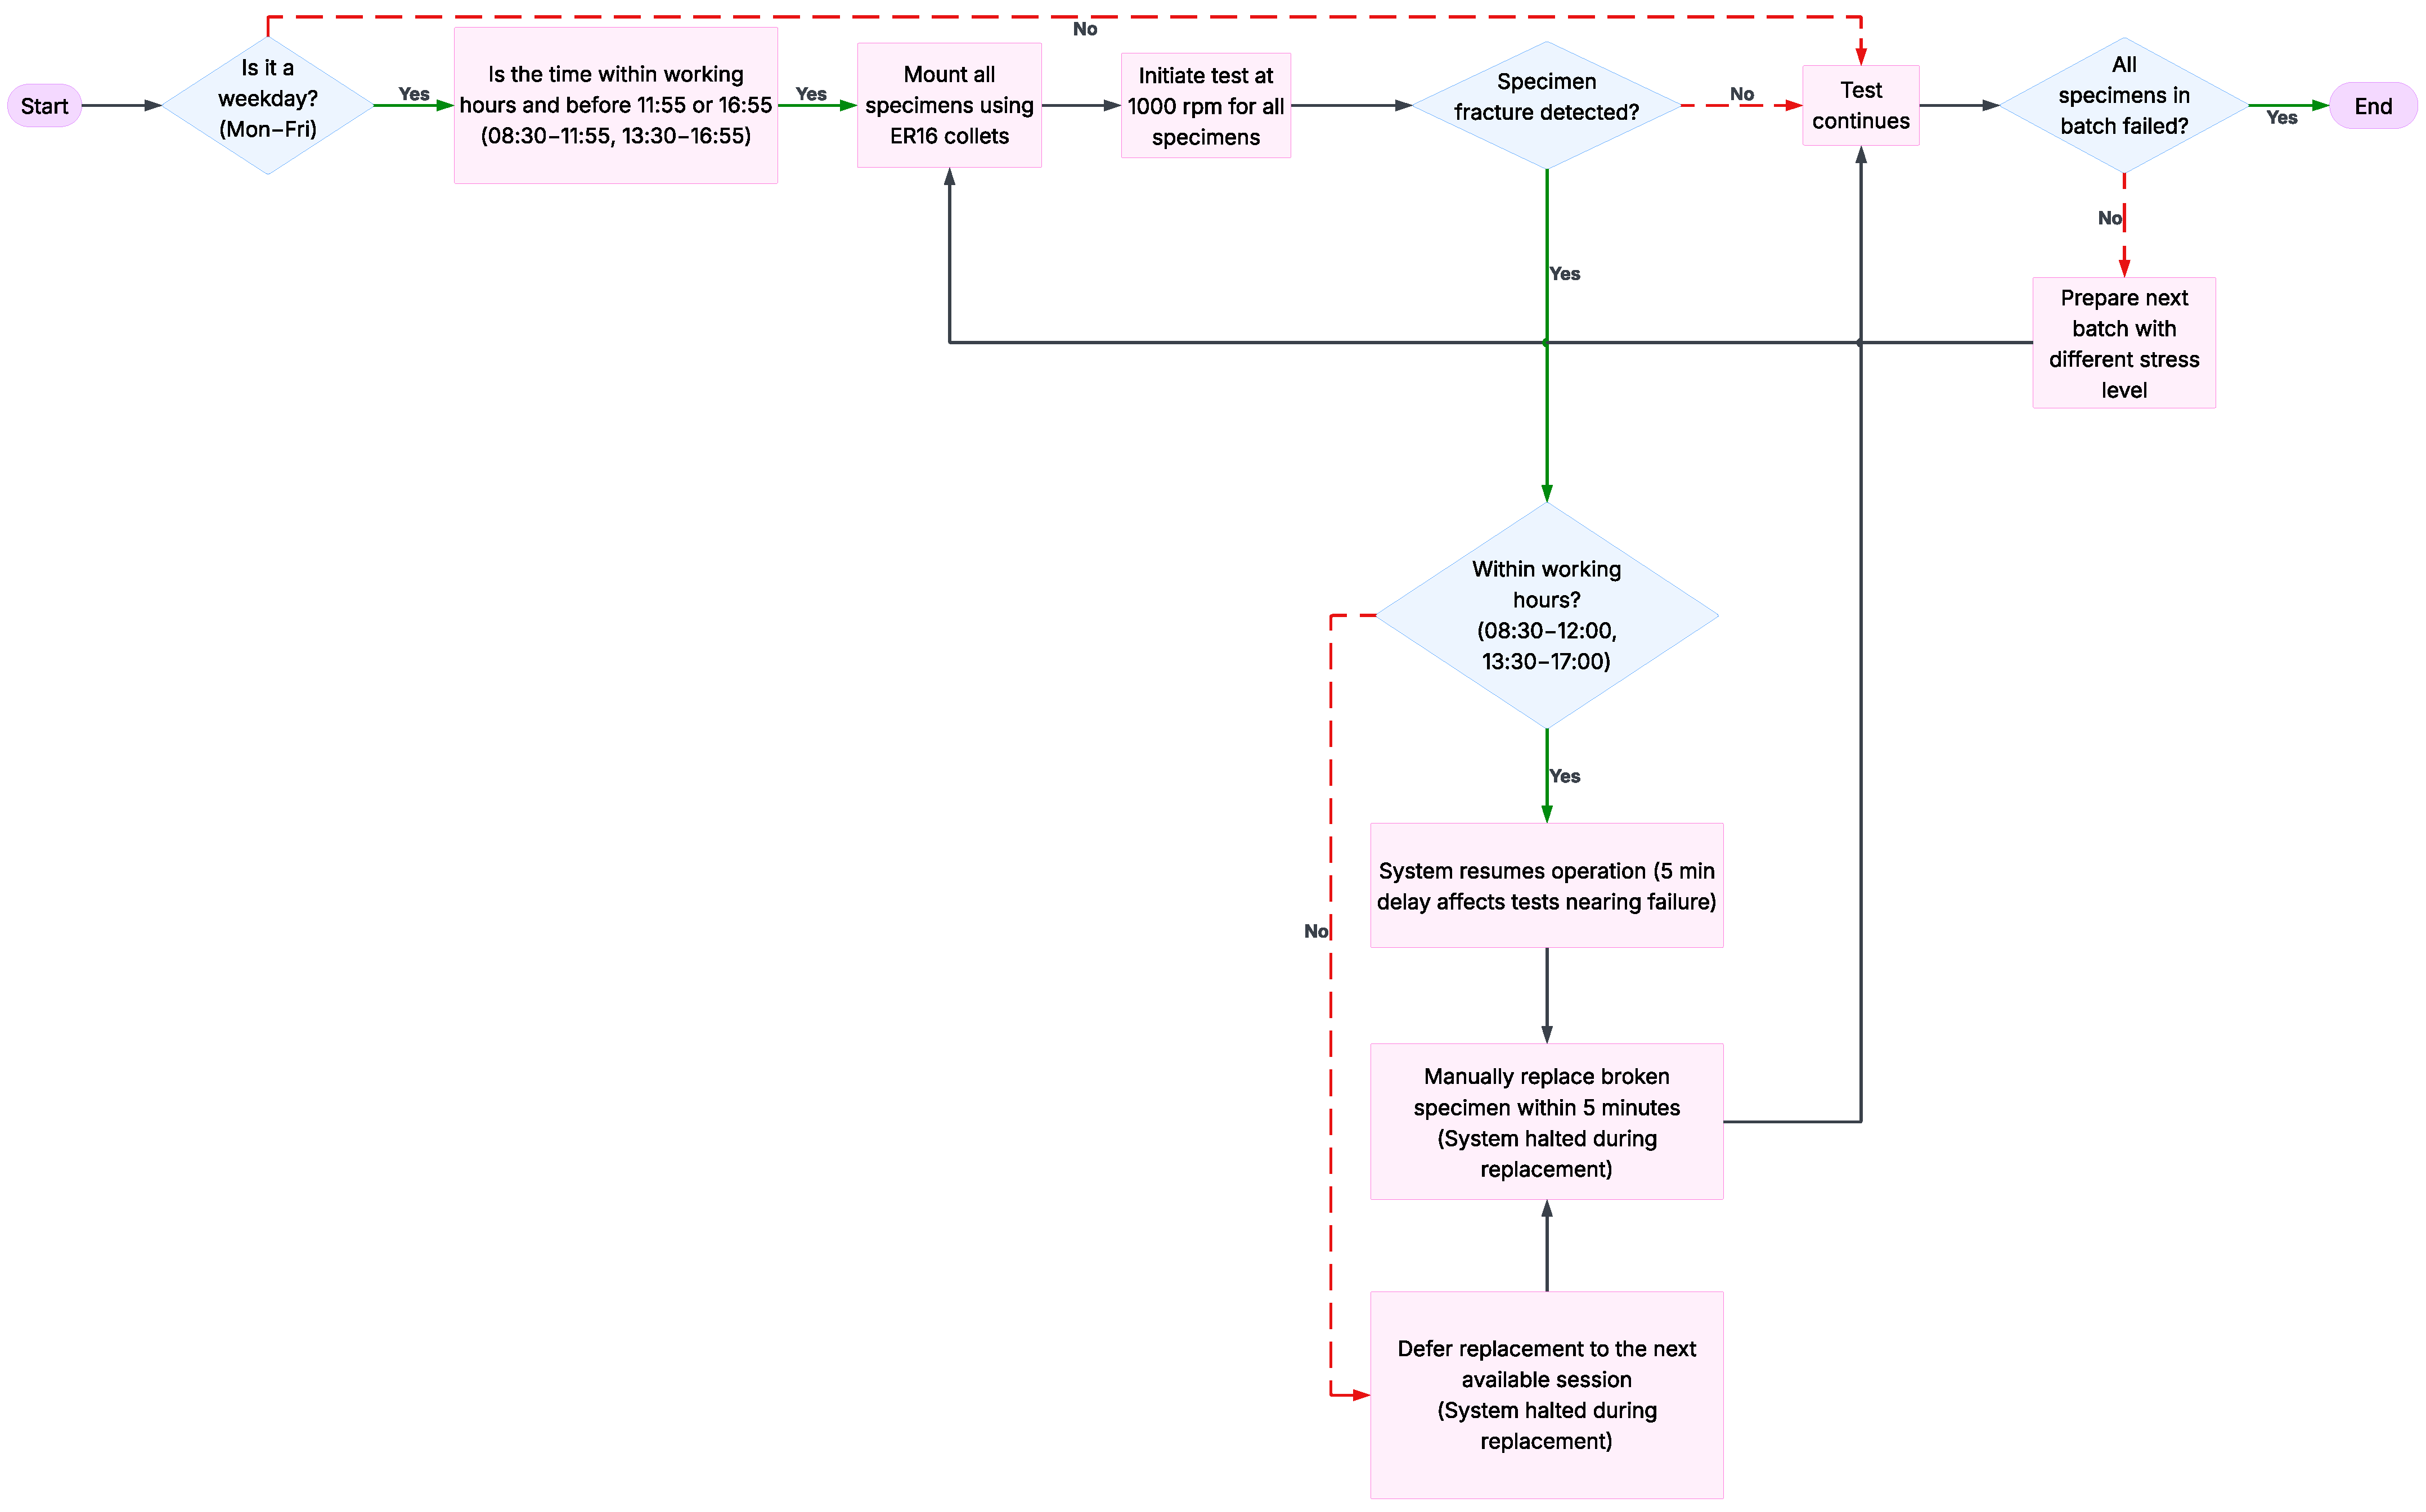
On the basis of these assumptions and constraints, a rule-based simulation algorithm was designed to model the time-dependent behavior of the experimental setup. The algorithmic logic (illustrated in Figure 18) governs how specimen fractures are detected, how the centralized system responds to interruptions, and how replacement scheduling is handled in accordance with working-hour limitations. The model also incorporates parameters such as deferred replacement scheduling for out-of-hour failures, synchronized specimen replacement across stations, and total stoppage of the machine during any replacement activity.
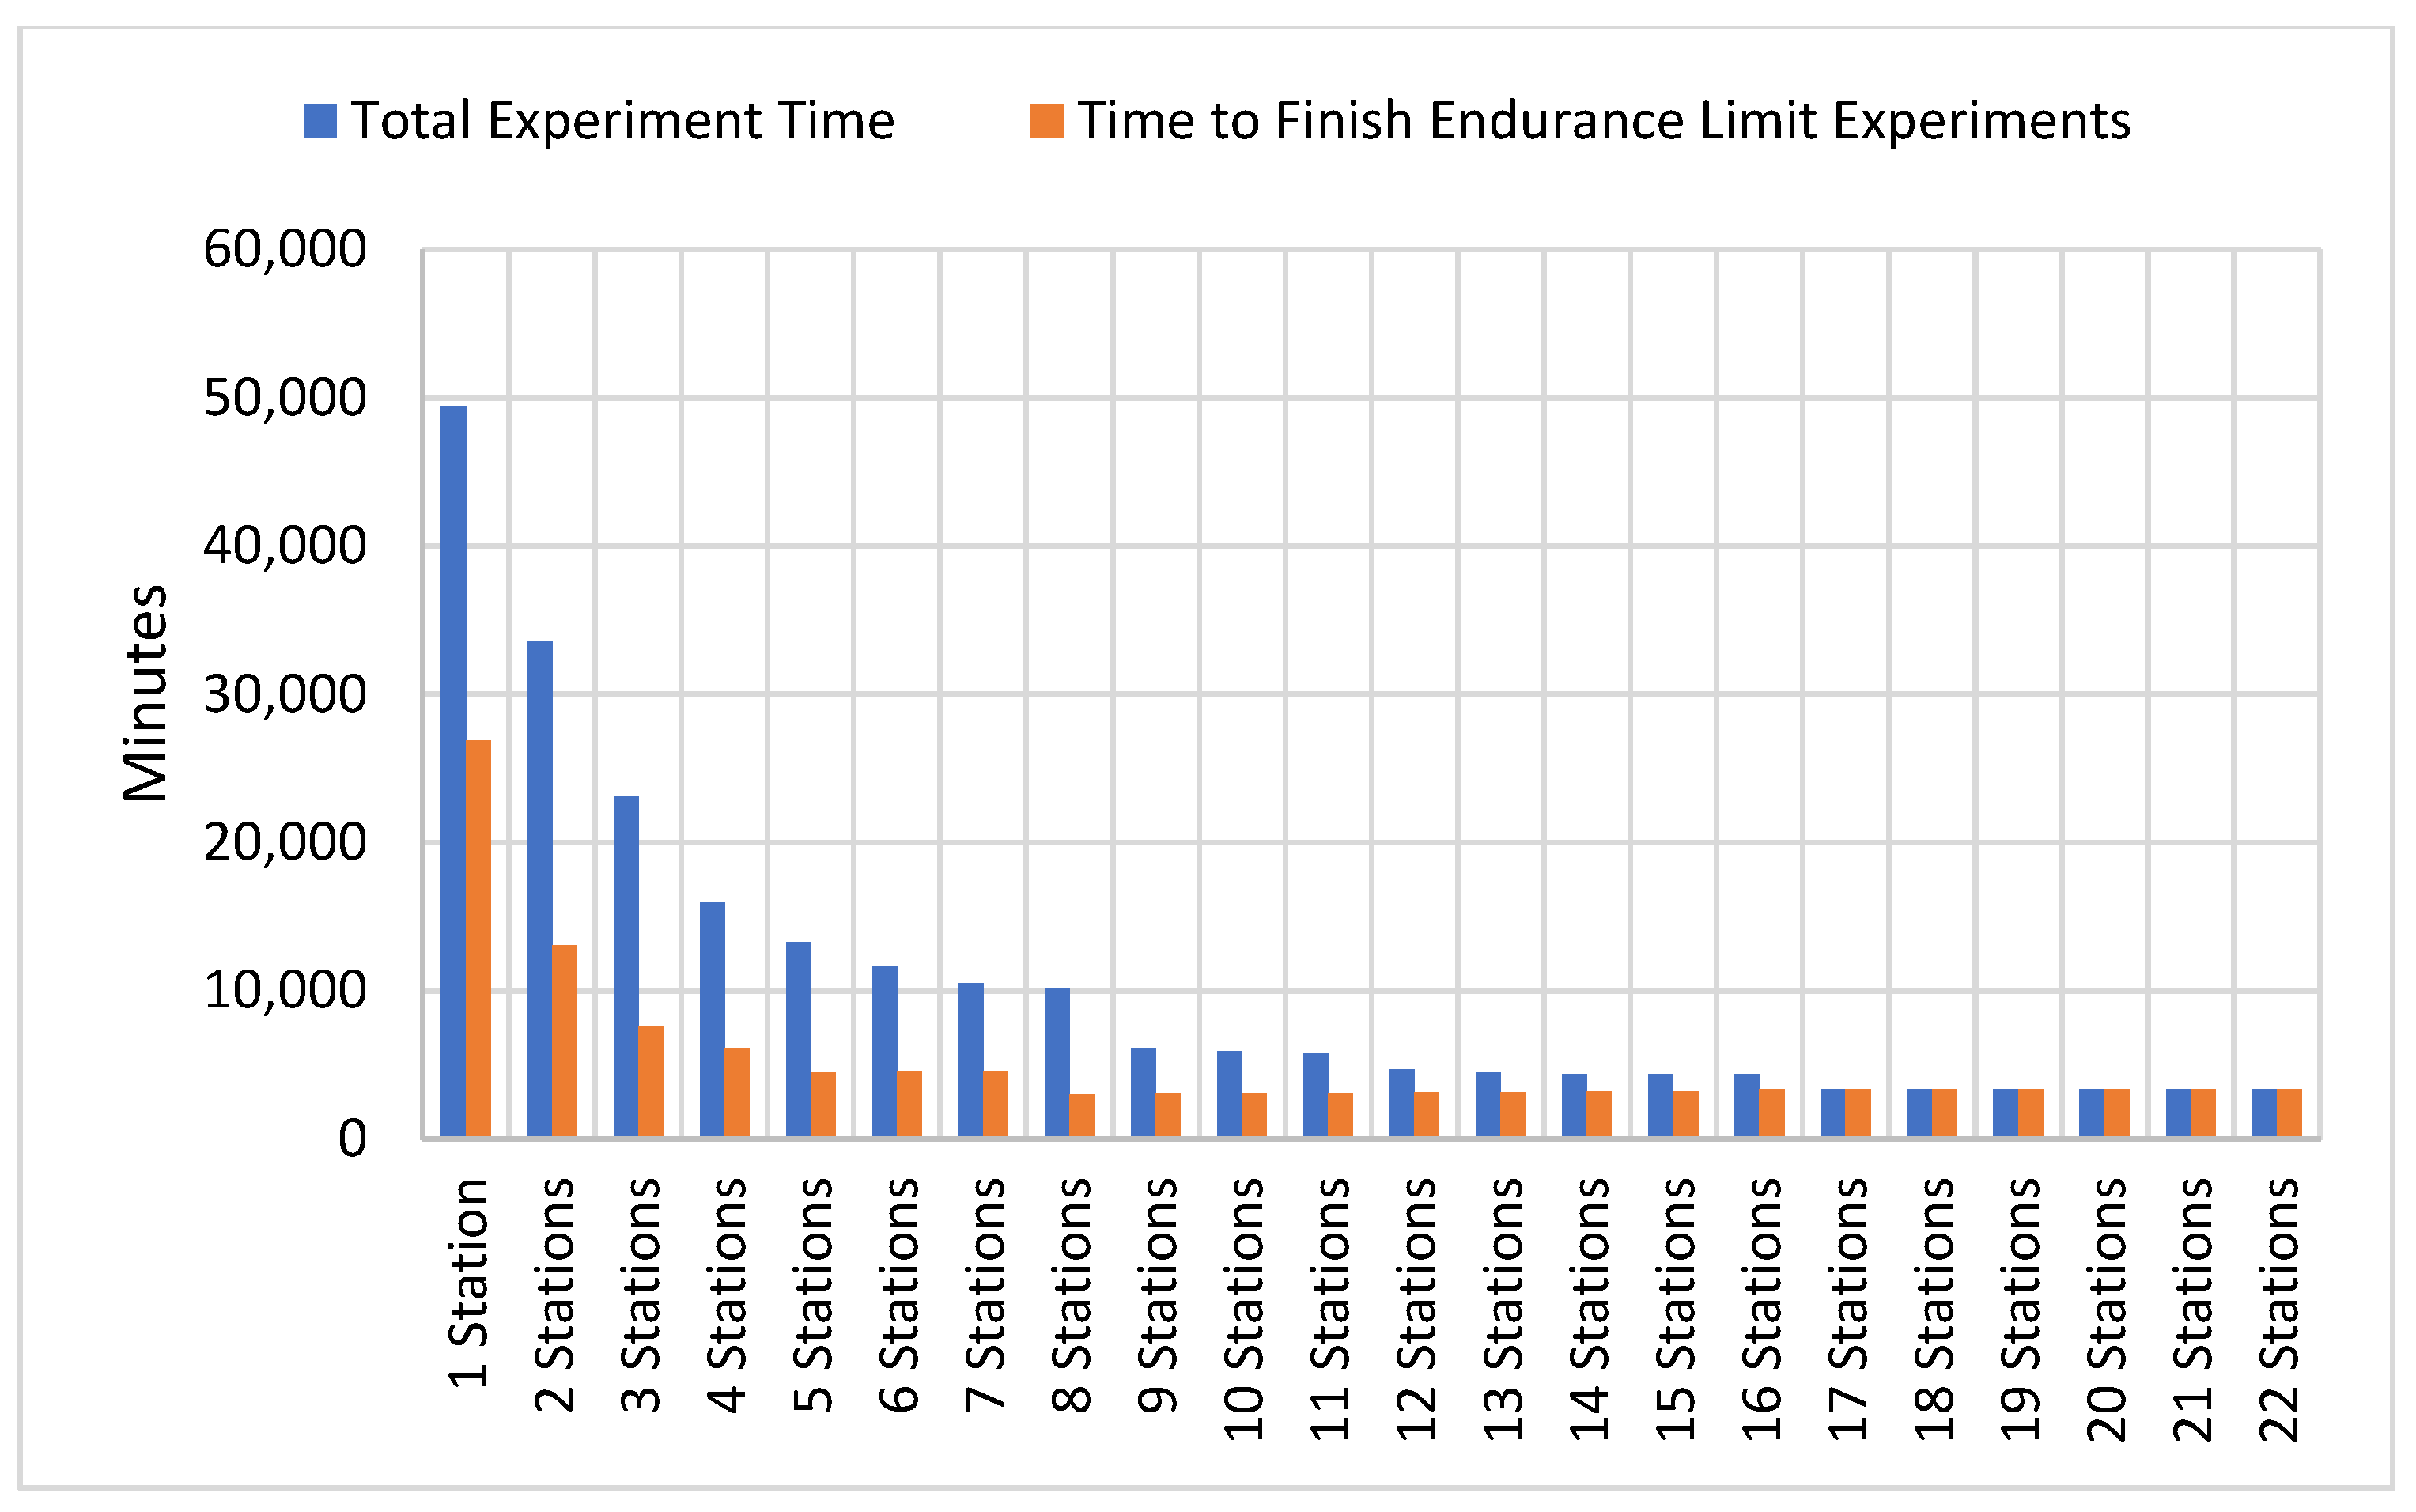
Using this algorithmic logic, various configurations with different numbers of active test stations (from 1 to 22) were evaluated. The corresponding results are presented in Figure 18, where the total test durations and time to complete the endurance-limit tests are compared. As illustrated in Figure 19, the predictive model outputs were visualized as a composite plot featuring a two-bar series. The first bar group represents the total test duration required to complete the full experimental campaign, whereas the second bar group reflects the time needed exclusively to complete the endurance-limit tests. This dual representation allows for a clearer interpretation of how different station configurations impact both the overall test timeline and the critical endurance-limit subset. Specifically, tests that took 34 days, 7 h, and 50 min with a single-station setup were completed in just 2 days, 7 h, and 50 min, respectively, via a 22-station configuration.
Notably, the results indicated that at 17 test stations, the duration required to complete the endurance-limit experiments matched the overall experimental campaign duration. This convergence signifies that the longest running and the remaining groups concluded simultaneously. Increasing the number of stations beyond 17 did not yield any further synchronization benefit as both the endurance group and the total campaign would already have concluded. Therefore, further station additions beyond this point do not contribute to reducing the overall test duration in practical terms.
To further assess the effectiveness of station parallelization, Figure 20 shows the percentage reduction in the total test duration relative to the single-station baseline. As the number of stations increased, a substantial decrease in the percentage reduction over time was observed. This reduction was most pronounced up to approximately nine stations, where each additional station contributed significantly to time savings. For example, with four stations, the reduction reached 67.7%, and with nine stations, it rose to 87.6%. Although the rate of increase tapered beyond this point, a significant efficiency gain was still achieved—reaching 91% at 14 stations. The peak value occurred at 17 stations, with a 93.2% reduction in the total test duration, after which the efficiency plateaued, indicating no further improvement with additional stations.
Notably, the reduction trend plateaued because of two intertwined scheduling phenomena. First, during off-hour specimen failures, the machine continues operating uninterrupted until working hours resume—thereby deferring replacement without halting overall testing. In contrast, during working hours, every specimen replacement incurs a system-wide interruption of 5 min per specimen as human access is needed. Second, the endurance-limit specimens, which have the longest life spans, become the dominant time-determining factor when the number of active stations is low. As the number of stations increases, these long-duration tests are executed in parallel, thus reducing their synchronization delay. Consequently, after a critical threshold (17 stations in this study), additional parallelization no longer yields meaningful gains as both endurance and nonendurance groups already reach completion simultaneously.
Theoretical analyses clearly demonstrate that 17 test stations are sufficient for the defined experimental workload. Since the dual-end spindle technique involves two specimens on opposite ends of the same spindle, the total number of stations must always be even. Therefore, the use of 18 stations was identified as a practical and efficient solution. It achieves synchronization between the endurance limit and total test duration while maintaining an even number of test positions—rendering any further increase in station count unnecessary for this testing scope.

4.3.2. Experimentally Observed Time Savings

In addition to the theoretical model, a second analysis was performed using actual experimental results. This analysis focused solely on specimen fatigue durations recorded during testing. It does not account for any operational limitations, such as working hours, machine idle periods, or specimen replacement times.
T i m e ( m i n u t e s ) = C y c l e   C o u n t 1000   r e v o l u t i o n m i n u t e s
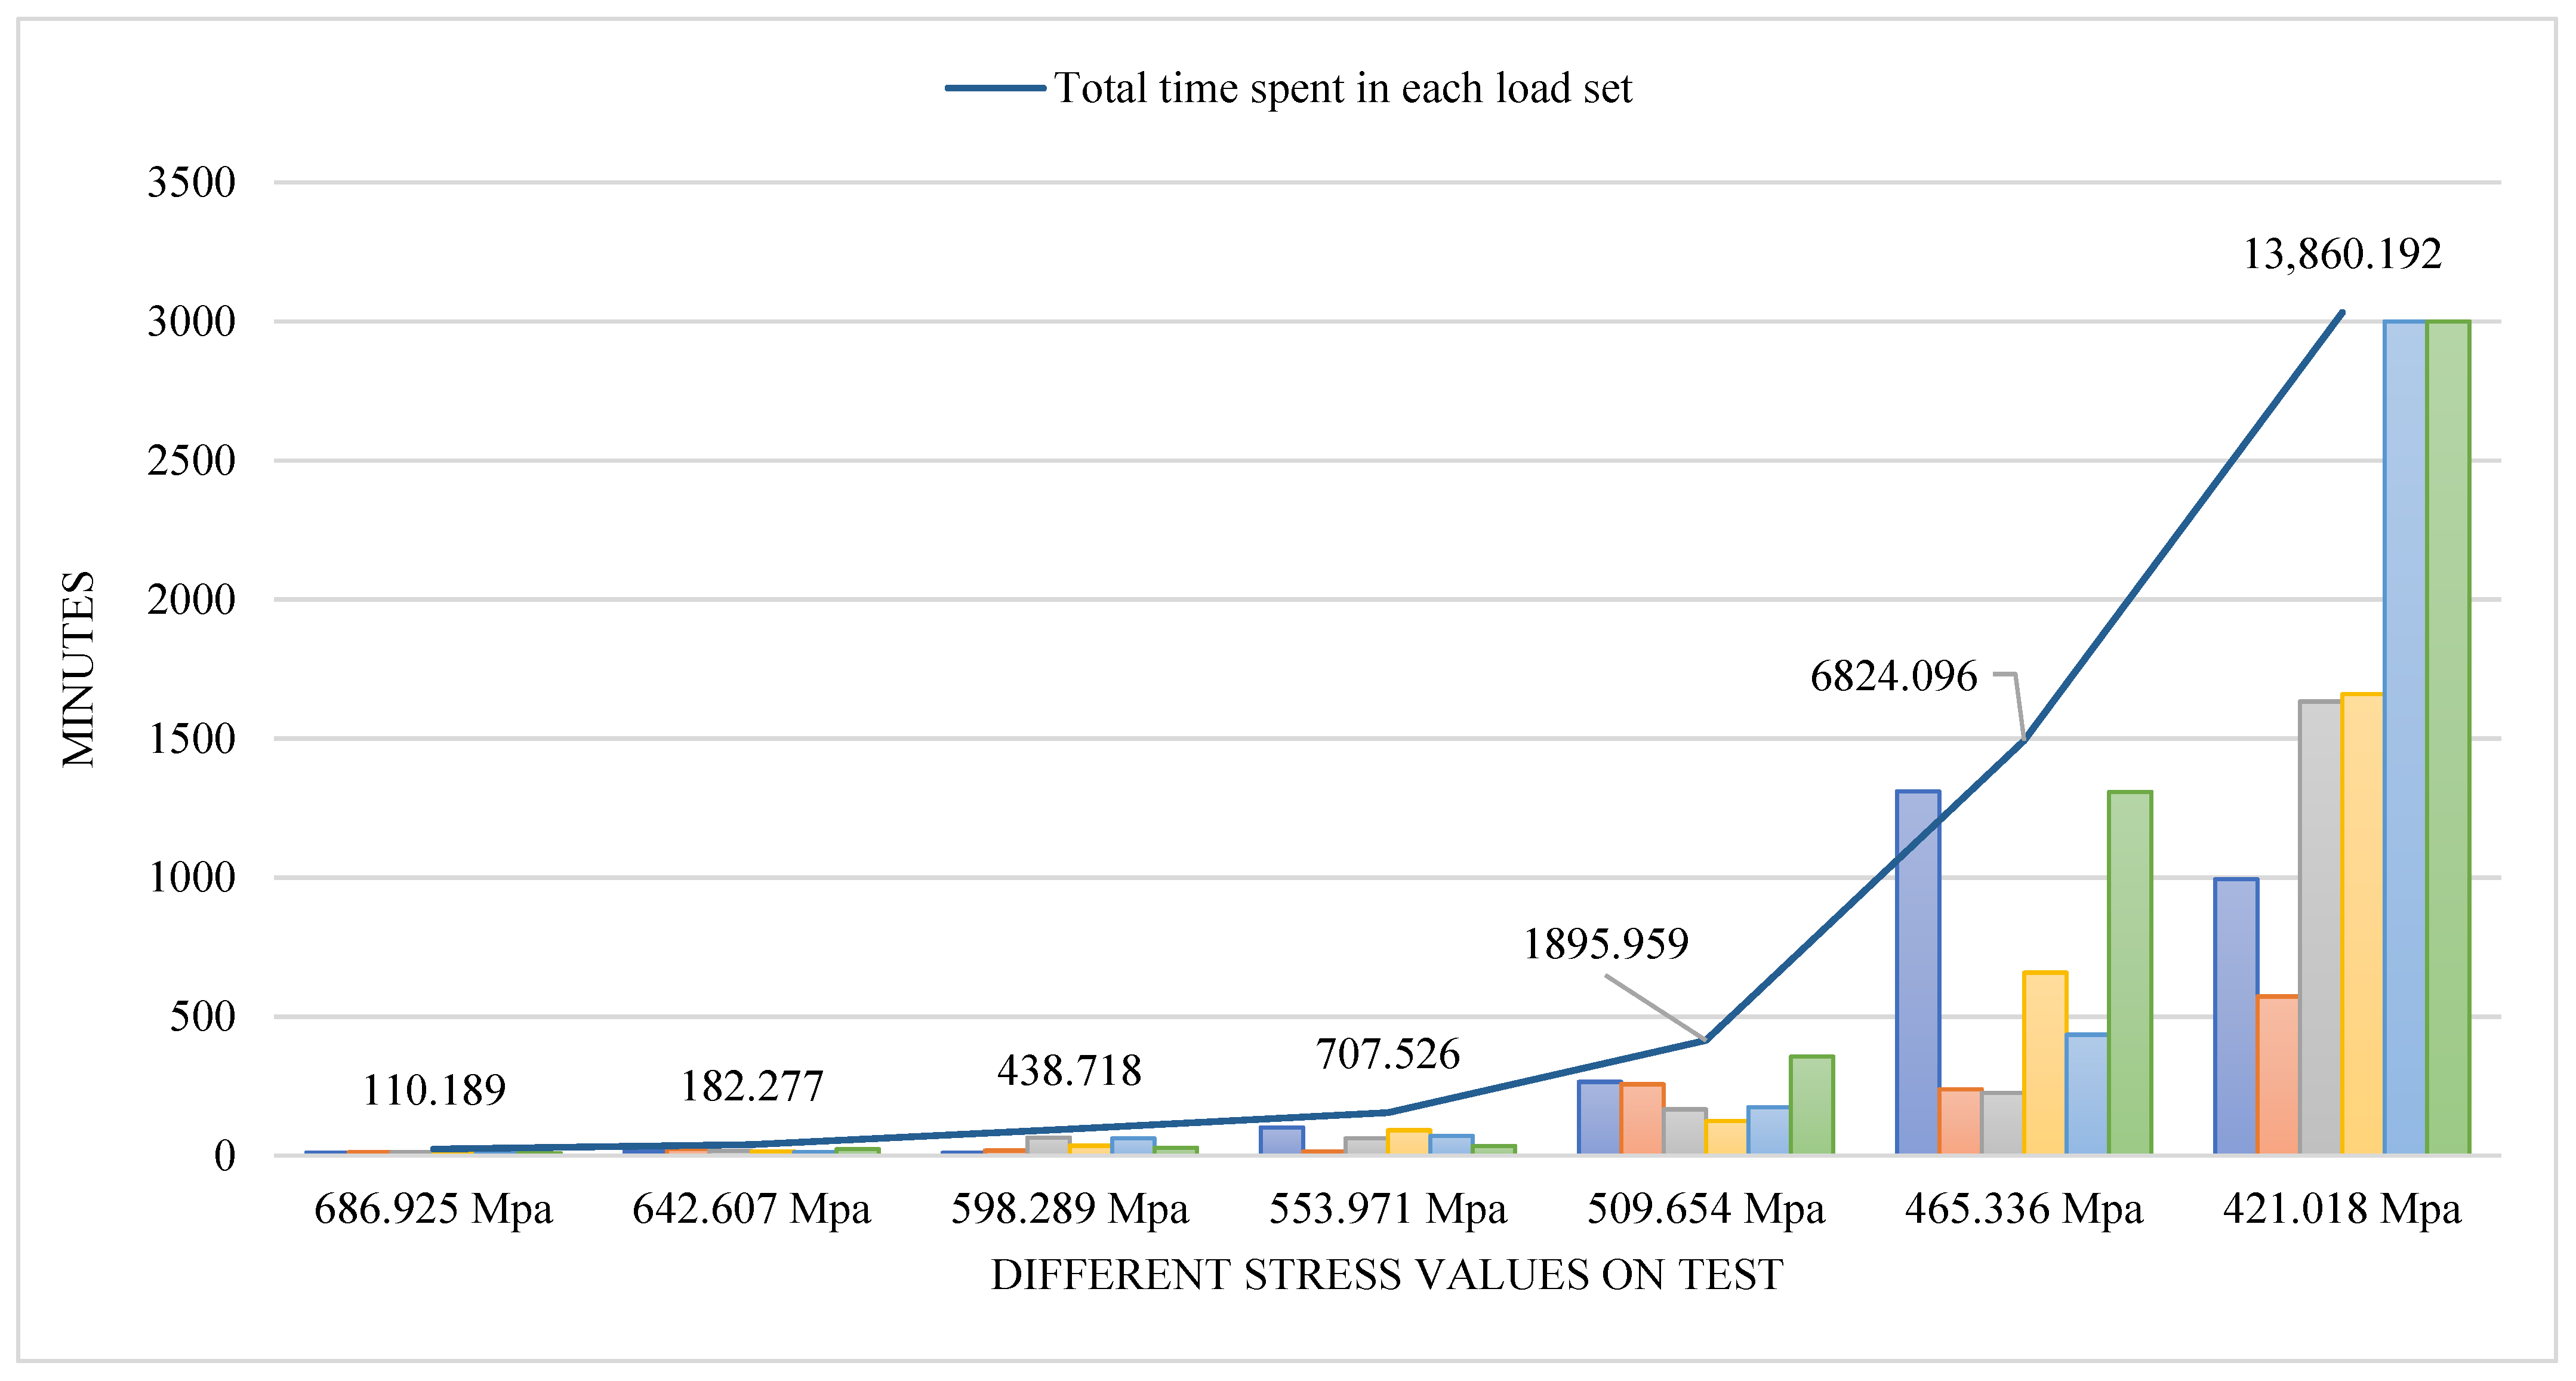
All the data are expressed in minutes via Equation (1). Figure 21 provides a dual-format visualization of these experimental durations. The line plot shows the total cumulative test duration at each stress level, whereas the bar plots display the individual test times per specimen, all expressed in minutes. This layout helps visualize both the overall testing effort and the variability across individual specimens.
As the figure illustrates, specimens tested at high stress levels (e.g., 689.925 MPa) were subjected to less time (e.g., 110 min), whereas those at lower stress levels (e.g., 421 MPa) were subjected to significantly more time, reaching a cumulative duration of approximately 13,861 min.
To assess the time efficiency, Figure 22 presents a comparison between the actual multi-specimen test execution and a conventional single-station setup. In the latter configuration, completing the full experimental matrix would have required approximately 24,019 min. In contrast, the high-throughput system accomplished the same workload in just 3000 min, corresponding to an estimated 87.5% reduction in the total test duration.
Importantly, this performance was achieved without operating the system at full capacity. The test matrix was executed with fewer than the maximum number of active stations, indicating that the observed time savings represent a conservative estimate. Further reductions in total duration are expected when the system is fully utilized.
These results highlight the effectiveness of the dual-end, parallel configuration and validate the scheduling strategy of initiating long-life specimens early in the test sequence. Overall, the findings demonstrate the scalability and operational efficiency of the proposed design for advanced fatigue characterization.

4.4. Fracture Surface Observations

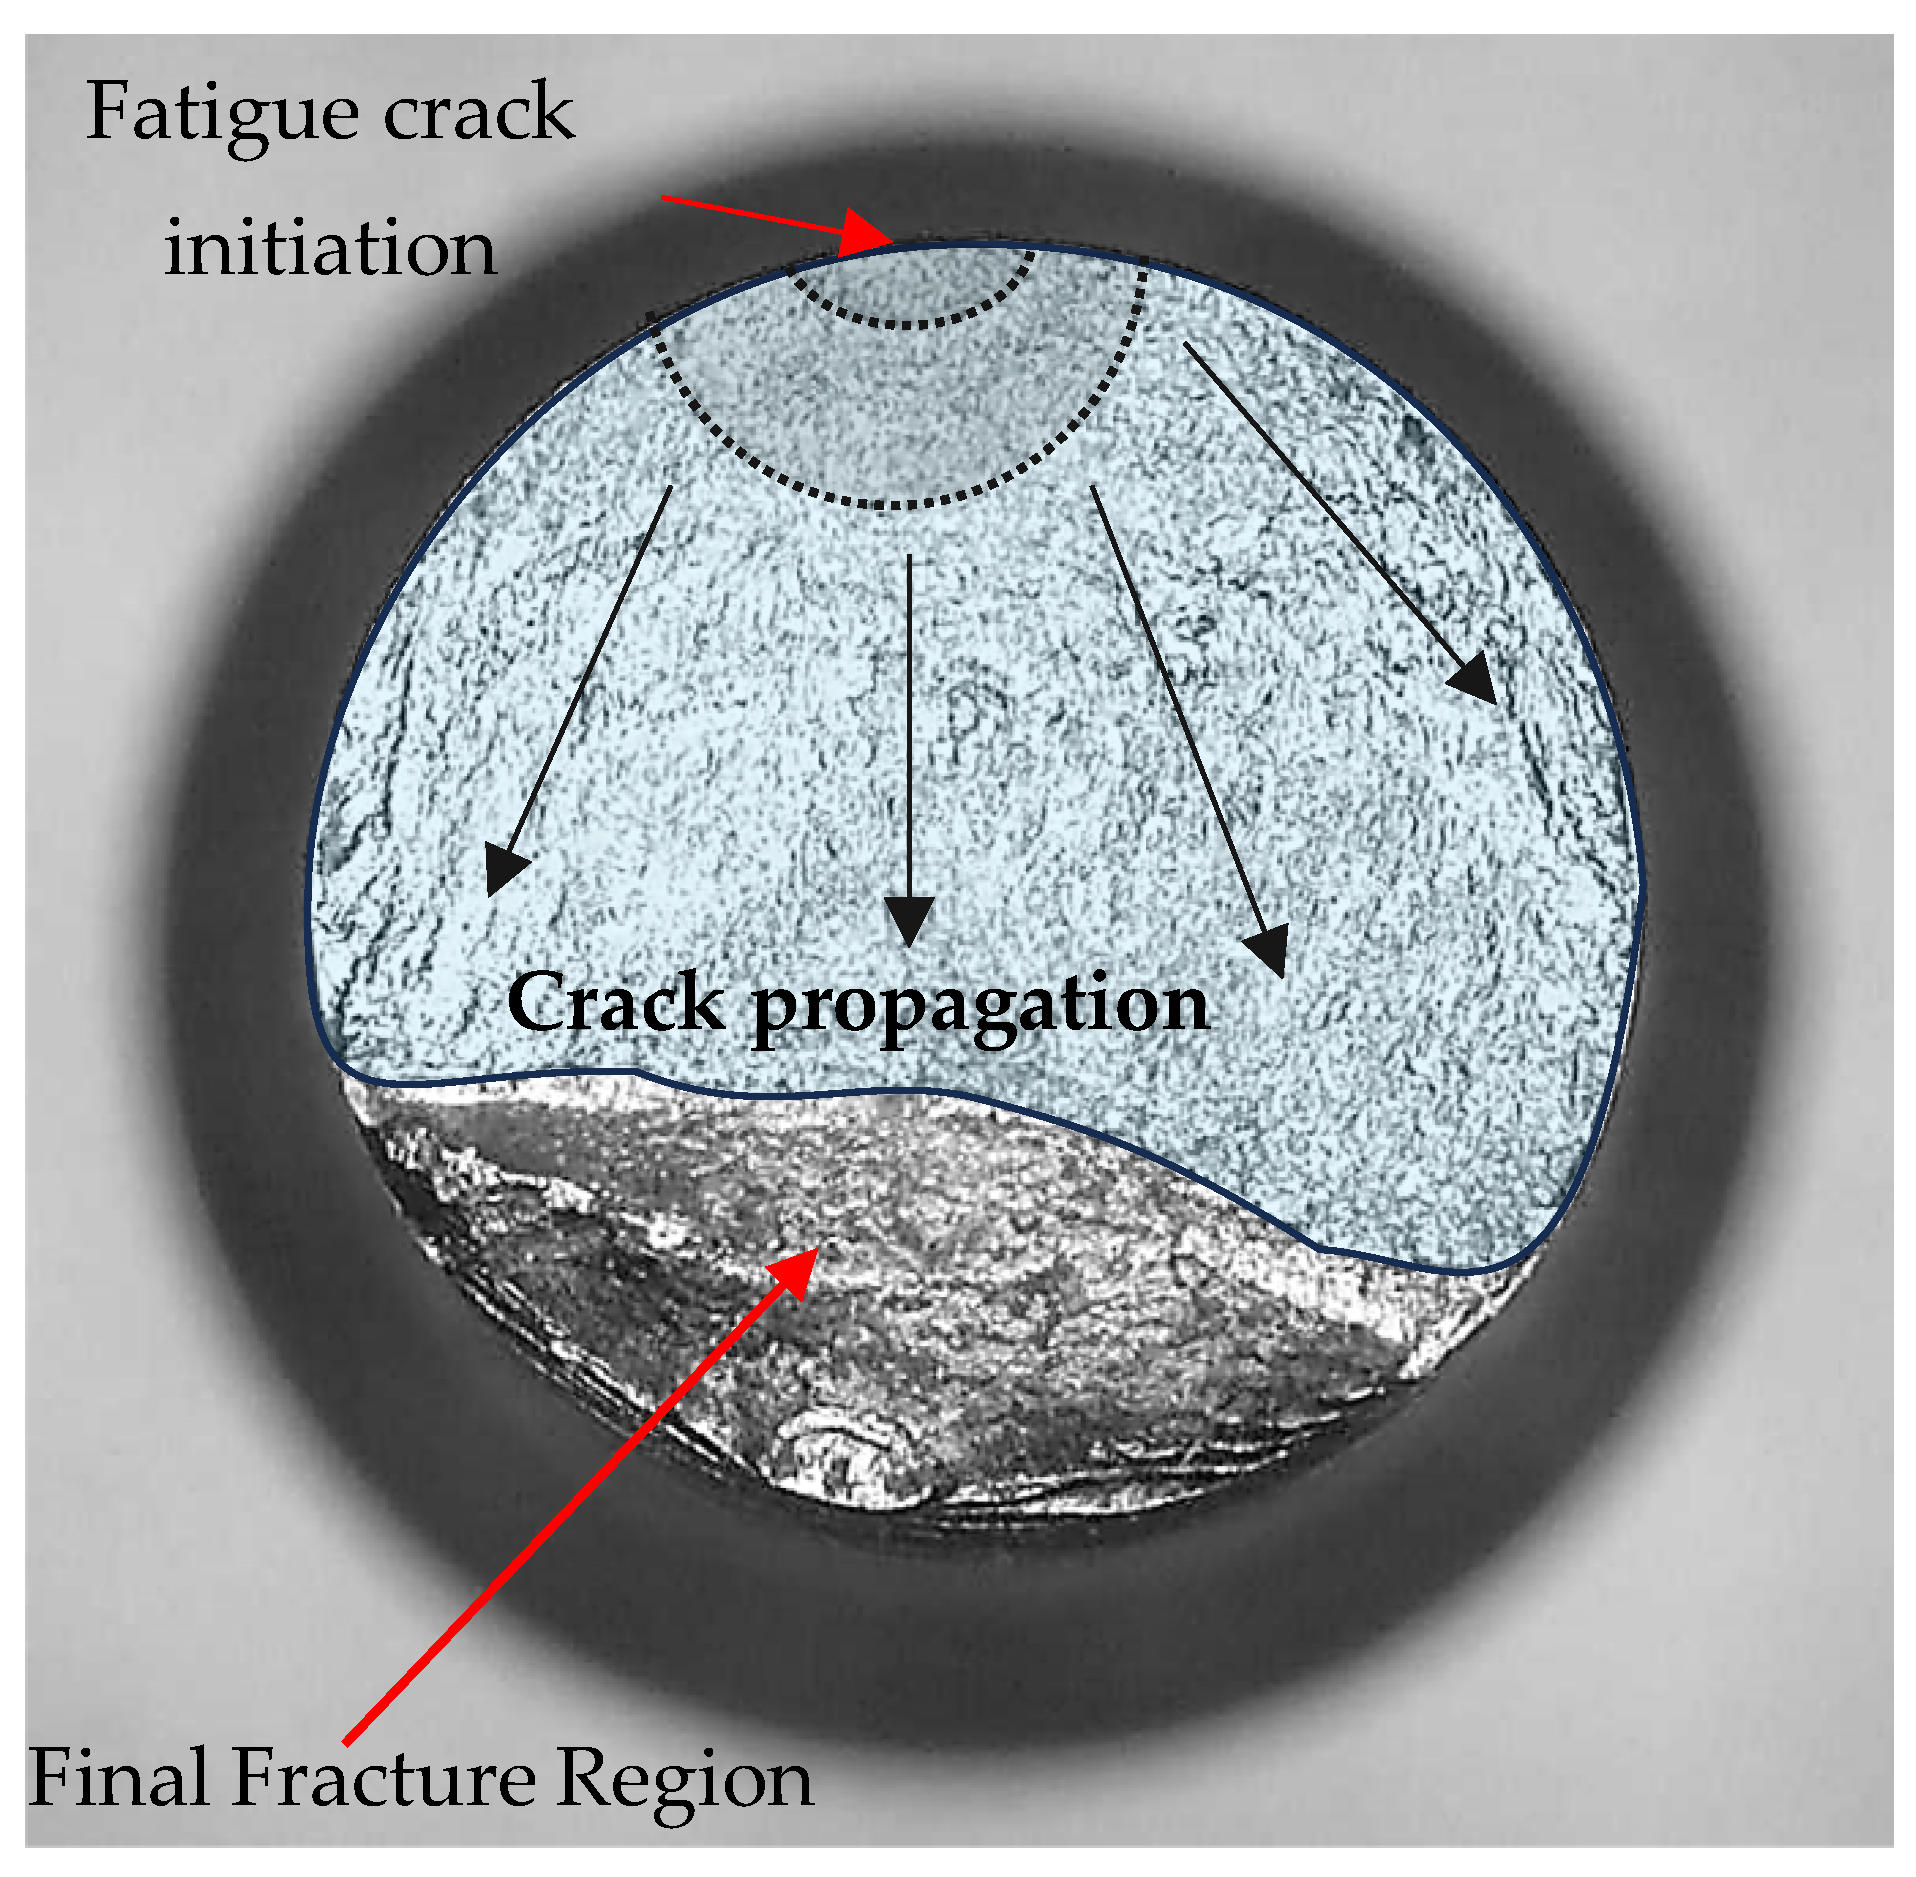
The aim of performing such tests is to evaluate the behavior of materials and components under prolonged cyclic loading in real-world applications. In rotating bending fatigue, fracture typically starts at the surface where cracks gradually develop and propagate over time until complete failure occurs. The fracture surfaces of the failed specimens exhibit distinct structural characteristics, with two visually identifiable zones. The first corresponds to the progressive crack propagation phase, whereas the second represents the final, sudden fracture. Microscopic examination reveals that the final fracture region is dark and dull, whereas the crack propagation zone is bright and smooth. Understanding these fracture stages is critical for assessing material performance and failure mechanisms under cyclic loading conditions.
Figure 23 presents an image from the experiment conducted in this study, which illustrates the key fracture stages, including crack initiation, propagation, and the final fracture zone. The experimental results indicate that the crack originated from a specific point and gradually progressed until it reached the final fracture region, where complete failure occurred. The observed fracture characteristics align with those described in the literature, demonstrating consistency with established fatigue failure mechanisms [6,8,9]. This validates the experimental setup and confirms its relevance in analyzing the fracture behavior of materials under rotating bending fatigue conditions.
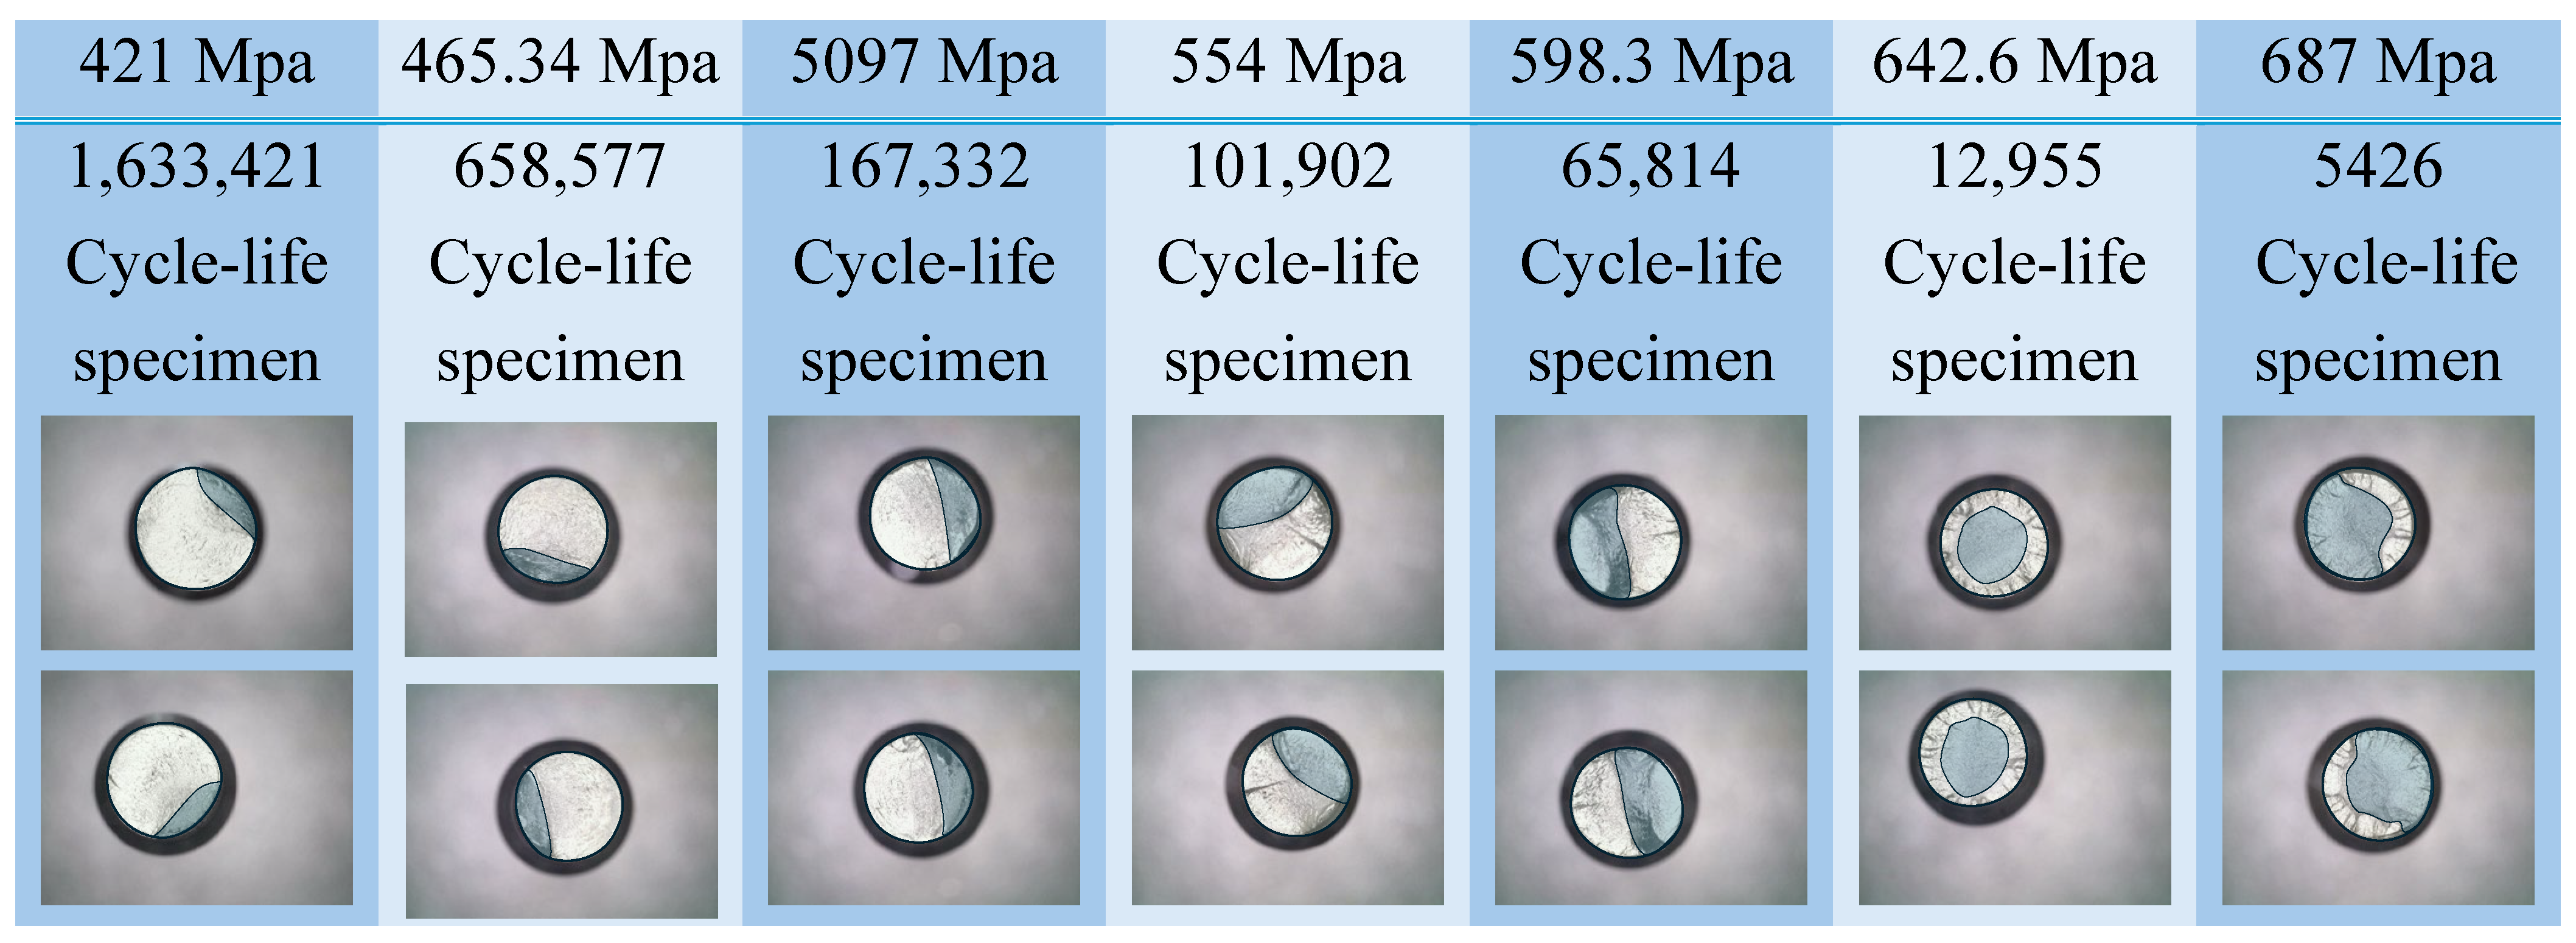
In rotating bending fatigue tests with smooth specimens, the final fracture region is smaller in area under low nominal stress, whereas the final fracture region is larger in area under high nominal stress in experimental studies [3,6,31].
As a result of the test, both fracture surfaces of the specimens with fracture damage were visualized with a microscope, and photographs of the damaged surfaces were taken. One specimen image from each load set was selected and is shown in Figure 24. The light-colored region is the crack propagation zone and has a very bright, smooth appearance under light loads. As a requirement of the test characteristics, the area of the sudden fracture zone increases when the applied load increases. At heavy loads, the crack propagation zone clearly exhibited plastic deformation, and the surface texture had a rougher geometry.
As a consequence of the examination of the fracture surfaces of the test specimens, the tests revealed a substantial degree of rotational bending fatigue, and the results were highly significant.

5. Conclusions

This study presents a dual-end, multi-station rotating bending fatigue testing platform designed to achieve high-throughput precision testing. The outcomes of this work can be summarized through the following key findings and contributions:
  • Substantial Time Efficiency: Theoretical modeling predicted a maximum time reduction of 93.2% with full utilization of all 22 stations, whereas experimental validation demonstrated a real-world efficiency gain of 87.5%. Notably, this result was achieved without operating the system at full capacity, indicating that even greater reductions are attainable under fully loaded conditions. These findings confirm the system’s potential to dramatically accelerate fatigue testing workflows.
  • Optimized Resource Allocation: The analytical results identified 18 stations as the optimal configuration, balancing throughput with diminishing returns beyond this point. This finding offers a strategic reference for laboratories aiming to maximize efficiency with minimal redundancy.
  • Validated Endurance Limit and Structural Reliability: Testing of AISI 304 stainless steel established an endurance limit of 421 MPa, with deviations within ±5.25% of the published literature, confirming the mechanical fidelity of the test system.
  • Seamless Automation and Modularity: Integrated with a previously validated PLC-controlled automation unit Doğan et al. [23], the system offers robust control, real-time monitoring, and flexible scalability to accommodate varying experimental demands.
  • Strategic Test Planning Model: A forward-looking scheduling model prioritized long-life specimens (e.g., endurance-limit tests) at the outset, ensuring synchronized test completion and minimized idle time, especially under constrained working-hour scenarios.
  • Maintenance-Oriented Design for Industrial Usability: The dual-end spindle unit was designed with maintenance efficiency and field serviceability in mind. A standard ER16 cylindrical-shank collet holder, readily available in industrial supply markets, was employed to ensure ease of replacement in cases of damage or wear. Furthermore, the entire spindle module is engineered for rapid disassembly, enabling complete replacement or repair in approximately one minute, significantly minimizing downtime.
  • Microscopic examination of fractured specimens revealed distinct crack initiation and propagation zones. Under light loads, the propagation regions appeared smooth and bright, whereas heavier loads resulted in plastically deformed, rougher textures. These consistent features across all load levels confirmed the validity and reliability of the fatigue life measurements.
The proposed system significantly enhances throughput in fatigue life studies, offering practical advantages in terms of both scalability and efficiency. Its design is particularly well suited for materials research and durability assessments in structural, automotive, and aerospace applications, where large-scale data acquisition and minimized test durations are of strategic importance.

Author Contributions

A.D.: writing—original draft preparation, validation, software, formal analysis, investigation, data curation, and visualization. K.G.: writing—review and editing, conceptualization, methodology, validation, supervision, project administration, and funding acquisition. İ.G.: writing—review and editing, conceptualization, methodology, and validation. All authors have read and agreed to the published version of the manuscript.

Funding

This research was funded by the Scientific Research Projects Coordination Unit (BAP) of Gaziantep University, grant number HUBF.DT.22.03.

Data Availability Statement

The data presented in this study are available upon request from the corresponding author.

Acknowledgments

The authors A.D., K.G. and İ.G. extend their sincere appreciation to the technical team of the Mechanical Engineering Laboratory at Gaziantep University for their dedicated support and hands-on assistance throughout the experimental and implementation stages of this study.

Conflicts of Interest

The authors declare that they have no conflicts of interest.

References

  1. Marijančević, A.; Braut, S.; Žigulić, R.; Skoblar, A. Fatigue Assessment of Marine Propulsion Shafting Due to Cyclic Torsional and Bending Stresses. Machines 2025, 13, 384. [Google Scholar] [CrossRef]
  2. Rivas, C.E.; Malo, G.D.; Minchala, L.I.; Probst, O. Self-Optimizing Control System to Maximize Power Extraction and Minimize Loads on the Blades of a Wind Turbine. Machines 2023, 11, 601. [Google Scholar] [CrossRef]
  3. Stephens, R.I.; Fatemi, A.; Stephens, R.R.; Fuchs, H.O. Metal Fatigue in Engineering; Wiley: New York, NY, USA, 2000; p. 496. [Google Scholar]
  4. Fukami, M.; Oguma, N.; Guennec, B.; Horikawa, N.; Sakai, T. Effects of Loading Modes on Fatigue Limit Estimation in Terms of Rotating Bending Fatigue and Rate Process Theory. Appl. Sci. 2024, 14, 477. [Google Scholar] [CrossRef]
  5. AIH Committee. ASM Handbook: Fatigue and Fracture; ASM International: Metals Park, OH, USA, 1996; Volume 19, p. 2592. [Google Scholar]
  6. Budynas, R.; Nisbett, K. Shigley’s Mechanical Engineering Design, 10th ed.; McGraw-Hill Education: New York City, NY, USA, 2014; p. 1106. [Google Scholar]
  7. AIH Committee. ASM Handbook: Mechanical Testing and Evaluation; ASM International: Materials Park, OH, USA, 2000; Volume 8, p. 2235. [Google Scholar]
  8. Marin, J. Mechanical Behavior of Engineering Materials; Prentice-Hall: Englewood Cliffs, NJ, USA, 1962; p. 502. [Google Scholar]
  9. Esin, A. Properties of Materials for Mechanical Design; M.E.T.U. Printing Office: Gaziantep, Turkey, 1981. [Google Scholar]
  10. Gentile, D.; Martorelli, M. Design and realization of a multisamples rotating high cycle fatigue machine. Frat. Ed Integrità Strutt. 2012, 6, 85–92. [Google Scholar] [CrossRef]
  11. Yamamoto, T.; Kokubu, A.; Sakai, T.; Kiyama, I.; Nakamura, Y. Development and fundamental preformance of dual-spindle rotating bending fatigue testing machine with special device providing corrosive environments. In Proceedings of the Asia Pacific Conference on Fracture and Strength–Mechanics and Materials (APCFS-MM2012), Busan, Republic of Korea, 13–16 May 2012. [Google Scholar]
  12. Yamamoto, T.; Benning, L.; Gotoh, K. Relationship between temperature property and loading frequency of rotating bending fatigue testing machine of cantilever type. In Proceedings of the International Conference on Very High Cycle Fatigue (VHCF), Dresden, Germany, 3–5 July 2017. [Google Scholar]
  13. Chauhan, S.J.; Misal, A.; Jadhav, A.; Jadhav, R.; Bhalavi, A.; Jagdale, R. Design and Fabrication of Rotating Bending Fatigue Testing Machine–A Laboratory Development Project. Int. Res. J. Eng. Technol. 2016, 3, 816–819. [Google Scholar]
  14. Banavasi, S.M.; Ravishankar, K.S.; Naik, P.S. Review on Design and Fabrication of Fatigue Testing Machine. Int. J. Nov. Res. Dev. 2018, 3, 5–14. [Google Scholar]
  15. Mali, P.R.; Chavan, U.S. Design and development of rotating bending fatigue test rig. J. Emerg. Technol. Innov. Res. 2018, 5, 578–586. [Google Scholar]
  16. Isakov, M.; Rantalainen, O.; Saarinen, T.; Lehtovaara, A. Large-Scale Fatigue Testing Based on the Rotating Beam Method. Exp. Tech. 2022, 47, 553–563. [Google Scholar] [CrossRef]
  17. Çipil, M.; Karabudak, F.; Zamanlou, H. Design and manufacturing of rotating bending fatigue test machine. Eur. J. Res. Dev. 2024, 4, 77–95. [Google Scholar] [CrossRef]
  18. Alaneme, K.K. Design of a Cantilever-Type Rotating Bending Fatigue Testing Machine. J. Miner. Mater. Characterisation Eng. 2011, 10, 1027–1039. [Google Scholar] [CrossRef]
  19. Ali, S.; Tahir, M.H.; Saeed, M.A.; Zaffar, N.; Khan, M.K. Design and Development of Fatigue Machine: Rotating Bending Fatigue Testing of different Materials. Int. J. Adv. Eng. Manag. 2019, 4, 8–15. [Google Scholar] [CrossRef]
  20. Kattimani, M.A.; Khatib, M.I.; Ghori, M.M.; Sajjad, M.A.; Jahangir, S.; Baqtaiyan, H.; Sadiq, M. Design and Fabrication of Fatigue Testing Machine. Int. J. Sci. Res. Sci. Eng. Technol. 2020, 7, 295–304. [Google Scholar] [CrossRef]
  21. Pilkey, W.D.; Pilkey, D.F. Peterson’s Stress Concentration Factors, 3rd ed.; Wiley: Hoboken, NJ, USA, 2007; p. 560. [Google Scholar]
  22. Doğan, A.; Göv, K.; Göv, İ. Modular and Service Orientated Design with Dual-End Spindle: A New Approach for Multi-Statıon Fatigue Test Systems. In Proceedings of the 5th Bilsel International Çatalhoyuk Scientific Researches Congress, Konya, Türkiye, 19–20 April 2025. [Google Scholar]
  23. Dogan, A.; Göv, K.; Göv, İ. Automation of a Multi-Station Rotary Bending Fatigue Test Machine with PLC Control System. Adıyaman Univ. J. Eng. Sci. 2025, 12, 143–158. [Google Scholar] [CrossRef]
  24. ASTM E466-07; Standard Practice for Conducting Force Controlled Constant Amplitude Axial Fatigue Tests of Metallic Materials. ASTM International: Conshohocken, PA, USA.
  25. Behvar, A.; Scott-Emuakpor, O.; James, K.; Crannell, B.; Haghshenas, M. Rotating Bending Fatigue Durability of Wrought 304 Stainless Steel: A Comparative Study of Surface-Treated vs. Untreated Specimen. J. Des. Against Fatigue 2024, 2, 1–12. [Google Scholar] [CrossRef]
  26. Zagielski, M. What Is the Difference Between a Chuck and a Collet? Available online: https://www.foredom.net/2024/06/what-is-the-difference-between-a-chuck-and-a-collet (accessed on 17 June 2025).
  27. Forrest, P.G. Fatigue of Metals; Pergamon: Bergama, Turkey, 1962; p. 436. [Google Scholar]
  28. Maximov, J.; Duncheva, G.; Anchev, A.; Dunchev, V.; Argirov, Y. Effect of Diamond Burnishing on Fatigue Behaviour of AISI 304 Chromium-Nickel Austenitic Stainless Steel. Materials 2022, 15, 4768. [Google Scholar] [CrossRef] [PubMed]
  29. Nahm, S.-H.; Shim, H.-B.; Baek, U.-B.; Suh, C.-M. Very High Cycle Fatigue Behaviors and Surface Crack Growth Mechanism of Hydrogen-Embrittled AISI 304 Stainless Steels. Mater. Sci. Appl. 2018, 09, 393–411. [Google Scholar] [CrossRef]
  30. Strzelecki, P.; Mazurkiewicz, A.; Musial, J.; Tomaszewski, T.; Slomion, M. Fatigue Life for Different Stress Concentration Factors for Stainless Steel 1.4301. Materials 2019, 12, 3677. [Google Scholar] [CrossRef] [PubMed]
  31. Schijve, J. Fatigue of Structures and Materials, 2nd ed.; Springer Science & Business Media: Berlin/Heidelberg, Germany, 2009; p. 623. [Google Scholar]
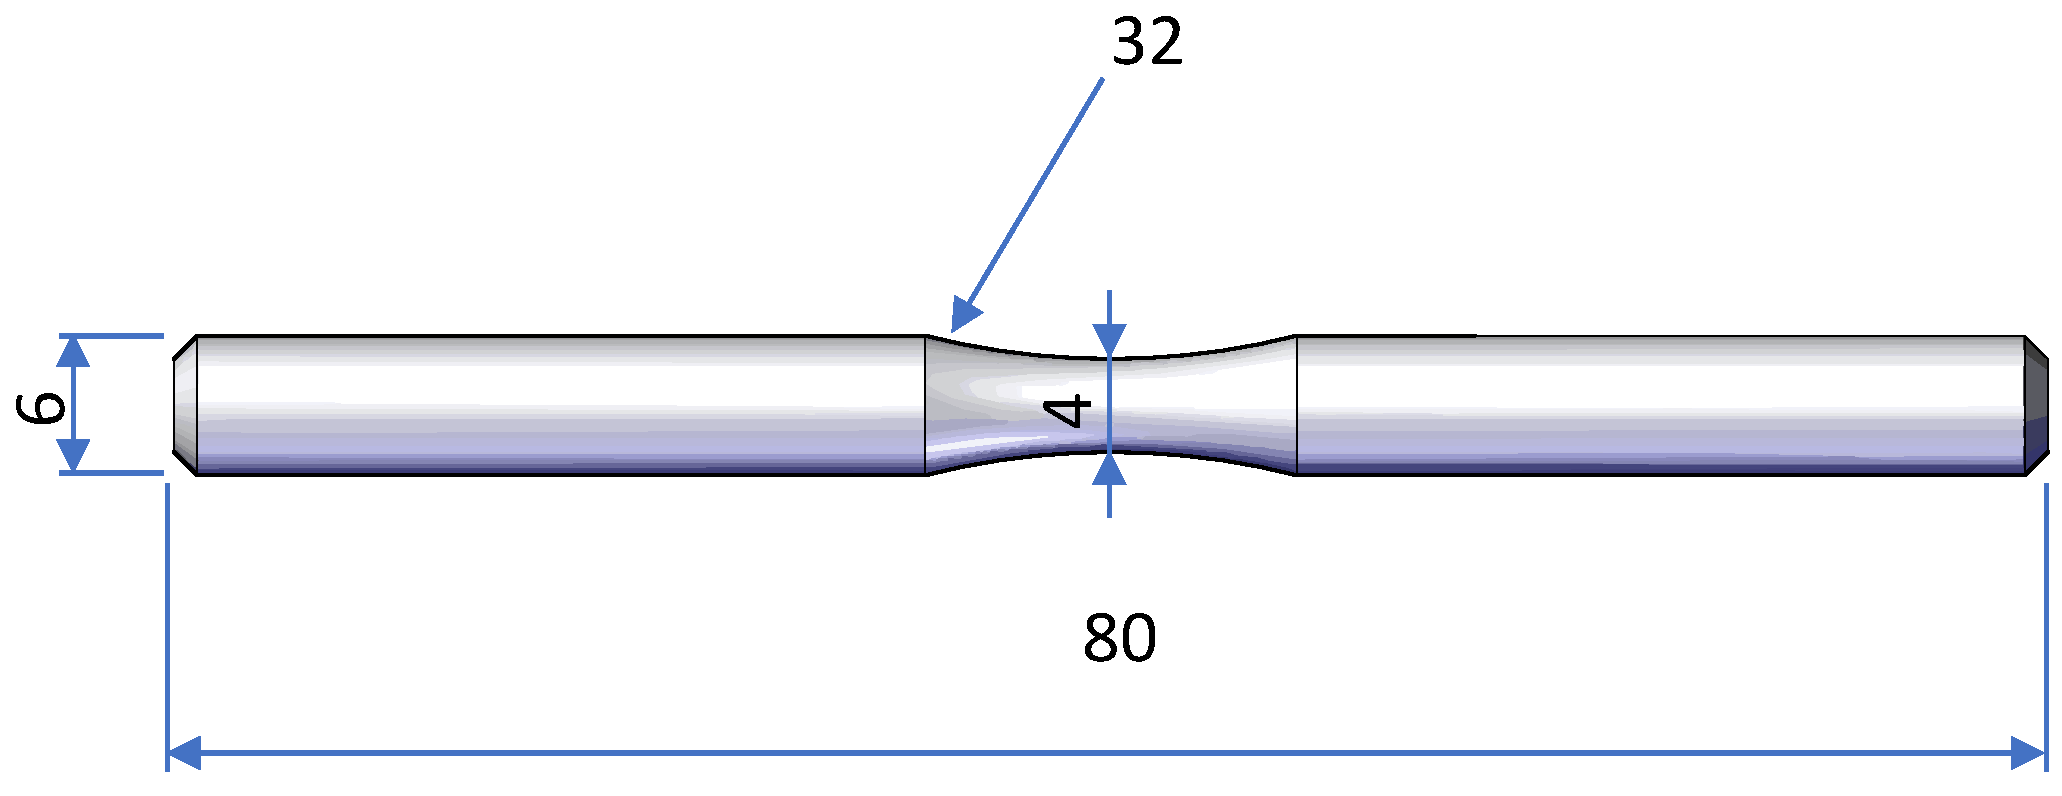
Figure 1. Specimen dimensions.
Machines 13 00665 g001
Figure 2. Schematic representation of a dual-end spindle assembly architecture.
Machines 13 00665 g002
Figure 3. Schematic diagram of the assembly of the dual-end spindle axes, the idler drive, and the main drive axes.
Machines 13 00665 g003
Figure 4. (a) Assembly details of the idler weight collet holder unit, illustrating the mechanical integration of the ER16 collet, self-aligning ball bearing, and adapter. (b) Schematic depiction of the load application setup, illustrating how standardized 5 N and 30 N precision weights are mounted on the M10 stud to apply controlled cyclic loads to the specimen during testing.
Machines 13 00665 g004
Figure 5. Schematic of the dual-end spindle architecture with two fatigue specimens and free-end idler weights inducing rotational bending loads.
Machines 13 00665 g005
Figure 6. Schematic representation of the specimen holding and load application processes on the completed machine assembly.
Machines 13 00665 g006
Figure 7. Parametric definitions for the stress calculation.
Machines 13 00665 g007
Figure 8. Systematic plan of the series of experiments.
Machines 13 00665 g008
Figure 9. Stress distribution profiles along the specimen under varying total load levels. Each curve corresponds to a distinct load configuration, illustrating the location and magnitude of the maximum bending stresses.
Machines 13 00665 g009
Figure 10. Experimental results with the 1st, 2nd, and 3rd load sets.
Machines 13 00665 g010
Figure 11. Experimental results with the 4th and 5th load sets.
Machines 13 00665 g011
Figure 12. Experimental results with the 6th and 7th load sets.
Machines 13 00665 g012
Figure 13. (a) Front panel of the fatigue test machine showing the delta VFD-M drive, inductive sensors and touchscreen HMI interface; (b) internal view of the control cabinet, illustrating the PLC, power relays, encoder interface, and sensor terminal blocks.
Machines 13 00665 g013
Figure 14. Surface roughness measurement of the specimen: (a) measurement along the longitudinal direction and (b) profilometer used for measurement.
Machines 13 00665 g014
Figure 15. Surface roughness measurements for ten specimens in the longitudinal direction, with individual values shown as columns and the overall mean indicated by the horizontal line.
Machines 13 00665 g015
Figure 16. S/N diagram derived from the experimental results obtained using smooth AISI 304 stainless steel specimens under rotating bending conditions. The plotted data include individual specimen results, mean values used to construct the S–N curve (orange line), and run-out specimens indicated by grey circles and arrows.
Machines 13 00665 g016
Figure 17. Relationship between unnotched bending fatigue strength and tensile strength [27].
Machines 13 00665 g017
Figure 18. Fatigue testing operation and schedule logic for the multi-station spindle approach.
Machines 13 00665 g018
Figure 19. Effect of the number of test stations on the theoretical total experimental duration.
Machines 13 00665 g019
Figure 20. Effect of the number of test stations on the theoretical time-saving efficiency.
Machines 13 00665 g020
Figure 21. Test duration of each specimen and the overall results of the load sets.
Machines 13 00665 g021
Figure 22. Comparison of the total test time between the testing specimens individually and in the case of multiple specimens.
Machines 13 00665 g022
Figure 23. Fracture surface image of a specimen fractured at 465.34 MPa, showing crack nucleation, propagation, and final fracture zones.
Machines 13 00665 g023
Figure 24. Some images taken from different fracture surfaces. The bright and smooth areas represent the crack propagation zones, while the darker regions indicate the sudden fracture zones.
Machines 13 00665 g024
Table 1. Chemical composition of the AISI 304 stainless steel.
C%S%Si%Mo%P%Mn%Cr%Cu%Ni%
0.0720.0110.3950.2760.0411.42117.8200.4257.946
Table 2. Mechanical properties of the AISI 304 stainless steel material.
Ultimate Tensile StrengthYield StrengthYoung’s ModulusPoison’s Ratio
734 MPa432 MPa193 GPa0.27–0.30
Table 3. Stress calculation plan for the specimen.
0     x     l H S 2
(Between Holding Point and Beginning of the Arc)
l H S 2     x     l H 2
(Between Start and Center of the Arc)
l H 2   <   x   <   l H + S 2
(Between Center and the End of the Arc)
l H + S 2     x     l H
(Between End of the Arc and Collet)
l H     x     l A
(In Idle Weight Collet)
σ = 32 × F × x π × G 3   R A r c 2 = l H 2 x 2 + y 2   R A r c 2 = x l H 2 2 + y 2 σ = 32 × F × x π × G 3 σ = 0
y =   R A r c 2 l H 2 x 2 y =   R A r c 2 x l H 2 2
d y = 2 × R A r c + D 2 × y d y = 2 × R A r c + D 2 × y
σ = 32 × F × x π × d y 3 σ = 32 × F × x π × d y 3
Table 4. Test load configurations determined through preliminary experiments.
Load Sets in ExperimentsWeight PanAdditional WeightTotal Load
117.5 N60 N77.5
217.5 N55 N72.5
317.5 N50 N67.5
417.5 N45 N62.5
517.5 N40 N57.5
617.5 N35 N52.5
717.5 N30 N47.5
817.5 N25 N42.5
Table 5. Comparison of key design and performance attributes between previous fatigue testing machines and the proposed system.
FeaturePrevious StudiesPresent Study
Test CapacityMax. 5 specimens [10]22 specimens (4.4× increase)
Drive SystemMultimotor [11,12]Centralized high-power motor
Fixture DesignDrill chuck [19] or collet holder [10]ER16 collet holder
Frame StructureWelded mild steel [19,20]Rigid laser-cut steel (8 mm)
Bearing TypeStandard ball bearings [10,13]Flanged type ball bearings (UCF 204)
Time Efficiency4× reduction [11,12]7× reduction (87.5% faster)
Load ConsistencyModerate [10]High (centralized load balancing)
AutomationLimited or none [10,19]PLC-based real-time monitoring with HMI interface
Load Application TypeDead Weight in kgPrecision Weights in N (5 N or 30 N)
Table 6. A comparative assessment of endurance-limit values from the literature and the present study was performed.
StudyEndurance Limit (MPa)This Study (MPa)Deviation of This Study from the Literature (%)Surface FinishTesting Method
Behvar et al. [25]4054213.95%TurningRotating Bending Fatigue
ASM Metals Handbook [5]413.74211.76%Not SpecifiedRotating Bending Fatigue
Maximov et al. [28]4404214.32%Turning + Polishing
Ra = 0.32 μm
Rotating Bending Fatigue
Nahm et al. [29]4004215.25%Turning + PolishingRotating Bending Fatigue
Strzelecki et al. [30]4004215.25%Turning
Ra = 1.25 μm
Rotating Bending Fatigue
Table 7. Estimated fatigue lives and test durations used for theoretical modeling of experimental time requirements.
Stress
(MPa)
Life (Approx.)Test Duration (min)# of Specimen
4213 × 10630005
4211.5 × 10615005
4656 × 10560010
5103 × 10530010
5551.5 × 10515010
60080,0008010
64050,0005010
68515,0001510
Table 8. Description of operational constraints applied in time efficiency modeling, distinguishing between human access-dependent activities and autonomous machine operation.
ParameterDescription
Working DaysMonday to Friday
Working Hours (Human Access)08:30–12:00 and 13:30–17:00
Lunch Break (No Human Access)12:00–13:30 (no specimen replacement allowed)
Weekend AccessNot allowed
Machine Operation During Off-HoursAllowed (machine continues running but no specimen replacement)
Specimen Replacement Allowed HoursOnly during working hours
Latest Replacement Time (Morning)11:55 (last mount before lunch break)
Latest Replacement Time (Afternoon)16:55 (last mount before end of day)
Specimen Replacement Duration5 min per specimen
System-Wide Interruption During ReplacementAll stations pause during specimen change; total interruption duration equals 5 min × number of replaced specimens
Deferred Replacement RuleIf replacements exceed shift time, they are postponed to the next work period
Testing Frequency1000 rpm (60,000 cycles/h)
Disclaimer/Publisher’s Note: The statements, opinions and data contained in all publications are solely those of the individual author(s) and contributor(s) and not of MDPI and/or the editor(s). MDPI and/or the editor(s) disclaim responsibility for any injury to people or property resulting from any ideas, methods, instructions or products referred to in the content.