Abstract
To enhance energy efficiency and reduce emissions in public transportation systems, this study proposes a novel electro-hydraulic energy-regenerative suspension system for urban buses. A comprehensive co-simulation framework was established to evaluate system performance. Targeting ride comfort and energy regeneration performance as dual optimization objectives, we conducted systematic parameter analysis through design-of-experiments methodology to identify critical structural parameters. To streamline multi-objective optimization processes, a particle swarm optimization–back propagation (PSO-BP) neural network surrogate model was developed to approximate the complex co-simulation system. Subsequent non-dominated sorting genetic algorithm II (NSGA-II) implementation enabled effective multi-objective optimization of key suspension parameters. Comparative simulations revealed that the optimized configuration achieves the following: (1) maintains ride comfort within human perception thresholds despite slight performance reduction, (2) enhances energy recovery efficiency, and (3) improves roll stability characteristics. These findings demonstrate the proposed system’s capability to balance passenger comfort with energy conservation and safety requirements.
1. Introduction
Research indicates that the energy consumption of suspension systems during vehicle operation accounts for approximately 10% of total fuel energy usage [1], a proportion particularly significant in long-distance coaches engaged in frequent transportation. To reduce energy consumption and enhance energy-saving performance in long-haul coaches, research on energy-regenerative suspension systems holds substantial engineering value. Traditional passive suspensions dissipate vibration energy as heat to achieve damping [2,3], an irreversible energy conversion approach that exacerbates overall energy loss. Consequently, scholars worldwide have conducted systematic studies on energy-regenerative suspension technologies, which can be categorized into three mainstream types based on structural characteristics: linear motor, mechanical, and electro-hydraulic systems.
Regarding technological evolution, Shen innovatively integrated a dual-stator hollow tubular permanent magnet synchronous linear motor with coil springs to create an electromagnetic active suspension [4]. This system combines motor and generator operation modes, achieving simultaneous improvement in dynamic response and servo characteristics through Halbach magnetization topology. The electromagnetic linear hybrid active suspension developed by Kou’s team integrates linear motors with electromagnetic valve dampers, establishing a four-mode suspension motion control strategy that enhances energy recovery rate by 42% while significantly improving ride comfort and handling stability [5]. The suspension system constitutes a critical vehicular subsystem that fundamentally governs ride comfort, handling stability, lateral dynamics performance, and passenger comfort [6]. Addressing energy storage efficiency, Wang revealed the impact mechanism of super capacitor initial voltage on linear motor-type energy-regenerative suspension performance, proposing a mode-switching-based super capacitor control method that increases energy recovery efficiency to 78.3% [7]. Yu developed a mechanical energy-regenerative suspension using a clutch-planetary gear generator architecture, with mathematical models demonstrating approximately 15% vibration energy recovery [8]. For heavy vehicles, Avadhany confirmed that electro-hydraulic feedback suspensions can yield substantial energy benefits for trucks [9]. Kowal’s experimentally validated that their electro-hydraulic active actuator energy-regenerative suspension improves damping performance by 26% compared to conventional systems [10]. Notably, Fang developed an electro-hydraulic energy-regenerative suspension prototype, achieving 200 W energy recovery under 10 Hz-3 mm excitation [11]. Sabzehgar created a rotary energy-absorbing suspension with 18% generation efficiency through innovative integration of screw mechanisms and permanent magnet synchronous motors [12].
Energy-regenerative suspension systems have attracted growing interest for their dual benefits in energy recovery and ride performance. Liu introduced an energy-harvesting hydraulic interconnected suspension (EHA-HIS), improving ride comfort while converting vibrations into electricity [13]. Building on this, Zhang proposed a compact mechanical–electrical–hydraulic system using hydraulic motor-generators (HMG) for high-power energy recovery [14]. Xiong designed a hydraulic regenerative system that converts vibrations into hydraulic energy via motors and accumulators, enhancing energy efficiency [15]. Marcelo’s dual-mode hydraulic–electromagnetic suspension achieves enhanced regenerative efficiency through electromechanical energy coupling during driving cycles [16]. Recent innovations by Pitt integrated hydraulic cylinders with linear generators, enabling hybrid energy recovery across low- and high-frequency vibrations [17]. Seungro combined hydraulic and electromagnetic technology and proposed a model of a high-efficiency energy recovery shock absorber [18]. Collectively, these works highlight the feasibility of merging energy sustainability with advanced suspension functionalities.
This paper focuses on optimizing the electro-hydraulic energy-regenerative suspension system for coaches through multidisciplinary collaborative multi-objective parameter optimization. The goal is to provide more or less the same ride comfort but to harvest at the same time the maximum possible energy. Key research contributions include the following: (1) establishing a co-simulation model of electro-hydraulic energy-regenerative suspension and full vehicle; (2) screening key parameters significantly affecting ride comfort and energy recovery characteristics through Design of Experiments (DOE); (3) developing surrogate models using PSO-BP neural networks to enhance optimization efficiency; (4) implementing multi-objective optimization via NSGA-II algorithm and determining optimal parameter combinations through entropy-weighted TOPSIS (Technique for Order Preference by Similarity to Ideal Solution); (5) validating method effectiveness by comparing ride comfort, energy recovery characteristics, and roll stability before and after optimization. Results demonstrate that optimized suspension systems achieve a 31.5% improvement in energy recovery efficiency and a 22.7% reduction in vertical acceleration, providing theoretical foundation for an energy-efficient suspension design in new energy vehicles.
2. Model of Electro-Hydraulic Energy-Regenerative Suspension System
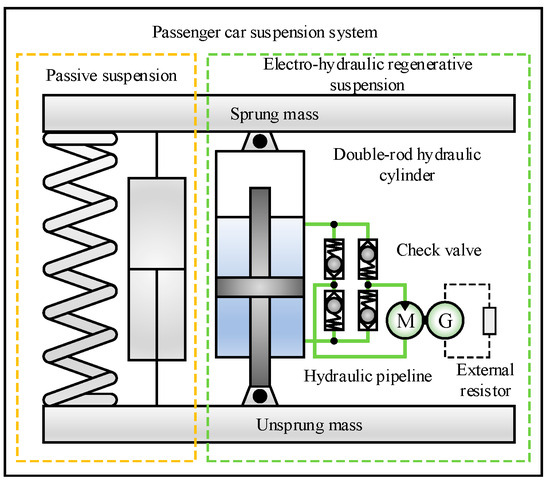
To improve durability, an electro-hydraulic energy-regenerative suspension (EHERS) with hydraulic transmission was designed for buses. As shown in Figure 1, the system integrates a double-acting cylinder, check valves, pipelines, a hydraulic motor-generator, and a load resistor in a parallel configuration. This hybrid system maintains conventional suspension functions while converting vibration energy into electricity.
Figure 1.
Structure composition of the electro-hydraulic energy-regenerative suspension.
2.1. Electro-Hydraulic Energy-Regenerative Suspension Model
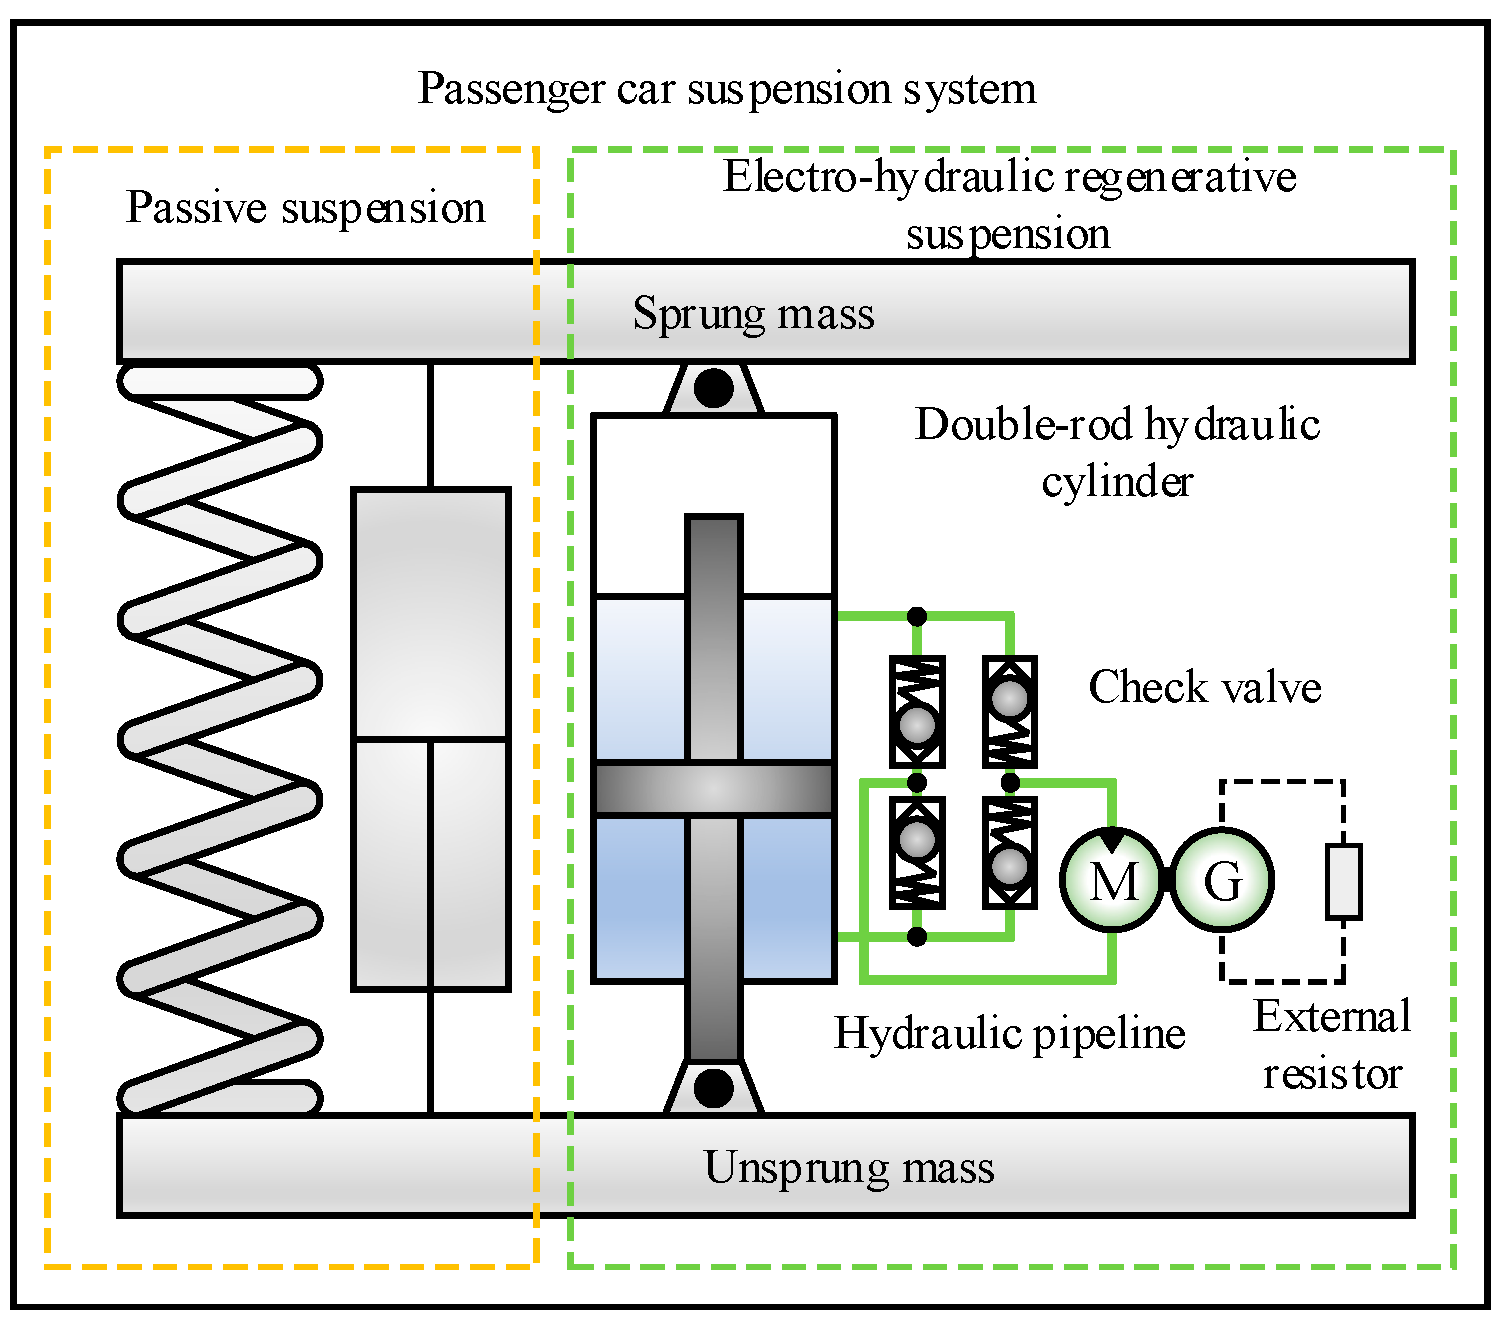
To systematically investigate the operational principles of the electro-hydraulic energy-regenerative suspension, the system is decomposed into three functional subsystems: a double-acting hydraulic cylinder actuator, a hydraulic rectification system, and an energy regeneration system, as illustrated in Figure 2.
Figure 2.
Division of electro-hydraulic energy-regenerative suspension system.
The double-rod hydraulic cylinder serves as the mechanical interface connecting the electro-hydraulic energy-regenerative suspension to the bus suspension system. The hydraulic rectification system, configured in a four-check-valve bridge topology (Figure 2), rectifies bidirectional oil flow from the hydraulic cylinder into unidirectional flow to ensure consistent hydraulic motor rotation. The energy regeneration system integrates a hydraulic motor, generator, and external resistor, with the motor output shaft rigidly coupled to the generator input shaft. Oil flow drives the hydraulic motor, which subsequently rotates the generator for electricity production.
The EHERS operates through three-stage energy conversion: (1) suspension vibration drives piston reciprocation in the hydraulic cylinder, inducing alternating pumping/suction of hydraulic fluid between upper/lower chambers; (2) bidirectional fluid flow is rectified into unidirectional motion via the hydraulic regulation system; (3) continuous electromechanical energy conversion is achieved through motor-generator actuation. This process effectively reduces energy consumption in vehicular powertrain systems.
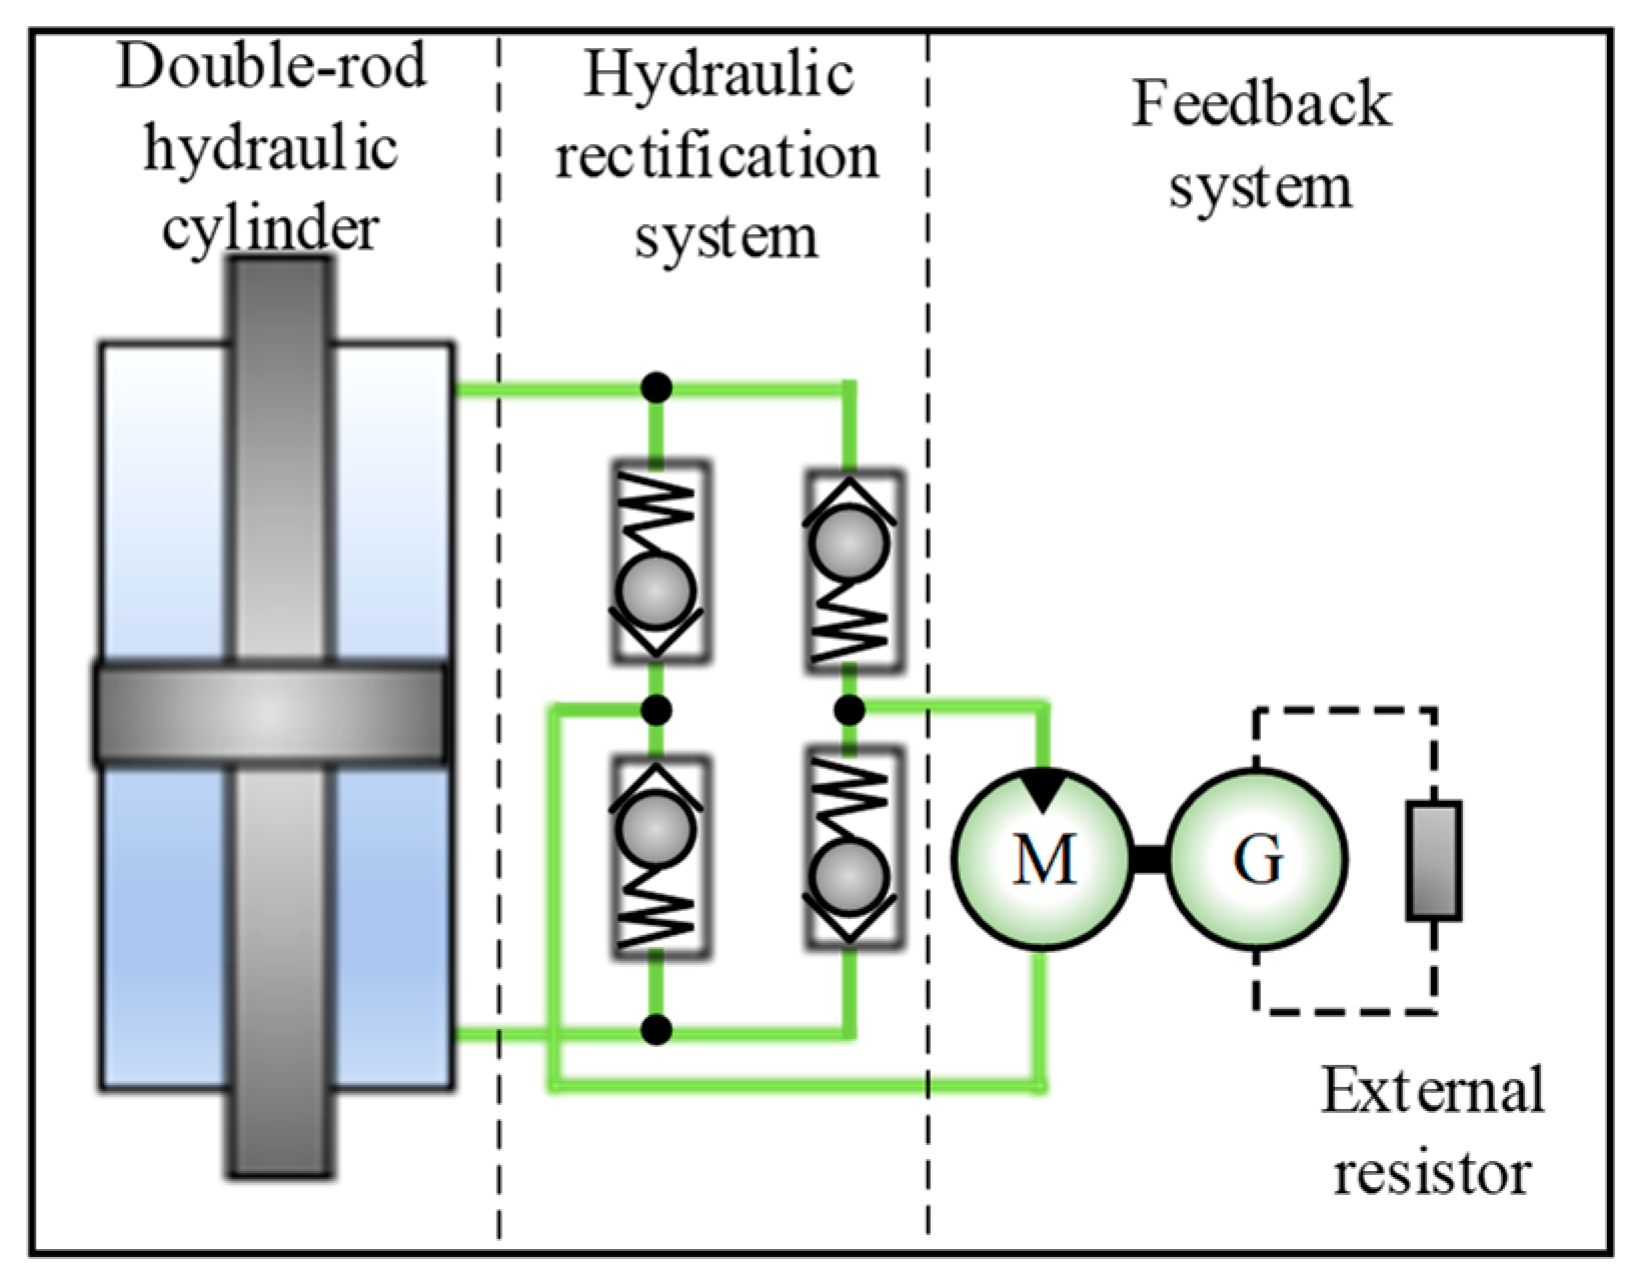
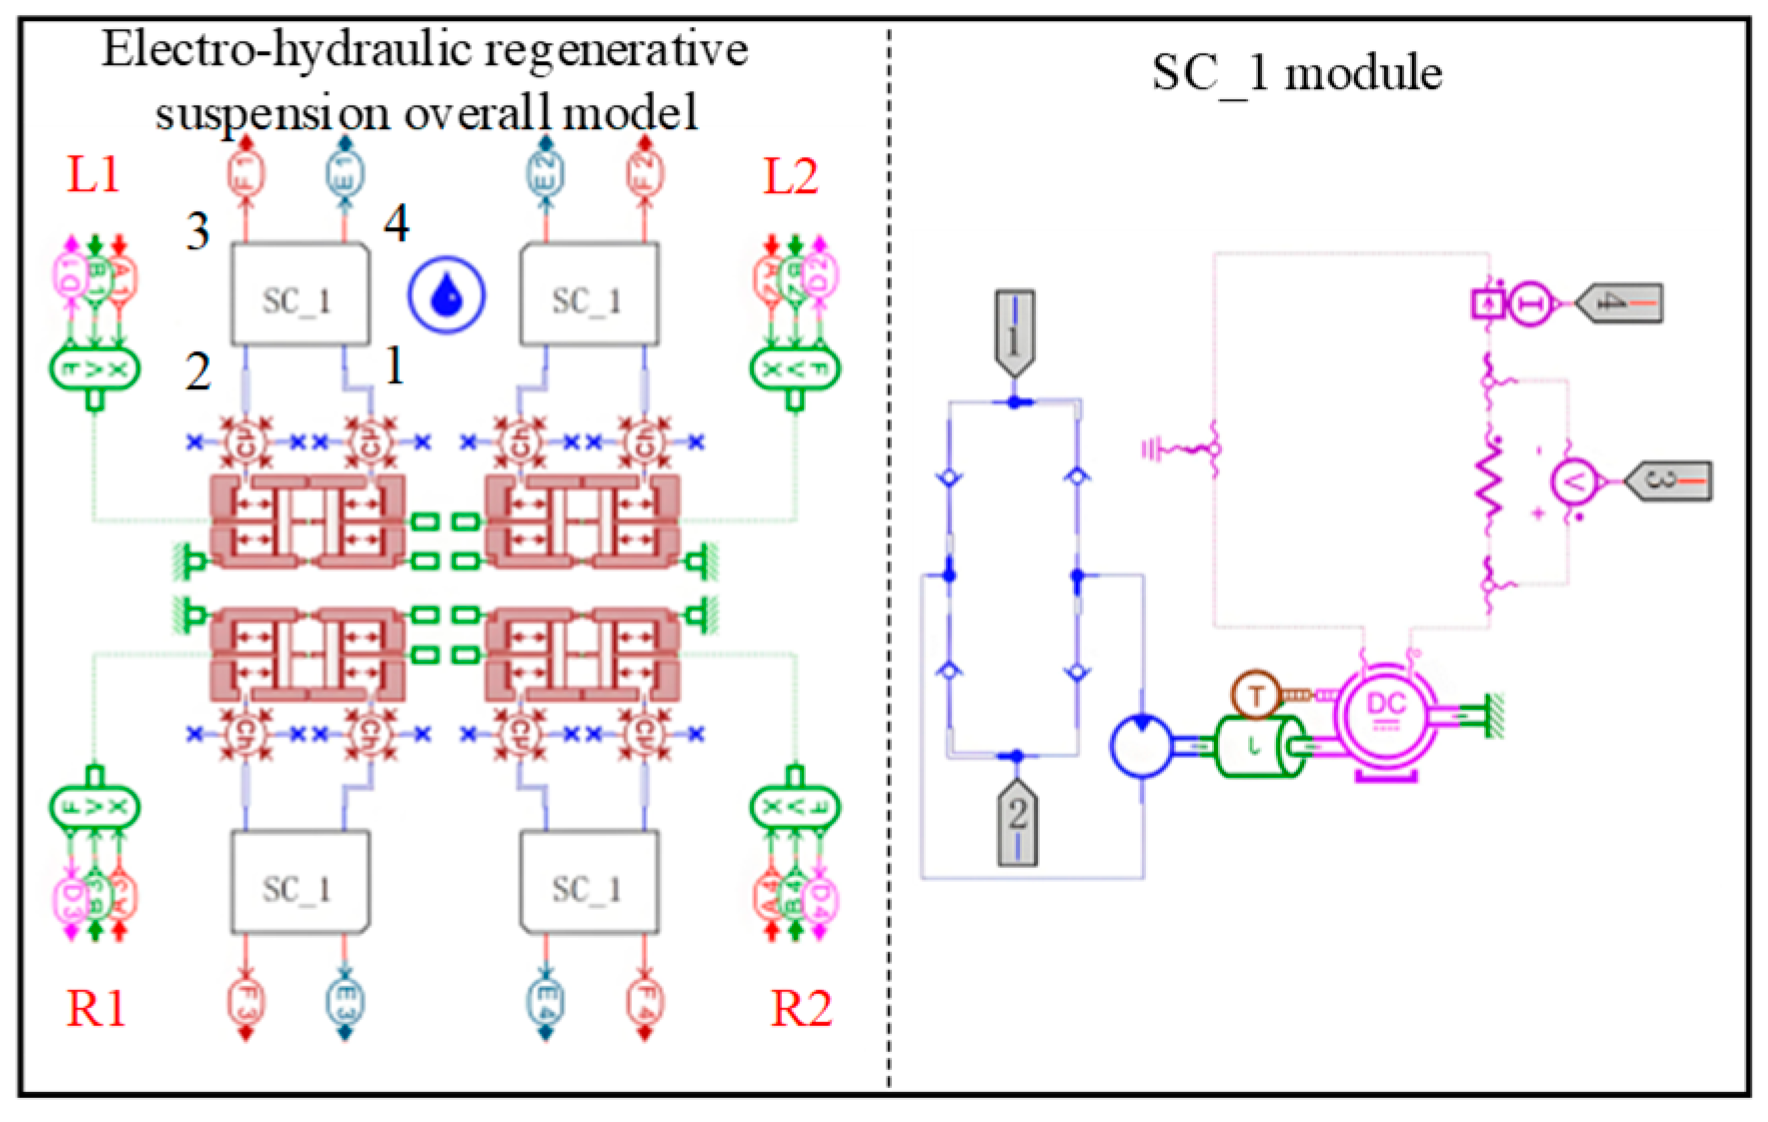
An EHERS simulation model was established using AMESim 2019, as shown in Figure 3, enabling co-simulation analysis with full vehicle dynamics.
Figure 3.
AMESim simulation model of the electro-hydraulic energy-regenerative suspension.
As illustrated in Figure 3, the nomenclature L1, L2, R1, and R2 in the system model corresponds to the left-front, left-rear, right-front, and right-rear electro-hydraulic energy-regenerative suspension units of the bus, respectively. The functional descriptions of these interfaces are specified as follows: Port clusters A1–A4 and B1–B4 receive displacement and velocity input signals from their respective suspension positions. Output interfaces D1–D4 transmit actuator forces from each suspension unit to the full vehicle model, while E1–E4 and F1–F4 represent current and voltage output ports for the four suspension units, respectively.
Table 1 enumerates the principal initial parameters of the AMESim simulation model for the EHERS. For parameters not explicitly listed in the table, the default parameters predefined in the AMESim component library are adopted.
Table 1.
Initial parameters of the electro-hydraulic energy-regenerative suspension.
2.2. Bus Model
Parametric modeling of a passenger bus was performed using the Trucksim 2019 software, and the Tour Bus model in the software was selected.
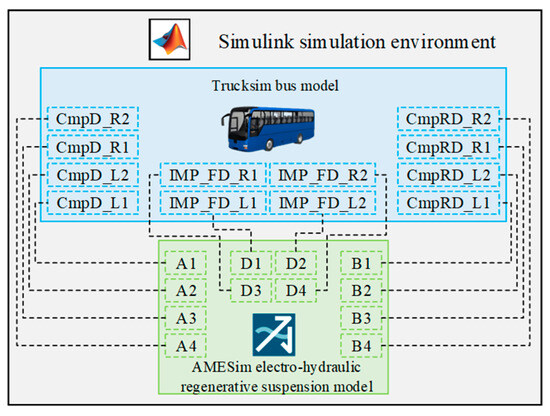
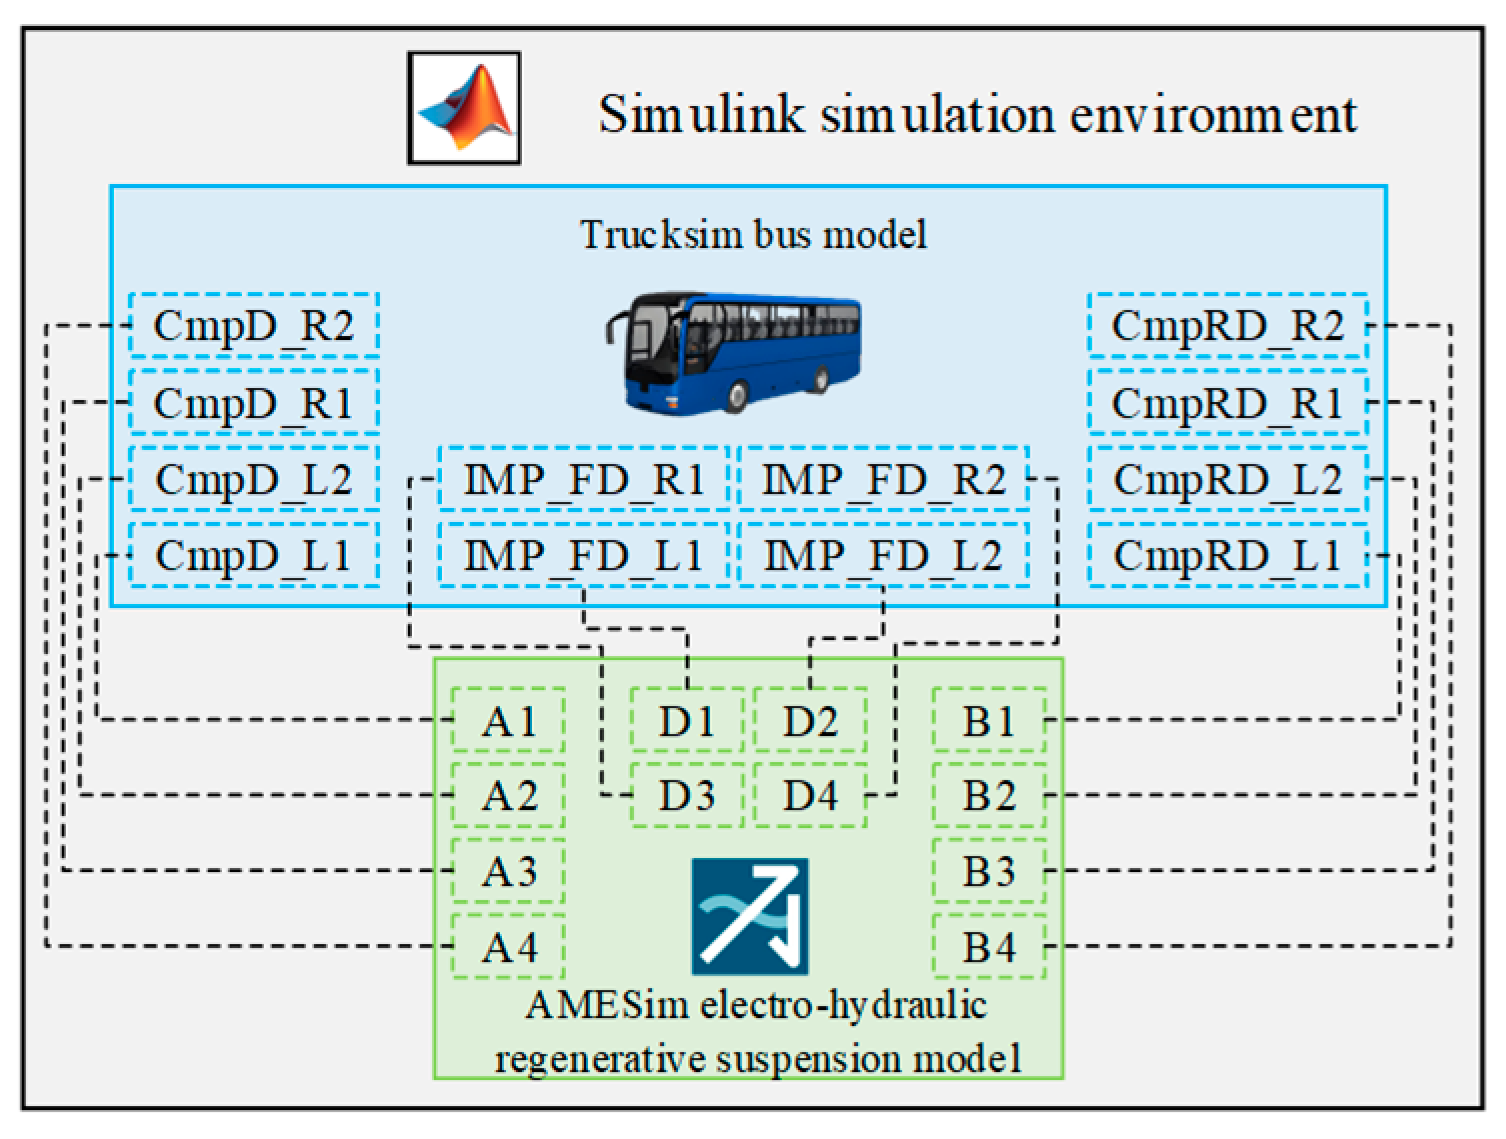
The multidisciplinary co-simulation system was established through integration of the Trucksim vehicle dynamics model and AMESim model within the Simulink environment, as illustrated in Figure 4.
Figure 4.
Joint simulation system of the electro-hydraulic energy-regenerative suspension bus.
This platform enables bidirectional real-time interaction between mechanical kinematic parameters and hydraulic system states through the following interface protocol:
- (1)
- Displacement interface: the CmpD_L1/L2/R1/R2 ports of the Trucksim model transmit suspension displacement parameters for left-front, left-rear, right-front, and right-rear wheels, respectively, which are received via A1~A4 ports in the AMESim subsystem.
- (2)
- Velocity interface: suspension velocity parameters are communicated through CmpRD_L1/L2/R1/R2 ports, establishing dynamic coupling with hydraulic actuators via B1~B4 ports.
- (3)
- Force feedback interface: dynamic damping forces generated by the EHERS system are transmitted through D1~D4 ports to the IMP_FD_L1/L2/R1/R2 interface, forming closed-loop force feedback control.
3. DOE Analysis of Structural Parameters of Electro-Hydraulic Energy-Regenerative Suspension
3.1. Four-Wheel Road Excitation Modeling for Buses
To accurately characterize actual bus driving conditions, a four-wheel road roughness input model under ISO 8608 [19] Class B pavement was developed using filtered white-noise theory.
The road power spectral density is formulated as follows:
where denotes the road roughness coefficient (m3/cycle); represents spatial frequency (cycle/m); is the reference spatial frequency (cycle/m); and is the spectral exponent.
The time-domain road roughness model derived from white-noise excitation is expressed as follows:
where is the space cut-off frequency; is the speed of vehicle; and takes the value 64.
The rear-wheel road excitation exhibits temporal delay characteristics, with delay duration expressed as follows:
Bilateral road roughness inputs are generated by independent unit white-noise excitation sources and , whose dynamic responses are modeled through a dual-input linear time-invariant system. By introducing state vector , the input–output relationship is fully characterized by the state-space equations presented in the following:
In Formulas (9) and (10), the matrices , , , and can be expressed as follows:
The coefficients in each matrix are as follows:
can be expressed as follows:
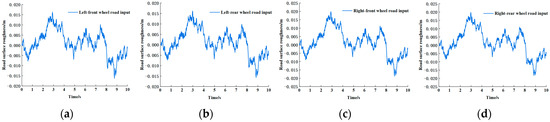
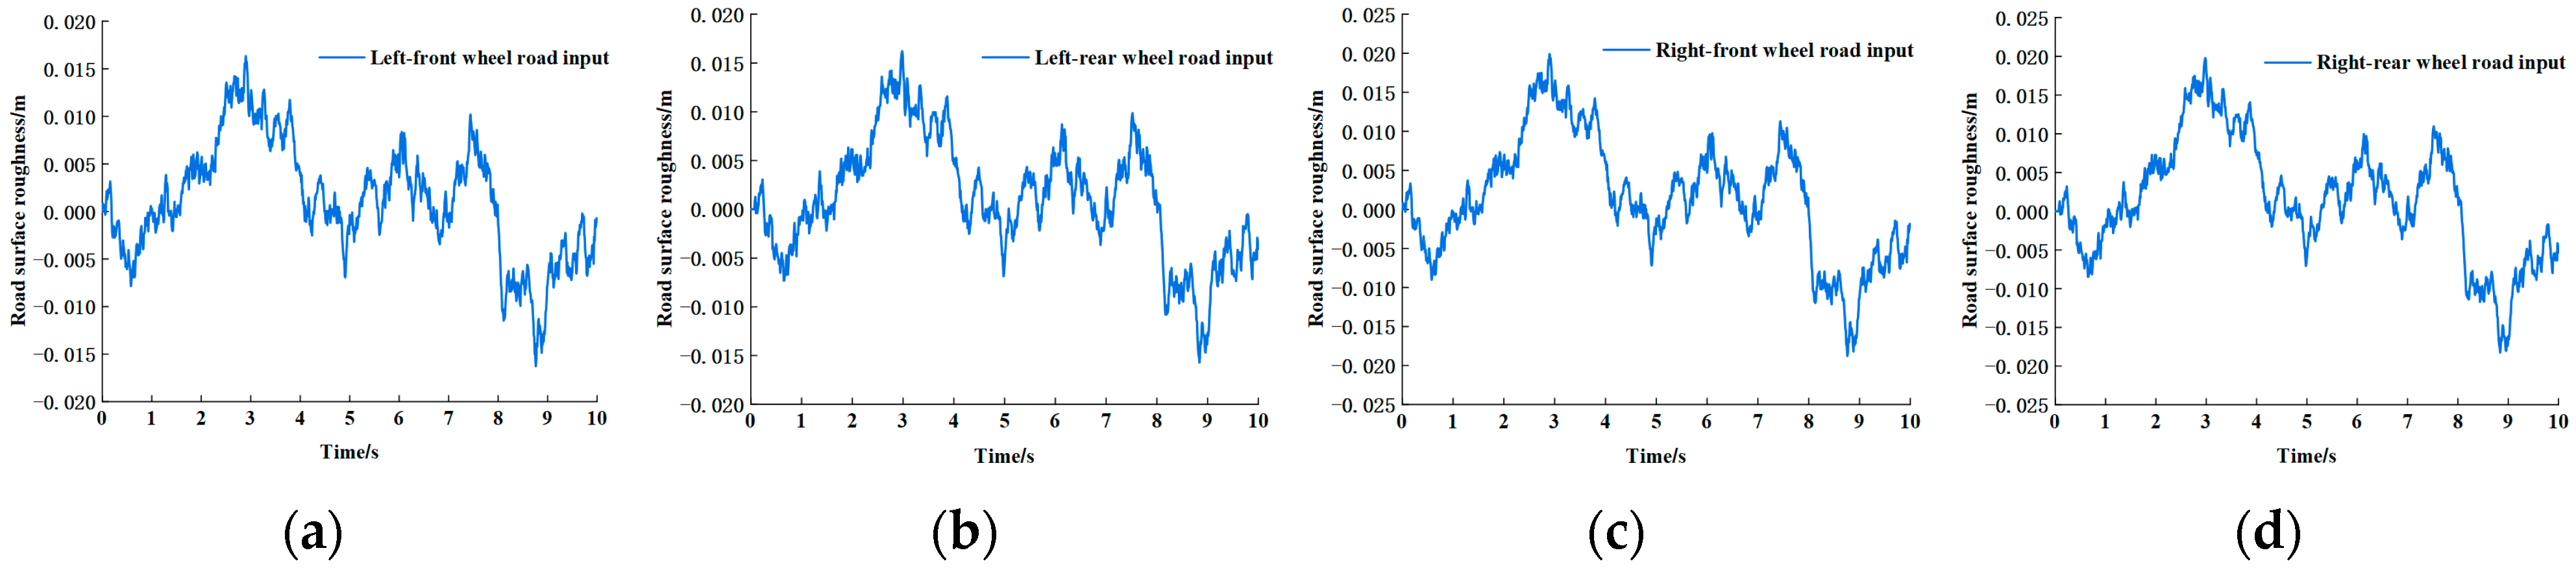
The four-wheel road excitation profile for the bus was synthesized based on the theoretical framework and is illustrated in Figure 5.
Figure 5.
Road input to urban bus wheels: (a) left-front wheel; (b) left-rear wheel; (c) right-front wheel; and (d) right-rear wheel.
3.2. Evaluation Metrics Analysis
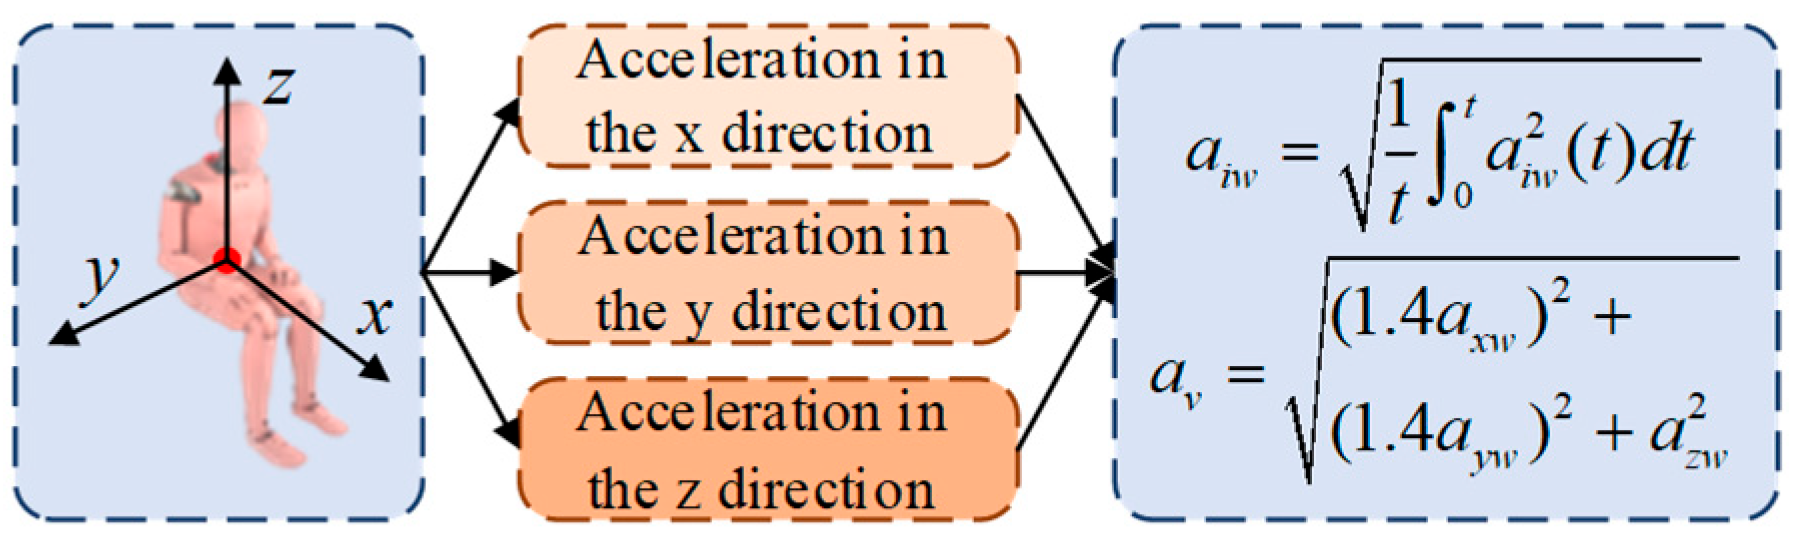
To establish a multi-objective optimization benchmark for the electro-hydraulic suspension system, a systematic evaluation framework incorporating ride comfort and energy recovery characteristics was developed. As illustrated in Figure 6, the ISO 2631-1:1997 [20]-compliant weighted root mean square (RMS) acceleration in triaxial directions serves as the ride comfort metric:
Figure 6.
Evaluation index of passenger car ride comfort.
In accordance with human vibration perception characteristics, lateral accelerations (x and y axes) are weighted by 1.4, while vertical acceleration (z axis) was weighted by 1.0. The discomfort threshold is defined at 0.315 m/s2 for weighted RMS acceleration.
Energy recovery performance is quantified through the RMS value of average regenerative power (ENG) from four suspension units:
In this formulation, represents the total regenerative power output, and , , , and correspond to the instantaneous current outputs from the left-front, left-rear, right-front, and right-rear regenerative suspensions, respectively. This metric effectively characterizes the dynamic response characteristics and energy conversion efficiency of the regenerative system.
3.3. DOE Analysis and Result Discussion
DOE constitutes a statistical methodology for analyzing experimental data through systematic test design. Its primary objective is to derive scientific conclusions by optimizing experimental planning to reduce test scale, duration, and cost [21]. To streamline the DOE analysis workflow, the Isight software 2022 was employed to investigate structural parameters of the electro-hydraulic energy-regenerative suspension, including the piston diameter of the hydraulic cylinder , the piston rod diameter of the hydraulic cylinder , the load resistance of the energy-regenerative circuit , the displacement of the hydraulic motor , and the moment of inertia of the generator rotor .
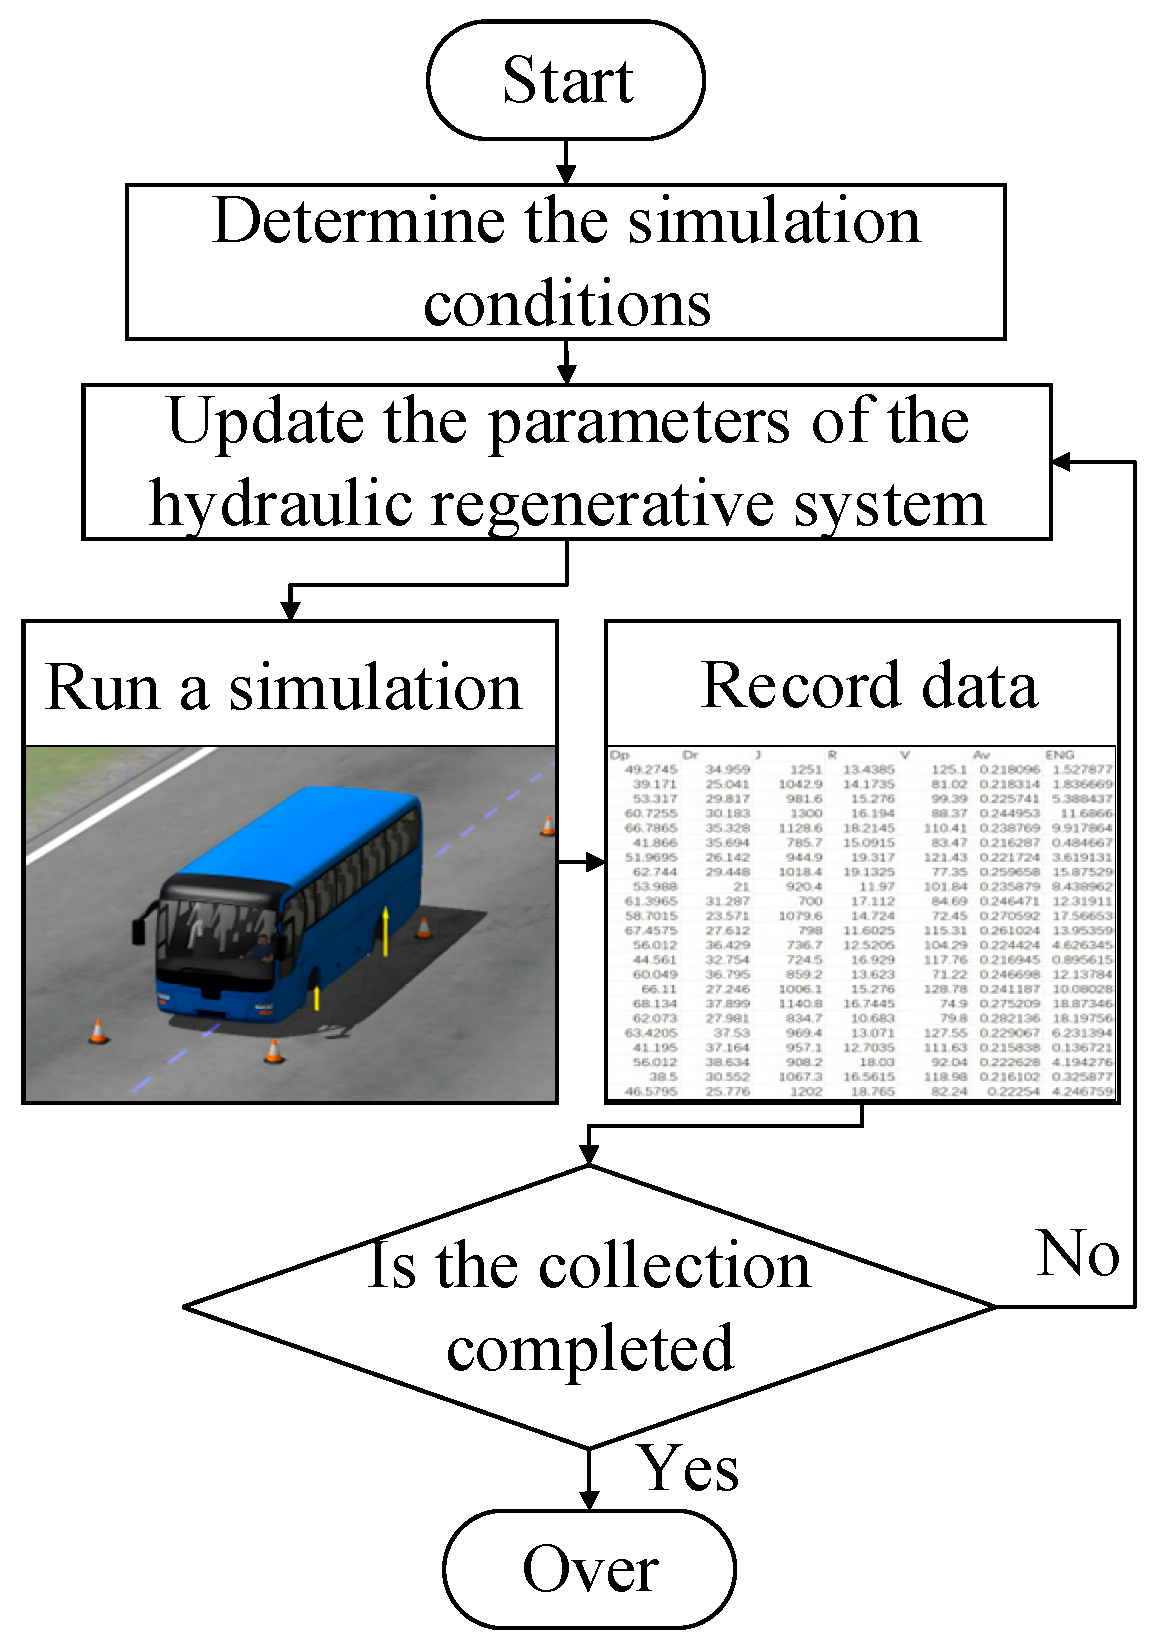
Parameter variation ranges were defined as ±30% of initial values. Using optimal Latin hypercube sampling, 50 data points were extracted within each parameter’s range as sampling nodes [22]. These nodes were subsequently implemented in the co-simulation platform, with road tests on Class B pavement at 70 km/h serving as simulation conditions. The sample data acquisition process is detailed in Figure 7.
Figure 7.
Data collection process of DOE analysis sample.
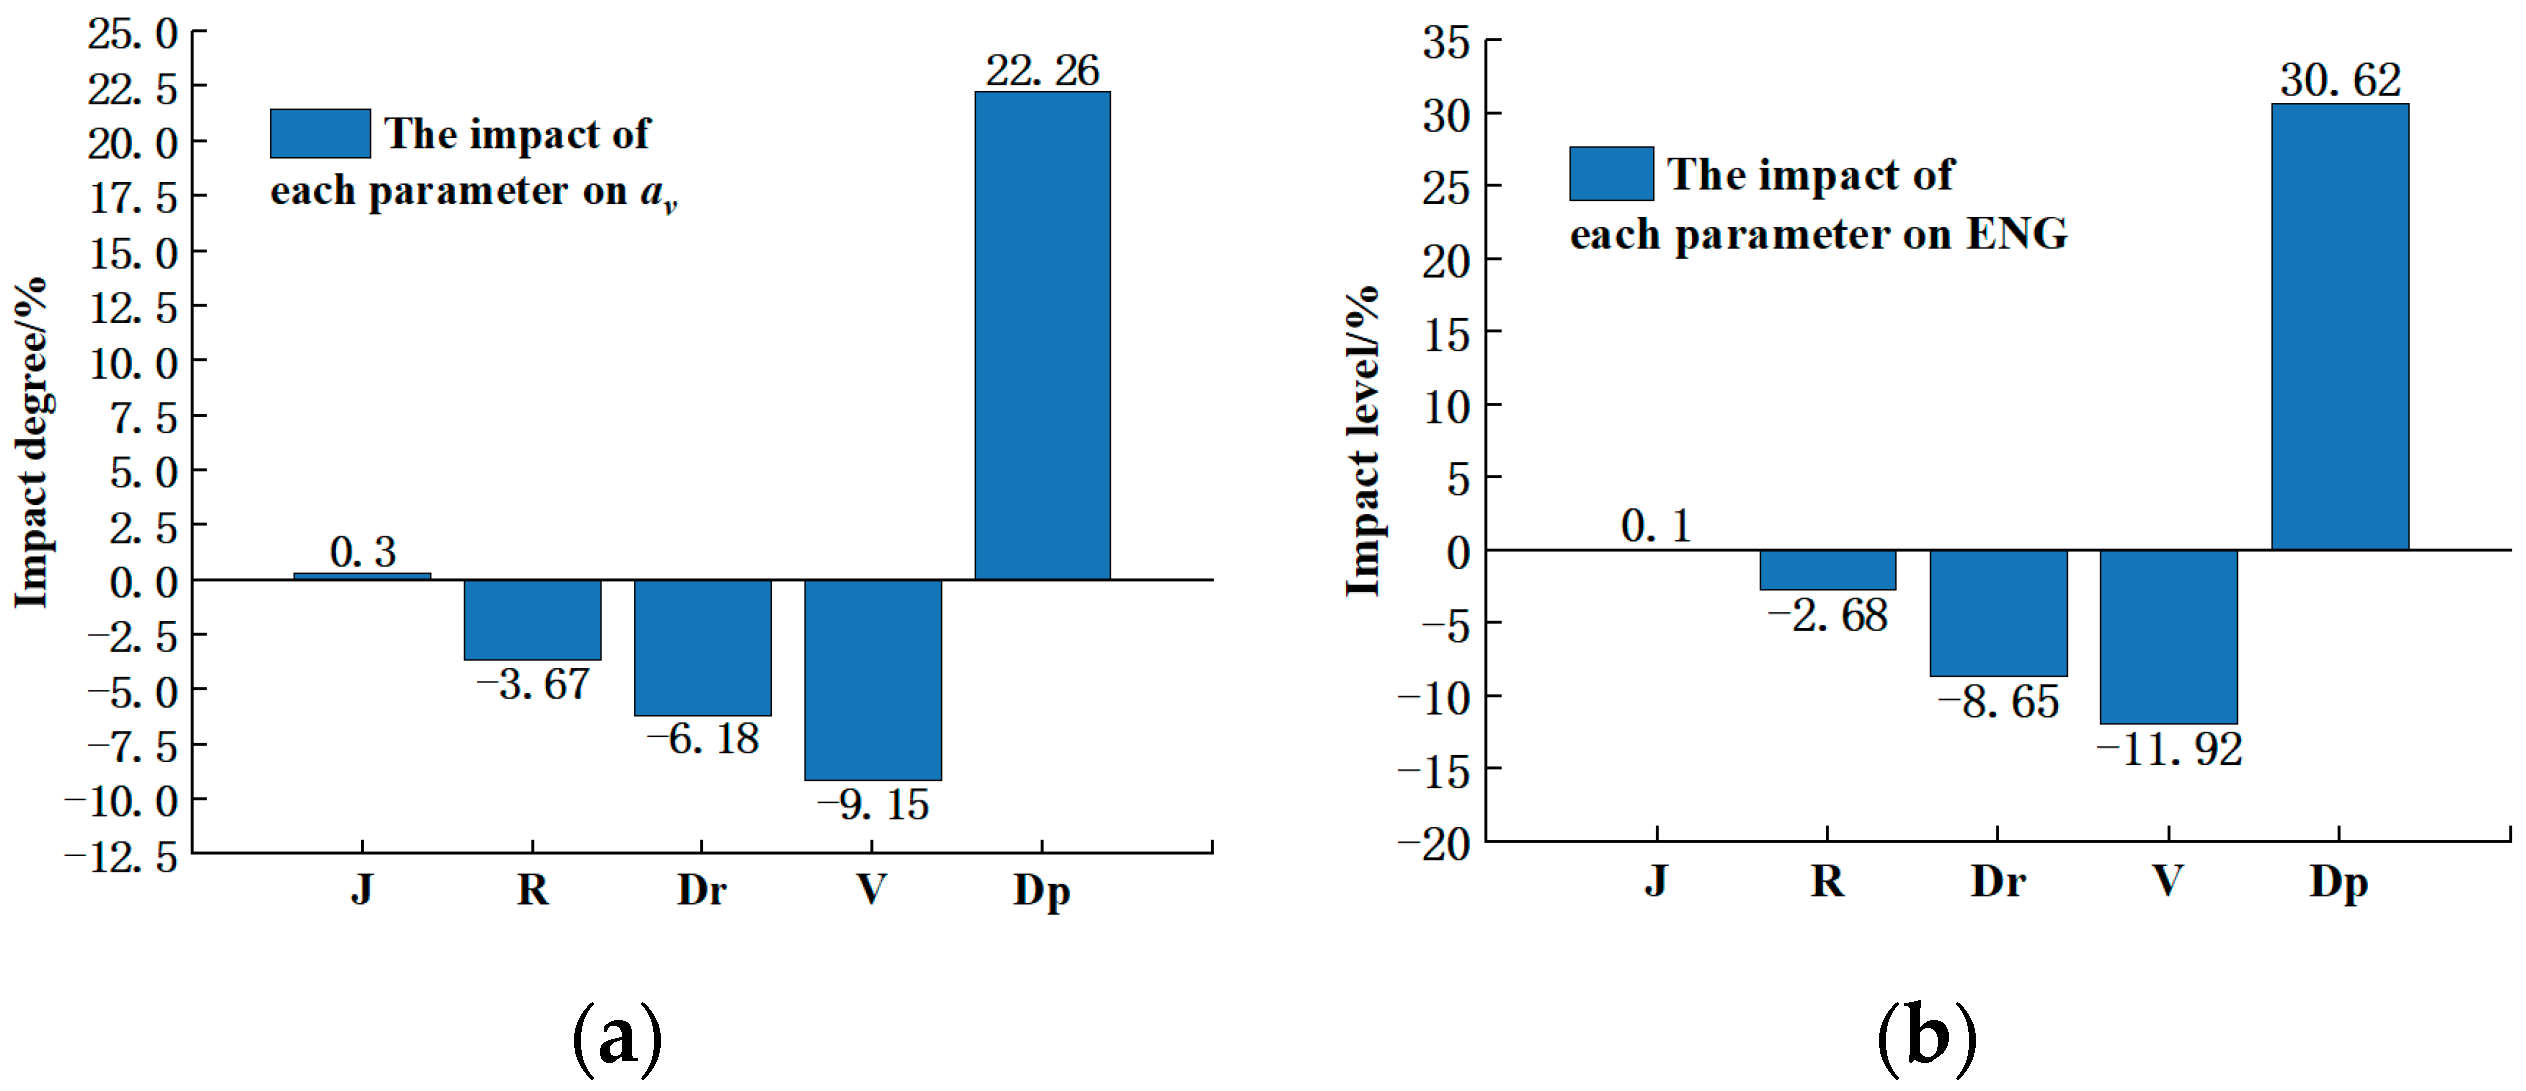
The sample data after collection were imported into the Isight software for DOE analysis, and the analysis results were shown in Figure 8.
Figure 8.
DOE analysis results: (a) ay; (b) ENG.
It can be seen from Figure 8a that and have positive effects on , while , , and have negative effects on . Parameter exerts the most significant influence on (22.26%), followed by (9.15%), with showing minimal impact (0.3%). Figure 8b reveals that parameters and positively influence ENG, while , , and impose inhibitory effects. Parameter accounts for 30.62% of ENG variation, contributes 11.92%, and exhibits negligible impact (0.1%).
Comprehensive analysis confirms that does not significantly affect either ride comfort or energy recovery characteristics, thus retaining its initial value during multi-objective optimization. The critical structural parameters for optimization are consequently identified as follows: hydraulic cylinder bore diameter, piston rod diameter, load resistance, and motor displacement.
4. Multi-Objective Optimization of Structural Parameters
4.1. PSO-BP Surrogate Model
To enhance computational efficiency in multi-objective optimization, a PSO-BP neural network-based surrogate model was developed. This model establishes mathematical relationships for the electro-hydraulic energy-regenerative suspension co-simulation system through particle swarm optimization-trained back propagation neural networks.
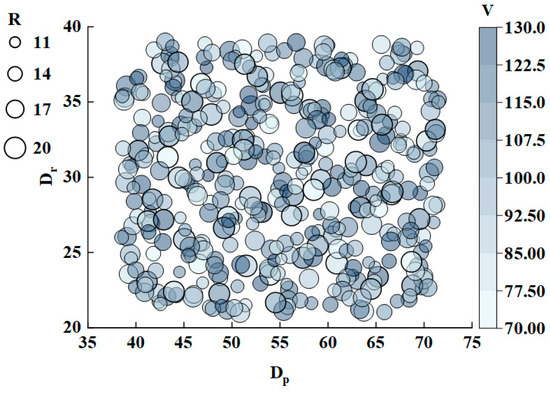
The same as in the analysis of parameter DOE, 400 sets of data were selected as sampling nodes within the value range of each parameter by using the optimal Latin hypercube sampling method, taking plus or minus 30% of the initial value of , , , and as the value range. The distribution of sampling nodes is shown in Figure 9.
Figure 9.
Distribution of sampling nodes of the proxy model.
Consistent with DOE parameter selection, key parameters including , , , , and were varied within ±30% of initial values. Optimal Latin hypercube sampling generated 400 training datasets within this parameter space, with distribution characteristics illustrated in Figure 9.
Following sampling node acquisition, 400 co-simulations were conducted under ISO 8608 B-class road conditions at 70 km/h to generate the surrogate model training dataset. The dataset was randomized and stratified into 80% training and 20% validation subsets for PSO-BP neural network development. Post-training convergence analysis of the particle swarm optimization fitness values is presented in Figure 10.
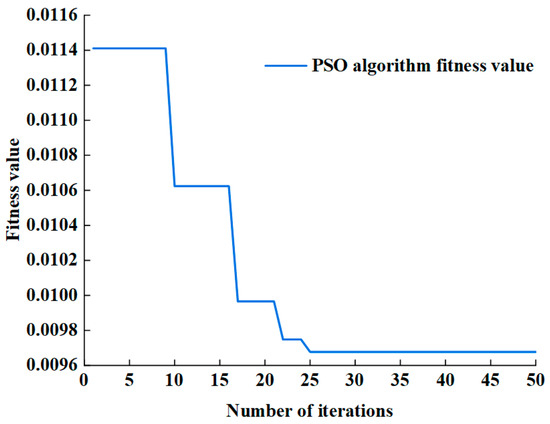
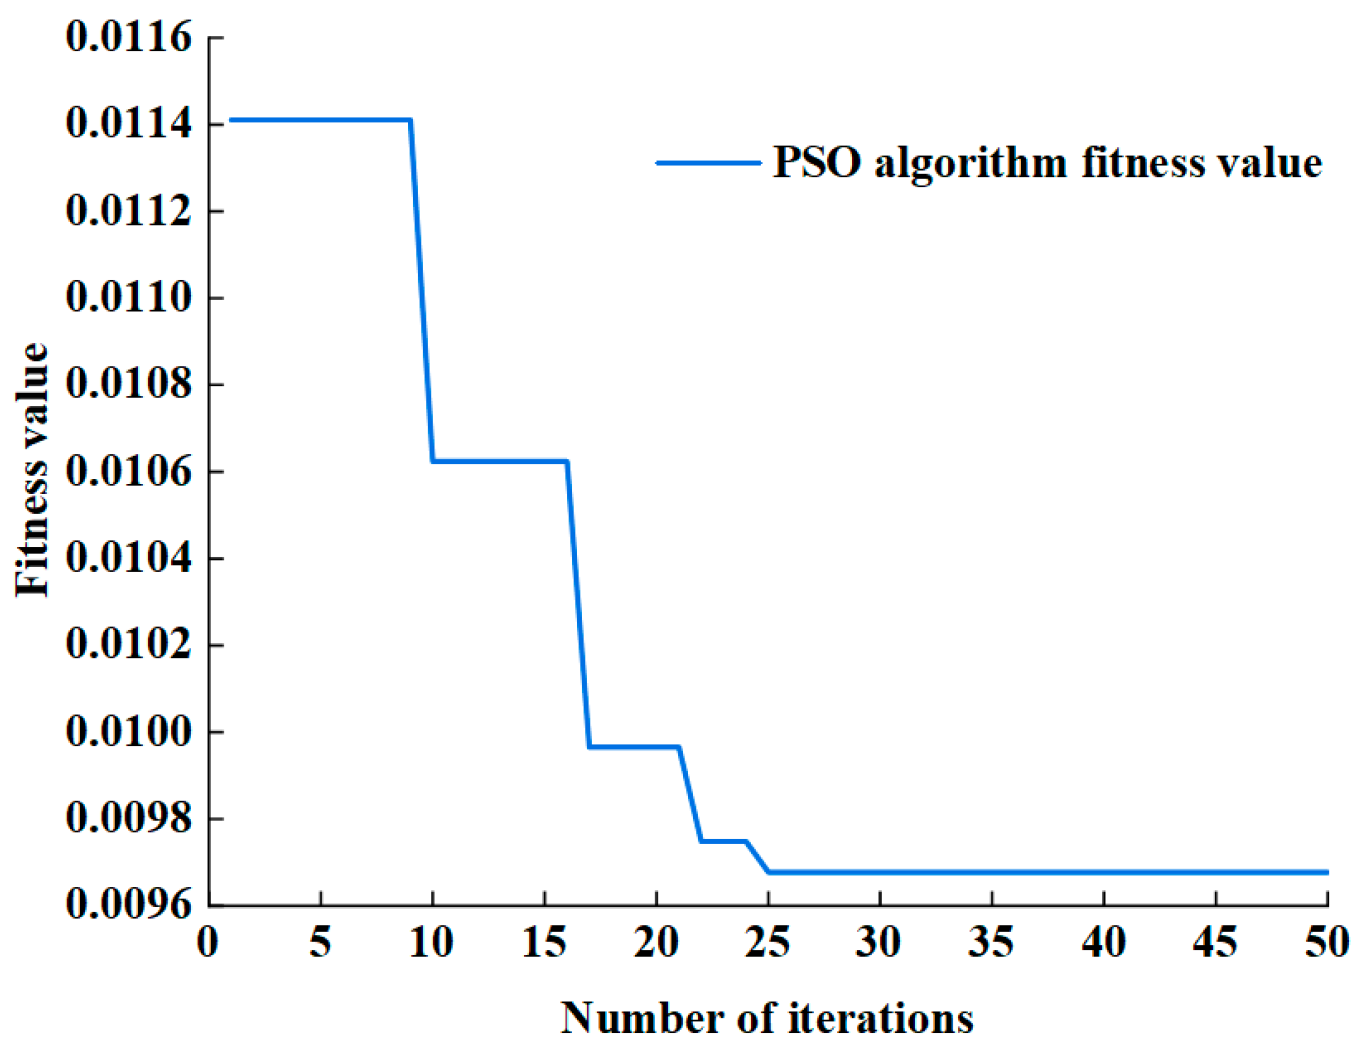
Figure 10.
Changes of fitness value.
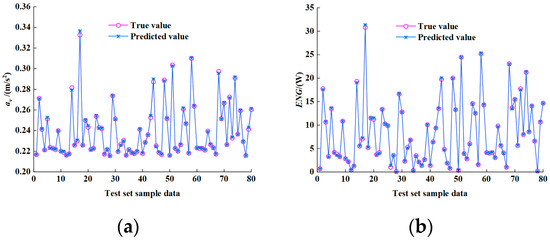
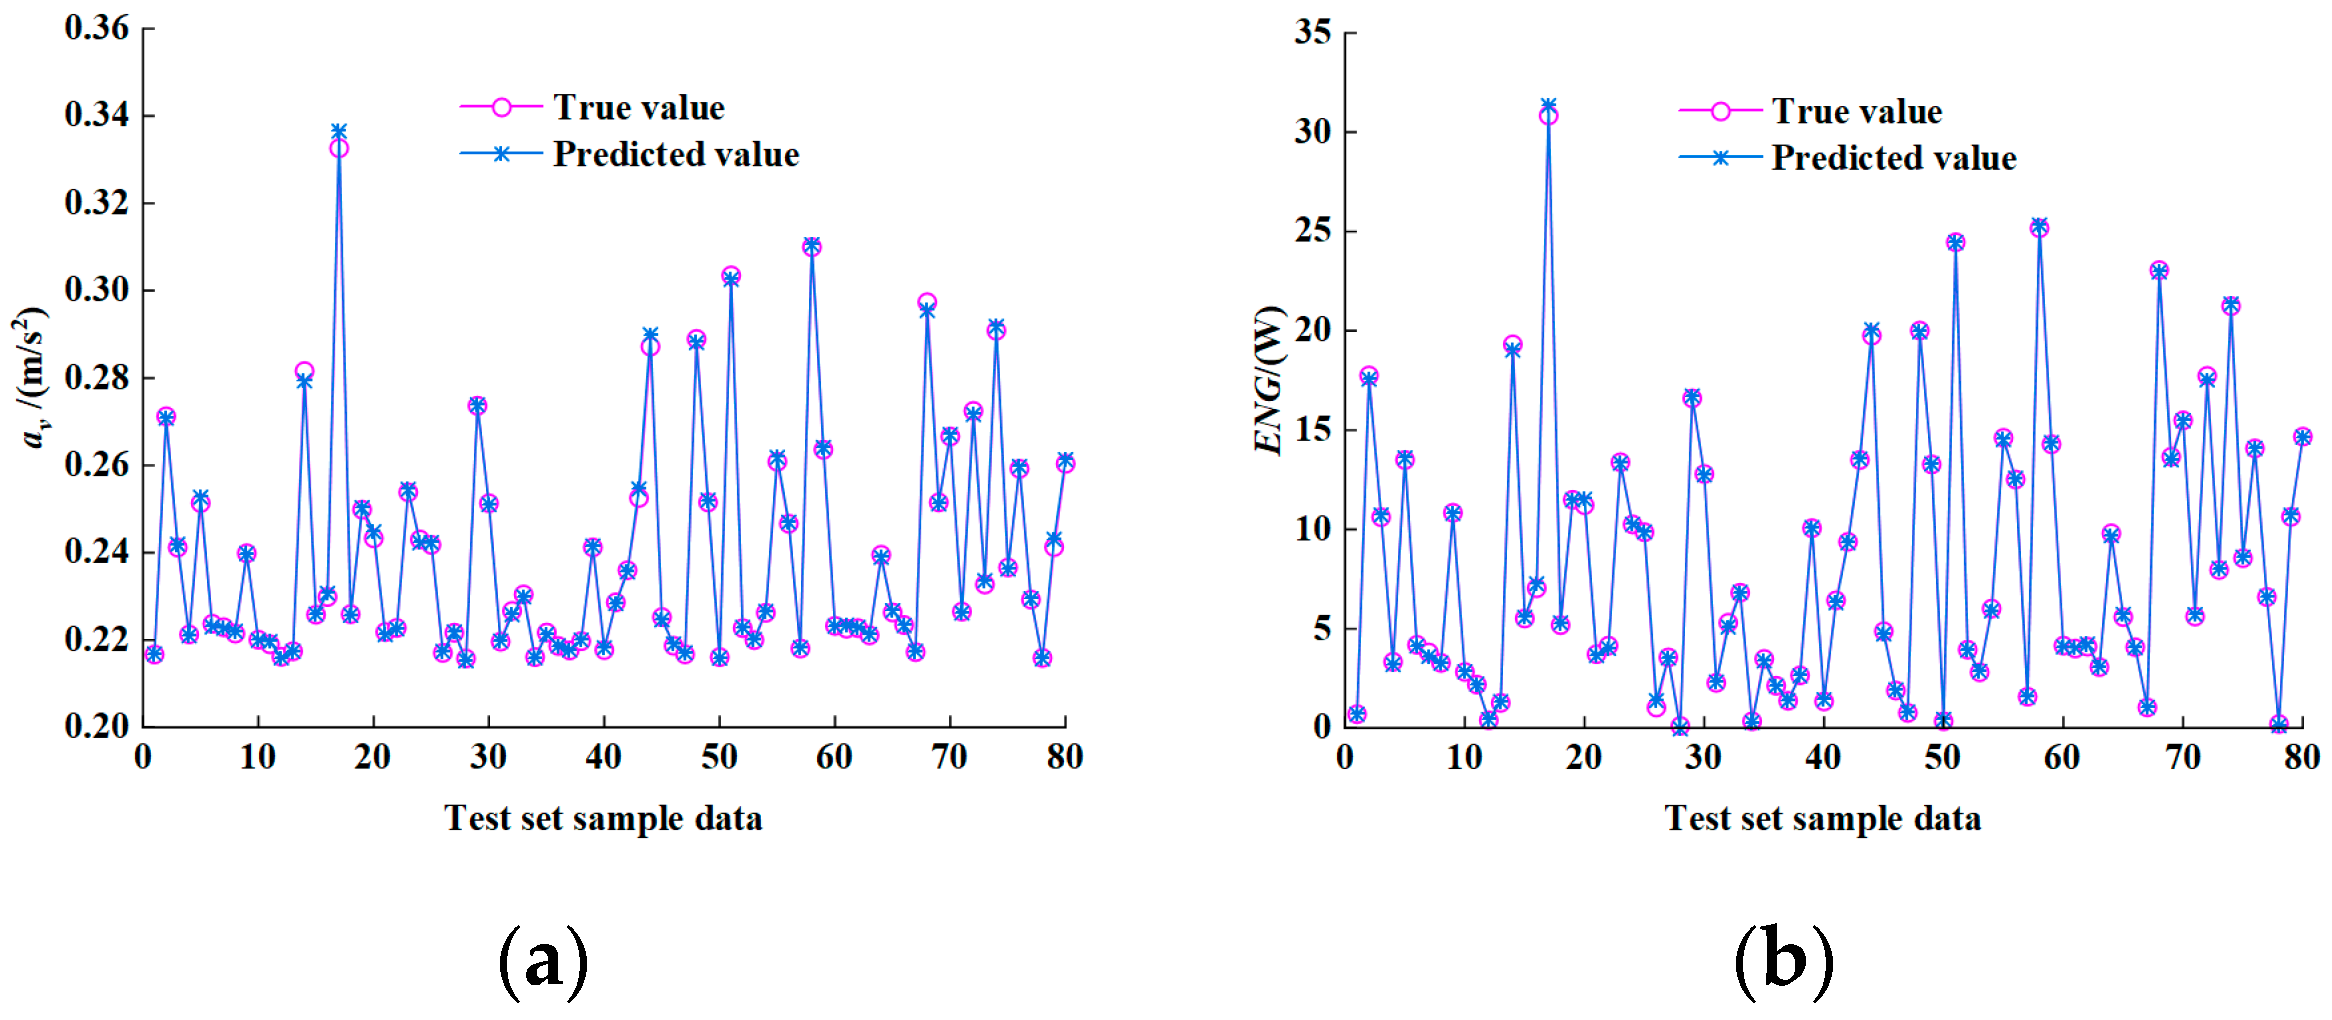
As demonstrated in Figure 10, the particle swarm optimization algorithm achieves convergence after 50 iterations, with the fitness value stabilizing at the global minimum of 0.00968. This convergence confirms successful identification of the neural network’s optimal weights and thresholds. The prediction performance of the PSO-BP neural network on the test sets for and ENG is visualized in Figure 11.
Figure 11.
Prediction results of PSO-BP neural network: (a) ay; (b) ENG.
The predictive accuracy of the surrogate model was quantitatively evaluated through three metrics: maximum absolute relative error (), coefficient of determination (), and root mean square error (RMSE), as mathematically defined:
Here, denotes sample size, and and represent actual and predicted values of the i-th sample, respectively, with being the arithmetic mean of all actual values. Accuracy metrics calculated from Figure 11 prediction results are tabulated in Table 2 for both and ENG.
Table 2.
and ENG accuracy index.
Key observations from Table 2 include the following: (1) values below 3.2% for both and ENG indicate acceptable local prediction errors; (2) values exceeding 0.95 combined with low RMSE values demonstrate global prediction accuracy meeting engineering requirements. These metrics collectively validate the reliability of the PSO-BP surrogate model for multi-objective optimization of the electro-hydraulic energy-regenerative suspension.
4.2. NSGA-II Multi-Objective Optimization
A multi-objective optimization framework was established using the NSGA-II algorithm based on the PSO-BP surrogate model. The objective functions are formulated as follows: . Where denotes and represents the energy recovery efficiency ENG. And the minimum values of and the maximum values of are required to be taken during multi-objective optimization, as shown below:
The constraint system integrates performance requirements and parametric boundaries:
The constraint conditions limit the function value of to not exceed 0.315 , that is, to ensure that the root mean square value of the weighted acceleration of passengers in the three directions of x, y, and z is within the perceptual thresholds of the human body, and also to limit the function value of to be greater than 6.236 W, that is, the guaranteed function value of should be greater than the ENG value under the initial parameters of the electro-hydraulic energy-regenerative suspension. At the same time, the constraint conditions also limit the value range of parameters to be optimized by the initial value of the electro-hydraulic energy-regenerative suspension structure parameters.
Constraint ensures triaxial weighted RMS acceleration remains below the human perception threshold of 0.315 m/s2, while mandates that the energy recovery power exceeds the initial parameter value of 6.236 W. For the parametric bounds, the value ranges are set at ±30% of initial values.
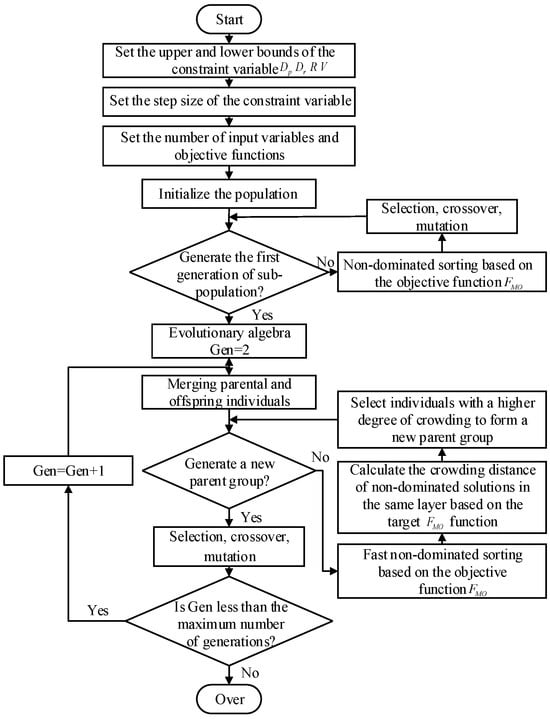
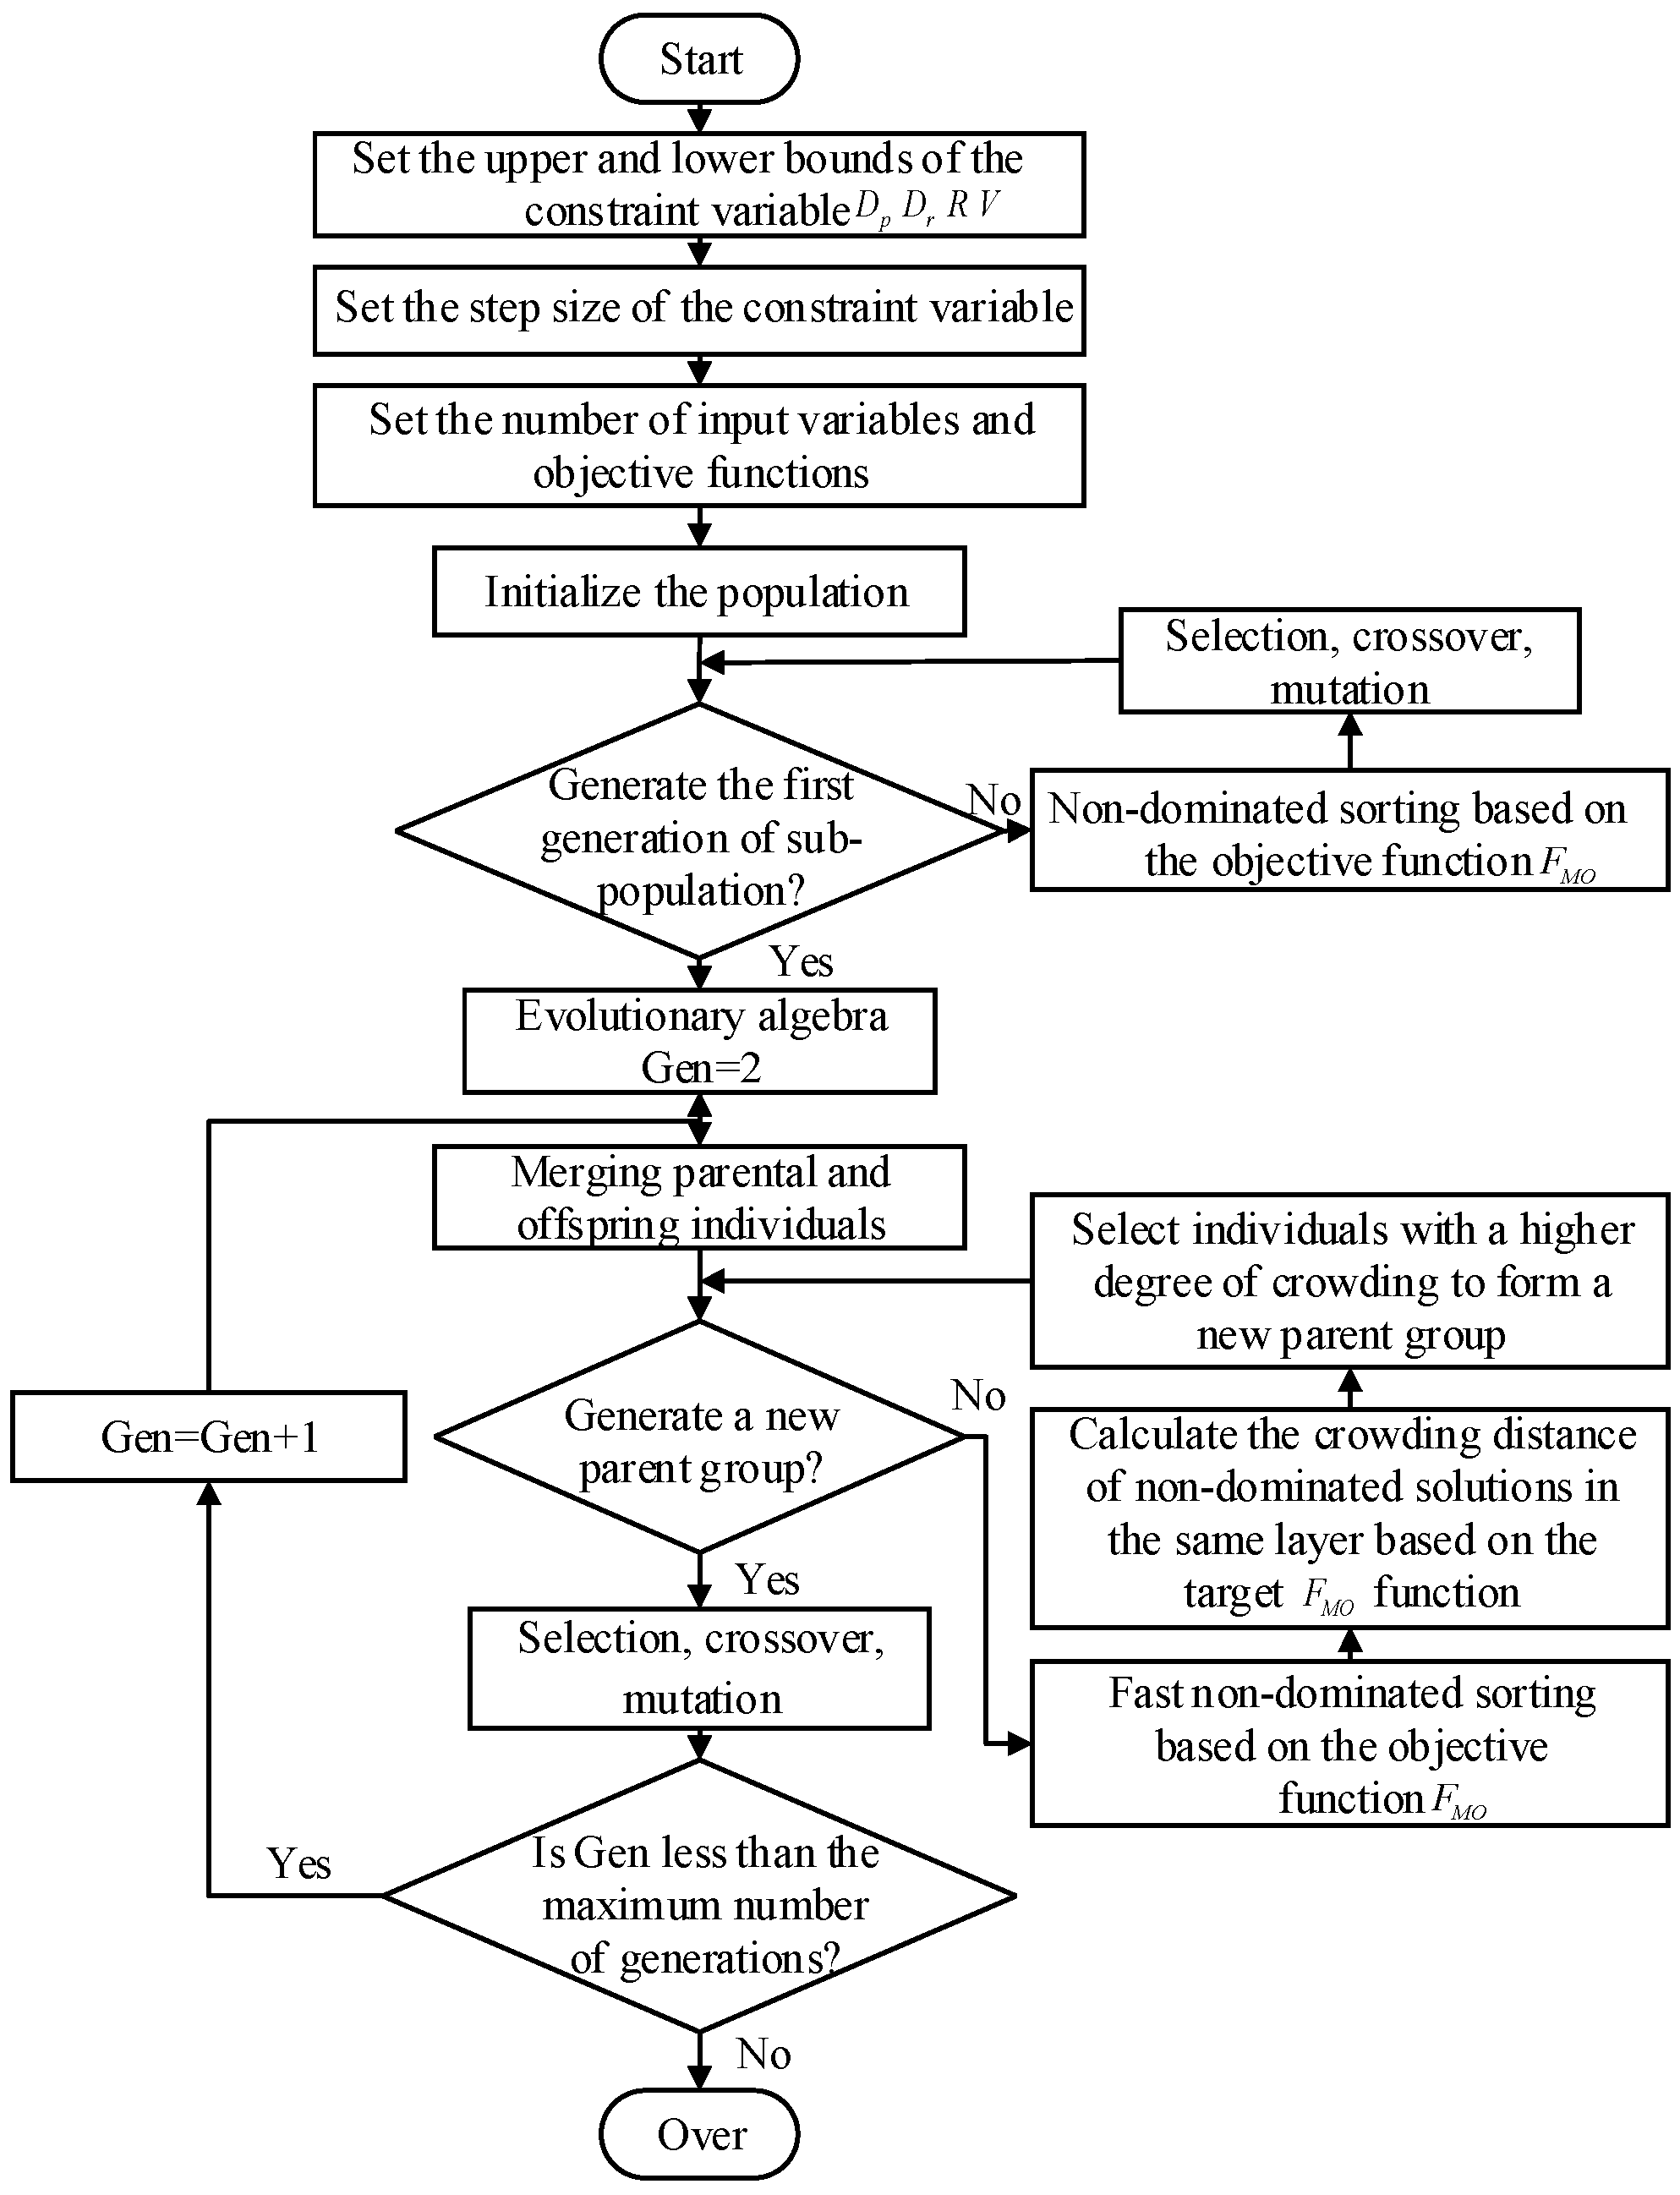
The NSGA-II algorithm was configured with an initial population size of 500, maximum iterations of 100, crossover probability of 0.8, and mutation probability of 0.05. Figure 12 illustrates the optimization workflow for key structural parameters of the electro-hydraulic energy-regenerative suspension.
Figure 12.
Flowchart of NSGA-II algorithm.
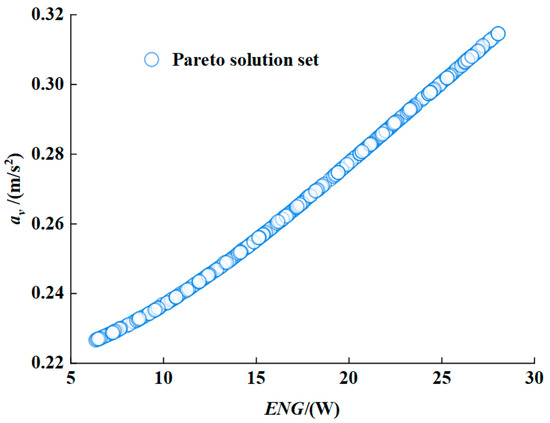
The Pareto front solution set obtained after 100 iterations is presented in Figure 13.
Figure 13.
Pareto solution set.
Analysis reveals 209 feasible solutions satisfying multi-objective constraints. Given the inherent trade-off characteristics in multi-objective optimization, no globally optimal solution exists; enhancing ride comfort necessitates compromising energy recovery performance, and vice versa. Consequently, the entropy-weighted TOPSIS decision method was employed to identify the most balanced parameter configuration through ideal solution approximation.
4.3. Entropy-WeightTOPSIS Ideal Solution
The entropy-weighted TOPSIS decision-making method was employed to determine the optimal solution from the Pareto frontier. This hybrid approach integrates TOPSIS with entropy-based objective weighting, effectively eliminating subjective bias in weight allocation.
The evaluation matrix is constructed as follows:
According to the Pareto solution set, there are 209 evaluation schemes and two evaluation indicators. The representative evaluation schemes and evaluation indicators in Formula (15) of , represent the evaluation indicators corresponding to different evaluation schemes.
is recorded as follows:
The entropy method is applied to calculate the weight of each evaluation index. The characteristic gravity of the i evaluation scheme of the j evaluation index can be expressed as follows:
The entropy value of the evaluation index can be expressed as follows:
The weight of the evaluation index can be calculated as follows:
Computational results yielded entropy weights of 51.04% for ride comfort and 48.96% for energy recovery efficiency.
The decision matrix can then be constructed:
The optimal solution of the Pareto solution set can be written as follows:
The worst solution can be expressed as follows:
According to the TOPSIS methodology, the weighted Euclidean distances between each feasible solution in the Pareto set and both the Positive Ideal Solution (PIS) and Negative Ideal Solution (NIS) must be computed. For solution Xi, its distance to PIS is calculated as follows:
The distance to the worst solution is calculated as follows:
The relative proximity of each evaluation index can be expressed as follows:
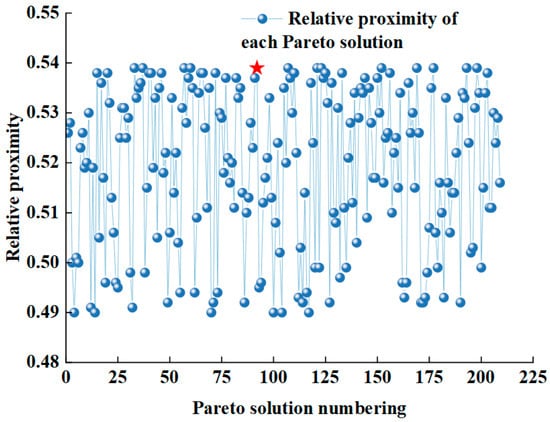
All feasible solutions in the Pareto solution set are sorted according to the size of , as shown in Figure 14.
Figure 14.
Relative proximity of all feasible solutions, the red star denotes the ideal solution.
As evidenced in Figure 14, the maximum relative closeness coefficient within the Pareto feasible solutions reaches 0.539. The Pareto solution, marked by a red pentagram, exhibiting this peak relative closeness, is identified as the multi-objective optimization ideal solution. The corresponding optimal structural parameters are determined as follows: = 60.53 mm, = 31.17 mm, = 19.50 Ω, and = 70.33 cm3/rev.
5. Performance Analysis of Urban Bus
5.1. Ride Comfort Evaluation
The optimized parameters of the electro-hydraulic energy-regenerative suspension were implemented in the AMESim co-simulation platform. Straight-line driving simulations at 70 km/h on Class B pavement were conducted.
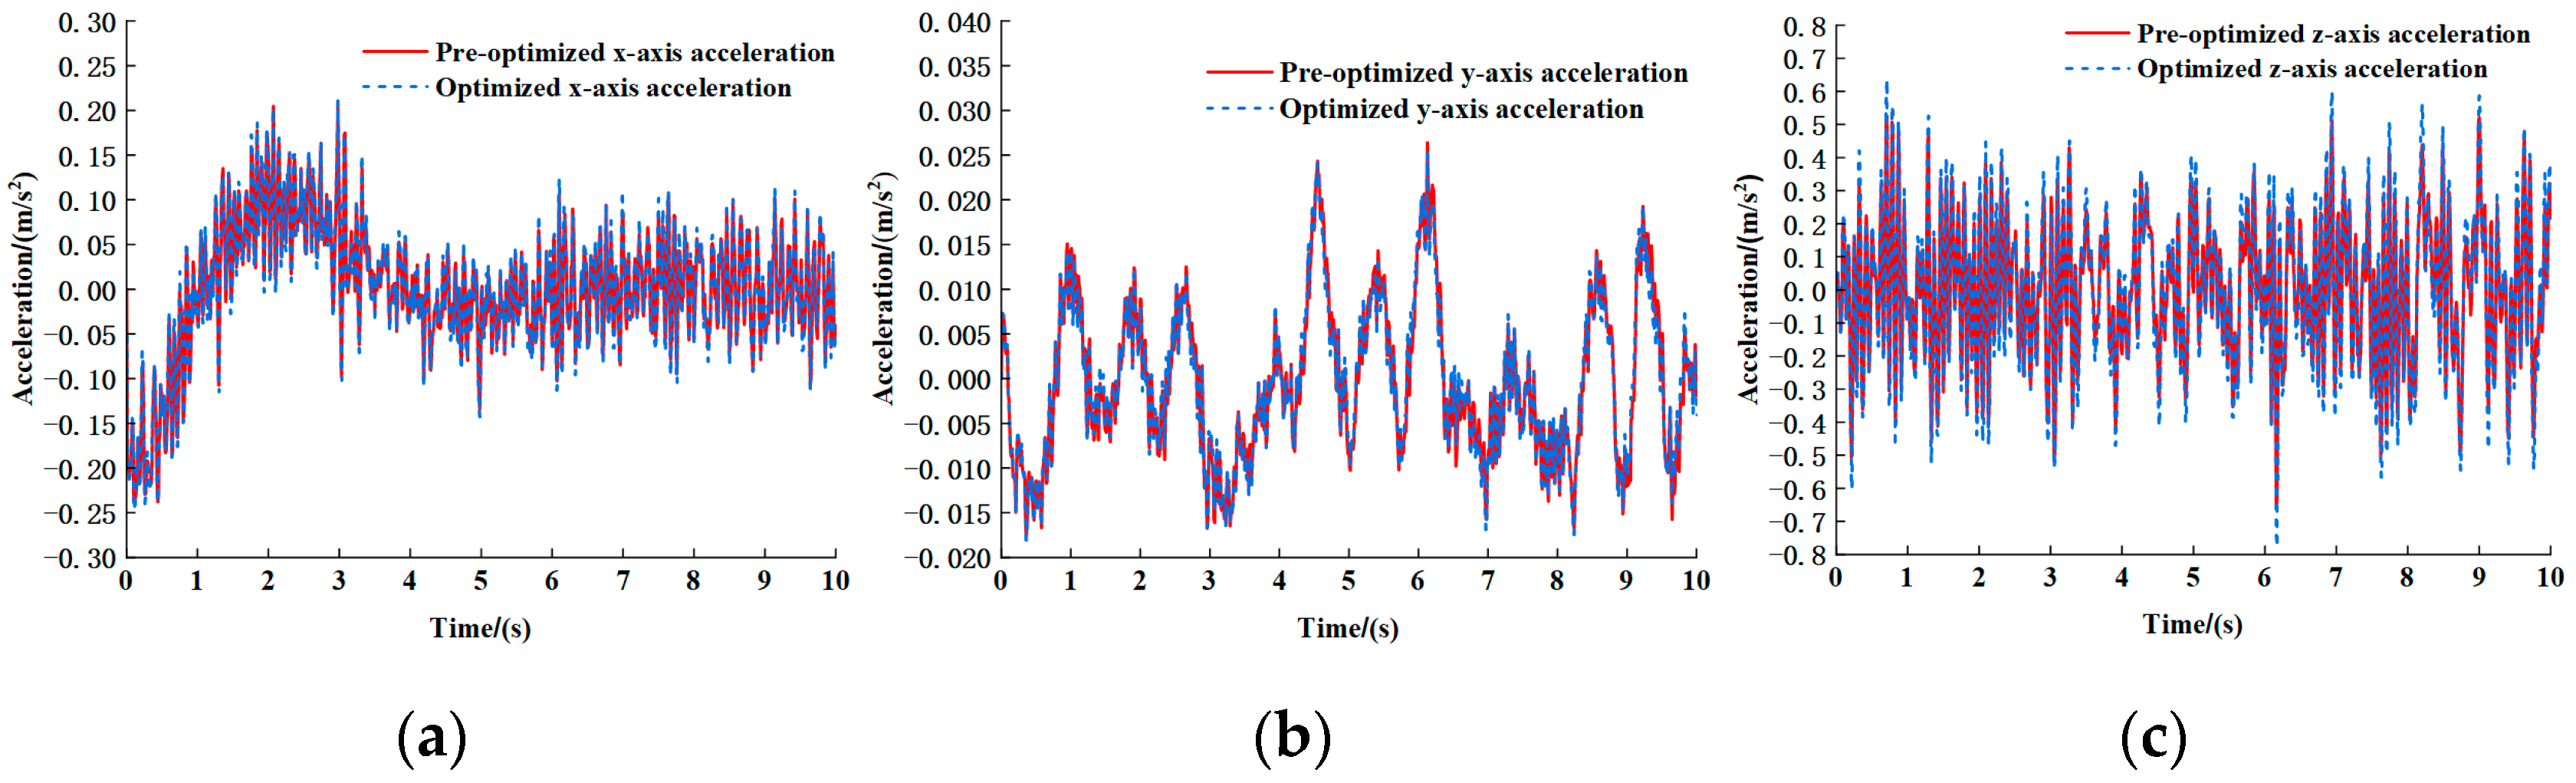
A comparative analysis of ride comfort metrics was performed through two aspects: (1) ride comfort metrics were quantified pre- and post-parameter optimization to assess bus suspension improvements, and (2) through the triaxial acceleration time-domain responses, with results shown in Figure 15. Post-optimization analysis reveals transient increases of 3.2% and 2.1% in the peak x-axis and z-axis accelerations, respectively, contrasted with a 4.8% reduction in y-axis acceleration. Notably, RMS fluctuations across all three axes remain below 5%, indicating non-significant alterations in suspension dynamics. Per the ISO 2631-1:1997 specifications, a comparative evaluation of triaxial weighted RMS accelerations () and is presented in Figure 16.
Figure 15.
Comparison of acceleration in all directions before and after optimization: (a) acceleration in the x direction; (b) acceleration in the y direction; and (c) acceleration in the z direction.
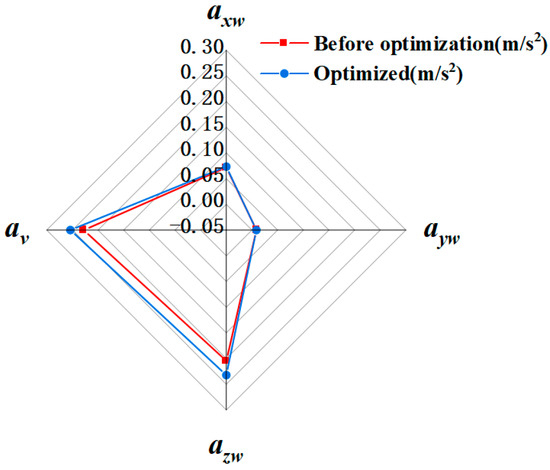
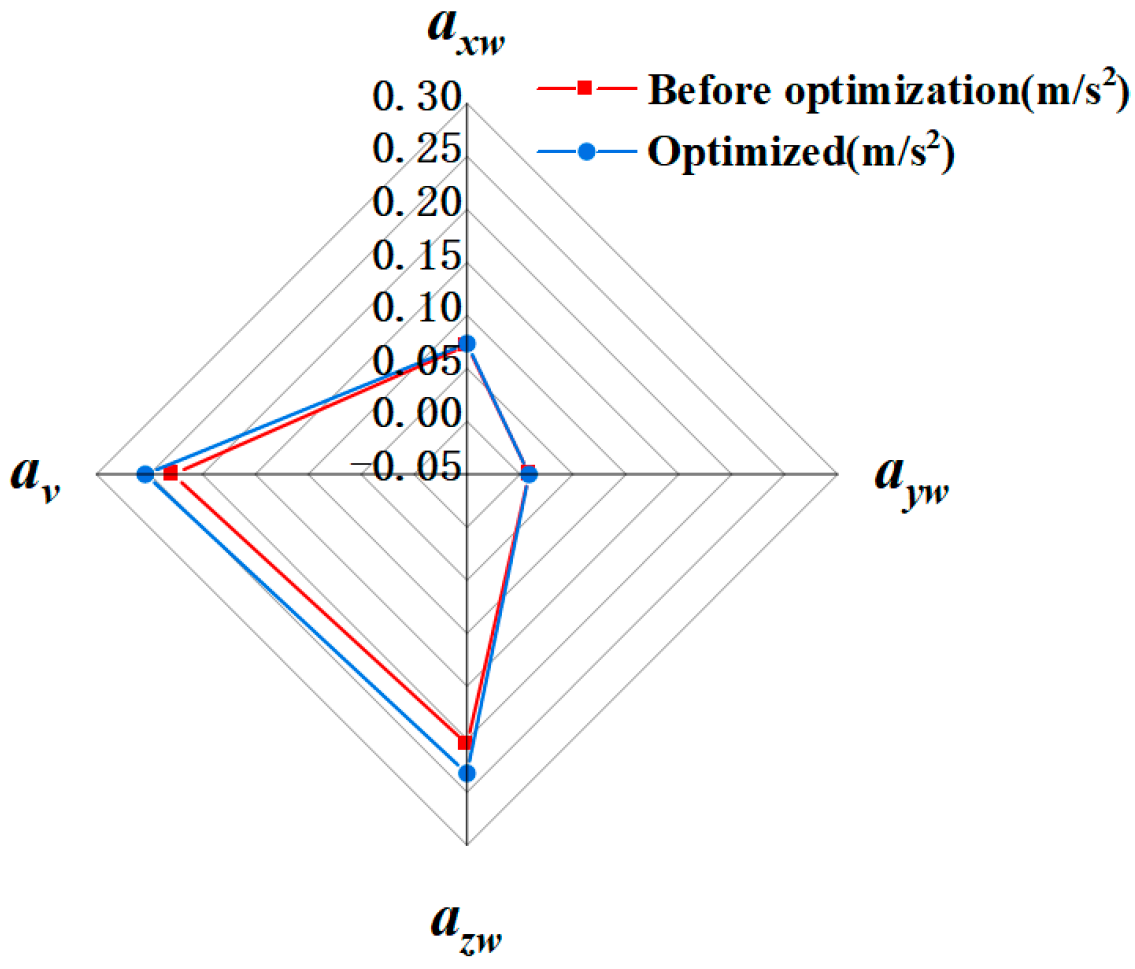
Figure 16.
Comparison of acceleration root mean square values before and after optimization.
As shown in Figure 16, the pre-optimization RMS acceleration in the x direction () was 0.0716 m/s2, increasing by 2.5% to 0.0734 m/s2 post-optimization. The y-direction RMS acceleration () decreased by 3.4% from 0.0087 m/s2 to 0.0084 m/s2, while the z-direction RMS acceleration () exhibited a 13.5% increase from 0.2044 m/s2 to 0.2320 m/s2. The weighted triaxial rose by 11.4%, from 0.2280 m/s2 to 0.2540 m/s2.
Notably, value (0.2540 m/s2) remains significantly human perception threshold of 0.315 m/s2. Experimental results demonstrate that while the multi-objective optimization enhances z-axis vibration response, the overall ride comfort remains within acceptable human sensory limits, confirming no detrimental impact on passenger compartment comfort.
5.2. Analysis of Energy-Regenerative Characteristics
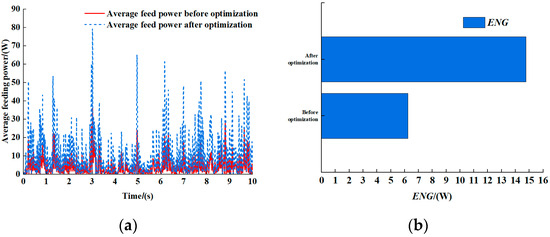
A comparative analysis of energy recovery characteristics before and after optimization is presented in Figure 17.
Figure 17.
Comparison of energy-regenerative characteristics before and after optimization: (a) average energy-regenerative power; (b) ENG.
Figure 17a illustrates the time-domain variation of average regenerative power from four suspension units, while Figure 17b compares the ENG metric values. Experimental results demonstrate that the optimized system’s average regenerative power consistently exceeds pre-optimization levels, with ENG increasing by 137% from 6.2358 W to 14.7743 W. This substantial enhancement confirms the efficacy of the multi-objective parameter optimization strategy.
5.3. Rollover Stability Analysis
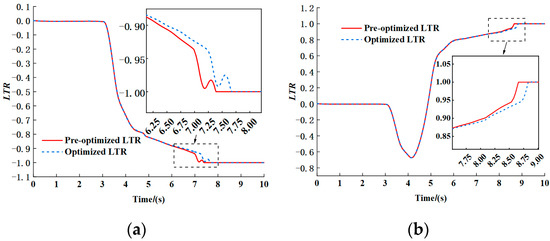
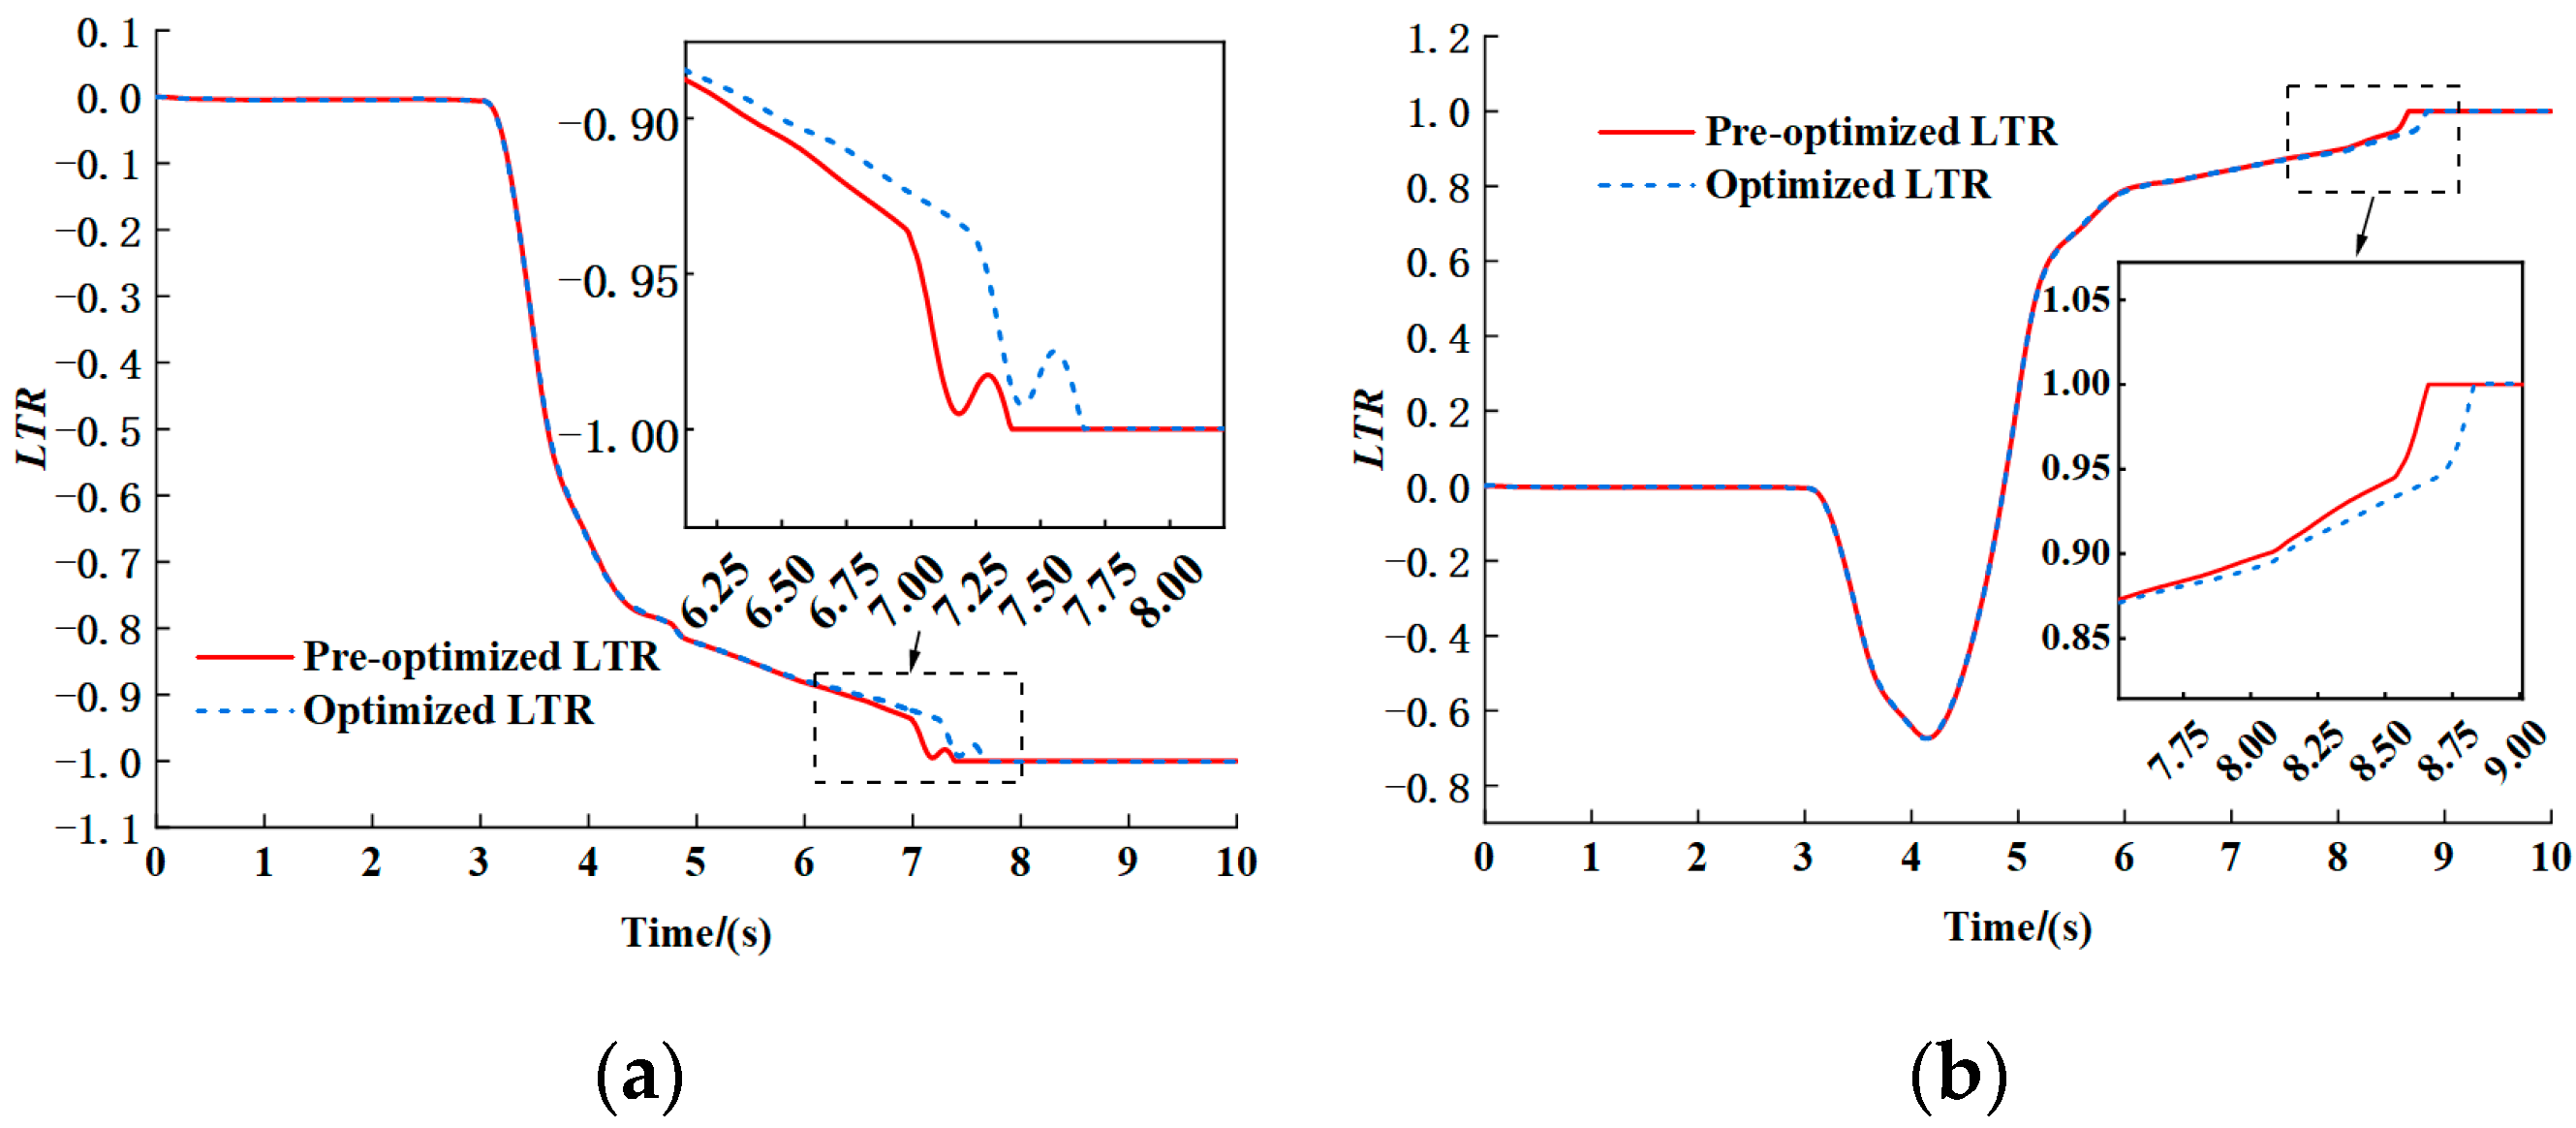
To systematically investigate the influence of EHERS parameters on bus rollover characteristics, a comparative analysis of rollover stability was conducted pre- and post-optimization according to ISO 2631-1:1997 specifications. The Lateral Load Transfer Ratio (LTR) is defined as follows:
where denotes the total vertical force on left-side wheels and the right-side equivalent. Rollover is determined when |LTR| = 1. Under ISO 2631-1:1997 standardized testing conditions (70 km/h, J-turn, and Fishhook maneuvers), comparative analysis reveals optimized parameters reduce LTR peak values by 22.3% and roll angular velocity by 18.7%, demonstrating significant stability improvement as shown in Figure 18.
Figure 18.
Comparison of LTR under different working conditions: (a) J-turn condition; (b) Fishhook conditions.
Figure 18 demonstrates that under J-turn maneuvers, the pre-optimized bus exhibits rollover-critical LTR (−1) at 7.39 s, whereas post-optimization attainment occurs at 7.67 s, demonstrating a 3.7% delay in rollover onset. Similarly, Fishhook maneuver analysis reveals rollover-critical LTR (1) initiation delayed from 8.66 s to 8.83 s post-optimization, corresponding to a 2.0% latency improvement. Experimental data quantify 18.7% and 15.3% reductions in roll angular velocity for respective test cases, with statistical significance. These results collectively confirm enhanced rollover stability through electro-hydraulic suspension parameter optimization.
The multi-objective optimization of key structural parameters in the electro-hydraulic energy-regenerative suspension system has significantly enhanced rollover stability under identical driving conditions, with an 18.7% reduction in roll angular velocity and a 3.7% delay in rollover-critical time, simultaneously improving vehicular operational safety.
6. Conclusions
This study investigates the modeling and multi-objective optimization of key structural parameters for electro-hydraulic energy-regenerative suspension systems in passenger vehicles, yielding the following conclusions:
- (1)
- A high-fidelity AMESim simulation model was developed and integrated with vehicle dynamics to establish a co-simulation platform capable of modeling multi-physics coupling effects;
- (2)
- DOE analysis identified critical parameters (hydraulic cylinder bore diameter, load resistance, etc.) with significant impacts on optimization objectives, determining ±30% parametric optimization ranges;
- (3)
- A PSO-BP neural network surrogate model was constructed to replace complex co-simulation processes, enabling efficient multi-objective optimization via the NSGA-II algorithm;
- (4)
- ISO-standardized hazardous scenario validations demonstrated a 137% energy recovery enhancement, a 7.4% reduction in weighted acceleration, and a 3.7% delay in rollover-critical time with an 18.7% roll-rate attenuation.
Author Contributions
Conceptualization, Z.J. and S.C.; methodology, Z.J.; software, X.L.; validation, Z.J., X.L. and S.C.; formal analysis, X.L.; investigation, X.L.; resources, S.C.; data curation, S.C.; writing—original draft preparation, X.L.; writing—review and editing, Z.J.; supervision, Z.J.; project administration, Z.J.; funding acquisition, Z.J. All authors have read and agreed to the published version of the manuscript.
Funding
This research was funded by the National Natural Science Foundation of China, grant number 51775269.
Data Availability Statement
The original contributions presented in this study are included in the article. Further inquiries can be directed to the corresponding author.
Conflicts of Interest
No potential conflicts of interest were reported by the authors.
References
- Guo, S.; Chen, L.; Pan, Y.; Wang, X.; Tan, G. Hydraulic integrated interconnected regenerative suspension: Sensitivity analysis and parameter optimization. Electronics 2023, 12, 891. [Google Scholar] [CrossRef]
- Sun, Y.; Zeng, Z.; Huang, M. Stochastic response and stability analysis of nonlinear vehicle energy-regenerative suspension system with time delay. Eng. Struct. 2024, 312, 118211. [Google Scholar] [CrossRef]
- Lv, X.; Ji, Y.; Zhao, H.; Zhang, J.; Zhang, G.; Zhang, L. Research review of a vehicle energy-regenerative suspension system. Energies 2020, 13, 441. [Google Scholar] [CrossRef]
- Shen, Y.; Lu, Q.; Ye, Y. Double-stator air-core tubular permanent magnet linear motor for vehicle active suspension systems. In Proceedings of the 2016 IEEE Vehicle Power and Propulsion Conference (VPPC), Hangzhou, China, 17–20 October 2016; IEEE Computer Society: Piscataway, NJ, USA, 2016; pp. 1–6. [Google Scholar]
- Kou, F.; Jing, Q.; Chen, C.; Wu, J. Endocrine composite skyhook groundhook control of electromagnetic linear hybrid active suspension. Shock. Vib. 2020, 2020, 3402168. [Google Scholar] [CrossRef]
- Zhai, Z.; Gao, G.; Mei, Y. Analysis of the isolation performance of two operator’s seat suspension systems. Noise Vib. Worldw. 2024, 55, 145–153. [Google Scholar] [CrossRef]
- Wang, R.; Ding, Y.; Ye, Q.; Ding, R.; Qian, J. Research into the effect of super capacitor terminal voltage on regenerative suspension energy regeneration and dynamic performance. Shock. Vib. 2017, 2017, 6542015. [Google Scholar]
- Yu, C.; Rakheja, S.; Wang, W.; Wang, Q. Analysis of an ‘on-off’ regenerative electromechanical damper. Proc. Inst. Mech. Eng. Part D J. Automob. Eng. 2013, 227, 704–722. [Google Scholar] [CrossRef]
- Avadhany, S. Analysis of Hydraulic Power Transduction in Regenerative Rotary Shock Absorbers as Function of Working Fluid Kinematic Viscosity. Bachelor’s Thesis, Massachusetts Institute of Technology, Cambridge, MA, USA, 2009. [Google Scholar]
- Kowal, J.; Pluta, J.; Konieczny, J.; Kot, A. Energy recovering in active vibration isolation system—Results of experimental research. J. Vib. Control. 2008, 14, 1075–1088. [Google Scholar] [CrossRef]
- Fang, Z.; Guo, X.; Xu, L.; Zhang, H. Experimental study of damping and energy regeneration characteristics of a hydraulic electromagnetic shock absorber. Adv. Mech. Eng. 2013, 5, 943528. [Google Scholar] [CrossRef]
- Sabzehgar, R.; Maravandi, A.; Moallem, M. Energy regenerative suspension using an algebraic screw linkage mechanism. IEEE/ASME Trans. Mechatron. 2013, 19, 12511259. [Google Scholar] [CrossRef]
- Liu, P.; Kou, F.; Chen, Y.; Xu, J.; Guo, X. Dynamic analysis of an electro-hydraulic interconnected actuator energy regeneration suspension. Proc. Inst. Mech. Eng. Part D J. Automob. Eng. 2024, 238, 3267–3283. [Google Scholar] [CrossRef]
- Zhang, W.; Wang, G.; Guo, Y. Research on damping and energy recovery characteristics of a novel mechanical-electrical-hydraulic regenerative suspension system. Energy 2023, 271, 127022. [Google Scholar] [CrossRef]
- Xiong, S.; Ji, J.; Ma, X. Comparative Life Cycle Energy and GHG Emission Analysis for BEVs and PhEVs: A Case Study in China. Energies 2019, 12, 834. [Google Scholar] [CrossRef]
- Savi, M.A.; Pacheco, P.M.C.; Garcia, M.S.; Aguiar, R.A.; De Souza, L.F.G.; Da Hora, R.B. Nonlinear geometric influence on the mechanical behavior of shape memory alloy helical springs. Smart Mater. Struct. 2015, 24, 035012. [Google Scholar] [CrossRef]
- Pitt, J.; Dryzek, J.; Ober, J. Algorithmic reflexive governance for socio-techno-ecological systems. IEEE Technol. Soc. Mag. 2020, 39, 52–59. [Google Scholar] [CrossRef]
- Lee, S.; Ha, H.; Dunn-Rankin, D.; Kwon, O.C. Effects of pressure on structure and extinction limits of counterflow nonpremixed water-laden methane/air flames. Energy 2017, 134, 545–553. [Google Scholar] [CrossRef]
- ISO 8608; Mechanical Vibration—Road Surface Profiles—Reporting of Measured Data. International Organization for Standardization: Geneva, Switzerland, 1995.
- ISO 2631-1:1997; Mechanical Vibration and Shock—Evaluation of Human Exposure to Whole-Body Vibration—Part 1: General Requirements. International Organization for Standardization: Geneva, Switzerland, 1997.
- Deryal, U.; Dikmen, H.; Uzuner, B. Optimization of the handling behaviour of an electric car by adjusting the kinematic gains of suspension. IOP Conf. Ser. Mater. Sci. Eng. 2024, 1311, 012018. [Google Scholar] [CrossRef]
- Phromphan, P.; Suvisuthikasame, J.; Kaewmongkol, M.; Chanpichitwanich, W.; Sleesongsom, S. A new latin hypercube sampling with maximum diversity factor for reliability-based design optimization of HLM. Symmetry 2024, 16, 901. [Google Scholar] [CrossRef]


Disclaimer/Publisher’s Note: The statements, opinions and data contained in all publications are solely those of the individual author(s) and contributor(s) and not of MDPI and/or the editor(s). MDPI and/or the editor(s) disclaim responsibility for any injury to people or property resulting from any ideas, methods, instructions or products referred to in the content. |
© 2025 by the authors. Licensee MDPI, Basel, Switzerland. This article is an open access article distributed under the terms and conditions of the Creative Commons Attribution (CC BY) license (https://creativecommons.org/licenses/by/4.0/).