Abstract
This research deals with the optimization of the machining process using a model based on criterial functional dependence hypothesis. The basis of this hypothesis is the assertion that for each production process of a given product with many input parameters, at given known requirements and conditions, it is possible to determine the minimum/maximum local extremum, that is, to find the most suitable conditions under which the criterion is achieved. To verify the optimization model, three different cutting tools (cutting inserts) were compared within the criteria functions set for cutting force Fc, process power P, and surface roughness characteristics Rz, all with two independent variables—cutting speed vc and feed f. The technology of turning with longitudinal external machining of the cylindrical surface was selected as the operation for the experiment. Taking into account the importance of individual criteria for real practice and the minimum extreme values achieved (a surface roughness Rz = 2.2 μm and cutting power p = 14,700 W at vc = 145 m/min and f = 0.8 mm), the tool with a linear cutting edge (LCE) designed at the authors’ workplace appeared as the most suitable tool for machining operation under the given conditions when compared with commercially produced cutting tools TCMT 16T308-PR 4035 and CNMG 120408-WM 4025.
1. Introduction
At the beginning of the 20th century, Niels Bohr observed and interpreted exponential development in the field of science, and, with the necessary application time response, it can also be identified in technology. His quote “The fact that nature does not allow the simultaneous measurement of all properties of a system is a metaphor for the social inability to simultaneously absorb all the consequences of progress” provides a philosophical basis for understanding how scientific revolutions destabilize traditional understandings of reality [1].
Another characteristic of modern society is the exponential growth of consumption in developing regions and the associated exponential growth of production. Among the first significant authors to describe how the speed of technological progress (“dromology”—from an Ancient Greek noun “dromos” for race or racetrack) leads to “accidents” in social space is Paul Virilio. Hypercomplexity is understood in his context as the product of a collision between human perception and technical acceleration [2].
In 1997, John Elkington formalized the 3P (People-Planet-Profit, also known as the Triple Bottom Line) concept, seeking to promote the evaluation of business success not only based on Profit (Profit), but also on responsible behavior in the social (People) and environmental (Planet) areas [3]. In 2018, in the article “25 Years Ago I Coined the ‘Triple Bottom Line’. Here’s Why It’s Time to Rethink It” [4], he pointed out that his 1997 model had become superficial “greenwashing” in many companies, serving to create a beautiful packaging for an inferior product.
Today, Elkington speaks of the “Triple Helix” (People, Planet, Prosperity) as a new vision for the 21st century. In this understanding, a shift can be seen from the “planar circular 3P” to the “3P spatial orientation” with non-linear relationships between the elements of the system. A look at the history of the development of the ingenious concept of the 3P by Elkington himself very realistically points to a parallel with the development of concepts aimed at creating mutual harmony of all elements of our civilization.
Some modern authors, in accordance with the philosophical framework of Elkington, refer to modern society as a “hypercomplex anthropotechnical environment”, as a description of the state of indeterminate complexity of exponential processes exceeding the possibilities of natural human linear thinking and traditional models [5]. The technocratic practices of modern society, based on engineering and rational planning, create a short-term illusion of control that ignores local complexity and leads to systemic failures [6].
One of the best visualizations of the increasing complexity of production systems in a hyper-complex anthropotechnical environment is represented by Figure 1.

Figure 1.
The increasing complexity of the production system in the history of the industrial era of humanity.
The production system (Figure 1) from the beginning of the industrial era is represented by the tetrahedron of the elements Cost/Quality/Flexibility/Time, which was the main scheme until about the 1980s. Costs in the original tetrahedron gradually transformed into the more practical Profit, and over time-mainly through the actions of society-other elements were added to the system. The octahedron Profit/Quality/Flexibility/Time/People/Planet in Figure 1 is only illustrative, because currently there are other elements belonging to this system: e.g., Technology/Business Philosophy and Strategy, etc.
2. State of the Art
Several studies have investigated the effects of cutting parameters—such as cutting speed, feed rate, and depth of cut—on machining power indicators like surface roughness, cutting force, and power consumption.
Study of Patole et al. [7] examined how feed rate, cutting speed, and depth of cut influence surface roughness and cutting force during the turning of AlSi5Cu3 alloy. Findings indicated that feed rate significantly affects surface roughness, followed by cutting speed, while depth of cut has minimal impact. Similar results were obtained by Kumar [8] during dry turning of aluminum with various cutting tools, including PCD and coated inserts. This was also investigated by Rezvan [9], who revealed during the turning of Al7032-SiC composites that surface roughness is most significantly affected by depth of cut.
The research of Asavarutpokin et al. [10] aimed to optimize cutting conditions to balance power consumption and surface quality when turning S50C steel. The achievements highlighted the trade-off between minimizing power consumption and desired surface quality. A similar investigation on how surface temperature, cutting speed, feed rate, and depth of cut influence cutting forces, surface finish, and tool wear during hot machining was performed by Thandra [11], Bhattacharya [12], and El-Kady [13]. The findings revealed that cutting speed significantly influences both surface roughness and power consumption, while feed rate and depth of cut have less impact.
Duman & Özel [14] employed artificial neural networks and SHAP analysis to model the effects of cutting parameters on surface roughness and cutting forces during the turning of 90MnCrV7 steel. Multi-criteria decision-making methods were used to optimize these parameters, identifying optimal levels for insert radius, cutting speed, feed, and depth of cut to minimize surface roughness and cutting forces. Similarly, Varga & Szakálos [15] examined the effects of cutting speed and feed rate on various surface roughness parameters and cutting force during dry turning of AISI304L stainless steel using coated carbide tools.
The aim of the work by Jeulin et al. [16] was to create a model which expresses the relationship with the chip cross-section defined by the coefficient Kc integrating specific moment behavior. This model provides energy perspectives for specific configurations for which torques in the energy balance could be important, such as small-radius tools or high-speed milling. On another hand, Yuqin, in his study [17], concluded that with changes in roughness, the optimal design value of the maximum residual compressive stress depth changes from about 0.5 times the Hertzian contact half-width depth in the subsurface layer to about 15 μm in the near-surface layer. Jaurker [18] and Xun [19] and their teams investigated optimization techniques in machining processes to improve output quality. They discussed methods for modelling parameters and their relationships and calculating optimal machining conditions. Xun moreover proposed a generic optimization framework based on an end-to-end evolutionary algorithm that can be adapted to various machining optimization problems to guide operators in selecting the best parameters in an automated manner.
Cutting analyses performed by Chang [20] discovered a relationship between chip bending, shear yielding and fracture toughness, while the sharp tools with an angle θ were used to cut surface layers of varying thickness h, and the cutting force Fc, and transverse force Ft were measured during orthogonal cutting. The turning power using CBN inserts under different cooling and lubrication conditions was also investigated by Ngoc [21] through the evaluation of cutting force, tool wear, tool life, and surface roughness. It was found that the normal force component takes on large values and is closely related to flank wear, so it can be used as a criterion for evaluating tool life, while the cutting force coefficient can also be used to evaluate machining power. Numerical approach to the cutting forces investigation and machining model optimization can be also an efficient tool for the cutting tool and machined workpiece behavior; however, it is not easy to take into account all real boundary conditions [22,23].
Based on the above, it can be stated that the topic of the relationship between power (energy), machining process parameters and the achieved surface roughness has been of long-term interest to scientists, while it could be mistakenly concluded that development in this area has stopped. However, since machining is still one of the most widely used and accessible technologies, this topic is still relevant and gaining intensity, especially in connection with automation, digitalization, or other new elements that are currently emerging within Industry 4.0/5.0.
Therefore, the primary objective of the presented study is to create a simple model for increasing the efficiency of the production process, based on which it is possible to determine the best value of the criterial function within the given conditions of a specific company. Such a criterion function can be e.g., minimum process* power during the production process, shortest production time, minimal cutting force, or minimal surface roughness. The secondary objective is to verify this proposed optimization model when comparing the achieved results for three types of machining tools, two of which are commercially available and one of which the authors developed in their workplace.
The optimization of the machining process using a model based on criterial functional dependence, together with the achieved results, represents a contribution not only to the theory of machining, but also to aspects related to the evaluation of the production process from the point of view of the product life cycle, product quality and tool life assessment, since the power of the cutting process (while achieving the same product quality) is a very important criterion for evaluating process efficiency and affects the competitiveness of companies. Lower energy consumption or minimal process power can lead to lower costs, reduced environmental impact of harmful emissions, and better sustainability of production. A proposed model based on simple mathematical optimization while finding the process power and surface roughness extrema can be considered as a novelty.
∗Process power is related in this research to the amount of energy consumed to perform the cutting operation with a given tool.
3. Materials and Methods
3.1. Methodology
Long-term research in the field of complex efficiency of production processes and systems has led to the creation of models for the efficient use of natural resources—mainly materials and energy. The authors’ models are based mainly on the ISO 14040 [24] and ISO 14044 [25] standards focused on complex Life Cycle Assessment. These standards are a very suitable tool for systematic assessment and improvement of the environmental profile of processes and products.
In terms of systematization of the assessment of the cutting process, in this paper, the authors focus on a partial element of complex modelling—the physical determination of the minimum required power to perform the operation [26].
Minimization of the power required to perform the operation led to the creation of the authors’ hypothesis called “Minimum process power”.
The basis of this hypothesis is the assertion that for each production process of a defined product, given known requirements and conditions, it is possible to determine the minimum physical local extremum from the point of view of necessity.
The term “known requirements and conditions” means the following:
- Qualitative characteristics—conditions determined by the production drawing (type of material, required tolerances and surface roughness), qualitative characteristics of technologies, personnel qualifications, …;
- Quantitative characteristics—required production quantities and productivity, available capacities (personnel, available technologies).
The selection of the most suitable technology then depends not only on the above-mentioned requirements and conditions but on all elements of a complex modern production system, as mentioned in the previous chapter.
When simplifying the model for optimizing the production process, the authors used decomposition of the product production process into individual technological workplaces where production takes place in individual production operations. In order for the optimization to take place, it is assumed that several alternative production processes are designed. If optimization is performed for each production process in order to minimize the required power for each technological workplace, then the sum of the required power for all technological workplaces of a specific production process serves as a comparison with other variants [27]. It is also necessary to simultaneously optimize material consumption in connection with energy consumption. An example of the complexity of this basic and initial optimization in the entire production system [28] is the comparison of energy intensity (J/kg) and volume productivity (kg/h) of selected technologies in Figure 2 that is expressed in the form of “Hockey stick trend.” For easy sharing of optimization results, it is very convenient to determine in advance the quantity in which the optimization will be performed—for example, price, power, power input, amount of energy, carbon footprint, etc.
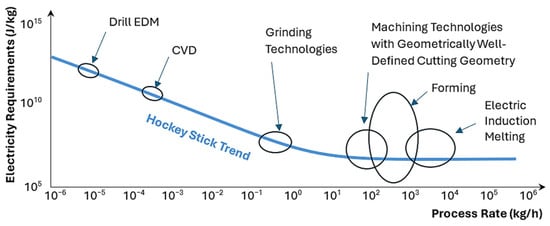
Figure 2.
The dependency of energy intensity (J/kg) on process rate (kg/h) for selected production technologies expressed in the form of “Hockey stick trend”.
The choice of technologies used according to Figure 2 cannot be oriented only to energy consumption and efficiency of material volume removal, because the product has clearly defined quality requirements and conditions—e.g., characteristics defined by prescribed tolerances and surface roughness. On the other hand, it is not appropriate to directly choose a technology ensuring the fulfilment of quality characteristics [29]. This step involves the optimization of a suitable combination of technological methods, which will ensure the minimization of material and energy consumption for the required productivity [30].
For production process design, it is very important to choose suitable combinations of technologies for known requirements and conditions—e.g., for piece production of small parts, it is not economically permissible to design special tools and fixtures, in serial production the suitability of their use is determined by optimization calculations, and in mass production, special tools and fixtures are crucial for achieving the required productivity at the required quality and price. In general, in piece and small-batch production, the material consumption per product is significantly higher than in mass production, where the initial investment in procedures that save the amount of material used is returned in the form of savings in this particular item. An example of this optimization is shown in graphic form in Figure 3. In this figure, the breakpoints are the intersections of the Psei curves that determine the extent to which the individual proposed production processes are economically more efficient in terms of the required productivity.
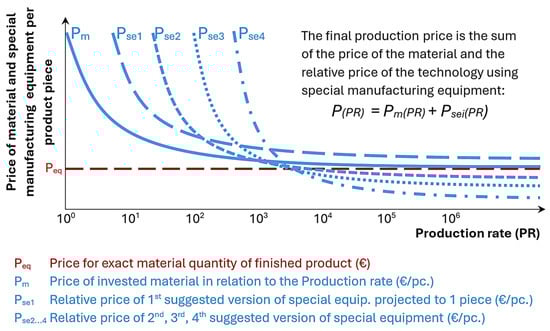
Figure 3.
Development of the price of material and the relative price of more suggestions of special manufacturing equipment (tool, fixture, etc.) according to the required productivity.
Figure 4 graphically interprets the assumed historical development of energy efficiency of the selected manufacturing process-turning-Process Power Efficiency PPE—i.e., comparison of theoretically required power and actually invested power for removal of a specified volume of material. It is an essential measurable factor of the authors’ “Minimum Process Power” hypothesis. This factor indicates the degree of energy utilization for a technological operation.
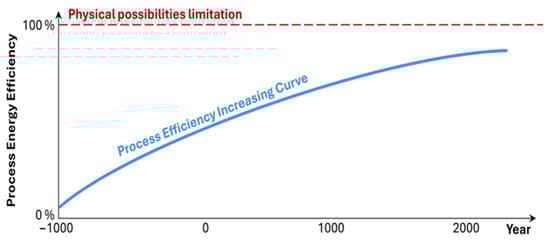
Figure 4.
Assumed historical development of the degree of energy use for the process implementation through the process efficiency factor PPE.
The calculation of process efficiency is:
where
- PPE—Process Power Efficiency—expresses the efficiency of the process (a dimensionless number from 0 to a value approaching 1);
- PT—Theoretically required power to perform the process;
- PR—Real power needed to perform the process.
Determining PT—the theoretically required power to perform a process—is a complex problem that depends on many factors. There is no universal physical approach that can be used for all types of manufacturing processes and materials. In general, the power required to perform a process change is proportional to the force required to create, move, or break the bonds between the material particles to perform the change through the manufacturing process. To decide on the method of determining the theoretically required power—i.e., the minimum power required to perform a manufacturing process—it is necessary to consider at least the following influences:
1. Process characteristics—because each production process in manufacturing engineering has its own specific characteristics of the action on the material, this is the primary consideration for choosing the physical principle for determining the theoretically required energy. To determine the physical principle for determining the minimum energy, the authors use the definitions of the DIN 8580 standard [31], which identifies only four possible types of manufacturing engineering processes in terms of influencing the cohesion of the particles of the processed material:
- Creation—primary shaping, in which a compact object is created from atomized particles, e.g., powder metallurgy processes;
- Preservation—the cohesion of the particles is neither broken nor increased, e.g., forming;
- Reduction—certain volumes of material are separated from the body that will form the final product, e.g., machining;
- Increase—between the partial volumes of the future product there is a joining—e.g., welding.
2. Technological properties of the material—it is evaluated in what proportion for a specific material processed by a specific technology there are [32]:
- The proportion of elastic deformation, which causes certain dimensional and shape changes in the volume of the material to be negated after the end of the production process;
- The proportion of plastic deformation, which causes permanent changes in the volume of the processed material.
- The proportion of brittle failures causing separation between specified volumes of the processed material.
3. Chemical composition and physical properties of the material [33]:
- Chemical composition: One of the most significant factors of the material properties—some chemical elements can significantly change—in a positive or negative sense—the physical and technological properties of the material even in trace amounts.
- Physical properties:
- ○
- State of the material matrix: Theoretically the same material from a chemical point of view has completely different properties if it is in the form of a single crystal or a polycrystalline structure. A polycrystalline structure has different properties if it is fine-grained or coarse-grained.
- ○
- Tensile strength: The resistance of the material to rupture.
- ○
- Yield strength: The stress at which the material begins to deform permanently.
- ○
- Modulus of elasticity: A measure of the stiffness of the material.
- ○
- Density: The mass of the material per unit volume.
4. Geometry of the processed material:
- The ratio of the maximum dimensions in space;
- The ratio of the number of atoms on the surface of the object to the number in the volume of the material.
Depending on the combination of the above-mentioned influences, it is necessary to define appropriate calculation methods.
For the purpose of the research presented in this article, the authors used to determine the theoretically necessary power for the process (PT). Cutting force determined from the chip cross-section A and the specific cutting coefficient kc, which expresses the resistance of the machined material to cutting and is therefore representative of the technological properties [34]:
where:
Fc—cutting force;
kc—specific cutting resistance—a material characteristic that needs to be determined experimentally within the range of used technological parameters with the exclusion of all other influences (resistances, changes in geometry, etc.);
A—chip area in the direction perpendicular to the action of the force Fc;
f—feed;
ap—depth of cut;
b—chip width;
h—chip thickness.
The above calculation of cutting force Fc based on a specific cutting resistance kc has a certain degree of inaccuracy because the value of kc depends on several factors of the cutting process—e.g., geometry of the cutting tool, cooling method, but especially on the thickness of the removed chip—as the chip thickness decreases, the specific cutting resistance increases.
The theoretical cutting power PT is given by the relation [35]:
where vc is the cutting speed.
If the dependencies of the experimentally measured data for the given conditions are known, these mathematical formulations can be further used to optimize the parameters entering the production process. When specifying the extrema of the function in a given range of variables, it is necessary to identify the critical points and determine whether these points correspond to local maxima or minima. Given the objectives of the presented research, the following steps of the methodology are aimed at finding the minimum of a function with two variables [36,37].
Let z = f(x,y) be a function of two variables, which is differentiable on an open set containing the point (x0,y0). The point (x0,y0) is called a critical point of a function f of two variables if one of the two following conditions holds:
- fx(x0,y0) = fy(x0,y0) = 0;
- either fx(x0,y0) or fy(x0,y0) does not exist.
The critical points of f(x,y) are the points where for the first-order partial derivatives with respect to both x and y hold
The solutions (x0,y0) to this system are the candidate critical points. Once the critical points have been found, discriminant D(x,y) at each critical point (x0,y0) is given as:
where
The critical points (x0,y0) that correspond to local minima are identified when the second derivative test yields D > 0 and fxx(x0,y0) > 0.
The critical points (x0,y0) that correspond to local maxima are identified when the second derivative test yields D > 0 and fxx(x0,y0) < 0.
Similarly, it holds with when more variables are considered.
To summarize the steps of the proposed method, a simple flowchart was prepared, as shown in Figure 5.
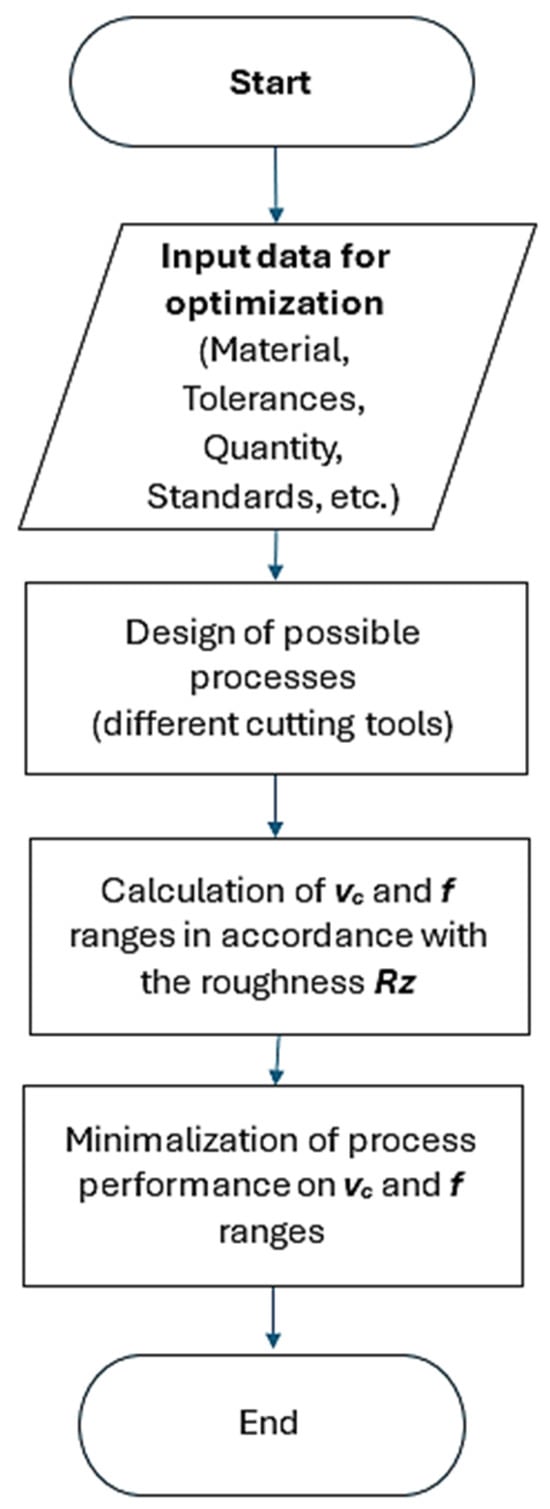
Figure 5.
A flowchart for data processing.
In real machining operations, it is possible to determine the real power consumed to perform the PR process by setting the desired cutting speed vc and measuring the cutting force, or by directly measuring the tool power.
Although it seems that when applying different tools, the differences in power cannot be significant, studies by several manufacturers [38,39,40,41] show that, for example, by changing some parameters of the cutting tool (adaptive cutting edge geometry, variable helix pitch, uneven cutting edge separation, etc.), it is possible to achieve the same amount of material removed with almost half the tool power. So, small changes in some features of the system can generate great differences in results.
The disadvantage of these solutions is usually the higher price of the tool, uneven wear of the cutting edges, more complicated restoration of cutting-edge quality, etc. [42] Typically, power savings in the cutting process are achieved by requiring increased power in tool manufacturing and maintenance.
The goal of the research is therefore to determine in a certain control area the combination of cutting factors that will ensure the maximum control efficiency, given by the objective function of these factors, in the presence or absence of additional parameter constraints dependent on these factors set by the control objective.
3.2. Experimental Conditions and Materials
In real practice, it is important to correctly decide which tool (cutting insert) is most suitable for machining the selected material under given conditions and with specified requirements. Criteria for evaluating efficiency with the given range of input parameters (e.g., cutting speed, cutting depth and feed) can be, for example, the shortest time, the smallest roughness, the smallest cutting forces, the lowest power, the smallest value of energy consumed, or others. Different tools mean different results; and in large-scale or mass production, they affect not only the economy but also the qualitative side of machining (and other associated evaluation indicators such as tool life, etc.).
To verify the optimization model, the authors decided to compare three different cutting tools (cutting inserts) within the criteria functions set for cutting force Fc, machining power P and surface roughness characteristics Rz, all with two independent variables—cutting speed vc and feed f.
Note: The influence of the depth of cut ap on the variables has not been investigated because based on the experience of the authors, its influence on the values of the characteristics is the smallest of the technological factors and this insignificant limitation will significantly simplify the conditions of the pilot experiment.
The technology of turning with longitudinal external machining of the cylindrical surface was selected as the operation for the experiments according to a scheme shown in Figure 6. This technology was chosen because of the simple kinematic scheme of the process, which is easy to control, the possibility of a quasi-static process, the simplicity of setting the experiment factors, the simplicity of measuring the measured parameters, and the simplicity of designing and manufacturing the necessary tool.
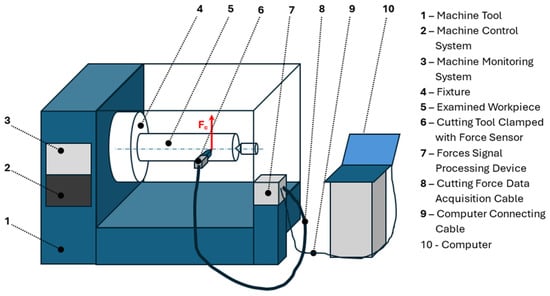
Figure 6.
The machining setup scheme.
The maximum height of surface roughness Rz was selected for evaluation because it has the following advantages over Ra [43,44]:
- (i)
- Rz is much more sensitive to extreme fluctuations in the surface profile—it provides better information about the extreme values of the measured surface, which have a significant impact on the functionality of the surface. In the case of scratches or grooves in the surface profile, this characteristic of surface roughness identifies them, which is important for surfaces participating in sealing systems;
- (ii)
- Rz correlates better with the functional properties of surfaces—the measured values are in direct relation with the surface properties affecting tightness, wear and friction properties;
- (iii)
- Rz is more suitable for quality control, because it is more sensitive in detecting surface defects that negatively affect its functionality.
- Surface roughness measurements were performed parallel with the workpiece axis with the measurements repeated three times.
The experimental and technological conditions were determined based on the properties of the investigated material and the selected tools, and an experimental plan was developed on their basis:
- (A)
- Machined material: 12 050.1 (C45 according to DIN EN, which corresponds to 1045 AISI/SAE steel), ϕ 170 mm—it is an unalloyed structural carbon steel produced to a range of 0.43 ÷ 0.50% Carbon and 0.60 ÷ 0.90% Manganese. It is a high strength steel intended for tempering, popular because of the good balance between machinability and mechanical properties, used primarily in gears, shafts, axles, studs, and other machine parts.
- (B)
- Cutting tools (Figure 7)—three tools designed for different types of machining were selected for comparison in order to determine the characteristics for their special orientation:
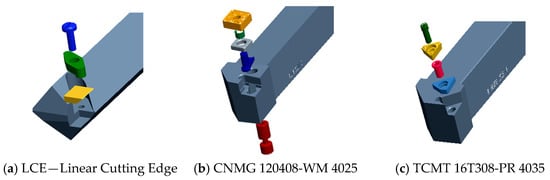 Figure 7. The cutting tools used for experiments.
- Tool with a linear cutting edge—self-designed at the Technical University of Košice (Figure 7a).
- Cutting geometry—angles in the tool coordinate system:
The angle of tool orthogonal rake γo1 = 0° The angle of tool orthogonal rake γo2 = 40° Cutting edge inclination angle λs1 = 40° Cutting edge inclination angle λs2 = 0° The angle of tool orthogonal clearance αo1 = 20° The angle of tool orthogonal clearance αo2 = 10° Negative chamfer 0.2 mm Corner radius rε = 0.5 mm
A tool with a linear cutting edge performs machining based on a free cut, with the chip being cut off only by the major cutting edge. This tool is suitable for machining at high feeds, since at low feeds there is a risk of vibrations caused by the small thickness of the chip, and even at high feeds it shows effective values of surface roughness characteristics after machining. Other advantages of a tool designed in this way include that any vibrations of the technological set can be eliminated by the position of the cutting-edge inclination or that the worn part of the cutting edge can be easily regenerated by parallel displacement in the direction of the cutting edge or by changing the position of the tool. The tool material is P30 according to ISO (C6 according to ANSI) with a TiN coating, and the tool is primarily intended for high- power finishing of external cylindrical surfaces.Recommended feed range 0.25–1.0 mm, cutting depth range 0.5–5 mm. - Commercial tool for fine-turning with wiper technology for low values of surface roughness characteristics at high feed rates-CNMG 120408-WM 4025 (Figure 7b)—cutting material GC4025 with CVD coating is intended for machining steels (P10 to P30 according to ISO) with a combination of high wear resistance and good edge stability.Recommended feed range 0.15–0.7 mm, cutting depth range 0.5–5 mm.
- Commercial tool TCMT 16T308-PR 4035 (Figure 7c)—recommended for use in common turning operations and cutting material GC4035 is a universal quality material (P20–P40 according to ISO) with CVD coating. It is intended for medium cutting speeds and feeds usable under adverse working conditions.Recommended feed range 0.12–0.35 mm, cutting depth range 0.2–2 mm.
Measuring of tool geometry was performed employing the profile projector—optical comparator Mitutoyo (Mitutoyo UK Ltd, Andover, Hampshire), with templates used: for radii: Mitutoyo RA1.34, no. 301394; for angles: Mitutoyo G01.34, no. 301395. Below, in Figure 8a, is shown a picture of the tip with linear cutting edge LCE, in Figure 8b is presented a shape of the cutting tip of Wiper CNMG 120408-WF 1525 tool during measuring the geometry on a projection profilometer Mitutoyo (Figure 8c), while the geometry of the individual cutting tips is presented in Figure 9.

Figure 8.
(a) Cutting tip of LCE tool; (b) tip shape of the Wiper CNMG 120408-WF 1525 tool; (c) tool geometry measuring by a projection profilometer.
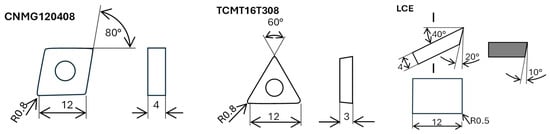
Figure 9.
The geometry of the individual cutting tips.
- (C)
- Machine: Lathe SUI 40;
- (D)
- Devices and instruments for measuring monitored and detected quantities;
- Mitutoyo Surftest 301 (Mitutoyo UK Ltd, Andover, Hampshire)—instrument for measuring the roughness characteristics of the machined surface;
- KISTLER dynamometer (Kistler GmbH, Wien, Austria)—instrument for measuring cutting force components—KISTLER 9411 sensor unit/KISTLER 5006 signal amplifier/KISTLER 5501 analogue indicators;
- Lutron DT 2235A (Lutron EA Ltd., London, UK)—digital contact tachometer for measuring cutting speed.
- (E)
- Machining conditions:
| Cooling | NO |
| Depth of cut | ap = 1 mm |
| Adjustment related to the workpiece axis | |
| Tool with LCE | h = 1 mm above the axis |
| CNMG 120408-WM | h = 0 mm—in the axis |
| TCMT 16T308-PR | h = 0 mm—in the axis |
| Feed per revolution—used values | f = 0.203/0.281/0.405/0.563/0.810 mm |
| Cutting speed—used values | vc = 70/84/100/120/145 m/min |
4. Results and Discussion
Based on the experimental plan, three measurements at the same setup characteristics were made, while surface roughness Rz and cutting force Fc as criterial dependencies on two independent variables—cutting speed vc and feed f—were selected. Three different tools were tested using external longitudinal turning technology.
The results obtained by experimental measurement were supplemented by the dependence of the required power P on both independent variables based on Equation (3), where for each measurement point determined independently by the variables (vc and f), the cutting power P = Fc vc was calculated, which, unlike theoretical power, also includes all resistances entering the technological operation (e.g., friction).
The measured values were statistically processed, and the Grubbs’ test was used to identify individual outliers, while no outliers were detected. The mean value was used to compare the influence of cutting conditions (feed, speed, depth of cut). The obtained data were subsequently processed in MATLAB software, version R2024a, using the methodology for evaluating the extreme (minimum) described in Section 3.1. and multivariate regression, while the following criterion functions and coefficients for individual tools were obtained (with R2 identifying strong dependencies):
Tool TCMT 16T308-PR 4035
Tool CNMG 120408-WM 4025
Tool LCE (Linear Cutting Edge)
The processed results are plotted in Figure 10, while all evaluated extrema of the desired criterion functions within studied range of variables are listed in Table 1.
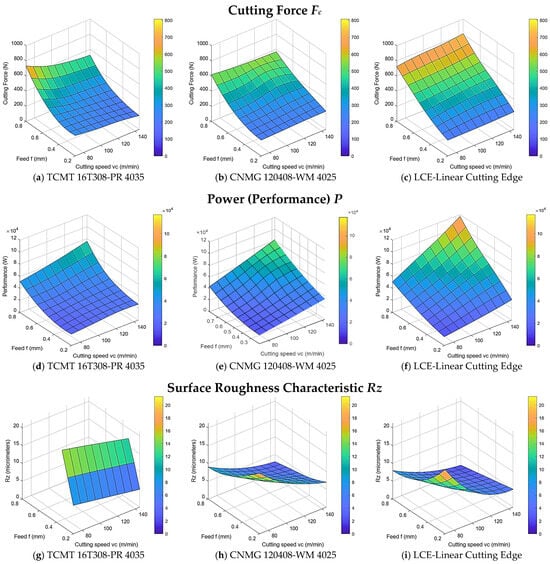
Figure 10.
Graphical interpretation of the experimental verification results.

Table 1.
All evaluated extrema of the desired criterion functions within studied range of variables are listed in Table 1.
The first comparison of the achieved results is in terms of the complete cutting forces. All three tools show a tendency for a small effect of cutting speed on the cutting force Fc and a significant effect of the increase in cutting speed Fc with increasing feed. TCMT tool—compared to the insensitivity of the remaining two tools to changes in cutting force Fc by changing the cutting speed vc, for this tool the cutting force Fc slightly decreases by increasing the cutting speed vc. The minimal cutting force is for the combination of experimental factors vc = 145 m.min−1 and f = 0.2 in the value of Fc = 196 N. The CNMG tool achieves the lowest value of the cutting force Fc at a feed of f = 0.2 mm in the entire range of used cutting speeds in the approximate value of Fc = 211 N. The LCE tool achieves the lowest value of the cutting force Fc at a feed of f = 0.2 mm in the entire range of used cutting speeds in the approximate value of Fc = 210 N. Based on Fc, it can be stated that the minimum value was found when machining with the TCMT tool, but the difference between the minimum cutting force values Fc achieved with all three tools is small, with the values for the CNMG and LCE tools being almost the same.
The second comparison of the achieved results is in terms of the cutting power that has in practice greater significance. For all three tools, a tendency of increasing cutting power with increasing values of both independent variables is shown. All tools reached the minimum of cutting power P at the combination of input factors vc = 70 m.min−1 and f = 0.2. Specifically, the TCMT tool has reached a minimum cutting power p = 19,040 W, the CNMG tool has reached p = 14,770 W and the LCE tool p = 14,700 W. The values p of both CNMG and LCE tools are again almost the same (similarly as it holds for Fc).
The third comparison of the achieved results is from the maximum height of the surface roughness Rz point of view. The TCMT tool shows a significant tendency for the Rz value to increase with increasing feed. The lowest Rz = 5.2 μm has been identified at the highest cutting speed vc = 145 m.min−1 and lowest feed f = 0.2 mm. The CNMG tool shows the smallest values of Rz ≅ 3.15 μm at the combination of the highest values of cutting speed vc and feed f (vc = 145 m.min−1 and 0.8 mm). When machining with the LCE tool, the lowest value of Rz = 2.2 μm has been achieved in combination of the highest values of both variables (vc = 145 m.min−1 and f = 0.8 mm).
An important fact is that for the dependence of the surface roughness Rz on the independent variables for the TCMT 16T308-PR 4035 tool, it was not possible (Figure 10g) to perform measurements for feeds greater than 0.405 mm, since the roughness values were outside the maximum measurement range of the roughness meter used. However, this fact is logical, since this tool is designed to work in the feed-range from 0.12 to 0.35 mm. For example, the tool with the wiping geometry CNMG 120408-WM 4025 has, according to the manufacturer, a recommended working feed range from 0.15 to 0.7 mm, which is twice as wide.
Taking into account the importance of individual criteria for real practice and the minimum extreme values achieved, it can be concluded that among the tools studied, the tool with a linear cutting edge (LCE) is the most suitable tool for longitudinal external machining under the given conditions, because it achieved the lowest extreme values for two evaluated criterial functions—cutting power P and surface roughness Rz (while at the same time the cutting force was also close to the minimum value).
The tool wear measurement was performed using a Carl-Zeiss measuring microscope (accuracy 0.01 mm) so that for each cutting speed there were 3 specific cutting wear curves using at least 5 measurements. The cutting wear criterion was set (e.g., for LCE it was VB = 0.4 mm—this value was chosen considering that the tool was intended for finishing and higher tool wear values could adversely affect the dimensional accuracy of the workpiece). The results were tested for outliers using the Grubs test. No outliers were identified; therefore, the measured data were subsequently statistically processed.
An example of captured wear/damage on the Wiper CNMG 120408-WF 1525 cutting tool is shown in Figure 11.
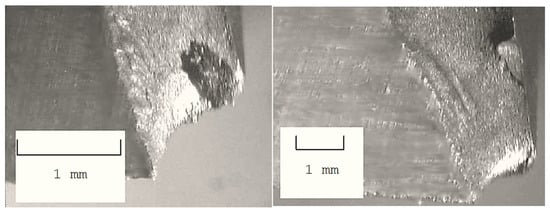
Figure 11.
An example of captured wear/damage on the Wiper CNMG 120408-WF 1525 cutting tool.
During machining, the formation of long helical chips (5.1 Long Conical Helical Chips) for a tool with a linear cutting edge and the formation of short conical helical chips (4.2 Short Washer-Type Helical Chips) for classic cutting tools (TCMT16T308-PR 4035 and CNMG120408-WM 4025) was recorded—according to DIN 3685 [45]—in all used combinations of independent variables.
5. Conclusions
In real terms, it is not always necessary for the product surface to be characterized by low roughness values. Achieving lower roughness values may cause higher energy consumption, but at higher cutting speeds and feeds, the operation will be performed earlier. The range determining the Process Power Efficiency (PPE) values is given by the combinations of cutting speed vc and feed f, in which the Rz values range from the maximum limits given by the drawing to the values (RzMAX-10%).
Based on our measurements and evaluation method, the values of these input factors (vc, f, …) can also be selected using an inverse approach, i.e., backwards based on the output requirements (criteria) set for the surface roughness.
The research presented in the paper is pilot research of the authors’ hypothesis called “Minimum production power” oriented on the creation of as the simplest model as possible to obtain knowledge and experiences for continuing processes efficiency increasing. The basis of this hypothesis is the assertion that for each production process of a given product, at given known requirements and conditions, it is possible to determine, from the point of view of need (specified criterion), the minimum/maximum physical local extremum using a model based on criterion functional dependence, that is, to find the most suitable conditions under which the criterion is achieved.
- To verify the model, experimentally obtained data for external longitudinal turning, as the kinematically and technologically simplest manufacturing operation, were processed and evaluated. Three tools with different characteristics were selected for the model verification: a classic commercially available universal tool TCMT16T308-PR 4035 for common machining operations with standard ranges of used technological factors; a commercially available tool CNMG120408-WM 4025 with a wiper geometry designed for very productive universal machining in twice the technological factor ranges compared to the first tool; and an original innovative author’s tool design with a linear cutting edge (LCE) for productive machining with very good values of surface roughness characteristics.
- After obtaining the dependences of experimentally measured and calculated data Fc, Rz and P on the input two independent variables of cutting speed vc and feed f for given conditions, these mathematical formulations were used to optimize the parameters entering the production process. When specifying the extrema of the function in a given range of variables, it was necessary to identify critical points and determine whether these points correspond to local extrema (in our case, minima).
- The evaluation of the behavior of the three tools used under the same conditions showed a diversity of results related to the established criterion. If the criterion of the smallest cutting force Fc had been established (which has a low practical significance for real practice), the most suitable tool would have been the commercially produced TCMT tool (with an achieved value of Fc = 196 N at the input parameters vc = 145 m.min−1 and f = 0.2 mm). However, for the criterion of the smallest roughness, the LCE tool (with the possibility of achieving a roughness of Rz = 2.2 μm at vc = 145 m.min−1 and f = 0.8 mm) was clearly the best, which also dominated from the point of view of the criterion of the lowest process power p = 14,700 W achieved at the same parameters. Therefore, taking into account the importance of individual criteria for real practice and the minimum extreme values achieved, it can be concluded that among the tools studied, the tool with a linear cutting edge (LCE) is the most suitable tool for longitudinal external machining under the given conditions.
Given the required simplicity of this initial model, the results achieved are partial and for future research, the authors plan to create a more complex model that will also include the volume of machining power and power consumption in the optimization.
Author Contributions
Conceptualization, P.P.M. and K.M.; methodology, P.P.M.; software, P.P.M.; validation, P.P.M. and O.B.; formal analysis, P.P.M. and M.R.; investigation, P.P.M.; resources, P.P.M. and M.R.; data curation, P.P.M., O.B., and K.M.; writing—original draft preparation, P.P.M.; writing—review and editing, K.M.; visualization, P.P.M.; O.B., and M.R.; supervision, P.P.M. and K.M.; project administration, P.P.M. and K.M.; funding acquisition, P.P.M. and K.M. All authors have read and agreed to the published version of the manuscript.
Funding
This research was funded by the Ministry of Education, Science, Research and Sport of the Slovak Republic by the grants APVV-19-0550 and KEGA 042TUKE-4/2025, as well as the CEEPUS agency within the network SK-2026-01-2526.
Institutional Review Board Statement
Not applicable.
Data Availability Statement
The data are contained within the article.
Acknowledgments
The authors would like to express their gratitude to the Ministry of Education, Science, Research and Sports of the Slovak Republic for research support provided through the grants APVV-19-0550 and KEGA 042TUKE-4/2025, as well as the CEEPUS agency within the network SK-2026-01-2526.
Conflicts of Interest
The authors declare no conflicts of interest.
Abbreviations
The following abbreviations are used in this manuscript:
| 3P | People-Planet-Profit/after 2018 in version People-Planet-Prosperity |
| CNMG | Cutting tool with wiper geometry |
| LCE | Tool with linear cutting edge |
| PR | Production rate |
| TCMT | Tool for general purposes |
| LCE | Linear cutting edge |
References
- Bohr, N.; Noll, W. Atomic Physics and Human Knowledge. Am. J. Phys. 1958, 26, 596–597. [Google Scholar] [CrossRef]
- Virilio, P. Speed and Politics; (Originally Published in 1977); Semiotext(e): Los Angeles, CA, USA, 2007; ISBN-10: 1-58435-040-7. [Google Scholar]
- Jeurissen, R. Cannibals With Forks: The Triple Bottom Line of 21st Century Business. J. Bus. Ethics 2000, 23, 229–231. [Google Scholar] [CrossRef]
- Elkington, J. 25 Years Ago I Coined the ‘Triple Bottom Line.’ Here’s Why It’s Time to Rethink It. Harv. Bus. Rev. 2018, 25, 6. [Google Scholar]
- Meadows, D.H. Thinking in Systems; Chelsea Green Publishing: White River Junction, VT, USA, 2015. [Google Scholar]
- Scott, J.C. Seeing Like a State; Yale University: New Haven, CT, USA, 1998; ISBN 0-300-07016-0. [Google Scholar]
- Patole, P.B.; Pol, G.J.; Desai, A.A.; Kamble, S. Analysis of effect of cutting parameters on surface roughness and cutting force during turning of aluminum alloy (AlSi5Cu3). Manuf. Technol. Today 2021, 20, 3–8. [Google Scholar]
- Kumar, R.; Pattnaik, S.K.; Minz, J.K.; Sarangi, S.K. Influence of cutting parameters on cutting forces and surface roughness in dry turning of Al using PCD and different coated tools. Sādhanā 2019, 44, 1–17. [Google Scholar] [CrossRef]
- Rezvan Rostami, R.; Abedini, V. Experimental study on surface roughness and cutting force in turning of Al7032 reinforced with SiC using Taguchi design. Modares Mech. Eng. 2021, 8, 69–76. [Google Scholar]
- Asavarutpokin, A.; Sae-Lee, J.; Kaewdook, D. Power consumption and surface quality optimization of cutting conditions for S50C material in turning process using means utility concept and Taguchi method. J. Eng. Digit. Technol. 2020, 8, 58–62. [Google Scholar]
- Thandra, S.K.; Choudhury, S.K. Effect of cutting parameters on cutting force, surface finish and tool wear in hot machining. Int. J. Mach. Mach. Mater. 2010, 8, 260–273. [Google Scholar] [CrossRef]
- Bhattacharya, A.; Das, S.; Majumder, P.; Yadava, V. Estimating the effect of cutting parameters on surface finish and power consumption during high-speed machining of AISI 1045 steel using Taguchi design and ANOVA. Prod. Eng. 2009, 3, 31–40. [Google Scholar] [CrossRef]
- El-Kady, E.Y.; Gaafer, A.M.; Ghaith MH, G.; Khalil, T.; Mostafa, A.A. The effect of machining parameters on the cutting forces, tool wear, and machined surface roughness of metal matrix nano composite material. Adv. Mater. 2015, 4, 43–50. [Google Scholar] [CrossRef]
- Duman, E.; Özel, T. Prediction and optimization of surface roughness and cutting forces in turning process using ANN, SHAP analysis, and hybrid MCDM method. Appl. Sci. 2024, 14, 11386. [Google Scholar]
- Varga, J.; Szakálos, P. The effects of cutting parameters on cutting force and tribological properties of machined surface under dry turning of AISI304L austenitic stainless steel. J. Manuf. Mater. Process. 2024, 8, 257. [Google Scholar]
- Jeulin, M.; Cahuc, O.; Darnis, P.; Laheurte, R. A 6-components mechanistic model of cutting forces and moments in milling. Forces Mech. 2022, 9, 100130. [Google Scholar] [CrossRef]
- Wen, Y.; Zhou, W.; Tang, J. Composite effects of residual stress and hardness gradient on contact fatigue performance of rough tooth surfaces and optimization design of de-tailed characteristic parameters. Eng. Fail. Anal. 2024, 162, 108424. [Google Scholar] [CrossRef]
- Jaurker, D.; Pradhan, M.K.; Jaurker, S.; Malviya, R. Optimization Techniques Used in Machining Processes: A Review. In Recent Advances in Materials and Manufacturing Technology; ICAMMT 2022. Lecture Notes in Mechanical, Engineering; Nayak, R.K., Pradhan, M.K., Mandal, A., Davim, J.P., Eds.; Springer: Singapore, 2023. [Google Scholar] [CrossRef]
- Xun, C.; Wu, P. A Generic Multi-Objective Optimization of Machining Processes Using an End-to-End Evolutionary Algorithm. Machines 2024, 12, 635. [Google Scholar] [CrossRef]
- Chang, L.; Patel, Y.; Wang, H.; Williams, J.G. The Partitioning of Plastic Energy in Cutting Tests. Procedia Struct. Integr. 2016, 2, 309–315. [Google Scholar] [CrossRef][Green Version]
- Ngoc, T.B.; Duc, T.M.; Tuan, N.M.; Long, T.T. Influence of Al2O3/MoS2 hybrid nanofluid MQL on surface roughness, cutting force, tool wear and tool life in hard turning. Forces Mech. 2024, 16, 100285. [Google Scholar] [CrossRef]
- Mejri, H.; Mehdi, K. Modeling of cutting forces in curvilinear peripheral milling process. Int. J. Adv. Manuf. Technol. 2019, 102, 277–291. [Google Scholar] [CrossRef]
- KBounif, M.; Abbadi, M.; Nouari, R. Selvam, A numerical approach for crack-induced damage in tungsten carbide cutting tools during machining. Eng. Fail. Anal. 2021, 128, 105617. [Google Scholar] [CrossRef]
- ISO 14040:2006; Environmental Management—Life Cycle Assessment—Principles and Framework. International Organization for Standardization: Geneva, Switzerland, 2006; Edition 2, ISO/TC 207/SC 5. p. 20.
- ISO 14044:2006; Environmental Management—Life Cycle Assessment—Requirements and Guidelines. International Organization for Standardization: Geneva, Switzerland, 2006; Edition 1, ISO/TC 207/SC 5. p. 46.
- Karmiris-Obratanski, P.; Thangaraj, M.; Leszczyńska-Madej, B.; Markopoulos, A.P. Advanced Machining Technology for Modern Engineering Materials. Materials 2024, 17, 2064. [Google Scholar] [CrossRef]
- Grzeszik, W. Advanced Machining Processes of Metallic Materials, Theory, Modelling, and Applications; Elsevier: Amsterdam, The Netherlands, 2017; ISBN 978-0-444-63711-6. [Google Scholar]
- Gutowski, T.; Jiang, S.; Cooper, D.; Corman, G.; Hausmann, M.; Manson, J.A.; Sekulic, D.P. Note on the Rate and Energy Efficiency Limits for Additive Manufacturing. J. Ind. Ecol. 2017, 21, S69–S79. [Google Scholar] [CrossRef]
- Mehdi, K.; Monka, P.P.; Monkova, K.; Sahraoui, Z.; Glaa, N.; Kascak, J. Investigation of Dynamic Behavior and Process Stability at Turning of Thin-Walled Tubular Workpieces Made of 42CrMo4 Steel Alloy. Machines 2024, 12, 120. [Google Scholar] [CrossRef]
- Monka, P.P.; Monkova, K.; Majstorovic, V.D.; Božić, Ž.; Andrej, A. Optimal cutting parameter specification of newly designed milling tools based on the frequency monitoring. Int. J. Adv. Manuf. Technol. 2021, 115, 777–794. [Google Scholar] [CrossRef]
- DIN 8580:2022-12; Manufacturing Processes—Terms and Definitions, Division. German Institute for Standardisation: Berlin, Germany, 2022; p. 25.
- Lampropoulos, A.D.; Markopoulos, A.P.; Manolakos, D.E. Modeling of Ti6Al4V Alloy Orthogonal Cutting with Smooth Particle Hydrodynamics: A Parametric Analysis on Formulation and Particle Density. Metals 2019, 9, 388. [Google Scholar] [CrossRef]
- Monkova, K.; Monka, P.P.; Sekerakova, A.; Hruzik, L.; Burecek, A.; Urban, M. Comparative Study of Chip Formation in Orthogonal and Oblique Slow-Rate Machining of EN 16MnCr5 Steel. Metals 2019, 9, 698. [Google Scholar] [CrossRef]
- Stal, J.E.; De Vos, P. Metal Cutting: Theories and Models; CRC Press: Boca Raton, FL, USA, 2012; ISBN 9789163713361. [Google Scholar]
- Živković, A.M.; Zeljković, M.V.; Mlađenović, C.D.; Tabaković, S.T.; Milojević, Z.L.; Hadžistević, M.J. A Study of Thermal Behavior of the Machine Tool Spindle. Therm. Sci. 2019, 23, 2117–2130. [Google Scholar] [CrossRef]
- Karmiris-Obratański, P.; Papazoglou, E.L.; Leszczyńska-Madej, B.; Karkalos, N.E.; Markopoulos, A.P. An Optimalization Study on the Surface Texture and Machining Parameters of 60CrMoV18-5 Steel by EDM. Materials 2022, 15, 3559. [Google Scholar] [CrossRef]
- Mladjenovic, C.; Monkova, K.; Zivkovic, A.; Knezev, M.; Marinkovic, D.; Ilic, V. Experimental Identification of Milling Process Damping and Its Application in Stability Lobe Diagrams. Machines 2025, 13, 96. [Google Scholar] [CrossRef]
- Available online: https://www.hoffmann-group.com (accessed on 19 November 2024).
- Available online: https://www.kennametal.com (accessed on 14 October 2024).
- Available online: https://www.sandvik.coromant.com (accessed on 25 November 2024).
- Available online: https://www.walter-tools.com (accessed on 19 November 2024).
- Vargova, M.; Tavodova, M.; Monkova, K.; Dzupon, M. Research of Resistance of Selected Materials to Abrasive Wear to Increase the Ploughshare Lifetime. Metals 2022, 12, 940. [Google Scholar] [CrossRef]
- Michael Quinten: A Practical Guide to Surface Metrology; Springer Nature: Cham, Switzerland, 2019; ISBN 978-3-030-29454-0.
- Rodrigues, A.C.P.; Ribeiro, P.J.N.; Österle, W.; Azevedo, C.R.D.F. Failure analysis as a tool to optimize the design of a ring on disc tribotest investigating the role of surface roughness. Eng. Fail. Anal. 2015, 56, 131–141. [Google Scholar] [CrossRef]
- ISO 3685:1993; Tool-Life Testing with Single-Point Turning Tools. International Organization for Standardization: Geneva, Switzerland, 2017; ISO/TC 29/SC 9. p. 48.


Disclaimer/Publisher’s Note: The statements, opinions and data contained in all publications are solely those of the individual author(s) and contributor(s) and not of MDPI and/or the editor(s). MDPI and/or the editor(s) disclaim responsibility for any injury to people or property resulting from any ideas, methods, instructions or products referred to in the content. |
© 2025 by the authors. Licensee MDPI, Basel, Switzerland. This article is an open access article distributed under the terms and conditions of the Creative Commons Attribution (CC BY) license (https://creativecommons.org/licenses/by/4.0/).