Article

Research on the Dynamic Response of a Cracked-Spur Gear System with Parameter Uncertainty

1
School of Mechanics and Aerospace Engineering, Southwest Jiaotong University, Chengdu 610031, China
2
Key Laboratory of Vibration and Control of Aero-Propulsion System Ministry of Education, Northeastern University, Shenyang 110819, China
*
Author to whom correspondence should be addressed.
Machines 2025, 13(5), 395; https://doi.org/10.3390/machines13050395
Submission received: 14 March 2025 / Revised: 8 April 2025 / Accepted: 9 April 2025 / Published: 9 May 2025
(This article belongs to the Section Machines Testing and Maintenance)

Abstract

In this paper, the time-varying mesh stiffness (TVMS) of a gear is meticulously derived using the potential energy method (PEM) and an analytical expression for it is obtained. Subsequently, calculations are performed to determine the effects of crack depth and crack angle on the TVMS. The validation is carried out using the finite element method (FEM). Then, a discussion is carried out on the dynamic characteristics of a spur gear system with a crack. Moreover, uncertainty is an objective reality in gear systems, arising from various factors such as the material properties and working environment. To enable a more reasonable evaluation of the dynamic characteristics of the spur gear system, this paper presents a deviation of an uncertainty interval analysis method based on Chebyshev polynomials. A dynamic model of the spur gear system with uncertain parameters is then proposed. The dynamic response of a gear transmission system with these uncertain parameters is investigated in detail. Additionally, the interval response of a gear system with root cracks under uncertainty is further investigated. The experimental results confirm the inherent presence of uncertainty in the gear system and validate the effectiveness of the proposed uncertainty analysis method.

1. Introduction

Gears are essential components in industrial systems, serving a pivotal role in power transmission. They find extensive applications across various sectors such as aerospace, energy, and machinery [1,2]. Owing to material defects, machining errors, harsh working conditions, or the reaching of fatigue limits, faults can occur in gear pairs, such as root cracks, tooth surface pitting, or tooth breakage [3]. These faults can give rise to abnormal vibrations, which have the potential to trigger the failure of the entire system and even lead to safety incidents. Consequently, gaining a more profound understanding of the dynamic characteristics of faulty gear systems is of the utmost importance for the monitoring and maintenance of gear equipment. Root cracks are among the most prevalent faults in gear systems. During the early stage of crack formation, it is extremely challenging to capture the vibration characteristics caused by the crack because of the interference from noise signals. However, under cyclic loading, the crack in the gear tooth may propagate quickly, potentially leading to tooth failure within a short time. Therefore, accurately calculating the time-varying mesh stiffness (TVMS) of a cracked gear is of the utmost importance for conducting a comprehensive analysis of gear fault characteristics and achieving effective fault diagnosis [4]. The methods commonly employed for calculating the TVMS primarily encompass the finite element method (FEM) and the potential energy method (PEM) [5]. The FEM exhibits remarkable adaptability when dealing with complex structures. Nevertheless, its modeling procedure is intricate and computationally demanding. Conversely, the PEM has gained extensive popularity in research circles. This can be attributed to its straightforward modeling approach and high-efficiency computation. When it comes to general structures, the PEM can achieve an accuracy on par with that of the FEM [6]. Yang et al. [7] divided the meshing potential energy into three parts: bending energy, axial compressive energy, and Hertzian contact energy. Subsequently, they carried out the calculation of the meshing stiffness. Tian [8] further considered the shear deflection and proposed a local meshing fault simulation method based on meshing tooth parameters and then analyzed the typical local meshing faults. Wu et al. [9] refined the formula of the potential energy method. More specifically, they delved into the impact of varying root crack depths on the TVMS. Moreover, they conducted an analysis of the sensitivity of several statistical indicators to crack propagation. Mohammed et al. [10] substituted the straight-line model with a parabolic one to more accurately account for the volume loss due to cracks. This approach effectively addressed the problem of substantial calculation errors in meshing stiffness that typically occur under severe crack conditions. Ma et al. [11] proposed an improved meshing stiffness model that considers the misalignment between the root circle and the base circle of the gear. Subsequently, they made a comparison of meshing stiffness values corresponding to different crack paths. Liang et al. [12] derived the equation used to calculate the TVMS in cases of single-tooth and multi-tooth pitting. Moreover, they established the correlation between the severity of pitting and the TVMS. Saxena et al. [13] took into account the coupling effects of shaft misalignment and friction. Subsequently, they carried out a detailed analysis of the TVMS in spur gear pairs with cracks. Yu et al. [14] carried out an in-depth analysis of the influence that spatial crack propagation exerts on the TVMS as well as the load-sharing ratio. Luo et al. [15] conducted a comprehensive study on the impact of the variation in gear center distance on both intact and cracked gear pairs. Huang et al. [16] investigated the PEM with slice theory to explore how four different crack types affect the meshing stiffness of helical gear pairs. Jiang et al. [17] developed a meshing model that considered the deflection of the gear body. Subsequently, they investigated how root cracks impact the TVMS of the cracked teeth and their neighboring teeth. Meng et al. [18] proposed a segmented stiffness method to investigate the evolution of dynamic responses in both the time and frequency domains during gear fault propagation. Yang et al. [19] introduced a calculation method for the TVMS that places emphasis on the crack position. The purpose of this method is to more accurately predict the meshing stiffness of spur gear pairs suffering from both root and surface cracks. Zhou et al. [20] proposed an enhanced spur gear pair model, where the delayed disengagement of the contact point caused by root cracks was taken into consideration. As the industry advances and the requirements for the performance and reliability of gear systems continue to grow, quantifying the uncertainties within the model has emerged as an especially crucial task [21]. In gear systems, there is a wide array of uncertainty sources, such as the material properties, boundary conditions, and system parameters [22]. Tobe et al. [23,24] performed experimental studies to verify the stochastic nature of transmission errors in gear systems. Kumar et al. [25] deduced the equivalent discrete equations for the spur gear system and examined how the stochastic transmission error influences the dynamic load factor. Gelman et al. [26] concurrently took into account the stochastic transmission error, stochastic initial conditions, and stochastic meshing stiffness. They subsequently investigated the relationship between the dynamic mean excitation and the average transmitted load within the gear system. Deng et al. [27] established a system model in which gear profiles were treated as random variables. On this basis, they carried out an analysis of the amplitude–frequency response of the system according to the stochastic errors. Chen et al. [28] investigated the nonlinear dynamic behavior of gear systems subjected to random error excitation. Yang [29] investigated the vibration behavior of multi-meshing gear systems under the combined effects of deterministic and stochastic loading. Wen et al. [30] considered both the TVMS and the tooth flank clearance nonlinearity within gear systems. As a result, they employed the path integral method to determine the stochastic response in the probability domain. Wei et al. [31] set up a torsional vibration model for the gear transmission system and investigated the impact of interval parameters on the dynamic response of the system. Beyaoui et al. [32] constructed a polynomial chaos method to describe the uncertainty caused by stochastic disturbances from aerodynamic torque. Guerine et al. [33] developed a polynomial chaos approach to characterize the uncertainties induced by stochastic perturbations stemming from aerodynamic torque. Mabrouk et al. [34] employed the polynomial chaos method to explore the vibration characteristics of bevel gear systems featuring uncertainties in the power coefficient parameter. Fang et al. [35] developed a nonlinear dynamic model that took into account TVMS, clearance, sliding friction, and stochastic external loads. Subsequently, they analyzed how stochastic external loads and friction impact the transient characteristics of the gear pair. Ma et al. [36] proposed a boundary-corrected interval analysis approach based on Chebyshev polynomial expansion and modal superposition. Wei et al. [37] improved the efficiency of the Chebyshev interval analysis method by incorporating the least squares technique and subsequently carried out experiments to investigate the effects of various uncertain parameters on the amplitude–frequency response of the gear system. Chen et al. [38] introduced an uncertain tribodynamics model considering correlations, revealing the effect of correlated uncertainties in lubricant properties on the tribological performance of the gear. Hu et al. [39] proposed a gear system model considering the uncertainty of shaft misalignment and used interval analysis of Chebyshev inclusion functions and optimization methods for analysis. To date, although a substantial amount of research has been conducted on the dynamic characteristics of gear systems, studies focusing on the coupled effects of crack faults and parameter uncertainties remain relatively scarce. In fact, exploring this coupling is of great significance for enhancing the operational stability and safety of gear systems.
The structure of this paper is organized as follows: In Section 1, the research on the TVMS of gear pairs and the studies on gear systems with uncertainty factors are introduced. In Section 2, the models for both healthy gears and gears with root cracks are established. Meanwhile, the analytical solutions for the TVMS using the potential energy method are derived. To ensure the accuracy and reliability of the analytical results, the verification is achieved through the finite element method. After that, the dynamic response results of the deterministic gear system with a root crack are detailed in Section 3. Here, we present a thorough analysis of how the system behaves under the influence of a root crack in a deterministic setting, offering valuable insights into the fundamental dynamic characteristics of the cracked gear system. Section 4 elaborates on the principles of the Chebyshev interval uncertainty analysis method, enabling the reader to understand how it can be applied to handle uncertainties in gear system analysis. In Section 5, the dynamic responses of the uncertain gear system are studied, in which different levels of parameter uncertainties are taken into account. To support the theoretical analysis and numerical simulation given in the previous sections, the experimental studies performed on a gear test rig are conducted in Section 6, where some practical issues need to be addressed. Finally, the conclusions of this study are presented in Section 7.

2. Modeling and Verification of Time-Varying Mesh Stiffness

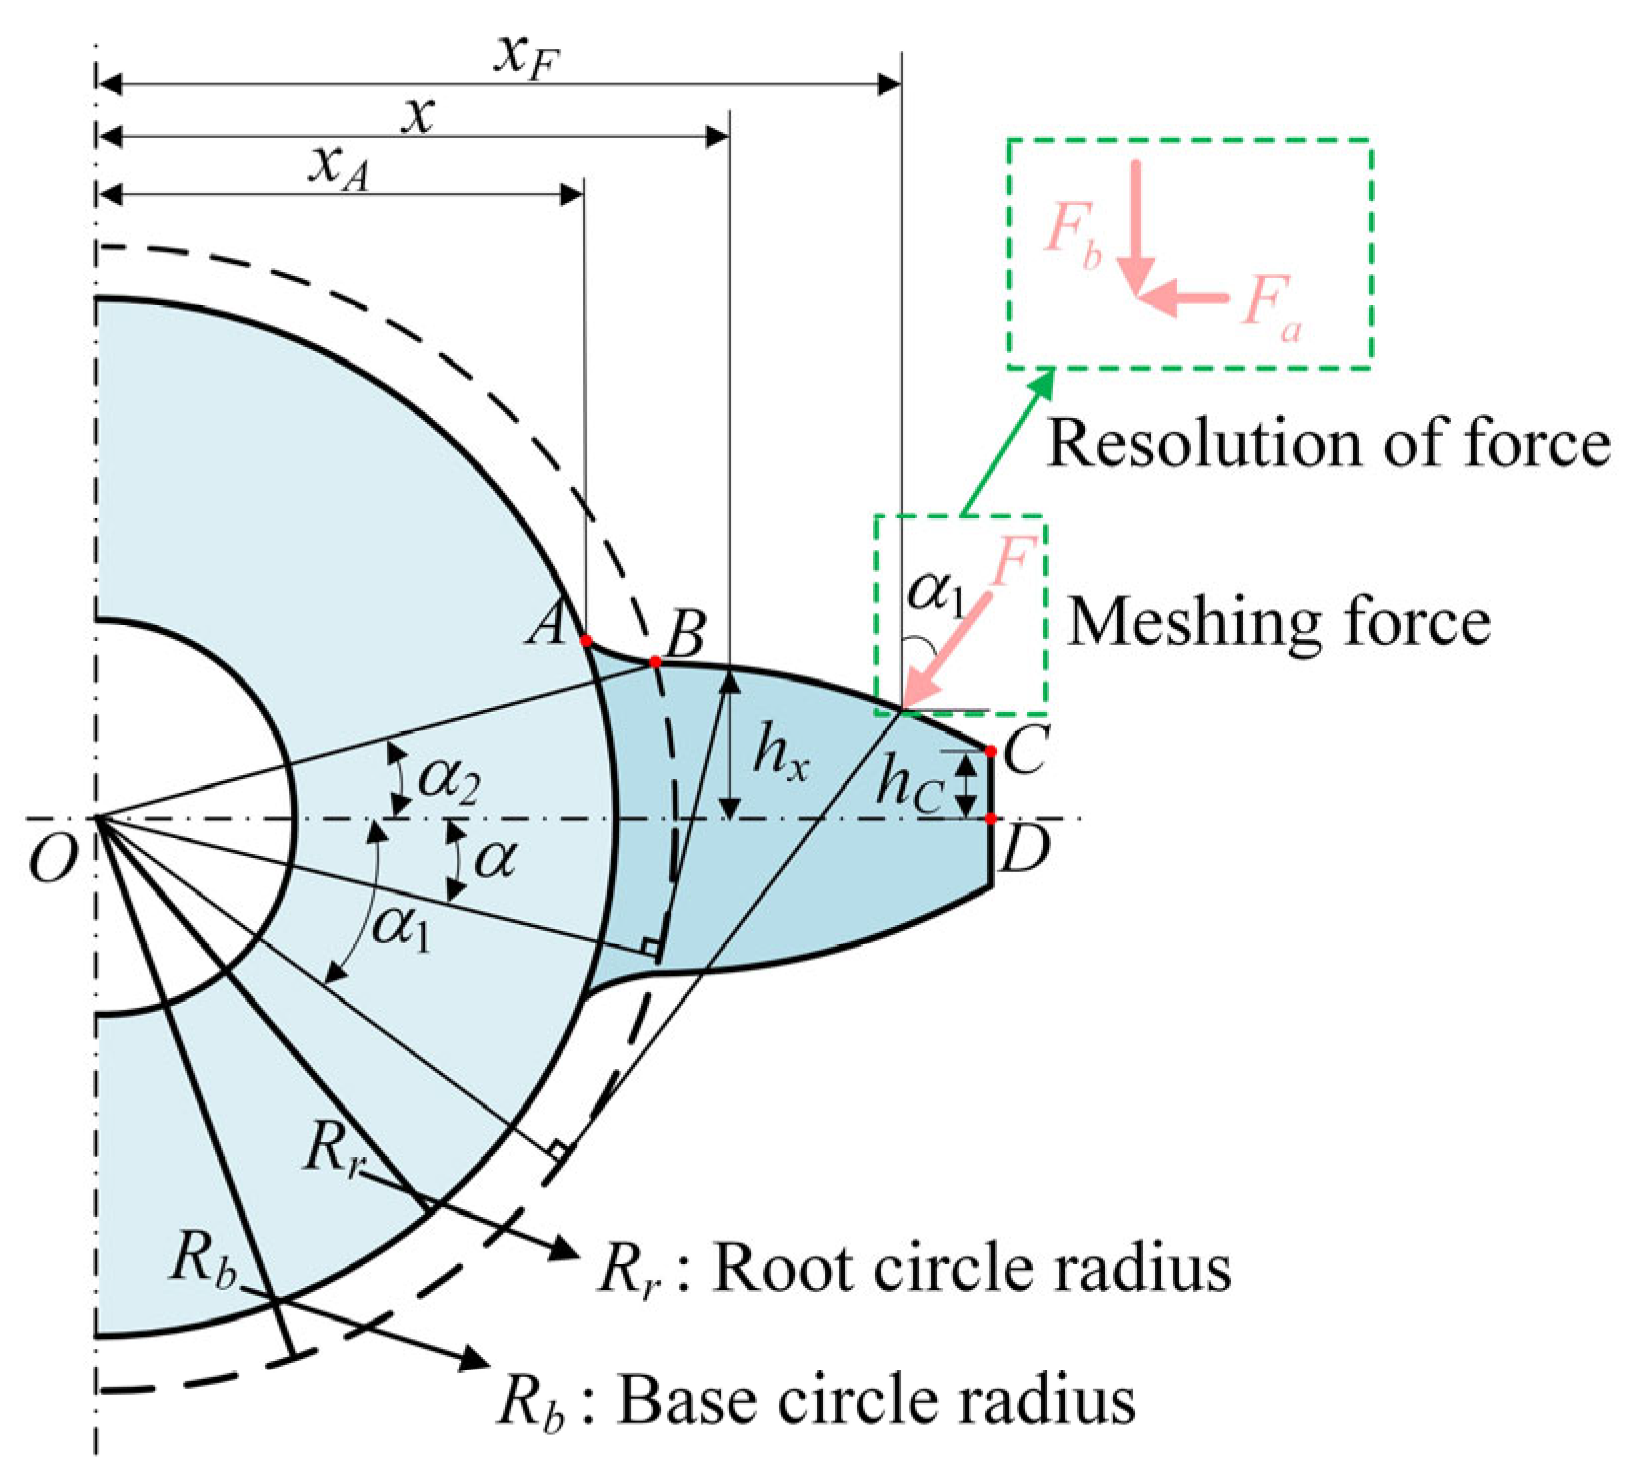
2.1. Time-Varying Mesh Stiffness of Healthy Spur Gear Pair

As depicted in Figure 1, the gear tooth is regarded as a variable cross-section cantilever beam bounded by the root circle. The tooth profile is composed of three segments: AB represents the transition curve, BC denotes the involute curve, and CD denotes the addendum curve. Based on the PEM, the axial compression energy U a , bending energy U b , and shear energy U s during the gear meshing process can be expressed as
U a = F 2 2 k a = x A x F F a 2 2 E A x d x
U b = F 2 2 k b = x A x F F b ( x F x ) F a h 2 2 E I x d x
U s = F 2 2 k s = x A x F 1.2 F b 2 2 G A x d x
where F a and F b represent the orthogonal components of the contact force F, k a , k b and k s denote the axial compression, bending, and shear stiffness, respectively, E and G denote Young’s modulus and shear modulus, and I x and A x represent the moment of inertia and area of the section where the distance from the point O is x.
The transition curve shown in the above figure can be mathematically described as follows
x = R p cos ϕ ( a 1 sin γ + r ) sin ( γ ϕ ) y = R p sin ϕ ( a 1 sin γ + r ) cos ( γ ϕ ) , α 0 γ π / 2
where R p denotes the radius of the pitch circle. The conditions, including ϕ = a 1 / tan γ + b 1 / R p , a 1 = h a + c m r , b 1 = π m / 4 + h a m tan α 0 + r cos α 0 , and r = c m / 1 sin α 0 , are satisfied. γ is a variable parameter, α 0 is the pressure angle, h a is the addendum coefficient, and c is the addendum clearance coefficient.
Moreover, the mathematical expression of the involute curve is given by
x = R p cos ϕ ( a 1 sin γ + r ) sin ( γ ϕ ) y = R p sin ϕ ( a 1 sin γ + r ) cos ( γ ϕ ) , α 0 γ π / 2
By combining the transition curve and the involute curve, I x and A x can be further expressed as
I x = 2 3 h x 3 L
A x = 2 h x L
where h x is expressed in a piecewise form, that is
h x = h x 1 = R p sin ϕ a 1 sin γ + r cos γ ϕ , x A x x B h x 2 = R b α 2 + α cos α sin α , x B < x x C
where L is the tooth width, α 1 represents the angle of gear rotation, and α 2 represents the half of the base tooth angle, so that
α 2 = π 2 N + inv α
By substituting Equations (6)–(9) into Equations (1)–(3), the analytical expressions of axial compression stiffness k a , bending stiffness k b , and shear stiffness k s can be obtained as follows
1 k a = π 2 α 0 sin 2 α 1 2 E L R p sin ϕ a 1 sin γ + r cos γ ϕ d x 1 d γ d γ + α 2 α 1 sin 2 α 1 2 E L R b sin α + α 2 α cos α d x 2 d α d α
1 k b = π 2 α 0 3 1 α + α 2 sin α + cos α cos α 1 2 2 E L R p sin ϕ a 1 sin γ + r cos γ ϕ 3 d x 1 d γ d γ + α 2 α 1 3 1 α + α 2 sin α + cos α cos α 1 2 2 E L R b sin α + α 2 α cos α d x 2 d α d α
1 k s = π 2 α 0 1.2 1 + ν cos 2 α 1 E L R p sin ϕ a 1 sin γ + r cos γ ϕ d x 1 d γ d γ + α 2 α 1 1.2 1 + ν cos 2 α 1 E L R b sin α + α 2 α cos α d x 2 d α d α
where the calculations of d x 1 d γ and d x 2 d α satisfy the following condition
d x 1 d γ = a 1 sin a 1 / tan γ + b 1 R p 1 + tan 2 γ tan 2 γ + a 1 cos γ sin 2 γ sin γ a 1 / tan γ + b 1 R p a 1 sin γ + r cos γ a 1 / tan γ + b 1 R p 1 + a 1 1 + tan 2 γ R p tan 2 γ
d x 2 d α = R b α 2 + α cos α
Assuming that the gear teeth are made of identical, isotropic elastic materials, the Hertzian contact stiffness between the meshing teeth remains constant along the entire line of action and is independent of the contact position. This constant can be expressed as
1 k h = 4 1 υ 2 π E L
where υ represents the Poission ratio.
In addition, the gear base deforms during the meshing process, and the stiffness of the fillet-foundation region also influences the overall mesh stiffness. Due to the complexity of accurately calculating this stiffness, an effective empirical formula is introduced, that is
1 k f = cos 2 α 1 E L L * u f S f 2 + M * u f S f + P * 1 + Q * tan 2 α 1
X i * h f i , θ f = A i θ f 2 + B i h f 2 + C i h f i θ f + D i θ f + E i h f i + F i
where X i * represents L * , M * , P * , and Q * . The empirical parameters A i , B i , C i , D i , E i , and F i can be obtained from the reference [20].
In summary, the meshing stiffness of a healthy spur gear pair is obtained and can be expressed as
k t = 1 1 k b 1 + 1 k b 2 + 1 k a 1 + 1 k a 2 + 1 k s 1 + 1 k s 2 + 1 k f 1 + 1 k f 2 + 1 k h ,   single-tooth   meshing i = 1 2 1 1 k b 1 i + 1 k b 2 i + 1 k a 1 i + 1 k a 2 i + 1 k s 1 i + 1 k s 2 i + 1 k f 1 i + 1 k f 2 i + 1 k h i ,   double-tooth   meshing
where the subscripts 1 and 2 denote the driving gear and the driven gear, respectively.

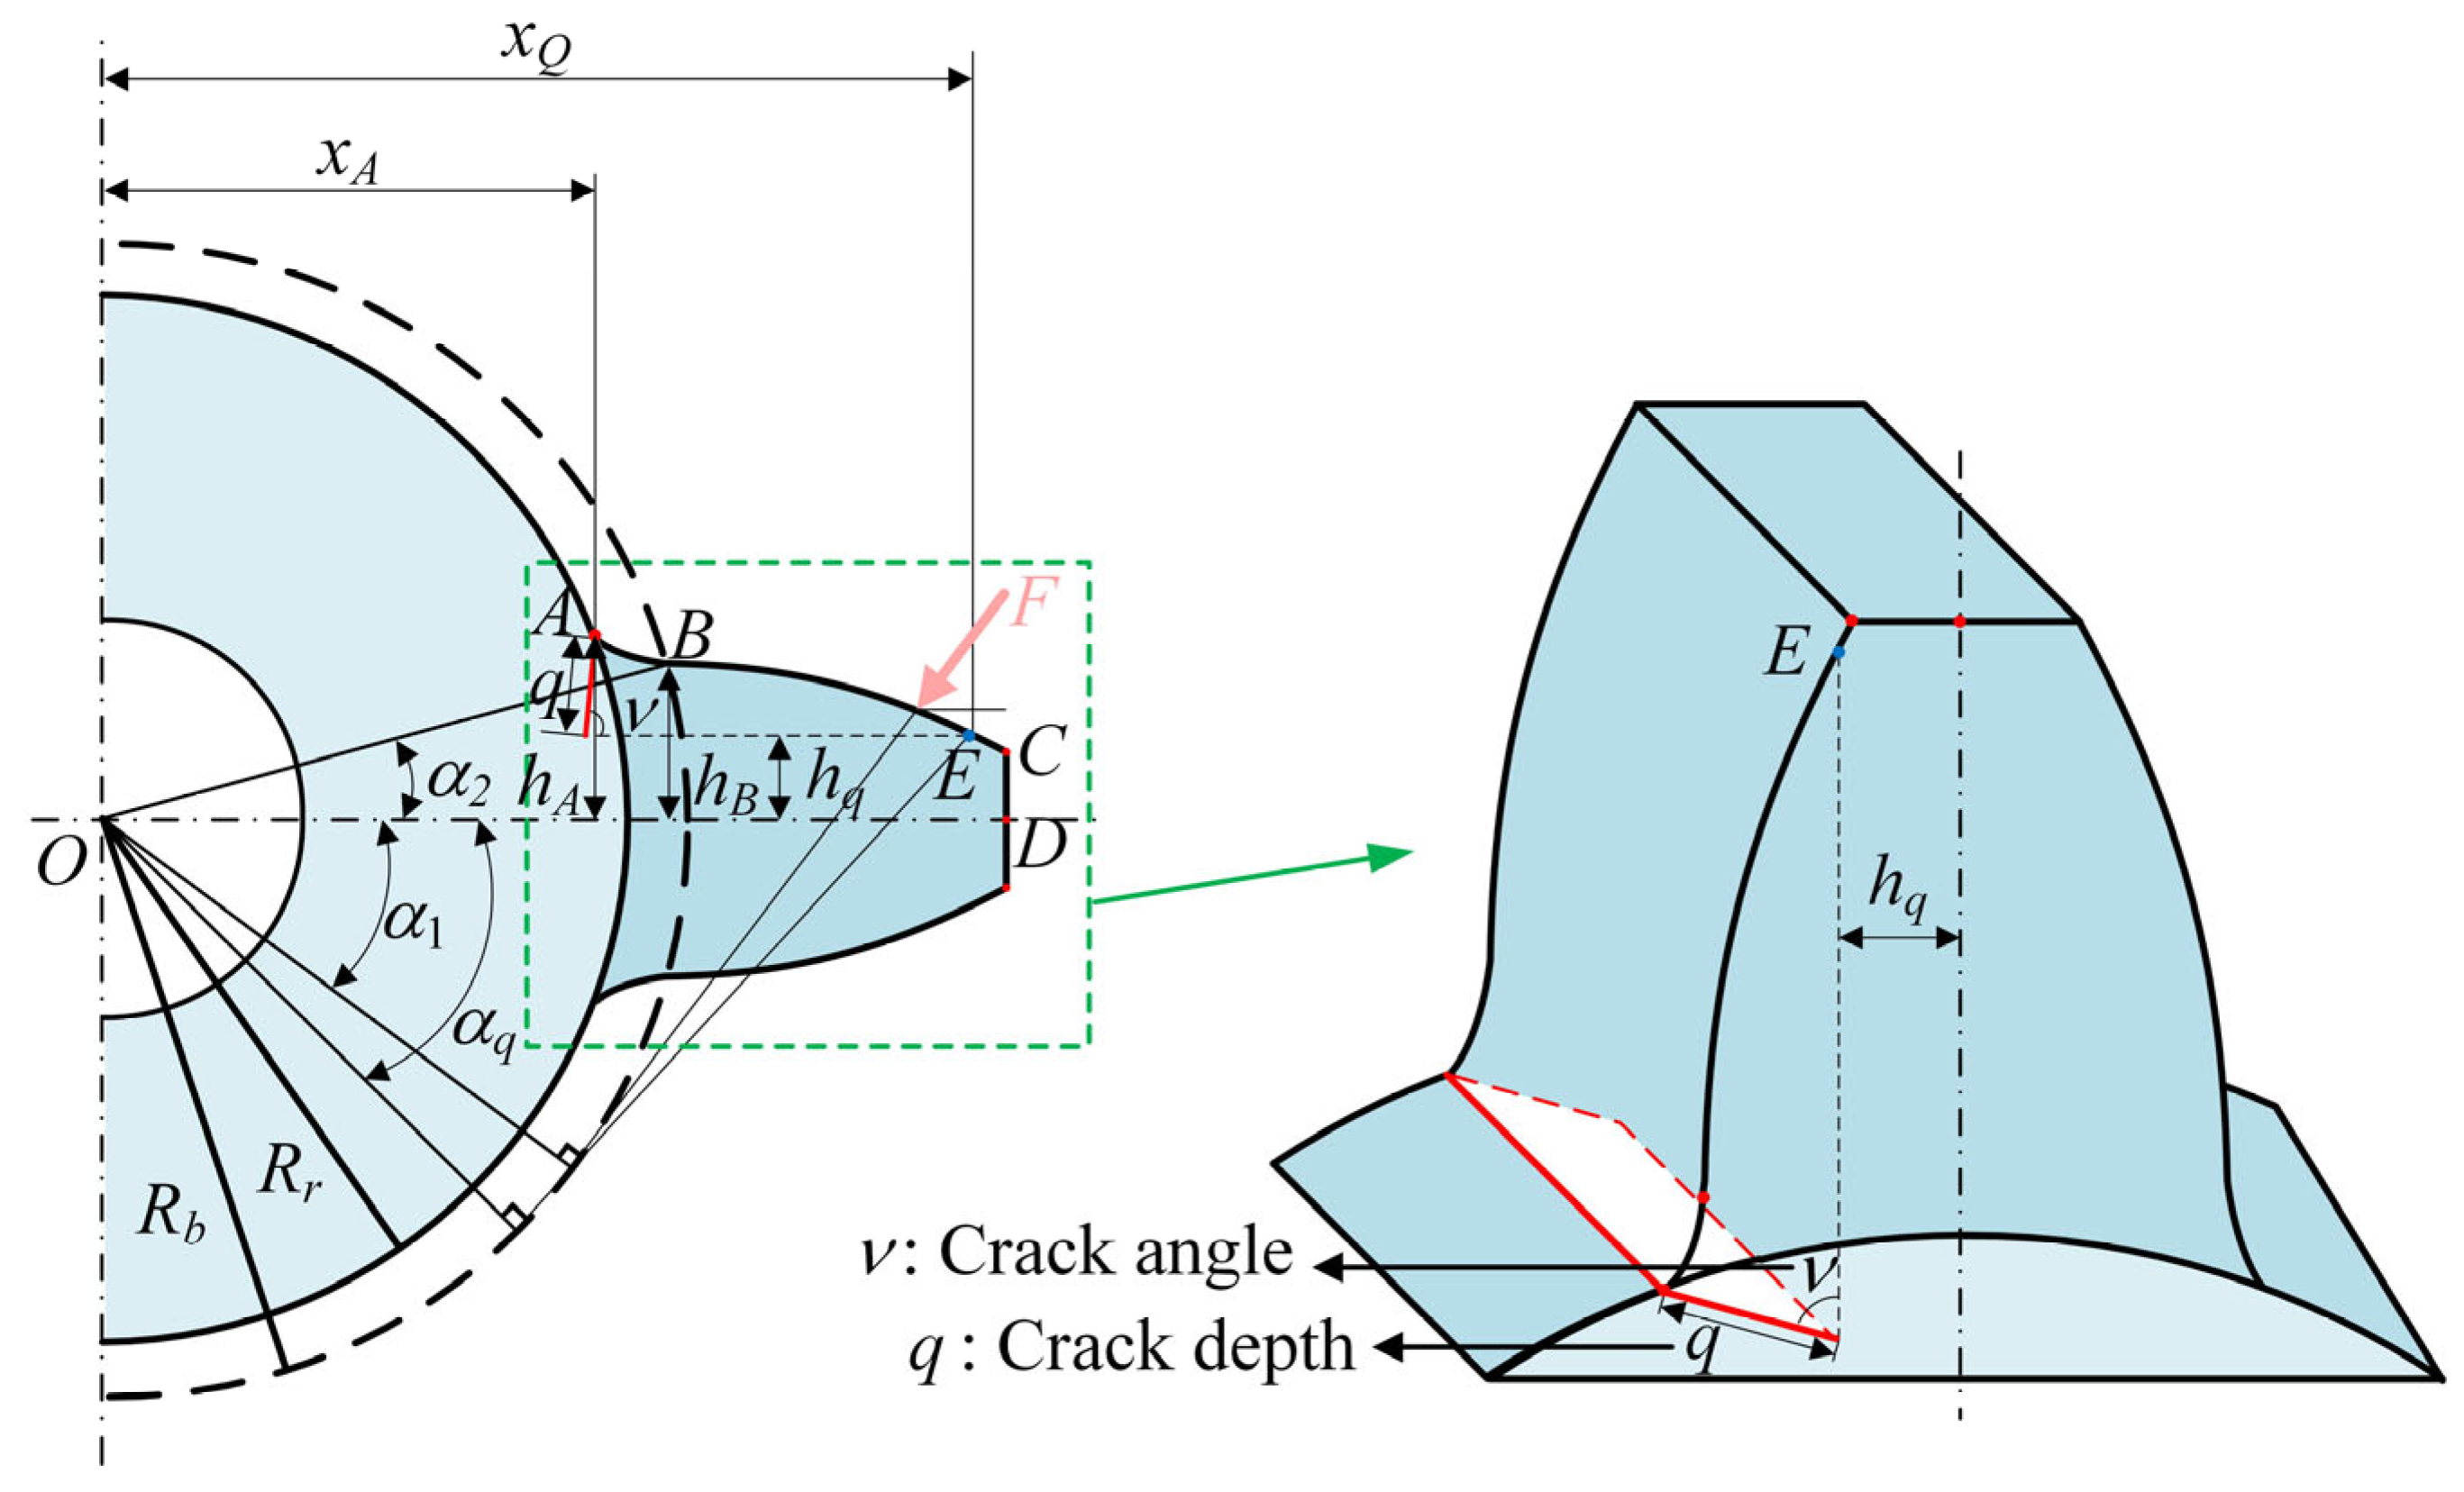
2.2. Time-Varying Mesh Stiffness of Cracked Spur Gear Pair

As depicted in Figure 2, a crack of length q is presumed to be present at the root of the gear. The crack forms an angle ν with the centerline of the tooth, and both q and ν remain constant along the width of the tooth. Similar to a healthy tooth, the cracked tooth is still treated as a variable cross-section cantilever beam. Since the crack has no impact on the tooth profile curve or the radial load-carrying capacity of the tooth, the calculations for axial compression, Hertzian contact, and fillet-foundation stiffness are the same as those for a healthy tooth. However, the bending and shear stiffness are altered due to the presence of the crack. Depending on the different crack lengths and angles, the effective moment of inertia and area of the section where the distance from the point O is x will change accordingly, and the following scenarios need to be taken into account.
  • Case 1 h B < h q
In this case, the influence of the crack is only manifested in a portion of the transition curve. The effective moment of inertia and area of the section where the distance from the point O is x can be calculated as follows
I x = L 12 h x 1 + h A q sin ν 3 , x A < x x Q 2 L 3 h x 1 3 , x Q < x x B 2 L 3 h x 2 3 , x B < x x C
A x = h x 1 + h A q sin ν L , x A < x x Q 2 h x 1 L , x Q < x x B 2 h x 2 L , x B < x x C
  • Case 2 h C < h q < h B
In this case, the effect of the crack is reflected throughout the entire transition curve and a part of the involute curve. The effective moment of inertia and area of the section where the distance from the point O is x can be calculated as follows.
I x = L 12 h x 1 + h A q sin ν 3 , x A < x x B L 12 h x 2 + h A q sin ν 3 , x B < x x Q 2 L 3 h x 2 3 , x Q < x < x C
A x = h x 1 + h A q sin ν L , x A < x x B h x 2 + h A q sin ν L , x B < x x Q 2 h x 2 L , x Q < x x C
  • Case 3 h q < h C
In this case, the influence of the crack is manifested in the entire transition curve and partially affects the involute curve. The effective moment of inertia and area of the section where the distance from the point O is x is given by
I x = L 12 h x 1 + h A q sin ν 3 , x A < x x B L 12 h x 2 + h A q sin ν 3 , x B < x x C
A x = h x 1 + h A q sin ν L , x A < x x B h x 2 + h A q sin ν L , x B < x x C
By integrating the above three scenarios and substituting Equations (19)–(24) into Equations (1)–(3), the axial compression and shear stiffness under different crack conditions can be obtained. This, in turn, enables the determination of the TVMS of the gear containing a root crack.

2.3. Verification of Time-Varying Mesh Stiffness

To verify the proposed theoretical model, a three-dimensional finite element model of the spur gear pair is constructed using Solid 186 elements, as illustrated in Figure 3. The main parameters of the spur gear pair are presented in Table 1.
Conta174 elements are assigned to the contact surface of the driving gear, while Targe170 elements are applied to the contact surface of the driven gear. To enhance computational accuracy, mesh refinement is applied in the contact and crack regions. The finite element contact algorithm also plays a significant role in determining the accuracy of the simulation results. The augmented Lagrangian method is employed for contact analysis to reduce the sensitivity of the contact stiffness factor and alleviate convergence oscillations induced by excessively small penetration factors. The driven gear hub is fully constrained, while a torque load is applied to the hub of the driving gear. A static analysis is then performed to determine the angular displacement of the driving gear. Subsequently, the contact position of the gear meshing is adjusted to complete the meshing process of a tooth. The gear meshing stiffness is calculated as
k = T Δ θ R b 2
where T is the torque applied to the driving gear and Δ θ and R b represent the angular displacement and the base circle radius of the driving gear, respectively.
Taking into account the impact of crack length on the TVMS, the crack angle is fixed at 45°. Figure 4a and Figure 4b, respectively, illustrate the TVMS of the gear pair at different crack depths obtained through the use of the PEM and the FEM. A close consistency is observed between the results derived from the PEM and those obtained through the FEM. The presence of a crack leads to a decrease in the TVMS, and as the crack depth increases, the reduction in the TVMS becomes more pronounced. Moreover, as the rotation angle increases, signifying that the meshing position shifts from the tooth root to the tooth addendum, the reduction in the TVMS also intensifies.
Similarly, Figure 5a,b present the TVMS of the gear pair at different crack angles, obtained using the PEM and FEM, respectively, with the crack length set at 3 mm. As the crack angle increases, the reduction in TVMS also grows.
Table 2 presents the average values and comparative results obtained from the FEM and analytical methods under various crack conditions. The mesh stiffness over a single tooth engagement cycle is calculated using a weighted averaging approach. The close agreement between the two sets of results confirms the accuracy and reliability of the proposed model.

3. Dynamic Characteristics of Deterministic Gear System

This section focuses on discussing the influences of tooth cracks on the dynamic characteristics of deterministic gear systems. By conducting in-depth analyses in both the frequency domain and time domain, we aim to thoroughly investigate and clarify the effect of crack depth on the vibration behavior of a deterministic gear system, providing insights into the underlying mechanical principles.
As depicted in Figure 6, the gear system is composed of a driving gear and a driven gear. These two components are coupled through the meshing action between them. Through the analysis of kinetic, potential, and dissipative energies, as well as the generalized forces of both the driving and driven gears, and by applying the Lagrange equation along with the previously obtained TVMS, a six-degree-of-freedom lumped-parameter dynamic model for the gear system is developed. The governing equations of motion can be expressed as follows
m 1 x ¨ 1 + c 1 x x ˙ 1 + k 1 x x 1 + F t sin α 0 = 0 m 2 x ¨ 2 + c 2 x x ˙ 2 + k 2 x x 2 F t sin α 0 = 0 m 1 x ¨ 1 + c 1 y y ˙ 1 + k 1 y y 1 + F t cos α 0 = 0 m 2 x ¨ 2 + c 2 y y ˙ 2 + k 2 y y 2 F t cos α 0 = 0 I 1 θ ¨ 1 + F t R b 1 = T 1 I 2 θ ¨ 2 F t R b 2 = T 2
where the subscript i = 1, 2 represents the driving gear and driven gear, respectively; T i , m i and I i represent the torque, mass, and moment of inertia of the ith gear, respectively; x i , y i and θ i represent the horizontal displacement, vertical displacement, and angular displacement of the ith gear, respectively; k i x and k i y represent the stiffness of the bearing in the horizontal and vertical directions; and c i x and c i y represent the damping coefficients of the bearing in the horizontal and vertical directions.
Combined with the theoretical derivation of the TVMS in the previous section, the meshing force between the driving gear and the driven gear can be expressed as
F t = c t δ ˙ + k t δ
where δ is the dynamic transmission error (DTE) that obeys the following form
δ = x 1 x 2 sin α 0 + y 1 y 2 cos α 0 + θ 1 R b 1 θ 2 R b 2
The time-varying mesh damping coefficient c t of the gear system is defined as
c t = 2 ζ k t R b 1 2 / I 2 + R b 2 2 / I 1
where ζ is the meshing damping ratio.
To investigate the vibration response of the DTE under varying crack depths, the crack angle of the driving gear is fixed at 45°, with its input rotational speed fixed at 2400 rpm. Figure 7 and Figure 8 show the time-domain responses of DTE and the corresponding magnified views for different crack depths.
It is evident that when the cracked gear engages in the meshing process, a sudden change takes place in the DTE. The time interval of this change is 1T (16tc), which is identical to the rotational period of the driving gear. As the crack depth deepens, the amplitude of the periodic pulses shows an upward trend. An examination of Figure 8 reveals that the maximum vibration amplitude of the DTE occurs during the middle phase of the meshing process of the cracked tooth. Although the decrease in the time-varying meshing stiffness caused by the crack is not the most substantial at this stage, the gear is operating within the single tooth meshing region at this moment. In this region, the overall meshing stiffness reaches its lowest point, resulting in a remarkable increase in the vibration amplitude of the DTE.
Figure 9 presents the frequency-domain signals of a healthy and a cracked tooth. It is observed that the frequency-domain signal of a healthy tooth solely consists of the meshing frequency (calculated as 2400/60 × 16 = 640 Hz) and its corresponding harmonics. When cracks appear, the amplitude of the meshing frequency does not exhibit significant alterations. However, this occurrence gives rise to the appearance of rotational frequencies and their associated harmonics. Due to the modulation effect, sidebands are produced. As the depth of the crack increases, the frequency band becomes more distinct and prominent. This phenomenon indicates that the presence and progression of the crack have a notable impact on the frequency-domain characteristics of the tooth vibration signal, which can potentially serve as an important indicator for crack detection and fault diagnosis in gear systems.

4. Description of Interval Uncertainty

The preceding section focuses on analyzing the dynamic transmission error (DTE) of a deterministic gear system. However, uncertainty is an inherent aspect of real-world systems and the effects of parameter variability have been neglected. In reality, such uncertainties influence not only the vibration characteristics of the gear system but also its overall operational reliability.
To conduct a reasonable assessment of the dynamic characteristics of the gear system, this section undertakes research on a gear system with parameter uncertainties. This exploration aims to provide a more comprehensive understanding of the gear system performance in real-world scenarios where parameter uncertainties are inevitable.
In the gear system, the uncertain parameters are uncertain but bounded variables. These parameters can be conveniently represented in the form of an interval, which is expressed as
η I = η _ , η ¯ = η c β η c , η c + β η c
where η I denotes the interval parameter; η _ and η ¯ , respectively, stand for the lower and upper bounds of this interval parameter; and η c = η _ + η ¯ / 2 represents the mid-value of the interval parameter. Meanwhile, β serves as the uncertainty coefficient, which is used to quantify the extent of uncertainty.
When it comes to the extension to the multi-dimensional interval, Equation (30) can be presented in matrix form as
η I = η _ , η ¯ = η c β η c , η c + β η c
where η c = η _ + η ¯ / 2 denotes the mid-value matrix corresponding to the interval parameter matrix and β = η ¯ η _ / 2 η c denotes the uncertainty coefficient matrix associated with the interval parameter matrix.
Considering the influence of parameter uncertainties, the dynamic equation governing the gear system can be formulated as follows
M η I U ¨ + C η I , t U ˙ + K η I , t U = F η I
where M , C , K , and F represent the global mass matrix, global damping matrix, global stiffness matrix, and global excitation force vector of the gear system, respectively.
In accordance with the Weierstrass theorem, within a closed interval, there exists a polynomial g x that converges to the continuous function f x .
f x g x < ε , x a , b
where g k x is employed to denote the set of polynomials whose order is no greater than the k order.
g k ( x ) = a 0 + a 1 x + + a k x k
where a 0 a k denote the coefficients of the polynomial.
There is a distinct polynomial that meets the following equation
f x g x f x g k * x = E k f , x a , b
where g k * x is the optimal uniform approximation polynomial of the k order for the function f x within the interval a , b .
Since the Chebyshev series closely resembles the optimal uniform approximation polynomial, it can be effectively employed to approximate the original function.
When dealing with one-dimensional uncertain problems, the Chebyshev series is defined as
A k x = cos k arccos x , x 1 , 1
when x a , b , the variable A k x is linearly transformed to A k x = cos k arccos 2 x ( b + a ) b a . The recurrence relation for the Chebyshev polynomials A k x is as follows
A 0 x = 1 ; A 1 x = x ; A k x = 2 x A k 1 x A k 2 x , k = 1 , 2 ,
where A k exhibits orthogonality with respect to the weight function ρ x = 1 / 1 x 2 within the interval 1 , 1 , so that
1 1 A k ( x ) A p ( x ) 1 x 2 d x = 0 π cos k arccos x cos p arccos x d arccos x          = π , k = p = 0 π 2 , k = p 0 0 , k p
The function f x can be approximated using a kth order polynomial derived from the Chebyshev series.
f ( x ) g k ( x ) = f 0 2 + i = 1 k f i A i ( x )
Assuming that f x has n + 1 order continuous derivatives, the approximation error of the above expression can be written as
f ( x ) p n ( x ) 2 n ( n + 1 ) ! f ( n + 1 )
It can be seen from the above expression that the error decreases with increasing order n and so can be neglected to some extent.
f i represents the constant coefficients, which can be calculated as
1 1 f ( x ) A k ( x ) 1 x 2 d x 1 1 A k ( x ) 1 x 2 f 0 2 + i = 1 k f i A i ( x ) d x          = 1 1 f 0 A k ( x ) 2 1 x 2 d x + i = 1 k f i A i ( x ) A k ( x ) 1 x 2 d x
f i = 2 π 1 1 f ( x ) A i ( x ) 1 x 2 d x , i = 0 , 1 , , k
By applying the Gauss–Chebyshev numerical integration formula to Equation (37), the following result can be obtained as
f i = 2 π 1 1 f ( x ) A i ( x ) 1 x 2 d x 2 n j = 1 n f ( x j ) A i ( x j )
x j = cos 2 j 1 2 n π , j = 1 , 2 , , n
where n denotes the number of interpolation points and x j stands for the interpolation points themselves. It is worth emphasizing that the quantity n of interpolation points must surpass the k order of the approximation equation to guarantee the accuracy of the approximation.
Consequently, the kth order polynomial approximation of the function f x is given as follows
f ( x ) g k = 1 n j = 1 n f ( x j ) + 2 n i = 1 k j = 1 n f ( x j ) A i ( x j ) A i ( x )
When addressing multi-dimensional uncertain problems, the r-dimensional Chebyshev polynomial is formulated as the tensor product of one-dimensional Chebyshev polynomials corresponding to each uncertain parameter. It is defined as
A k 1 , k 2 , k r x 1 , x 2 , , x r = A k 1 x 1 A k 2 x 2 A k r x r
In the presence of r uncertain parameters, the function f x can be approximated as follows
f ( x ) = i 1 = 0 k i r = 0 k 1 2 m f i 1 , , i r A i 1 , , i r x
where m denotes the number of zeros in the set i 1 , , i r and the constant coefficients f i 1 , , i r can be computed as follows
f i 1 , , i r = 2 π r 1 1 1 1 f x A i 1 , i r x 1 x 2 1 x r 2 d x 1 d x r    2 n r j 1 = 1 n j r = 1 n f x j 1 , , x j r A i 1 x j 1 A i r x j r
x j i = cos 2 j i 1 2 n π ,   i = 1 , 2 , r ,   j r = 1 , 2 , , n
The dynamic behavior of a gear system subject to interval uncertainties is considered a continuously differentiable function. By performing numerical calculations on the deterministic responses at the interpolation points, the response boundaries of this uncertain gear system can be ascertained. The flowchart for computing the uncertainty is presented in Figure 10.

5. Dynamic Characteristics of Uncertain Gear System

This section investigates the dynamic response of a gear system characterized by uncertain parameters. These parameters are modeled as independent interval variables without reliance on any probabilistic distributions. The midpoint of each interval corresponds to the associated deterministic value, while the bounds of the interval are determined by predefined uncertainty coefficients. It is important to note that the interval bounds of the parameters do not directly translate to the maximum or minimum values of the system’s dynamic response.
For the purpose of continued analysis, the vertical displacement signal y 2 of the driven gear is chosen as the subject of investigation. This numerically obtained signal is processed using Fourier transform, from which the amplitude of the fundamental meshing frequency component is extracted to construct the gear system’s amplitude–frequency response curve.
First, the influence of a single uncertain parameter on the gear system is taken into account. Figure 11a depicts the amplitude–frequency response of the gear system with uncertain support stiffness, where the uncertainty coefficients are set sequentially to 3% and 5%. It is evident that the amplitude–frequency response of the deterministic system consistently falls within the response interval of the uncertain system. As the uncertainty coefficient increases, the system response interval expands further, particularly in the resonance region. Owing to the uncertainty in support stiffness, the initially single resonance frequency of the gear system broadens into a frequency range, giving rise to a resonance band. This implies that within a certain range near the deterministic resonance frequency, the vibration amplitude of the gear system could be substantial. Compared to the deterministic gear system, the frequency corresponding to the maximum amplitude of the uncertain gear system experiences a frequency shift. This phenomenon indicates that the uncertainty in support stiffness exerts a significant effect on the inherent characteristics of the gear system.
Figure 11b illustrates the amplitude–frequency response of a gear system with an uncertain mass. Similar to the case of support stiffness uncertainty, the uncertainty in mass also leads to the expansion of the resonance frequency of the deterministic gear system from a single value to a specific range, forming a well-defined resonance band. This phenomenon indicates that the uncertainty in mass significantly influences the inherent properties of the gear system.
Figure 11c illustrates the amplitude–frequency response of a gear system with an uncertain Young’s modulus. Evidently, the uncertainty associated with Young’s modulus exerts a substantial influence on the resonance peak, while only having a slight impact on the vibration amplitude in other regions. Moreover, the gear system does not exhibit any frequency-shift phenomena.
A subsequent analysis is conducted to examine the effects of multiple sources of parameter uncertainty on the dynamic behavior of the gear system. In this context, the support stiffness, mass, and Young’s modulus are all treated as uncertain variables. As depicted in Figure 11d, the presence of multi-source uncertainty significantly influences the system’s dynamic response. Under such conditions, a purely deterministic approach fails to accurately and efficiently capture the vibration characteristics of the gear system. At this stage, the amplitude–frequency response interval reflects features typically associated with single-parameter uncertainty, including frequency shifts and the formation of resonance bands.
After that, the main attention turns to an uncertain gear system with root cracks. Specifically, the crack depth is fixed at 3 mm and the crack angle is fixed at 45°. Figure 12 depicts the amplitude–frequency response when there are uncertainties in support stiffness, mass, and Young’s modulus. The findings suggest that the emergence of cracks neither influences the frequency-shift phenomena nor changes the envelope shape of the response interval. Nevertheless, it could cause an increase in the vibration amplitude within the resonance band area.
Taking into account the influence of uncertainty on the DTE of a gear system with root cracks, an uncertainty coefficient of 3% is adopted here. As illustrated in Figure 13a, the DTE response of a gear system featuring root cracks and uncertain support stiffness is depicted. Evidently, the DTE exhibits low sensitivity to support stiffness, and the upper and lower bounds of the response interval closely resemble the deterministic response. Figure 13b presents the response interval of the DTE under mass uncertainty. It is apparent that the DTE is also relatively insensitive to mass uncertainty, with the variation in the meshing region being marginally greater than that under support stiffness uncertainty. In comparison with the results obtained under mass uncertainty, uncertainty in the Young’s modulus exerts a substantial influence on the DTE response. However, the envelope form of the DTE differs, which can be attributed to the distinct mechanisms through which the parameters affect the gear system. Figure 13d shows the DTE response of a gear system with root cracks under the combined influence of multiple parameter uncertainties. The results suggest that under the impact of multiple parameter uncertainties, the potential vibration amplitude of the DTE significantly surpasses the deterministic response, which is obviously detrimental to the safe and stable operation of the gear system.

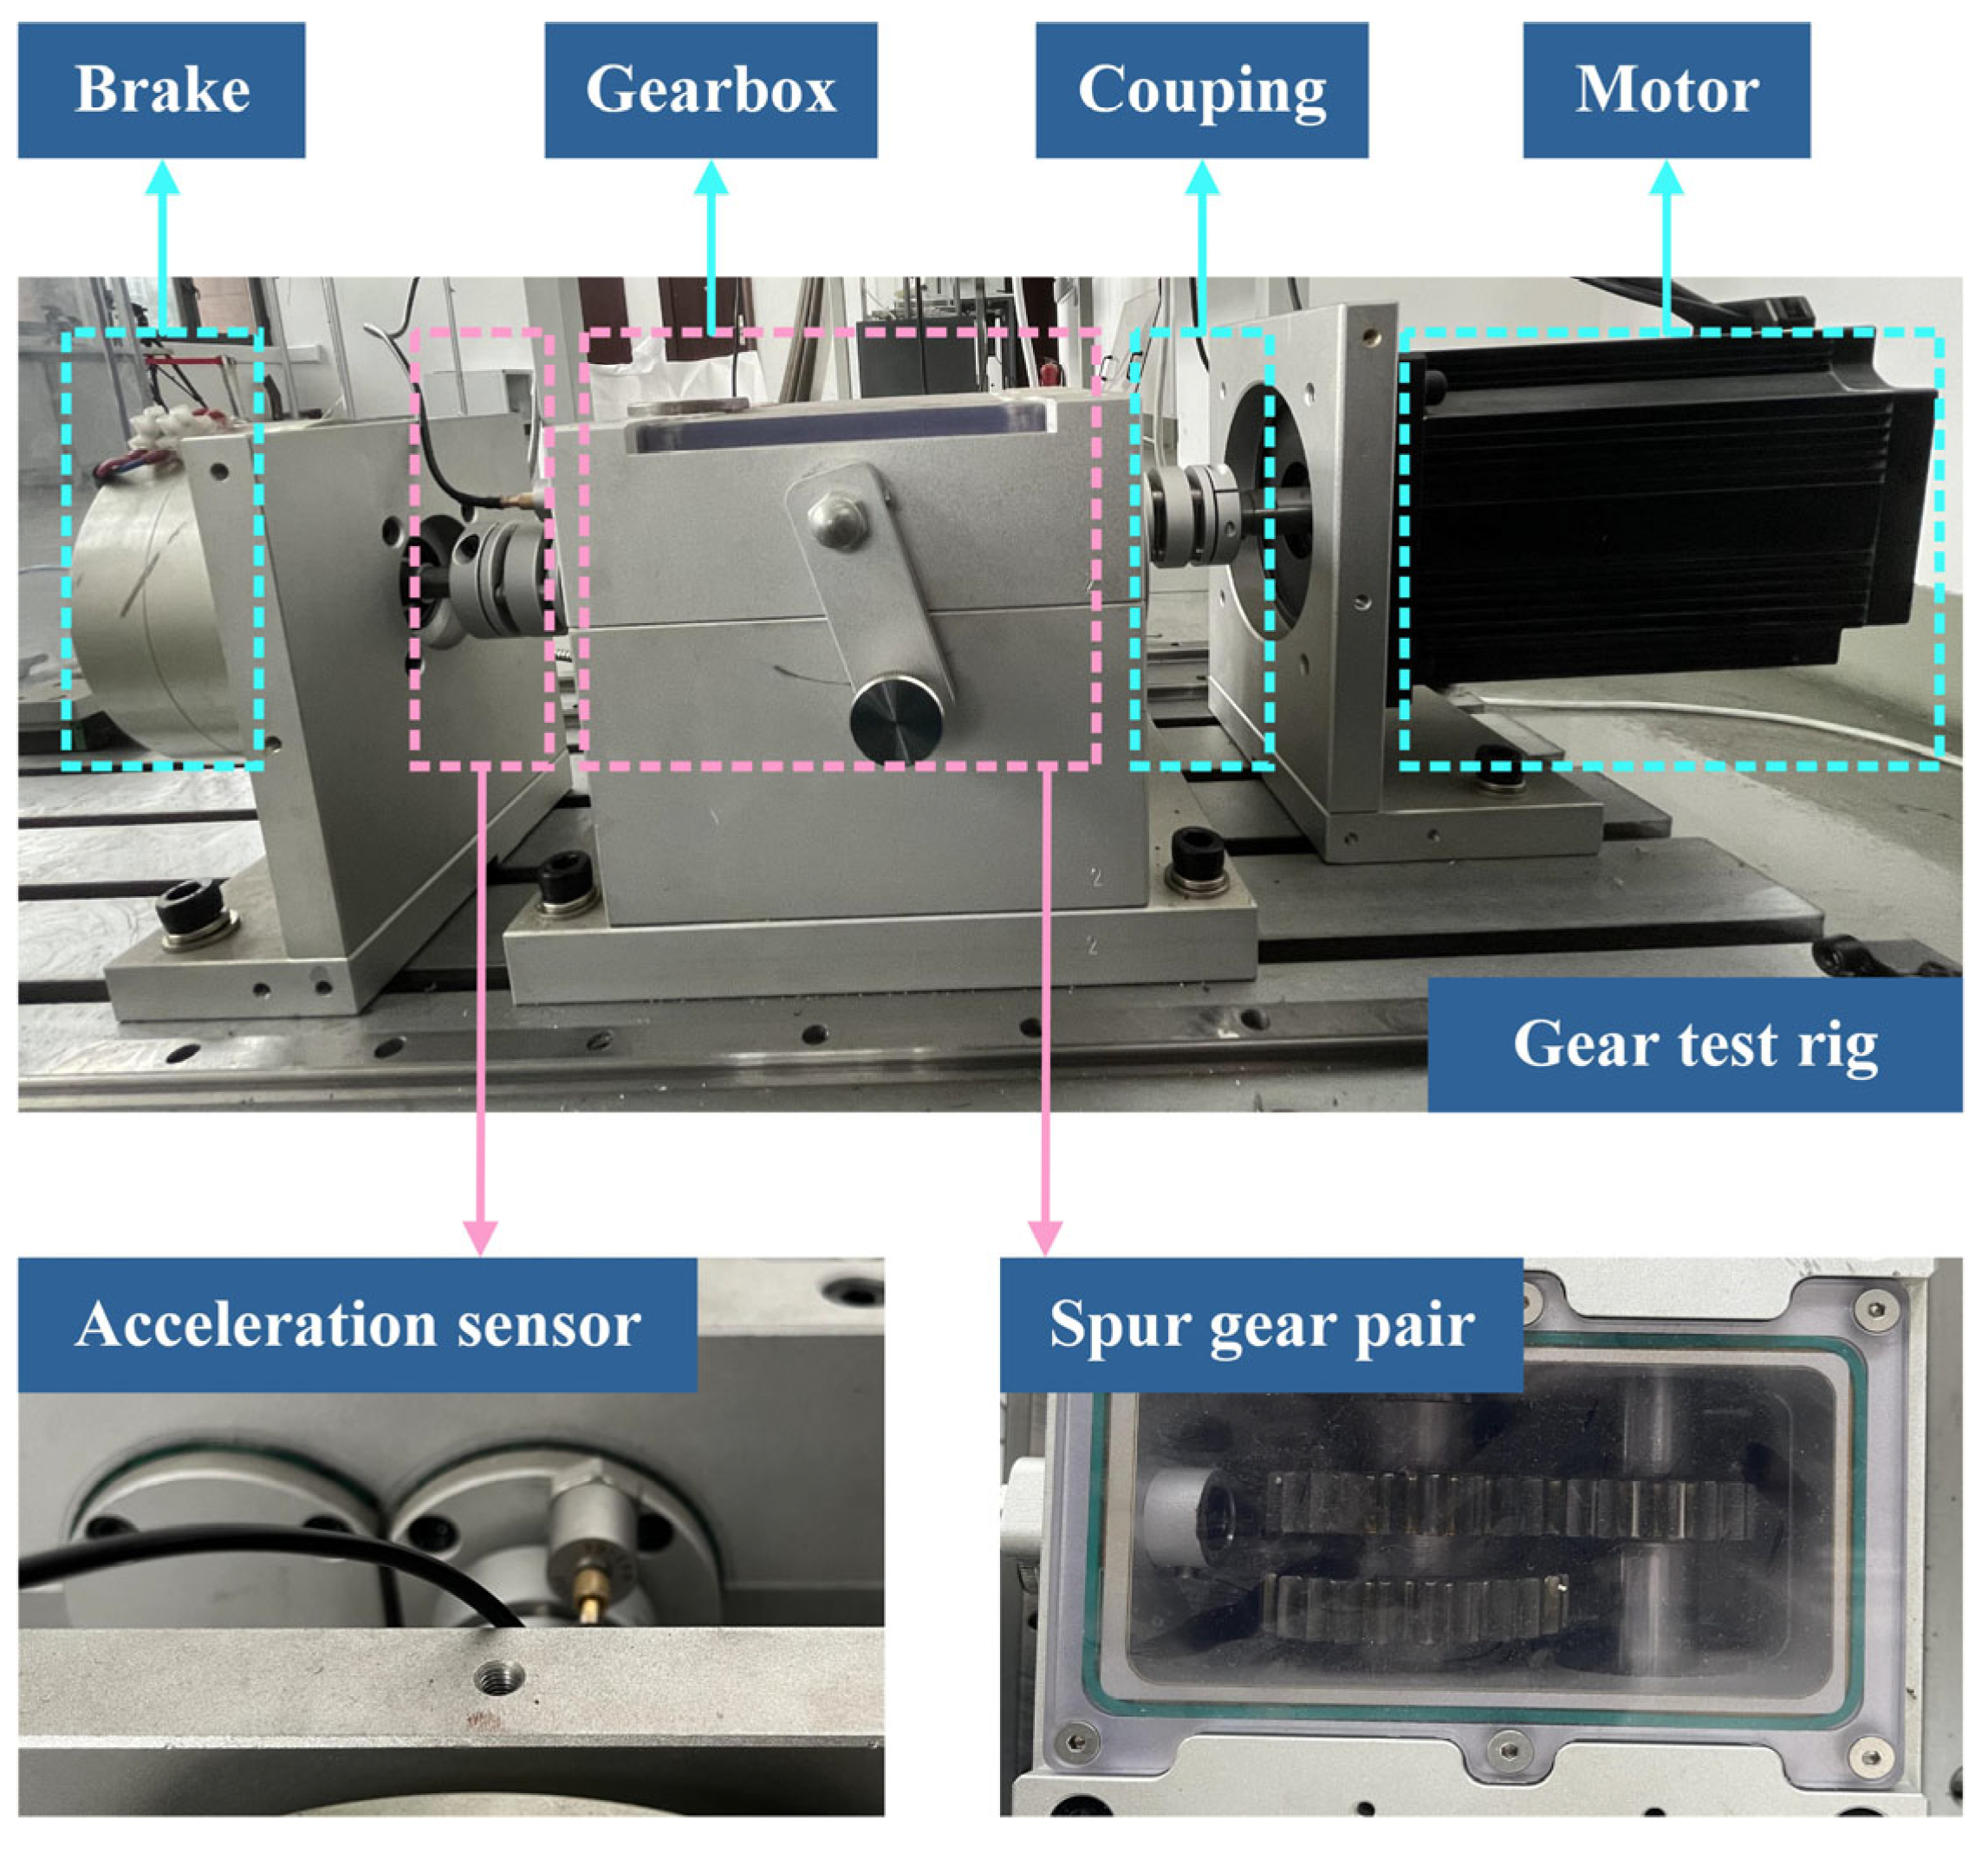
6. Experiments and Verification

To experimentally verify the theoretical analysis and capture the vibration behavior of the gear system, a dedicated test rig is established. In this section, experiments are performed at various rotational speeds, and both time-domain and frequency-domain vibration signals are collected and analyzed accordingly.
Figure 14 presents the gear system test rig, which serves as a crucial experimental setup for investigating the performance and characteristics of the gear system. This rig is composed of several key components, namely a motor, a gearbox, two couplings, and a brake. The motor acts as the power source, providing the necessary rotational energy to drive the entire gear system. The gearbox, being the core of the rig, is responsible for changing the speed and torque of the input power according to specific requirements. The two couplings play a vital role in connecting different parts of the system, ensuring smooth power transmission and minimizing energy losses. Meanwhile, the brake is used to control the rotational speed and stop the system when needed, enhancing the safety and controllability of the experiment. To accurately capture the vibration signals of the gear system, an acceleration sensor is placed above the bearing cover of the driven gear shaft. This location is carefully chosen because the bearing cover of the driven gear shaft can affect the dynamic behavior of the gear system.
Figure 15 shows the experimental results, the theoretical predictions of the deterministic model, and those of the uncertainty-based model. As shown in the figure, the experimental data align well with the deterministic theoretical results in terms of resonance frequency, with the first-order resonance observed near 830 Hz. In addition, regarding response amplitude, the theoretical and experimental values exhibit close agreement. The minor deviations observed suggest the presence of uncertainty within the gear system. At this time, combined with the above multi-source uncertainty results, it can be found that both the deterministic response and the experimental results fall within the response range of the uncertain system. This highlights the importance of accounting for uncertainty factors in real-world gear system manufacturing and operation.
To further analyze the response characteristics of the gear test rig at different rotational speeds, the acceleration signals of the drive gear at different rotational speeds are acquired and discussed, as shown in Figure 16. It is evident that as the rotational speed increases, the vibration amplitude tends to be larger. Meanwhile, the time-domain signals are relatively complex. It does not exhibit simple 1T-period motion but contains a rich variety of frequency components. To reveal the frequency components present in the system response, a further frequency-domain analysis at different rotational speeds is carried out. The results show that, beyond the fundamental meshing frequency 1X, the system response also contains typical harmonic signals, such as 2X, 3X, and other components. This precisely verifies, through experiments, that for a gear system, its frequency components during operation are composed of the meshing frequency and harmonic forms.

7. Conclusions

In this paper, the deterministic theoretical models of both healthy-tooth and cracked-tooth gear systems are established to investigate the TVMS and DTE. On this basis, a dynamic model incorporating uncertainty is formulated using the Chebyshev interval analysis approach. Subsequently, the influence of various uncertain parameters on the dynamic behavior of the gear system is investigated. The main conclusions of this study are as follows.
  • For the deterministic system, as the crack depth and angle increase, the time-varying mesh stiffness decreases, and the presence of cracks leads to periodic pulse signals in the dynamic transmission error.
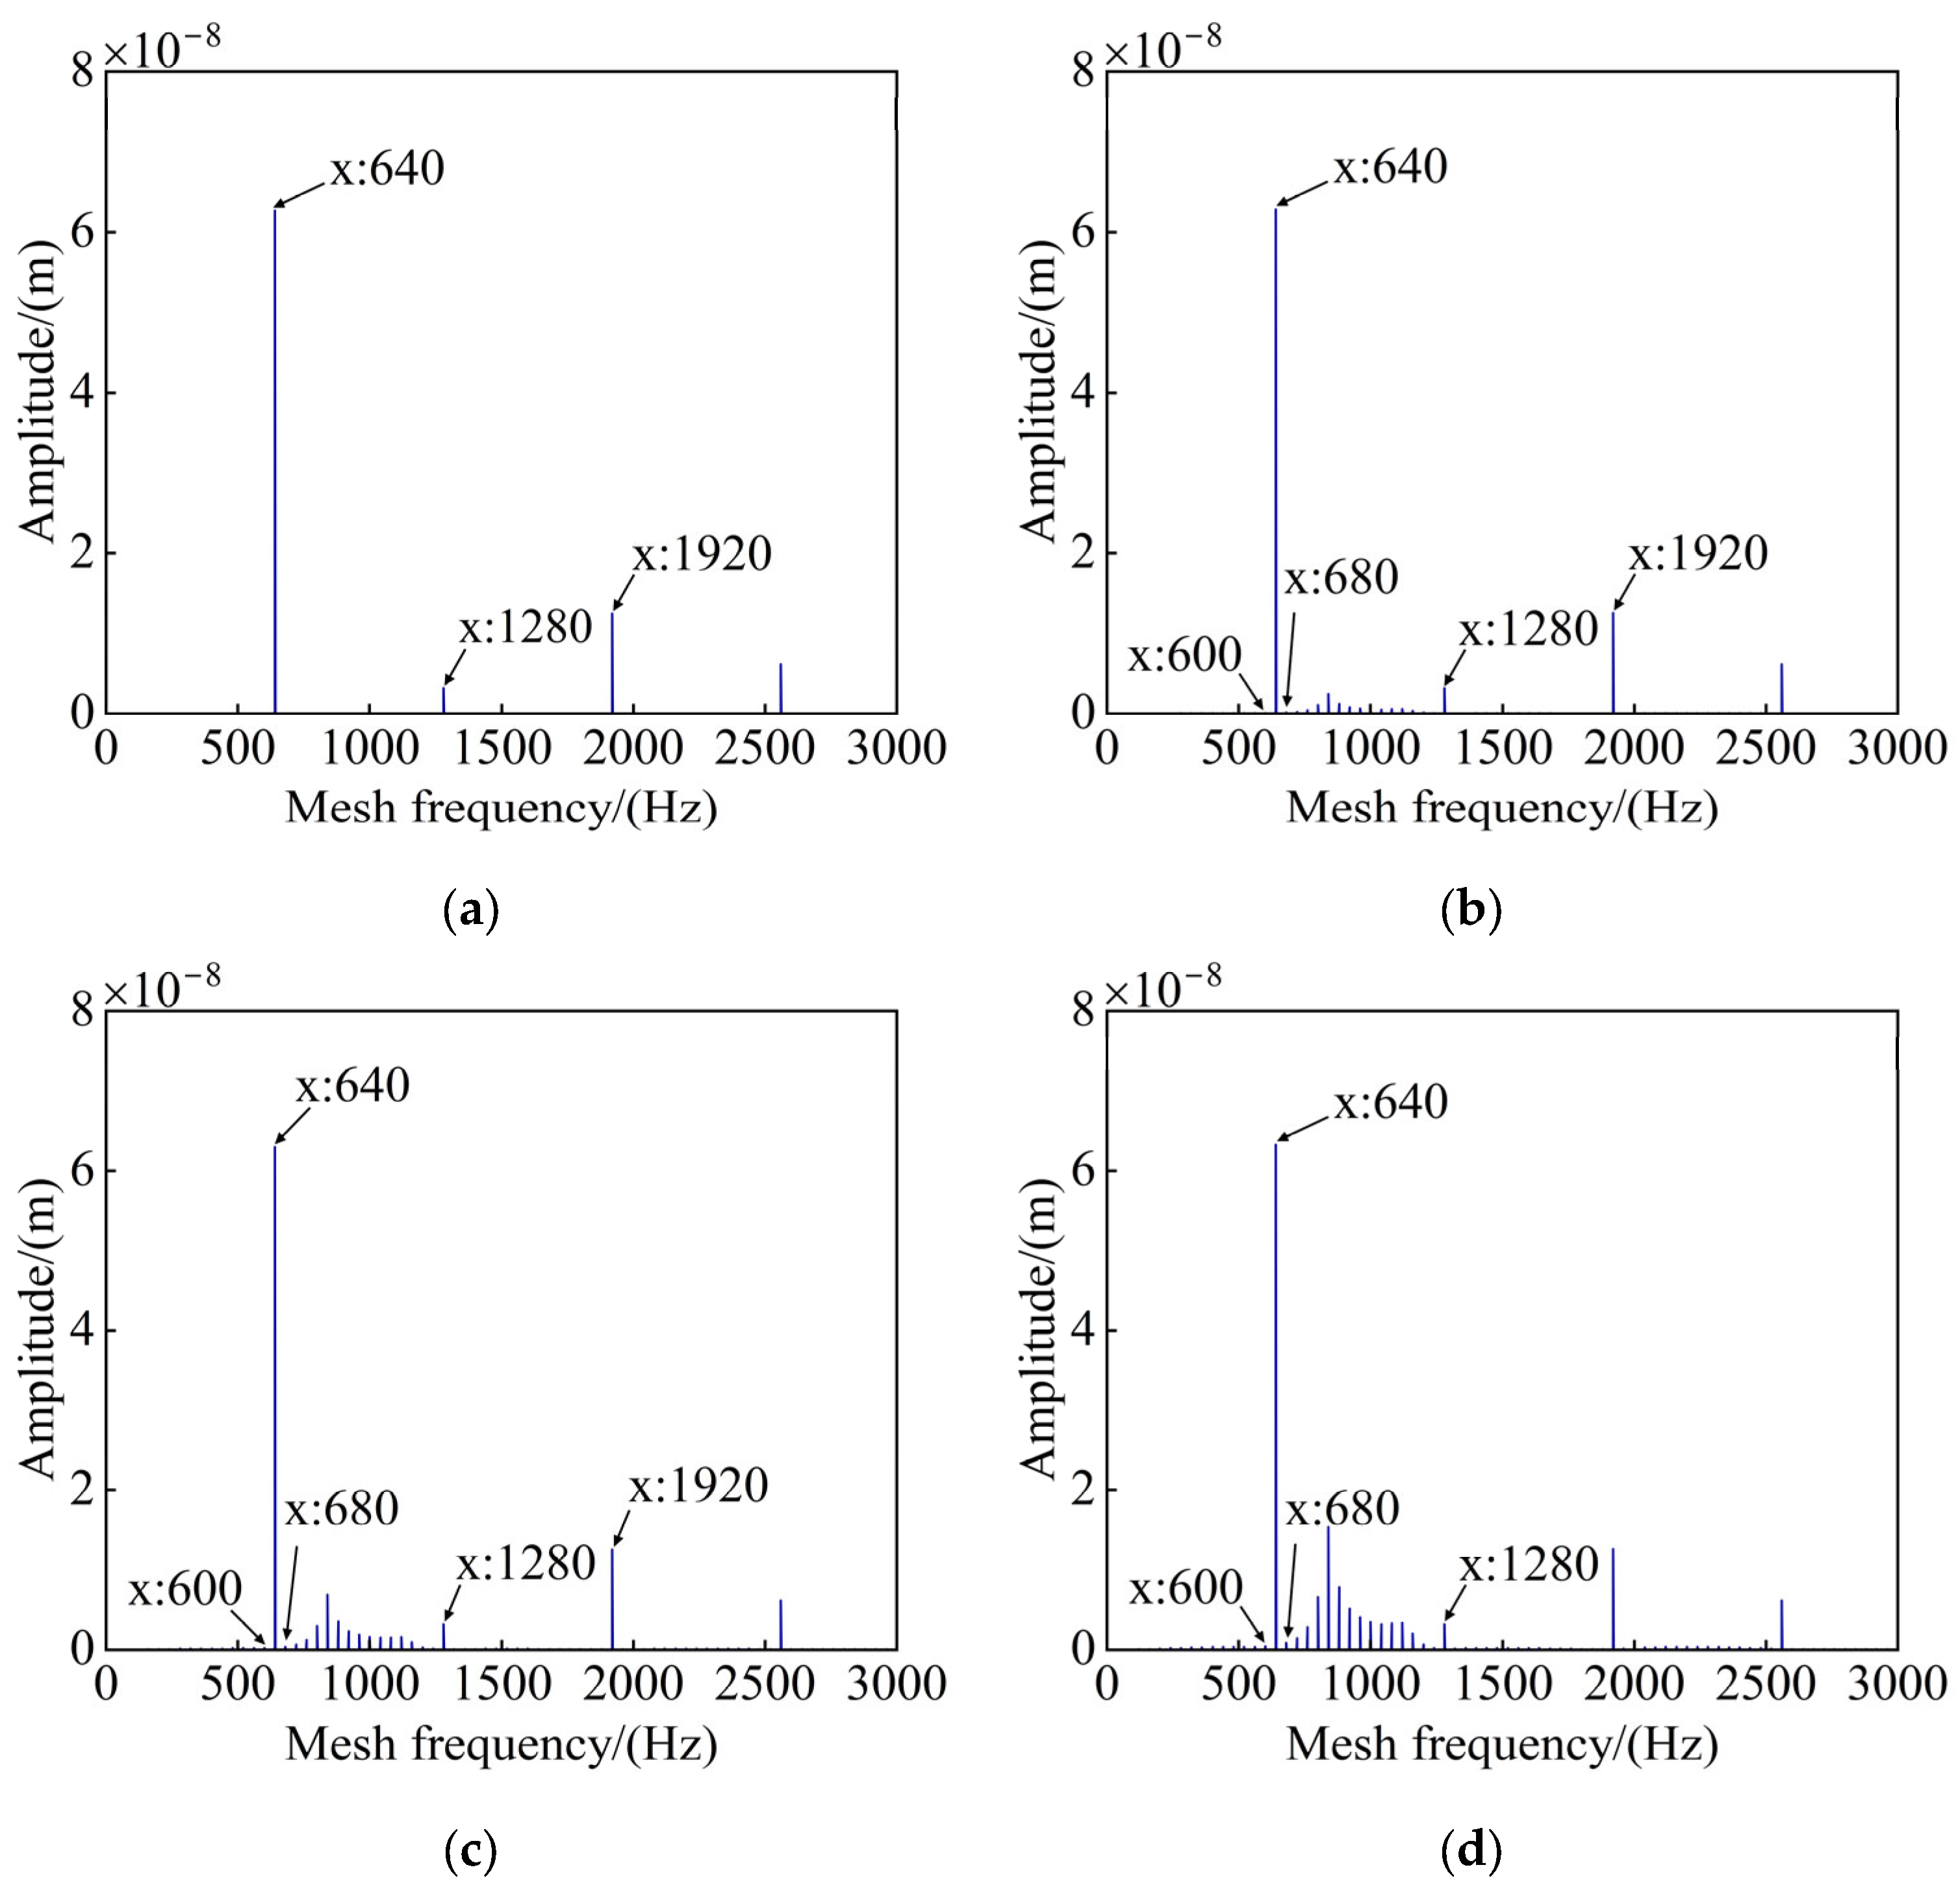
  • In the frequency-domain response of a deterministic system, it is experimentally verified that the meshing frequency and its harmonic components are usually included.
  • Under the influence of parameter uncertainties, the amplitude–frequency response of the gear system exhibits an envelope shape, and in this situation, multi-source uncertainties result in a more pronounced deviation in the system response compared to single-source uncertainty.
  • In the uncertain gear system, the interval vibration response of the dynamic transmission error is far more sensitive to the uncertainty of Young’s modulus than to the uncertainties of support stiffness and gear mass.
  • Under parameter uncertainty, the influence of a tooth crack on the vibration behaviors of the spur gear system is further amplified, which significantly weakens the stability and reliability of the system.

Author Contributions

Conceptualization, Y.Y. and P.F.; methodology, P.F. and J.Z.; software, P.F. and J.Z.; validation, Y.Y.; formal analysis, Y.Y. and J.Z.; resources, Y.Y.; data curation, Y.Y. and P.F.; writing—original draft preparation, P.F.; writing—review and editing, P.F.; visualization, P.F.; supervision, Y.Y.; funding acquisition, Y.Y. and J.Z. All authors have read and agreed to the published version of the manuscript.

Funding

This research was funded by the National Natural Science Foundation of China (Grant Nos. 12172307, 12202368) and the Key Laboratory of Vibration and Control of Aero-Propulsion System, Ministry of Education, Northeastern University of China (No. VCAME202205).

Data Availability Statement

No data were used for the research described in the article.

Conflicts of Interest

The authors declare no conflicts of interest.

References

  1. Liu, F.H.; Zhang, L.; Jiang, H.J.; Zhang, J.L. Nonlinear dynamic analysis of two external excitations for the gear system using an original computational algorithm. Mech. Syst. Signal Process. 2020, 144, 106823. [Google Scholar] [CrossRef]
  2. Kashani, S.A.A. Design and optimization of coaxial reluctance magnetic gear with different rotor topologies. IEEE. Trans. Ind. Electron. 2021, 69, 101–109. [Google Scholar] [CrossRef]
  3. Mohammed, O.D.; Rantatalo, M. Dynamic response and time-frequency analysis for gear tooth crack detection. Mech. Syst. Signal Process. 2016, 66, 612–624. [Google Scholar] [CrossRef]
  4. Chen, Z.G.; Shao, Y.M. Mesh stiffness calculation of a spur gear pair with tooth profile modification and tooth root crack. Mech. Mach. Theory 2013, 62, 63–74. [Google Scholar] [CrossRef]
  5. Jiang, H.J.; Liu, F.H. Dynamic features of three-dimensional helical gears under sliding friction with tooth breakage. Eng. Fail. Anal. 2016, 70, 305–322. [Google Scholar] [CrossRef]
  6. Sun, Y.N.; Ma, H.; Huang, Y.F.; Chen, K.K.; Che, L.Y.; Wen, B.C. A revised time-varying mesh stiffness model of spur gear pairs with tooth modifications. Mech. Mach. Theory 2018, 129, 261–278. [Google Scholar] [CrossRef]
  7. Yang, D.C.H.; Lin, J.Y. Hertzian damping, tooth friction and bending elasticity in gear impact dynamics. J. Mech. Des. 1987, 109, 189–196. [Google Scholar] [CrossRef]
  8. Tian, X.H. Dynamic Simulation for System Response of Gearbox Including Localized Gear Faults. Master’s Thesis, University of Alberta Edmonton, Edmonton, AB, Canada, 2004. [Google Scholar]
  9. Wu, S.Y.; Zuo, M.J.; Parey, A. Simulation of spur gear dynamics and estimation of fault growth. J. Sound Vib. 2008, 317, 608–624. [Google Scholar] [CrossRef]
  10. Mohammed, O.D.; Rantatalo, M.; Aidanpää, J.-O. Improving mesh stiffness calculation of cracked gears for the purpose of vibration-based fault analysis. Eng. Fail. Anal. 2013, 34, 235–251. [Google Scholar] [CrossRef]
  11. Ma, H.; Song, R.Z.; Pang, X.; Wen, B.C. Time-varying mesh stiffness calculation of cracked spur gears. Eng. Fail. Anal. 2014, 44, 179–194. [Google Scholar] [CrossRef]
  12. Liang, X.H.; Zuo, M.J.; Pandey, M. Analytically evaluating the influence of crack on the mesh stiffness of a planetary gear set. Mech. Mach. Theory 2014, 76, 20–38. [Google Scholar] [CrossRef]
  13. Saxena, A.; Parey, A.; Chouksey, M. Effect of shaft misalignment and friction force on time varying mesh stiffness of spur gear pair. Eng. Fail. Anal. 2015, 45, 79–91. [Google Scholar] [CrossRef]
  14. Yu, W.N.; Shao, Y.M.; Mechefske, C.K. The effects of spur gear tooth spatial crack propagation on gear mesh stiffness. Eng. Fail. Anal. 2015, 54, 103–119. [Google Scholar] [CrossRef]
  15. Luo, Y.; Baddour, N.; Liang, M. Effects of gear center distance variation on time varying mesh stiffness of a spur gear pair. Eng. Fail. Anal. 2017, 75, 37–53. [Google Scholar] [CrossRef]
  16. HuangFu, Y.F.; Chen, K.K.; Ma, H.; Che, L.Y.; Li, Z.W.; Wen, B.C. Deformation and meshing stiffness analysis of cracked helical gear pairs. Eng. Fail. Anal. 2019, 95, 30–46. [Google Scholar] [CrossRef]
  17. Jiang, H.J.; Liu, F.H. Analytical models of mesh stiffness for cracked spur gears considering gear body deflection and dynamic simulation. Meccanica 2019, 54, 1889–1909. [Google Scholar] [CrossRef]
  18. Meng, Z.; Shi, G.X.; Wang, F.L. Vibration response and fault characteristics analysis of gear based on time-varying mesh stiffness. Mech. Mach. Theory 2020, 148, 103786. [Google Scholar] [CrossRef]
  19. Yang, Y.; Tang, J.Y.; Hu, N.Q.; Shen, G.J.; Li, Y.H.; Zhang, L. Research on the time-varying mesh stiffness method and dynamic analysis of cracked spur gear system considering the crack position. J. Sound Vib. 2023, 548, 117505. [Google Scholar] [CrossRef]
  20. Zhou, W.G.; Zhu, R.P.; Li, Z.W.; Wang, J.J. An improved dynamic model of spur gears considering delayed meshing out of the contact point due to root crack. Mech. Syst. Signal Process. 2024, 212, 111325. [Google Scholar] [CrossRef]
  21. Soize, C. Uncertainty Quantification: An Accelerated Course with Advanced Applications in Computational Engineering; Springer International Publishing: Berlin, Germany, 2017. [Google Scholar] [CrossRef]
  22. Fu, C.; Sinou, J.J.; Zhu, W.D.; Lu, K.; Yang, Y.F. A state-of-the-art review on uncertainty analysis of rotor systems. Mech. Syst. Signal Process. 2023, 183, 109619. [Google Scholar] [CrossRef]
  23. Tobe, T.; Sato, K. Statistical analysis of dynamic loads on spur gear teeth. Bull. JSME 1977, 20, 882–889. [Google Scholar] [CrossRef]
  24. Tobe, T.; Sato, K.; Takatsu, N. Statistical analysis of dynamic loads on spur gear teeth: Experimental study. Bull. JSME 1977, 20, 1315–1320. [Google Scholar] [CrossRef]
  25. Kumar, A.S.; Osman, M.O.M.; Sankar, T.S. On statistical analysis of gear dynamic loads. J. Vib. Acoust. 1986, 108, 362–368. [Google Scholar] [CrossRef]
  26. Gelman, L.; Giurgiutiu, V.; Bayoumi, A. Statistical analysis of the dynamic mean excitation for a spur gear. J. Vib. Acoust. 2005, 127, 204–207. [Google Scholar] [CrossRef]
  27. Deng, C.S.; Yang, B.; Liu, Z.M. Dynamic analysis of gear system based on the random gear errors. J. Mech. Transm. 2011, 35, 31–34. [Google Scholar] [CrossRef]
  28. Chen, H.T.; Qin, D.T.; Wu, X.L.; Zhou, Z.G.; Yang, J. Dynamic characteristics of planetary gear transmission system of wind turbine with random manufacturing error. Chin. J. Mech. Eng. 2012, 48, 77–83. [Google Scholar] [CrossRef]
  29. Yang, J.M. Vibration analysis on multi-mesh gear-trains under combined deterministic and random excitations. Mech. Mach. Theory 2013, 59, 20–33. [Google Scholar] [CrossRef]
  30. Wen, Y.B.; Yang, J.M.; Wang, S.Y. Random dynamics of a nonlinear spur gear pair in probabilistic domain. J. Sound Vib. 2014, 333, 5030–5041. [Google Scholar] [CrossRef]
  31. Wei, S.; Zhao, J.S.; Han, Q.K.; Chu, F.L. Dynamic response analysis on torsional vibrations of wind turbine geared transmission system with uncertainty. Renew. Energy 2015, 78, 60–67. [Google Scholar] [CrossRef]
  32. Beyaoui, M.; Tounsi, M.; Abboudi, K.; Feki, N.; Walha, L.; Haddar, M. Dynamic behaviour of a wind turbine gear system with uncertainties. C. R. Mec. 2016, 344, 375–387. [Google Scholar] [CrossRef]
  33. Guerine, A.; Hami, A.E.; Walha, L.; Fakhfakh, T.; Haddar, M. A polynomial chaos method for the analysis of the dynamic behavior of uncertain gear friction system. Eur. J. Mech. A/Solid 2016, 59, 76–84. [Google Scholar] [CrossRef]
  34. Mabrouk, I.B.; Hami, A.E.; Walha, L.; Zghal, B.; Haddar, M. Dynamic response analysis of Vertical Axis Wind Turbine geared transmission system with uncertainty. Eng. Struct. 2017, 139, 170–179. [Google Scholar] [CrossRef]
  35. Fang, Y.N.; Liang, X.H.; Zuo, M.J. Effects of friction and stochastic load on transient characteristics of a spur gear pair. Nonlinear Dyn. 2018, 93, 599–609. [Google Scholar] [CrossRef]
  36. Ma, Y.H.; Wang, Y.F.; Wang, C.; Hong, J. Interval analysis of rotor dynamic response based on Chebyshev polynomials. Chin. J. Aeronaut. 2020, 33, 2342–2356. [Google Scholar] [CrossRef]
  37. Wei, S.; Chu, F.L.; Ding, H.; Chen, L.Q. Dynamic analysis of uncertain spur gear systems. Mech. Syst. Signal Process. 2021, 150, 107280. [Google Scholar] [CrossRef]
  38. Chen, Z.; Jiang, Y.B.; Li, S.; Tong, Z.M.; Tong, S.G.; Tang, N. Uncertainty propagation of correlated lubricant properties in gear tribodynamic system. Tribol. Int. 2023, 179, 107812. [Google Scholar] [CrossRef]
  39. Hu, Y.H.; Du, Q.G.; Xie, S.H. Nonlinear dynamic modeling and analysis of spur gears considering uncertain interval shaft misalignment with multiple degrees of freedom. Mech. Syst. Signal Process. 2023, 193, 110261. [Google Scholar] [CrossRef]
Figure 1. Schematic diagram of a healthy gear tooth model.
Machines 13 00395 g001
Figure 2. Schematic diagram of a cracked gear tooth model.
Machines 13 00395 g002
Figure 3. Finite element model of a gear pair with tooth crack.
Machines 13 00395 g003
Figure 4. Calculation results of TVMS at different crack depths.
Machines 13 00395 g004
Figure 5. Calculation results of TVMS at different crack angles.
Machines 13 00395 g005
Figure 6. Schematic diagram of a deterministic gear system.
Machines 13 00395 g006
Figure 7. Time-domain response of DTE for different crack depths: (a) healthy, (b) q = 2 mm, (c) q = 3 mm, and (d) q = 4 mm.
Machines 13 00395 g007
Figure 8. Magnified views for different crack depths.
Machines 13 00395 g008
Figure 9. Frequency-domain response of DTE for different crack depths: (a) healthy, (b) q = 2 mm, (c) q = 3 mm, and (d) q = 4 mm.
Machines 13 00395 g009
Figure 10. Flowchart for computing system uncertainty.
Machines 13 00395 g010
Figure 11. Amplitude–frequency response of a gear system with different uncertain parameters: (a) support stiffness k 2 y uncertainty, (b) mass m 2 uncertainty, (c) Young’s modulus E uncertainty, and (d) multi-source parameter uncertainty.
Machines 13 00395 g011
Figure 12. Amplitude–frequency response of a gear system with tooth cracks containing uncertain parameters: (a) support stiffness k 2 y uncertainty, (b) mass m 2 uncertainty, (c) Young’s modulus E uncertainty, and (d) multi-source parameter uncertainty.
Machines 13 00395 g012
Figure 13. Time-domain response of a gear system with tooth cracks containing uncertain parameters: (a) support stiffness k 2 y uncertainty, (b) mass m 2 uncertainty, (c) Young’s modulus E uncertainty, and (d) multi-source parameter uncertainty.
Machines 13 00395 g013
Figure 14. Diagram of the gear test rig.
Machines 13 00395 g014
Figure 15. Comparison of experimental and theoretical amplitude–frequency responses.
Machines 13 00395 g015
Figure 16. Experimental acceleration signals of the gear test rig at different rotational speeds: (a) time-domain signal at ω = 2700 rpm, (b) frequency-domain signal at ω = 2700 rpm, (c) time-domain signal at ω = 3000 rpm, (d) frequency-domain signal at ω = 3000 rpm, (e) time-domain signal at ω = 3300 rpm, and (f) frequency-domain signal at ω = 3300 rpm.
Machines 13 00395 g016
Table 1. Parameters of the spur gear pair.
ParametersDriving GearDriven Gear
Young’s modulus E (GPa)200200
Poisson’s ratio ν 0.30.3
Density ρ (kg/m3)78507850
Tooth number1624
Module (mm)33
Pressure angle (deg)2020
Teeth width (mm)1515
Support stiffness in x direction (N/m) 4.2 × 10 7 4.2 × 10 7
Support stiffness in y direction (N/m) 4.2 × 10 7 4.2 × 10 7
Mass (kg)0.751.25
Table 2. Comparison between FEM results and analytical results under different crack conditions.
ConditionFEM
(108 N/m)
Proposed Methed (108 N/m)Difference
(%)
Health2.8322.6954.8
q = 2 mm, ν = 45°2.7612.6444.2
q = 3 mm, ν = 45°2.6622.5484.2
q = 4 mm, ν = 45°2.5542.4075.7
q = 3 mm, ν = 30°2.7452.6324.1
q = 3 mm, ν = 60°2.5762.4265.8
Disclaimer/Publisher’s Note: The statements, opinions and data contained in all publications are solely those of the individual author(s) and contributor(s) and not of MDPI and/or the editor(s). MDPI and/or the editor(s) disclaim responsibility for any injury to people or property resulting from any ideas, methods, instructions or products referred to in the content.

