Abstract
This work presents the development of an adaptive thermal protection system for synchronous machines (SMs), taking into consideration the final cooling temperature and the operation point of the machine. This system aims to improve current thermal protections, which consist of a fixed alarm and trip thresholds regardless of the generator’s operating point or ambient temperature. A recurrent neural network (RNN)-based approach has been employed to predict SM temperatures during operation. Multiple tests have been conducted on a specially designed test bench. Inside the windings and iron core of the 5.5 kVA generator, multiple Pt100 sensors have been installed to train the neural network with real temperature values, enabling accurate predictions. The selected RNN model is Long Short-Term Memory (LSTM). Its inputs include electrical variables and the inlet and outlet air temperatures of the SM’s cooling system. The results show that the model accurately defines warning and trip thresholds, significantly improving thermal protection, as these thresholds are no longer fixed values. Additionally, the study suggests validating the model under cooling system failures and exploring its application in water-cooled systems. This research is supported by a patent on real-time thermal diagnostics for synchronous machines, highlighting its potential contribution to predictive maintenance and the monitoring of power generation systems.
1. Introduction
Rotating electrical machines have traditionally been reliable devices with very few failures. However, in recent times, more optimized designs have led to an increased likelihood of faults occurring during their operation.
At the same time, the industrial application of these types of electrical machines demands even greater productivity, meaning that downtime is due to failures or maintenance results in significant economic losses for the owner.
One of the main reasons for machine stoppages is the activation of protective systems. These protections are designed to ensure safety, both for the machine and for the workers. Additionally, these protection systems must contribute to the reliability of the machine’s operation, as well as that of the electrical system in general, especially in the case of large synchronous generators [1].
There are numerous types of protection, including thermal protections, which ensure that temperature limits are not exceeded—either based on the manufacturer’s recommendations or the insulation properties of the machine.
To achieve this, temperature sensors are installed at specific points during the machine’s manufacturing process: in the windings, in the magnetic core, and at both the inlet and outlet of the primary coolant and heat exchangers [2]. These sensors are part of the data acquisition, control, and supervision system, commonly known as SCADA (Supervisory Control and Data Acquisition). However, despite their power and capabilities, in most cases, they are only used to detect when preset temperature limits have been exceeded, triggering an alarm or a shutdown signal [3,4,5].
Protection systems have undergone significant evolution, particularly in the field of research on protections for permanent magnet synchronous machines (PMSMs) [6,7]. These range from systems that use machine data—such as assigned current and thermal time constant—to calculate temperature, to sophisticated digital relays that enable more complex protection schemes and even allow for the connection of temperature sensors.
In this context, there is a growing need to develop protection systems capable of minimizing the number of unwanted stoppages while maximizing the machine’s lifespan. In other words, adaptive protections that adjust their thresholds based on the machine’s operating point and can detect issues even under low load conditions, without reaching temperatures near the shutdown threshold.
In recent years, significant advancements have been made in the thermal simulation of electrical machines and their cooling, using techniques such as finite element analysis (FEA) and computational fluid dynamics (CFD). These advancements allow for much more precise design [8,9,10,11].
However, we are currently in a crucial stage of industrial development, driven by data monitoring and analysis using tools enabled by the rapid advancement in the manufacturing of increasingly powerful microprocessors. These advancements have drastically reduced the previous limitations in handling large volumes of data.
Within this context, electrical engineering is one of the fields that is adapting most rapidly to data monitoring and analysis. This enables network assets to be equipped with automatic control and has led to the development of numerous artificial intelligence applications, ranging from real-time demand management to equipment monitoring.
Recent advancements in temperature monitoring and predictive maintenance for electrical elements have been significantly influenced by artificial intelligence and data-driven models. Several studies have successfully estimated temperature variations in lithium-ion batteries using recurrent neural networks (RNNs) [12,13], highlighting their potential for thermal analysis in industrial applications. Similarly, RNN-based methodologies have been applied to synchronous generators and permanent magnet synchronous machines, enhancing predictive capabilities for fault protection and diagnostics [14,15,16].
Temperature prediction remains a crucial factor in developing intelligent protection systems. Deep learning models, including neural networks and linear regression techniques, have significantly improved real-time monitoring accuracy in PMSMs [17,18,19,20]. Reinforcement learning and optimization techniques have also been employed to enhance temperature prediction and control strategies [21,22,23].
Beyond temperature estimation, AI-driven approaches have been applied to fault diagnosis and severity assessment in synchronous machines, improving reliability and adaptive protection strategies [24,25]. Additionally, recent innovations have integrated differentiable physics models with machine learning techniques to enhance thermal modeling accuracy [26,27,28,29,30,31].
This paper focuses on data monitoring and analysis, proposing an RNN as a dynamic thermal protection mechanism for synchronous machines, with potential applications in other electrical machines like transformers. The system continuously considers the machine’s load state, using electrical variables such as voltage (U), active power (P), reactive power (Q), and excitation current (If) as inputs. This innovative approach enables more adaptive and precise protection strategies, optimizing machine reliability and efficiency. The main innovation of this work is the development of a dynamic thermal protection using an RNN, improving the existing method of thermal protection in the synchronous machine, achieving warning and temperature trip thresholds that are adjusted according to the electrical operating point of the machine as well as taking into account the previous operating points of the machine.
2. Materials and Methods
2.1. Experimental Setup
Multiple long-duration tests under constant operation points (P, Q, and U) were carried out on a special 5.5-kVA, 400-V static excitation salient-poles synchronous machine. The ratings and main characteristics of the SM are summarized in Table 1:

Table 1.
Experimental synchronous machine ratings.
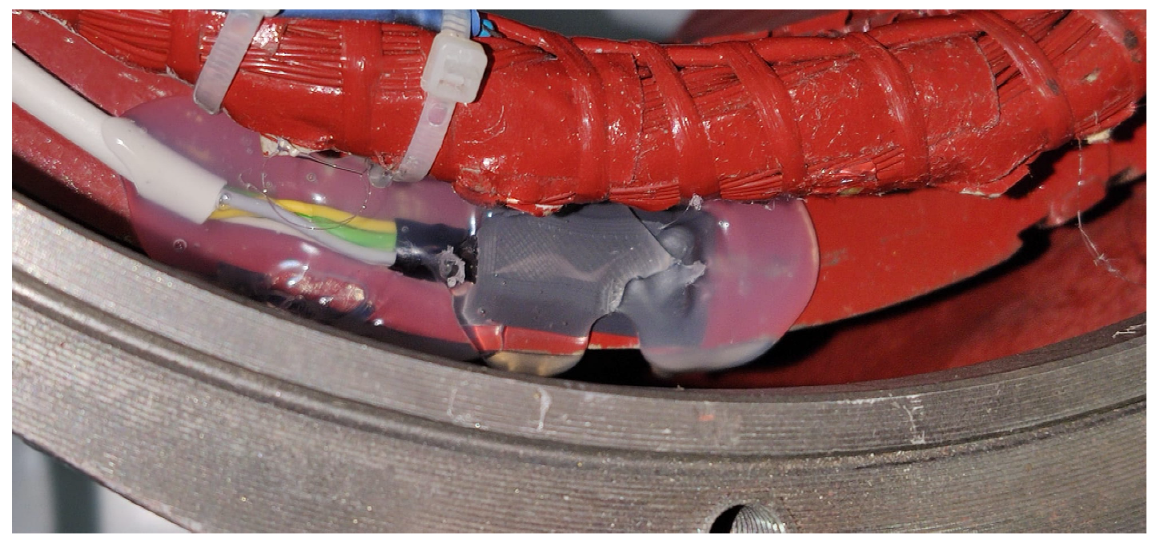
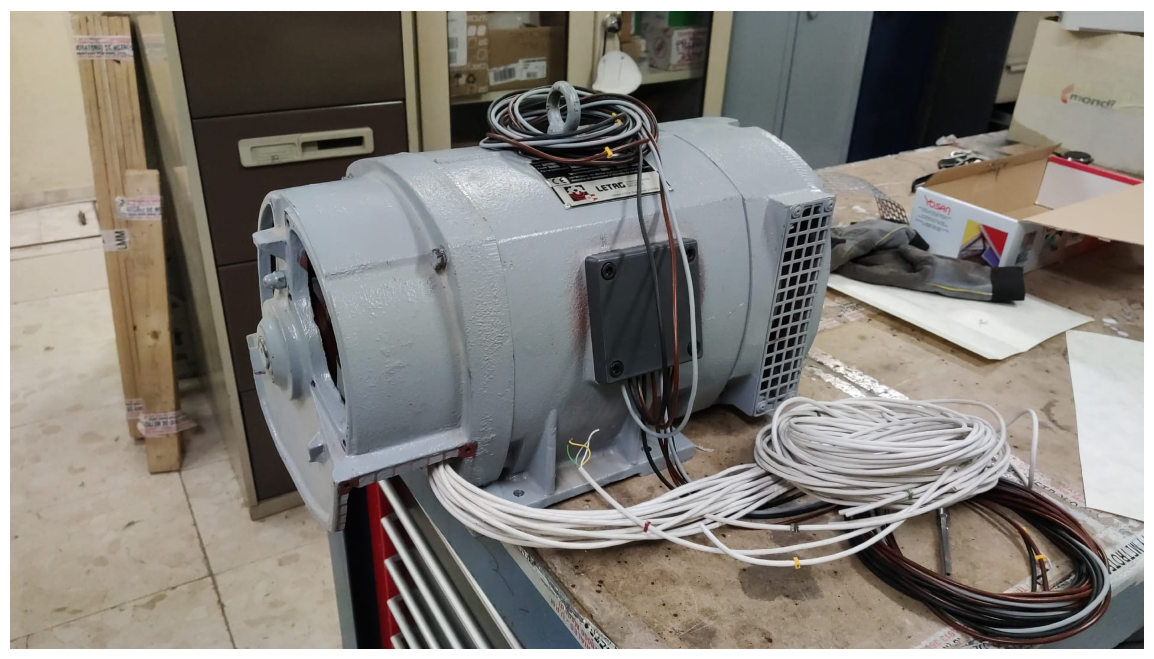
This SM was modified by adding 14 temperature sensors (Pt-100) to monitor the temperature in the stator windings, in the iron core and in the cooling air. An example of Pt-100 installation in the stator windings can be observed in Figure 1 and in the stator iron core in Figure 2. The synchronous machine after the installation of all the temperature sensors is shown in Figure 3.
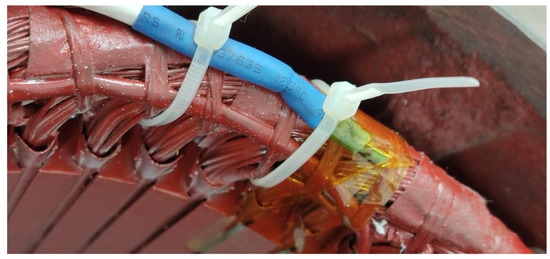
Figure 1.
Winding temperature sensor Pt-100 installation.

Figure 2.
Iron core temperature sensor Pt-100 installation.

Figure 3.
Synchronous machine after the installation of the temperature sensors.
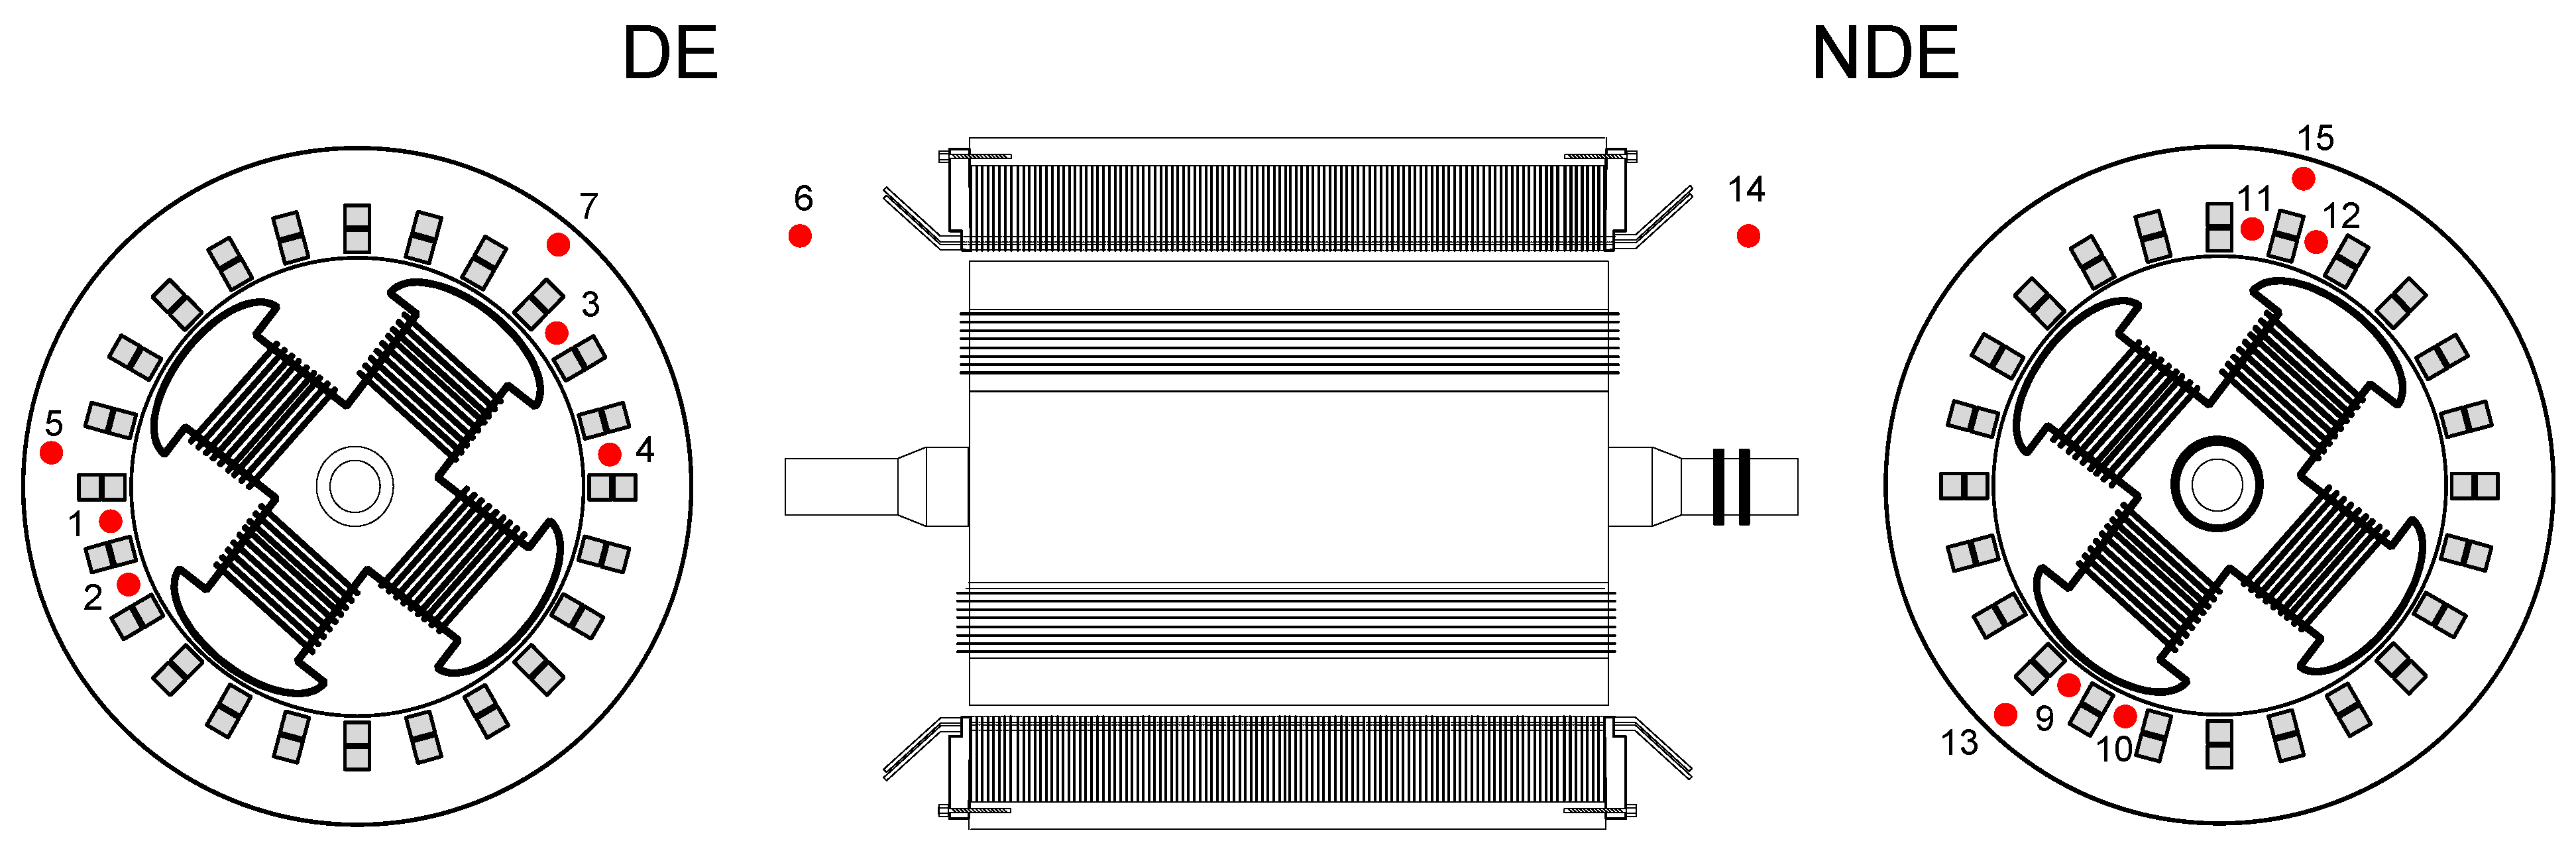
The position of all the temperature sensors installed in the machine are displayed in Figure 4. The sensors are installed in the windings (1, 2, 3, 4, 9, 10, 11, and 12) to try and observe the temperature variations in opposite sides of the stator, and in the iron core (5, 7, 13, and 15) of the driven end (DE) and the non-driven end (NDE). The sensors are placed at the right and left side of the machine. Moreover, there are two external sensors for cold air (14) and hot air (6).
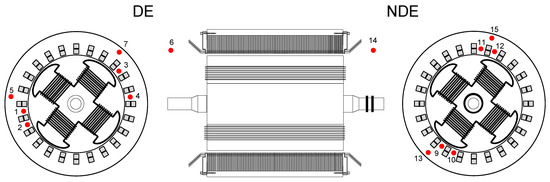
Figure 4.
Temperature sensor positions. Windings (1, 2, 3, 4, 9, 10, 11, and 12), iron core (5, 7, 13, and 15), cold Air (14), and hot air (6).
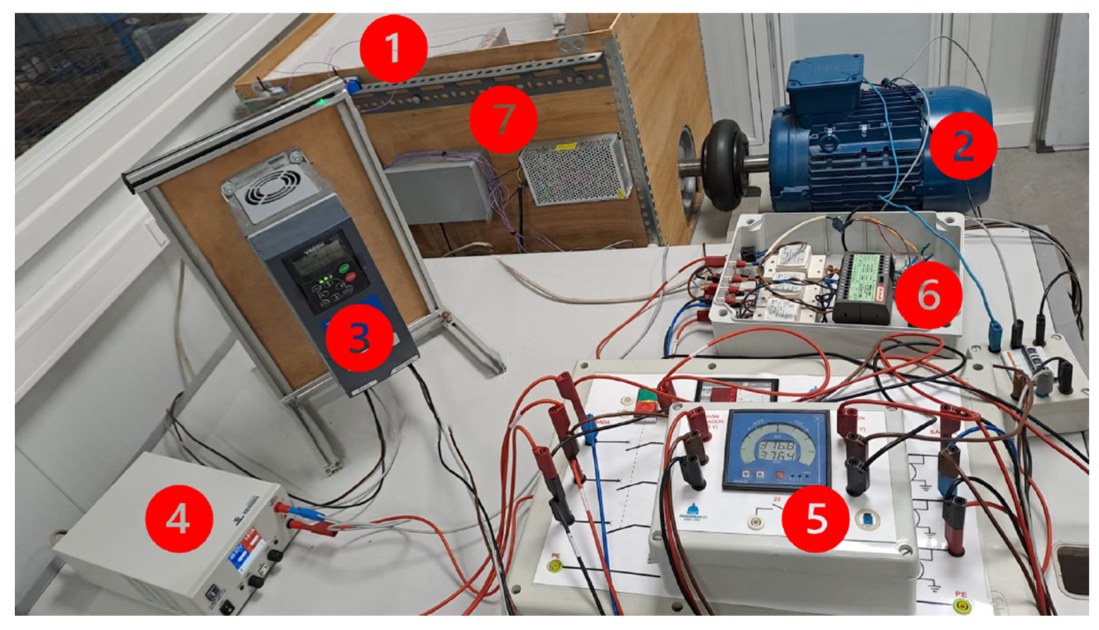
The completed experimental setup can be seen in Figure 5. The synchronous generator (1) is driven by an induction motor (2) fed with a frequency converter (3). In this way it is possible to control the active power supplied by the generator. The excitation of the synchronous machine is fed by a DC power supply (4) that allows for the control of the reactive power of the generator. The generator is connected to the power system by a synchro check relay (5).
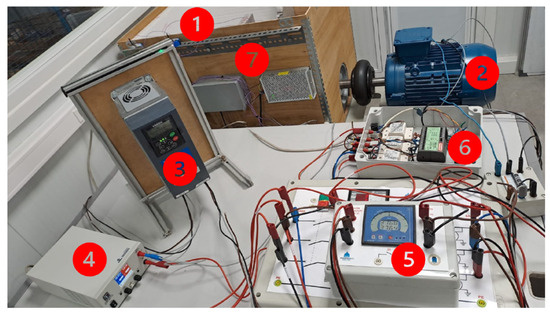
Figure 5.
Experimental setup.
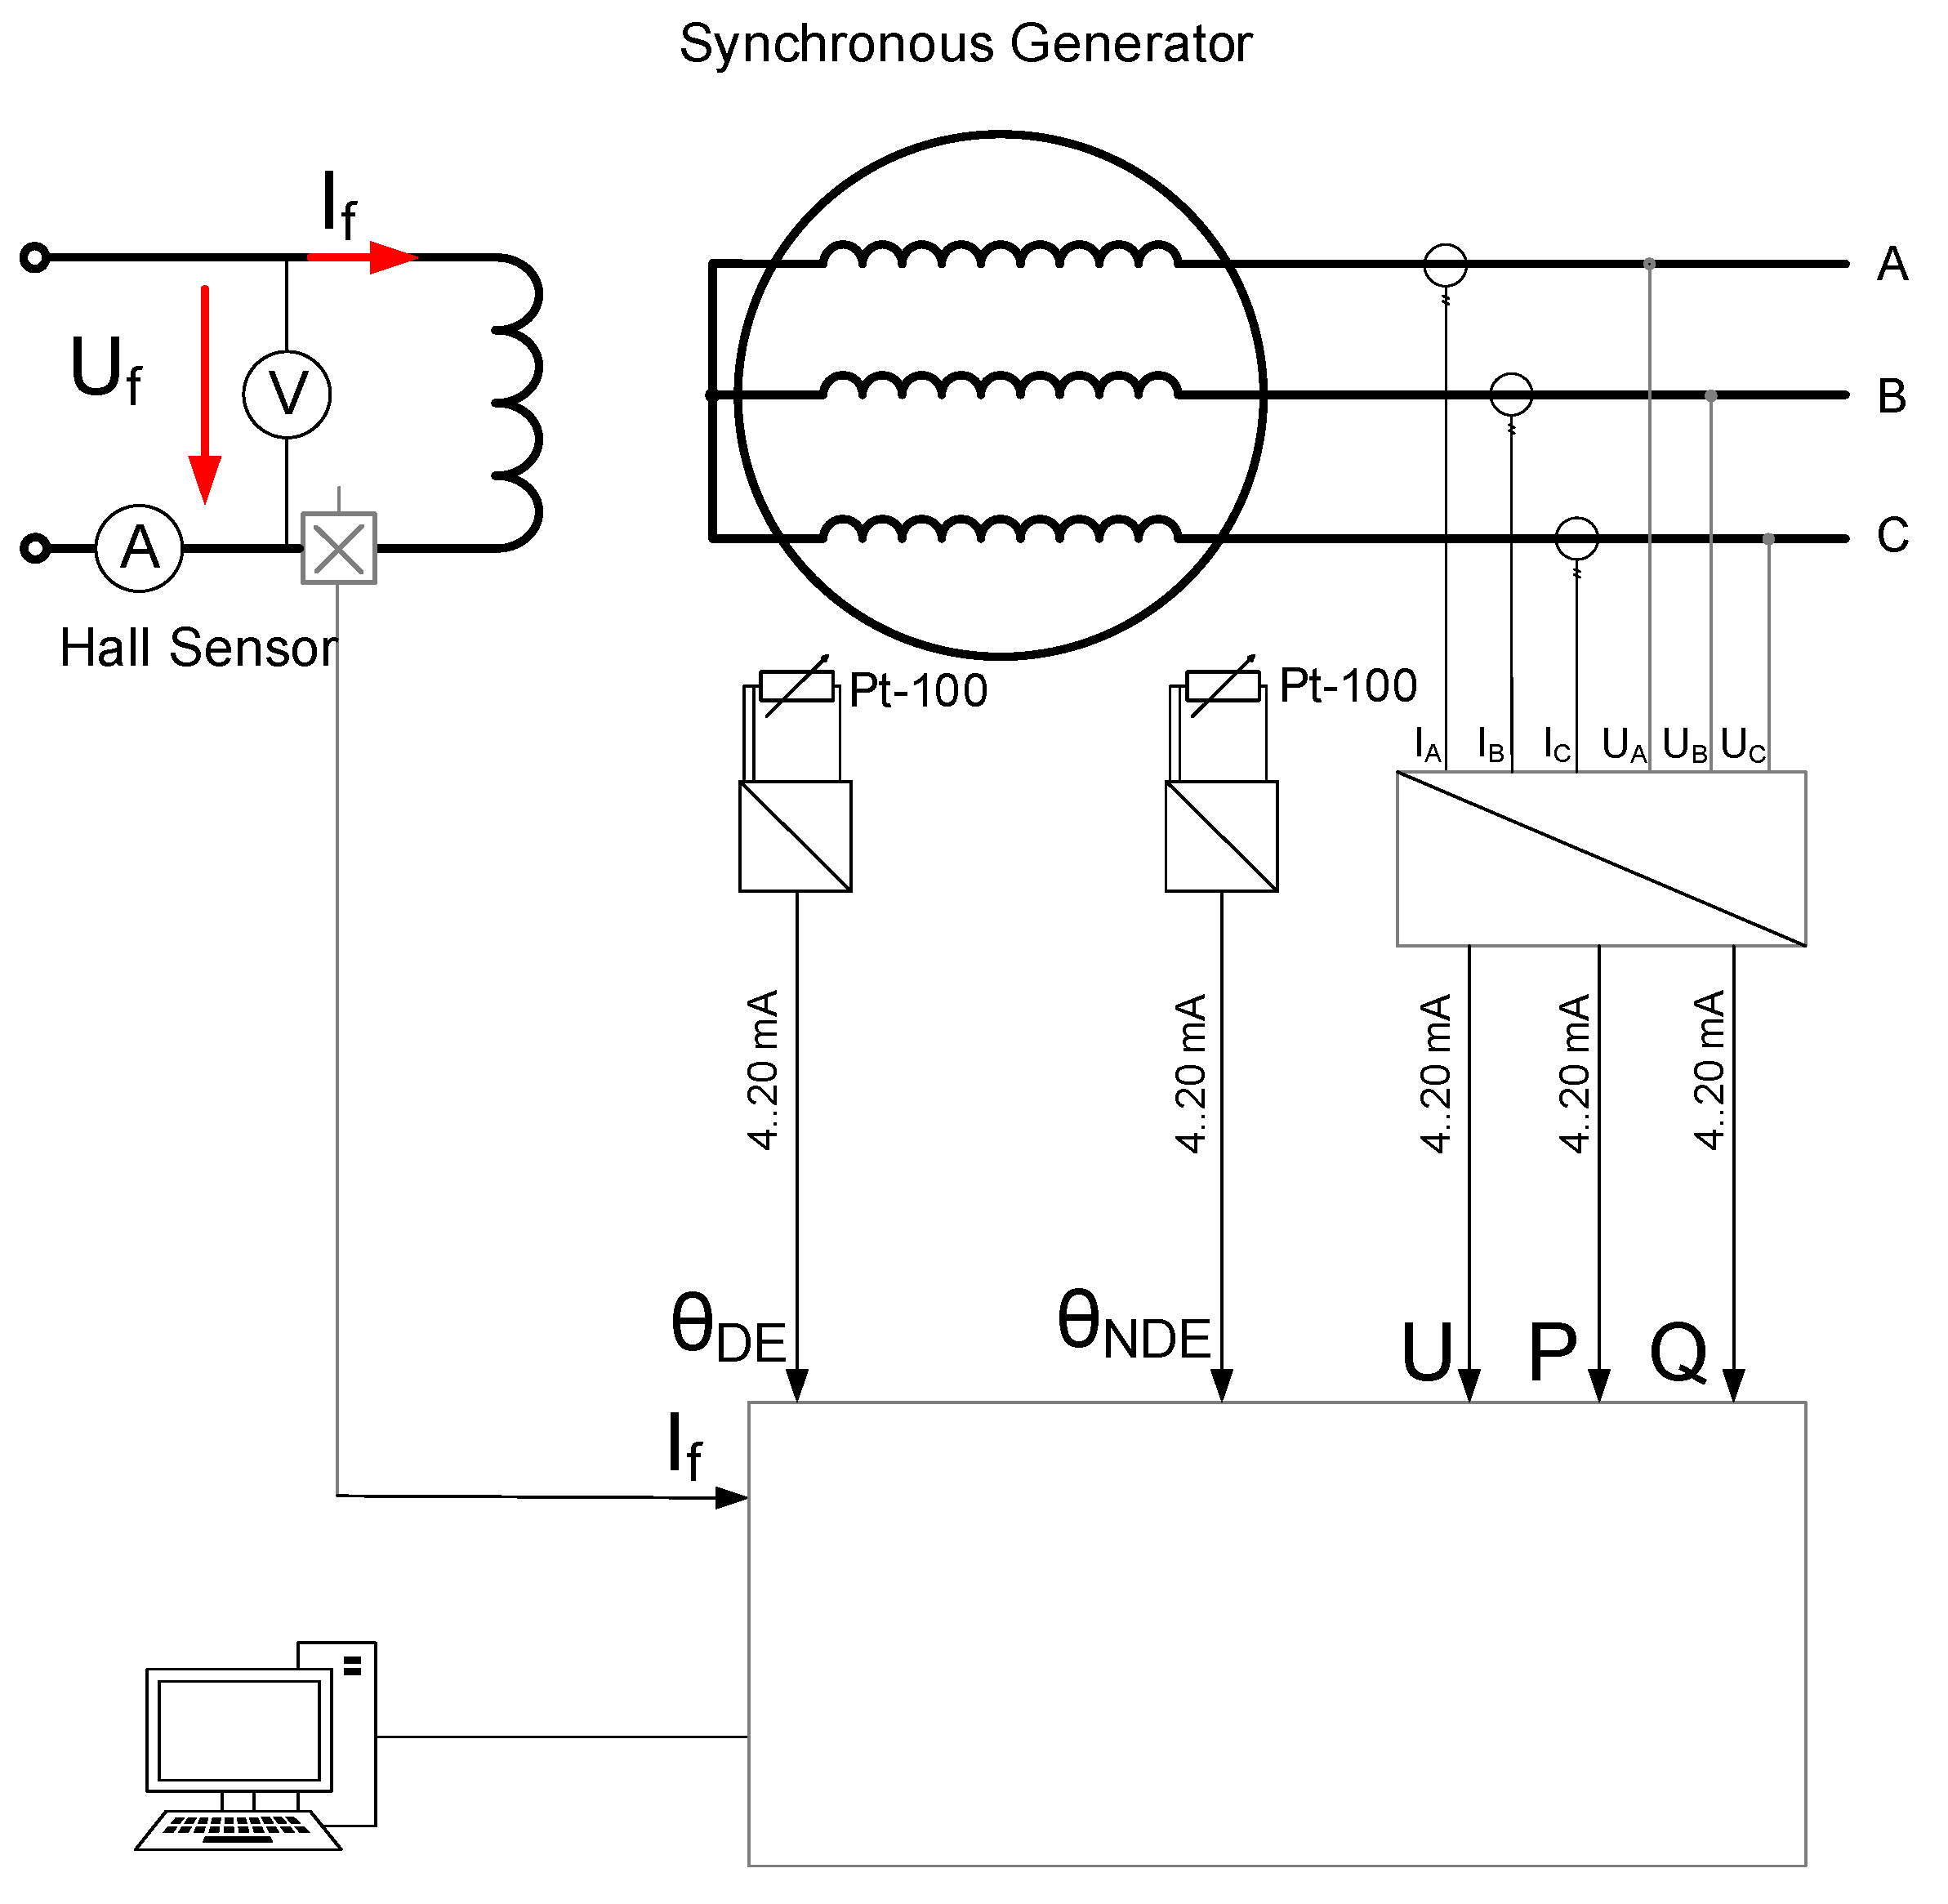
The electrical metering devices are placed in (6). The values of the active power (P), reactive power (Q), and stator voltage (U), are measured by a commercial 3-channel programmable transducer (SINEAX M563, ABB Measurement & Analytics, Wohlen, Switzerland) fed from three current transformers. The field current (If) is measured using a Hall effect sensor directly compatible with an Arduino© microcontroller. All the electrical measurements are recorded on a computer through an Arduino© microcontroller, communicating via the COM port of the computer. All the temperature metering devices are placed in (7). The temperature sensors are connected to the microcontroller through Pt-100 to 4… 20 mA converters. A simplified electrical diagram is shown in Figure 6.
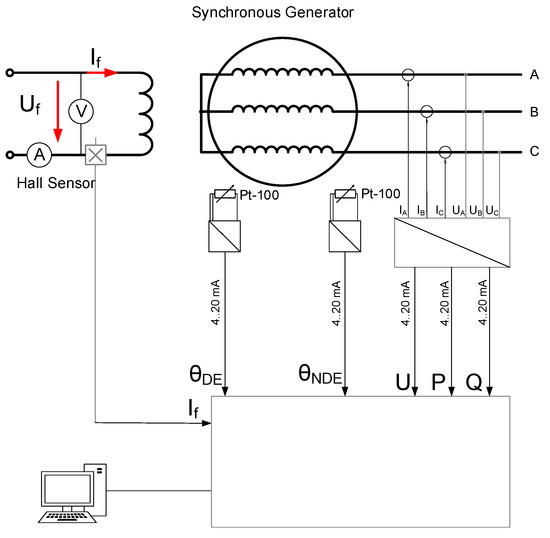
Figure 6.
Experimental setup simplified electrical schema.
2.2. Data Set Description
In order to analyze the thermal behavior of the machine, heating and cooling tests were carried out at a wide range of machine operating points. For the heating tests, the data are recorded from the start of the SM and for the cooling tests from the moment the SM stops. The tests were carried out at different active and reactive power levels of the machine to cover its entire generation curve. The tests performed are summarized in Table 2:
Table 2.
Tests performed.
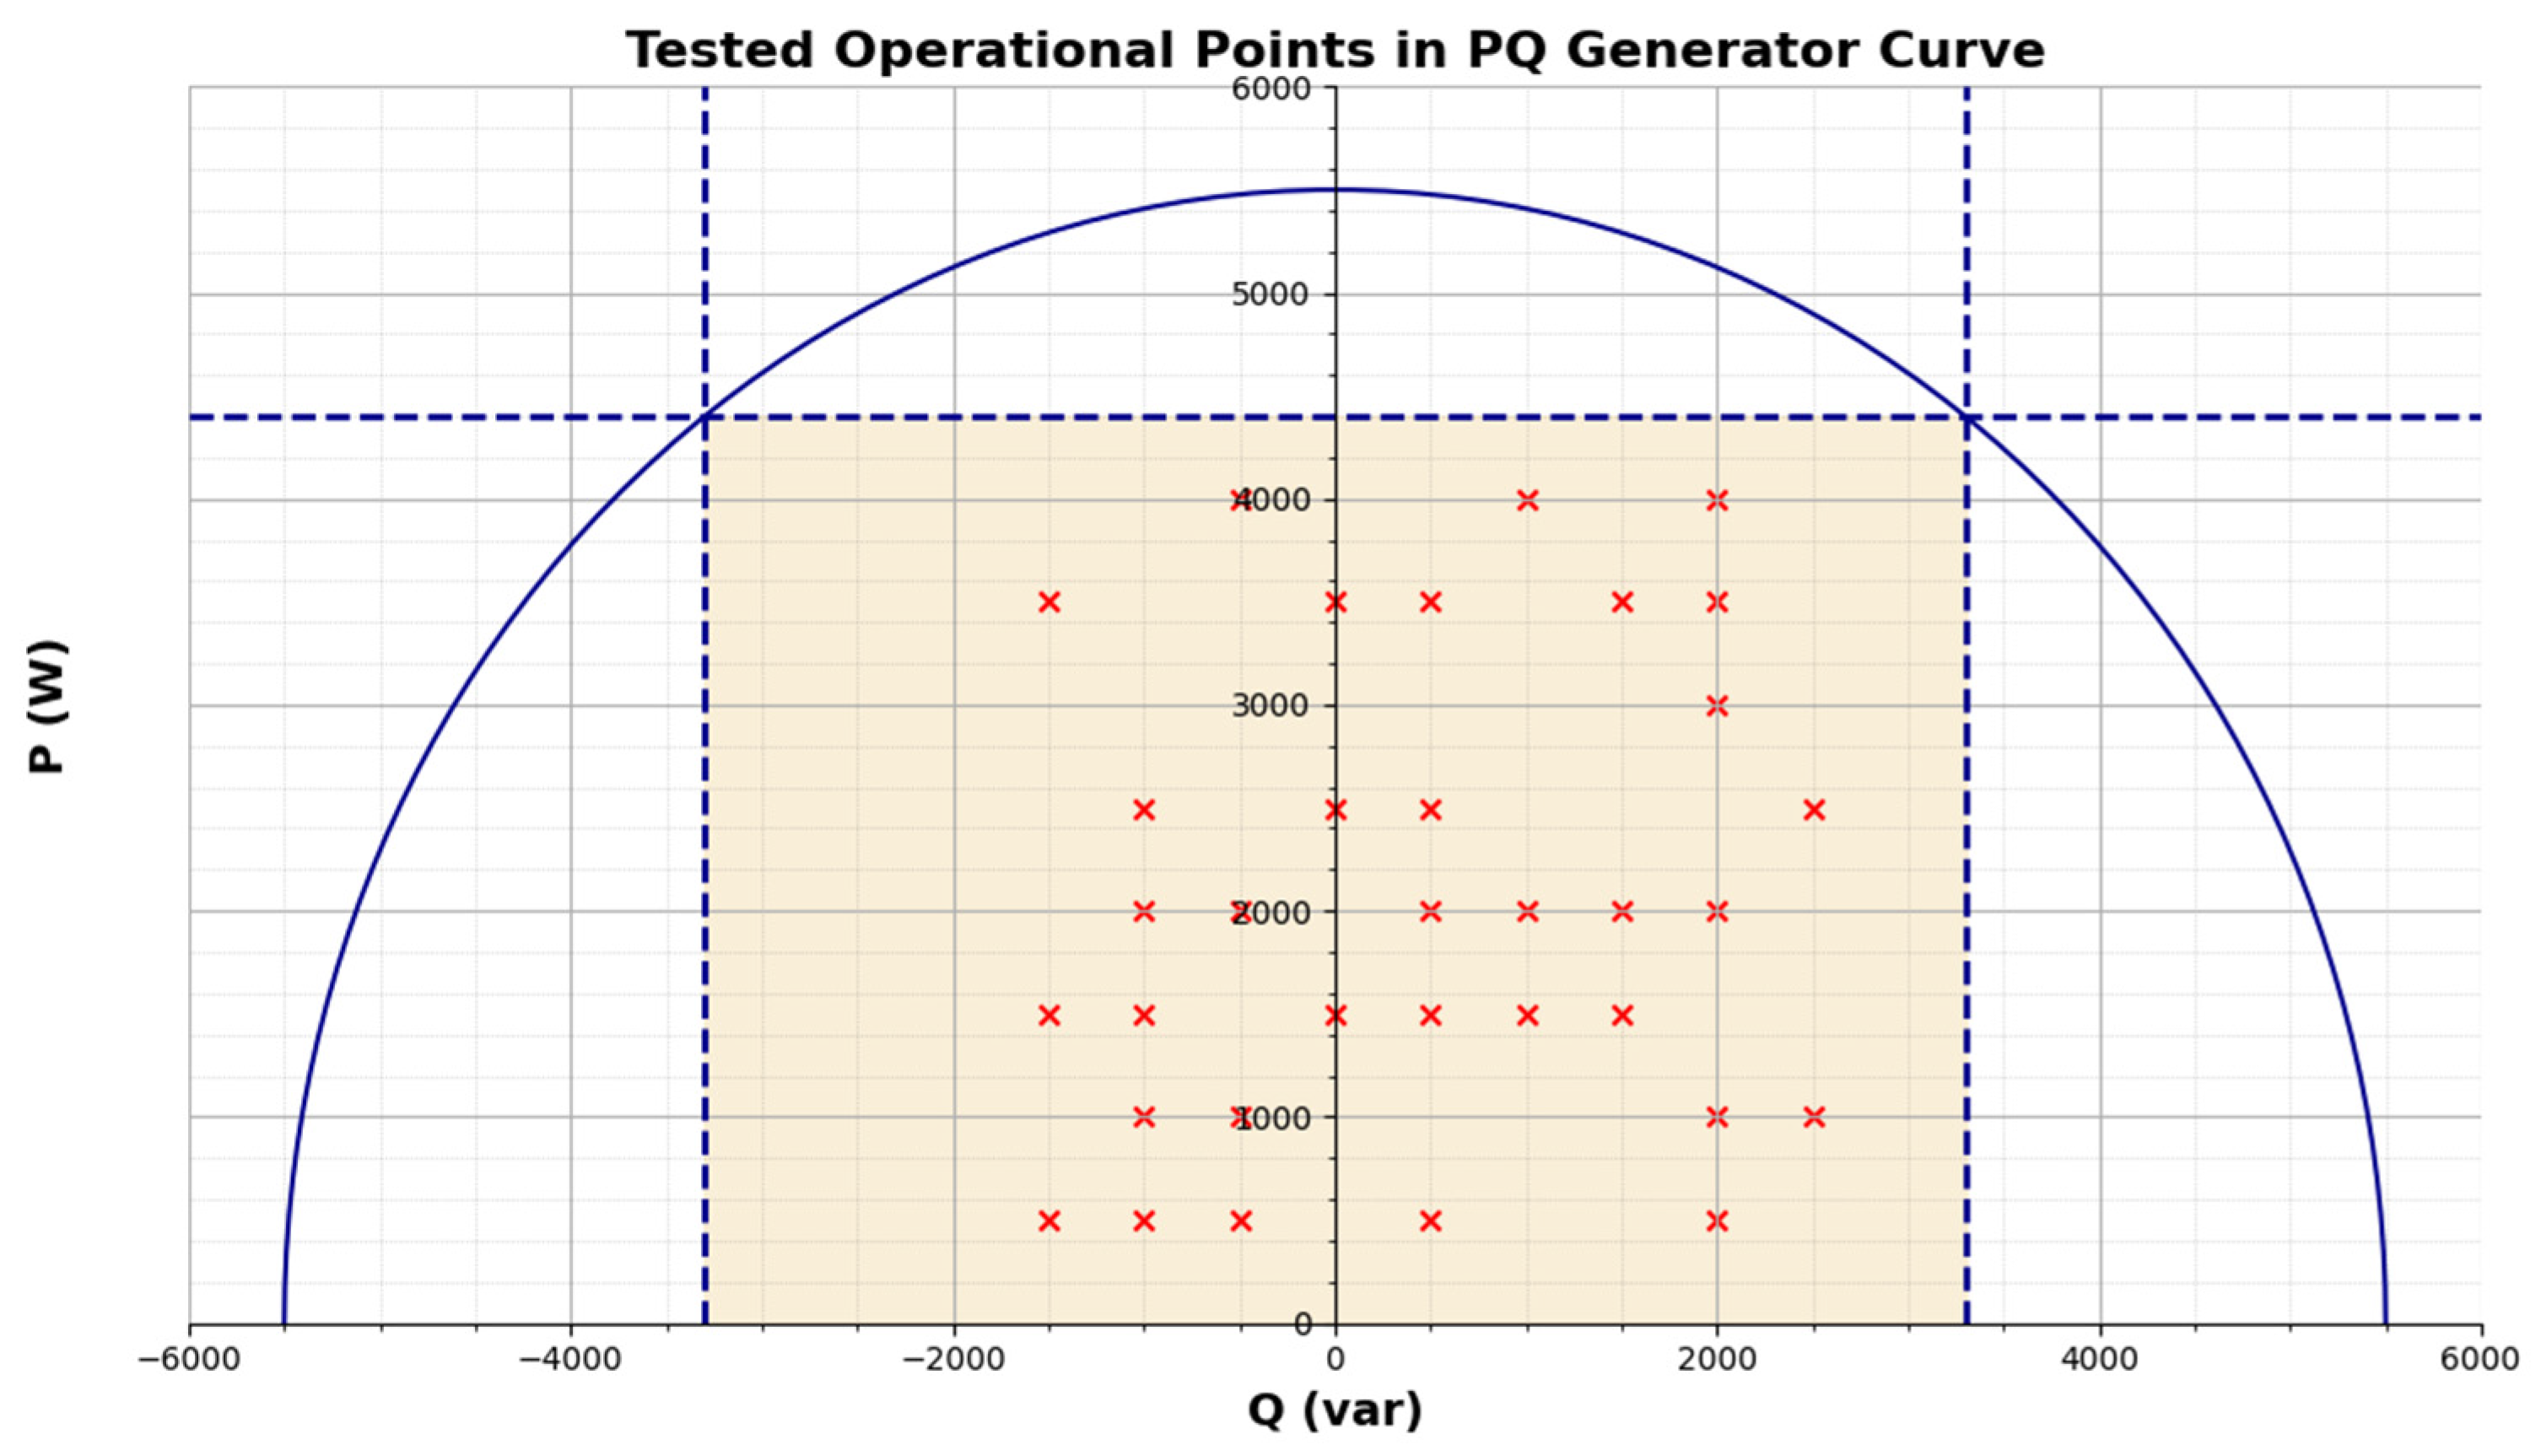
Figure 7 shows the tests performed that were referenced in the previous table in the PQ Curve of the generator:

Figure 7.
Tested operational points in the PQ generator curve.
The semicircle in blue is the stator rated current of the generator, the vertical lines in blue represent the limits of the generator in terms of injection and consumption of reactive power (5.5 kVA × 0.6 = 3.3 kvar) and the horizontal line in blue is the maximum limit of active power (5.5 kVA × 0.8 = 4.4 kW). So, the vanilla rectangle shows the operational range of the generator to perform the test. The red crosses show the tests performed.
2.3. Experimental Results
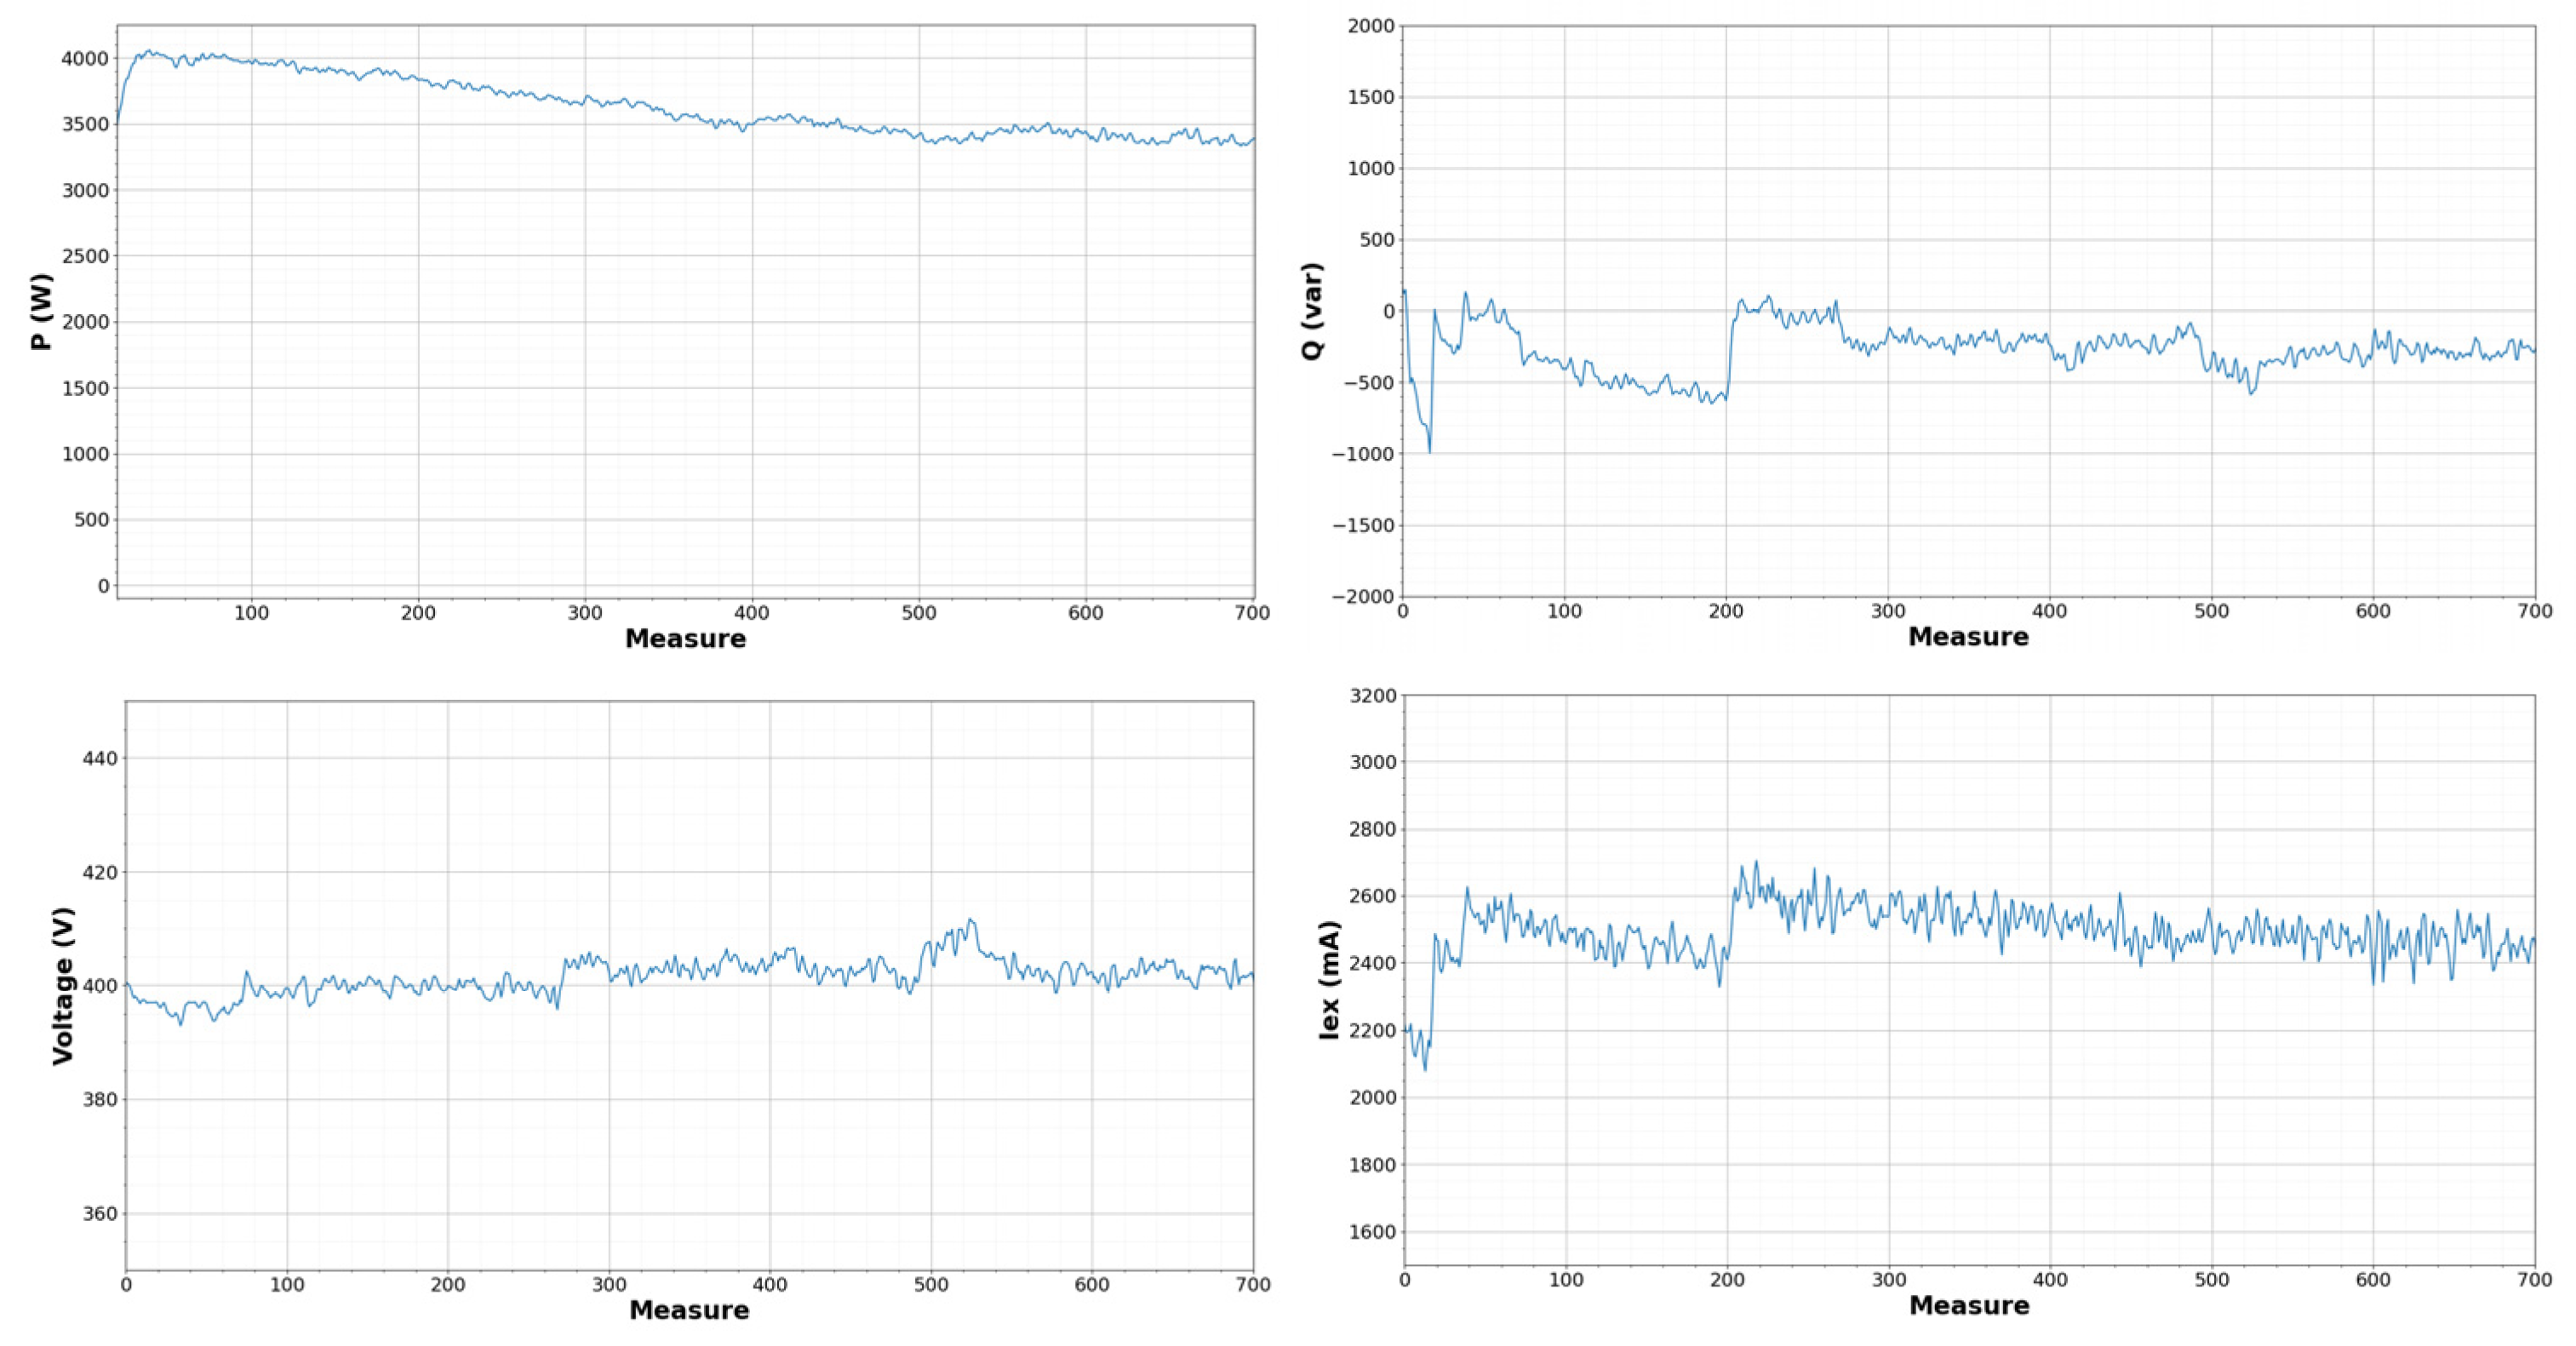
Multiple tests have been carried out to characterize the thermal behavior of the SM to have a great dataset to train a neural network that predicts the temperatures of the sensors during the operation of the machine. In all the tests, electrical and thermal variables are measured. Figure 8 and Figure 9 show these variables during a heating test:
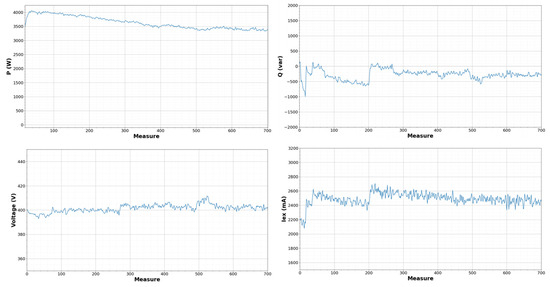
Figure 8.
Electrical variables measured during a heating test (P = 4000 W, Q = −500 var).
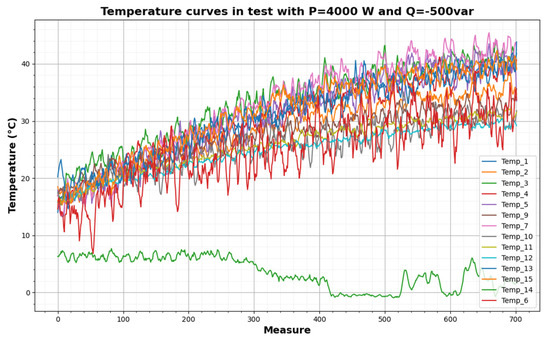
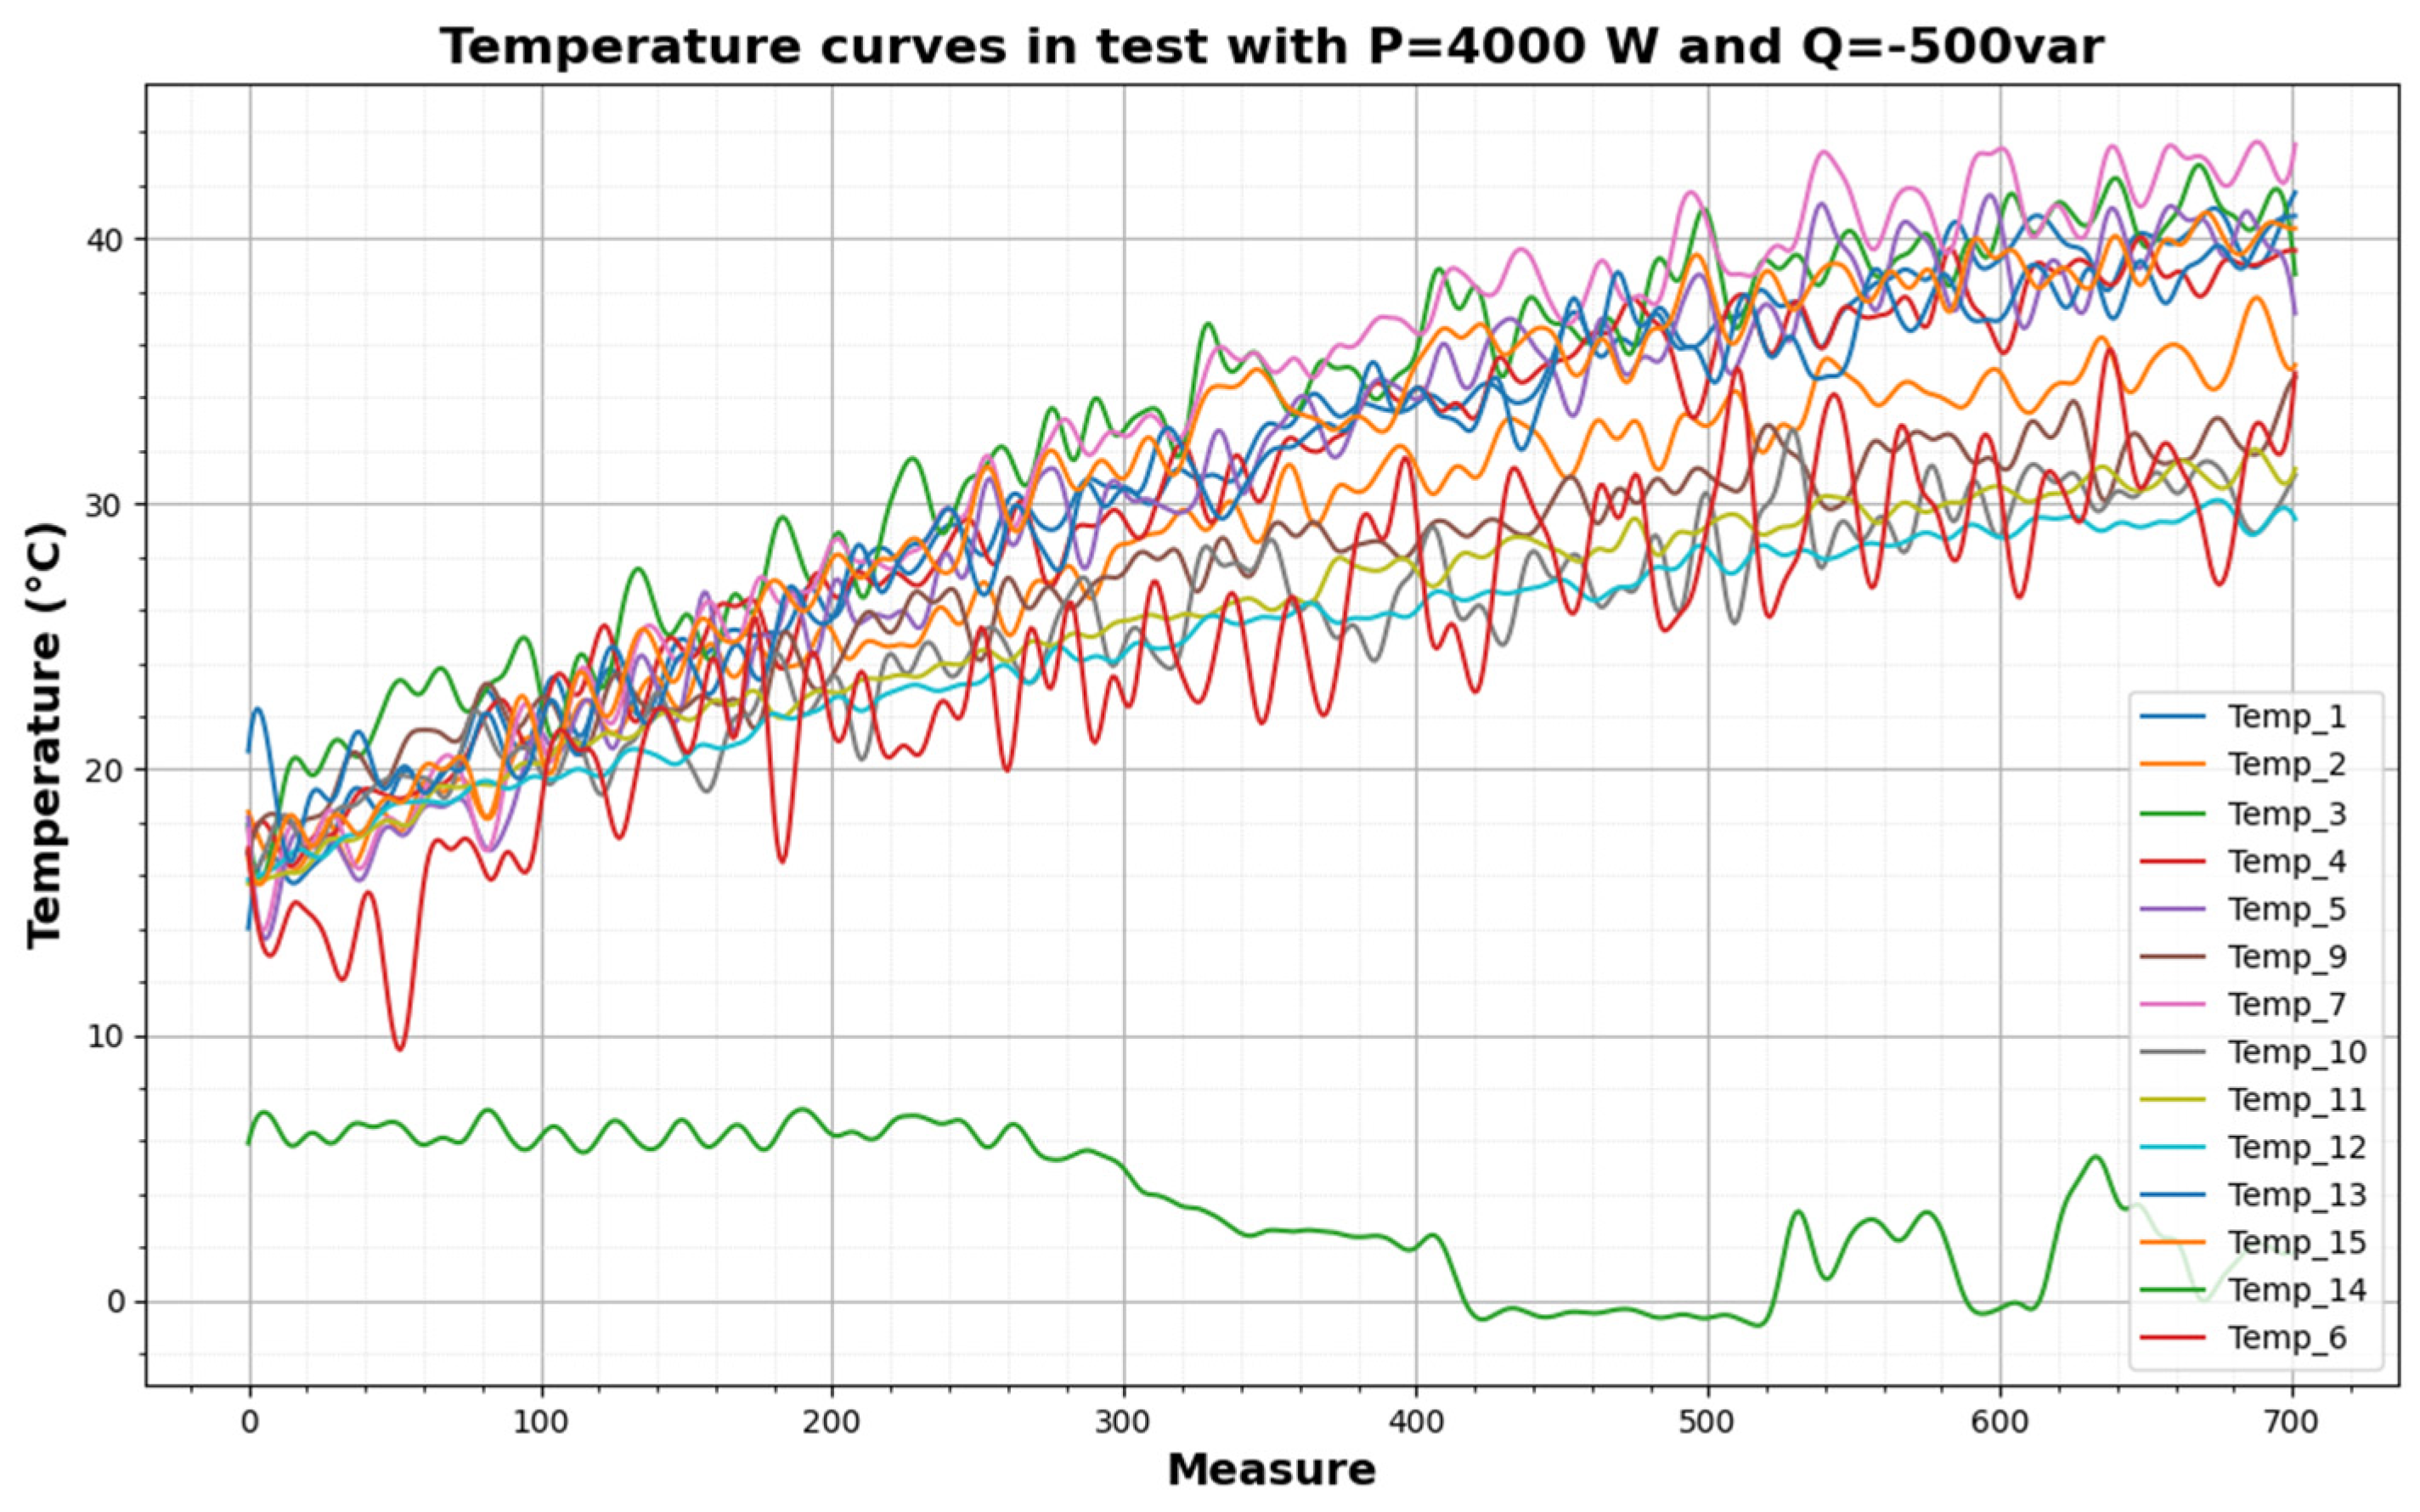
Figure 9.
Thermal variables measured during a test (P = 4000 W, Q = −500 var).
Figure 8 shows that the active power decreases a bit during the test, and the reactive current changes due to the change in the grid voltage in the laboratory. The X-axis unit is the number of measurements (the time between measurements is 5 s).
Figure 9 shows the temperature measurements during a test. The temperature measurements are noisy during heating tests due to the frequency converter. In order to not introduce noise into the neural network, a two-step Savitsky–Golay filter is used [32]. The parameters of the filter are the following: window_1 = 5, poly_order_1 = 3, window_2 = 11, and poly_order_2 = 5. After the filter, the thermal variables measured are shown in Figure 10. In both figures, one of the thermal variables has a much lower value than the others, that of temperature sensor 14, because it is the measured temperature of the cold air entering the cooling system.

Figure 10.
Thermal variables measured after filter (P = 4000 W, Q = −500 var).
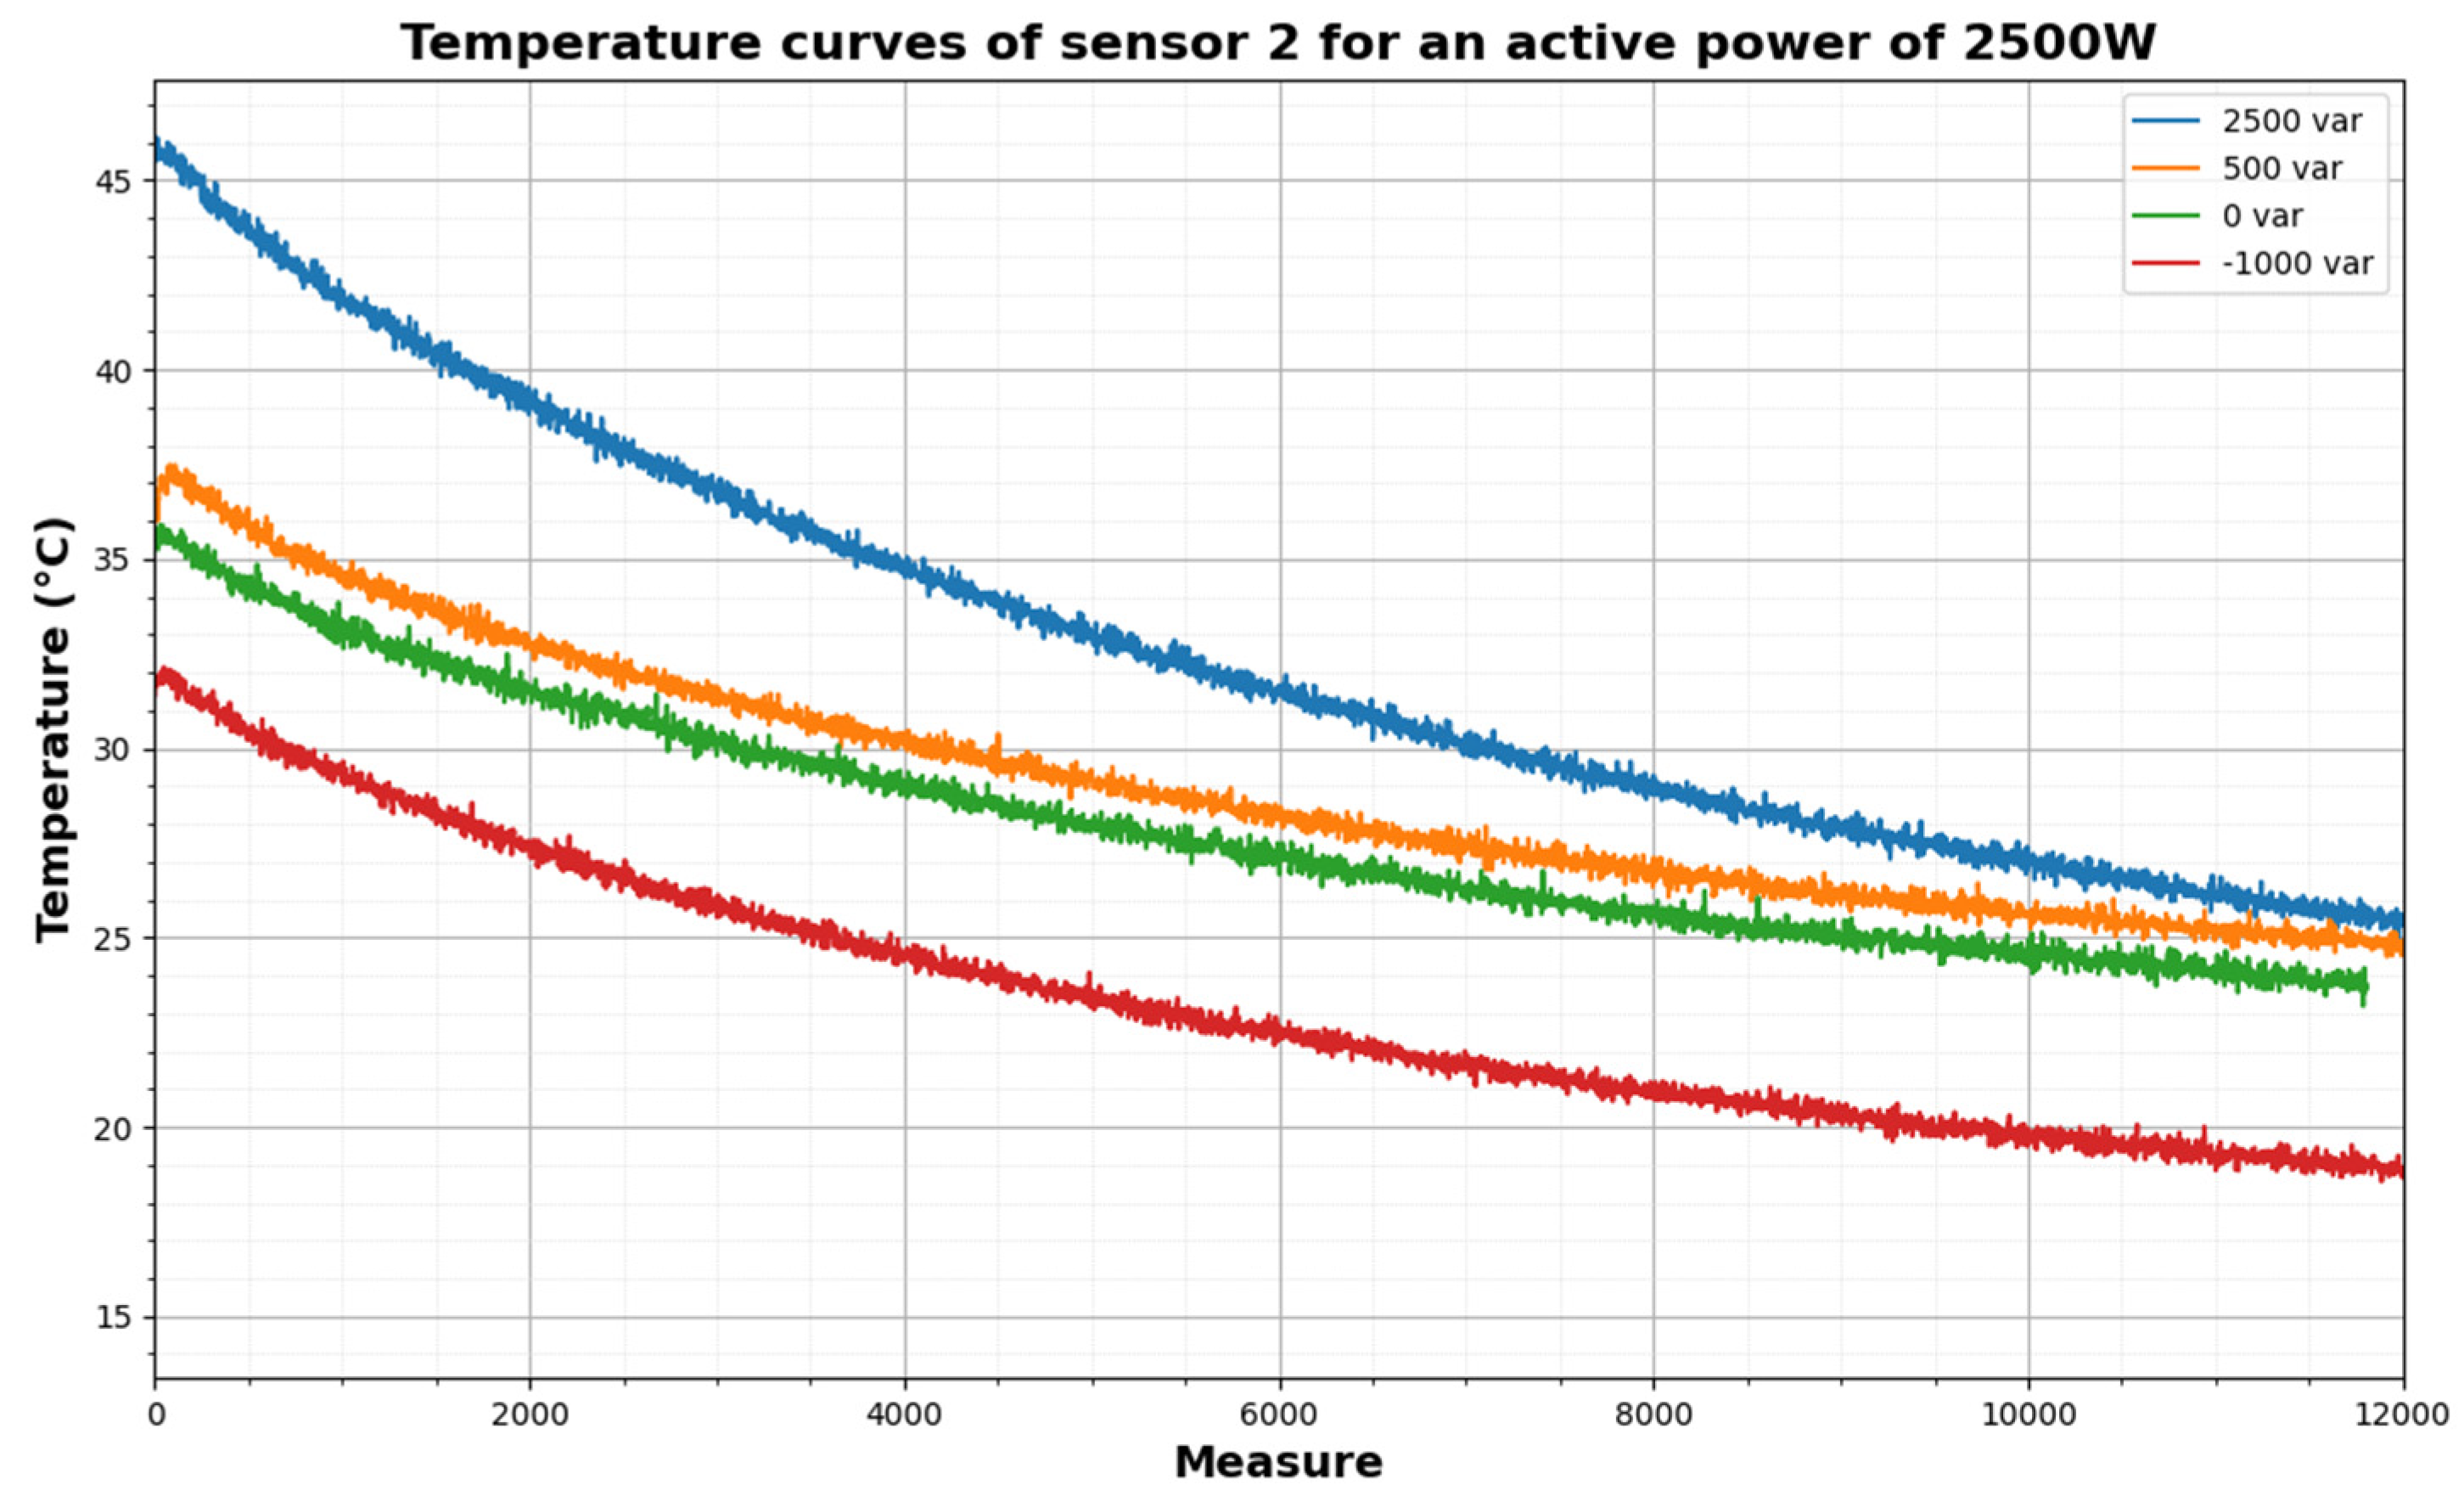
In Figure 11, a set of curves is shown representing the different cooling tests performed for P = 2500 W, while varying the reactive power.
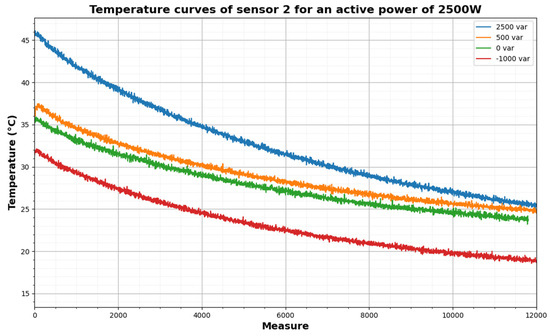
Figure 11.
Temperature curves of sensor 2 in test with P = 2500 W.
The measurements during the cooling tests have not presented noise because the frequency variator is off, so no Savitsky–Golay filter needs to be used.
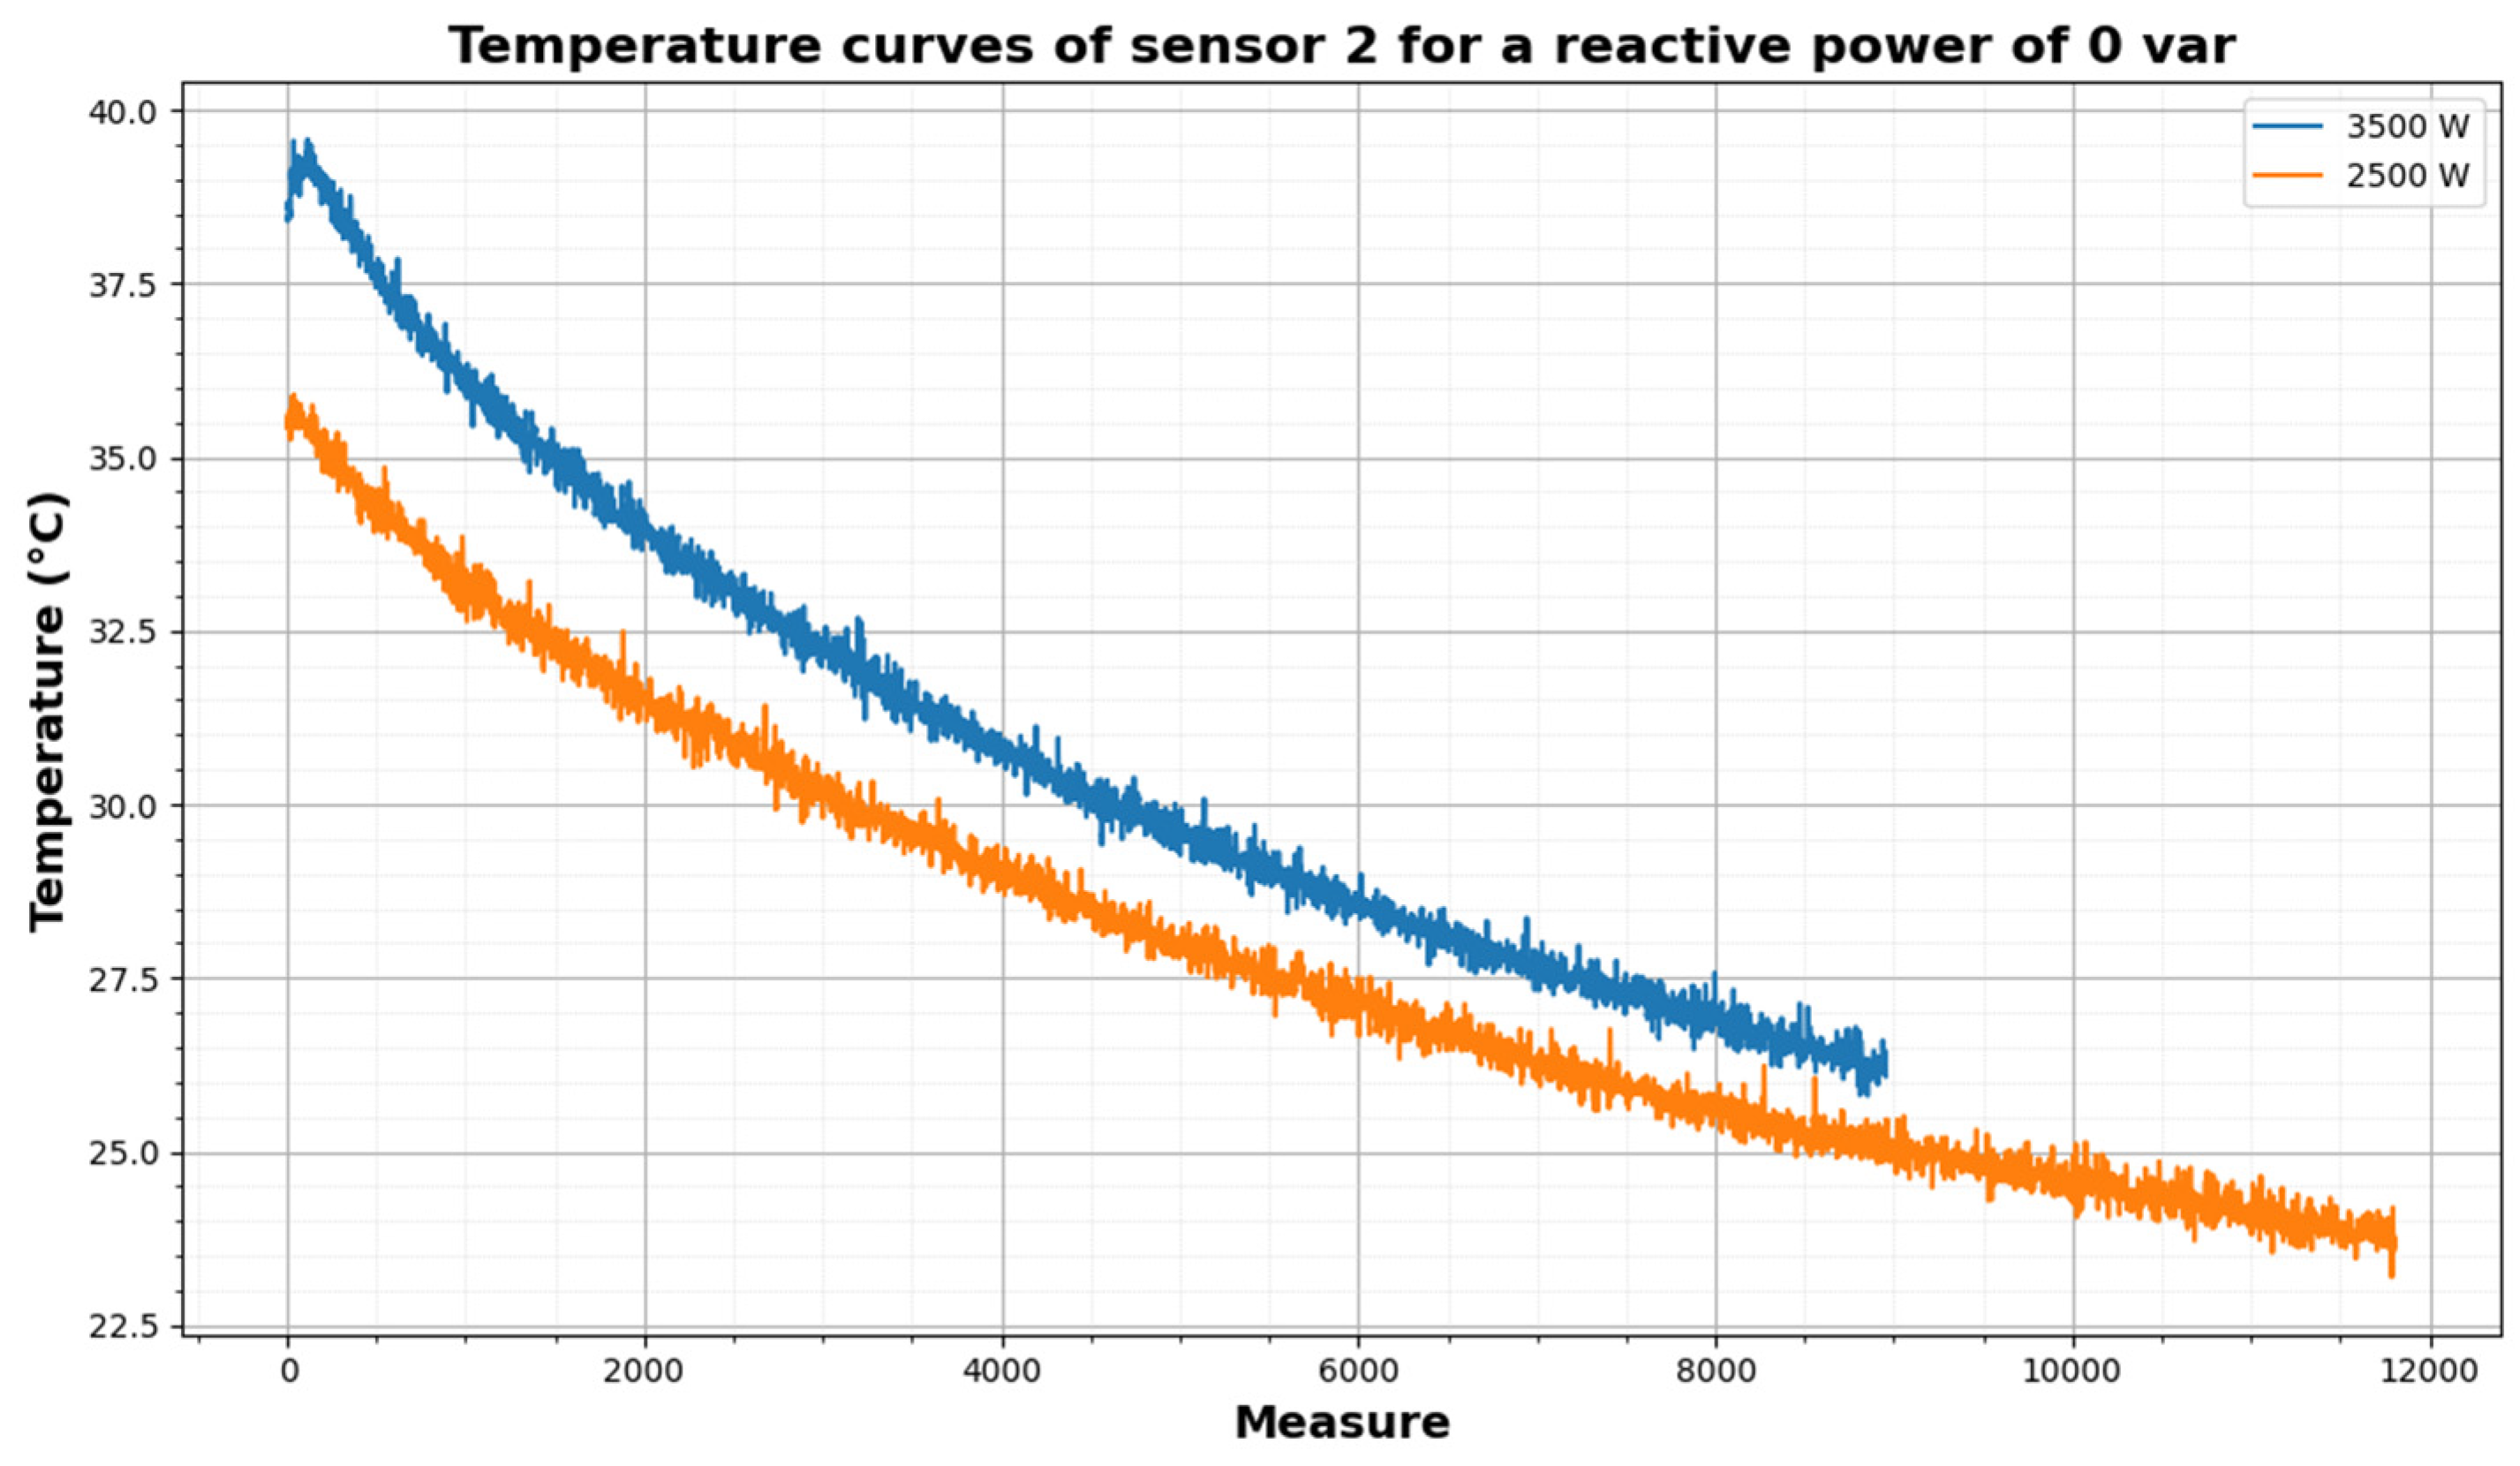
In Figure 12, a set of curves is shown representing the different cooling tests performed for Q = 0, while varying the active power.

Figure 12.
Temperature curves of sensor 2 in test with Q = 0 var.
As can be seen in Figure 12, with higher active power the temperature reached is higher.
With all of the dataset summarized in Table 2, a Long Short-Term Memory (LSTM) neural network has been trained. The total data collected from the heating tests is around 30.000 measurements and from the cooling tests is 120.000 measurements. The number of measurements varies slightly due to the time required to reach steady-state conditions: approximately 1 h during the heating tests and approximately 12–15 h during the cooling tests. On average, a heating test includes around 930 measurements, while a cooling test comprises approximately 3740 measurements.
2.4. Long Short-Term Memory Neural Network
The LSTM neural network is a special variant of the RNNs, modified to solve some inherent problems of the RNNs. In this variant, a more sophisticated memory mechanism system is introduced that allows for the control of the dependance of the previous data more effectively.
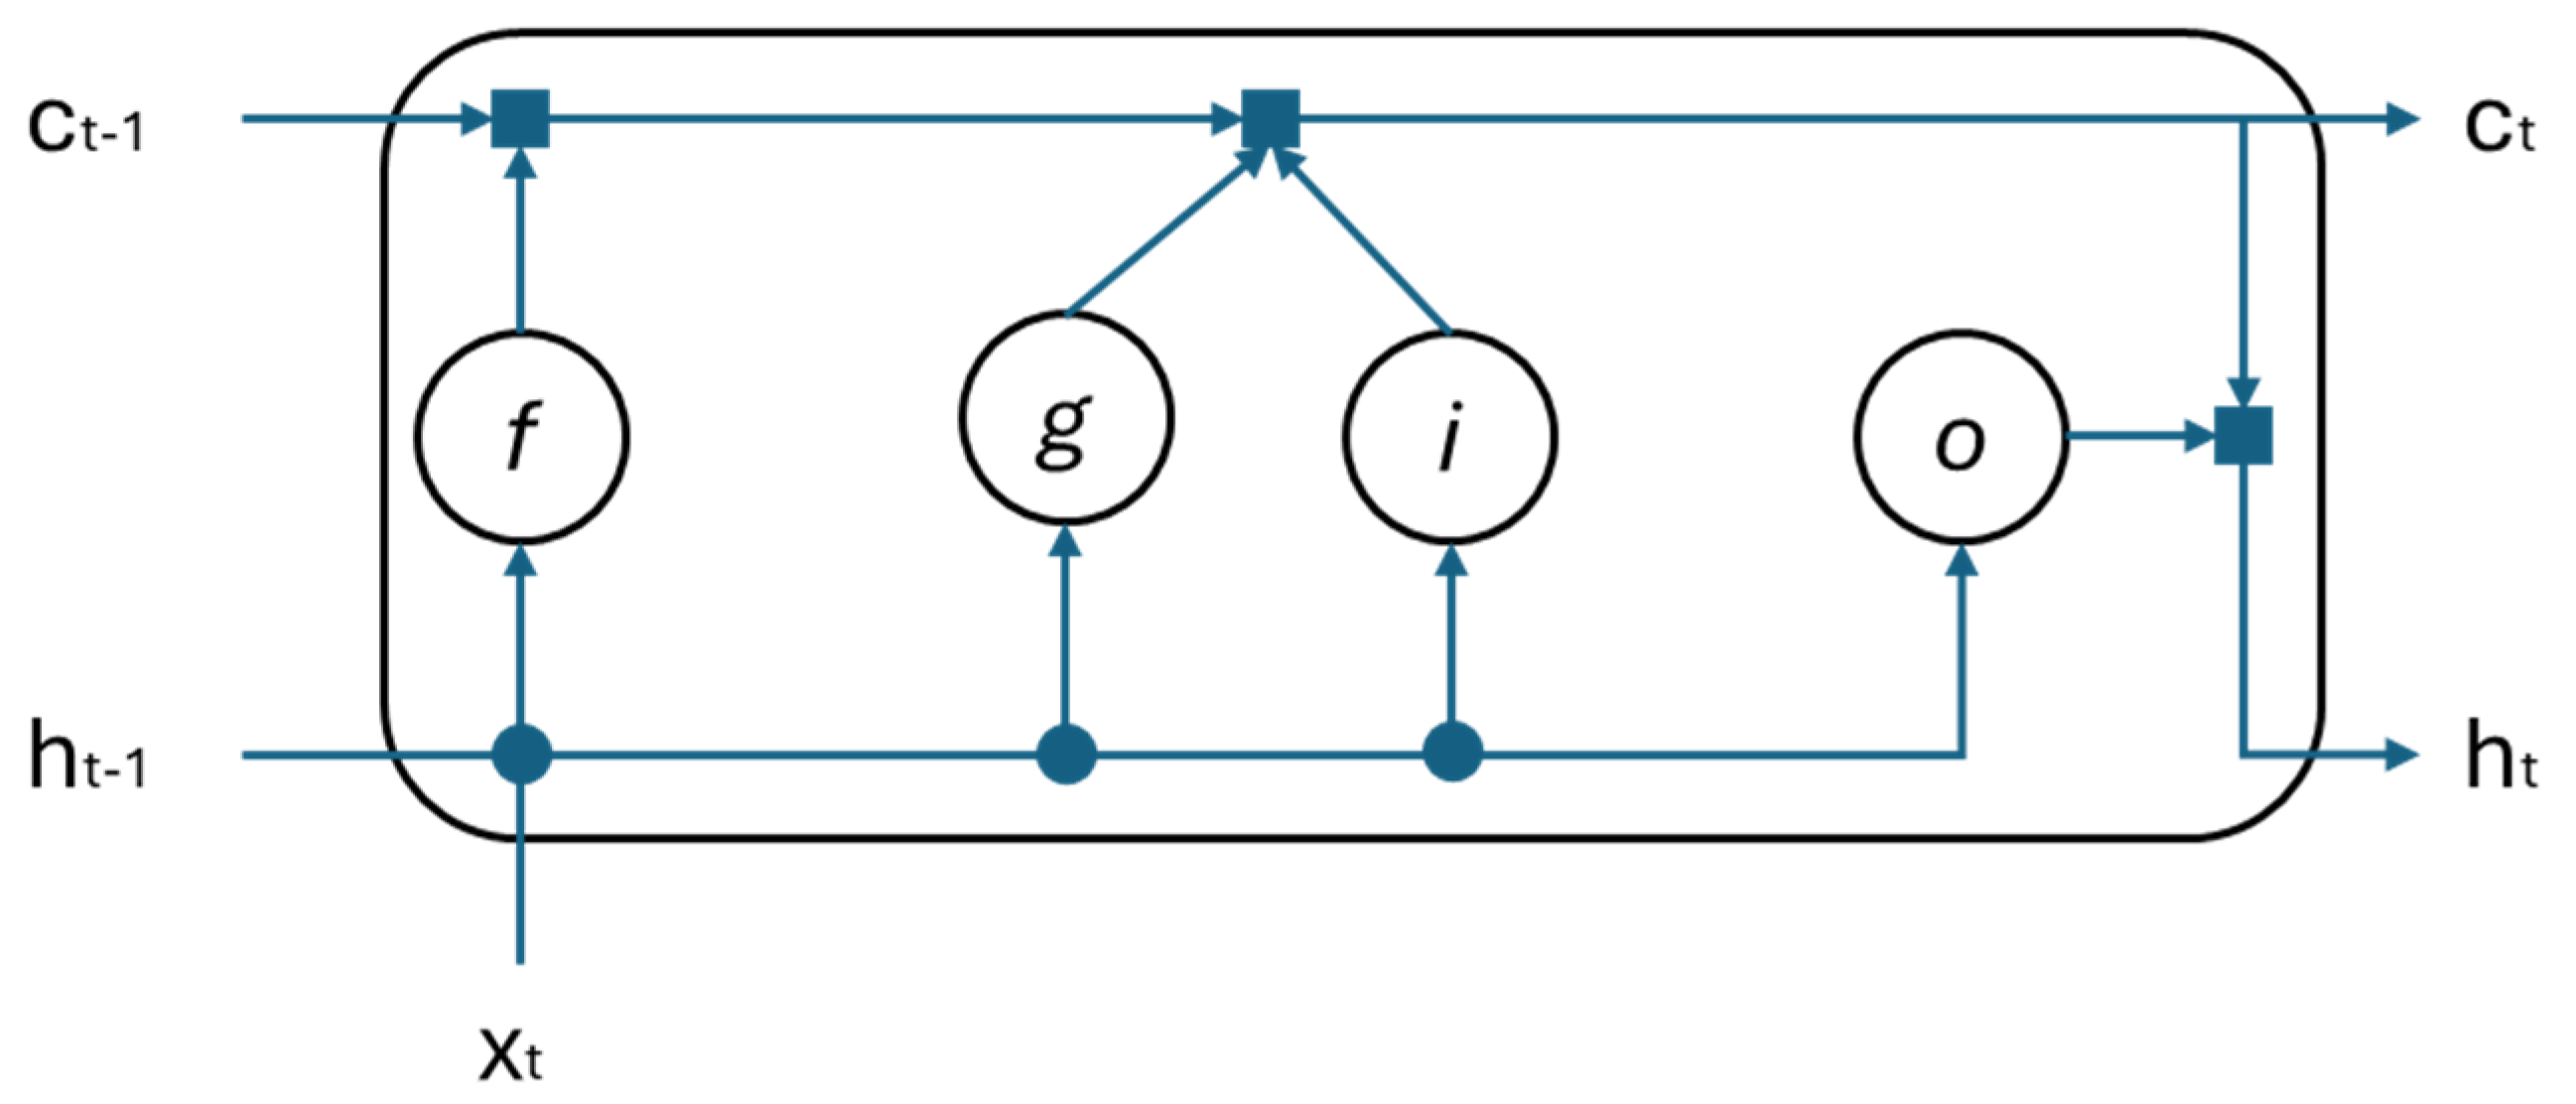
The architecture of an LSTM cell consists of three main gates: forget gate, input gate, and output gate, as well as a cell state that acts as memory. The cell processes inputs and previous hidden states to determine what information should be stored, discarded, or passed to the next time step. The architecture of an LSTM cell is shown in Figure 13.
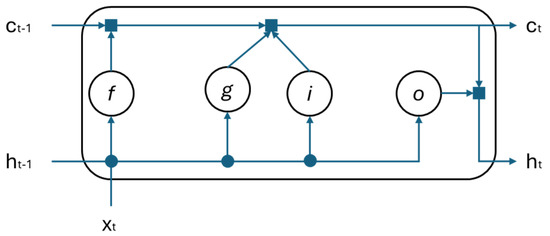
Figure 13.
Structure of LSTM cell.
In the figure, xt is the input, ht is the hidden state, ct is the cell state, f is the forget gate, g is the memory cell, i is the input gate, and o is the output gate.
The forget gate determines what portion of the previous cell state (Ct−1) should be retained or discarded by applying a sigmoid function (σ) to the previous hidden state (ht−1) and the current input (xt).
The input gate decides how much of the new candidate information should be added to the cell state. The new cell state Ct is computed by combining the previous cell state Ct−1 (scaled by the forget gate) with the new candidate (scaled by the input gate). This mechanism ensures that important long-term dependencies are preserved while allowing irrelevant information to be gradually forgotten (this mechanism solves the RNN’s biggest problem).
The output gate determines what portion of the updated cell state should be exposed as the new hidden state. Finally, the hidden state ht is passed to the next LSTM cell in the sequence or used for predictions.
Knowing the operating of an LSTM cell, in this paper this type of neural network is used to estimate an internal temperature value (measured by a sensor) using the electrical variables and the input and output temperatures of the coolant air as entries of the model. Two different LSTMs have been developed to analyze separately the heating and the cooling scenarios, because during the cooling tests the electrical variables are not relevant. During the cooling tests, the SM and the grid were decoupled, and the frequency converter was stopped. As a result, the SM was not rotating, and the internal fan of the refrigeration system was inoperative. Consequently, the electrical variables (voltage, active power, reactive power, and excitation current) were recorded as zero and are therefore not considered relevant inputs for the LSTM model. These variables are excluded to avoid the inclusion of unnecessary data.
To train and test the LSTM neural network, the initial dataset of heating and cooling scenarios is divided into 80% of the trials being used for the training and 20% of the trials used for the testing phase. For the training phase we have tried to cover all active power levels, so that the LSTMs are prepared to operate in the whole operating range of the machine. For the test phase, several scenarios with a medium active power level (2500–3500 W) have been selected so that the network never tests with active power values outside the range in which it has been trained. That is to say, the tests at low and high power as well as several at medium power levels have been used for the training phase and for the LSTM network test, the remaining tests at medium power levels not used during the training phase have been used.
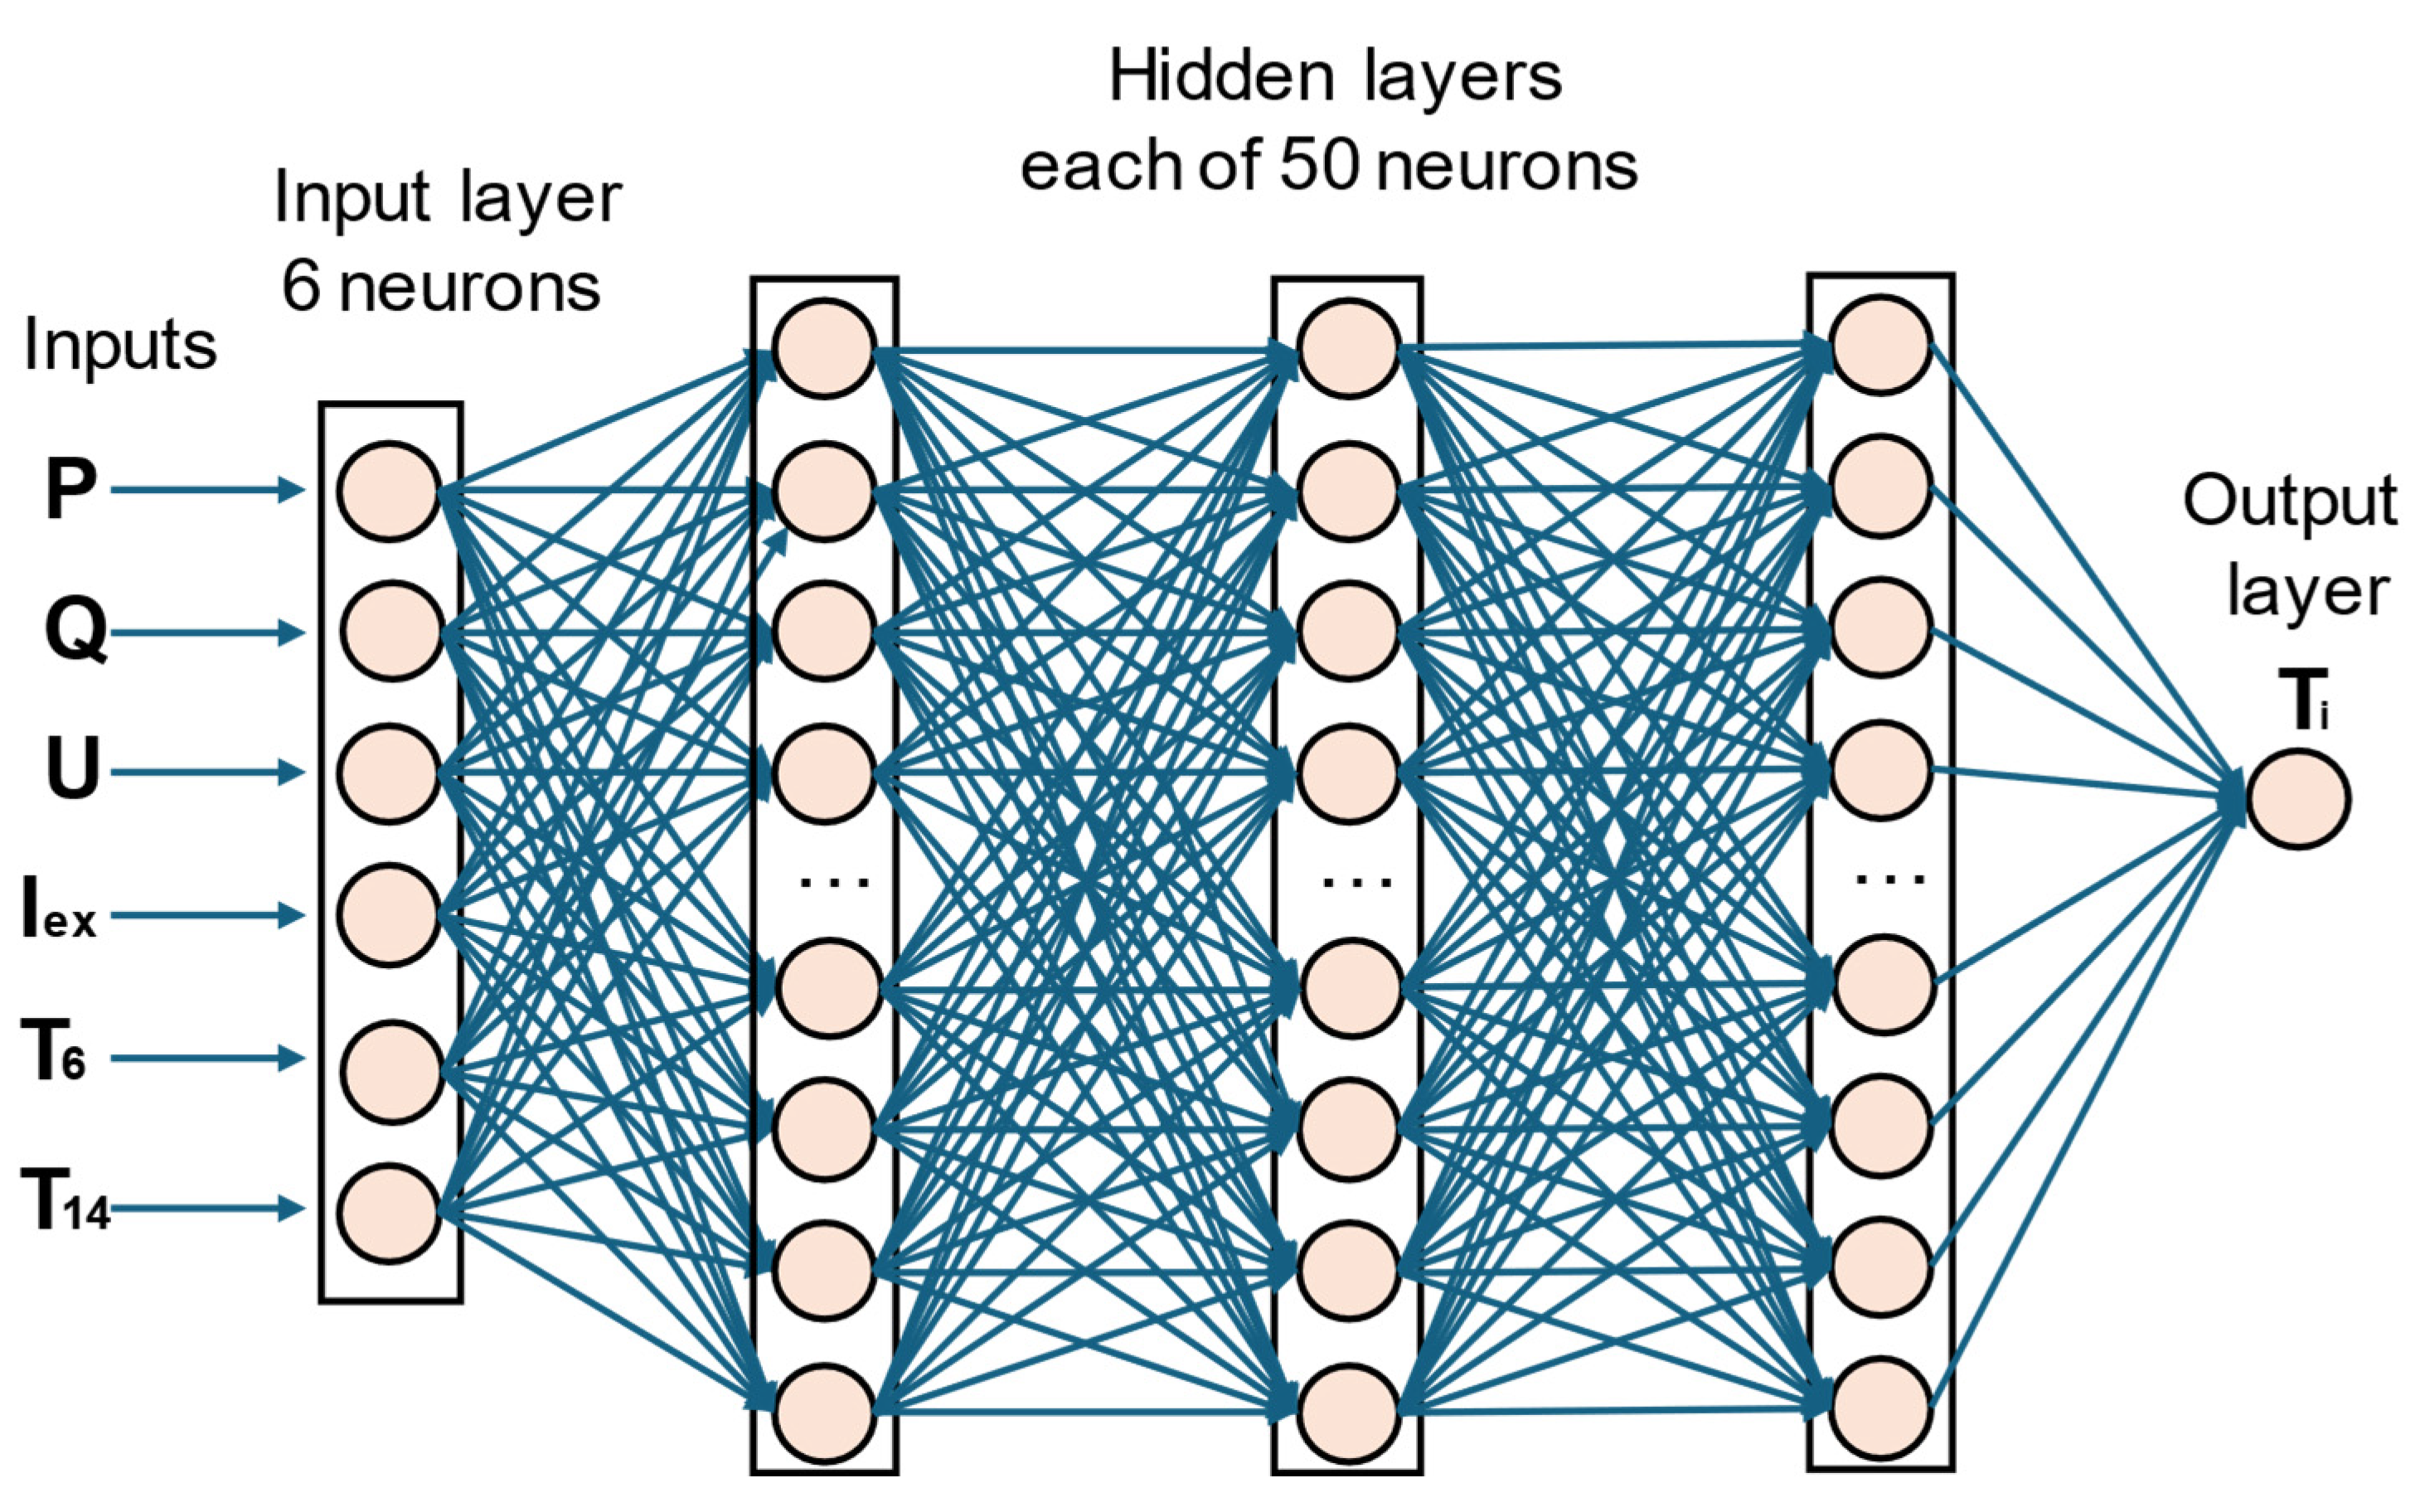
The architecture of the LSTM neural network used for the heating tests is shown in Figure 14.
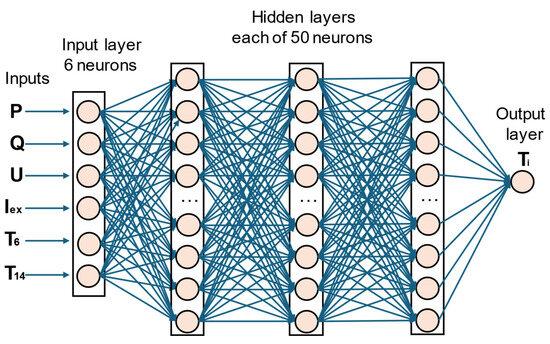
Figure 14.
LSTM neural network architecture for heating scenarios.
The LSTM neural network used is composed of 5 layers. Different architectures were tested, and the best results were obtained using 5 layers, with a reasonable computational effort. The output of the calculations is one of the internal temperatures, Ti where i = 1, 2, 3, 4, 5, 7, 9, 10, 11, 12, 13, and 15.
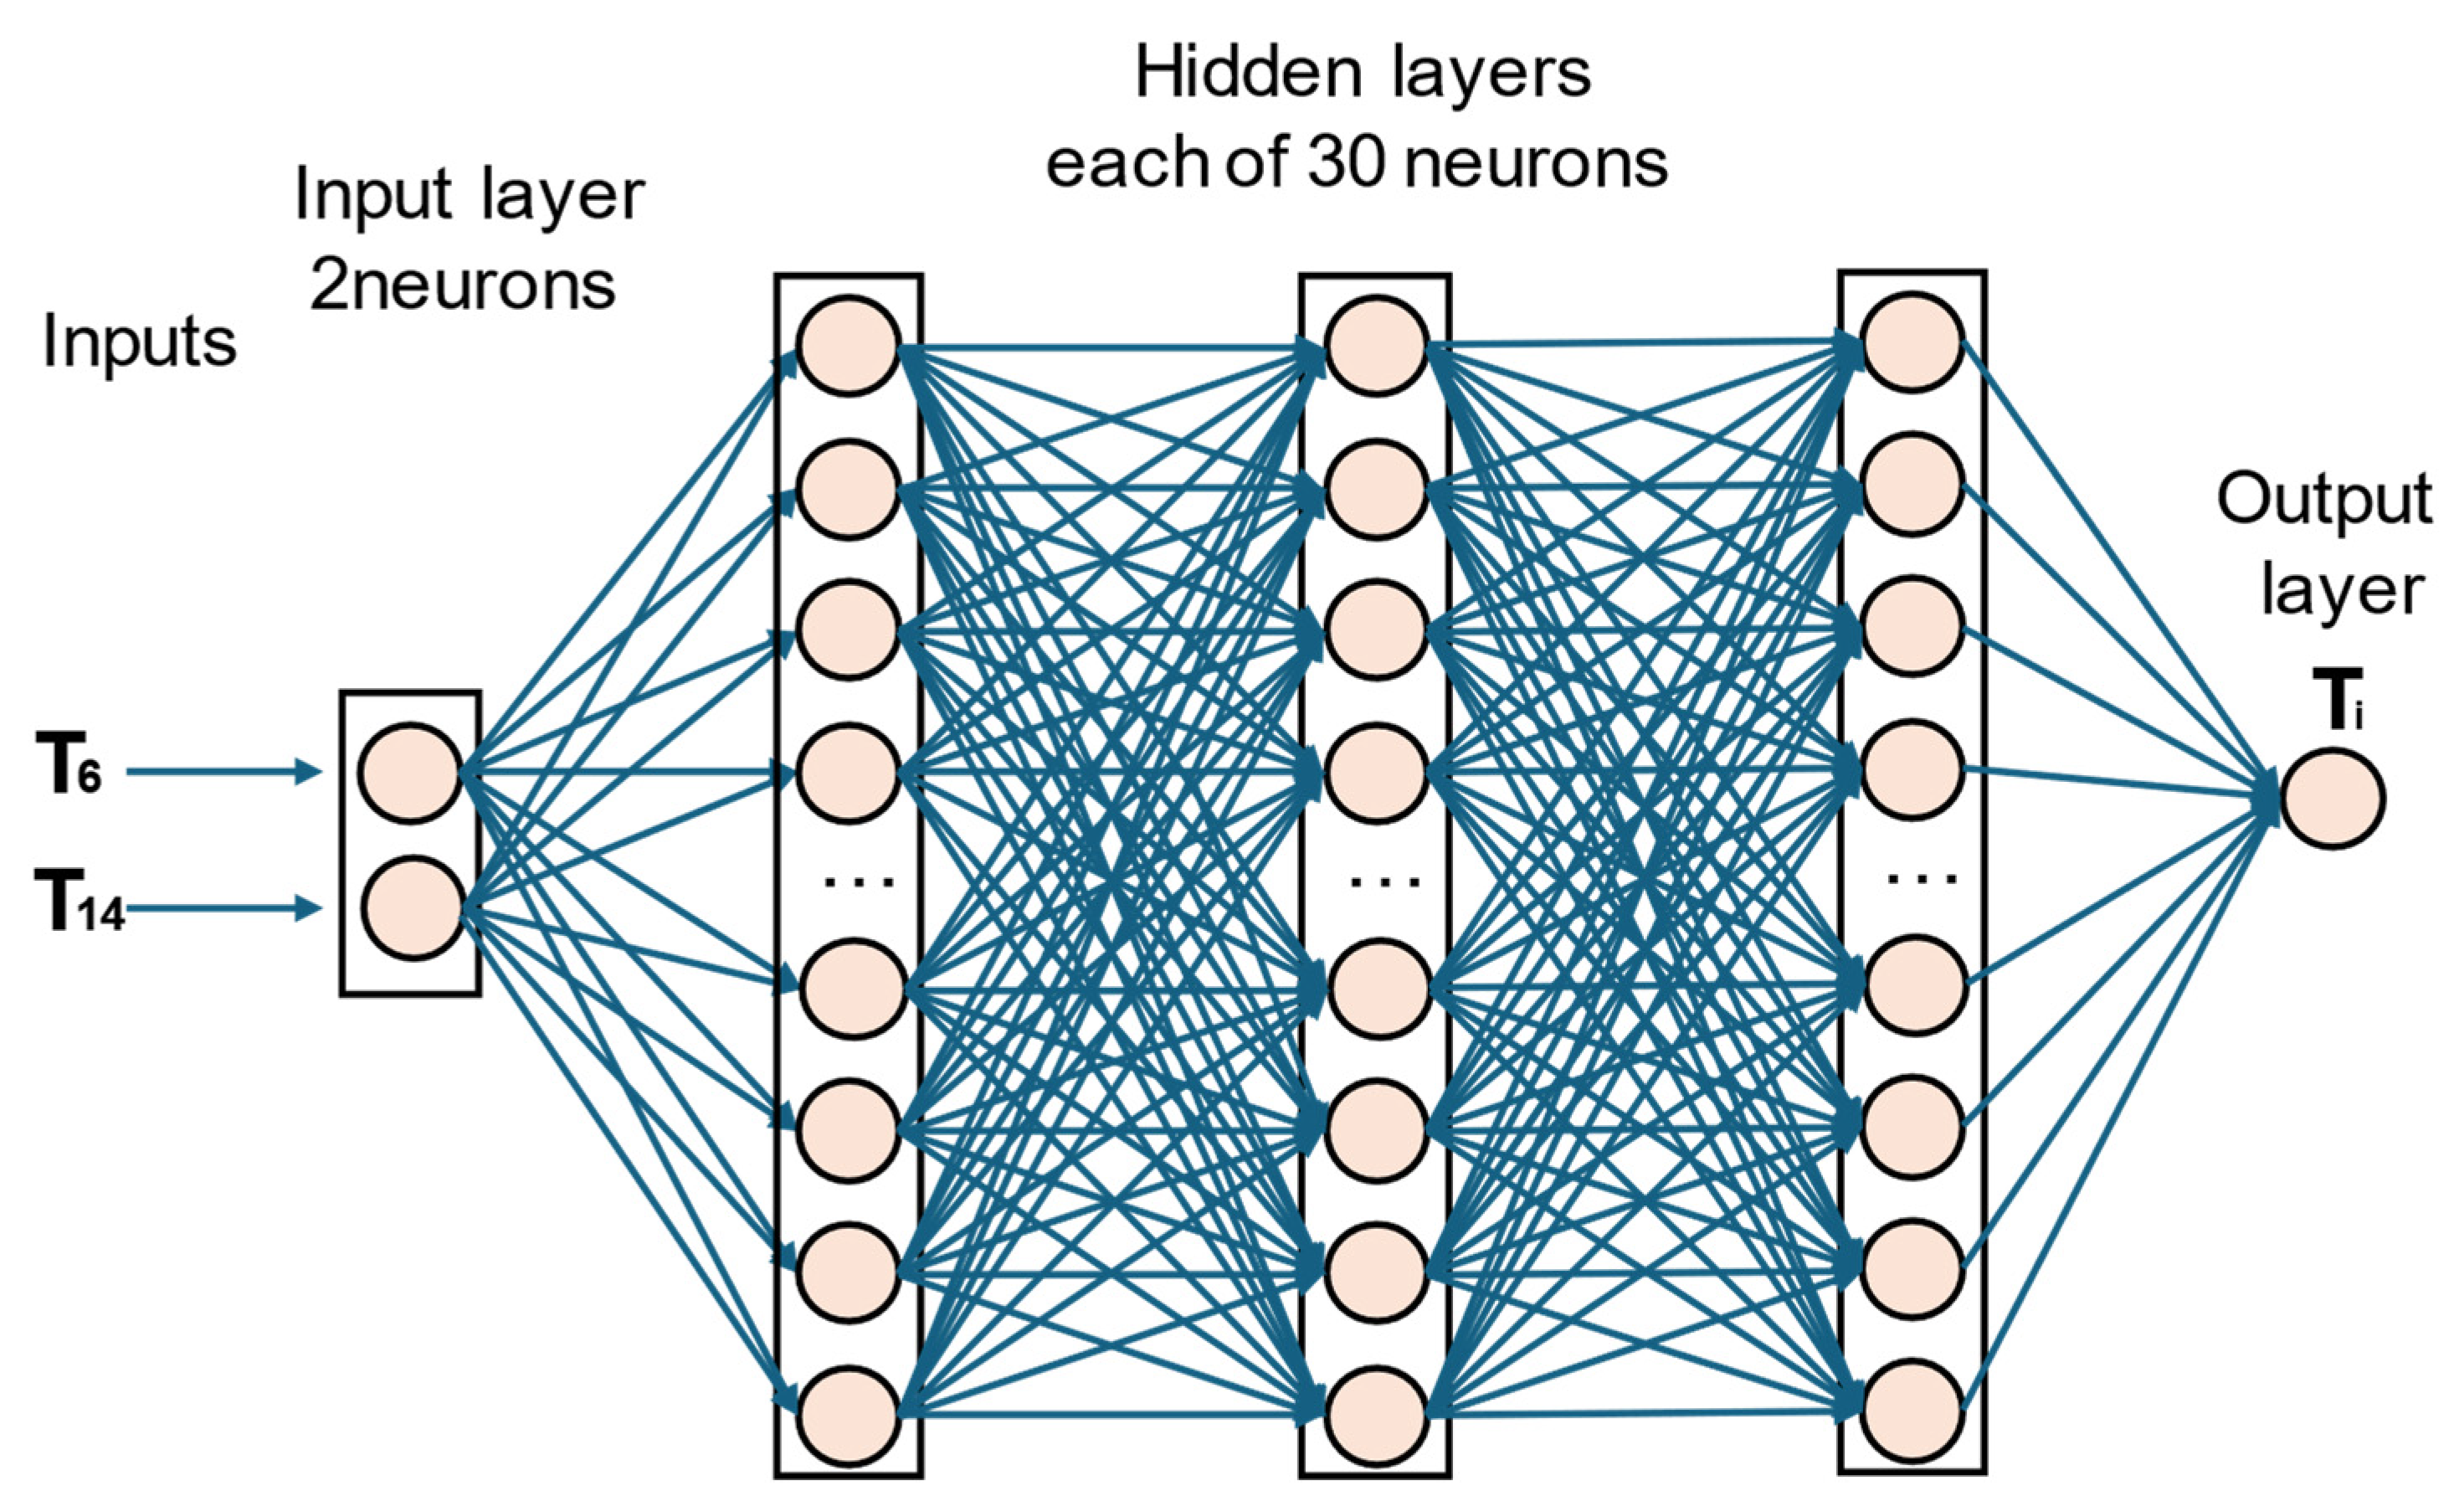
The LSTM for the cooling scenarios has only T6 and T14 as inputs. Its architecture is slightly different from that of the heating scenarios due to the number of inputs and the number of neurons. Each hidden layer now has an optimal number of 30 neurons. The architecture is shown in Figure 15.
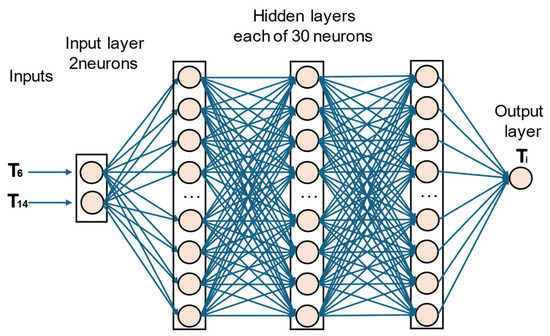
Figure 15.
LSTM neural network architecture for cooling scenarios.
The main data of the LSTM neural networks used for the heating and cooling scenarios are summarized in Table 3.
Table 3.
Main data of the LSTM neural networks.
The number of neurons in the hidden layers was determined using an optimization process. First, the results of this process indicated that 50 and 30 are the optimal numbers of neurons.
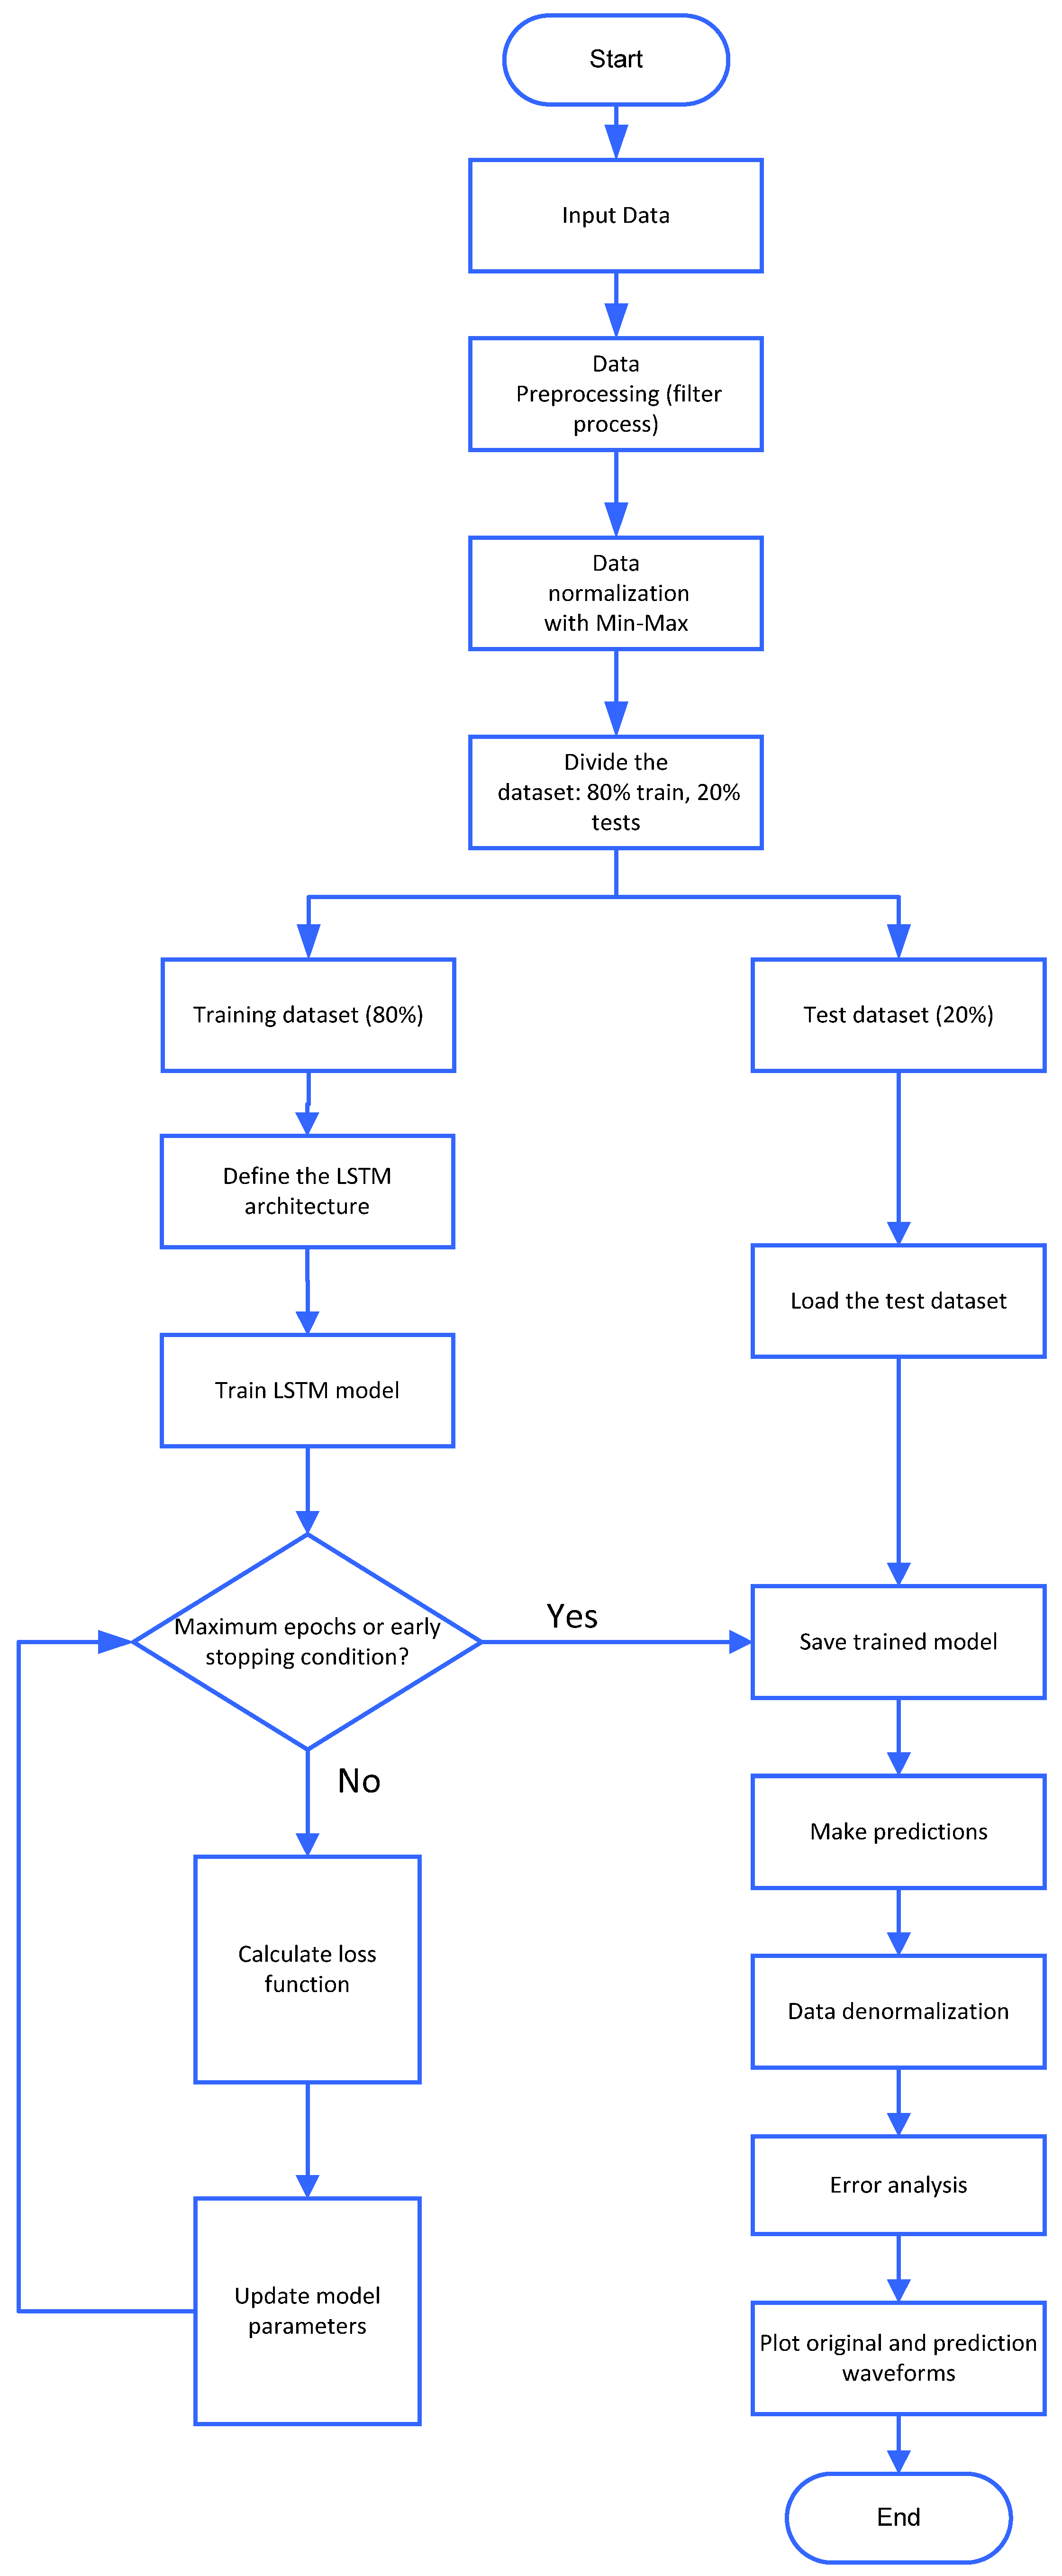
The simplified computer routine chart is displayed in Figure 16.
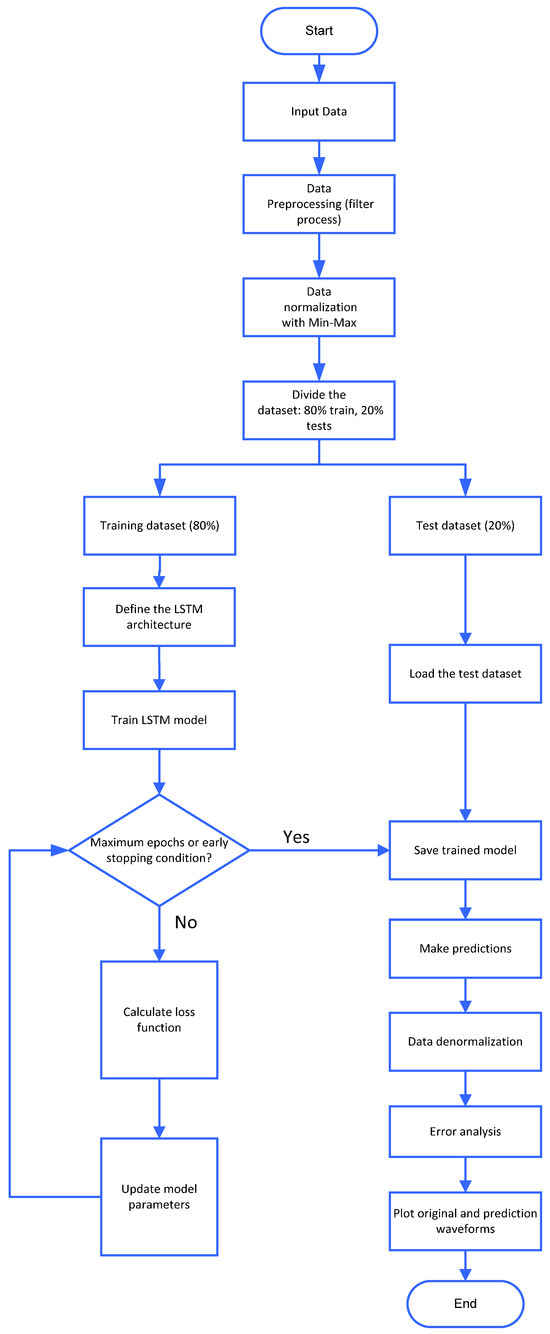
Figure 16.
Computational routine chart.
During the training of the LSTMs, the overfitting has been considered, and because of the overfitting, the optimal structure of the LSTMs are using 30 neurons and 50 neurons for cooling and heating scenarios, respectively. We have evaluated the number of neurons of each hidden layer from 10 to 100, and if the overfitting was not considered, the optimal number could be 100 neurons for both scenarios. Also, to remove the overfitting problem, we have added an early stopping parameter during the training process of the LSTMs. The early stop used is 2 epochs. This means that in each interaction when the parameters of the LSTM network are recalculated, the behavior of the network is evaluated, and if it is seen that the RMSE has not improved for two consecutive epochs, the training is stopped and the last evaluation in which the behavior of the network improved is taken as good.
3. Results
The sequence parameter is relevant in LSTM neural networks, because the number of previous data used to predict the following value of the temperature. Multiple LSTM neural networks have been trained with different sequence values. This has been conducted in order to be able to select which of the LSTM neural networks gives the best results.
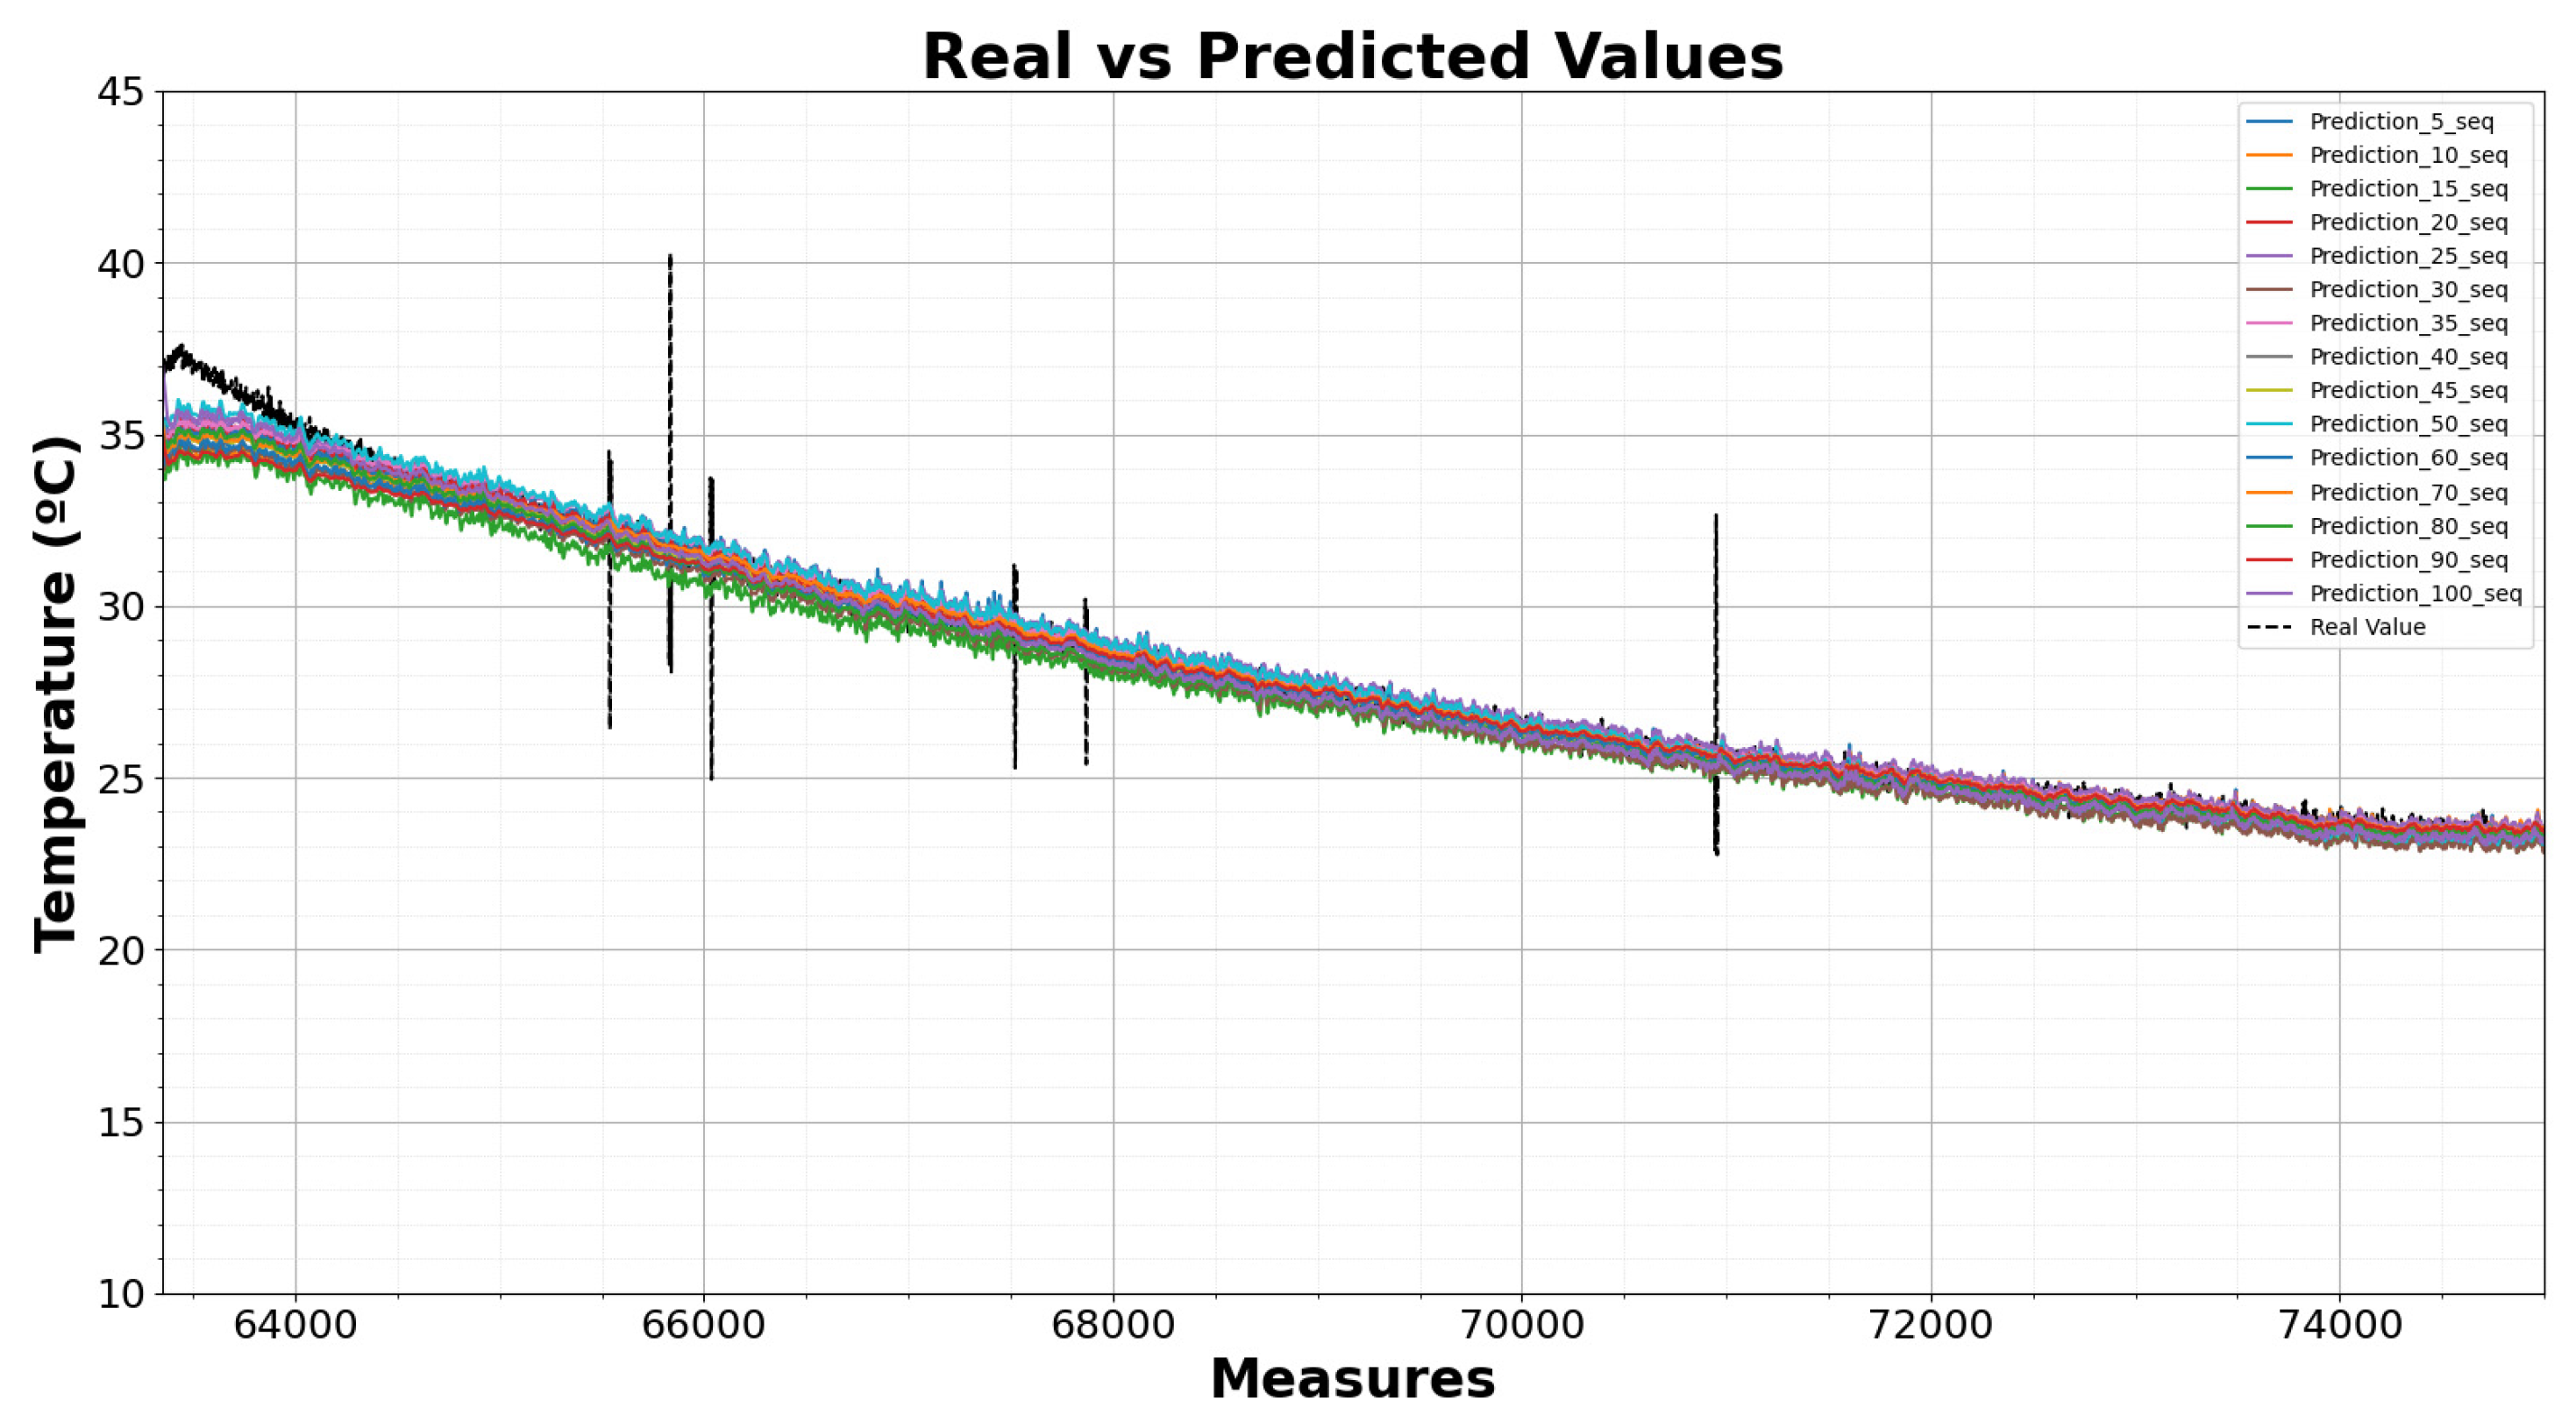
To present the results more clearly, only the results obtained using the LSTM trained to predict the results for temperature sensor 2 are shown, but all sensors have an individual LSTM to predict their values. The results obtained in the testing phase (with the different LSTMs trained), using the data from the heating test with P = 3500 W and Q = 0 var to predict the temperature of the sensor 2, are shown in Figure 17. In black is shown the real temperature values measured during the test, and the other colors show the predictions made by the LSTMs trained with different numbers of sequences.
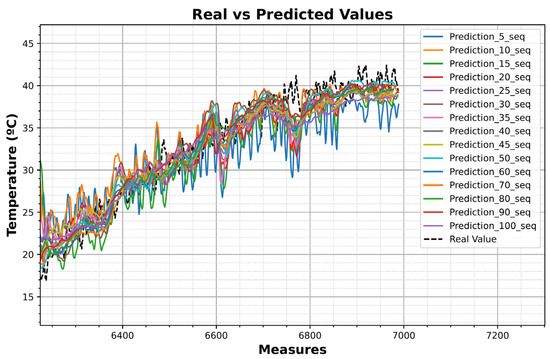
Figure 17.
Test results of the LSTMs using P = 3500 W and Q = 0 var for the heating test predicting temperature of sensor 2.
Table 4 summarizes the results obtained, using each sequence value across all testing data.
Table 4.
Heating LSTM obtained results.
As shown, the best results were obtained using 80 sequences, as all the statistical metrics reach their respective minimum value.
The results obtained in the testing phase, using data from the cooling test with P = 2500 W and Q = 0 var, are shown in Figure 18 with different sequences. Table 5 summarizes the results obtained, using each sequence value across all testing data.
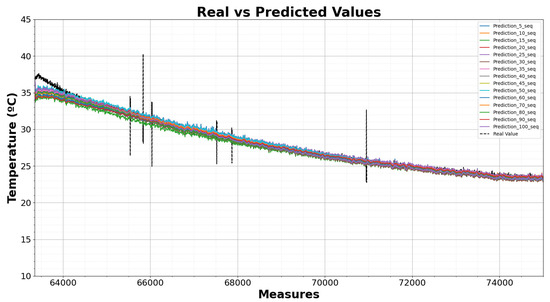
Figure 18.
Test results of the LSTMs using P = 2500 W and Q = 0 var for cooling test predicting temperature of sensor 2.
Table 5.
Cooling LSTM obtained results.
4. Conclusions
The best results for the heating scenarios are achieved using the LSTM neural network with 50 neurons in the hidden layers and 80 sequences, as it has the lowest statistical error metrics.
Similarly, the best results for the cooling scenarios are achieved using the LSTM neural network with 30 neurons in the hidden layers and 40 sequences, also having the lowest statistical error metrics.
It is important to notice that the LSTM has performed better during the cooling scenarios compared to the heating scenarios, due to two factors: the number of inputs and the most important factor, the noise caused by the frequency converter in the temperature measurements. This problem does not exist in an electrical generator machine of an industrial plant, as the industrial analogue input Pt-100 cards for the control systems comprise filters, minimizing the noise in the measurements.
With the optimal LSTM neural network trained for the heating and cooling scenarios of the synchronous machine used, the thermal behavior of the machine at all its operating points can be characterized.
With the MSE errors obtained in Table 4 and Table 5, a warning threshold and a trip threshold can be defined. In the case of heating scenarios, the optimum MSE obtained was 5.19, so that the warning threshold can be defined as a 7% temperature error with respect to the value predicted by the LSTM for each operating point, and the trip threshold can be defined as a 10% error.
The results obtained are effective for monitoring the temperature of an electrical SM using this method based on the implementation of a LSTM network, and it could also be used to monitor other electrical machines such as transformers. Furthers works should aim to validate the thermal model obtained by applying thermal faults to the machine, for example by plugging half of the air inlet of the machine’s cooling system, verifying what error in thermal predictions is produced.
Another work could be to develop a water cooling system to evaluate a situation closer to an SM of a power plant, adding new input variables to the system, such as water temperatures during its cooling cycle (before and after the pump, before and after the water–air exchanger, water flow, etc…).
5. Patents
This work is based in a patent invented for two authors of this article. The patent number is P202130429, and the title is the following: “METHOD AND SYSTEM FOR REAL-TIME THERMAL DIAGNOSIS OF SYNCHRONOUS MACHINES”. Link to the patent: https://worldwide.espacenet.com/publicationDetails/biblio?CC=ES&NR=2876998B2&KC=B2&FT=D&ND=4&date=20230228&DB=EPODOC&locale=en_EP (accessed on 20 March 2025).
Author Contributions
Conceptualization, R.P. and C.A.P.; methodology, R.P.; software, R.P.; validation, R.P., M.E. and J.M.G.; formal analysis, C.A.P. and J.M.G.; investigation, R.P., M.E. and C.A.P.; resources, C.A.P.; data curation, R.P.; writing—original draft preparation, R.P. and C.A.P.; writing—review and editing, M.E. and J.M.G.; visualization, R.P. and C.A.P.; supervision, M.E.; project administration, R.P. and C.A.P.; funding acquisition, C.A.P. All authors have read and agreed to the published version of this manuscript.
Funding
This research received no external funding.
Data Availability Statement
The original contributions presented in the study are included in the article, further inquiries can be directed to the corresponding author.
Conflicts of Interest
The authors declare no conflicts of interest.
Abbreviations
The following abbreviations are used in this manuscript:
| MAE | Mean Absolute Error |
| MSE | Mean Squared Error |
| LSTM | Long Short-Term Memory |
| PMSM | Permanent Magnet Synchronous Machine |
| RMSE | Root Mean Squared Error |
| RNN | Recurrent Neural Network |
| SM | Synchronous Machine |
References
- IEEE Std C37.102-2023 (Revision of IEEE Std C37.102-2006); IEEE Guide for AC Generator Protection. IEEE: Piscataway, NJ, USA, 2024; pp. 1–211.
- UNE-EN 60034-1:2001; Máquinas Eléctricas Rotativas. Parte 1: Características Asignadas y Características de Funcionamiento. UNE: Madrid, Spain, 2001.
- IEEE Std C50.13-2014 (Revision of IEEE Std C50.13-2005); IEEE Standard for Cylindrical-Rotor 50 Hz and 60 Hz Synchronous Generators Rated 10 MVA and Above. IEEE: Piscataway, NJ, USA, 2014; pp. 1–63.
- IEEE Std C50.12-2005 (Previously Designated as ANSI C50.12-1982); IEEE Standard for Salient-Pole 50 Hz and 60 Hz Synchronous Generators and Generator/Motors for Hydraulic Turbine Applications Rated 5 MVA and Above. IEEE: Piscataway, NJ, USA, 2006; pp. 1–45.
- IEC 60034-11:2020; Rotating Electrical Machines. Part 11: Thermal Protection. International Electrotechnical Commission: Geneva, Switzerland, 2020.
- Jiang, S.; Wang, L.; Wang, L.; Ye, P.; Hao, Z. A new thermal protection approach for permanent magnet synchronous motor. In Proceedings of the IECON 2013—39th Annual Conference of the IEEE Industrial Electronics Society, Vienna, Austria, 10–13 November 2013; pp. 2536–2540. [Google Scholar]
- Mocanu, R.; Onea, A. Determination of stator temperature for thermal protection in a permanent magnet synchronous machine. In Proceedings of the 25th Mediterranean Conference on Control and Automation (MED), Valletta, Malta, 3–6 July 2017; pp. 1321–1325. [Google Scholar]
- Wang, L.; Kou, B.; Cai, W. Research on resistance enhancement coefficient and thermal dissipation of stator strands in huge synchronous generator. IEEE Access 2020, 8, 40357–40366. [Google Scholar] [CrossRef]
- Tong, W.; Wu, S.; Tang, R. Research on the airflow and thermal performance in a large forced air-cooled permanent magnet synchronous machine. IEEE Access 2019, 7, 162343–162352. [Google Scholar] [CrossRef]
- El Halabi, N.; Donolo, M.; Donolo, P.; Rajab, T. Synchronous rotor thermal model based on stator current modulation. J. Eng. 2018, 2018, 866–870. [Google Scholar] [CrossRef]
- Sun, T.; Wang, J.; Griffo, A.; Sen, B. Active thermal management for interior permanent magnet synchronous machine (ipmsm) drives based on model predictive control. IEEE Trans. Ind. Appl. 2018, 54, 4506–4514. [Google Scholar] [CrossRef]
- Jiang, Y.; Yu, Y.; Huang, J.; Cai, W.; Marco, J. Li-ion battery temperature estimation based on recurrent neural networks. Sci. China Technol. Sci. 2021, 64, 1335–1344. [Google Scholar] [CrossRef]
- Zhu, S.; He, C.; Zhao, N.; Sha, J. Data-driven analysis on thermal effects and temperature changes of lithium-ion battery. J. Power Sources 2021, 482, 228983. [Google Scholar] [CrossRef]
- Zachary, C.; Berkowitz, J. Critical Review of Recurrent Neural Networks for Sequence Learning. arXiv 2015, arXiv:1506.00019. [Google Scholar]
- Saeed, M.; El-Saadawi, M. Practical Implementation and Testing of RNN Based Synchronous Generator Internal Fault Protection. Recent Adv. Electr. Electron. Eng. 2019, 12, 181–189. [Google Scholar] [CrossRef]
- Ida, S.; Darwin, S.; Fantin, E. A deep residual neural network model for synchronous motor fault diagnostics. Appl. Soft Comput. 2024, 160, 111683. [Google Scholar]
- Guo, H.; Ding, Q.; Song, Y.; Tang, H.; Wang, L.; Zhao, J. Predicting Temperature of Permanent Magnet Synchronous Motor Based on Deep Neural Network. Energies 2020, 13, 4782. [Google Scholar] [CrossRef]
- Bingi, K.; Rajanarayan, B.; Kumra, A.; Chawla, A. Torque and Temperature Prediction for Permanent Magnet Synchronous Motor Using Neural Networks. In Proceedings of the 2020 3rd International Conference on Energy, Power and Environment: Towards Clean Energy Technologies, Shillong, India, 5–7 March 2021; pp. 1–6. [Google Scholar]
- Thosar, P.; Patil, J.; Singh, M.; Thamke, S.; Gonge, S. Prediction of Motor Temperature using Linear Regression. In Proceedings of the 2020 International Conference on Smart Technologies in Computing, Electrical and Electronics (ICSTCEE), Bengaluru, India, 9–10 October 2020; pp. 7–12. [Google Scholar]
- Hughes, R.; Haidinger, T.; Pei, X.; Vagg, C. Real-time temperature prediction of electric machines using machine learning with physically informed features. Energy AI 2023, 14, 100288. [Google Scholar] [CrossRef]
- Cen, Y.; Zhang, C.; Cen, G.; Zhang, Y.; Zhao, C. The Temperature Prediction of Permanent Magnet Synchronous Machines Based on Proximal Policy Optimization. Information 2020, 11, 495. [Google Scholar] [CrossRef]
- Swidenbank, E.; Mcloone, S.; Flynn, D.; Irwin, G.; Brown, M.; Hogg, B. Neural network-based control for synchronous generators. IEEE Trans. Energy Convers. 2000, 14, 1673–1678. [Google Scholar] [CrossRef]
- Tang, P.; Zhao, Z.; Li, H. Short-Term Prediction Method of Transient Temperature Field Variation for PMSM in Electric Drive Gearbox Using Spatial-Temporal Relational Graph Convolutional Thermal Neural Network. IEEE Trans. Ind. Electron. 2024, 71, 7839–7852. [Google Scholar] [CrossRef]
- Pascual, R.; Mahtani, K.; Rivero, E.; Platero, C.A. Brushless Synchronous Machine Field Winding Interturn Fault Severity Estimation Through Deep Neural Networks. IEEE Trans. Energy Convers. 2024, 39, 1341–1351. [Google Scholar] [CrossRef]
- Barrera-Cardenas, R.; Perez-Londoño, S.; Mora-Florez, J. Artificial neural networks applied to synchronous machine modeling: A review. Tecnura 2010, 14, 109–122. [Google Scholar]
- Wang, P.; Wang, X.; Wang, Y. End-to-End Differentiable Physics Temperature Estimation for Permanent Magnet Synchronous Motor. World Electr. Veh. J. 2024, 15, 174. [Google Scholar] [CrossRef]
- Zhu, Y.; Xiao, M.; Lu, K.; Wu, Z.; Tao, B. A Simplified Thermal Model and Online Temperature Estimation Method of Permanent Magnet Synchronous Motors. Appl. Sci. 2019, 9, 3158. [Google Scholar] [CrossRef]
- Sun, L.; Dhale, S.; Nalakath, S.; Mohamadian, M.; Luedtke, D.; Preindl, M.; Emadi, A. Non-Linear Optimization-Based Temperature Estimation of IPMSM. In Proceedings of the 2019 IEEE Transportation Electrification Conference and Expo (ITEC), Detroit, MI, USA, 19–21 June 2019; pp. 1–7. [Google Scholar]
- Shafieeroudbari, E.; Iyer, L.; Kar, N. Real-Time Rotor Temperature Estimation in Permanent Magnet Synchronous Motor Using Incremental Deep Learning. In Proceedings of the 2024 International Conference on Electrical Machines (ICEM), Torino, Italy, 1–4 September 2024; pp. 1–6. [Google Scholar]
- Foda, S.G.; Abdel-Rahman, M.H.; Addoweesh, K.E. Fault detection in large AC machines. In Proceedings of the ICM 2001 Proceedings. The 13th International Conference on Microelectronics, Rabat, Morocco, 29–31 October 2001; pp. 193–196. [Google Scholar]
- Tang, J.; Liu, Y.; Lundberg, S. Estimation Algorithm for Current and Temperature of Field Winding in Electrically Excited Synchronous Machines with High-Frequency Brushless Exciters. IEEE Trans. Power Electron. 2021, 36, 3512–3523. [Google Scholar] [CrossRef]
- Savitzky, A.; Golay, M.J.E. Smoothing and Differentiation of Data by Simplified Least Squares Procedures. Anal. Chem. 1964, 36, 1627–1639. [Google Scholar] [CrossRef]


Disclaimer/Publisher’s Note: The statements, opinions and data contained in all publications are solely those of the individual author(s) and contributor(s) and not of MDPI and/or the editor(s). MDPI and/or the editor(s) disclaim responsibility for any injury to people or property resulting from any ideas, methods, instructions or products referred to in the content. |
© 2025 by the authors. Licensee MDPI, Basel, Switzerland. This article is an open access article distributed under the terms and conditions of the Creative Commons Attribution (CC BY) license (https://creativecommons.org/licenses/by/4.0/).