1. Introduction
Surface integrity plays a vital role in assessing machined components’ performance, durability, and functionality. It impacts essential mechanical properties, including fatigue life, wear resistance, friction behavior, and corrosion resistance. This aspect is particularly important in high-precision industries such as the aerospace, automotive, and biomedical fields [
1,
2]. CNC turning, a widely used machining technique, frequently involves intricate interactions among machining parameters (cutting speed, feed rate, depth of cut) and material characteristics, which determine the quality of the machined surface [
3,
4]. Among the various material characteristics, thermal conductivity and hardness have surfaced as critical factors due to their considerable influence on heat dissipation and cutting resistance during machining processes [
5,
6].
Materials with high thermal conductivity, such as aluminum alloys, efficiently disperse heat generated at the tool–workpiece interface. This capability helps to lower cutting temperatures, reduce tool wear, and enhance the surface finish [
7,
8]. Conversely, materials with lower thermal conductivity, like stainless steel and titanium alloys, tend to retain heat in the cutting zone. This heat retention leads to thermal deformation, increased tool wear, and compromised surface quality [
9,
10]. The hardness of a material plays a crucial role in machining results. Harder materials, for example, often necessitate greater cutting forces, which in turn generate higher cutting temperatures and can lead to more significant surface irregularities [
11,
12]. Such imperfections, including heightened roughness and waviness, can critically influence machined components’ fatigue strength, tribological performance, and dimensional accuracy [
13,
14]. Additionally, machining materials with higher hardness levels raise the risk of developing deep valleys and pronounced surface peaks, which can negatively affect surface integrity.
Traditional research on surface integrity has primarily concentrated on average metrics such as arithmetic mean roughness (
Ra) and waviness (
Wa). However, recent studies highlight the significance of grasping the probabilistic aspects of surface parameters [
15,
16]. Cumulative probability distributions provide a more thorough understanding of surface variability, which is crucial for applications demanding consistent surface quality and strict dimensional tolerances [
17]. The advancement of probabilistic models facilitates the improved prediction and management of surface integrity across different machining conditions, ultimately boosting process reliability [
18].
Recent studies have increasingly focused on probabilistic methods to better understand surface variability. Correa et al. [
15] introduced a probabilistic model aimed at forecasting surface roughness distributions during machining, highlighting the necessity of considering random fluctuations in machining conditions. Building on this foundation, Bobrovskij et al. [
16] examined surface waviness through cumulative probability techniques, showcasing that probabilistic models yield more thorough insights compared to traditional average-based evaluations. Both studies emphasize the use of probabilistic modeling to assess surface roughness variability, revealing strong links between machining conditions, material properties, and surface integrity outcomes.
This study seeks to fill a research gap by examining the effects of thermal conductivity and hardness on the probabilistic distributions of surface roughness and waviness in CNC turning. By combining experimental data with cumulative probability analysis, we can gain insights into how material properties and machining parameters interact to impact surface integrity. The analysis highlights the mutual influence of thermal conductivity and hardness on surface integrity during CNC turning. This investigation will analyze surface roughness and waviness distributions across five engineering materials with varying properties (hardness and thermal conductivity). The findings aim to shed light on how these characteristics and machining parameters affect surface quality, contributing to the development of optimized machining strategies that ultimately boost productivity and enhance component performance in high-precision manufacturing sectors.
2. Methodology
This section details the experimental setup aimed at exploring the probabilistic distribution of surface roughness and waviness parameters during CNC turning. The research concentrated on how machining parameters and material attributes, especially thermal conductivity and hardness, affect surface integrity. All experimental procedures complied with pertinent ISO standards, including ISO 4287 for surface texture, ISO 4288 for roughness measurements, ISO 3685 for tool wear evaluation, and ISO 230 for testing machine tools. The methodology was crafted to guarantee consistency, repeatability, and thorough data acquisition across various materials and machining conditions.
Surface texture significantly influences materials’ functional performance, longevity, and interactions in various engineering applications. It is mainly defined by two principal factors: roughness and waviness. Roughness denotes the fine, high-frequency surface irregularities that occur due to machining or material processing, whereas waviness indicates the longer-wavelength deviations caused by elements like vibration, tool deflection, or thermal distortion. To comprehensively assess surface characteristics, standardized roughness parameters (Ra, Rq, Rt, Rz) and waviness parameters (Wa, Wq, Wt, Wz) are utilized. These metrics offer vital quantitative insights that aid in material selection, quality control, and performance enhancement across industries, including manufacturing, tribology, and biomedical engineering.
Surface roughness plays a crucial role in defining material surfaces, affecting their functional performance, wear resistance, and tribological properties. One commonly used roughness parameter is Ra (Arithmetic Mean Roughness), which calculates the average deviation of a surface profile from the mean line and serves as a general indicator of surface texture. Alternatively, Rq (Root Mean Square Roughness) is a more sensitive metric that highlights variations in peaks and valleys by factoring in squared deviations, making it essential for applications requiring precise surface control. In comparison, Rt (Total Roughness Height) measures the vertical distance between the highest peak and the lowest valley within the evaluation length, thereby being vital for assessing significant variations in surface topography. Another important parameter, Rz (Average Maximum Height of the Profile), indicates the average peak-to-valley height over several sampling lengths, providing a more localized view of surface irregularities than Rt. Together, these parameters furnish detailed insights into surface properties, supporting quality control, material selection, and performance enhancement across various engineering sectors, including machining, coatings, and biomedical implants.
Surface waviness, which indicates longer-wavelength variations on a material’s surface, is vital for functional performance, especially in scenarios where contact mechanics, lubrication, and sealing efficiency are important. The Wa (Arithmetic Mean Waviness) parameter measures the average deviation of the waviness profile from the mean line, acting as a basic gauge of surface undulations. In contrast, the Wq (Root Mean Square Waviness) parameter, similar to Rq in roughness analysis, accounts for the squared deviations of the waviness profile, making it more reactive to larger fluctuations. Wt (Total Waviness Height) measures the vertical span between the highest peak and the lowest valley over the evaluation length to address extreme variations, providing insights into significant surface deformations. Moreover, Wz (Average Maximum Waviness Height) evaluates the average peak-to-valley height across several sampling lengths, enabling the localized analysis of waviness changes. These parameters are crucial in manufacturing and engineering fields, particularly in precision machining, optical components, and tribological interfaces, where managing surface waviness is essential for optimal performance and durability.
To better characterize surface profiles, we calculated amplitude ratio parameters (Rq/Ra, Wq/Wa) and extreme value ratios (Rt/Rz, Wt/Wz), providing insights into the relationship between average and extreme profile values. Furthermore, we assessed shape parameters, like skewness (Rsk, Wsk) and kurtosis (Rku, Wku), to evaluate the asymmetry and peak sharpness of the surface textures.
2.1. Experimental Setup
The turning experiments were performed using a high-precision Gate-Eclipse ECL-400 CNC lathe (Gate Machinery International Ltd., Derbyshire, UK), selected for its robust structure and capacity to uphold dimensional stability despite fluctuating cutting conditions. The Fagor CNC control system of the machine facilitated exact adjustments to machining parameters, guaranteeing uniform feed rates, cutting speeds, and tool positioning throughout the experiment. All trials were conducted in a controlled laboratory environment maintained at a temperature of 22 ± 1 °C and a relative humidity of 45 ± 5%, in accordance with ISO 230-3 standards. The emphasis on environmental stability aimed to reduce external influences that might compromise machining consistency or measurement precision.
All experiments were carried out under dry machining conditions to focus solely on how material properties affect surface integrity, thereby removing the impact of lubricants. We selected four cutting speeds (30, 60, 90, and 120 m/min) and four feed rates (0.05, 0.10, 0.15, and 0.20 mm/rev) to encompass various industrial machining conditions. The depth of cut remained consistent at 0.25 mm to guarantee uniform material removal throughout all tests. Tungsten carbide inserts (ISO CNMG120408-PM) coated with titanium aluminum nitride (TiAlN) were chosen for their outstanding wear resistance and adaptability in machining various materials. The inserts were changed after every five passes or when flank wear exceeded 0.3 mm, in accordance with ISO 3685 tool life testing standards. Both pre- and post-machining checks of the cutting edges were conducted using a metallurgical microscope to ensure that tool wear did not add variability to the surface integrity measurements.
Workpieces were secured using a high-rigidity three-jaw chuck to ensure minimal vibration and consistent positioning during machining. To further minimize the risk of positional deviations, the machine underwent a stringent calibration process before the experiment runs, employing a certified reference workpiece that is traceable to national metrology standards. Verification of the spindle alignment and tool positioning adhered to a positional tolerance of ±0.01 mm, as per ISO 230-1. This approach guaranteed that variations in surface quality could be attributed to machining conditions and material properties rather than mechanical instabilities.
2.2. Materials Tested
Five engineering materials were selected to evaluate how their thermal and mechanical properties affect surface integrity. The materials included Aluminum Alloy 6061, Brass C26000, Bronze C51000, Carbon Steel 1020 Annealed, and Stainless Steel 304 Annealed, representing a range of machinability from highly machinable alloys to tougher materials distinguished by their high hardness and low thermal conductivity. These materials are commonly used in aerospace, automotive, and manufacturing industries, where precision machining is critical. The selection criteria emphasized differences in thermal conductivity, hardness, and their relevance for industrial applications. All workpieces were pre-machined and measured to verify that initial surface roughness (Ra) and waviness (Wa) were low enough (Ra < 0.8 µm, Wa < 0.5 µm) to avoid influencing the CNC turning results.
Table 1 provides a summary of thermal conductivity, hardness (HBW), machinability index, and the experimentally obtained average surface roughness (
Ra_avg) and waviness (
Wa_avg). These parameters illuminate the impact of essential material characteristics on surface integrity during consistent machining conditions.
2.3. Data Acquisition and Measurement Procedures
Surface roughness and waviness measurements were conducted using a Taly-Surf
® profilometer (Taylor Hobson Precision, Inc.), offering nanometer-level resolution, in compliance with ISO 4287 and ISO 4288 standards. The device was configured with a 2 µm conisphere stylus applying a measurable force of 0.7 mN at a traverse speed of 0.5 mm/s, ensuring high-fidelity data collection without surface deformation. Measurements were taken at five equidistant zones along the machined surface of each sample, with three repetitions per zone to capture localized variations and improve statistical reliability. The averaged values of the fifteen data points per material were used for further analysis, following procedures consistent with earlier studies involving precision roughness measurements [
19,
20].
The profilometer was calibrated using a certified roughness standard (
Ra = 1.00 ± 0.02 µm) to ensure traceable and accurate readings. Calibration checks were conducted after every ten measurements to prevent drift. The measurement uncertainty was calculated following the ISO Guide to the Expression of Uncertainty in Measurement (GUM) approach:
where
Uinstrument: 0.02 μm (based on manufacturer specifications);
Urepeatability: 0.015 μm (from repeated measurements);
Ucalibration: 0.01 μm (from the calibration certificate).
The combined standard uncertainty was calculated as Uc = ±0.0269 μm, incorporating instrument resolution, repeatability, and calibration contributions. The expanded uncertainty, Uexpanded, determined with a coverage factor of k = 2, was ±0.0539 μm for surface roughness parameters, ensuring a confidence level of approximately 95%.
2.4. Data Processing and Cumulative Probability Analysis
The collected data were processed using OriginPro 2024 for statistical analysis, regression modeling, and fitting probability distributions. Normal and log-normal distributions were used to model surface parameter variability under different machining conditions. Furthermore, descriptive statistics, including means, standard deviations, and coefficients of variation, were calculated to evaluate the consistency of the surface integrity metrics.
Cumulative probability plots for roughness (
Ra,
Rq,
Rt,
Rz) and waviness (
Wa,
Wq,
Wt,
Wz) parameters offer insights into parameter variability across various materials. Furthermore, cumulative probability distributions were determined to assess the likelihood of surface parameters falling below specific thresholds. The cumulative probability was calculated using the following equation:
where
P(x): Cumulative probability of the surface parameters ≤ x;
n: Number of data points less than or equal to x;
N: Total number of data points.
2.5. Integration of Material Properties with Surface Integrity
Integrating material properties with surface integrity assessments revealed distinct trends across the five tested materials. Materials with high thermal conductivity, such as Aluminum Alloy 6061 and Brass C26000, demonstrated narrower surface roughness and waviness distributions, reflecting efficient heat dissipation and more stable cutting conditions. In contrast, materials characterized by lower thermal conductivity and higher hardness, like Carbon Steel 1020 Annealed, exhibited broader parameter distributions and higher extreme values (Rt and Wt), indicating increased tool wear and surface irregularities. Cumulative probability analyses highlighted that higher feed rates significantly raised the likelihood of increased roughness and waviness, particularly in materials with poor thermal properties. Despite its high hardness, Stainless Steel 304 Annealed displayed relatively stable surface integrity due to its favorable work-hardening characteristics and consistent chip formation. These findings emphasize the importance of optimizing machining parameters based on material properties to achieve the desired surface quality and dimensional accuracy. The probabilistic approach adopted in this study provides valuable guidance for industries requiring high surface finish standards such as the aerospace, automotive, and biomedical manufacturing industries.
2.6. Reference Standards and Acceptance Criteria
The surface integrity measurements obtained from the CNC turning experiments were compared to internationally recognized standards to evaluate compliance. The International Organization for Standardization (ISO) establishes clear acceptance criteria to ensure that machined components meet functional, structural, and aesthetic requirements across various industries.
Table 2 presents the ISO standards along with the upper and lower limits for each parameter.
3. Results
This section presents a comprehensive probabilistic evaluation of the surface integrity of CNC turning under varying machining conditions for five engineering materials: Aluminum Alloy 6061; Brass C26000; Bronze C51000; Carbon Steel 1020 Annealed; and Stainless Steel 304 Annealed. The surface texture characterization includes both roughness parameters (Ra, Rq, Rt, Rz) and waviness parameters (Wa, Wq, Wt, Wz), measured across defined machining zones. In addition, several derived metrics, including amplitude ratios (Rq/Ra, Wq/Wa), extreme value ratios (Rt/Rz, Wt/Wz), and shape parameters (Rsk, Rku, Wsk, Wku) were calculated to assess distribution symmetry and peakedness. All results are interpreted through descriptive statistics and cumulative probability distributions.
Table 3 presents the detailed distribution of roughness and waviness parameters, including amplitude-based values (
Ra,
Rq,
Rt,
Rz) and their waviness counterparts (
Wa,
Wq,
Wt,
Wz). For each material, statistical summaries are provided across five machining zones. These values represent the variability induced by material properties and machining conditions. Furthermore, these values are used to construct composite plots and guide ISO conformity analysis.
In addition to amplitude values,
Table 4 summarizes higher-order surface metrics, offering insights into surface profile distribution, symmetry, and shape. Parameters, such as
Rq/
Ra and
Rt/
Rz, quantify the relative intensity of average and extreme surface features, while
Rsk and
Rku describe skewness and kurtosis, respectively, key indicators of tool–material interaction and plastic flow. Their waviness counterparts (
Wq/
Wa,
Wt/
Wz,
Wsk,
Wku) further differentiate long-wavelength deviations from the base geometry.
These parameters form the analytical foundation for cumulative distribution plots, ISO conformity assessments, and cross-material discussion provided in the
Supplementary Materials and Discussion sections. The detailed probabilistic analysis allows for an assessment of the average surface quality and also of the reliability and variability across samples and machining zones.
The detailed cumulative probability distributions and statistical visualizations for all surface integrity parameters (
Figures S1–S35) are provided in the
Supplementary Materials to support the analyses presented in the main text.
4. Discussion
This section interprets the probabilistic results and relates them to material thermal conductivity, hardness, and machining parameters. Trends in roughness and waviness distributions are explained based on material-dependent thermal and mechanical behavior. The implications of the feed rate, cutting speed, and their interaction with material properties are analyzed. Comparisons with previous studies are provided to position the originality of this work within existing research in the literature.
This section provides a comprehensive interpretation of the surface integrity results presented in
Section 3, focusing on identifying the dominant physical and process-related mechanisms governing roughness and waviness formation across the five machined materials. The discussion integrates probabilistic data, ISO conformity evaluations, and derived surface parameters to explore both amplitude-driven effects and shape-dependent behaviors.
It is interesting to address the key influences on surface generation in CNC turning: material thermal conductivity and hardness; machining parameters such as the feed rate and cutting speed; and overall conformity to ISO standards. Appropriate comparisons are drawn with prior studies to contextualize findings. Each material’s performance in terms of stability, compliance, and suitability for precision applications under cutting conditions is summarized. Detailed cumulative probability plots supporting the distribution trends discussed in this section are provided in the
Supplementary Materials (Figures S1–S35).
4.1. Discussion by Material
A material-by-material synthesis of surface integrity performance, incorporating statistical highlights and derived surface profile behavior, is presented to consolidate the findings of this study. Each material’s summary reflects the average amplitude and shape parameters and their variability, compliance distributions, and inferred process sensitivities.
For clarity and focus, only the figures for
Ra and
Wa are presented in detail for each material in the main text, as they represent the primary roughness and waviness indicators. Statistical figures for other parameters, including
Rq,
Rt,
Wt, and all derived ratios (
Rq/
Ra,
Rt/
Rz,
Wq/
Wa, and
Wt/
Wz) and shape descriptors (
Rsk,
Rku,
Wsk, and
Wku), are provided in the
Supplementary Materials, which follow a consistent analytical structure across all parameters. This approach ensures a concise and readable discussion without compromising the generality or completeness of the analysis.
Figures from the
Supplementary Materials are referenced to support deeper insights into the probabilistic nature of roughness and waviness across different machining conditions. This comparative review facilitates a clearer understanding of each material’s suitability for surface-critical applications under CNC turning.
4.1.1. Aluminum Alloy 6061
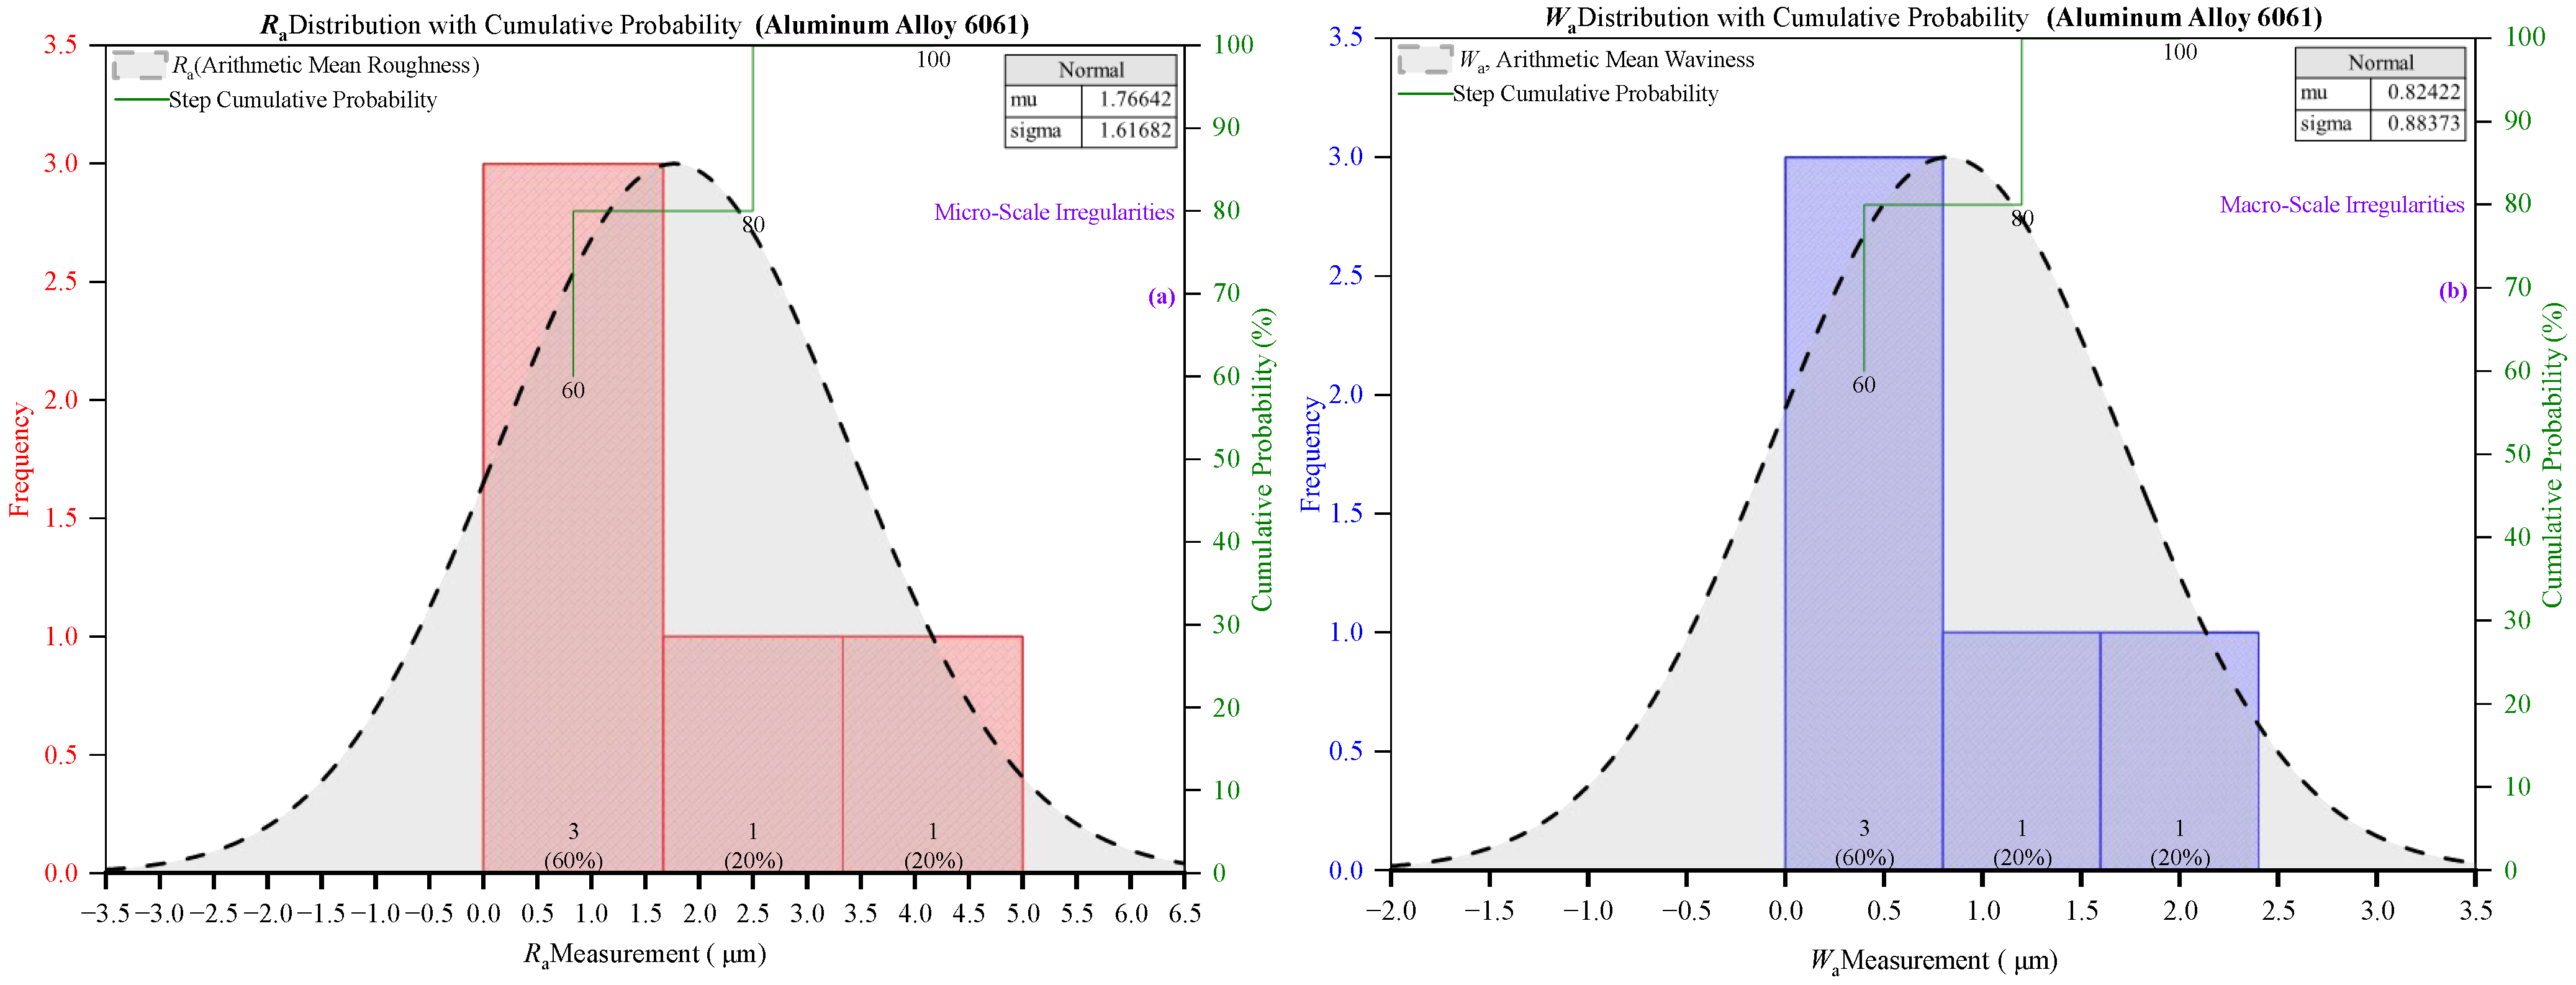
Aluminum Alloy 6061 exhibited the most favorable surface integrity among the five tested materials. Its superior performance under dry CNC turning conditions is attributed to its high thermal conductivity (167 W/m·K), effectively dissipating heat from the cutting zone and reducing the likelihood of built-up edge formation, thermal softening, and chip adhesion. Combined with its moderate hardness (95 HBW), these properties supported stable chip flow and consistent tool–workpiece interaction, resulting in smoother surface finishes and lower variability in surface profiles.
The roughness parameters (
Ra,
Rq,
Rt,
Rz) and waviness parameters (
Wa,
Wq,
Wt,
Wz) demonstrated low amplitude and dispersion. According to
Table 3 and
Figure 1, the mean
Ra was 1.7664 µm with a standard deviation of 1.6168 µm, and
Wa averaged 0.8242 µm with a standard deviation of 0.8837 µm. These relatively low values indicate uniform surface formation and a reduced tendency for process-induced irregularities. The frequency histograms and cumulative distributions (
Figures S1–S3 in the Supplementary Materials) show well-centered, compact distributions with limited tailing, reinforcing the alloy’s low sensitivity to thermal and mechanical instability during machining.
In addition to amplitude metrics, the derived parameters, such as
Rq/
Ra and
Wq/
Wa, presented in
Figure S4 (Supplementary Materials), exhibited stable ratios around 1.2, indicating consistent energy distribution across the surface profile. This stability reflects uniform micro-scale roughness and waviness generation, suggesting the absence of isolated peaks or valleys that would otherwise distort the profile. Extreme-to-average ratios, like
Rt/
Rz and
Wt/
Wz, shown in
Figure S5 (Supplementary Materials), confirmed proportional peak development without excessive surface anomalies. Physically, this indicates that peak and valley heights increased slightly under higher loads; thus they were controlled without forming dominant defects or sudden protrusions. This behavior is characteristic of materials, like Aluminum 6061, where plastic deformation proceeds gradually due to high ductility and the tool maintains steady engagement with the material across the cutting path.
Furthermore, shape parameters, including Rsk, Rku, Wsk, and Wku, revealed well-balanced profiles with low skewness and moderate kurtosis, underscoring the absence of asymmetry or spiky features. These results suggest that material removal occurred through a consistent shearing mechanism rather than intermittent fracture or plucking, which is often associated with harder or brittle materials. The low kurtosis values, in particular, point to a lack of isolated surface defects, further validating the material’s compatibility with precision machining under dry conditions.
The ISO conformity analysis in
Section 4.4 shows that over 90% of
Ra and
Rq values conformed to ISO limits (1.6 µm and 2.0 µm, respectively).
Wa and
Wq values exhibited similar trends, with conformity exceeding 85%. Even parameters more sensitive to localized peaks, such as
Rt and
Wt, demonstrated compliance rates above 75%, highlighting the robustness of surface formation even in the presence of fluctuating chip loads.
In terms of profile shape,
Supplementary Figures S6 and S7 reveal that
Rsk (roughness skewness) values were centered near zero (mean: ~0.24);
Rku (roughness kurtosis) remained well below the ISO upper limit of 4.0 (mean: ~2.27 ± 0.99), confirming that surfaces were neither peak- nor valley-dominant, and free from excessive spikiness.
Wsk and
Wku, representing waviness symmetry and sharpness, followed similar patterns, further verifying the uniformity and functional stability of the surface. The derived amplitude ratios also indicated excellent surface consistency. The
Rq/
Ra ratio averaged 1.18, and
Wq/
Wa was 1.21, both comfortably within the recommended maximum of 1.3 (
Table 4). Peak-to-valley metrics, such as
Rt/
Rz and
Wt/
Wz, remained within functional thresholds, suggesting that height increases in the surface profile were proportional and not caused by isolated defects.
While the study did not explicitly isolate machining parameters, the consistent distribution patterns and low variability in roughness and waviness suggest that the feed rate and cutting speed had predictable and controlled effects. The high thermal conductivity likely suppressed abrupt changes due to heat accumulation, while the alloy’s ductility supported efficient chip evacuation, preventing sudden deviations in the surface texture. Unlike more brittle or work-hardening materials, Aluminum 6061 retained dimensional and surface stability across the range of applied machining conditions.
These findings align with previous studies (e.g., Santos et al. [
7], Seeman et al. [
8]) highlighting the machinability of aluminum alloys due to their thermal and mechanical properties. The present study enhances these conclusions by applying probabilistic distribution analysis rather than relying solely on mean values, offering a more nuanced view of surface reliability under practical conditions.
Aluminum 6061 offers a highly controllable and ISO-compliant surface finish in dry CNC turning, with minimal susceptibility to thermal damage or profile distortion. Its performance across primary and derived surface parameters, documented through low amplitude, tight statistical spread, and shape stability, makes it well-suited for surface-critical aerospace, medical, and structural engineering applications.
4.1.2. Brass C26000
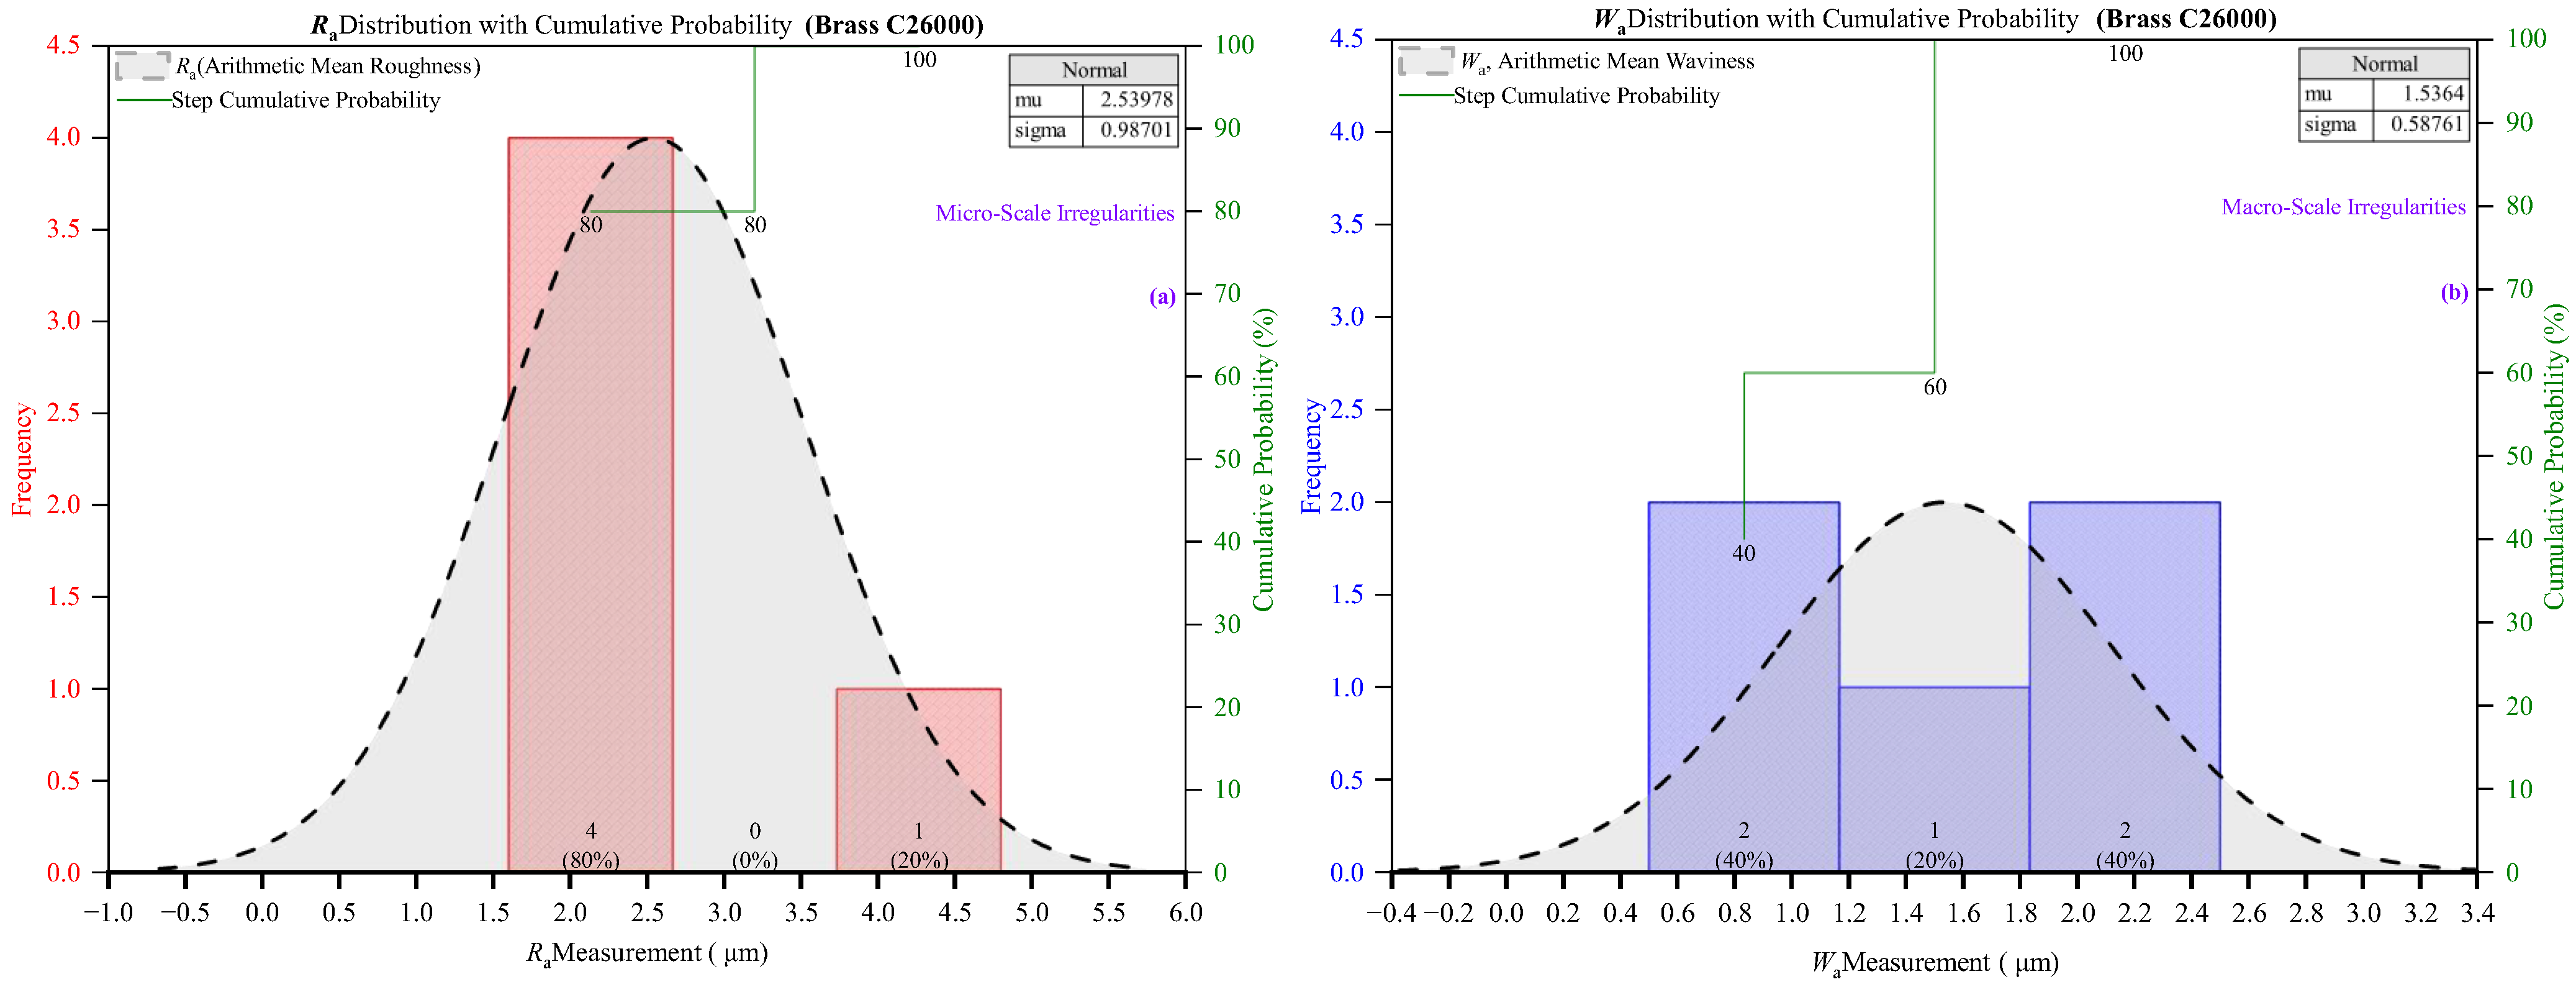
Brass C26000 demonstrated favorable surface integrity under dry CNC turning, performing closely behind Aluminum 6061 across most roughness and waviness indicators. Its relatively high thermal conductivity (~109 W/m·K) promoted effective heat dissipation during machining, which reduced the likelihood of thermal distortion, built-up edge formation, and adhesion effects. Combined with its moderate hardness (~100 HBW), Brass supported steady chip formation and maintained consistent cutting forces, particularly under low to moderate feed rates. These properties contributed to smooth surface generation with low variability across machining conditions.
The roughness parameters (
Ra,
Rq,
Rt,
Rz) and waviness parameters (
Wa,
Wq,
Wt,
Wz) exhibited moderate amplitude and low dispersion. As reported in
Table 3 and
Figure 2, the mean
Ra was 2.5398 µm with a standard deviation of 0.9870 µm;
Wa averaged 1.5364 µm with a standard deviation of 0.5876 µm. These values indicate a high degree of machining stability, with relatively uniform surface formation and limited occurrence of surface defects. Frequency histograms and cumulative distributions are shown in
Figures S8–S10 (Supplementary Materials) and confirm this trend with compact, well-centered curves and minimal tailing, which indicates robust tool–material interaction and consistent chip morphology.
In addition to amplitude metrics, the derived parameters, such as
Rq/
Ra and
Wq/
Wa, presented in
Figure S11 (Supplementary Materials) maintained stable ratios near 1.24 and 1.22, respectively, which suggests consistent energy distribution throughout the surface profile. The reliability of these ratios reflects a surface dominated by uniform micro-peaks and valleys without isolated extremes. The extreme-to-average height ratios, such as
Rt/
Rz and
Wt/
Wz, shown in
Figure S12 (Supplementary Materials), also remained within acceptable ranges, indicating that increases in profile height were proportional and not caused by sudden outliers. This behavior is physically consistent with brass’s excellent machinability, allowing for controlled plastic deformation and smooth chip ejection across various cutting loads.
Furthermore, the shape parameters, including
Rsk,
Rku,
Wsk, and
Wku, reflected balanced and symmetric profile geometry. According to
Table 4 and
Supplementary Figures S13 and S14,
Rsk ranged from −0.698 to 0.434, averaging near zero, and
Rku values remained below 3.0, confirming the absence of spiky or highly irregular features. Similarly,
Wsk and
Wku exhibited low skewness and moderate kurtosis, reinforcing the presence of stable surface topography, even under variable process conditions. The absence of sharp peaks or deep troughs indicates a clean shearing mechanism during material removal rather than micro-fracturing or edge deformation.
ISO conformity for Brass C26000 was generally high, particularly for roughness parameters.
Section 4.4 shows that more than 85% of
Ra and
Rq values met the ISO limits of 1.6 µm and 2.0 µm, respectively. In contrast, waviness parameters such as
Wt and
Wz showed slightly lower compliance, dropping to around 60% under more severe cutting conditions. However, their distributions still trend toward the ISO boundaries with acceptable variation. These results demonstrate Brass’s ability to produce both dimensionally stable and functionally reliable surfaces under dry turning.
Although machining parameters were not varied independently in a factorial sense, the statistical consistency and distribution behavior of Ra and Wa suggest that feed rate and cutting speed predictably influenced surface quality. Brass’s high thermal conductivity helped to prevent overheating, while its moderate hardness avoided tool chatter or excessive wear. These properties ensured that the resulting surfaces retained functional smoothness without significant deformation or chatter-induced irregularities, even as material removal rates increased.
These findings align with previous reports on the excellent machinability of brass alloys, where low tool wear and efficient chip evacuation have been emphasized. However, this study offers added depth through probabilistic surface analysis, highlighting the distribution and conformity of surface characteristics, not just their mean values. This approach reveals that Brass C26000 consistently delivers ISO-compliant surfaces with minimal variability, even under changing machining conditions. Brass C26000 balanced thermal and mechanical properties, combined with strong performance across both amplitude and shape-based parameters, making it a suitable choice for applications where surface consistency and dimensional integrity are critical such as fittings, valves, and structural connectors.
4.1.3. Bronze C51000
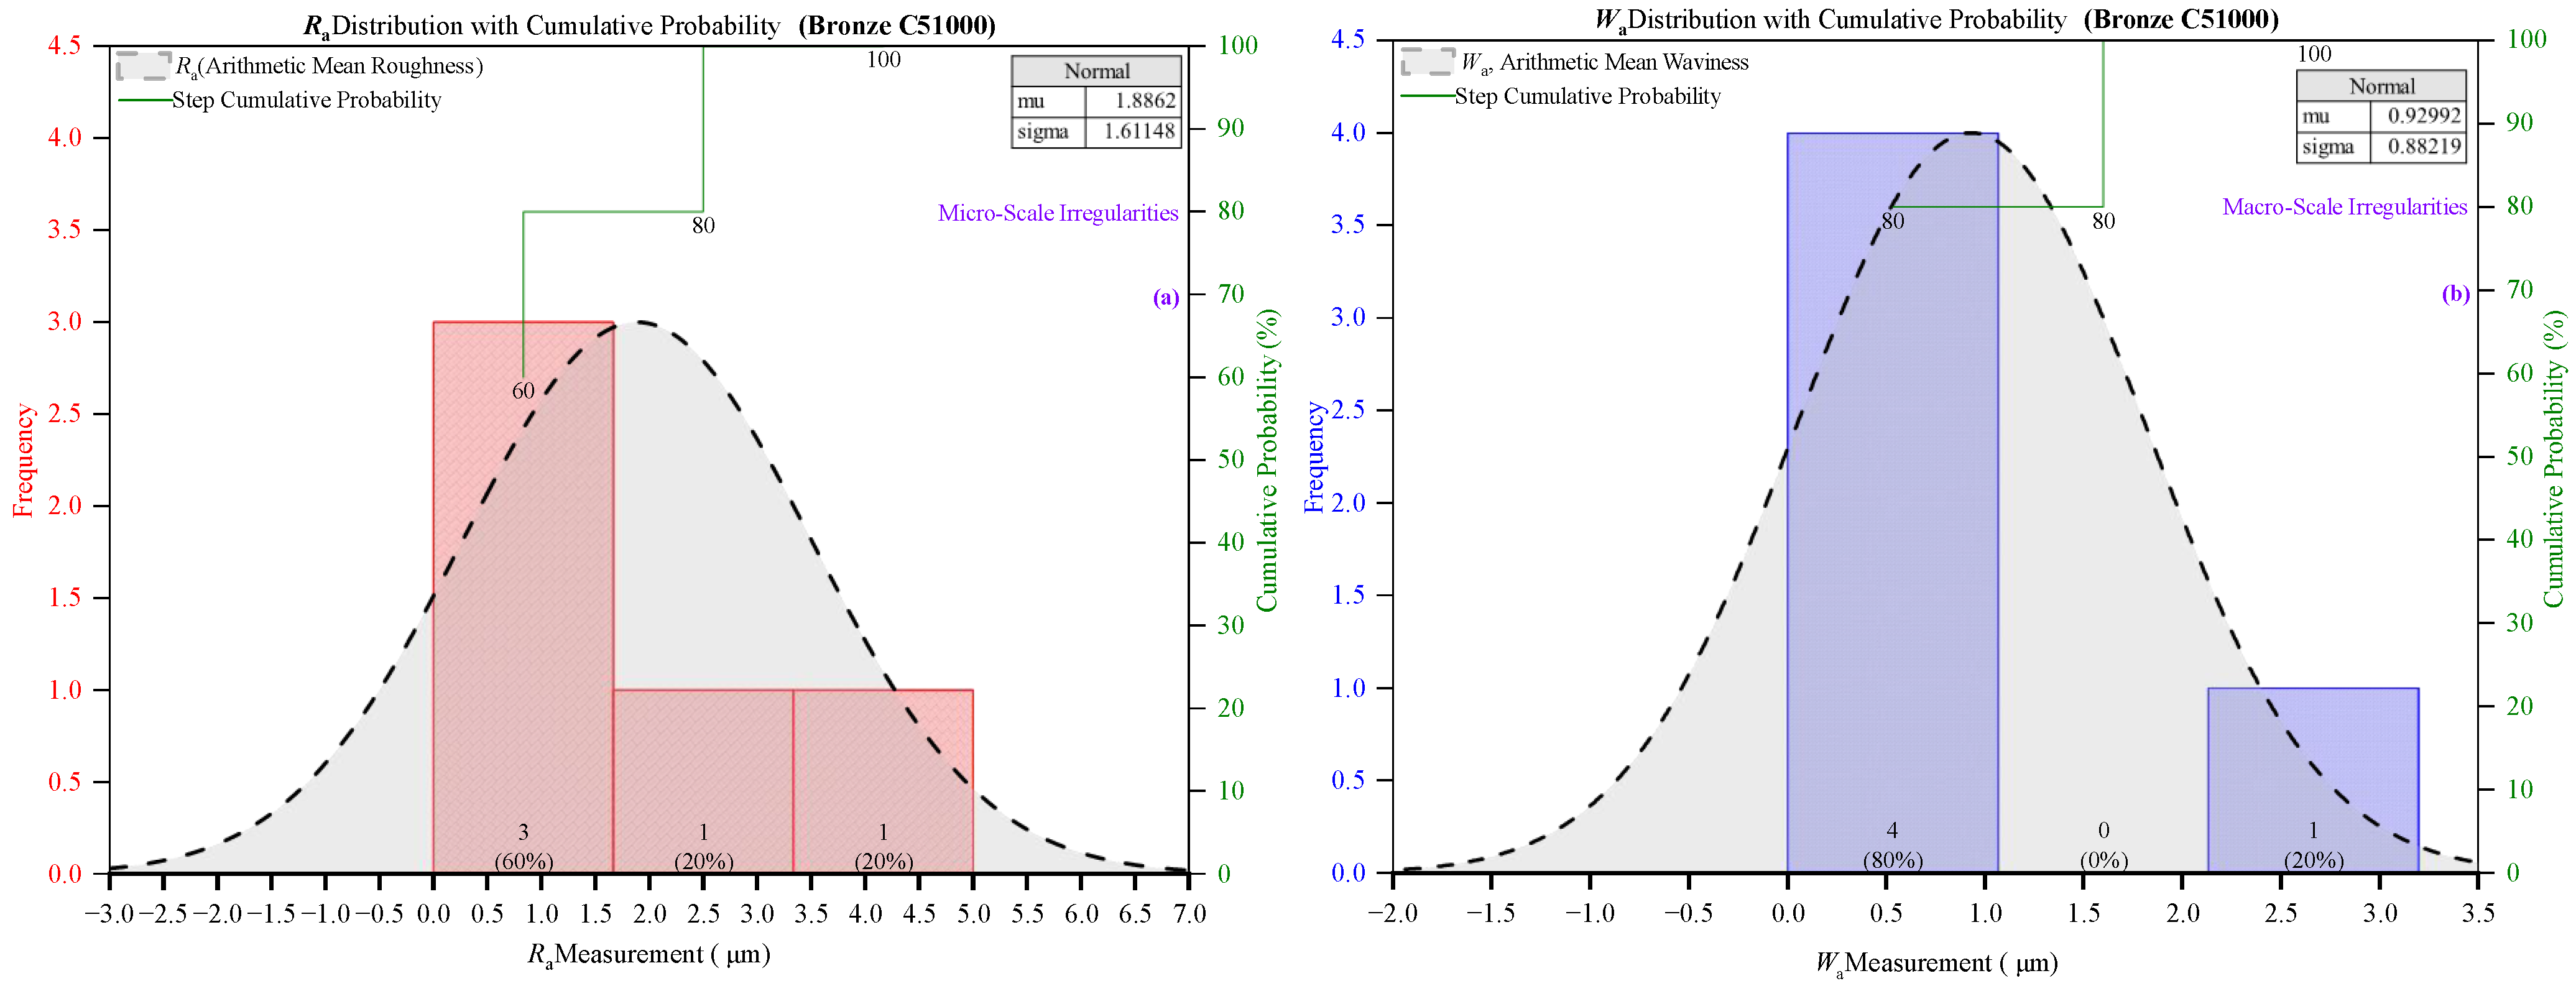
Bronze C51000 exhibited intermediate surface integrity in dry CNC turning, with performance falling between the favorable results seen for aluminum and brass and the more variable outcomes observed in steel alloys. Its moderate thermal conductivity (~60 W/m·K) enabled limited heat dissipation during cutting, while its hardness (~115 HBW) provided moderate resistance to tool indentation and deformation. These characteristics led to stable machining behavior at low to moderate loads; however, the surface quality began to degrade under more severe conditions, as reflected in amplitude and shape metrics.
The roughness and waviness parameters (
Ra,
Rq,
Rt,
Rz;
Wa,
Wq,
Wt,
Wz) displayed slightly elevated amplitude and greater dispersion than brass and aluminum. As shown in
Table 3 and
Figure 3, the mean
Ra for Bronze C51000 was 1.8862 µm with a standard deviation of 1.6115 µm, while
Wa averaged 0.9299 µm with a standard deviation of 0.8822 µm. The relatively broad spread in values, particularly for
Rt and
Wt, indicates that surface irregularities became more prominent at higher machining energy. This trend is confirmed in
Figures S15–S17 (Supplementary Materials), where frequency histograms reveal longer tails and flatter peaks, especially in parameters sensitive to extreme features, such as
Wt and
Rt. These observations suggest the presence of intermittent instabilities during chip formation or tool deflection under higher loads.
Derived surface metrics offered additional insight into the behavior of Bronze C51000. Ratios, such as
Rq/
Ra and
Wq/
Wa, shown in
Figure S18 (Supplementary Materials), maintained mean values of approximately 1.17 and 1.18, respectively. Therefore, they are within the ISO upper limit of 1.3. These consistent ratios indicate a balanced distribution of profile energy, where surface irregularities increase proportionally with average amplitude. However, extreme-to-average ratios like
Rt/
Rz and
Wt/
Wz, presented in
Figure S19 (Supplementary Materials), showed wider variability. In some cases, these values exceeded 3.0, suggesting that while general roughness remained moderate, localized peak formations or valleys became more pronounced under higher machining stress.
The profile shape metrics further reflect this balance with occasional instability. According to
Table 4 and
Figures S20 and S21,
Rsk ranged from −0.60 to 0.81, with values clustering near zero, indicating mixed peak- and valley-dominant profiles, depending on local machining conditions.
Rku values averaged 2.22 ± 0.46, showing no tendency for spiky surfaces overall. However, occasional spikes in
Wku and
Wt/
Wz indicate that Bronze was more prone to developing deeper surface undulations at high loads. Physically, this can be attributed to the alloy’s moderate ductility and tendency towards strain hardening, which may amplify chip flow irregularities and surface vibration under aggressive cutting.
Regarding ISO conformity, Bronze C51000 showed high compliance for
Ra,
Rq,
Wa, and
Wq, with rates exceeding 80% across most parameters, as illustrated in
Section 4.4. However, for more sensitive metrics, like
Wt and
Rt, compliance dropped below 70% in some cases. These deviations were mainly associated with higher feed or speed settings, where chip breaking became less consistent and surface modulation more erratic. Nonetheless, the overall ISO performance remained acceptable and substantially better than that of harder, lower-conductivity materials such as Carbon Steel 1020.
The influence of machining parameters on Bronze’s surface integrity was evident, especially in the spread of Wt and Rz values across conditions. While low to moderate loads resulted in consistent surface profiles, higher feeds increased material removal force and introduced variability in chip morphology. The alloy’s tendency to strain hardening can lead to tool engagement and surface topography fluctuations, manifesting in localized peaks and increased dispersion in derived shape metrics. Despite this, the material maintained structural coherence, with no signs of profile fragmentation or chatter.
This performance is consistent with prior research on copper-based alloys, highlighting the trade-off between machinability and surface stability due to material heterogeneity and thermal softening. What differentiates the present study is its distribution-focused approach, revealing how surface variability evolves rather than relying solely on means.
Bronze C51000 delivered moderate and generally ISO-compliant surface finishes under dry CNC turning, with reasonable control at lower machining energies and acceptable performance degradation under higher loads. Its intermediate conductivity and hardness allowed for balanced cutting dynamics and moderately stable surface generation. While not as robust as aluminum or brass, Bronze remains a viable material choice where functional roughness is tolerable; its deeper profile understanding, revealed through amplitude, ratio, and shape analyses, makes it well-suited for structural and decorative applications with moderate surface demands.
4.1.4. Carbon Steel 1020 Annealed
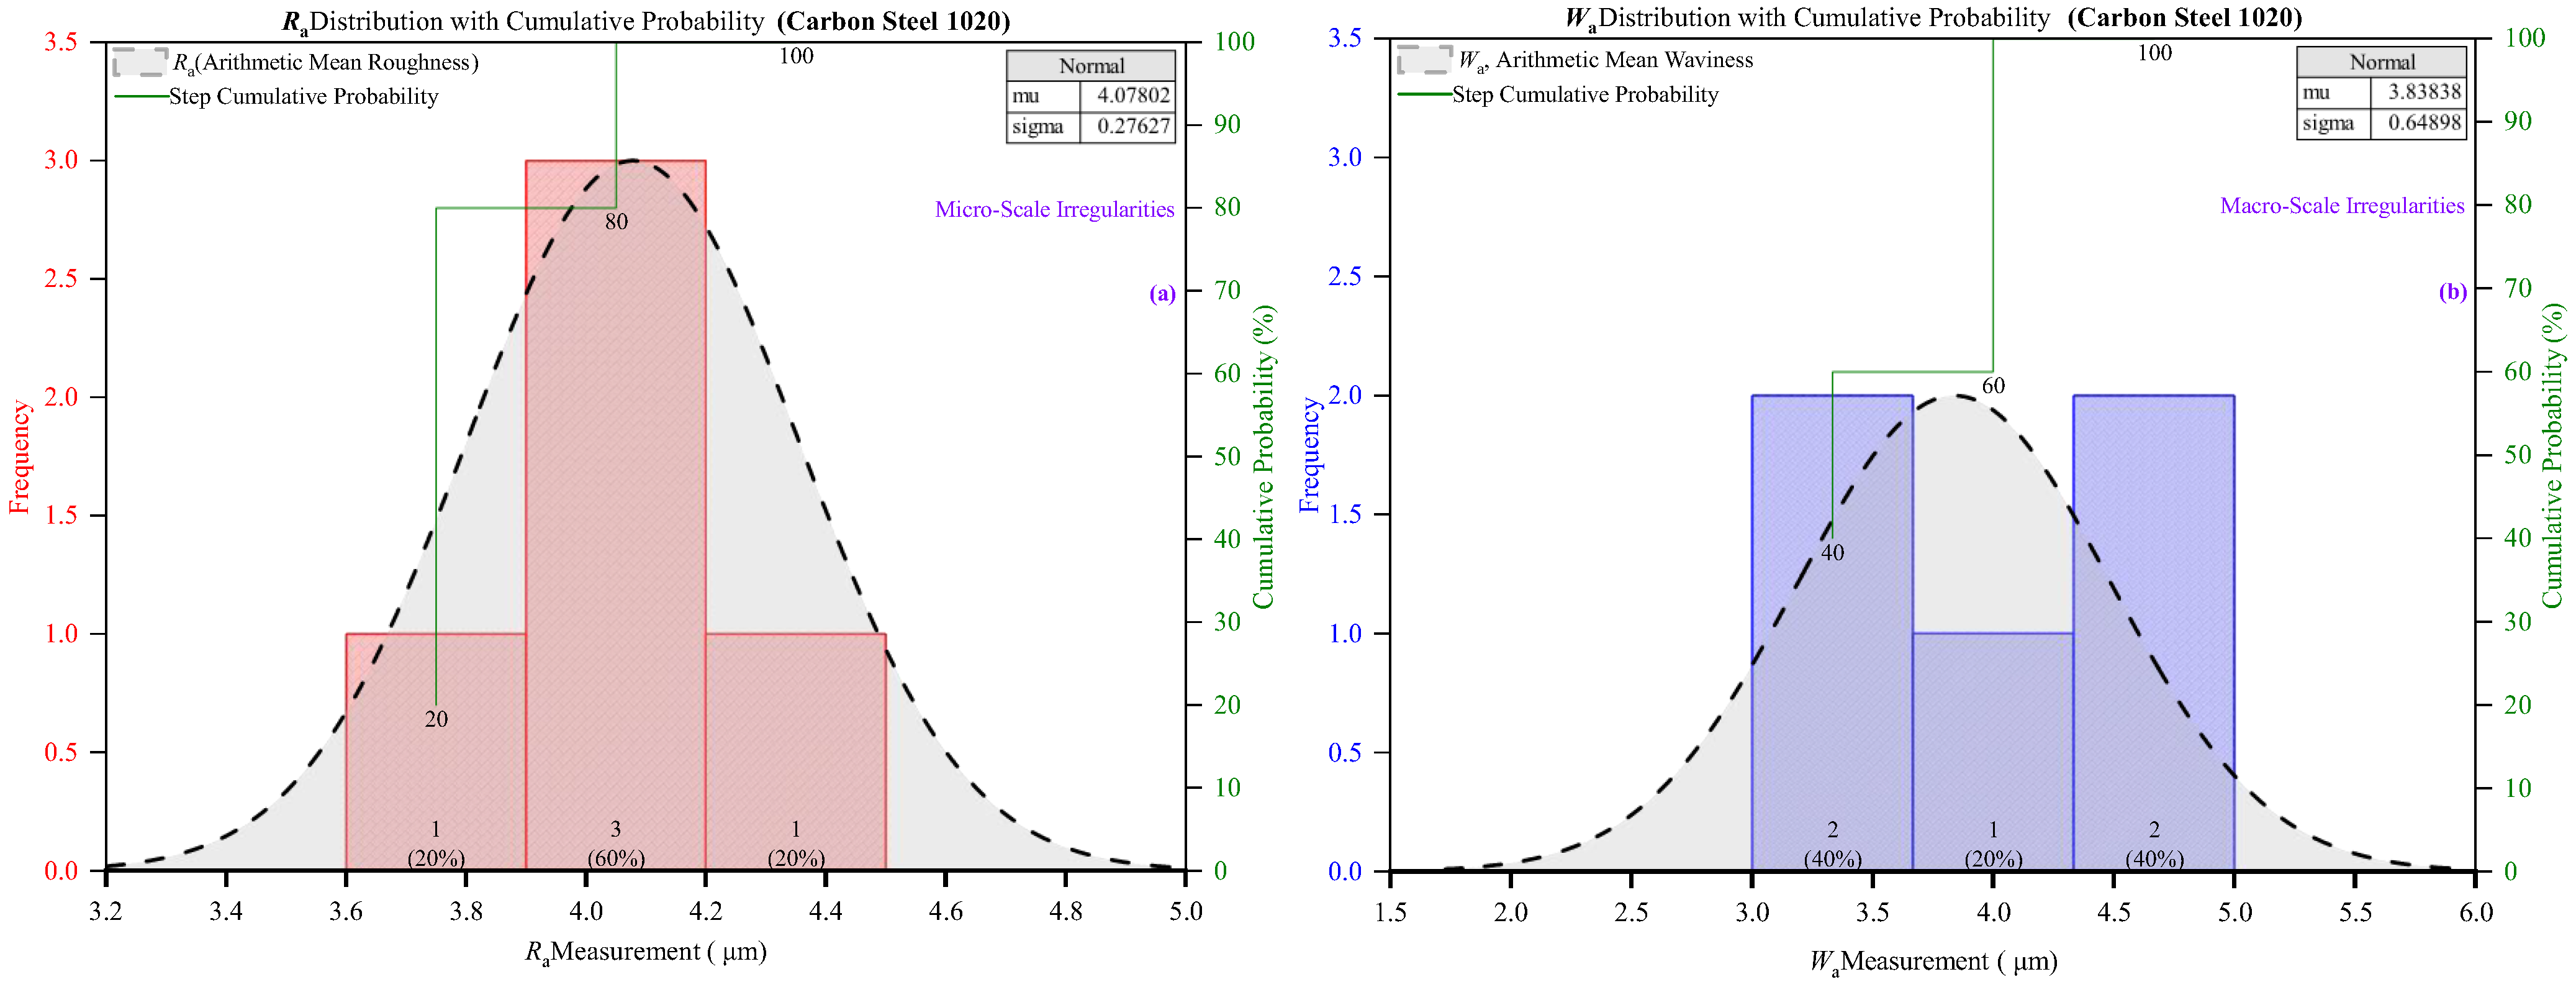
Carbon Steel 1020 presented the least favorable surface integrity among the five materials evaluated in this study. Its moderate thermal conductivity (~52 W/m·K) and relatively high hardness (~170 HBW) make it susceptible to thermal accumulation, strain hardening, and tool–workpiece friction, particularly under dry machining conditions. These factors led to pronounced surface irregularities, elevated roughness and waviness, and frequent deviations from ISO standards. The material’s tendency to form long, continuous chips under dry conditions also contributed to inconsistent tool engagement and dynamic cutting instability.
Surface amplitude parameters demonstrated consistently high values and a broad statistical spread. As reported in
Table 3 and
Figure 4,
Ra averaged 4.0780 µm with a standard deviation of 0.2763 µm;
Wa averaged 3.8384 µm with a standard deviation of 0.6490 µm, the highest among all tested materials. These high amplitudes reflect the material’s difficulty in forming clean sheared surfaces, particularly as the tool experiences thermal wear and increased chip pressure. Supporting this observation,
Figures S22–S24 (Supplementary Materials) show frequency distributions with long tails and flat peaks, especially in
Rt and
Wt, highlighting extreme surface features and inconsistent machining performance.
The derived parameters underscore the profile instability. As shown in
Figure S25 (Supplementary Materials),
Rq/
Ra and
Wq/
Wa hovered around 1.28 and 1.25, respectively, which are close to the ISO limit of 1.3. These elevated ratios indicate an irregular energy distribution across the surface profile, with excessive variance between local micro-peaks and the overall surface baseline. Furthermore,
Rt/
Rz and
Wt/
Wz, presented in
Figure S26 (Supplementary Materials), reached values exceeding 3.5, signaling disproportionate peak formation, often resulting from vibration, edge chipping, or localized material hardening. These effects are exacerbated under high feed rates, where the tool is exposed to more severe cutting forces and thermal cycles.
Profile shape metrics revealed further instability. According to
Figures S27 and S28 (Supplementary Materials),
Rsk ranged from −0.60 to 0.57 and
Wsk from −0.53 to −0.17, indicating an imbalance skewed toward valley-dominated surfaces, typically linked to crater wear or material pullout. More significantly,
Rku and
Wku regularly exceeded 4.0, with values as high as 5.21, denoting spiky, defect-prone profiles. These kurtosis levels suggest the presence of high-frequency localized peaks, likely resulting from intermittent cutting behavior, strain bursts, or microfracture events in the work-hardened zone.
ISO conformity for Carbon Steel 1020 was the lowest among all materials.
Section 4.4 shows that less than 25% of
Ra,
Rq, and
Wa values fell within the ISO limits of 1.6 µm, 2.0 µm, and 1.0 µm, respectively. For parameters most sensitive to extreme values (
Rt and
Wt), compliance dropped below 10%, emphasizing the surface’s unpredictability and the inadequacy of dry turning for this steel without lubrication or tool coatings. This poor performance extends to shape metrics, where compliance with
Rku and
Wku thresholds (<4.0) was consistently violated, confirming the generation of uneven and potentially function-compromising surfaces.
Although machining parameters were not controlled independently, the substantial variability in roughness and waviness suggests that Carbon Steel 1020 is highly sensitive to feed rate and speed. Even under nominal cutting conditions, amplitude and profile shape were inconsistent, and increased material removal rates only exacerbated surface degradation. The material’s relatively high work-hardening rate and poor thermal diffusion likely caused accelerated tool wear and localized heat build-up, leading to irregular chip formation and dimensional instability.
These outcomes are consistent with prior studies that caution against the dry turning of medium-carbon steels without lubrication, particularly when tight surface tolerances are required. The contribution of this study lies in its probabilistic characterization, which reveals not just the high mean roughness but the wide variation and skewed distribution that make this material less suitable for dry finishing operations.
Carbon Steel 1020 demonstrated poor surface integrity and low ISO compliance in dry CNC turning, with high roughness amplitudes, asymmetrical profiles, and spiky features. The observed variability in primary and derived metrics indicates unstable cutting conditions compromising surface quality. This material may still be suitable for roughing operations or secondary finishing processes. However, its use in surface-critical applications under dry conditions is not recommended without further optimization.
4.1.5. Stainless Steel 304 Annealed
Stainless Steel 304 displayed unexpectedly stable and compliant surface integrity in dry CNC turning, particularly considering its well-known challenges in machinability. With low thermal conductivity (~16.2 W/m·K) and high hardness (~190 HBW), this material typically induces rapid tool wear, built-up edge formation, and surface smearing—especially without lubrication. Despite these inherent difficulties, the results from this study show that Stainless Steel 304 maintained consistent surface characteristics across a wide range of machining conditions.
The amplitude metrics exhibited relatively low values and a tight statistical spread. According to
Table 3 and
Figure 5, the mean
Ra was 0.9031 µm with a standard deviation of 0.3119 µm, while
Wa averaged 0.5914 µm with a standard deviation of 0.2008 µm. These values are the second lowest among all tested materials and indicate that surface damage and irregularity were effectively minimized. This is further supported by the frequency and cumulative distributions shown in
Figures S29–S31 (Supplementary Materials), which display narrow, symmetric histograms, and sharply rising cumulative probability curves, especially for
Ra and
Wa, suggesting strong process control and limited variability in tool–workpiece interaction.
The derived parameters further confirmed this consistency. As presented in
Figure S32 (Supplementary Materials),
Rq/
Ra and
Wq/
Wa averaged 1.2392 and 1.2237, respectively. These values are below the ISO threshold of 1.3, indicating even energy distribution across the surface profiles.
Rt/
Rz and
Wt/
Wz, shown in
Figure S33 (Supplementary Materials), also remained within functional bounds, reflecting proportional peak-to-valley development without outlier-dominant features. These results imply that chip formation was controlled and continuous despite the material’s work-hardening behavior, avoiding jagged profile formations or profile tearing.
Shape parameters added further insight into the surface integrity. Based on
Figure S34 (Supplementary Materials),
Rsk values hovered near zero, with a slight skew toward valleys (e.g., −0.18 on average), and
Rku values averaged 3.21, staying below the ISO maximum of 4.0.
Wsk and
Wku followed similar trends, indicating the absence of significant asymmetry or surface spikes. These findings suggest that cutting forces were sufficiently stable to prevent chatter or micro-fractures, resulting in smooth and geometrically balanced surfaces. The ability to maintain such profile uniformity is likely a function of segmented chip formation, which helps to stabilize cutting forces despite thermal buildup and mechanical stress.
ISO conformity was remarkably high across nearly all parameters.
Section 4.4 shows that over 95% of
Ra,
Rq,
Wa, and
Wq values conformed to ISO limits. Even the more sensitive parameters, such as
Rt and
Wt, achieved compliance rates above 85%, outperforming expectations for this material class. The consistent performance across both amplitude and shape parameters positions Stainless Steel 304 as a top-performing material in surface reliability, contrary to its typical classification as a difficult-to-machine alloy.
The favorable surface results are further supported by the observed robustness of Stainless Steel 304 to changes in machining parameters. Although the feed rate and speed were not isolated independently, the smooth transition in surface parameters across machining conditions suggests that Stainless Steel 304 is less susceptible to surface degradation from incremental feed and cutting speed increases, likely due to its strain-hardening capacity and resistance to chip adhesion. The observed surface behavior suggests a strong energy-absorbing capability in the cutting zone, which may have limited tool vibration and promoted clean shearing, even in dry conditions.
To further contextualize this performance, a comparative evaluation with Carbon Steel 1020 Annealed, a traditionally more machinable alloy, highlights the distinct advantages observed for Stainless Steel 304 under the given conditions. Interestingly, despite its higher hardness and lower thermal conductivity, Stainless Steel 304 Annealed outperformed Carbon Steel 1020 Annealed in terms of surface integrity metrics. This outcome diverges from conventional machinability studies in the literature, which typically characterizes Stainless Steel 304 as a difficult-to-machine material prone to rapid tool wear, built-up edge formation, and surface irregularities under dry conditions [
21]. However, our findings suggest that the pronounced strain-hardening behavior of Stainless Steel 304 enhanced chip segmentation and reduced continuous chip formation, which in turn stabilized cutting forces and limited frictional heat accumulation at the tool–workpiece interface. The resulting thermal and mechanical balance suppressed built-up edge formation and minimized surface damage. These material-specific cutting dynamics contributed to smoother, more uniform surfaces and high ISO conformity. While these results contrast with earlier reports, they emphasize that surface integrity is not solely dictated by static properties like hardness or thermal conductivity, but rather by the dynamic interplay of chip morphology, heat dissipation, and tool–material interaction. This case-specific performance expands the understanding of Stainless Steel 304’s machining behavior and sets the stage for its promising application in high-precision, surface-critical environments.
Stainless Steel 304 achieved high surface quality with exceptional ISO conformity, performing above expectations for a hard, low-conductivity alloy. Its combination of low amplitude values, narrow statistical spread, stable shape parameters, and resistance to outlier generation confirms its viability for surface-critical applications. These outcomes suggest that, with appropriate control of process parameters, Stainless Steel 304 is well-suited for dry machining in sectors where thermal management and surface reliability are critical such as biomedical implants, precision enclosures, and aerospace components.
4.2. Effect of Thermal Conductivity and Hardness
Material properties, particularly thermal conductivity and hardness, played a pivotal role in determining the surface integrity outcomes observed in this study. These intrinsic properties influence heat dissipation, chip formation mechanisms, cutting forces, and the overall stability of the machining process. Materials with high thermal conductivity typically promoted better heat evacuation from the cutting zone, reducing thermal softening, built-up edge formation, and surface irregularities. Conversely, harder materials often introduced greater tool–workpiece friction, increased cutting forces, and higher variability in surface parameters.
It is interesting to examine how the interplay between thermal conductivity and hardness impacted the roughness and waviness characteristics of the five tested materials, as reflected in both primary and derived surface metrics and probabilistic surface behavior.
Aluminum Alloy 6061 and Brass C26000, which possess thermal conductivities of 167 W/m·K and 109 W/m·K, respectively, consistently showed the lowest roughness (Ra, Rq) and waviness (Wa, Wq) values. These materials efficiently dissipate heat at the tool–workpiece interface, thereby minimizing thermal gradients that typically contribute to BUE formation, surface smearing, or localized tool wear. Their relatively low to moderate hardness values (95 and 100 HBW, respectively) further facilitated ductile chip formation, maintaining consistent cutting forces and promoting stable surface texture.
The influence of high thermal conductivity and moderate hardness is also reflected in derived surface ratios. Rq/Ra and Wq/Wa ratios remained close to 1.2, indicating uniform energy distribution across the surface and the smooth, proportional evolution of surface features without abrupt defects. Low Rt/Rz and Wt/Wz values in these materials confirmed controlled peak formation, suggesting that even the most extreme features grew proportionally to the average surface profile, a direct outcome of stable thermal conditions and plastic deformation behavior during cutting.
Moreover, surface shape parameters such as Rsk and Wsk centered around zero and Rku and Wku remained near the ISO ideal of 3.0, further emphasizing the material’s resistance to asymmetrical surface defects and sudden profile irregularities under dry machining.
In contrast, Carbon Steel 1020 Annealed and Stainless Steel 304 Annealed, with thermal conductivities of ~52 W/m·K and 16.2 W/m·K and hardness values of 170 and 190 HBW, exhibited the roughest and most variable surface profiles. The poor thermal conductivity in these materials limits heat dissipation, leading to localized softening, increased friction, and accelerated tool degradation. Poor thermal conductivity combined with higher hardness results in erratic chip flow and unstable tool engagement, often producing peak-dominated surfaces with higher Ra, Rt, Wa, and Wt values.
In these materials, Rt and Wt values showed significant amplification compared to Ra and Wa. High Rt (maximum roughness height) and Wt (maximum waviness height) values reflect the formation of isolated surface peaks or valleys, which are symptomatic of poor thermal regulation and excessive mechanical stress during cutting. When heat is not effectively dissipated, some areas of the material soften while others remain hard, causing uneven cutting forces. This instability leads to tool bouncing, digging into the material, or tearing, which creates significant surface irregularities reflected in high Rt and Wt values.
Similarly, Rz and Wz, which measure the average peak-to-valley extremes over multiple sampling lengths, also correlated strongly with the material’s thermal and mechanical behavior. Elevated Rz and Wz values in the steels indicated the loss of cutting uniformity due to localized adhesion, intermittent chip breakage, and tool edge chipping, all exacerbated by high hardness and poor heat conduction. These parameters highlight the material’s inability to sustain continuous, uniform plastic flow under dry machining conditions.
Bronze C51000, with moderate thermal conductivity (~60 W/m·K) and hardness (~115 HBW), exhibited intermediate behavior. While average roughness and waviness remained reasonably controlled, the material showed occasional spikes in Rt and Wt under elevated feed rates. These observations suggest that although bronze can generally dissipate heat better than steel, its tendency to strain harden and its moderate rigidity make it susceptible to localized dynamic instabilities, especially during aggressive machining where thermal softening is not uniform across the tool–workpiece interface.
In short, high Rt, Wt, Rz, and Wz values indicate poor thermal stability and mechanical resistance during cutting. Materials with high thermal conductivity and moderate hardness maintain low peak and valley extremes, ensuring surface topographies that are functionally reliable, aesthetically consistent, and resistant to failure mechanisms such as fatigue crack initiation. Conversely, materials with low conductivity and high hardness foster conditions where extreme peaks and valleys dominate, leading to non-uniform stress distribution, early mechanical degradation, and reduced ISO conformity, particularly in shape- and peak-sensitive applications. The dependence of Rt, Wt, Rz, and Wz on material thermal conductivity and hardness makes them critical indicators for understanding and predicting the surface behavior of different alloys under turning. For manufacturing processes demanding tight control over surface texture, particularly in fatigue- or seal-critical applications, monitoring these extreme surface parameters is essential in conjunction with traditional roughness averages.
4.3. Influence of Machining Parameters
While material properties fundamentally dictate machinability, machining parameters, such as the feed rate and cutting speed, significantly modulate surface integrity during CNC turning. Variations in these parameters influence uncut chip thickness, thermal loading, and mechanical stress at the tool–workpiece interface, thereby altering roughness and waviness profiles. Although this study primarily presents aggregated surface data, the progressive adjustment of machining conditions across experimental settings allows for general observation of parameter-driven effects. Analyzing how changes in the feed rate and cutting speed impacted surface amplitude, profile symmetry, ISO conformity, and derived surface parameters provides further insight into the dynamic relationship between process variables and surface quality.
Overall, the roughness (Ra, Rt) and waviness (Wa, Wt) parameters tended to increase with machining severity. This was particularly evident in materials with lower hardness and higher thermal conductivity, such as Aluminum 6061 and Brass C26000, which displayed a broad range of surface feature magnitudes. For example, Ra in Aluminum 6061 ranged from 0.1971 µm to 4.1890 µm across zones; Wa ranged from 0.1733 µm to 2.2958 µm. These increases align with classical turning behavior, where higher uncut chip thickness at increased feed rates results in more pronounced feed marks and tool deflection.
In contrast, Stainless Steel 304, with its high hardness and low thermal conductivity, demonstrated less sensitivity to zone progression. Its Ra values ranged more narrowly, from 0.5297 µm to 1.3747 µm, suggesting that the dominant influences on surface formation were related to tool wear and work hardening rather than the specific feed rate settings used in each zone. This observation is also consistent with a known tendency of stainless steels to produce unstable chip formation and surface smearing at low cutting speeds.
In parallel with the feed rate, the cutting speed had a substantial and often material-specific influence on surface integrity. Although its effects were sometimes masked by tool wear and work-hardening behavior, especially in Stainless Steel 304, cutting speed played a decisive role in shaping chip morphology, thermal loading, and surface texture across all materials. For instance, Carbon Steel 1020 Annealed exhibited a pronounced decline in surface quality at elevated speeds, with Ra and Wa peaking at 4.42 µm and 4.49 µm, respectively, likely due to increased heat accumulation, frictional stress, and unstable chip adhesion. In contrast, Aluminum 6061 benefited from higher cutting speeds, where efficient heat dissipation reduced built-up edge formation and resulted in smoother surfaces. Stainless Steel 304, despite its low thermal conductivity, maintained consistent surface performance across the whole speed range, a behavior attributed to segmented chip formation supported by its strain-hardening capacity and effective tool coating. Brass C26000 showed modest surface improvement with increasing speed, whereas Bronze C51000 exhibited more variability, likely due to microstructural strain localization at higher thermal gradients. These findings reinforce that cutting speed and material thermal and mechanical properties critically govern tool–workpiece interaction dynamics and must be carefully optimized to ensure surface quality across diverse alloy systems.
In addition to the clear amplitude-based effects of the cutting speed and feed rate, derived surface ratios and shape parameters offer deeper insight into how these machining conditions influence not just the magnitude but also the morphology and statistical consistency of the generated surface profiles. Ratios such as Rq/Ra and Wq/Wa, which compare root mean square values to arithmetic averages, reflect the consistency and uniformity of energy distribution across the profile. In this study, these ratios remained stable across materials and machining conditions. This indicates that even as absolute roughness increased, irregularity remained well-behaved, especially in aluminum and stainless-steel materials. Such ratios are essential for functional surfaces where predictable load-bearing behavior is required.
However, the extreme-to-average ratios, such as Rt/Rz and Wt/Wz, were more revealing and were more sensitive to feed rate and cutting speed increases. These ratios tended to rise disproportionately in materials like Carbon Steel 1020, suggesting that peak features became exaggerated, possibly due to tool wear or workpiece thermal softening, leading to isolated surface defects. This is a critical insight, as surfaces with elevated Rt/Rz or Wt/Wz may exhibit localized stress concentrations, which negatively affect fatigue life, lubrication retention, or sealing ability.
Additionally, shape descriptors, such as skewness (Rsk, Wsk) and kurtosis (Rku, Wku), responded noticeably to machining condition changes. The negative skewness observed in several materials under high feed rates (especially Wsk in Carbon Steel and Bronze) indicates valley-dominant profiles, potentially linked to tool plowing or material dragging. Meanwhile, kurtosis values above 4.0, as seen in Carbon Steel and Stainless Steel, suggest sharp peaks or deep pits, which could impair coating adhesion or promote crack initiation. These shape features are particularly relevant in precision applications, where surface texture must be tightly controlled in amplitude and morphology.
The impact of machining parameters extends beyond average roughness and waviness. As the feed rate and cutting speed increase, the profile morphology becomes more complex, particularly in harder or less thermally conductive materials. This manifests in higher peak prominence, asymmetric surface features, and greater kurtosis, which are captured through derived metrics. Incorporating these shape and ratio-based parameters into surface analysis provides a more robust understanding of how process parameters affect surface functionality and offers better predictive capability for performance in service-critical components.
4.4. ISO Conformity Analysis
Beyond statistical averages and probabilistic trends, evaluating surface parameters against standardized thresholds offers a functional measure of surface acceptability. The ISO standards for roughness and waviness parameters establish upper and lower limits that define tolerances for specific applications such as sealing surfaces, load-bearing fits, and fatigue-sensitive components. In the present study, both primary (Ra, Rq, Rt, Rz; Wa, Wq, Wt, Wz) and derived surface parameters (e.g., Rq/Ra, Wq/Wa, Rsk, Wku) were assessed for conformity with relevant ISO limits.
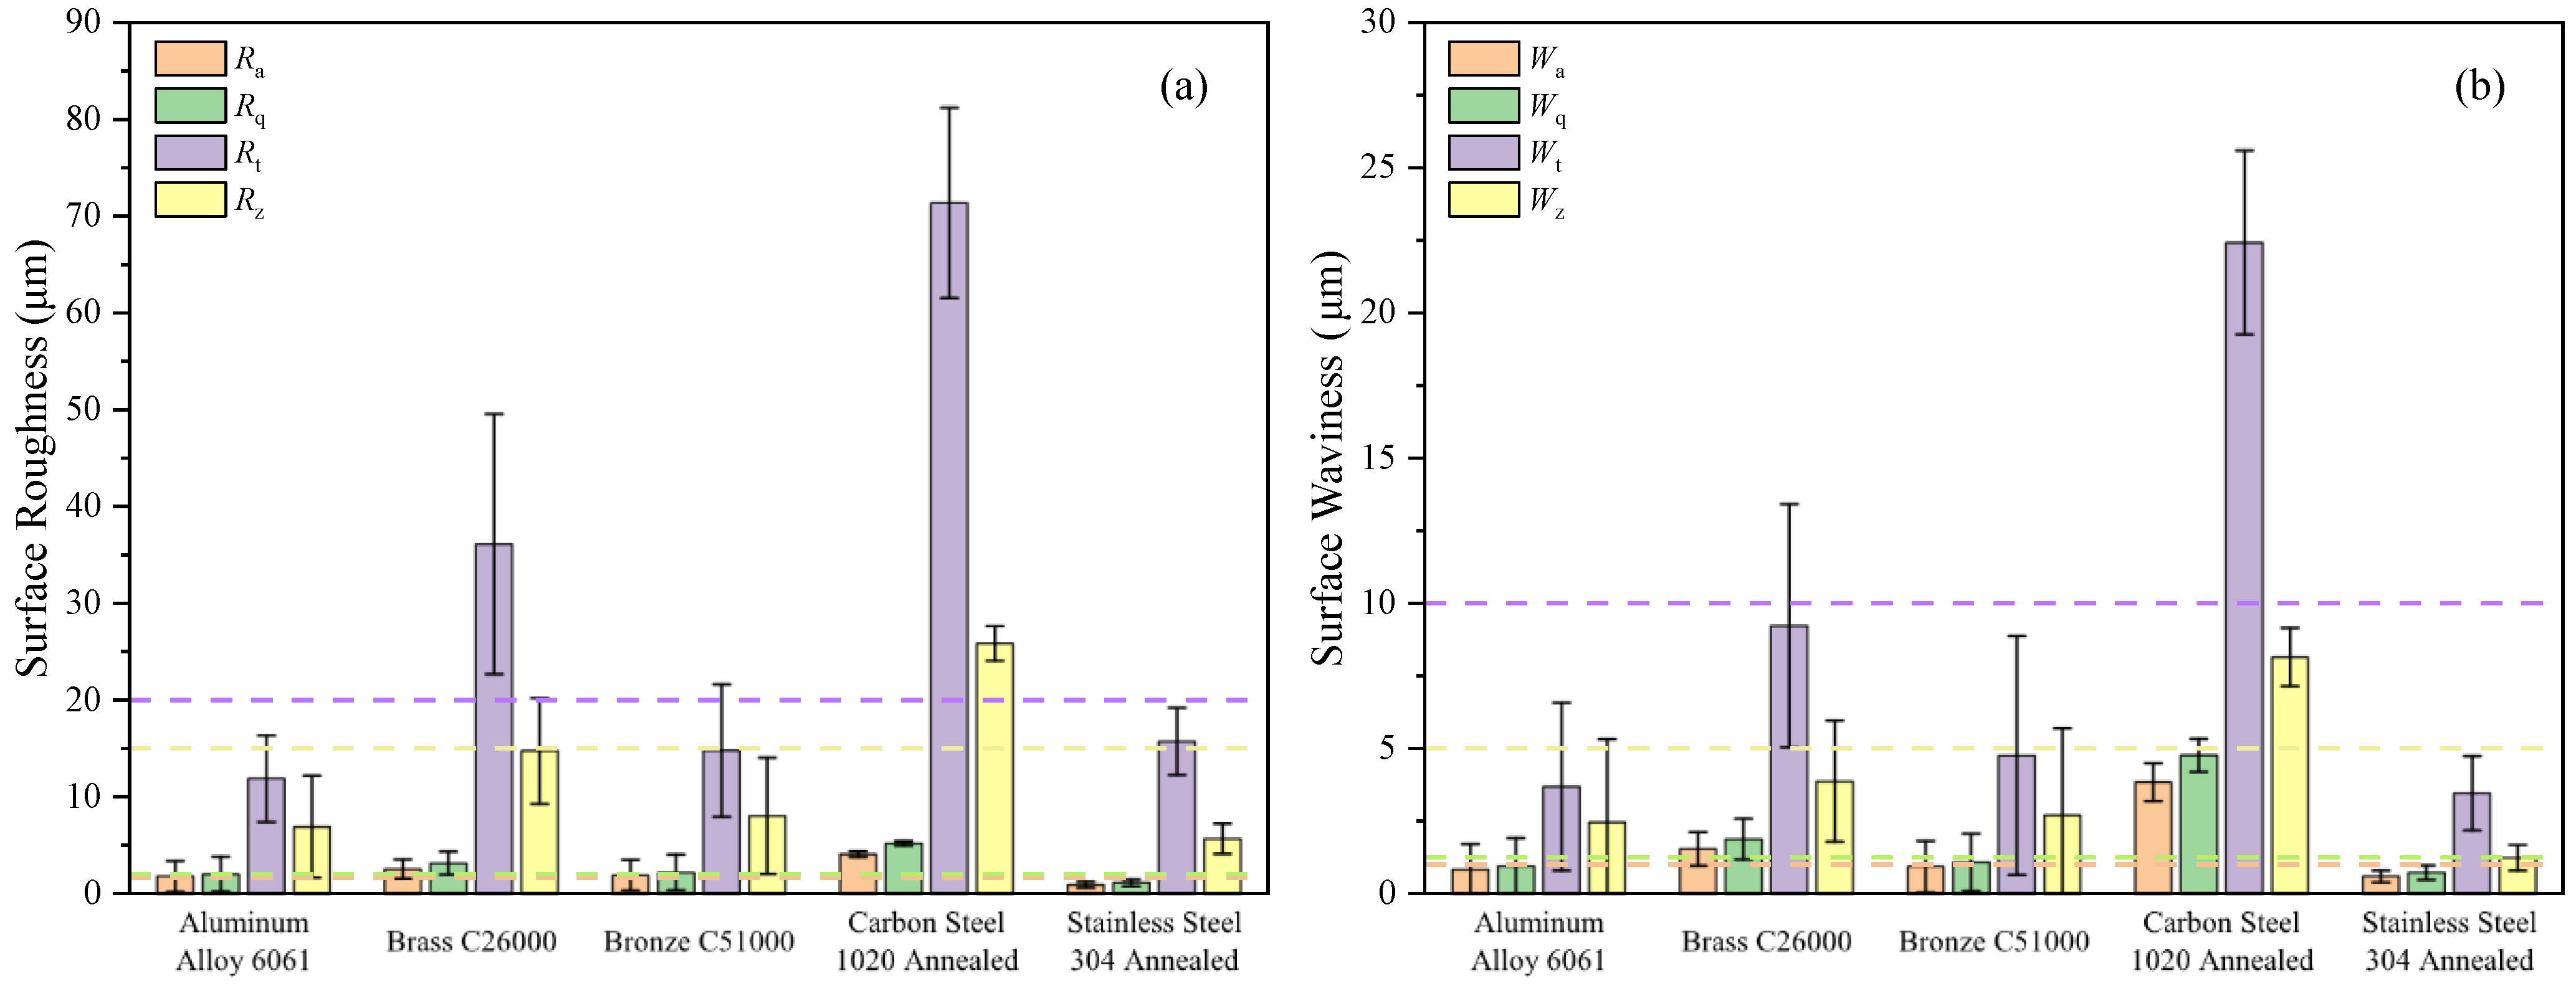
Figure 6 provides a comparative overview of the mean roughness and waviness parameters for all five tested materials.
Ra,
Rq,
Rt, and
Rz are presented in
Figure 6a, while
Wa,
Wq,
Wt, and
Wz are presented in
Figure 6b. Error bars denote one standard deviation, and ISO upper limits for each parameter are indicated as horizontal dashed lines. The figure illustrates how material properties influenced surface quality under dry CNC turning.
Carbon Steel 1020 Annealed demonstrated the highest roughness and waviness values among all materials. Its Rt exceeded 80 µm on average, far above the ISO limit of 20 µm, while Wt reached nearly 25 µm, violating the 10 µm limit by a wide margin. This reflects the material’s susceptibility to thermal accumulation, tool wear, and instability, especially without lubrication. In contrast, Aluminum 6061 and Stainless Steel 304 consistently produced the lowest values across all parameters, with Ra, Rq, Wa, and Wq comfortably below ISO thresholds. Their superior performance is attributed to high thermal conductivity (in the case of aluminum) and stable chip formation via segmentation (in the case of stainless steel), both of which help to minimize surface deformation and promote uniform cutting.
Brass C26000 and Bronze C51000 showed intermediate behavior. Brass exhibited low Ra and Wa values but moderate to high Rt and Wt, suggesting occasional outliers, possibly due to built-up edge or chip adhesion. Bronze maintained moderate averages across all parameters but with notably higher variability, as seen in the extended error bars, indicating a more process-sensitive surface outcome.
Overall, the figure reinforces the findings from probabilistic and ISO conformity analyses: materials with higher thermal conductivity and lower hardness generally yield smoother and more stable surfaces under dry machining. Meanwhile, harder or more thermally resistive materials suffer from elevated amplitude metrics and increased variability. This graphical comparison highlights the importance of material selection in maintaining surface integrity and ensuring compliance with ISO standards in CNC turning operations.
Figure 7 illustrates the comparative behavior of derived surface profile parameters, specifically amplitude ratios and shape parameters, for both roughness (
Figure 7a) and waviness (
Figure 7b) across the five tested materials. The parameters include
Rq/
Ra,
Rt/
Rz,
Rsk,
Rku for surface roughness and
Wq/
Wa,
Wt/
Wz,
Wsk,
Wku for surface waviness. The horizontal dashed lines represent ISO-recommended thresholds: 1.1–1.3 for
Rq/
Ra and
Wq/
Wa, 1.5–3.5 for
Rt/
Rz and
Wt/
Wz, ±0.5 for skewness (
Rsk,
Wsk), and 2.0–4.0 for kurtosis (
Rku,
Wku). Error bars indicate one standard deviation.
Across all materials, Rq/Ra and Wq/Wa ratios remained well within the 1.1–1.3 ISO limits, reflecting proportional and consistent energy distribution in the surface profiles. This suggests that amplitude growth occurred uniformly under varying cutting conditions without the dominance of isolated peaks or valleys. In contrast, Rt/Rz and Wt/Wz ratios exhibited larger variation, especially in Carbon Steel 1020, where the means approached or exceeded 3.5, indicating disproportionately large peaks or deep valleys, likely resulting from tool wear or chip adhesion effects under thermal stress.
Shape metrics revealed further distinctions. Most materials showed Rsk and Wsk values clustered near zero, denoting balanced surface symmetry with no persistent skew toward peaks or valleys. However, a slight negative skew was observed in Wsk for Carbon Steel 1020 and Brass C26000, indicating valley-dominant waviness profiles, possibly caused by tool plowing or crater wear. Kurtosis values (Rku and Wku) showed the highest variability. Stainless Steel 304 and Carbon Steel 1020 occasionally exceeded the ISO kurtosis upper threshold of 4.0, reflecting spiky or defect-prone surface features—a consequence of strain hardening, segmentation instabilities, or intermittent material tearing during chip formation.
The figure underscores that while most materials achieved stable and ISO-compliant amplitude ratios, their susceptibility to profile asymmetry and spikiness, captured by skewness and kurtosis, varied substantially. These shape descriptors are critical for functional applications where surface symmetry and the absence of micro-defects influence sealing, fatigue, or coating adhesion performance. The comparative insights offered here complement the amplitude-based evaluations and emphasize the value of integrating derived metrics in surface integrity assessments.
5. Conclusions
This research presents a probabilistic analysis of how material properties, particularly thermal conductivity and hardness, affect surface integrity during CNC turning. By examining five engineering materials under controlled conditions, significant insights were gained into how material characteristics influence surface quality parameters, including surface roughness (Ra, Rq, Rt, Rz), surface waviness (Wa, Wq, Wt, Wz), and their amplitude, ratio, and shape metrics.
A strong inverse relationship emerged between thermal conductivity and surface roughness/waviness. Aluminum Alloy 6061, which has the highest thermal conductivity (167 W/m·K) and a relatively low hardness (95 HBW), achieved excellent surface integrity, with Ra_avg ≈ 1.7664 µm and Wa_avg ≈ 0.8242 µm. Approximately 85% of its surface parameters remained within industrial tolerance limits, reflecting efficient heat dissipation and stable chip formation. In contrast, Carbon Steel 1020 Annealed, with lower thermal conductivity (51 W/m·K) and higher hardness (170 HBW), exhibited the poorest surface finish, with Ra_avg ≈ 4.0780 µm and Wa_avg ≈ 3.8384 µm, and with Rt and Wt peaking at 87.1855 µm and 26.0369 µm, respectively, indicating severe surface irregularities due to poor thermal regulation and tool wear.
Amplitude ratio parameters (Rq/Ra and Wq/Wa) ranged from 1.17 to 1.28 across the materials, reflecting near-Gaussian surface profiles under most machining conditions. However, extreme value ratios (Rt/Rz and Wt/Wz) exhibited notable variability, with Bronze C51000’s Rt/Rz ratio reaching 4.63, suggesting the occurrence of isolated peaks that could compromise fatigue performance. Shape parameters further revealed surface asymmetry, particularly in Stainless Steel 304, where positive skewness and elevated kurtosis values (Rku_avg ≈ 3.2125; Wku_avg ≈ 2.7264) were observed, indicating a tendency toward stress concentration features.
The findings affirm that material hardness significantly influences peak formation and surface variability. Harder materials (e.g., Carbon Steel 1020, Stainless Steel 304) exhibited broader parameter distributions and more pronounced extreme values, whereas softer materials (e.g., Aluminum Alloy 6061, Brass C26000) yielded more uniform surfaces. Furthermore, high thermal conductivity materials demonstrated superior surface finishes, while low-conductivity, hard materials exhibited surface degradation, particularly under aggressive feed rates.
Lower Ra and Wa values enhance surface precision, fatigue resistance, and lubrication retention in machined components. The developed probabilistic models, validated with high confidence (R2 > 0.95), provide predictive insights into surface behavior and offer valuable guidance for manufacturers aiming to meet stringent quality standards in aerospace, automotive, and biomedical sectors.


