1. Introduction
Machining is one of the most widespread manufacturing processes in terms of volume. Machined components are used in nearly all types of manufactured products. machining is estimated to contribute approximately 5% of the gross domestic product in developed countries. The machine tool industry has evolved over time, with the goal of enhancing the competitiveness of machines by reducing costs and improving the quality of manufactured components. Process monitoring and automation have been key factors in achieving this objective.
In machining, specific dimensional (tolerances) and surface (roughness, material damage, residual stresses) requirements must be met, while also ensuring competitive costs. Over the past years, the demand for these requirements has steadily increased, making the dynamic stability of the process a key factor in achieving the desired productivity levels. Despite significant advancements in machining process knowledge over the last decades, selecting optimal cutting conditions on the first attempt remains a challenge in many cases. This is due to various factors, such as the invalidity of the initial assumptions used to determine cutting conditions, the lack of consideration of machine dynamics, and the fact that optimal conditions can change during machining.
In recent years, the advancement of numerical control technology has significantly improved the efficient automation of machining processes. However, one of the main challenges remains the vibrations caused by chatter. Chatter is a key limiting factor in achieving maximum material removal rates and optimal surface quality due to its time-varying nature and the complex configurations of machining systems.
These vibrations occur due to the interaction between the machining process and the machine tool structure. In 1907, Taylor was the first to identify chatter as a limitation to machining productivity [
1]. Later, chatter was discovered to be caused by instability in metal cutting processes. The modulation of chip thickness due to vibrations was observed to dynamically affect cutting forces, which in turn amplifies the vibrations, leading to a phenomenon known as regenerative chatter.
In machining processes, there are three main types of chatter: tool chatter, workpiece chatter, and machine chatter. Tool chatter has been most extensively studied, as the tool is typically the least rigid component in the system. Chatter vibrations are also classified into primary and secondary chatter. Primary chatter originates from friction between the tool and the workpiece, thermo-mechanical effects, or mode coupling. Secondary chatter occurs due to the regeneration of surface waves on the workpiece [
2].
Regenerative chatter occurs around the frequency of the dominant mode [
3]. The excitation of this mode induces a relative motion between the machine tool and the workpiece. The time-dependent instantaneous chip thickness, h(t), is determined by the following equation:
A greater positive vibration during the previous revolution, y(t − τ), where τ is the time for one rotation, has been observed to result in a greater chip thickness (i.e., less material is removed, making the current chip thicker). Conversely, a greater current vibration, y(t), produces a thinner chip.
Figure 1 illustrates the regeneration mechanism between a flexible tool and a rigid workpiece in orthogonal cutting. The relative phase shift between the surface waviness of successive passes determines the variation in cutting force. Depending on factors such as mechanical system stiffness, damping, and cutting stiffness, this phase shift is a key variable in determining whether the operation remains stable or leads to chatter. The figure presents two possible scenarios:
When h1(t) = h2(t), the wavy surfaces from two consecutive revolutions are in phase. As a result, even if vibrations occur during material removal, the variation in chip thickness (vertical distance between the two curves) is negligible, leading to no significant force fluctuation. This enables a stable cutting process with larger chip widths. Given that the tool naturally tends to vibrate at its natural frequency, it is intuitive to assume that when the spindle rotation frequency matches the tool’s natural frequency, this favourable condition is achieved.
When h1(t) ≠ h2(t), the phase relationship is less favourable, causing a significant variation in chip thickness. This results in an unstable cutting process, where chatter occurs at smaller chip widths compared to the previous case due to fluctuating cutting forces and the resulting tool deflections [
4].
Although chatter research has been ongoing for many years, several aspects still require further investigation. Early studies focused on predicting stability using dynamic models, which are primarily offline approaches [
3,
5]. With advancements in sensor technology, real-time chatter detection has been extensively studied. The most commonly used sensors for experimental data acquisition include accelerometers [
6,
7,
8], dynamometers [
9,
10,
11], microphones [
12,
13], and internal signals such as current feedback [
13,
14]. Once acquired, these signals are processed using various theoretical methods based on time-domain, frequency-domain, or time-frequency analysis.
Recent research continues to explore advanced methods for chatter detection, particularly emphasizing the integration of multi-sensor information and novel damping mechanisms. For instance, there are relevant studies [
15,
16,
17] investigating the vertical vibration characteristics of rolling mills using fluid damper absorption. Similarly, refs. [
18,
19,
20] propose a multitype chatter detection framework using multichannel internal and external signals in robotic milling. Their approach fuses data from accelerometers, microphones, and internal drive signals to improve chatter recognition performance under complex machining conditions. While these approaches provide high accuracy, they often rely on high-end hardware setups and computational resources, which can limit their deployment in embedded industrial controllers.
The deployment of chatter detection systems in industrial settings is hindered by several key limitations. First, the use of dynamometers and microphones poses practical challenges due to their mounting constraints and inherent fragility. Dynamometers, in particular, are often cost-prohibitive, as highlighted by [
21], and microphones are highly susceptible to ambient noise, which is prevalent in industrial environments and can significantly degrade measurement reliability. Second, the computational complexity associated with conventional chatter detection algorithms—especially those involving spectral and time-frequency analyses—exceeds the processing capabilities typically available in computer numerical control (CNC) systems. These constraints severely limit the feasibility of real-time chatter detection on standard industrial hardware.
Building on this insight, the present work proposes a novel detection approach with a low computational cost and valid for hard real-time execution. The solution was tested and validated on a commercial FAGOR CNC system.
2. Methodology
2.1. Theoretical Background
In many physical systems, certain phenomena manifest when excited at high frequencies beyond the Nyquist limit of the available sampling system. Traditional signal processing dictates that such frequencies are lost due to aliasing unless the system is designed with a sufficiently high sampling rate. However, aliasing itself introduces predictable spectral components into the sampled signal, which can be leveraged to infer the presence of these high-frequency excitations. This work establishes the theoretical basis for using sub-Nyquist energy monitoring as an indicator of high-frequency phenomena without requiring precise knowledge of the excitation frequency.
According to the Nyquist-Shannon sampling theorem, a signal x(t) band limited to f
B can be perfectly reconstructed if sampled at a rate of f
s ≥ 2·f
B. When x(t) contains frequency components beyond f
s/2, these components are aliased into the first Nyquist zone due to spectral folding. Specifically, a sinusoidal component at f
H > f
s/2 appears at an alias frequency of
where k is an integer that determines the folding order.
Aliasing results in a redistribution of energy into the sampled frequency band, potentially increasing the observed power in specific spectral regions. Several studies [
22,
23] confirm that aliased spectral components retain a power relationship with their original frequencies, albeit distorted by system transfer characteristics and nonlinearities.
Rather than seeking to reconstruct the original high-frequency signal, the proposed solution monitors the total signal energy within the sampled band as an indicator of high-frequency excitation. The underlying justification is that the aliasing process preserves an energy signature of the original high-frequency phenomenon.
Let the power spectral density (PSD) of the original signal be S
x(f) and assume a broadband excitation at f
H. Due to aliasing, the observed PSD in the sampled domain, S
s(f), will include contributions from the aliased components:
where H
k(f) represents the system response to aliased components. Empirical studies [
23,
24] have demonstrated that significant energy increases can be observed in the sampled domain even when the excitation occurs at frequencies beyond Nyquist.
A key advantage of this detection method is that it enables real-time monitoring of high-frequency phenomena without the need for computationally expensive frequency-domain transformations, such as the Fast Fourier Transform (FFT). Many embedded systems, particularly those in real-time applications, operate under stringent computational constraints due to limited processing power, memory, and energy availability.
In real-time control and monitoring applications—such as industrial CNC systems—FFT-based analysis can be prohibitive due to its O(N·logN) complexity [
25]. Additionally, computing a full spectral decomposition introduces unacceptable latency in time-sensitive systems, where millisecond-level responsiveness is required.
Instead of frequency-domain processing, this method relies on energy computation in the time domain using filtering techniques that are inherently more efficient. Simple low-pass or band-pass filters can be implemented efficiently in real-time embedded processors, allowing continuous monitoring with minimal computational overhead.
2.2. Proposed Solution
The primary objective of this study is to develop a computationally efficient method for detecting chatter in real-time embedded systems, where computational resources and power consumption are constrained. The novelty of this approach lies in utilizing energy-based detection in the time domain rather than computationally expensive frequency-domain transformations.
A review of the state of the art reveals that, regardless of the type of sensor used (accelerometer, microphone, or both), chatter analysis must incorporate frequency spectrum analysis. This research focuses on detecting tool chatter, where knowing the tool’s resonance frequency in advance would theoretically be highly useful in developing an algorithm capable of distinguishing between forced frequencies associated with tooth entry into the material (or its harmonics) and chatter frequencies. However, for the case under study, measuring or calculating this resonance frequency was ruled out, as it is impractical for machine operators to determine it in a workshop setting. Additionally, laboratory-grade equipment is both costly and difficult to integrate into an industrial machining environment.
While resonance frequency knowledge could be beneficial in mass production systems—where the same set of tools and workpieces are used repeatedly—such environments are typically highly controlled. In these cases, chatter can often be mitigated by optimizing machining conditions or selecting tools that inherently minimize its occurrence. However, modern machining environments increasingly involve small-batch production or even single-part manufacturing, where machining conditions vary significantly. This variability makes a flexible, real-time chatter detection system essential for ensuring process stability across different machining scenarios.
The reference technique for converting between the time and frequency domains is the Discrete Fourier Transform (DFT), with the FFT being particularly relevant due to its significant reduction in computational complexity. In the initial phase of this research, several studies on the applicability of FFT were reviewed, and the investigation was further supported by experimental tests on a machine equipped with a microphone and instrumentation-grade accelerometers in a laboratory environment. As a first approach, FFT was employed to analyse the test results due to its high-frequency resolution and evenly spaced frequency bins, which is particularly useful when the range of interest is unknown beforehand.
However, despite these advantages, FFT was ultimately ruled out as part of the final solution for two key reasons:
High computational cost, which makes real-time execution challenging;
Incompatibility with continuous data streams in its original form, limiting its effectiveness in real-time monitoring applications.
Given these limitations, alternative methods better suited for real-time chatter detection in industrial environments were explored. This hypothesis provided the foundation for developing a real-time detection approach, ensuring a balance between computational efficiency and robustness in identifying chatter under varying machining conditions.
2.3. Research Challenges and Novelties
Detecting high-frequency phenomena in real-time embedded systems poses several fundamental challenges that directly motivate the research presented in this study. One of the most significant obstacles is the computational complexity associated with conventional signal processing techniques. Standard methods such as the FFT demand a high level of processing, relying on large window sizes and requiring floating-point operations, which are either unavailable or highly inefficient in typical microcontroller-based systems deployed in industrial environments.
Furthermore, real-time responsiveness is a critical requirement in CNC machining, where the system must react with very low latency to dynamic events such as the onset of chatter. Batch-processing techniques or those that require significant buffering introduce unacceptable delays and are incompatible with the tight control loops and deterministic timing required by CNC controllers. Ensuring that the chatter detection mechanism operates within these strict timing constraints, without sacrificing reliability, represents a central design challenge that shaped the architectural decisions in this work.
These constraints collectively motivate the need for a novel approach to chatter detection—one that abandons traditional frequency-domain strategies in favour of lightweight, real-time, time-domain methods. The primary goal of this research is to propose and validate such a method, demonstrating that it is possible to maintain effective detection capabilities while adhering to the stringent limitations imposed by embedded industrial systems.
The following
Table 1 summarizes key works in the field and highlights their limitations, which our approach aims to address.
These recent works underscore the value of high-fidelity signal acquisition and analysis for chatter detection. However, they also reveal a gap that the present study aims to address: the need for low-cost, real-time detection solutions that can be deployed on resource-constrained embedded platforms without relying on detailed dynamic models or extensive sensor arrays. Therefore, this research directly addresses these limitations by
Proposing a time-domain energy-based method to detect high-frequency phenomena without frequency-domain transformations;
Developing an approach that is computationally lightweight, avoiding FFT computations and significantly reducing processing overhead;
Providing a real-time detection mechanism suitable for embedded applications where computational resources are constrained;
Demonstrating how simple filtering techniques can be used to extract meaningful signal energy information in sub-Nyquist bands, making the approach highly practical for real-world implementations;
Eliminating the need for multi-sensor fusion by relying on a single signal source.
This innovative approach opens new possibilities for monitoring high-frequency phenomena in resource-constrained environments, where conventional spectral analysis would be impractical. By eliminating the need for high sampling rates and complex signal transformations, the proposed method provides a scalable, low-power solution that aligns with the stringent requirements of embedded systems.
2.4. Algorithm Development
The solution proposed in this study involves processing the signal from each available sensor (axial signals from the accelerometer and microphone) through a set of filters to determine the presence or absence of signal power, excluding frequency components related to the machining process itself, particularly those caused by the tool’s teeth entering the material.
This approach is both adaptable and scalable, as the same processing method is applied to each signal. This ensures that it can be easily adapted to different scenarios depending on the number of available signals and whether they originate from accelerometers and/or microphone sensors.
Figure 2 illustrates the block diagram of the developed chatter detector.
In the first stage of the process, a low-pass filter is applied to eliminate frequencies above the maximum chatter frequency range of the tool during typical machining operations. This ensures that only relevant frequencies are processed.
After the low-pass filtering stage, a process is carried out to remove frequency components related to the forced frequency of the machining process. To achieve this, a technique based on resampling the signal at the forced frequency and applying an Infinite Impulse Response (IIR) notch comb filter is used.
An IIR notch comb filter is a type of filter designed to selectively eliminate a specific frequency while preserving all other frequencies in the original signal. This filter uses a sampling structure at regular intervals and features a series of “teeth” that align with the frequency to be removed. The “teeth” of the comb filter have the property of selectively attenuating the signal at the target frequency while maintaining the signal at all other frequencies.
Once the frequency component related to the forced frequency has been removed, a finite set of N cascaded IIR biquad band-pass filters is applied to process the signal. The choice of IIR biquad filters is due to their low computational cost for filtering the signal, as they are second-order filters (two poles and two zeros in their transfer function).
To ensure that the gain of the filter set remains approximately constant across the entire working spectrum, it is necessary to properly calculate the defining parameters of the N filters, including their passband frequency and quality factor or bandwidth (4)–(6). This approach ensures that the input signal power is uniformly reflected across the set of output signals from each filter.
where f
c is the central frequency of the band-pass filter and f
s is the sampling frequency. The sampling frequency, f
s, used in the present test was 1 kHz.
where Q is the quality factor of the filter.
where a
i and b
i are the denominator and numerator coefficients of the IIR filter.
Since the required number of filters, N, is relatively low, the passband width of the frequency filters will be wider than the chatter frequency width. Consequently, the input chatter signal power will be reflected in one or, at most, two output signals (in cases where it overlaps between two passband frequencies). To obtain a proportional measure of the power of each individual signal, the Root Mean Square (RMS) function is applied. This allows for an estimation of the spectrogram discretized into as many frequency bands as there are N parallel filters applied. RMS is a statistical measure used to quantify the amplitude of a signal and is calculated as the square root of the mean of the squared values of the signal over time (7). In this way, the RMS value of each signal represents its average energy over time, which directly correlates with the signal’s power. By applying the RMS function to each individual signal, a measure of its power is obtained, which is then used to construct the spectrogram discretized into N frequency bands.
Subsequently, the individual signals are evaluated using a maximization function. This function is employed to identify the presence of a frequency band with significantly higher power compared to the rest of the frequency bands. In this context, the maximization function involves dividing the RMS value of the highest-power band of each signal by the RMS value of the lowest-power band (8). If the two highest-power bands are adjacent in frequency, the semi-sum of both bands is used for the division (9). This process yields a value that represents the power ratio between the maximum-power band and the minimum-power band for each signal. This value serves as an indicator of the degree of chatter presence in the signal and will be utilized in the subsequent stage to determine whether chatter is present or not.
Since the phenomenon of tool chatter is a relatively stable process over time, an averaging process is applied to the maximization signal obtained in the previous stage. This step is designed to filter out potential noise from the electronic components of the sensors and to eliminate unwanted instantaneous spurious components.
In the final stage of the chatter detector, the signals from all sensors are analysed collectively to determine the presence or absence of chatter. This approach is necessary because the chatter signal’s power can vary across different sensor signals depending on the type of machining being performed. By combining these signals, a more accurate and robust assessment of the machining process state is achieved, enabling more reliable detection of chatter. Additionally, integrating signals from multiple sensors can provide supplementary information about the process state, allowing for more informed decision making.
Figure 3 illustrates an example of filtering an accelerometer signal through the N band-pass filters. The figure shows that the power levels of the individual output signals vary, with the highest power observed in the 175 Hz band (highlighted in red in
Figure 3). The presence of a significantly higher power signal in this single band compared to others results in a relatively high amplitude in the output of the maximization function, indicating the presence of chatter.
3. Results
3.1. Experiment Design
The experimental tests to validate the proposed method were conducted during a face milling operation on a solid block of EN AW−6082 T651 aluminium alloy. The tool used, shown in
Figure 4, is a slender end mill with a diameter of 40 mm, four teeth, and a tip radius of 6 mm. The tool’s natural frequency is 760 Hz, its stiffness is 5400 N/mm, and its damping ratio is 2.5%.
The tool has the following mechanical characteristics:
The signals analyzed for chatter detection were as follows:
Microphone B&K 4189-A-021;
Accelerometer 1 triaxial PCB356A16;
Accelerometer 2 biaxial QG40-KAXY-16,0E-AI-CM-UL;
Internal CNC signals.
As shown in
Figure 4, the setup consists of an aluminium block mounted on a vice on the milling machine table, the tool and accelerometers mounted on the spindle, and the ambient microphone.
The design of the experiments takes into account the stability lobe diagram, shown in
Figure 5, to select the cutting conditions (spindle speed and cutting depth) that result in both chatter-free (blue dots) and chatter-prone scenarios (red dots). For the latter, the level of chatter can be controlled to ensure precise evaluation under different conditions.
The list of tests performed is presented in
Table 2. The feed per tooth of the milling cutter (0.1 mm) and the width of cut (40 mm) were kept constant across all tests. The spindle speed and cutting depth were varied to produce machining conditions with chatter as well as chatter-free conditions, enabling a comprehensive evaluation of the method under both scenarios:
3.2. Algorithm Validation
As described in the experimental design section, the sensor signals (accelerometers and microphone) were captured and stored at a high sampling frequency for each test conducted in the laboratory. These signals were later used for two purposes: to perform a frequency analysis over time (observing the temporal evolution of signal power across different frequency components) and as input to the chatter detector itself to simulate real-time online operation.
For each test, the results (presence or absence of chatter) were evaluated using several assessment criteria:
Stability Lobe Diagram (SLD): This diagram determines the theoretical presence or absence of chatter for given machining conditions (spindle speed, number of tool teeth, and radial and axial cutting depths);
Surface Finish: After completing the machining process for each test, the surface finish was inspected. A poor surface finish is an indicator of chatter presence;
Frequency Analysis: The sensor signals captured during each test were recorded at high frequency, enabling a detailed analysis. For each test, a series of FFTs were performed over time by dividing the input signal into multiple segments, each 100 ms long, with 50% overlap between them. An FFT was applied to each segment, resulting in a temporal evolution of power across different frequency components, with a spectral resolution of 10 Hz. By isolating the relative amplitude of the forced frequency from other frequencies, an alternative indicator of chatter presence over time was obtained. This indicator was compared with the output of the chatter detector for validation purposes.
Table 3 presents the conditions for each test along with whether chatter occurred and how the detector performed under those conditions.
Figure 6 illustrates two specific tests, with and without chatter. For simplicity, only the data from the X-axis accelerometer are shown. According to the implemented evaluation criteria, the test on the left (102) represents a chatter-free scenario, while the test on the right (6) corresponds to a case with chatter. In graph (a) for both test 102 and test 6, the input signal captured by the X-axis accelerometer is displayed. The red points in test 6 indicate the chatter detected by the algorithm.
The (b) graphs provide different types of information. On the one hand, they show the temporal evolution of multiple FFTs performed for 100 ms time windows. Specifically, they present the amplitude values of the FFT at the forced frequency (FFT FF) and the maximum amplitude value of the FFT (FFT MAX). On the other hand, they provide information about the implemented chatter detector. In this case, they display the average signal obtained after applying all filtering and signal processing stages. Finally, a digital signal is plotted to indicate whether chatter is present or absent.
The evolution of the FFT signal over time reflects the distribution of signal power during the test. When the amplitude of the forced frequency approaches the value of FFT MAX, it indicates that most of the signal’s power is due to the energy required by the tool’s cutting edges to remove material. Conversely, if the FFT amplitude at the forced frequency is significantly lower than FFT MAX, it suggests the presence of chatter in the signal.
The key indicator is the ratio between the power at the forced frequency (FFT FF) and the maximum power across the spectrum (FFT MAX). In chatter-free conditions, such as in test 102, FFT FF closely matches FFT MAX, indicating that the dominant energy is concentrated at the tool’s forced frequency. This concentration suggests stable cutting, with no significant excitation of other frequencies. In contrast, in test 6, FFT FF is noticeably lower than FFT MAX, revealing the presence of additional frequency components with significant energy. This dispersion of energy across multiple frequencies is characteristic of chatter.
The chatter detector signal further supports this distinction. It operates on a normalized scale, where low values reflect energy concentration at the forced frequency and high values indicate energy spread across the spectrum. In test 102, the detector output remains below an amplitude of 2, consistent with a stable regime. In test 6, the amplitude increases to approximately 5, reflecting a dominant non-forced frequency component. Consequently, the algorithm detects chatter in test 6 and confirms its absence in test 102.
3.3. Machine Testing
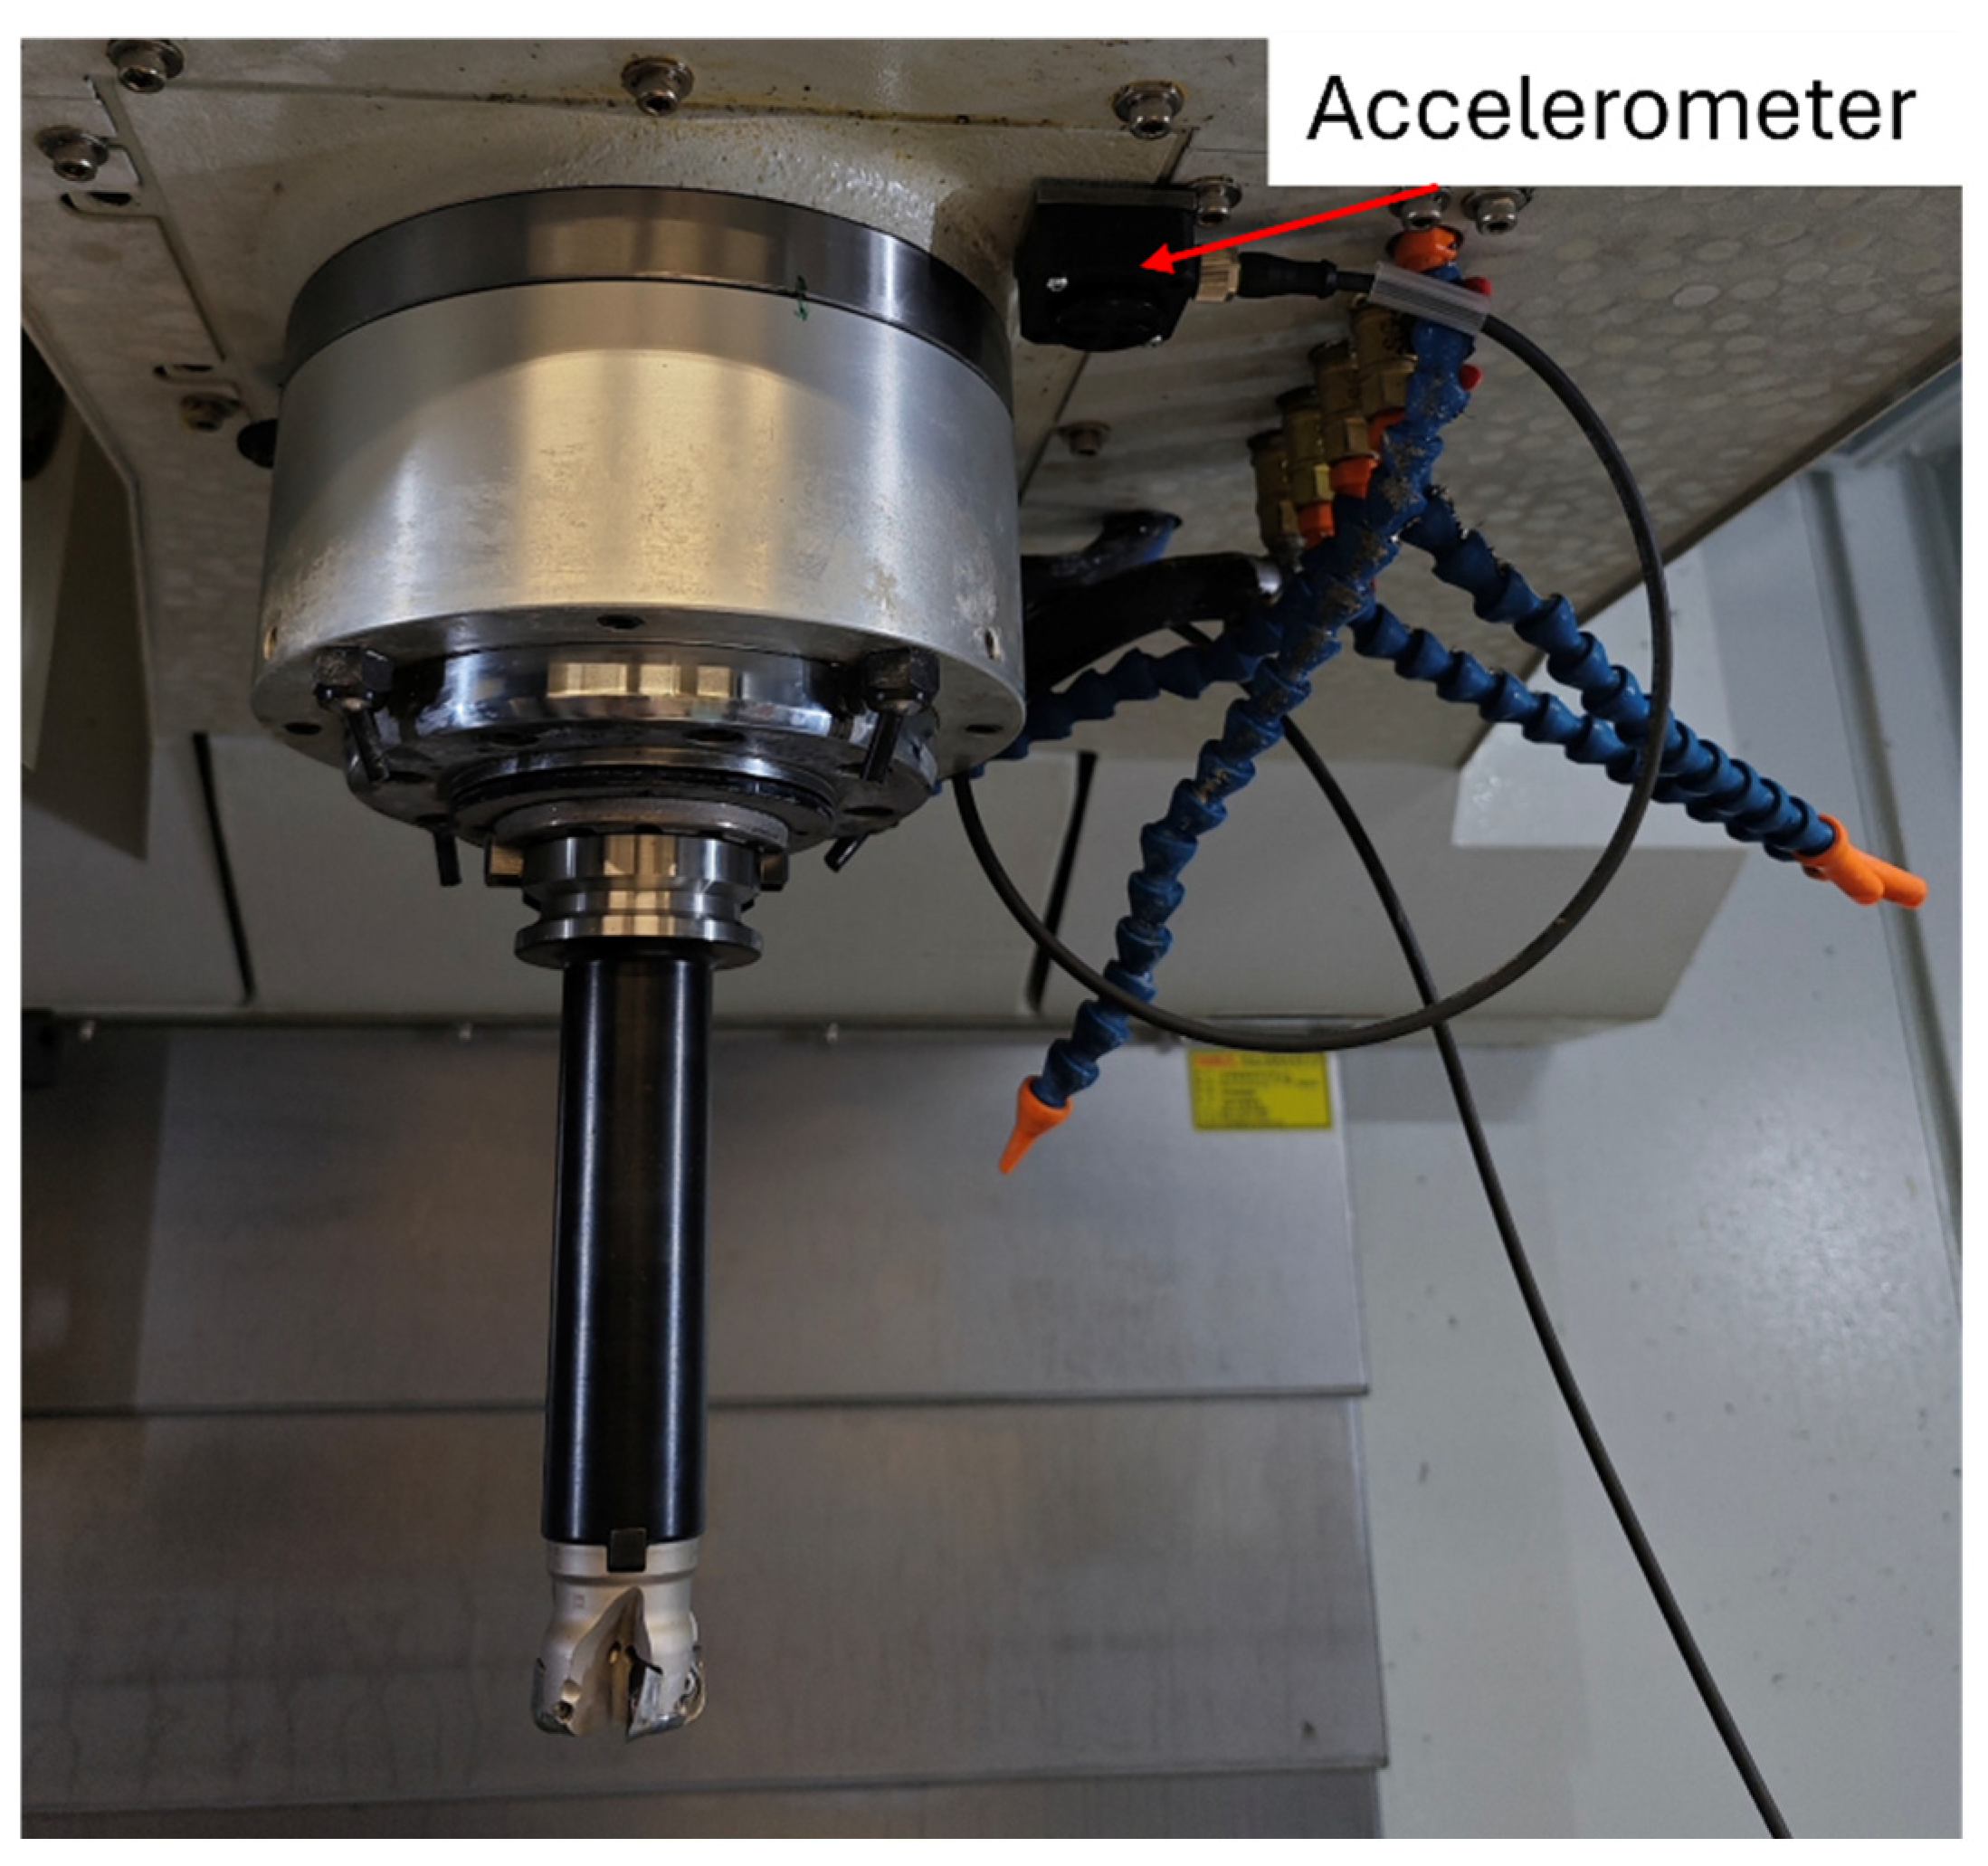
To validate the effectiveness of the developed chatter detector, tests were conducted on a three-axis milling machine. Various experiments were performed to evaluate the performance of the algorithm. Initially, a biaxial accelerometer was mounted as close as possible to the tool, as illustrated in
Figure 7.
Once the chatter detection algorithm was implemented on the CNC machine, various tests were conducted to evaluate its performance.
Table 4 displays three of the configurations used during testing, along with a column indicating whether chatter was present or not. For each test, three passes were performed: the first in the central part of the workpiece and the other two at its corners.
Figure 8 shows the most representative signals from the chatter detector for the first test, as displayed on the CNC’s internal oscilloscope. In this test, chatter is present during the first pass. The signals include the accelerometer readings (red and yellow traces), the maximized signal for one axis (pink trace), and the final output of the algorithm (blue trace).
Zooming in on
Figure 8 to gain greater accuracy produces
Figure 9, which shows how the blue signal, which represents the algorithm’s response, rises from 0 to 1 during the first pass, indicating the presence of chatter. This occurs when the accelerometer’s vibration increases, confirming that chatter is indeed taking place. Once the first pass is completed, the signal drops back to 0, indicating that chatter is no longer present. During the second and third passes, the signal does not rise to 1 at any point, even though vibrations are detected by the accelerometer.
Figure 10 shows the workpiece where the cuts were performed. Upon closer inspection, it is evident that the central part of the piece exhibits a poor surface finish, with visible tool marks and noticeable roughness to the touch. This is due to the vibrations caused by chatter. In contrast, the corners of the workpiece, where chatter did not occur, display a smooth and well-finished surface.
Finally,
Figure 11 displays the signals from the chatter detector for test number 3. It can be observed that, although the accelerometer signal shows significant power, this vibration is primarily attributed to the forced frequency. As a result, the detector does not classify it as chatter.
4. Conclusions
This study successfully developed and validated a real-time tool-chatter detection system optimized for industrial machining environments. The proposed algorithm, based on parallel bandpass filtering and low-cost accelerometer signals, demonstrated its effectiveness in detecting chatter without requiring prior knowledge of tool-specific dynamic characteristics. This flexibility, combined with its ability to detect chatter using only the number of teeth on the active tool, makes it a practical and broadly applicable solution for diverse machining scenarios.
The algorithm meets the stringent constraints of real-time embedded systems, including low latency, high determinism, and minimal computational cost, ensuring seamless integration into CNC controllers. Unlike frequency-domain approaches, which typically require high-performance computing resources, this method operates entirely in the time domain, allowing for an efficient implementation, even in embedded hardware. Experimental validation confirmed the robustness of the system under various cutting conditions, aligning well with theoretical stability predictions and surface quality observations. The results further demonstrate that, even when the Nyquist criterion is violated, the algorithm reliably detects chatter through aliasing effects, which is particularly relevant for implementations in resource-constrained environments.
A key limitation of the current approach is that it prioritizes computational efficiency over precise chatter frequency estimation. While this is suitable for early detection applications, it may not be directly applicable in control strategies requiring precise frequency information for corrective actions. On the other hand, the assumption of radial symmetry in stability lobes simplifies implementation but does not fully capture the complexity of real-world machining dynamics. Future research will focus on refining the algorithm’s robustness in challenging scenarios, such as distinguishing chatter from forced vibrations near system resonances or in cases where multiple frequency components contribute to the excitation.
Further advancements could involve integrating machine learning techniques to enhance detection accuracy by allowing the system to dynamically adapt to evolving machining conditions. Moreover, expanding the methodology to account for more complex tool dynamics—such as frequency modulations due to tooth engagement variations—could further improve its reliability across a wider range of machining operations.


