Abstract
Misalignment faults in drive systems occur when the motor and load are not properly aligned, leading to deviations in the centerlines of the coupled shafts. These faults can cause significant damage to bearings, shafts, and couplings, making early detection essential. Traditional diagnostic techniques rely on vibration monitoring, which provides insights into both mechanical and electromagnetic fault signatures. However, its main drawback is the need for external sensors, which may not be feasible in certain applications. Alternatively, motor current signature analysis (MCSA) has proven effective in detecting faults without requiring additional sensors. This study investigates misalignment faults in synchronous reluctance motors (SynRMs) by analyzing both vibration and current signals under different load conditions and operating speeds. Fast Fourier transform (FFT) is applied to extract characteristic frequency components linked to misalignment. Experimental results reveal that the amplitudes of rotational frequency harmonics (, , and ) increase in the presence of misalignment, with exhibiting the most stable progression. Additionally, acceleration-based vibration analysis proves to be a more reliable diagnostic tool compared to velocity measurements. These findings highlight the potential of combining current and vibration analysis to enhance misalignment detection in SynRMs, improving predictive maintenance strategies in industrial applications.
1. Introduction
In recent years, interest in synchronous reluctance machines (SynRMs) has grown due to their advantages. Although introduced in the early 1900s [1], they have only recently gained widespread adoption. SynRMs operate on magnetic reluctance variations, enabling efficient electromechanical energy conversion without rotor windings or permanent magnets. Compared to other machine topologies, such as induction motors (IMs) or permanent magnet motors (PMMs), they offer lower rotor losses, higher efficiency, and reduced manufacturing costs [2]. In particular, stricter energy regulations and rare-earth magnet price fluctuations have further increased interest in SynRMs as a viable replacement for permanent magnet synchronous machines (PMSMs) [3]. With their efficiency, reliability, and affordability, SynRMs are emerging as a key technology for industrial applications. Despite their advantages, synchronous reluctance machines (SynRMs) encounter several challenges. From a design perspective, issues such as high torque ripple, low power factor, noise, and vibration require further improvements to optimize performance. In [4], the authors proposed a method for torque ripple reduction using harmonic superposition, achieving a 13.3% reduction in torque ripple in permanent magnet-assisted synchronous reluctance machines (PMa-SynRMs). Additionally, some authors have explored the possibility of improving their efficiency by proposing a novel winding structure, achieving an efficiency increase of up to 2.35% compared to the benchmark motor [5]. While SynRMs are generally robust and efficient, the need to enhance their design remains crucial for their widespread adoption. Moreover, despite their durability, SynRMs are not immune to wear and degradation of their components. Given their increasing use in critical applications, such as transportation, there is a growing need for research focused on predictive maintenance. Currently, research in this area is limited, and it is essential to develop reliable methods for diagnosing faults and assessing the health of SynRMs to minimize downtime and ensure continuous operation. Rotating electric machines are designed with both mechanical and electrical symmetry to optimize performance, efficiency, and reduce vibrations. When operating under faulty conditions, this symmetry is disrupted, leading to changes in the magnitude or shape of various machine signals, such as electromotive force, line currents, vibration profiles, and temperature. Many of these faults produce distinct signal patterns, which can be used for fault diagnosis.
The most widely used method to detect failures in SynRMs is the analysis of the line current signal. In [6], the authors studied line current harmonics to detect inter-turn short-circuit (ITSC) faults in PMa-SynRMs. The difference between the first and fifth harmonics of the line current can be used to detect the presence of faults in these machines. The current spectrum is also used in [7] to detect ITSC faults in SynRMs. The combination of line current analysis and the calculation of the zero-sequence current component (ZSCC) enables the diagnosis of an ITSC fault even in its incipient stage. Other studies explore variations of current analysis to detect ITSC faults in SynRMs. In [8], the authors analyze the dq-axis current using a Luenberger observer, achieving promising results. Moreover, in the identification of this type of fault, current is not the only parameter used. Zero-sequence voltage components (ZSVCs) are calculated to quickly identify incipient faults [9]. The results have been validated through experimental tests, and the proposed technique is even applicable for detecting faults in transient regimes. Other recent works have studied current behavior by introducing sequence component models for steady-state analysis to detect incipient ITSC [10]. However, ITSC is not the only fault studied in SynRMs; eccentricity is also a widely researched issue. In [11,12], various fault-indicative frequency components for static, dynamic, and mixed eccentricity have been identified using FFT-based analysis of the line current. It has been shown that dynamic eccentricity increases the amplitude of the fifth and seventh line current harmonics, while mixed eccentricity generates sideband harmonics around the fundamental frequency and higher-order odd harmonics. Moreover, ZSVCs are used alongside stator current harmonics to detect these faults in PMa-SynRMs [13]. Asymmetries in the stator have also been studied by analyzing the line current, where the authors observe an increase in the third harmonic of the current progressively as the stator asymmetry increases [14]. Nevertheless, this is an initial study, and there could be other causes for the increase in that harmonic. Although not used as a direct diagnostic signal, line current has been employed as a complementary tool to detect demagnetization in PMa-SynRMs by exciting it with harmonics [15]. ITSC faults and eccentricity are among the most extensively studied faults in SynRMs; however, faults such as misalignment have received significantly less attention in this type of machine.
Regarding misalignment faults, they are among the most critical mechanical issues, as they can cause significant damage to the entire machine, including the bearings, stator, rotor, and winding. Early detection is crucial to prevent major economic losses and ensure that the machine operates reliably [16]. Previous studies have investigated motor speed as a diagnostic signal to detect misalignment in PMSM. In [17,18], FFT analysis of the speed signal was utilized to identify misalignment, revealing an increase in the amplitudes of the and components. The component was particularly highlighted as a fault indicator. Notably, these components are also associated with eccentricity in PMSMs [19]. Furthermore, some research has explored the use of stray flux signals as a diagnostic tool for detecting misalignment in induction motors, yielding promising results [20]. However, this approach has so far been applied exclusively to induction motors. In this context, it is important to highlight that vibration monitoring remains the most widely used method for diagnosing faults in rotating machinery, including electrical machines. This technique has proven effective for detecting mechanical issues such as load unbalance, misalignment, and other defects in induction motors [21]. Moreover, vibration monitoring in electrical machines provides valuable information for identifying both mechanical and electromagnetic fault signatures [22]. Some studies also use vibration signals combined with transfer learning methods to detect misalignment. In [23], the authors utilize vibration signals, which are transformed into the time-frequency domain using the wavelet transform technique to train a transfer learning network. However, this analysis was conducted on an induction motor. One of the main limitations of vibration monitoring is the need for external sensors, typically accelerometers, which must be attached to accessible, non-rotating parts. In certain cases, such as submersible motor-pump units, installing accelerometers can be highly challenging, making vibration monitoring difficult to implement.
This article aims to provide the detailed analysis of misalignment in SynRM using the current and vibration signals as diagnostic signals under different load points at three different speeds. The combination of both current and vibration signals gives the methodology greater robustness and improves the reliability of fault detection by separating the potential effects that may occur in only one of them. In [24], the authors use stray flux and motor current as signals for detecting various faults in induction motors; the analysis of the starting current allows them to avoid false positive/negative indications caused by constructive characteristics of the machine, while the analysis of the stray flux signal under starting conditions allows them to distinguish between eccentricities and misalignments. Therefore, the main objective of this work is to merge the information obtained from two different signals to reach a more robust diagnosis of the machine condition. On the one hand, the analysis of the stator current signal is the most widely used method to detect faults in SynRM. Meanwhile, the analysis of vibration data is one of the most common methods for diagnosing faults, especially those involving mechanical issues. The utilized signal processing tool is the classic method used for current and vibration signal analysis through the fast Fourier transform (FFT). The vibration data are collected in a test bench where vibrations are acquired at the drive end (DE) of the machine housing for different load points at different speeds. This paper is structured as follows. Section 2 presents the theoretical background of the detection of misalignment faults, first using the vibration signals and second using the stator current signal, and the proposed methodology. Section 3 describes the testbench in which the vibration data and current signals are acquired. Section 4 presents the main results of the analysis and discusses the main findings. Finally, Section 5 concludes this work, explaining the main contributions and conclusions obtained.
2. Theoretical Background
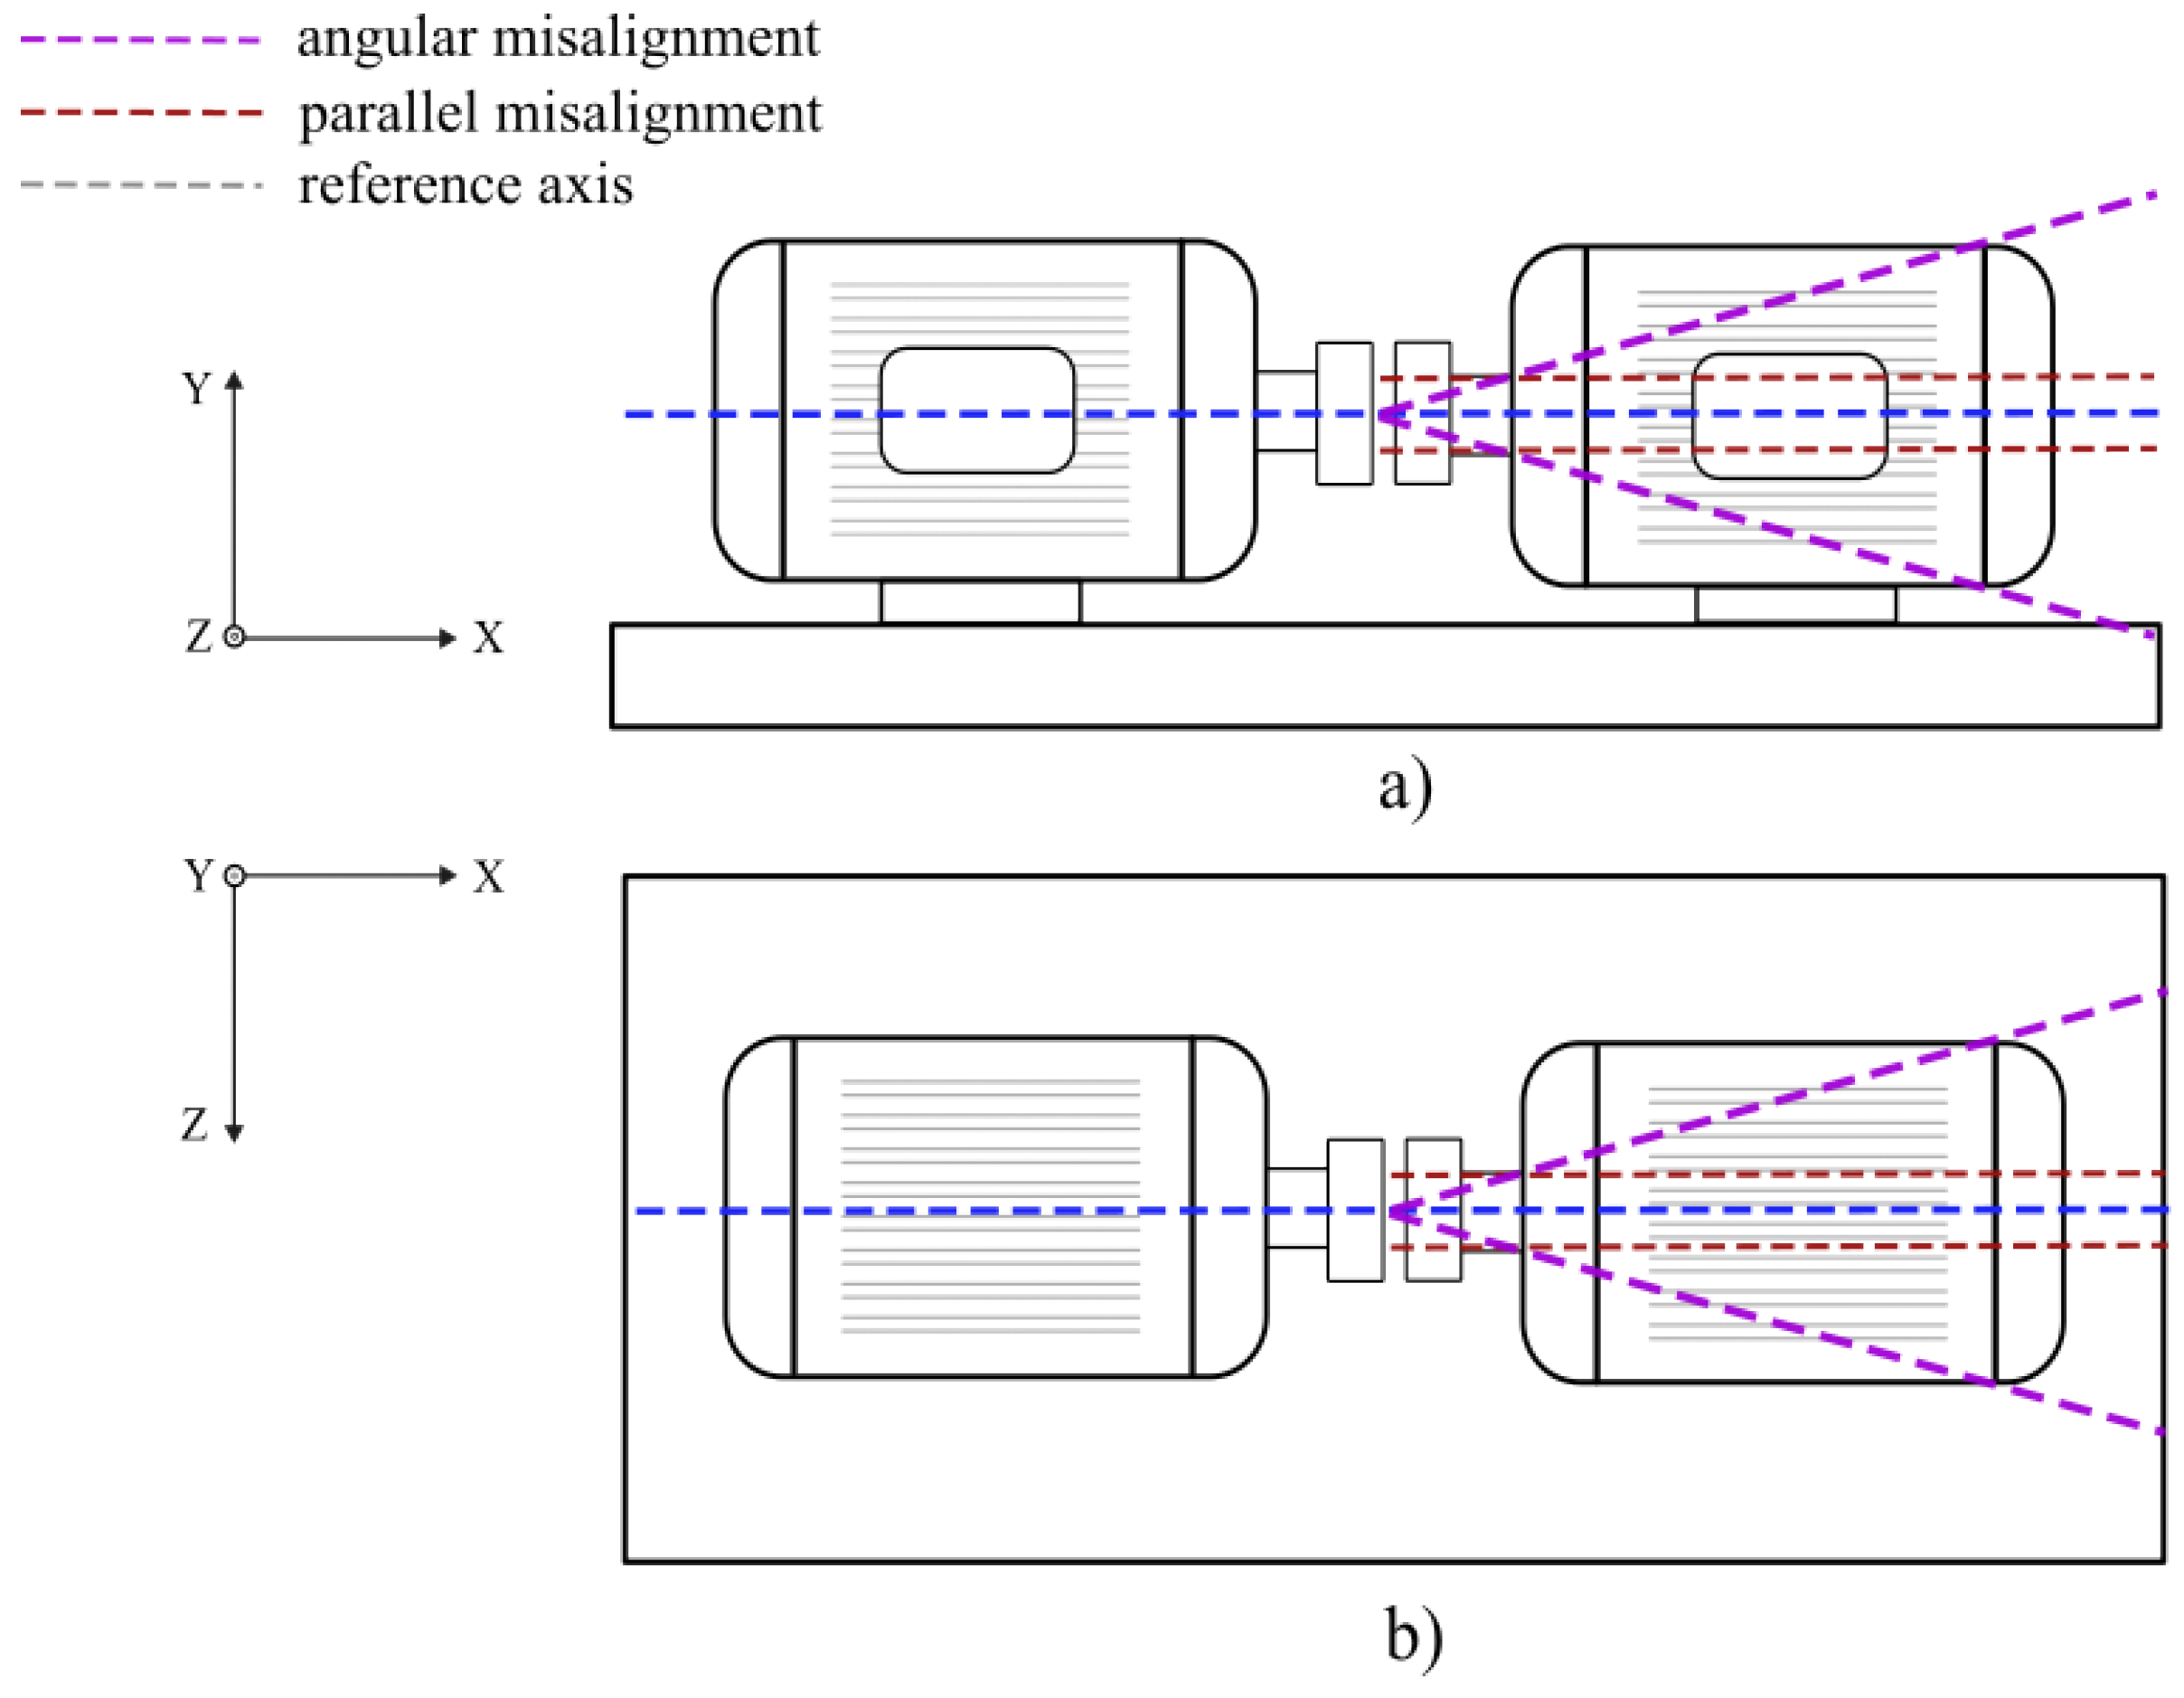
Misalignment faults in drive systems arise when the motor and the load are not correctly aligned, resulting in a discrepancy between the centerlines of the coupled shafts. This misalignment can be classified into three types: parallel, angular, or a combination of both (see Figure 1). Determining the degree of misalignment while the motor is in operation is challenging, as there is no direct measurement equipment available. The only way to detect misalignment is by analyzing its secondary effects on bearings, shafts, and couplings. These effects are closely related to the rotational speed of the motor [25].
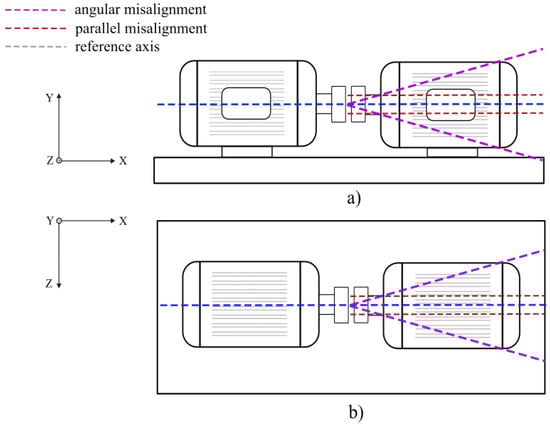
Figure 1.
Misalignment fault description: (a) vertical plane and (b) horizontal plane.
2.1. Effect of Misalignment in Vibration Signals
There is still some debate about which vibration components are specifically affected or generated by each type of shaft misalignment, but it is undeniable that misalignment causes the changes in the vibration spectra that can be identified [26]. The centrifugal force rotates at the rotor’s speed and produces the fundamental vibration component. If the shaft misalignment between the motor and the driven load is minimal in all planes, the velocity of the component should not normally vary significantly around the periphery of the bearing housings at both the drive end (DE) and the non-drive end (NDE). Other works explain that the vibration frequencies that change when there is a certain level of misalignment are both the and components [21].
Recent studies have further explored the impact of misalignment on vibration frequencies. In [27], the authors examined different defects known to produce vibrations, with misalignment being the most common issue that leads to dominant vibrations. These results were verified through experimental data by testing the machine under conditions of load imbalance, misalignment, and structural looseness. Furthermore, in [28], the authors investigated both vibration and current signals to detect misalignment in induction motors. Their results showed a marked difference in vibration components at even multiples of the rotating frequency ( and ). In this case, the rotating frequency () did not provide a reliable indication of misalignment. However, the twice supply frequency component () became more pronounced as misalignment levels increased.
2.2. Effect of Misalignment in Current Signals
The level of misalignment in the coupling between the motor and load shafts has a certain influence on the spectrum. Misalignment affects the dynamic behavior of the rotor, leading to static eccentricity [29]. Thus, shaft misalignment can be diagnosed by monitoring certain harmonics of the stator current, since an increase in misalignment—or, equivalently, a slight increase in the combination of eccentricities affecting the rotor during operation—results in an increase in the frequencies given by [30].
In fact, one of the most widely used methods to detect misalignment is by capturing the current signal during steady-state operation and analyzing the current spectrum using the fast Fourier transform (FFT). In [31], a comparison of various current analysis techniques, including FFT, root mean square (RMS), and discrete wavelet transform (DWT), is provided. This study examines the use of the stator phase current, the envelope of the stator phase current, and the stator phase current space vector module spectrum for identifying misalignment in permanent magnet synchronous motors (PMSMs). The results demonstrate that the amplitude of the frequency component increases when misalignment is present, although its magnitude is significantly influenced by the load torque. In contrast, the component in the stator current envelope or the stator current space vector module exhibits less dependence on the motor’s operating conditions. While current analysis using DWT and the RMS value of the stator current are sensitive to misalignment, they are not suitable for fault detection due to their limited sensitivity to the fault. These studies primarily focus on the analysis of current signals during steady-state operation in PMSMs. For induction motors (IMs), additional frequency signatures, such as , , and (where s is the slip), are observed in the stator current spectrum [32]. The impact of load is also explored in the stator current spectrum in the context of misalignment in [33].
2.3. Proposed Methodology
This work explores the detection of misalignment between the motor and the driven load by analyzing vibration and current signals during the steady-state regime in SynRM. The motor analyzed in this study is powered by a variable frequency drive (VFD), which inherently operates in a closed-loop manner. Therefore, the control strategy plays a crucial role in motor operation. However, in this study, control parameters remain fixed, and their impact on fault detection is not analyzed in depth. The study of fault detection in closed-loop electric motor control remains largely unexplored in the literature. Most works focusing on fault detection in inverter-fed motors do not explicitly address the type of control applied. Nevertheless, some researchers have investigated this topic, comparing the impact of open-loop and closed-loop control on the detection of broken bars in induction motors [34]. In [35], the authors analyze the mechanism by which fault harmonics appear in the stator current and speed. They demonstrate that, due to the action of the speed controller, increasing its bandwidth amplifies these fault harmonics in the current and voltage. This study was conducted on PMSM drives, whereas research on synchronous reluctance motors is still in its early stages. Given this, the present work focuses on analyzing misalignment faults without modifying the control strategy, leaving a more detailed exploration of the influences of the control strategy as a direction for future research.
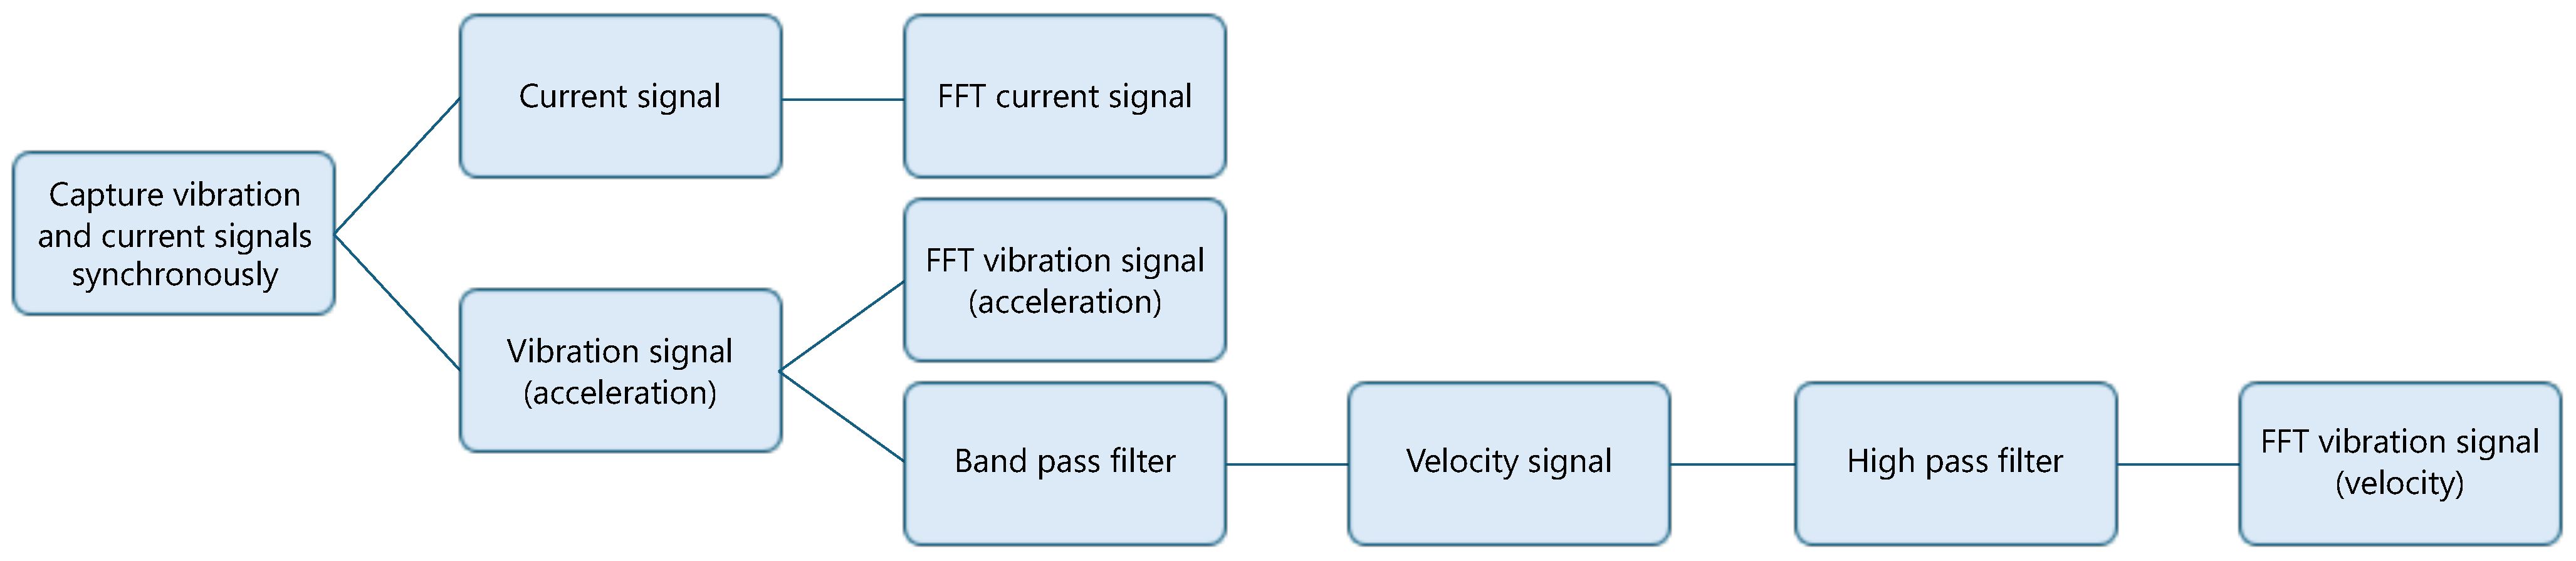
The vibration signals are acquired using an accelerometer located at the DE in order to obtain the radial vibration signal. According to the literature, the vibration signal focuses on the measurement of three quantities that are related by numerical integration or differentiation: displacement, velocity, and acceleration [26]. The utilized physical magnitude depends on different factors such as the size of the monitored plant and the frequency range of interest. Table 1 shows the typical transducer output response to the required frequency range, providing a general overview to determine which type of transducer should be selected based on the analyzed frequency range. Moreover, the general application of vibration-monitoring techniques is shown in Table 2, where velocity is the recommended magnitude for assessing the overall vibration levels in most machines. It should also be noted that many vibration monitoring standards are based on the velocity magnitude [36]. For these reasons, velocity and acceleration are studied as magnitudes to analyze the vibration of the motor. It should be noted that the transducer available is an accelerometer; therefore, the velocity magnitude is obtained by integrating the acceleration measured by the sensor. Regarding the current signal, it is measured synchronously together with the vibration signals through an oscilloscope. Once the necessary measurements have been taken, the signals are processed for further analysis, and the current and vibration spectra (both acceleration and velocity) are obtained through the FFT following the scheme in Figure 2.

Table 1.
Typical transducer output response for different frequency ranges [29].
Table 2.
Application of vibration-monitoring techniques [29].
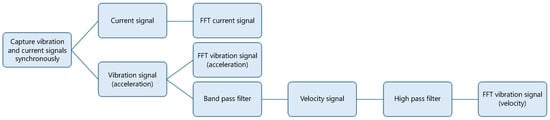
Figure 2.
Proposed signal processing pipeline for the detection of misalignment faults in a steady-state regime.
3. Experiments
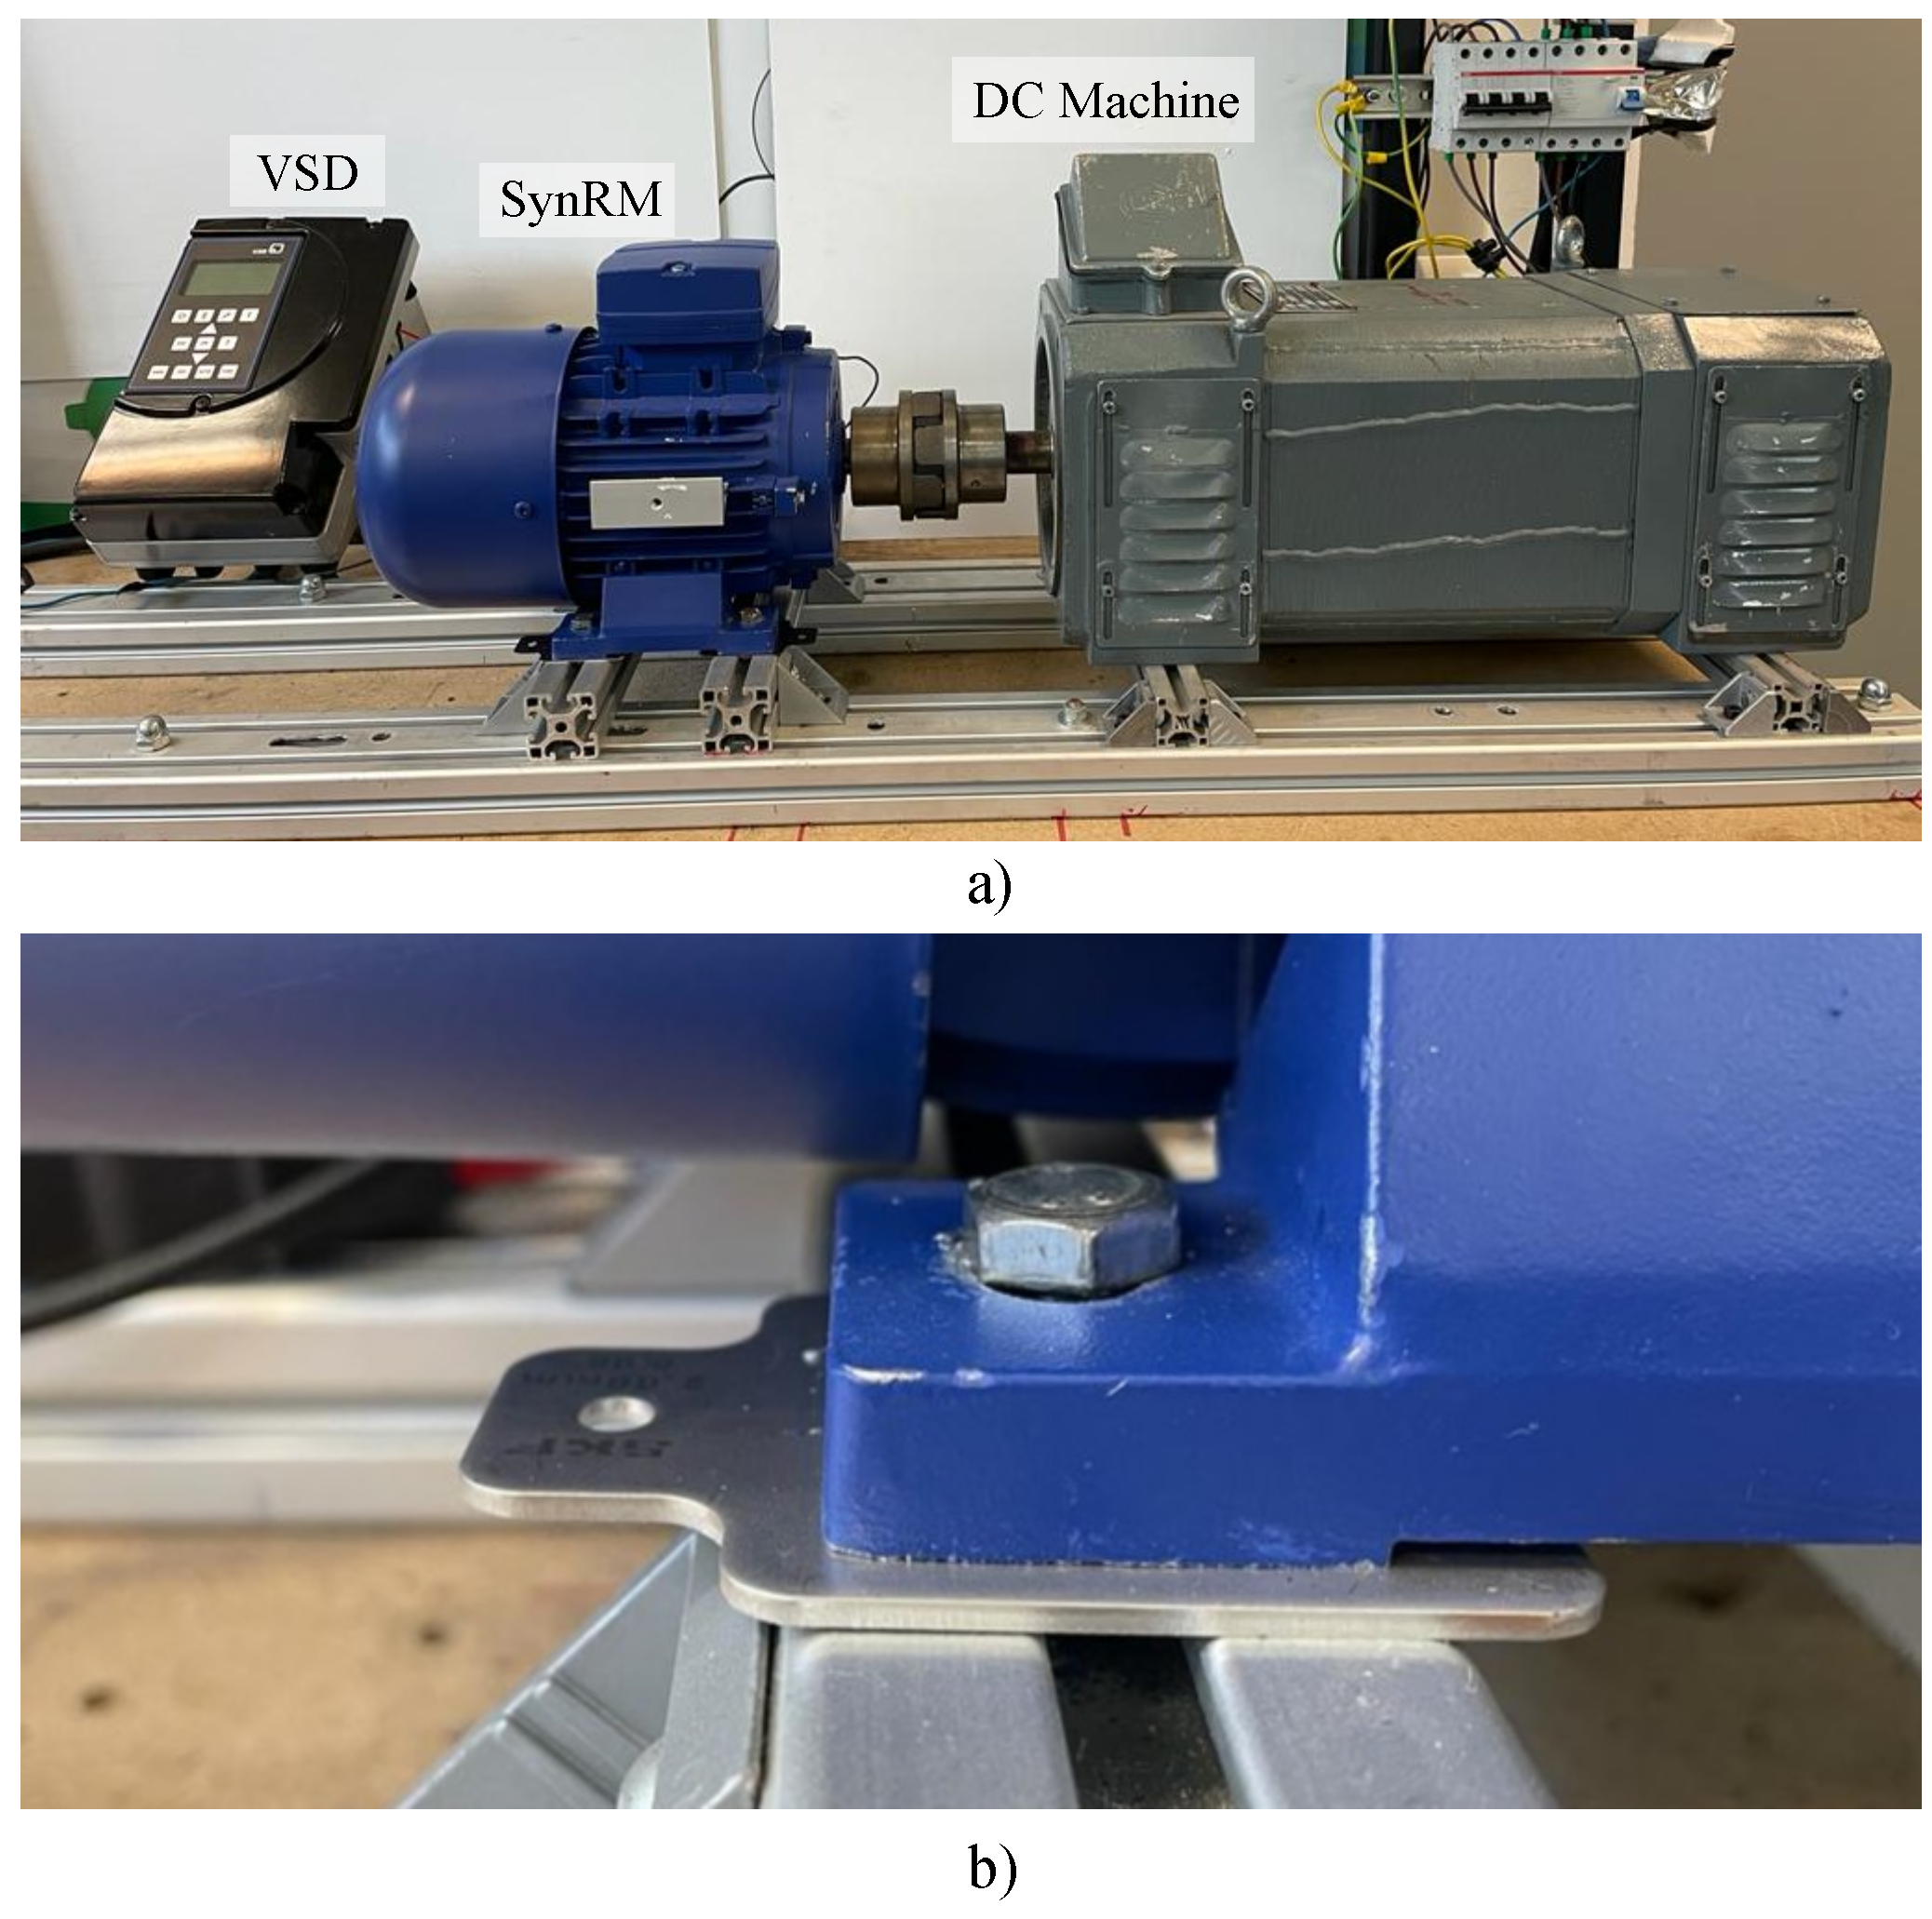
The experiments were carried out in the laboratory using a 1.1 kW, 2 pole pair synchronous reluctance machine coupled to a DC machine acting as a load. The motor was fed via VFD operating at three different speeds: 1200 rpm, 1500 rpm, and 1800 rpm. The motor was tested under different load levels: no load, 40% load (2.8 Nm), 80% load (5.6 Nm), and nominal load (7 Nm) when the motor was operating at 1200 rpm and at 1500 rpm and no load, 20% load (1.4 Nm), 60% load (4.2 Nm), and 80% load (5.6 Nm) when the motor was operating at 1800 rpm. Note that a SynRM possesses reduced torque capabilities when operating in its constant power region. The main characteristics of the synchronous reluctance machine tested in the laboratory are shown in Table 3. The vibration signals were collected at the drive end of the machine in the radial direction. A PCB352C33 accelerometer was positioned at the 12 o’clock position. This accelerometer was connected to a signal conditioning unit, which interfaced with the data acquisition system. A wave recorder was used to synchronously sample the two vibration signals and phase current at a sampling rate of 20,000 samples/s. All the signals are processed using MATLAB 2022b. Figure 3 provides details of the test bench in the physical setup.
Table 3.
Characteristics of the SynRM.
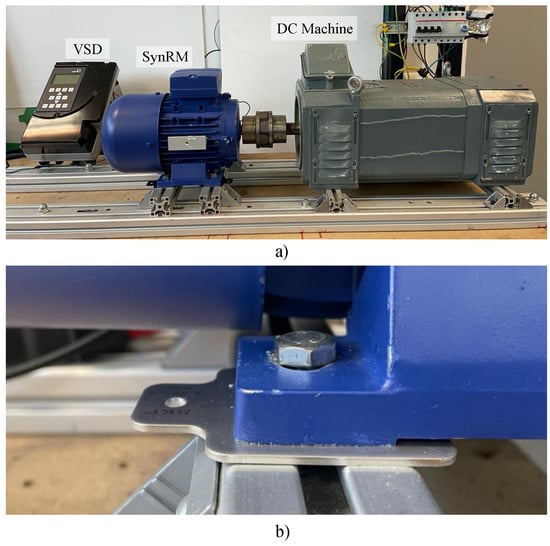
Figure 3.
(a) Experimental testbench; (b) shim on the back of the SynRM mounting.
Several cases of angular misalignment in the XY plane were forced between the motor and the driven load. The misalignment was forced by introducing two shims on the back of the motor, and the use of shims in the assembly is shown in Figure 3. For the healthy condition, the motor was aligned using a proper alignment tool that measures the relative position of the motor axis with the load axis in a horizontal and vertical plane (XZ and XY plane respectively). Three levels of misalignment were tested: level 1 with shims of 1 mm, level 2 with shims of 1.5 mm, and level 2 with shims of 2 mm. Table 4 shows the results obtained from the alignment tool for the aligned motor and each tested misalignment level in the horizontal and vertical planes. According to the speed at which the motor operates, the alignment tool considers maximum alignment limits for both the angle in mm/100 mm and the offset in mm. In this case, the motor operates between 1000 rpm and 2000 rpm; therefore, the manufacturer recommends maximum limits of 0.08 mm/100 mm for the angle and 0.10 mm for the offset.
Table 4.
Alignment results for the aligned motor and motor with certain levels of misalignment.
4. Results and Discussion
4.1. Vibration Spectrum Analysis
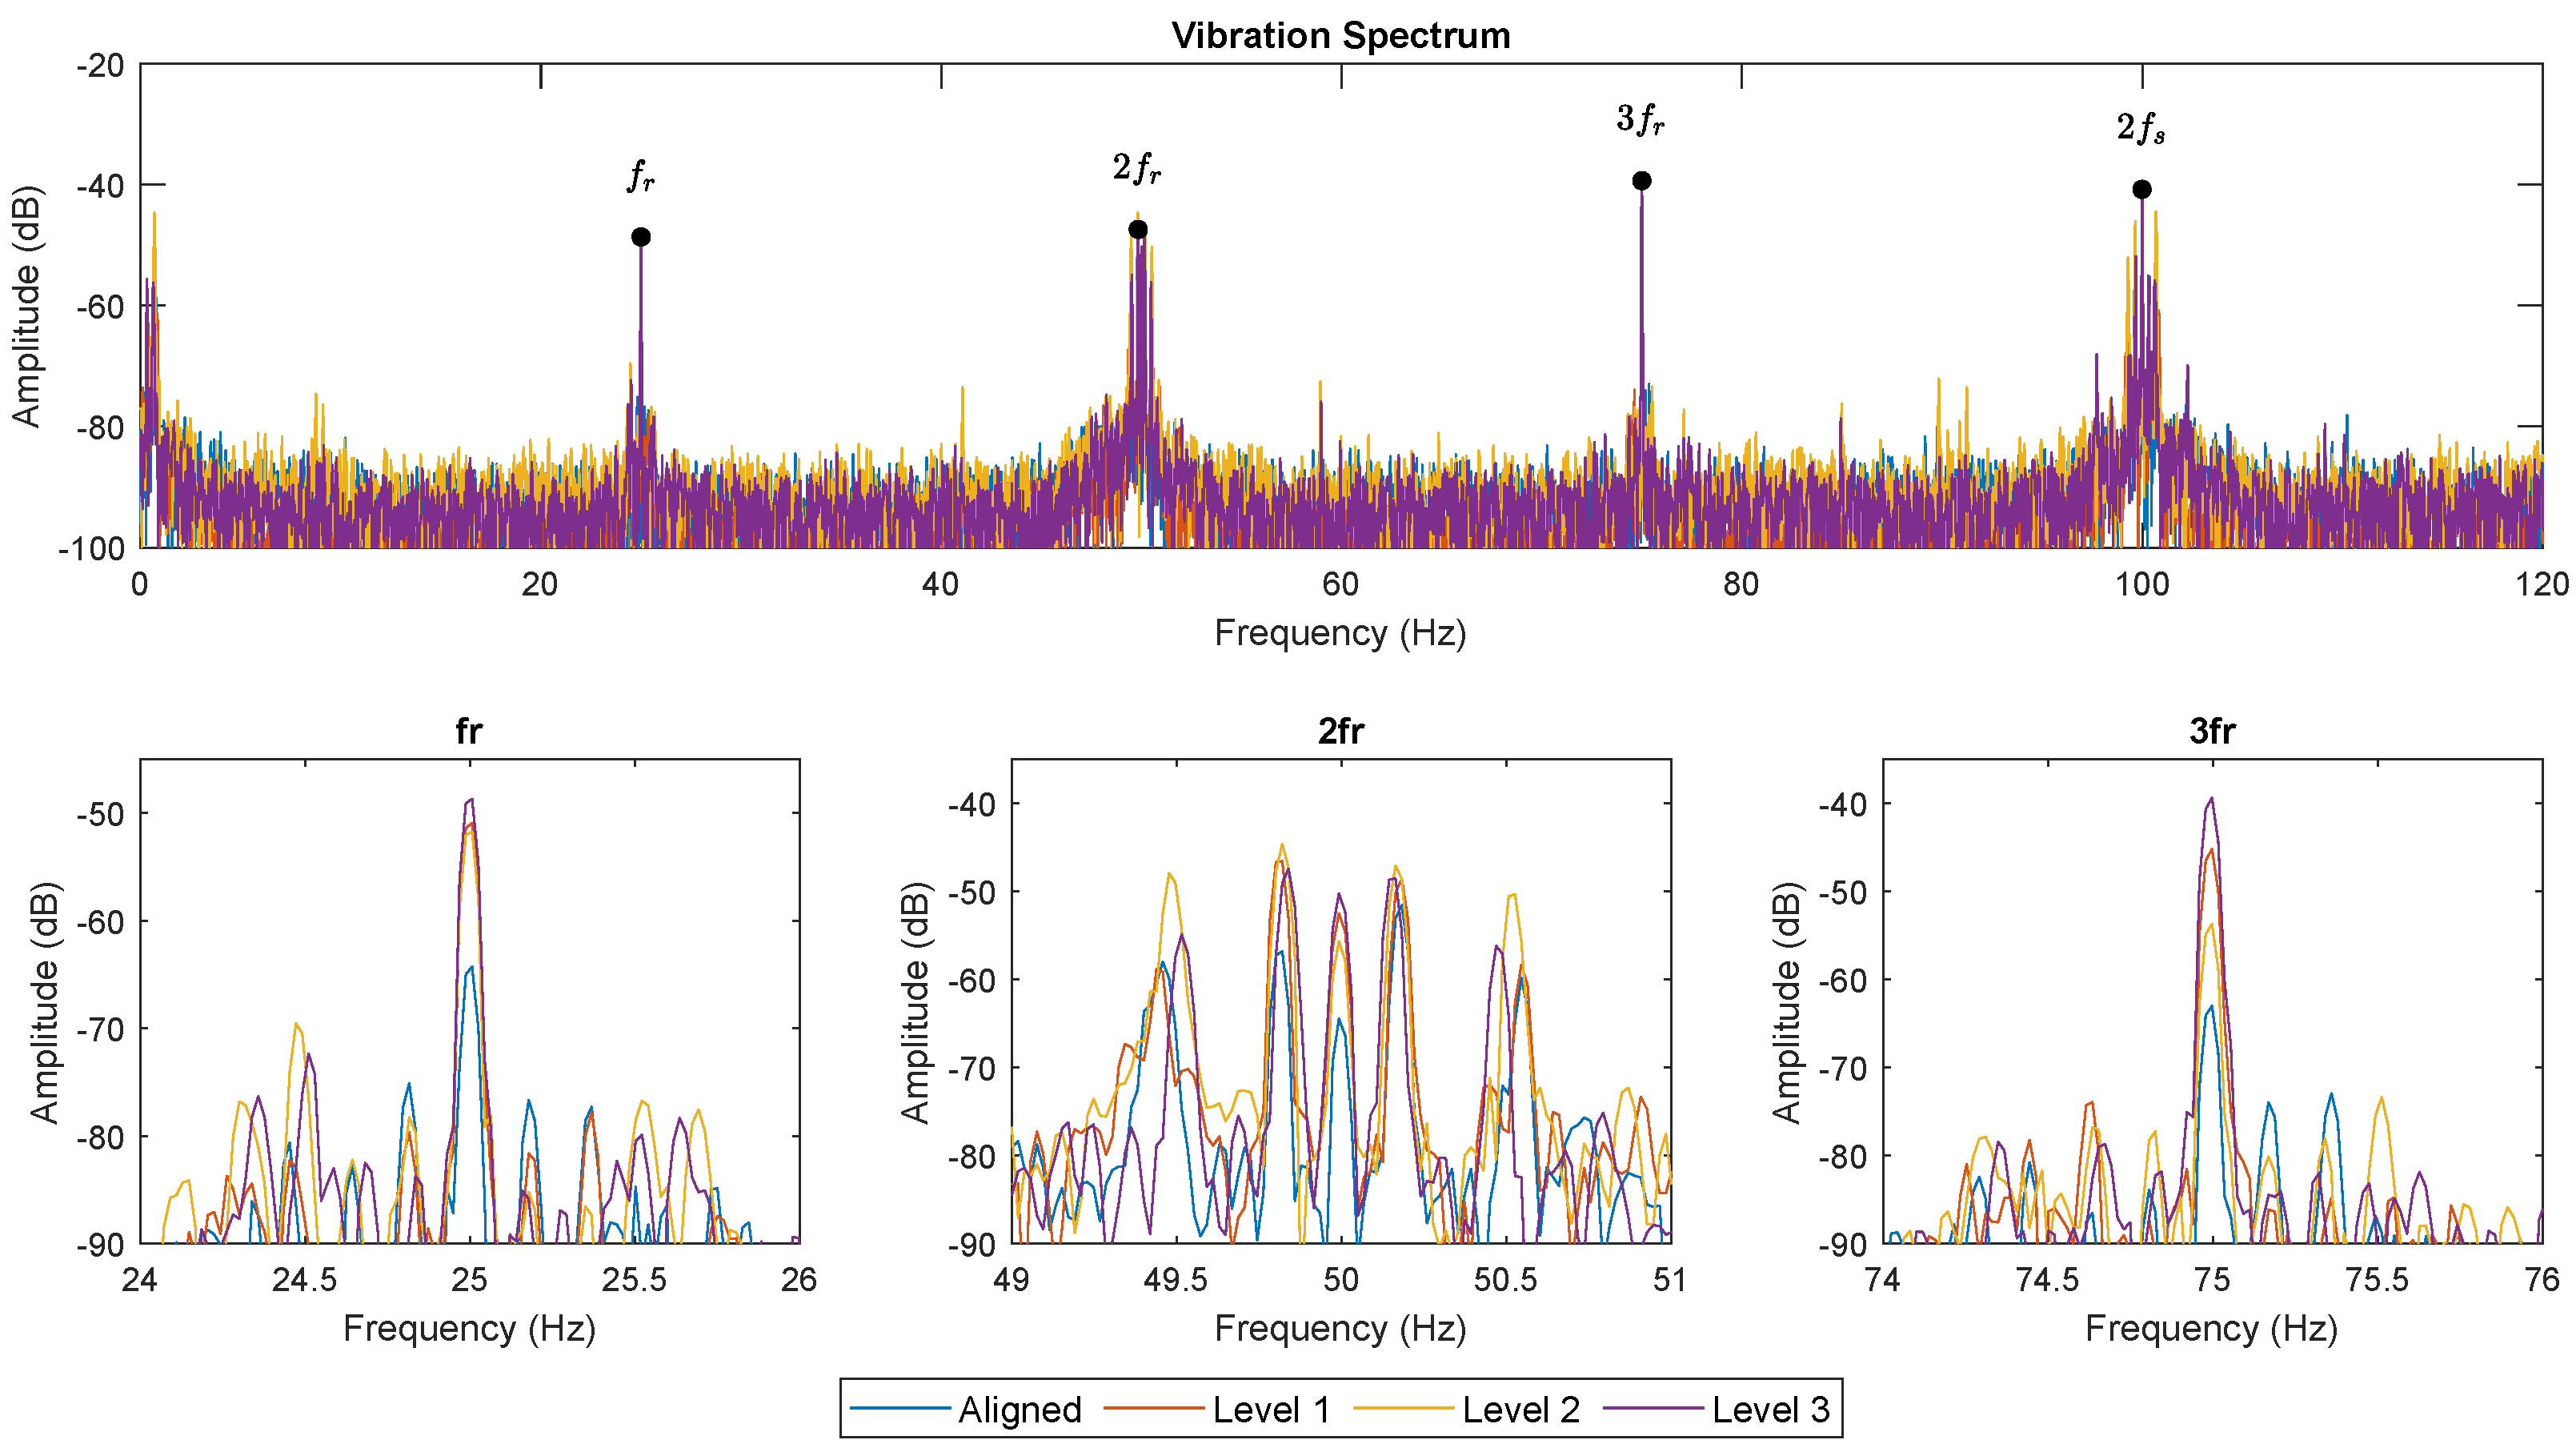
Figure 4 shows the FFT analysis of the vibration signals captured under the steady-state regime when the motor is operating at 1500 rpm with nominal load. The results show the amplitude of the , , and components for different levels of misalignment between the motor and the driven load: healthy (aligned with the load), level 1 (shims of 1 mm), level 2 (shims of 1.5 mm), and level 3 (shims of 2 mm) of angular misalignment in the vertical plane (XY plane).
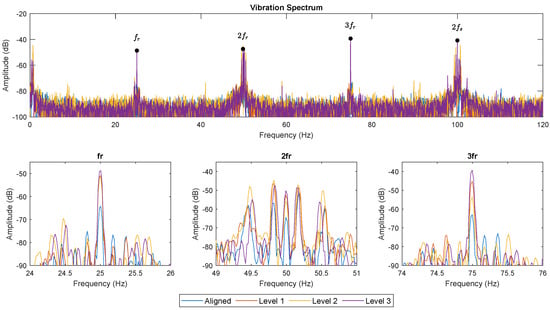
Figure 4.
FFT analyses of the vibration signals under a steady−state regime for the different levels of misalignment at 1500 rpm with nominal load.
Note that these frequencies appear even in the healthy state of the motor, although with a very low amplitude (around 65 dB); however, in all three cases, differences in amplitude are observed when there is a certain level of misalignment in the motor, indicating that these components are apparently related to the presence of misalignment in SynRMs.
A more detailed analysis is then performed, comparing the amplitude (in dB) of each of the analyzed components in the vibration spectrum (the , , and components) with the motor operating at different speeds of 1200, 1500, and 1800 rpm at nominal load (80% of nominal load when the motor operates at 1800 rpm), directly calculated from the acceleration signal and from the velocity signal obtained by integrating the acceleration signal. The figures compare the results of the aligned motor with each of the different misalignment levels studied.
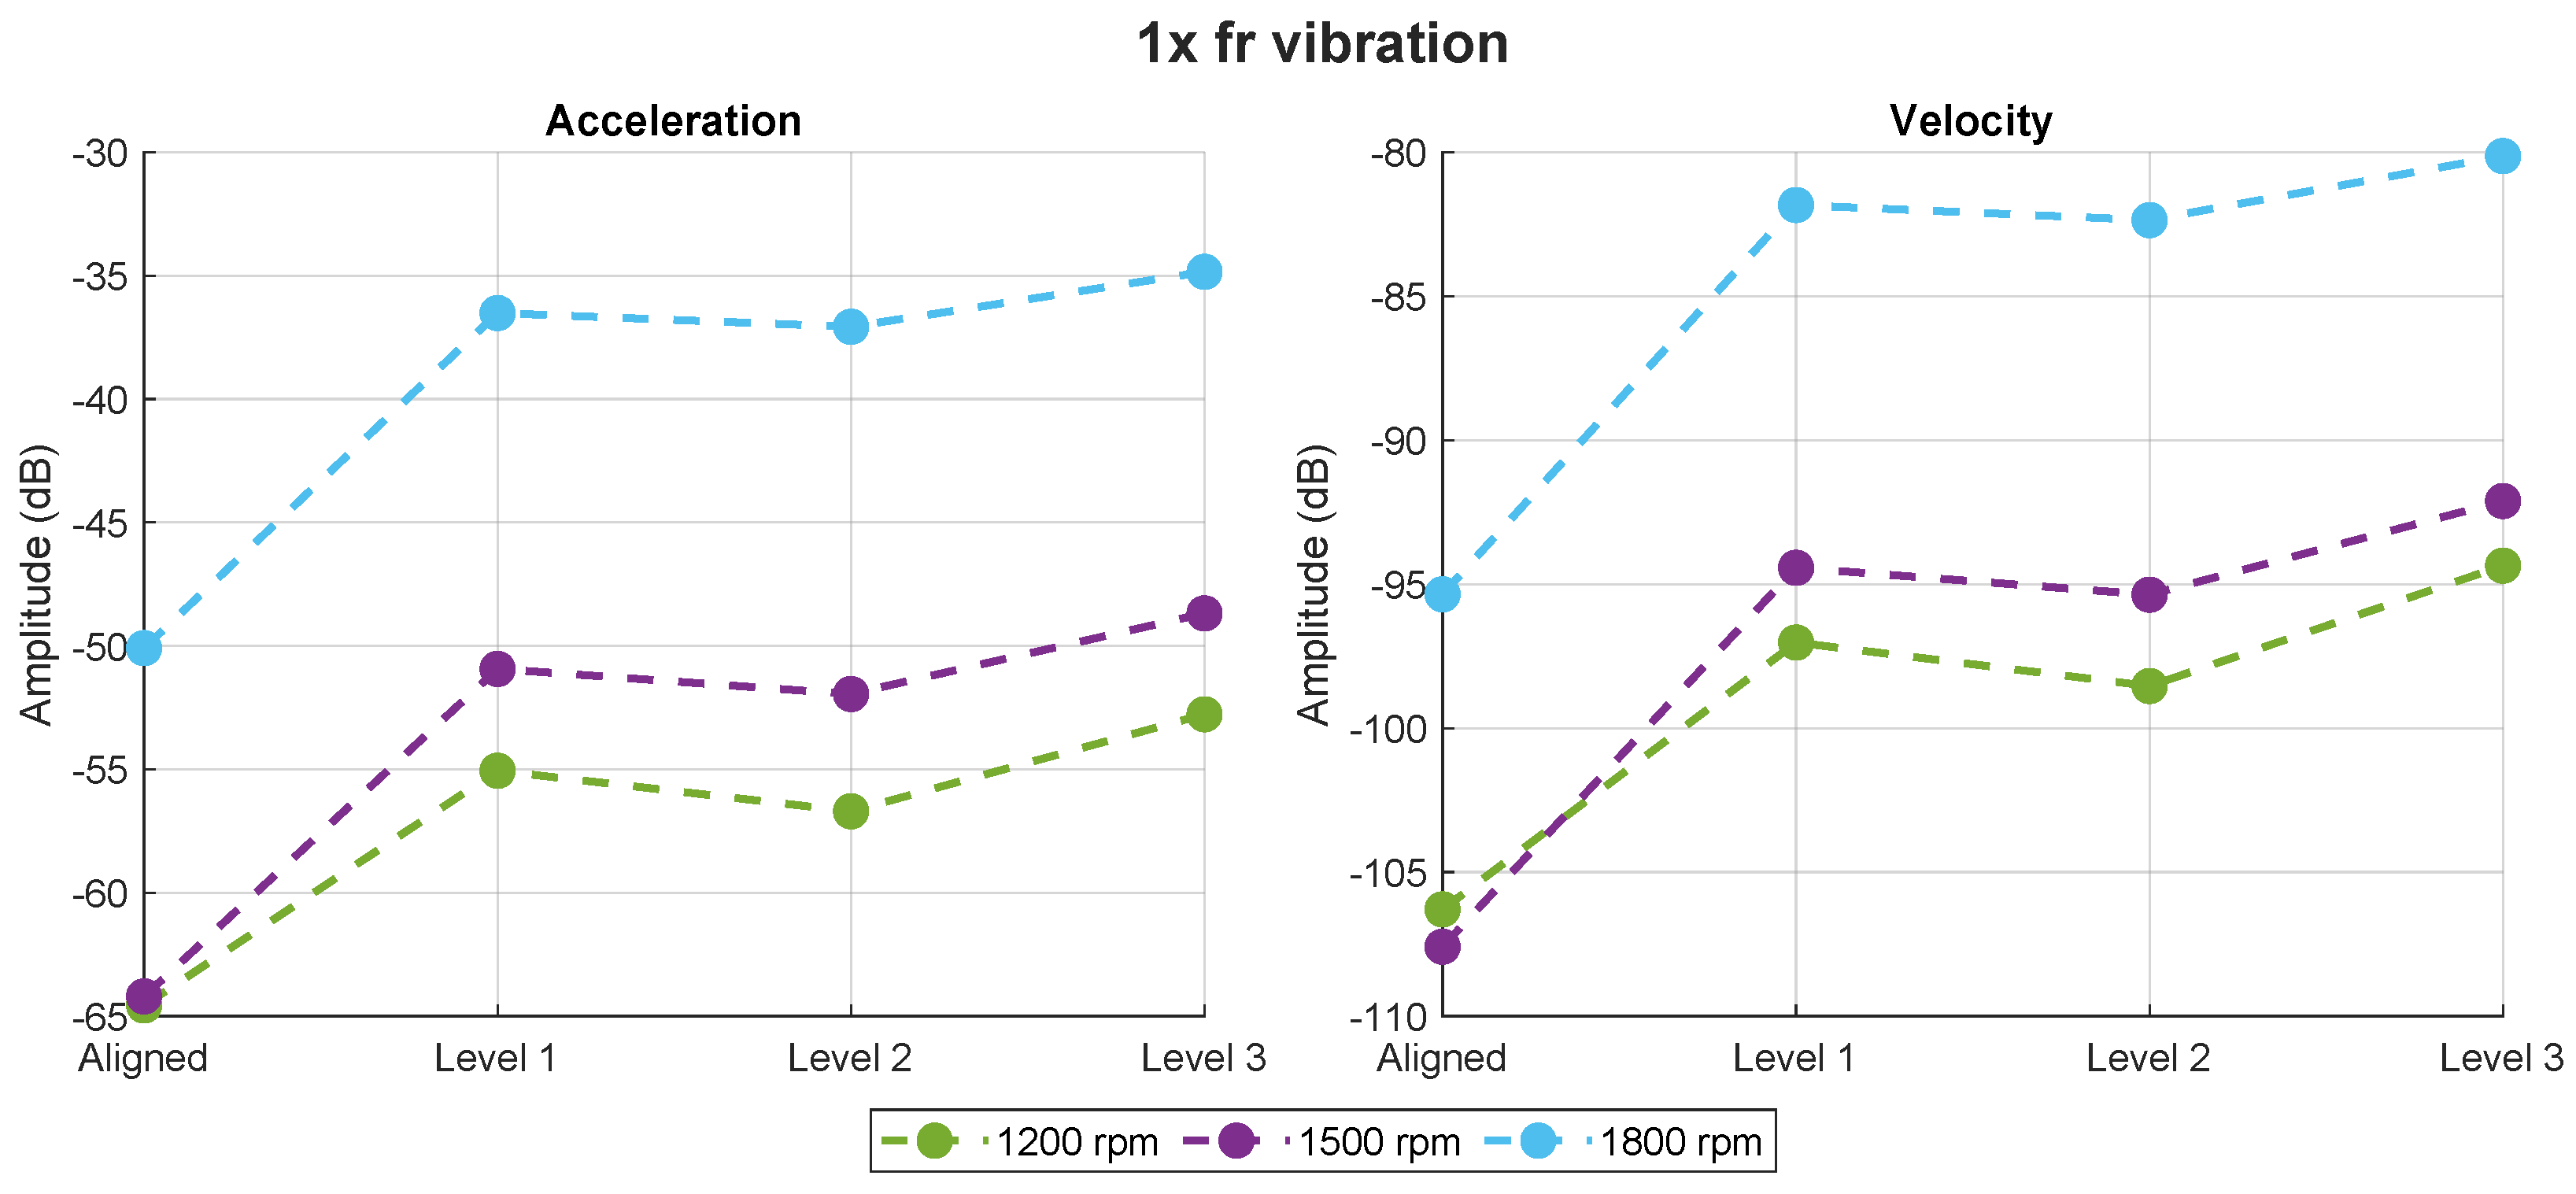
Figure 5 shows the amplitude of the rotational component in the vibration spectrum, directly calculated from the acceleration signal (left) and from the velocity signal (right). In general, Figure 5 shows that the amplitude of the rotational component in the vibration spectrum increases when a certain level of misalignment is present in the motor even at low levels of misalignment. However, the results do not allow for a clear distinction between the lower misalignment levels, as the amplitude does not follow a consistent increasing trend but rather remains relatively stable. Moreover, for the same fault level, or even with the motor aligned, the amplitude increases with speed, meaning that higher speeds result in a greater amplitude of this component. As expected, these patterns remain the same when the results come from the velocity signal; however, the changes are much smaller compared to those obtained from the acceleration signal.
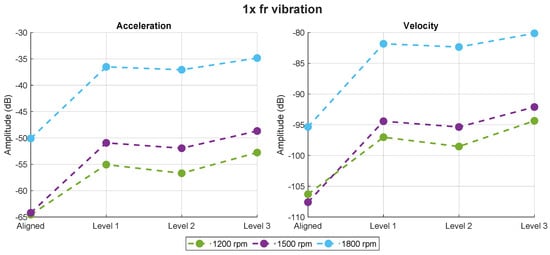
Figure 5.
vibration component obtained from acceleration (left) and velocity (right) for an aligned motor and different levels of misalignment under different speeds at nominal load.
Table 5 presents the quantitative results of the component in the vibration spectrum, obtained from both acceleration and velocity signals, calculating the percentage increase or decrease relative to the amplitude when the motor is aligned. The results confirm the relationship between the amplitude of and the presence of misalignment in the motor. At lower speeds (1200 rpm), this increase is much smaller, reaching a maximum of 18% in the most severe misalignment case when analyzing the acceleration signal. These changes are much more pronounced at higher motor speeds, with an increase of around 20% for the lowest misalignment level. When comparing with the results obtained from the velocity signal, the changes are significantly lower, with a maximum amplitude increase of 16% at the highest misalignment level compared to the healthy condition, whereas for the same case, the increase in the acceleration signal reaches 30%. Therefore, the vibration component is highly suitable for detecting misalignment in these motors. The results obtained from the acceleration signal are more pronounced than those observed with the velocity signal. Moreover, as misalignment increases, its effects on acceleration are more evident compared to vibration velocity, although the lowest misalignment levels cannot be distinguished.
Table 5.
Value of the vibration component and its increase with respect to the aligned case (as a percentage) for different speeds at nominal load.
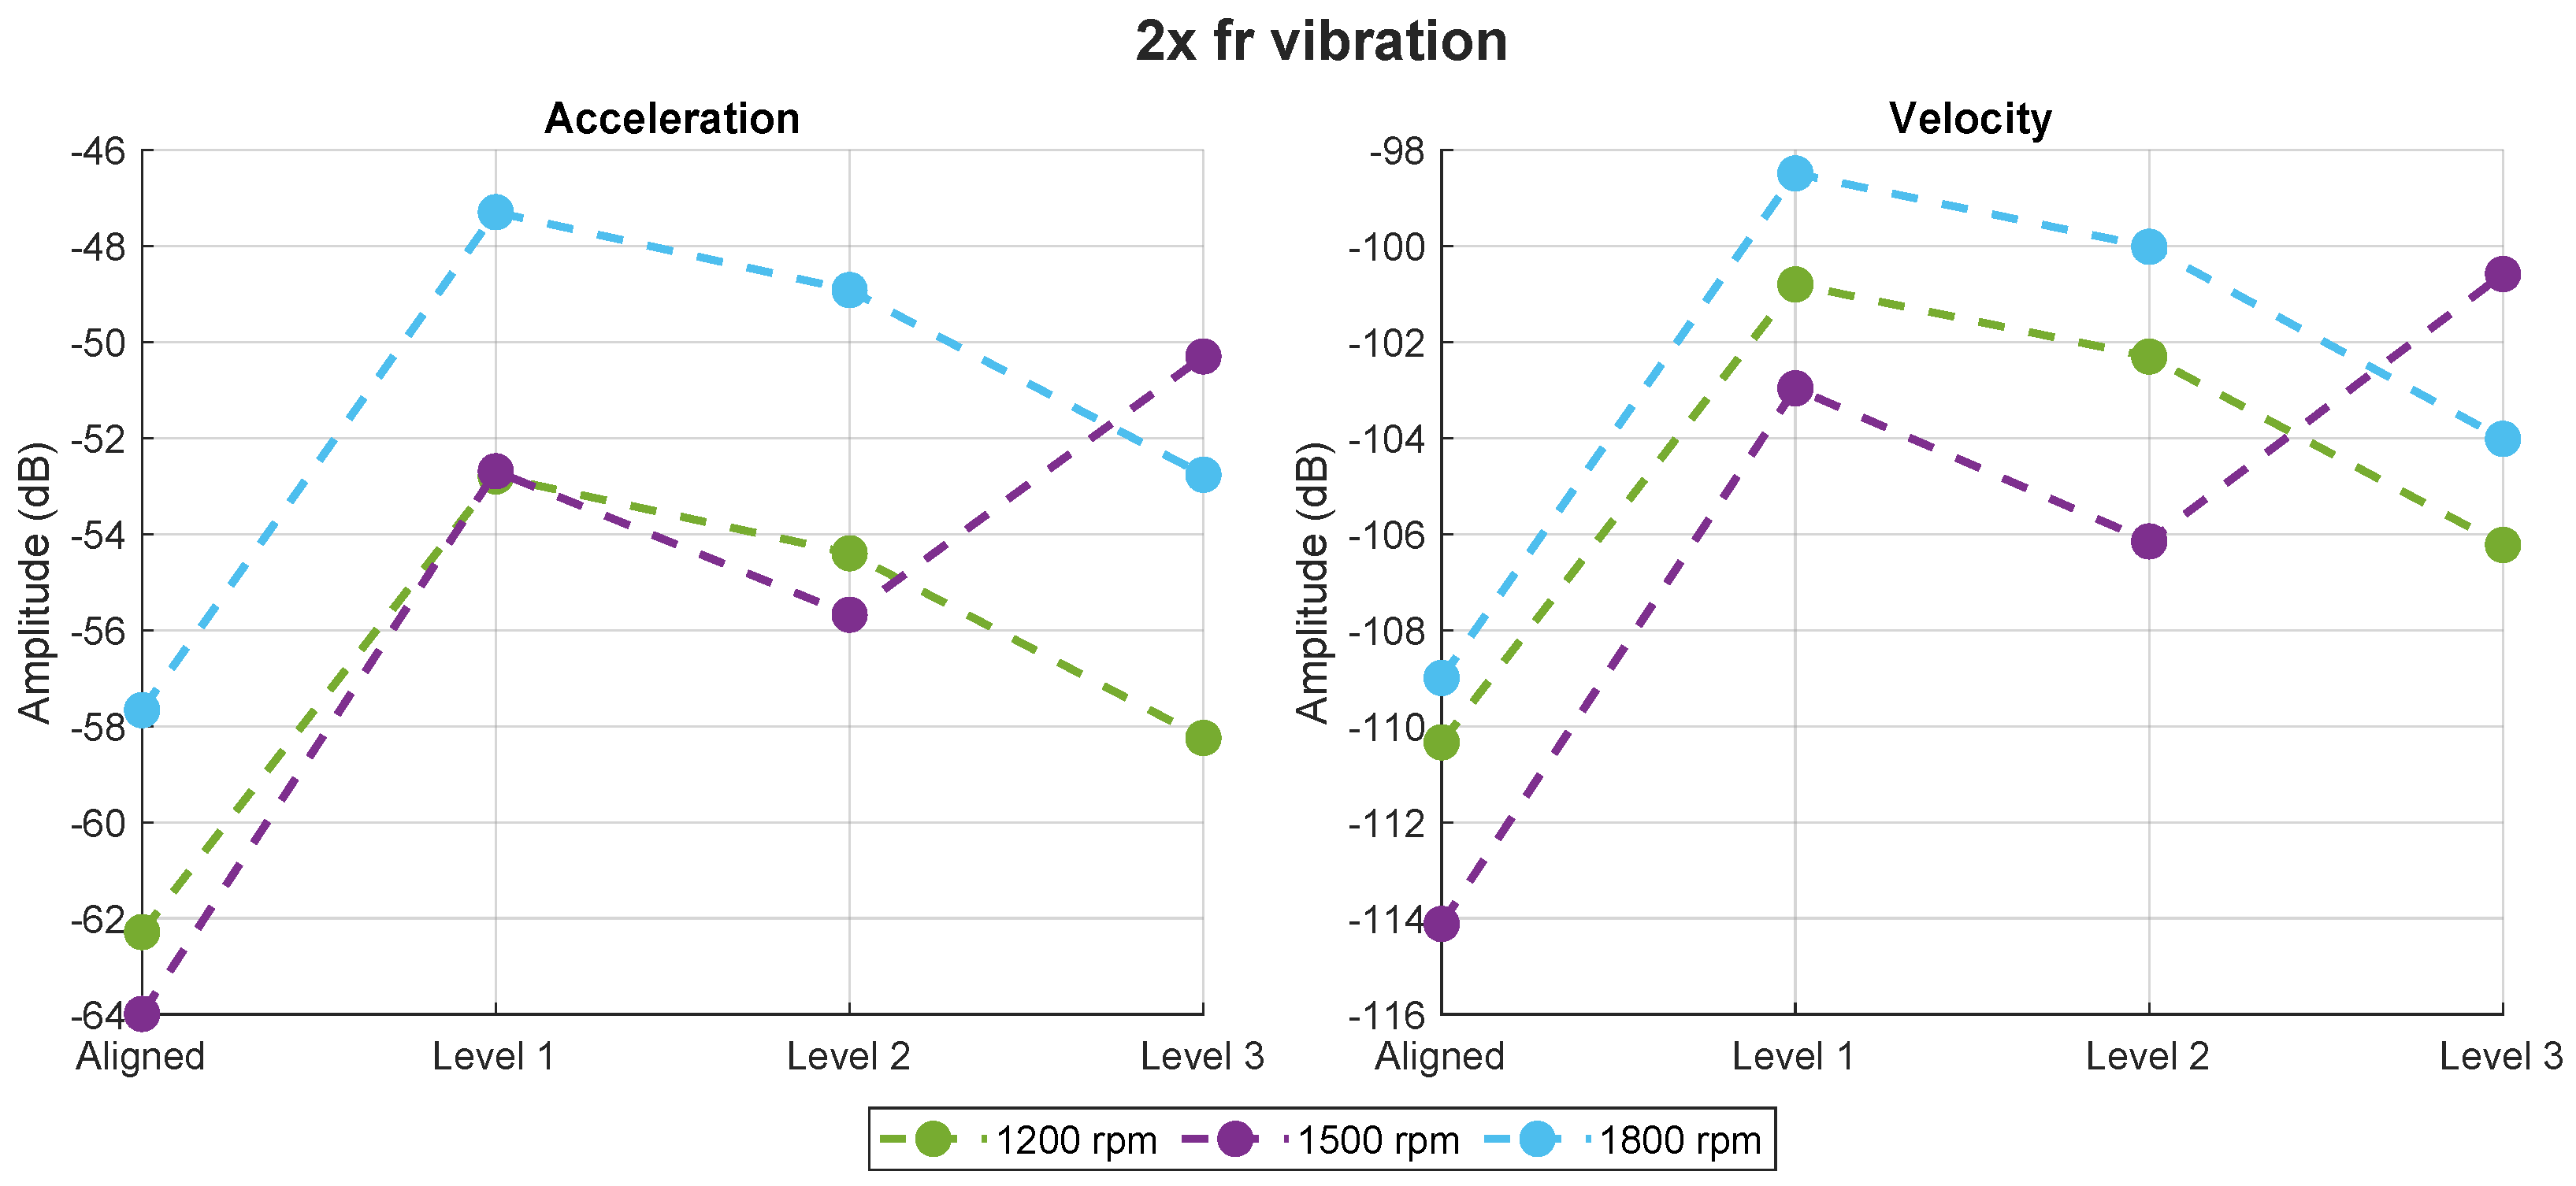
Figure 6 shows the variation in the amplitude of the component in the vibration spectrum of the acceleration and velocity signals. In both cases, the amplitude of the component increases significantly when transitioning from the aligned motor to misalignment level 1. However, when the motor moves from misalignment level 1 to level 2, the amplitude of remains stable and even decreases as the misalignment level increases. This trend continues, with the amplitude of the component decreasing when comparing misalignment level 1 to higher levels, except when the motor operates at 1500 rpm. In this particular case, the amplitude increases significantly, exceeding the amplitude observed at the first misalignment level. This indicates that the component does not allow for a clear distinction between different misalignment levels and exhibits erratic behavior. Despite this, the reduction in amplitude does not overlap with the amplitude value observed when the motor is fully aligned.
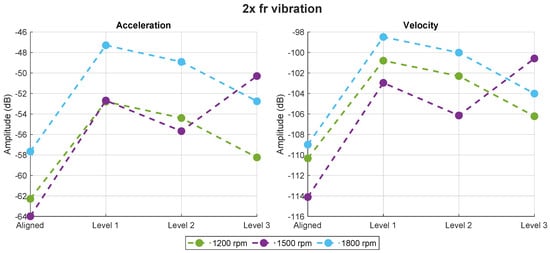
Figure 6.
vibration component obtained from acceleration (left) and velocity (right) for an aligned motor and different levels of misalignment under different speeds at nominal load.
Additionally, Table 6 presents the quantitative values of the amplitude of the component for each studied case. In this case, the data pattern is very similar to the one obtained with the component, showing an amplitude increase relative to the healthy condition when misalignment is present. However, these changes are not very pronounced, reaching a maximum increase of 20% when the motor operates at 1500 rpm. Compared to the results obtained in Table 5, these changes are much smaller, with the amplitude increasing by only 15% when misalignment is present in the motor at higher speeds, and in the case of the , the percentage is around 20% under the same conditions. In practice, this is not entirely reliable for detecting this fault in this context.
Table 6.
Value of the vibration component and its increase with respect to the aligned case (as a percentage) for different speeds at nominal load.
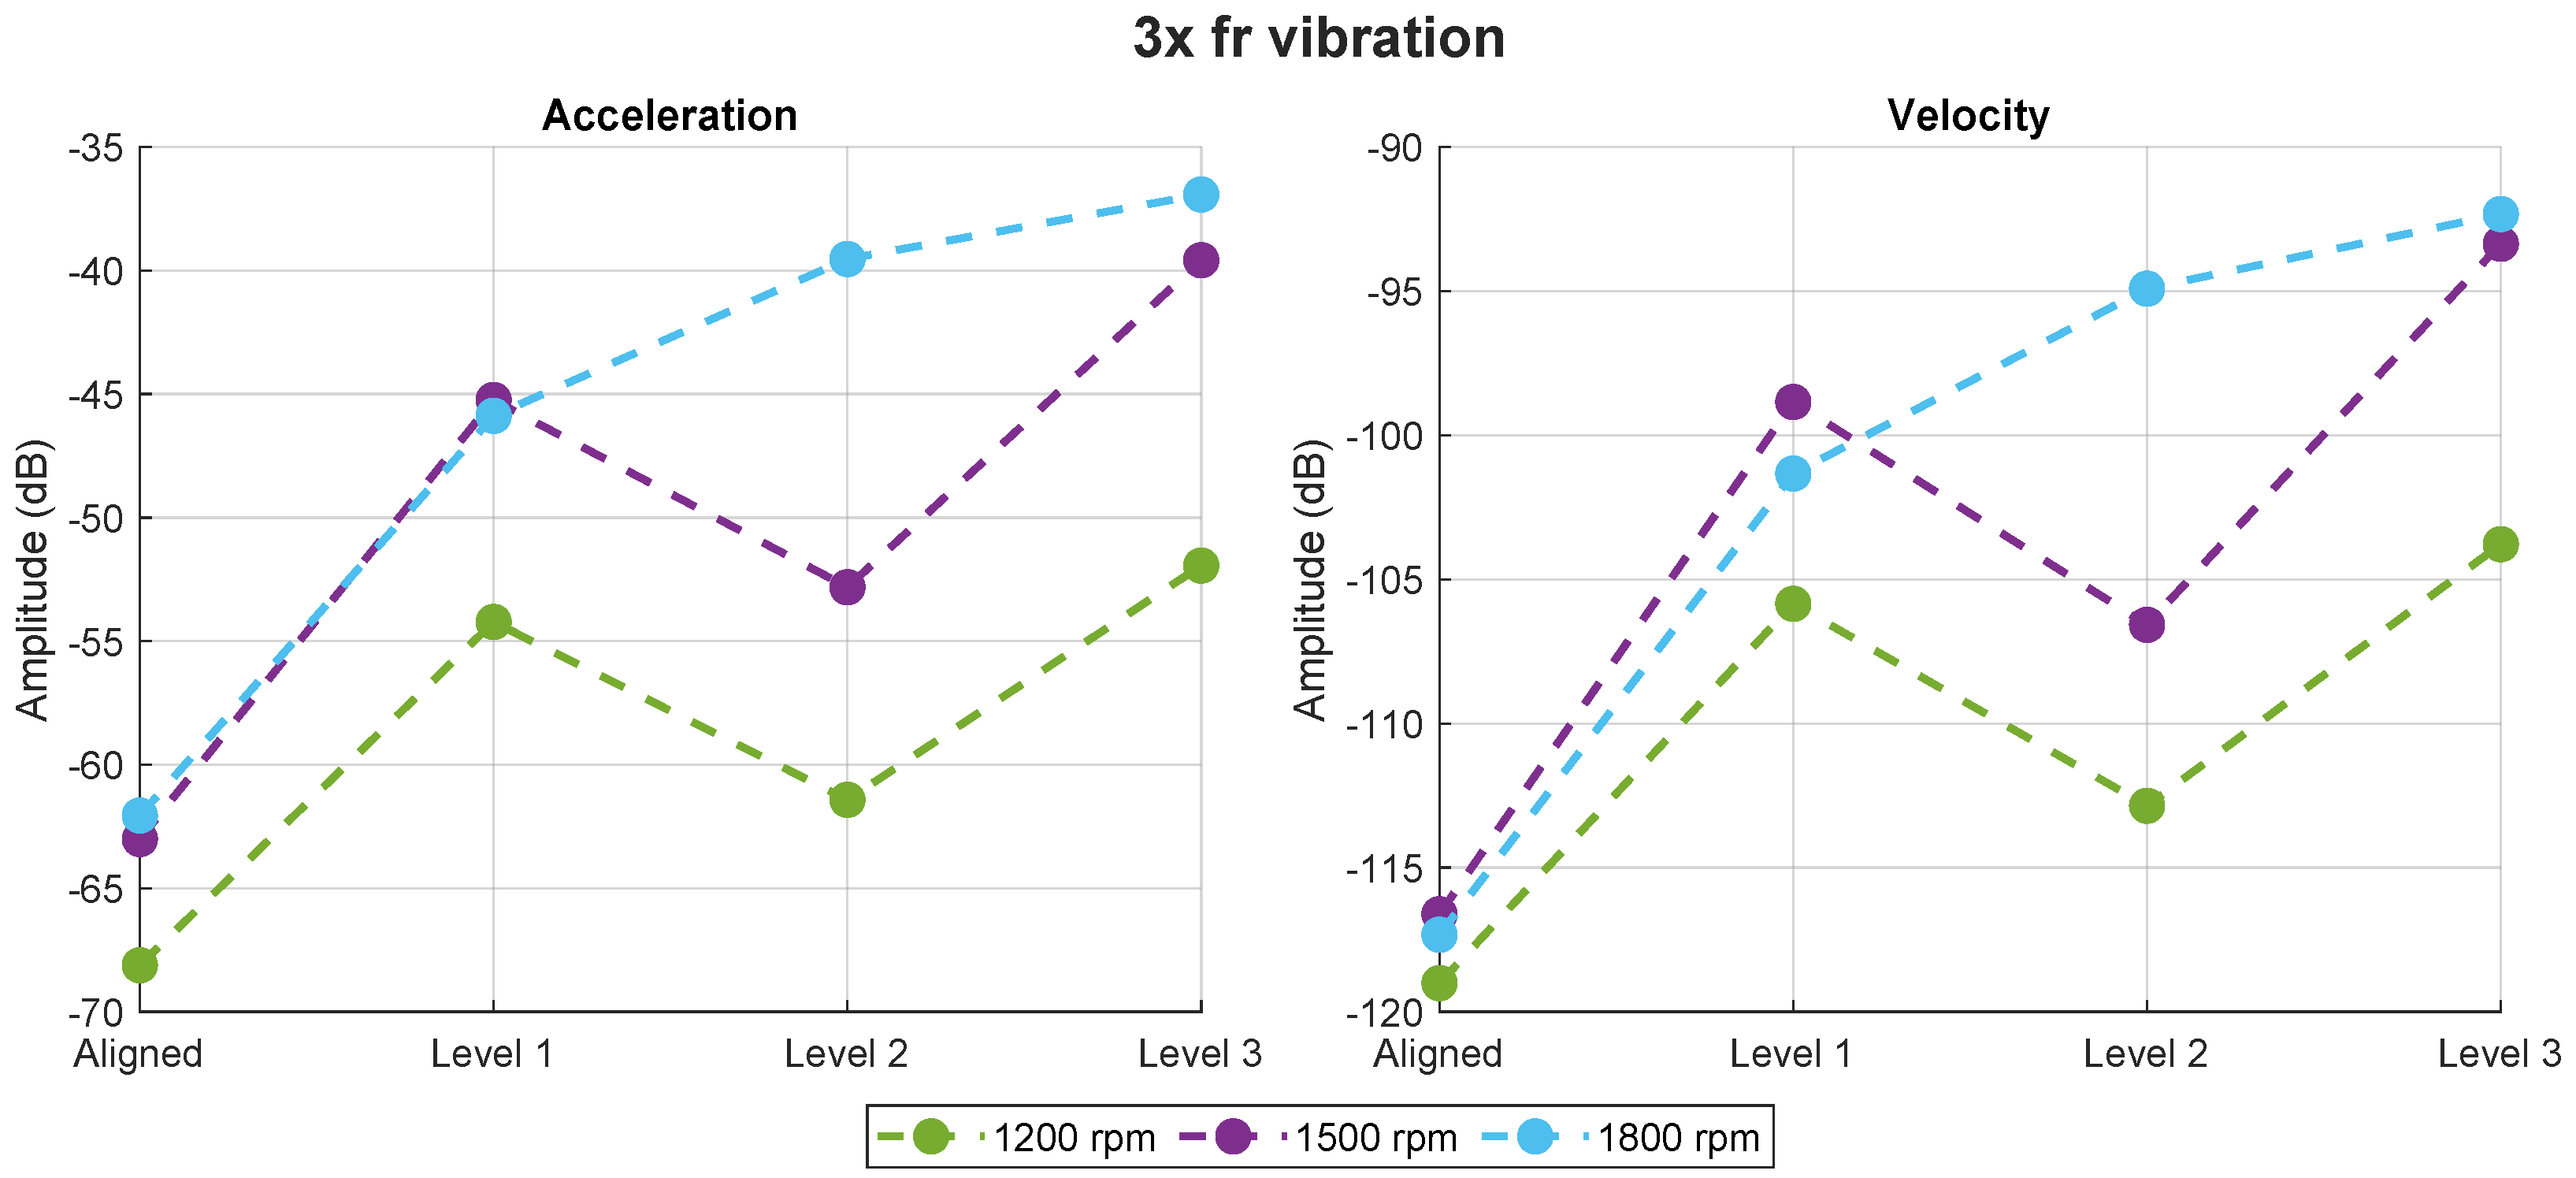
Figure 7 show the results of the analysis of the . Qualitatively, the two signals exhibit the same trend. The amplitude of the component increases in the presence of misalignment. The difference between the aligned motor and misalignment level 1 is significant, with a noticeable amplitude increase at all studied speeds. Moreover, when the motor operates at high speeds (1800 rpm), these changes correlate with the level of misalignment, meaning that as misalignment severity increases, the amplitude of also rises, allowing differentiation between fault levels. Conversely, at lower speeds (1200 and 1500 rpm), this behavior does not follow a linear pattern. The amplitude of can indicate the presence of misalignment, but not its severity, as the amplitudes at misalignment levels 1 and 2 do not follow a clear progression.
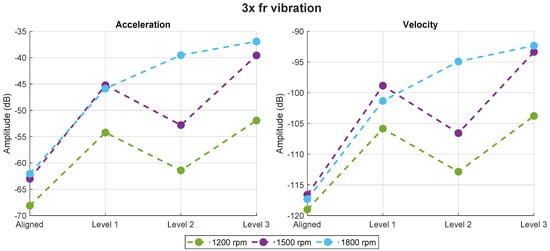
Figure 7.
vibration component obtained from acceleration (left) and velocity (right) for aligned motor and different levels of misalignment under different speeds at nominal load.
As observed with the and components, this amplitude rise is more significant when analyzing the component from the acceleration signal. This is evident in Table 7, which presents the quantitative results. The amplitude increases for each misalignment level compared to the aligned motor and is more pronounced when using acceleration-based analysis, particularly at 1500 and 1800 rpm. In the case of the motor operating at 1800 rpm, the increase reaches up to 40%. However, the rise is more gradual at 1200 rpm, with an 20% increase compared to the healthy condition. When analyzing velocity, the amplitude also increases compared to the aligned motor, but the variation is less pronounced.
Table 7.
Value of the vibration component and its increase with respect to the aligned case (as a percentage) for different speeds at nominal load.
Comparing the results for each studied rotational frequency multiple (, , and ), the most significant changes occur in the component. The amplitude evolution follows a more stable and less erratic pattern than in the other cases. In all three cases, there is an amplitude increase at all speeds. However, these changes are more significant in the component, especially when it is obtained from the acceleration signal. However, it must be noted that, contrary to what other studies suggest regarding the component , this does not appear to be the most suitable component for detecting misalignment due to its erratic behavior in the presence of the fault. In Figure 4, an enlargement of the vibration spectrum for each of the components studied is shown. In the case of the component , sidebands around it are observed, which could be caused by an electromagnetic component. In [21], it is explained that the power supply produces an electromagnetic force that results in a vibration frequency equal to twice the power supply frequency (); in this case, this component coincides with the component . When electromagnetic and mechanical frequencies coincide, components are observed around the coincident frequency (in the case of Figure 4, this would be 100 Hz). A similar phenomenon could be responsible for the distributed components observed around the component ; however, these components have an unknown origin at the moment, and the physical identification of their origin is beyond the scope of this research.
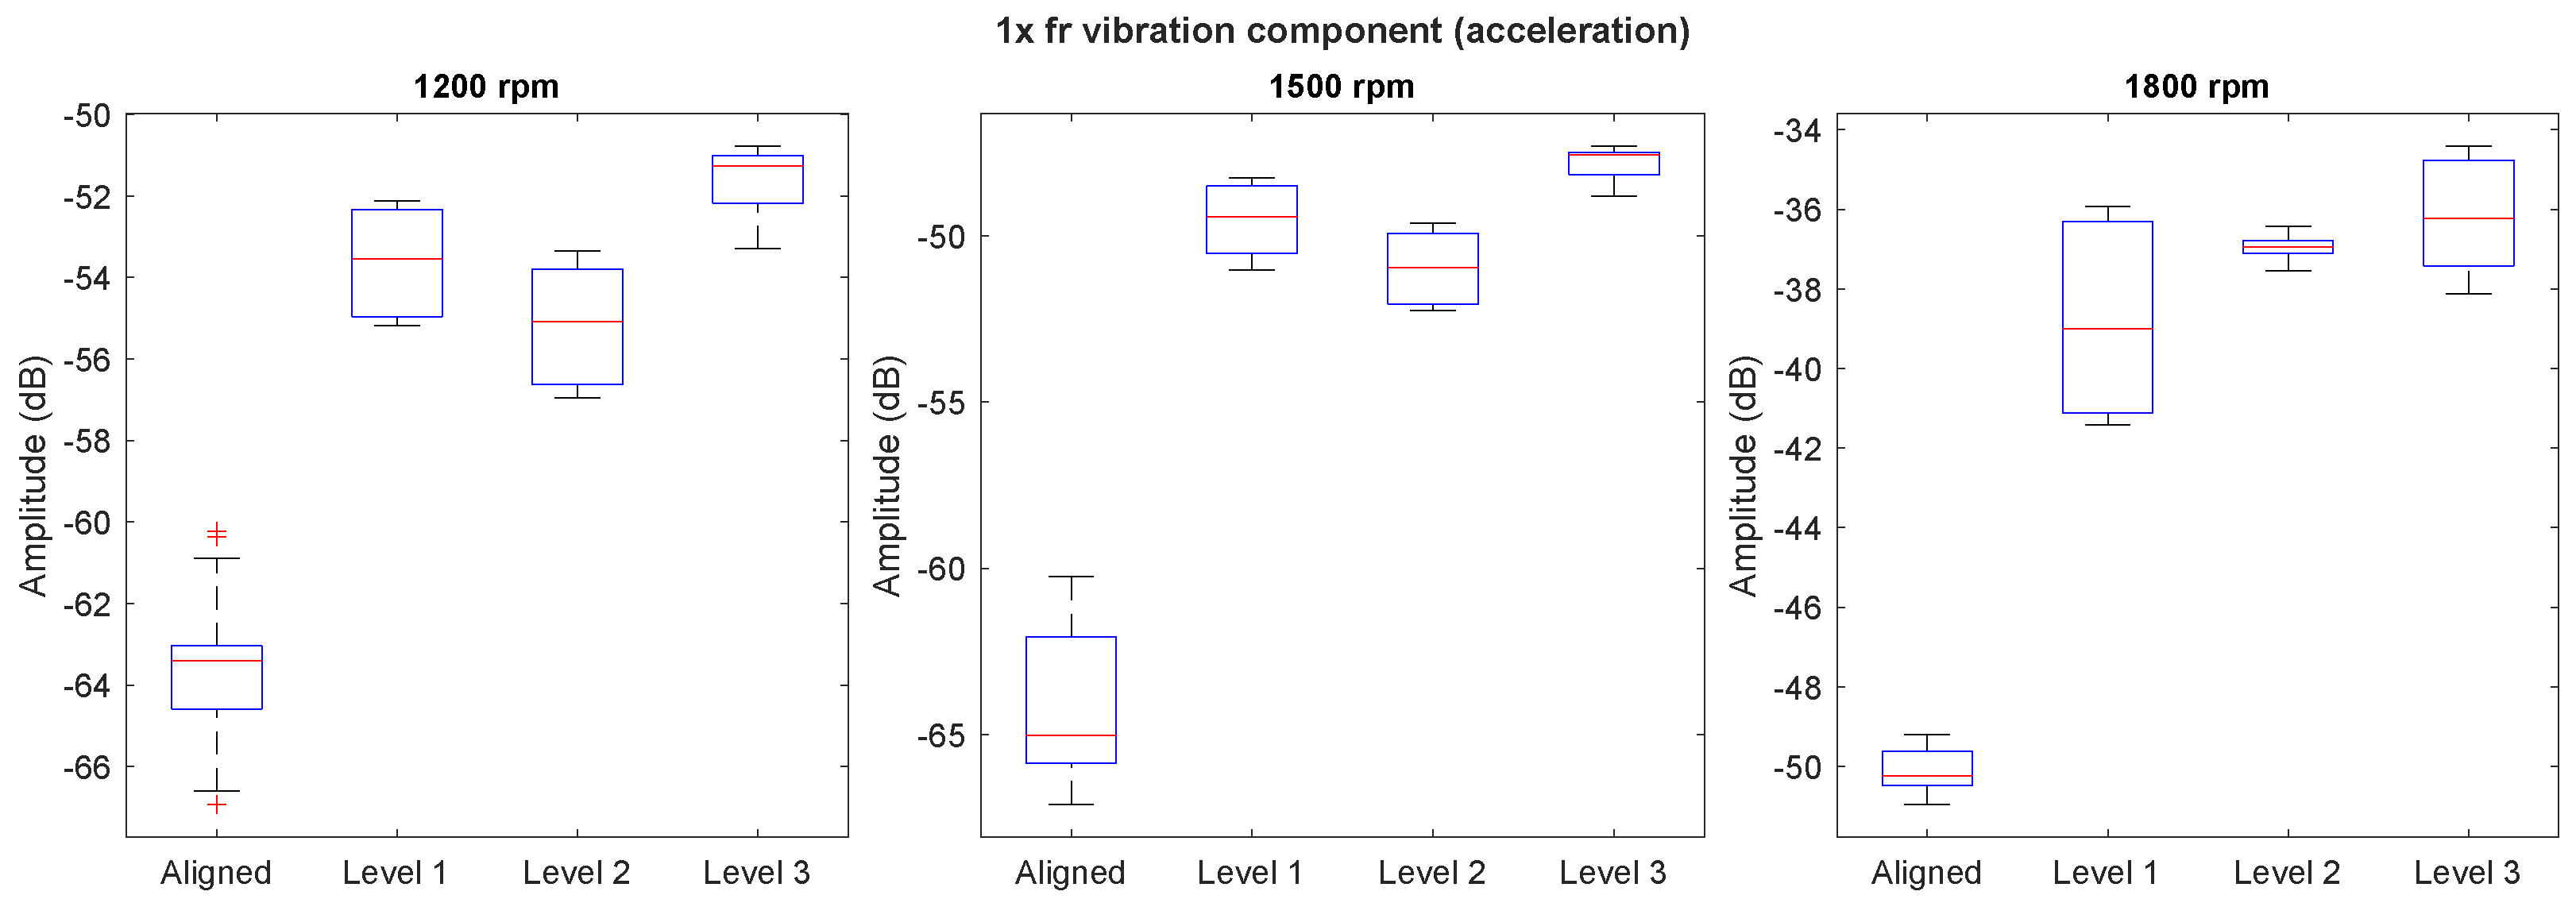
Finally, Figure 8 shows the boxplots corresponding to the distribution of the amplitude of the component of the vibration signal (acceleration) for each of the studied speeds with different load levels. The boxplots are well separated and do not overlap when the motor is aligned and when there is some degree of misalignment. This indicates that the amplitude of the component clearly distinguishes the presence of misalignment for all the considered machine load levels. However, this indicator is not capable of misalignment severity identification.
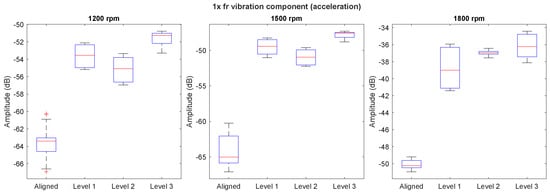
Figure 8.
Boxplots corresponding to the computation of the rotational frequency () amplitude (in dB) of the vibration signal during the steady−state regime under different speeds with several load levels.
4.2. Current Spectrum Analysis
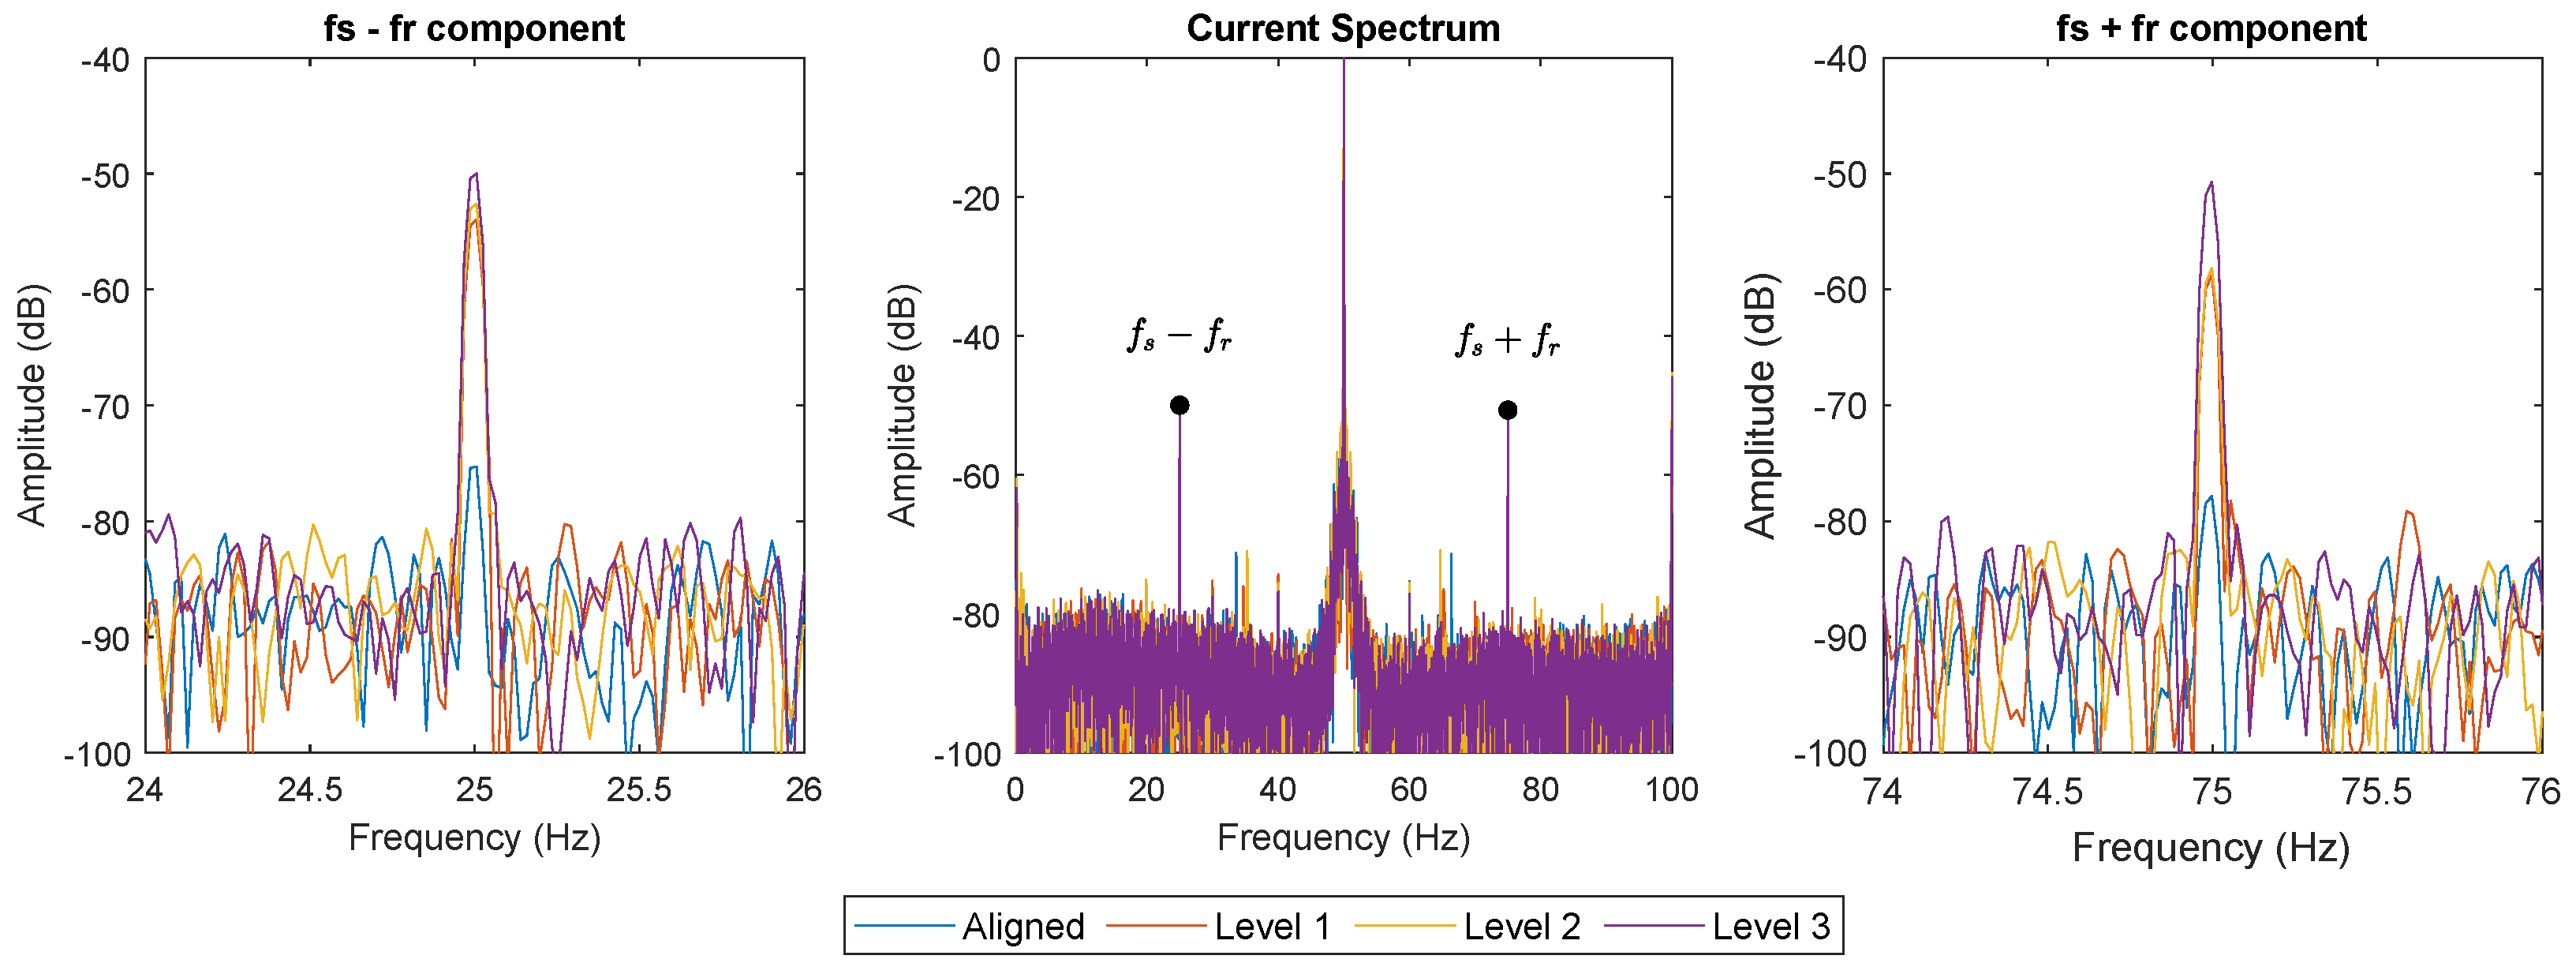
Figure 9 shows the FFT analyses of the current signals captured under the steady-state regime when the motor is operating at 1500 rpm with nominal load. The results show the amplitude of the rotational frequencies, and , for different levels of misalignment between the motor and the driven load. Note that the considered fault components ( and ) present clear differences in their amplitudes between the healthy case and faulty conditions. In the case of the component, the difference between the healthy condition and the most severe level of misalignment (level 3) is around 25 dB, which is an indication that the component is clearly related to misalignment. However, its amplitude remains stable between the different levels of misalignment. The same happens with the component. The difference between the healthy condition and the third level of misalignment is around 30 dB, similarly to what happen with the other component. Both components show an increase in their amplitude when there is a certain level of misalignment, but their amplitude does not increase as the level of misalignment worsens.
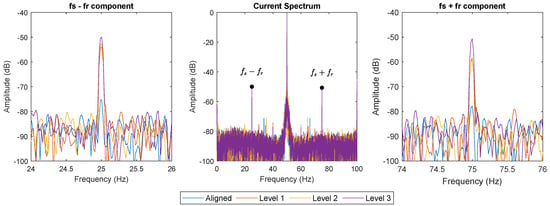
Figure 9.
FFT analyses of the current signals under a steady-state regime for the different levels of misalignment at 1500 rpm with nominal load.
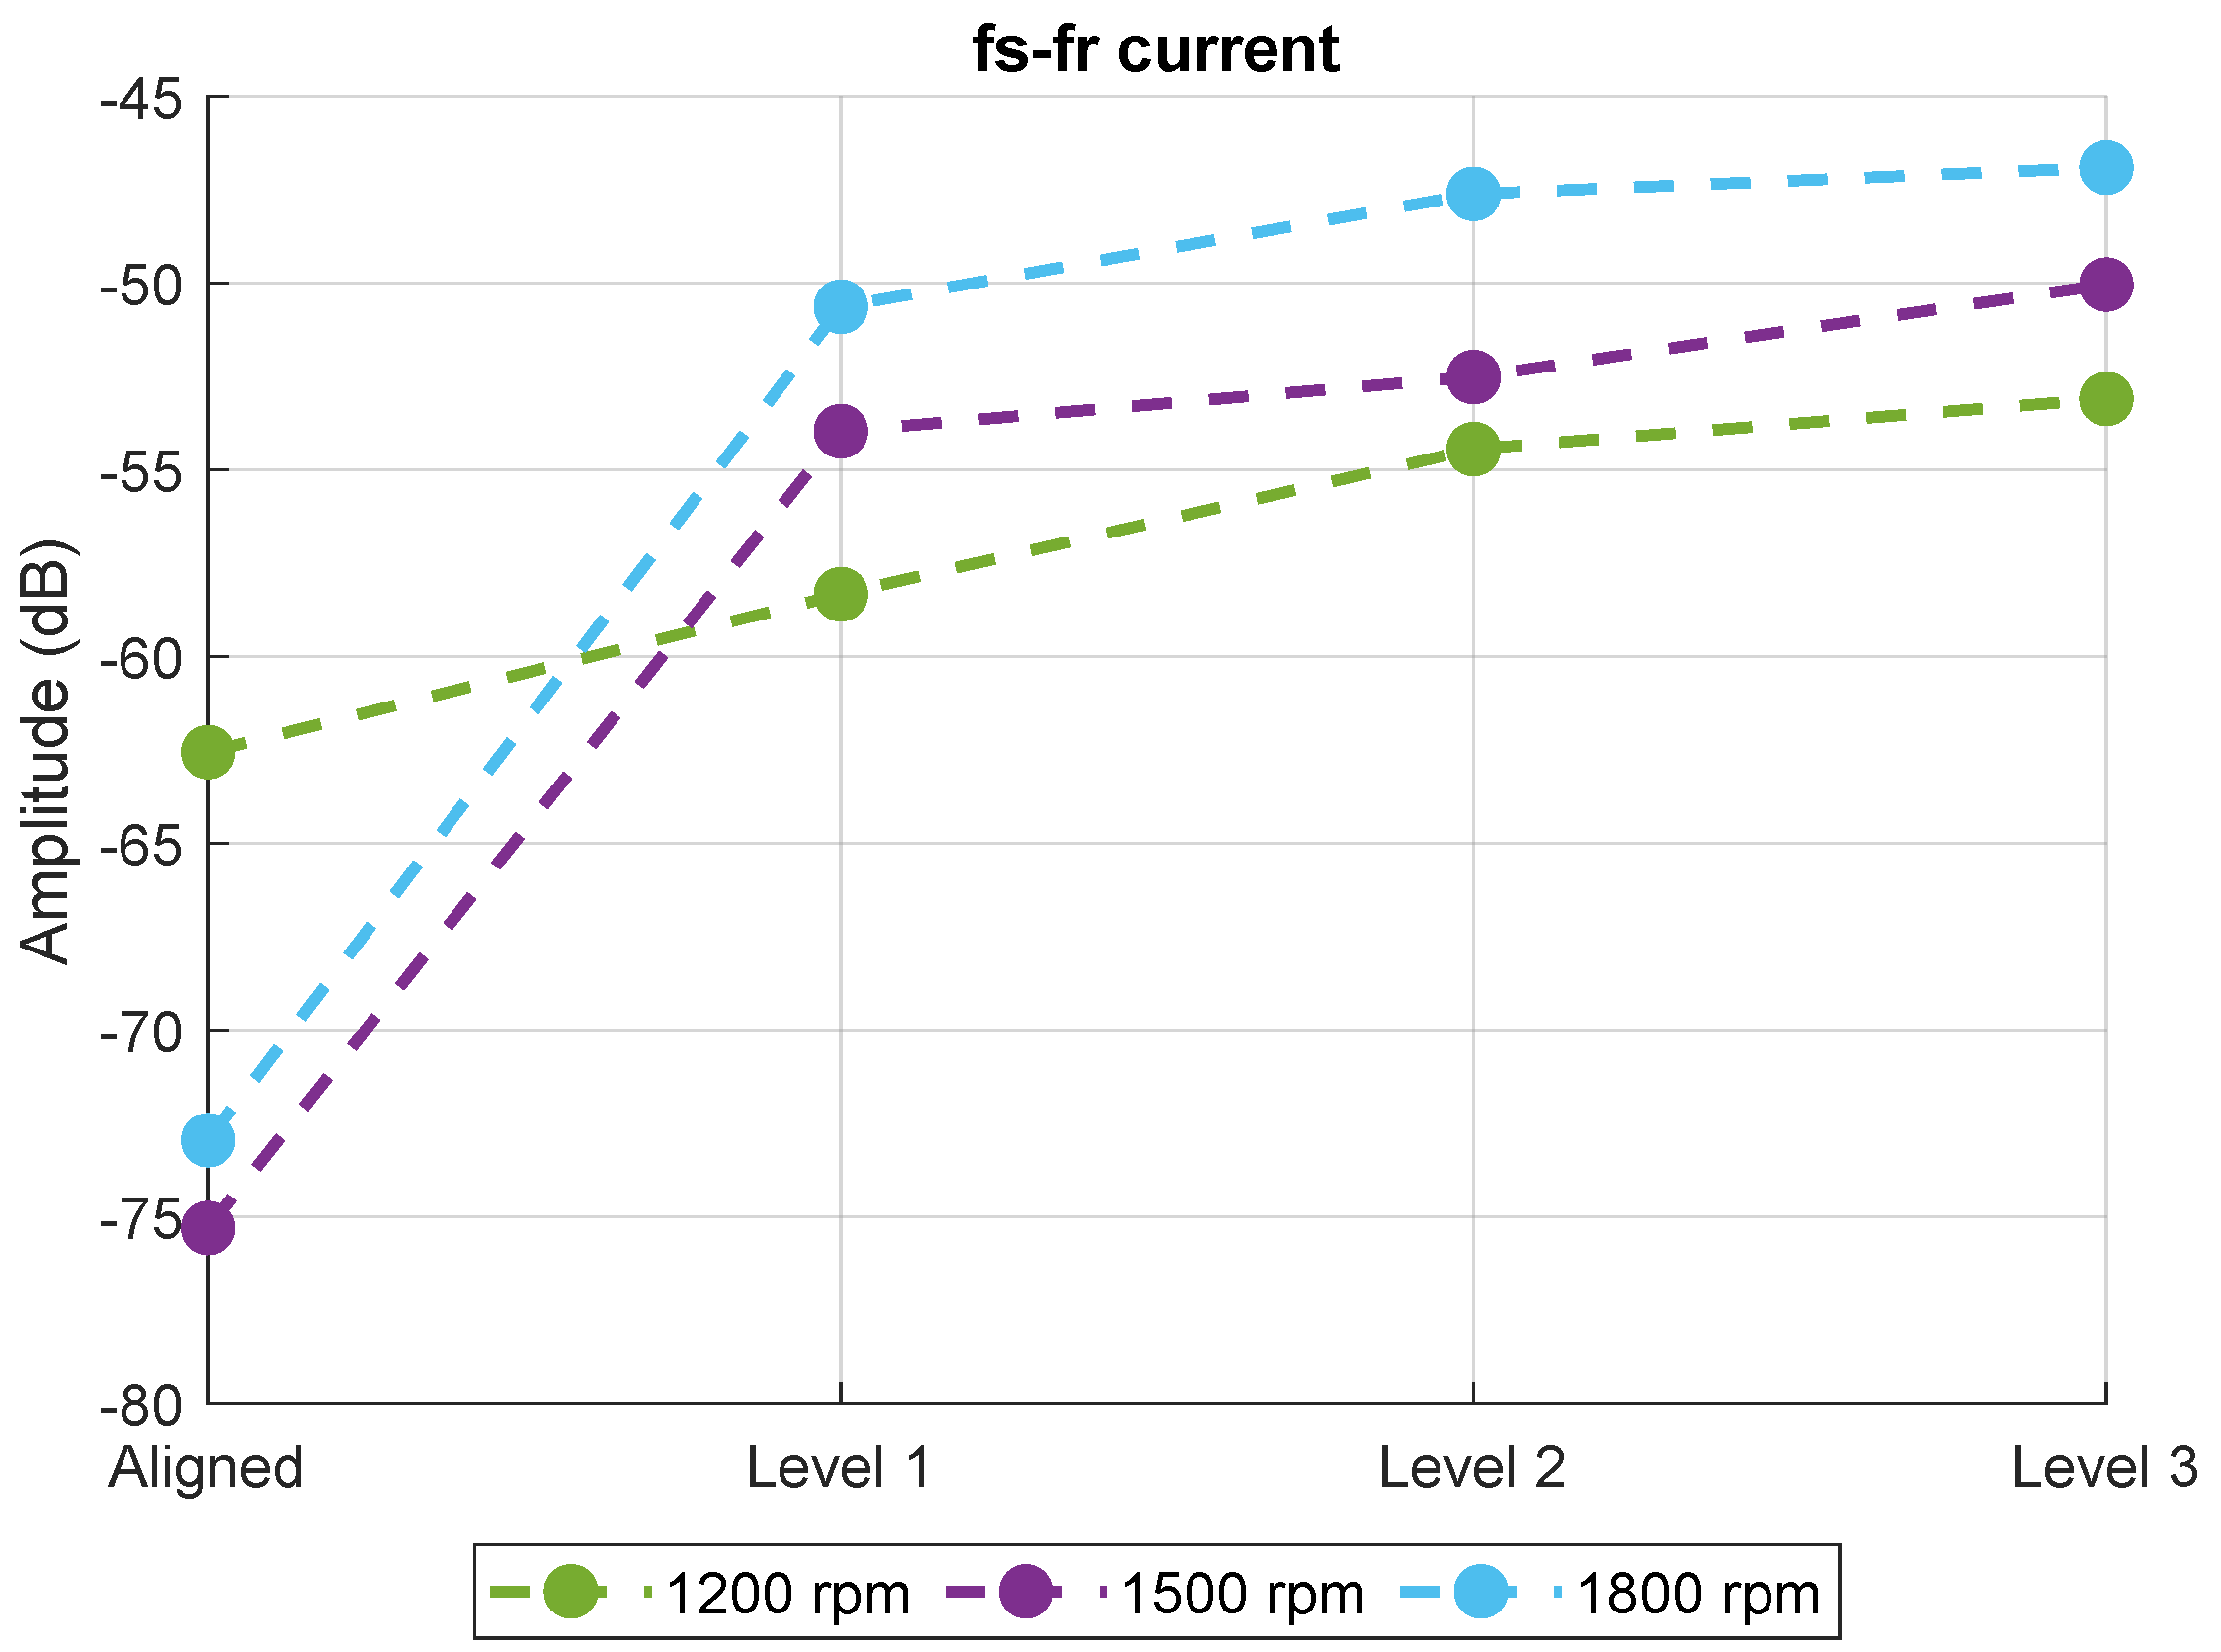
Figure 10 shows the amplitude of the component in the current spectrum when the motor is operating under different speeds at nominal load. The general trend is that the amplitude of this component increases when there is misalignment between the motor and the driven load. This effect is more significant at higher speeds; at 1500 rpm and 1800 rpm, the changes between the aligned and misaligned motor are more abrupt. However, these changes are smaller when the motor operates at lower speeds, specifically at 1200 rpm. Regarding the differences between failure levels, the most significant change occurs when the motor transitions from the healthy state to level 1 misalignment. As misalignment increases, the amplitude of this component shows a slight increase; however, these changes are quite small, and qualitatively, it remains relatively stable, especially at higher speeds. This suggests that this component is useful for detecting the presence of misalignment but is not sufficient to determine the severity of the fault.
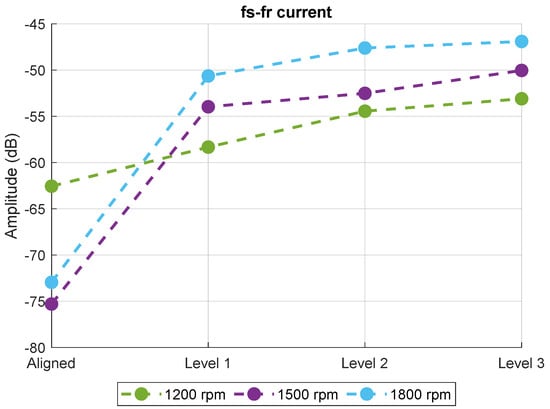
Figure 10.
− component of the current signal for aligned motor and different levels of misalignment under different speeds at nominal load.
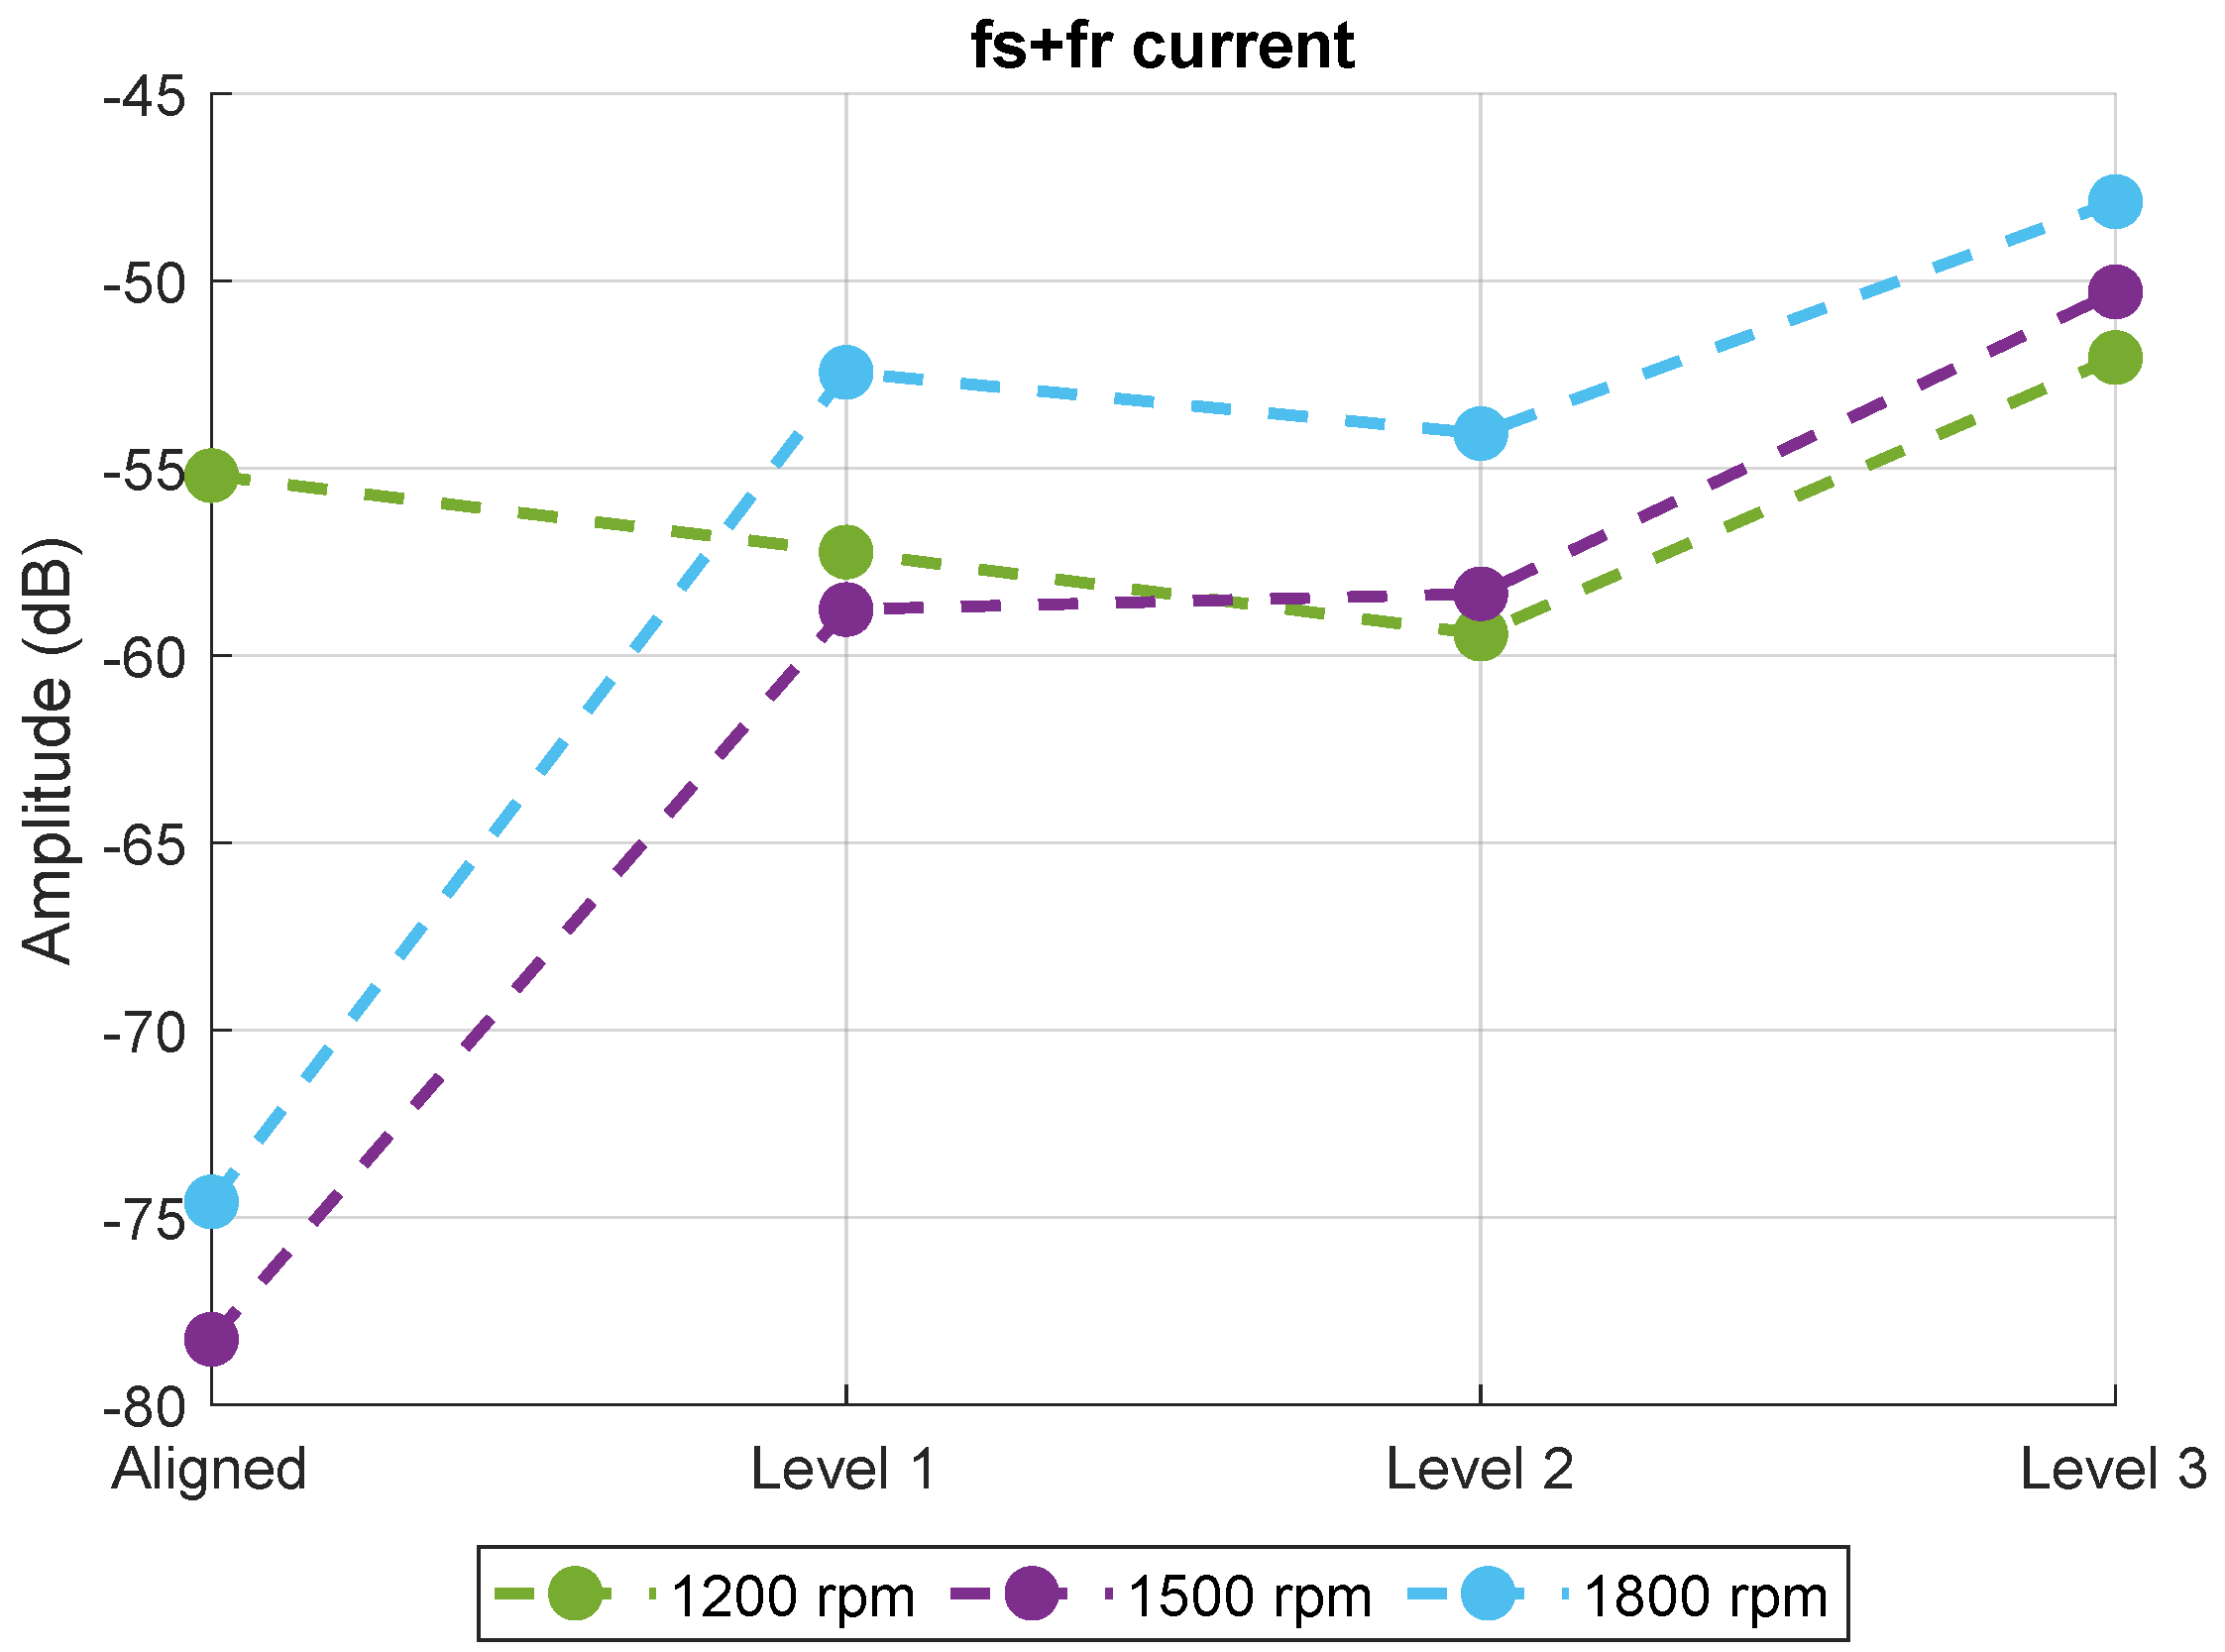
Figure 11 shows the amplitude of the component in the current spectrum when the motor is operating at different speeds under nominal load. Similarly to the component, at higher speeds (1500 rpm and 1800 rpm), the amplitude increases significantly when the motor transitions from being aligned to experiencing a slight level of misalignment. However, this does not occur at lower speeds. At 1200 rpm, the amplitude decreases in the healthy state and the initial misalignment levels, behaving erratically. In fact, the amplitude in the healthy state is around −55 dB, and when the motor operates at 1500 rpm with level 1 misalignment, the value is even lower. At 1200 rpm, the amplitude only increases when misalignment reaches the highest level, and even then, this increase is not significant, as it appears to rise by only 3 dB compared to the aligned motor. Regarding the differences between the various misalignment levels at higher speeds, at levels 1 and 2, the amplitude remains unchanged and even decreases slightly in the second case. These results broadly indicate that this component is not suitable for detecting the presence of misalignment in SynRMs.
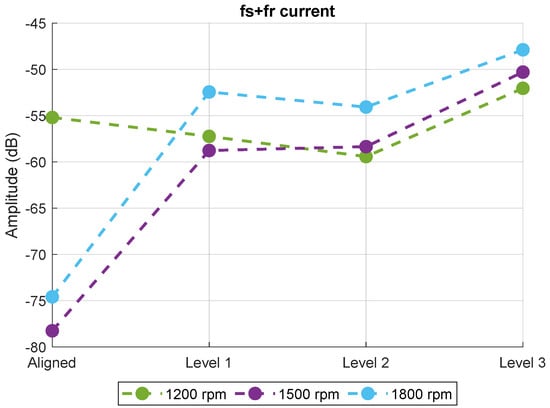
Figure 11.
component of the current signal for aligned motor and different levels of misalignment under different speeds at nominal load.
Table 8 shows the amplitude values of the components of the current signal when the motor operates at different speeds under nominal load. Additionally, this table also shows the percentage of increase or decrease in the amplitude for each of the studied fault levels (different levels of misalignment) compared to the healthy state (aligned motor). The general trend is that as the motor’s fault level increases, the amplitude of the components tends to rise in all cases. This indicates a correlation between the amplitude of these components and the presence of misalignment in the motor. Comparing the different speeds, it is observed that the increase in amplitude is much lower at lower speeds. In this case, at 1200 rpm, the amplitude of the component increases by only 15% when the motor has a level 3 misalignment, meaning the highest misalignment level. However, the component increases by just 5.7% under the same conditions and even exhibits erratic behavior at lower misalignment levels, sometimes decreasing in amplitude. When the motor operates at higher speeds, the amplitude increase is much more significant in all cases, suggesting that at higher motor speeds, the impact of the fault is more noticeable. Additionally, the increase in the component is particularly significant at these speeds, reaching up to 35% at the highest misalignment levels. Overall, the percentage increase in amplitude is greater as the fault level rises, although the variations between different levels are only about 4 dB for the component. In the case of the component, the changes between different misalignment levels do not follow a clear trend, as in some cases, the increase is greater at level 1 than at level 2.
Table 8.
Value of the current components and their increase with respect to the aligned case (as a percentage) for different speeds at nominal load.
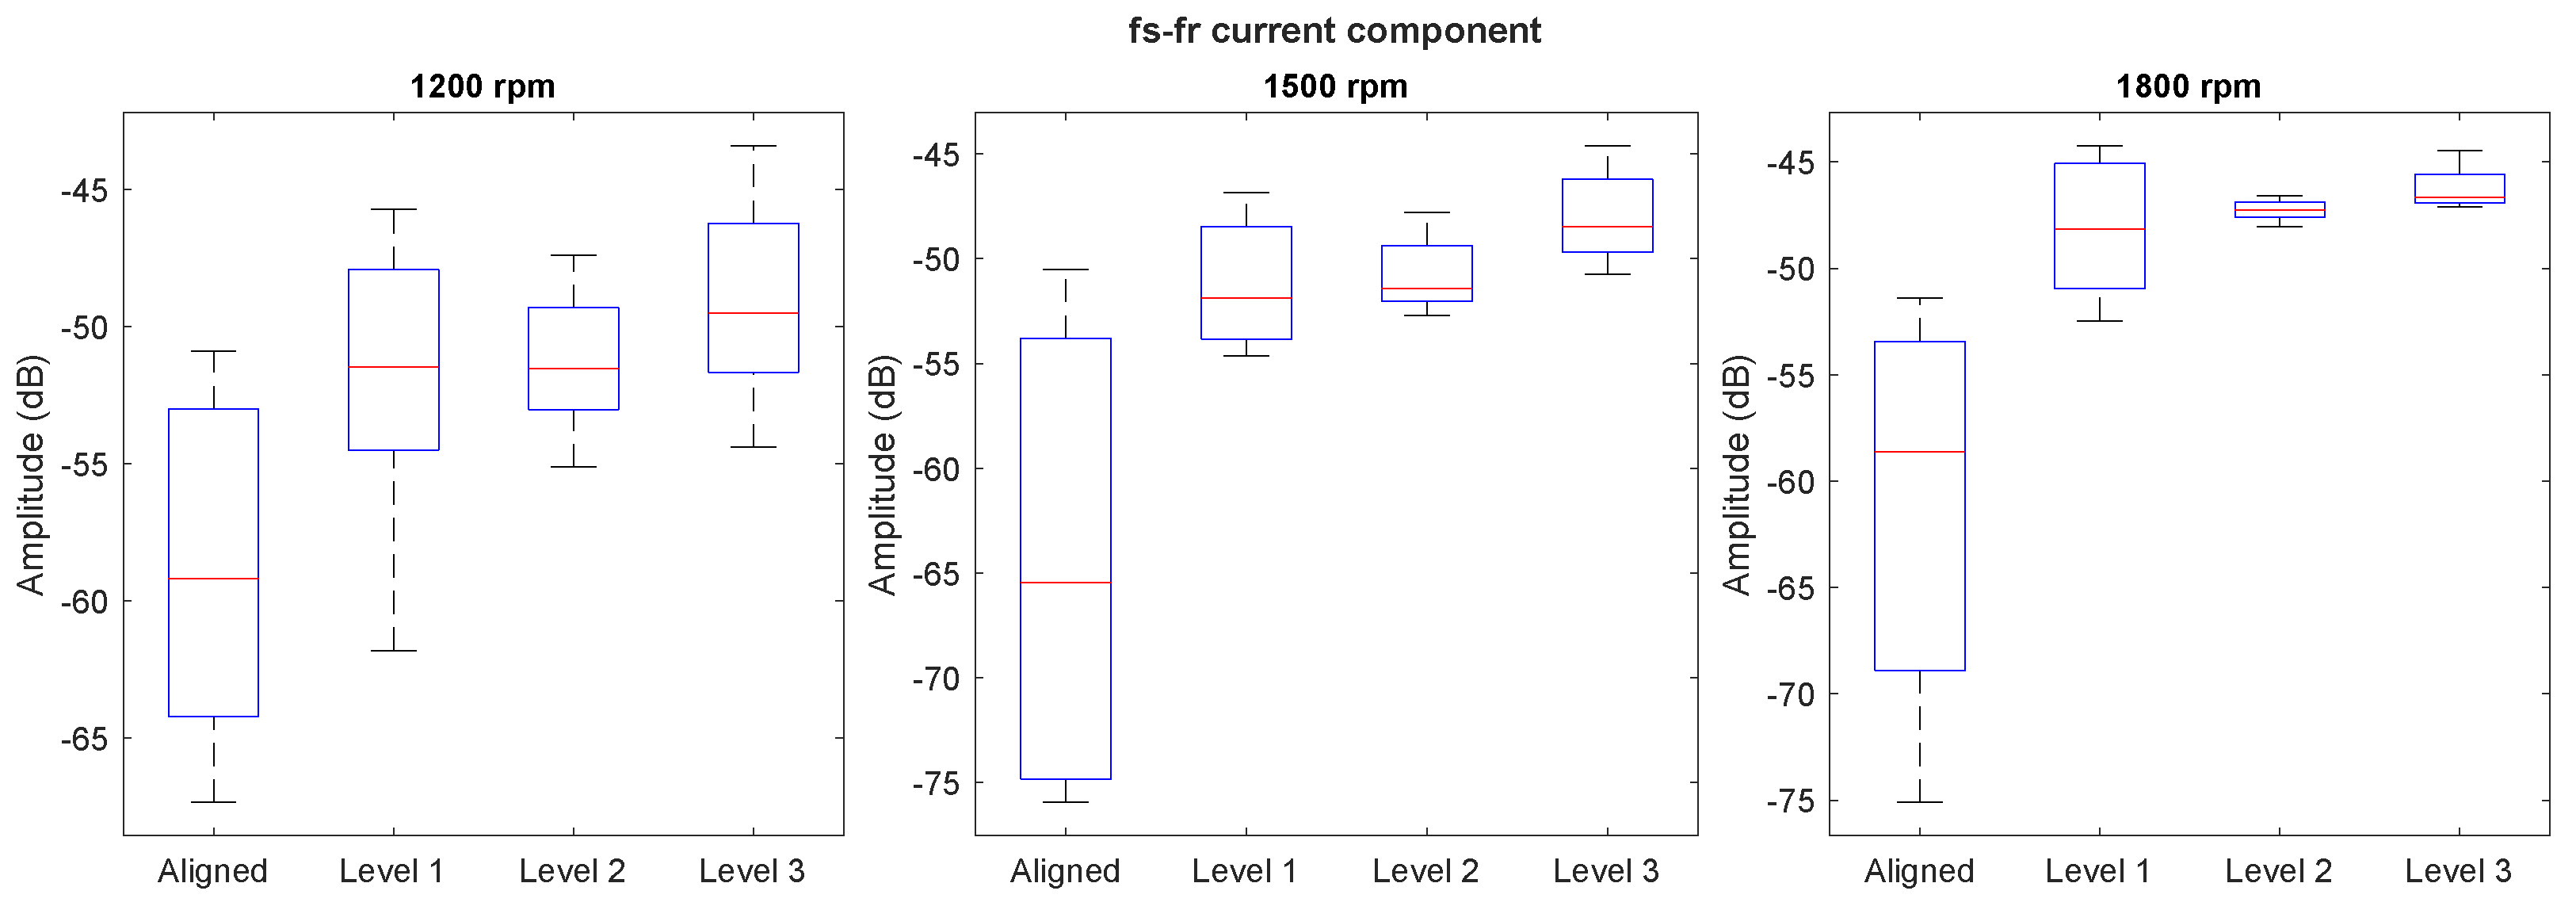
Figure 12 shows the boxplots corresponding to the distribution of the amplitude of the component during steady-state operation at different speeds and various load levels. When considering different load levels, the amplitude of the boxplots varies significantly, indicating that the amplitude of this component depends on the load level. Despite this, the component allows for distinguishing whether misalignment is present, as the median trend (represented by the red line in the boxplot) increases when a certain level of misalignment occurs. However, it is not entirely possible to differentiate between the various failure levels, as the amplitude remains stable across them.
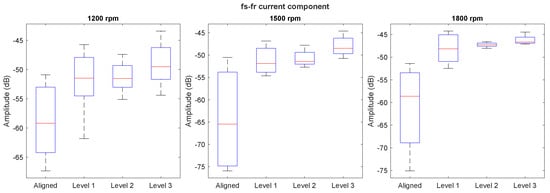
Figure 12.
Boxplots corresponding to the computation of − component amplitude (in dB) of the current signal during the steady−state regime under different speeds with several load levels.
5. Conclusions
The present manuscript explores the utilization of radial vibration signals and current signals during the steady-state regime to enhance the reliability of misalignment detection at different speed with several load levels in SynRMs. Based on the findings of this work, the following conclusions can be drawn:
- When comparing the results obtained from the acceleration and velocity of the vibration signal, the acceleration provides more information about the presence of misalignment. Unlike what usually happens at low frequencies, in this case, acceleration appears to be the most suitable magnitude for measuring vibration in the motor. The amplitude variations are greater when compared to those obtained using velocity. In general, the , , and components experience a higher increase if they are obtained from the acceleration signals instead of the velocity signal.
- The component of the vibration spectrum is the most suitable component to detect the presence of misalignment in this context. Its amplitude shows a clear correlation between the different levels of misalignment, allowing the determination of the severity of the fault.
- When analyzing the current signal, the and components display similar behavior at higher speeds. However, when the operational speed is 1200 rpm, the component shows erratic behavior, presenting a greater amplitude when misalignment is present compared to when the motor is fully aligned.
- In general, when comparing the different load levels, the results show that the amplitude changes under the same condition of the motor for both current and vibration signals. These results highlight the difficulty of determining a specific value from which misalignment in the motor can be considered—that is, it is difficult to propose a threshold from which the condition of the motor can be determined.
Future research could focus on a more in-depth study of the phenomenon responsible for the distributed components observed around the component and on how to distinguish between misalignment and eccentricity in SynRMs, as different types of faults produce the same effect in the current spectrum. Although this study focuses on misalignment detection in SynRMs, it is worth noting that the methodology could be extended to permanent magnet synchronous motors (PMSMs). Given the similarities in their synchronous operation, the proposed approach may be applicable to PMSMs with certain adaptations to account for their unique construction and fault characteristics. Future work could explore this possibility and evaluate the effectiveness of the diagnostic method for PMSM applications. Moreover, online implementation is an increasingly important area in the field of fault detection. Real-time monitoring and analysis of motor performance can significantly improve the ability to detect faults early, reducing downtime and maintenance costs. However, the feasibility of online implementation requires addressing several hardware-related challenges such as limitations in the trade-off between signal length and sampling frequency. The implementation of the proposed algorithm in on-line mode is envisioned for future works once the maturity level of misalignment diagnosis for SynRMs reaches an adequate maturity level.
Author Contributions
Conceptualization, A.N.-N. and J.E.R.-S.; methodology, A.N.-N.; software, A.N.-N. and V.B.-M.; validation, J.E.R.-S. and J.A.A.-D.; formal analysis, A.N.-N.; investigation, A.N.-N.; resources, J.A.A.-D.; data curation, A.N.-N. and V.B.-M.; writing—original draft preparation, A.N.-N.; writing—review and editing, J.E.R.-S.; visualization, A.N.-N.; supervision, J.E.R.-S. and J.A.A.-D.; project administration, J.A.A.-D.; funding acquisition, J.A.A.-D. All authors have read and agreed to the published version of the manuscript.
Funding
This research was funded by the Spanish ‘Ministerio de Ciencia e Innovacion’, Agencia Estatal de Investigacion and FEDER program in the framework of the ‘Proyectos de Generacion de Conocimiento 2021’ of the “Programa Estatal para Impulsar la Investigacion Cientifico-Tecnica y su Transferencia”, belonging to the “Plan Estatal de Investigacion Cientıfica, Tecnica y de Innovacion 2021–2023”. (ref: PID2021-122343OB-I00).
Data Availability Statement
Data are contained within the article.
Conflicts of Interest
The authors declare no conflicts of interest. The funders had no role in the design of the study; in the collection, analyses, or interpretation of data; in the writing of the manuscript; or in the decision to publish the results.
References
- Kostko, J.K. Polyphase reaction synchronous motors. J. Am. Inst. Electr. Eng. 1923, 42, 1162–1168. [Google Scholar] [CrossRef]
- Bianchi, N.; Babetto, C.; Bacco, G. Synchronous Reluctance Machines: Analysis, Optimization and Applications; The Institution of Engineering and Technology: London, UK, 2021. [Google Scholar] [CrossRef]
- Donaghy-Spargo, C. Synchronous reluctance motor technology: Industrial opportunities, challenges and future direction. Eng. Technol. Ref. 2016, 2016. [Google Scholar] [CrossRef]
- Li, Z.C.; Lu, J.P.; Wan, W.J.; Lan, Y.H.; Wang, Y.; Shi, D.; Hong, W.; Shen, J.X. Torque Ripple Reduction with Harmonics Superposition and Optimization for Axially-Segmented PM-Assisted Synchronous Reluctance Machines. IEEE Trans. Ind. Appl. 2025; early access. [Google Scholar] [CrossRef]
- He, T.; Wang, Y.; Bao, M.; Li, J.; Feng, S.; Qu, R. Design and Validation of a High-Efficiency Synchronous Reluctance Motor. IEEE Trans. Ind. Appl. 2025; early access. [Google Scholar] [CrossRef]
- Candelo-Zuluaga, C.; Riba, J.R.; Lopez-Torres, C.; Garcia, A. Detection of Inter-Turn Faults in Multi-Phase Ferrite-PM Assisted Synchronous Reluctance Machines. Energies 2019, 12, 2733. [Google Scholar] [CrossRef]
- Henriques, K.; Laadjal, K.; Cardoso, A.J.M. Inter-Turn Short-Circuit Fault Detection in Synchronous Reluctance Machines, Based on Current Analysis. Eng. Proc. 2022, 24, 23. [Google Scholar] [CrossRef]
- Mahmoudi, A.; Jlassi, I.; Cardoso, A.J.M.; Yahia, K.; Sahraoui, M. Inter-Turn Short-Circuit Faults Diagnosis in Synchronous Reluctance Machines, Using the Luenberger State Observer and Current’s Second-Order Harmonic. IEEE Trans. Ind. Electron. 2022, 69, 8420–8429. [Google Scholar] [CrossRef]
- Laadjal, K.; Bento, F.; Henriques, K.; Cardoso, A.J.M.; Sahraoui, M. A Novel Indicator-Based Online Diagnostics Technique of Interturn Short-Circuit Faults in Synchronous Reluctance Machines. IEEE J. Emerg. Sel. Top. Power Electron. 2023, 11, 3492–3501. [Google Scholar] [CrossRef]
- Krishna, M.S.R.; Seshadrinath, J. Model Based Stator Interturn Fault Analysis in Synchronous Reluctance Motor Drives. IEEE Trans. Ind. Appl. 2024, 60, 8878–8887. [Google Scholar] [CrossRef]
- Ilamparithi, T.; Nandi, S. Analysis, modeling and simulation of static eccentric reluctance synchronous motor. In Proceedings of the 8th IEEE Symposium on Diagnostics for Electrical Machines, Power Electronics & Drives, Bologna, Italy, 5–8 September 2011; pp. 45–50. [Google Scholar] [CrossRef]
- Ilamparithi, T.C.; Nandi, S. Detection of Eccentricity Faults in Three-Phase Reluctance Synchronous Motor. IEEE Trans. Ind. Appl. 2012, 48, 1307–1317. [Google Scholar] [CrossRef]
- Lopez-Torres, C.; Riba, J.R.; Garcia, A.; Romeral, L. Detection of Eccentricity Faults in Five-Phase Ferrite-PM Assisted Synchronous Reluctance Machines. Appl. Sci. 2017, 7, 565. [Google Scholar] [CrossRef]
- Navarro-Navarro, A.; Biot-Monterde, V.; Ruiz-Sarrió, J.E.; Antonino-Daviu, J. Detection of Stator Asymmetries in Synchronous Reluctance Motors through the Analysis of the Stator Current. In Proceedings of the 2024 International Conference on Electrical Machines (ICEM), Torino, Italy, 1–4 September 2024; pp. 1–6. [Google Scholar] [CrossRef]
- Creux, J.; Obeid, N.H.; Boileau, T.; Meibody-Tabar, F. PMASynRM Local Demagnetization Fault Detection Using Targeted Harmonic Excitation. IEEE Trans. Ind. Appl. 2025; early access. [Google Scholar] [CrossRef]
- Ehya, H.; Faiz, J. Introduction to Different Types of Faults in Synchronous Generators. In Electromagnetic Analysis and Condition Monitoring of Synchronous Generators; John Wiley & Sons, Inc.: Hoboken, NJ, USA, 2023; pp. 89–107. [Google Scholar] [CrossRef]
- Chai, N.; Yang, M.; Ren, B.; Huang, X.; Xu, D. Misalignment Detection of Rotor System Based on Adaptive Input-output Model Identification of Motor Speed. In Proceedings of the 2020 IEEE 9th International Power Electronics and Motion Control Conference (IPEMC2020-ECCE Asia), Nanjing, China, 29 November–2 December 2020; pp. 2266–2271. [Google Scholar] [CrossRef]
- Huang, X.; Yang, M.; Ren, B.; Chai, N.; Xu, D. Angle misalignment detection and its suppression algorithm in rotor system based on speed signal. In Proceedings of the 2020 IEEE 9th International Power Electronics and Motion Control Conference (IPEMC2020-ECCE Asia), Nanjing, China, 29 November–2 December 2020; pp. 3174–3179. [Google Scholar] [CrossRef]
- Frosini, L. Monitoring and Diagnostics of Electrical Machines and Drives: A State of the Art. In Proceedings of the 2019 IEEE Workshop on Electrical Machines Design, Control and Diagnosis (WEMDCD), Athens, Greece, 22–23 April 2019; Volume 1, pp. 169–176. [Google Scholar] [CrossRef]
- Zamudio-Ramirez, I.; Ramirez-Nunez, J.A.; Antonino-Daviu, J.; Osornio-Rios, R.A.; Quijano-Lopez, A.; Razik, H.; de Jesus Romero-Troncoso, R. Automatic Diagnosis of Electromechanical Faults in Induction Motors Based on the Transient Analysis of the Stray Flux via MUSIC Methods. IEEE Trans. Ind. Appl. 2020, 56, 3604–3613. [Google Scholar] [CrossRef]
- Finley, W.R.; Sauer, B.J.; Loutfi, M. Motor Vibration Problems: How to Diagnose and Correct Vibration Errors. IEEE Ind. Appl. Mag. 2015, 21, 14–28. [Google Scholar] [CrossRef]
- Tsypkin, M. The origin of the electromagnetic vibration of induction motors operating in modern industry: Practical experience—Analysis and diagnostics. In Proceedings of the 2016 Petroleum and Chemical Industry Technical Conference (PCIC), Philadelphia, PA, USA, 19–22 September 2016; pp. 1–9. [Google Scholar] [CrossRef]
- Habbouche, H.; Benkedjouh, T.; Amirat, Y.; Benbouzid, M. A Wavelet Transform-Based Transfer Learning Approach for Enhanced Shaft Misalignment Diagnosis in Rotating Machinery. Electronics 2025, 14, 341. [Google Scholar] [CrossRef]
- Zamudio-Ramírez, I.; Osornio-Rios, R.A.; Antonino-Daviu, J.A. Smart Sensor for Fault Detection in Induction Motors Based on the Combined Analysis of Stray-Flux and Current Signals: A Flexible, Robust Approach. IEEE Ind. Appl. Mag. 2022, 28, 56–66. [Google Scholar] [CrossRef]
- Orlowska-Kowalska, T.; Wolkiewicz, M.; Pietrzak, P.; Skowron, M.; Ewert, P.; Tarchala, G.; Krzysztofiak, M.; Kowalski, C.T. Fault Diagnosis and Fault-Tolerant Control of PMSM Drives–State of the Art and Future Challenges. IEEE Access 2022, 10, 59979–60024. [Google Scholar] [CrossRef]
- Thomson, W.T. Vibration Monitoring of Induction Motors. In Vibration Monitoring of Induction Motors: Practical Diagnosis of Faults via Industrial Case Studies; Cambridge University Press: Cambridge, UK, 2020; pp. i–ii. [Google Scholar]
- Battulga, B.; Shaikh, M.F.; Goktas, T.; Arkan, M.; Lee, S.B. Vibration-Based Identification of Mechanical Defects in Induction Motor-driven Systems During the Starting Transient. In Proceedings of the 2024 International Conference on Electrical Machines (ICEM), Torino, Italy, 1–4 September 2024; pp. 1–7. [Google Scholar] [CrossRef]
- Ruiz-Sarrio, J.E.; Biot-Monterde, V.; Madariaga-Cifuentes, C.; Navarro-Navarro, A.; Antonino-Daviu, J.A. On the Utilization of Radial Vibration Transient Signals for Induction Machine Misalignment Diagnosis. In Proceedings of the 2024 International Conference on Electrical Machines (ICEM), Torino, Italy, 1–4 September 2024; pp. 1–6. [Google Scholar] [CrossRef]
- Tavner, P.; Ran, P.L.; Penman, J.; Sedding, H. Condition Monitoring of Rotating Electrical Machines; The Institution of Engineering and Technology: London, UK, 2008. [Google Scholar] [CrossRef]
- Cabanas, M. Tecnicas para el Mantenimiento Diagnostico de Maquinas Electricas Rotativas; ACCESO RAPIDO, Marcombo: Barcelona, Spain, 1998. [Google Scholar]
- Pietrzak, P.; Wolkiewicz, M. Application of Spectral and Wavelet Analysis of Stator Current to Detect Angular Misalignment in PMSM Drive Systems. Power Electron. Drives 2021, 6, 42–60. [Google Scholar] [CrossRef]
- Goktas, T.; Arkan, M.; Gurusamy, V. A Comparative Study of Current, Vibration and Stray Magnetic Flux Based Detection for Parallel Misalignment Fault in Induction Motors. In Proceedings of the 2021 IEEE 13th International Symposium on Diagnostics for Electrical Machines, Power Electronics and Drives (SDEMPED), Dallas, TX, USA, 22–25 August 2021; Volume 1, pp. 11–16. [Google Scholar] [CrossRef]
- Rastegar Fatemi, J.R.F.; Henao, H.; Capolino, G.A.; Sieg-Zieba, S. Load influence on induction machine torque and stator current in case of shaft misalignment. In Proceedings of the 2009 35th Annual Conference of IEEE Industrial Electronics, Porto, Portugal, 3–5 November 2009; pp. 3449–3454. [Google Scholar] [CrossRef]
- Mantione, L.; Garcia-Calva, T.; Fernandez-Cavero, V.; Frosini, L.; Moriñigo-Sotelo, D. Broken Rotor Bar Detection in Closed Loop Inverter Fed Induction Motors Through Time-Frequency Techniques. IEEE Trans. Ind. Appl. 2025, 61, 209–217. [Google Scholar] [CrossRef]
- Roux, W.L.; Harley, R.G.; Habetler, T.G. Detecting faults in rotors of PM drives. IEEE Ind. Appl. Mag. 2008, 14, 23–31. [Google Scholar] [CrossRef]
- Kuemmlee, H.; Gross, T.; Kolerus, J. Machine vibrations and diagnostics the world of ISO. In Proceedings of the Industry Applications Society 60th Annual Petroleum and Chemical Industry Conference, Chicago, IL, USA, 23–25 September 2013; pp. 1–13. [Google Scholar] [CrossRef]
Disclaimer/Publisher’s Note: The statements, opinions and data contained in all publications are solely those of the individual author(s) and contributor(s) and not of MDPI and/or the editor(s). MDPI and/or the editor(s) disclaim responsibility for any injury to people or property resulting from any ideas, methods, instructions or products referred to in the content. |
© 2025 by the authors. Licensee MDPI, Basel, Switzerland. This article is an open access article distributed under the terms and conditions of the Creative Commons Attribution (CC BY) license (https://creativecommons.org/licenses/by/4.0/).