Abstract
Zero-Defect Manufacturing (ZDM) is a promising strategy for reducing errors in industrial processes, aligned with Industry 4.0 and digitalization, aiming to carry out processes correctly the first time. ZDM relies on digital tools, notably Artificial Intelligence (AI), to predict and prevent issues at both product and process levels. This study’s goal is to significantly reduce errors in machining large parts. It utilizes data from process models and in situ monitoring for AI-driven predictions. AI algorithms anticipate part deformation based on manufacturing data. Mechanistic models simulate milling processes, calculating tool deflection from cutting forces and assessing geometric and dimensional errors. Process monitoring provides real-time data to the models during execution. The research focuses on a high-value component from the oil and gas industry, serving as a test piece to predict geometric errors in machining based on the deviation of cutting forces using AI techniques. Specifically, an AISI 1095 steel forged flange, intentionally misaligned to introduce error, undergoes multiple milling operations, including 3-axis roughing and 5-axis finishing, with 3D scans after each stage to monitor progress and deviations. The work concludes that Support Vector Machine algorithms provide accurate results for the estimation of geometric errors from the machining forces.
1. Introduction
Within the new era of Industry 4.0 and digitalization, the concept of Zero-Defect Manufacturing (ZDM) is one of the most promising strategies to decrease and mitigate failures in industrial processes and states the philosophy of “doing things right the first time” [1]. It is based on the ability to incorporate digital technologies such as Artificial Intelligence (AI) and Machine Learning (ML) [2,3], as well as advancements in smart machine tool system architecture [4]. It aims to intelligently reduce defects through detection, prediction, prevention and correction strategies, ensuring both process and product quality [5].
While AI is a broad concept that usually refers to the ability of machines to solve tasks with something similar to human reasoning, Machine Learning (ML) is a branch of AI that uses large amounts of data to learn patterns that allow it to solve a specific problem through prediction. Furthermore, as a subset of ML, the concept of Deep Learning (DL) appears, in which multi-layered neural networks—modelled to work like the human brain—learn from large amounts of data [6].
However, there are many challenges to making the best use of AI. Data are among the most important ingredients in modelling based on AI algorithms and must be of high quality, with reliability based on accuracy and integrity [7]. Accuracy refers to the truthfulness of the data. It means that the data are true and free of errors, while integrity refers to the completeness of the data, meaning that the relevant fields are present, taking into account the intended uses. Collecting the right information is essential to running a productive AI model. Although the most widely used method is monitoring through signals captured over time from the process, this is a technique with certain limitations, as the signals only detect the potential presence of defects. To date, it is still difficult to quantitatively estimate the defect of a component only using signals captured by sensors [8]. Additionally, conventional mechanistic models, commonly used in manufacturing processes, can be used as input data and implemented in these AI models.
In recent decades, the modelling of milling processes has been performed by means of mechanistic models, which face numerous challenges inherent to the process. They are based on the use of experimentally obtained coefficients and enable the calculation of cutting forces, power consumption and torque, even for complete machining paths. Numerous mechanistic models have been developed for different types of tools and tool positioning, materials, processes and process features [9,10,11,12]. To develop a good mechanistic model, process monitoring is required during execution. In the case of machining, signals about relevant process variables and critical parameters (spindle vibrations, instantaneous power, axial force and torque, etc.) can be gathered online by machine integration of different sensors such as accelerometers, force sensors in tool or workpiece holders, and microphones, as well as CNC (computerized numerical control) inherent data that allow process monitoring in a less invasive manner [13]. These systems, exemplified by companies like Prometec [14] and Artis [15], utilize strategies based on signal boundaries, patterns, and real-time data analysis to optimize production processes, enhance quality control, and minimize costly downtime. The evolution over time of critical process variables, such as tool wear, temperature at the cutting point, etc., remain topics of great research interest [16] with the aim of further refining these monitoring systems and improving machining efficiency.
From the milling process point of view, one of the main challenges to be faced by mechanistic models is the static deformation of cutting tools during milling, which contributes considerably to geometric and/or dimensional errors of the resulting machining surface with respect to the required level, which can result in exceeding tolerances [17,18]. The mechanistic model of this study includes a module for the calculation of the tool deflection caused by cutting forces, which allows for estimating geometric and dimensional errors of the final product.
Besides that, another challenge for machining companies to manufacture high-added-value components is the initial positioning of blanks. These are usually produced by inexact processes such as casting or forging and do not have reference surfaces or features that facilitate the initial positioning process. Incorrect positioning could result in part rejection. Due to the high associated cost, initial alignment is performed meticulously, using time-consuming and labour-intensive techniques. They are generally performed on the machine itself and in a non-repetitive manner, which implies a high risk of error. In the literature, there are studies for the automatic alignment of parts, such as “virtual” Coordinate Measuring Machines (CMM) [19], and specific research to solve the mathematical problem of surface alignment taking into account the final geometry to avoid problems of material shortage, all without losing sight of the associated computational cost [20,21,22]. There are commercial reverse engineering systems that perform the adjustment of a surface obtained by 3D scanning to a design surface [23,24,25,26] and studies that carry this out by photogrammetry [27].
In the present study, the aim is a drastic reduction in defects and nonconformities in the machining of large-sized parts. The notion of large-sized parts varies according to industries and production needs, lacking a universal definition. Specifically, within the machining and machine–tool industry, large parts require advanced machinery, beyond standard milling machines, due to the tight dimensional tolerances relative to their size, which poses challenges in maintaining accuracy given the size of the machines themselves. Consequently, minimizing defects is crucial given the economic and environmental consequences of rejections. This focus on large parts underscores their importance in the machining industry, where precision and quality are paramount. To support digitalization, the information obtained from process models and in situ monitoring is required, which provides reliable and quality data and enables predictions using AI techniques. The research introduces a novel approach by applying ZDM principles and harnessing AI algorithms to mitigate errors in machining large parts within industrial settings. This innovative strategy acknowledges the inherent challenges in generalizing advanced techniques for seamless integration into diverse manufacturing environments. Despite the complexities involved in implementing AI-driven solutions, particularly due to the variability and intricacies of real-world production processes, this study serves as a pioneering effort to bridge the gap between theory and practice. Ultimately, the aim is to facilitate the widespread adoption of AI-driven approaches in industrial settings, thereby advancing the goal of achieving zero defects and enhancing operational efficiency in manufacturing processes. A high-value-added component from the oil and gas industry is selected as a test piece. It is a flange made of AISI 1095, manufactured by forging and afterward subjected to several machining operations by chip removal, in particular, 3-axis and 5-axis milling.
2. Methodology
In order to make a prediction of the geometric error in machining as a function of the deviation of the cutting forces, using Artificial Intelligence techniques, a test piece (case study) was defined consisting of the machining of a forged steel flange made of AISI 1095 steel from the oil and gas sector shown in Figure 1. A deviation in the initial positioning of the part was provoked to guarantee the presence of error, with a difference of 0.5 mm between the real position and the theoretical reference. Several milling operations were performed, in particular, 3-axis roughing and 5-axis finishing, the last one being the object of the study. After each machining stage, 3D scanning of the part was conducted.
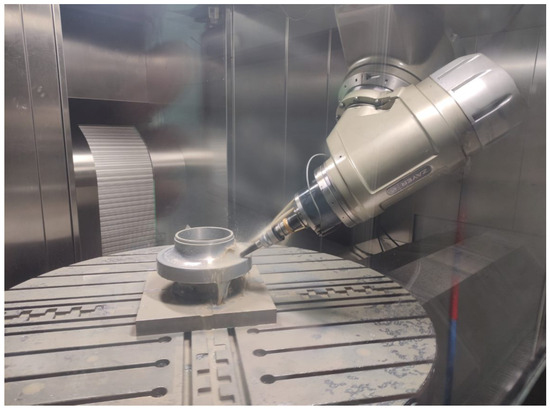
Figure 1.
Finished machining of the 5-axis forged flange on ZAYER’s Arion G machining center.
With the aim of minimizing errors due to other factors, such as clamping, machining has been carried out in two phases and with two clamps. Both have been performed using an inside jaw chuck. The first involves a strong clamp for roughing. The second clamp, for finishing operation, is a lighter one. Since in finishing, machining forces are much less aggressive, a clamp as strong as in roughing is not necessary. The clamping for finishing will not cause significant deformations in the piece.
This study corresponds to an actual cutting operation conducted in the industry; hence, the chosen cutting parameters mirror those used in production. For the 5-axis finishing process, a 25 mm diameter ball-nosed end mill with 2 cutting edges was utilized. The machining parameters employed include spindle rotational speed set at 3200 rpm and a feed rate of 1834 mm/min.
For the online monitoring of the 5-axis machining process in this study, the Spike® commercial system was used [28]. This system consists of a milling tool holder that integrates intelligent sensors for signal capture and allows recording variables such as axial force, bending moment or torque. The assembly was complemented by advanced software for diagnosing the condition of the cutting tool. This device makes it possible to determine different problems arising from the processes of wear, vibration, edge breakage, deflection, etc. A polar stress diagram was used to distinguish between the different cases. With this system, it was possible to see the forces per cutting edge live during the process. This provides permanent information on the condition of the cutting tool (wear) and the quality of the workpiece achieved.
Thus, the presented methodology was divided into the following phases shown in the flowchart in Figure 2:
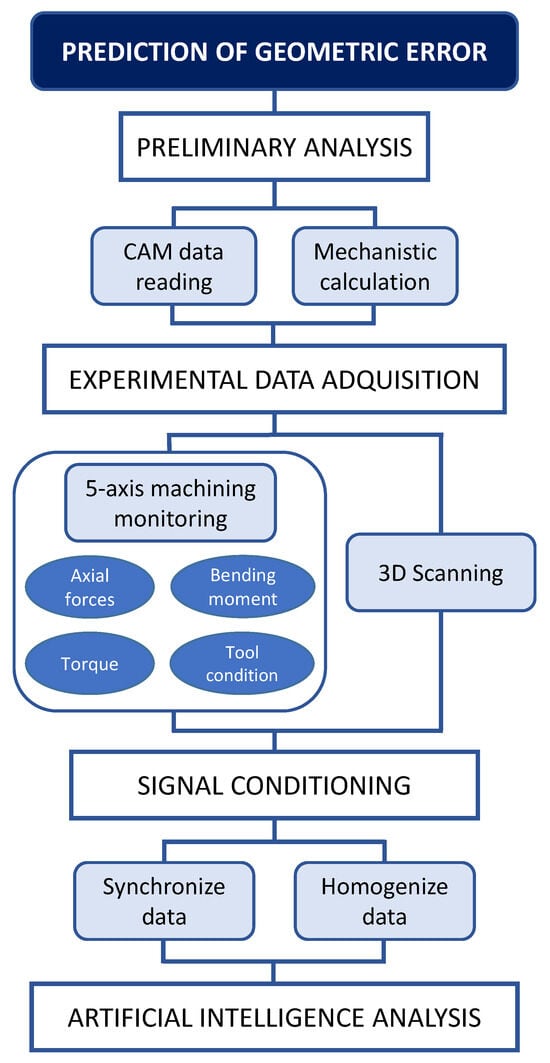
Figure 2.
Flowchart of the different phases of the methodology.
3. Mechanistic Modelling
The modelling of the milling process was the first of the input data sets that fed the AI study. The model used for this test piece is specific to milling operations and it is integrated in CAM software version 6.10, specifically in Siemens NX version 8.5. This CAD/CAM software version 1.0 is, in fact, the one used for programming the machining paths. The methodology and fundamentals of the model are those proposed by Sarasua et al. [29] and González-Barrio et al. [30]. Among the modelling stages, the following ones are of special interest:
- Pre-processing: Data reading from the CAM.
- The model is fed with a CL file (cutter location) containing the information about the tool, programmed path and cutting parameters, and an STL file with the initial blank geometry for the operation to be simulated.
- Processing: Mechanistic calculation.
- Based on the expressions presented by Altintas [31], the model starts from a differential discretization of the tool, obtains the tool–workpiece engagement domain and, finally, performs the summation of forces.
The results obtained from the previous model were the static cutting forces in the reference system of the part (Fx, Fy, Fz), the power and the torque. Subsequently, a new quasi-static module was implemented which, as a function of the static cutting forces (F) and the stiffness of the cutting tool (K), obtains the tool deflection over time (see Equation (1)). This formula is a modification of the bending formula (basic formula to calculate the deflection of a cantilever beam under a point load). The assumption is made that the stiffness of the tool remains constant, which depends on the cantilever length, the Young’s modulus of the material, and the second moment of the tool’s cross-sectional area. Since there is a transient period until equilibrium is reached, as the force affects the deflection and vice versa, a parameter C called deflection factor has been included to establish the relationship with the theoretical deflection according to the general formula. A theoretical centered deflection has been assumed, where the tool will find equilibrium at the center of the displacement generated by the cutting force, i.e., C = 2.
3.1. Simulated Area
The critical region of the forged steel flange with the biggest curvature was selected as the study area for the simulation of the machining. Among milling operations, the 5-axis finishing operation carried out in the aforementioned area of the test piece was simulated and analyzed. Figure 3 shows the programmed tool path and the blank part resulting from the roughing operation. This study is aligned with a real cutting operation carried out in the industry and, thus, the cutting parameters selected are those of production. The tool used for the 5-axis finishing operation is a 25 mm diameter ball-nosed end mill with two cutting edges. The machining parameters used are as follows: spindle rotational speed, S = 3200 rpm; feed rate, F = 1834 mm/min.
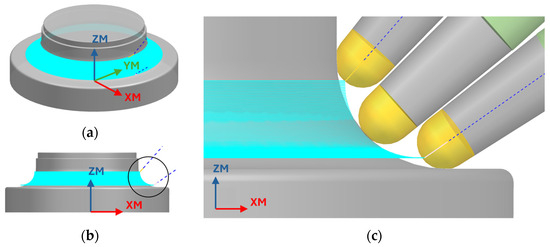
Figure 3.
(a,b) 3D geometry of the test piece and machining path (c) Zoom of the area shown in b: blank, path and tool in 3 positions.
3.2. Modelling Results
Figure 4 shows obtained results from the tool path simulation, under the cutting conditions specified in Section 3.1. Particularly, the cutting forces Fx, Fy and Fz in the workpiece coordinate system (Figure 4a), the tangential force on the tool (Figure 4c), the tool deflection (Figure 4b) and the power (Figure 4d) are shown.
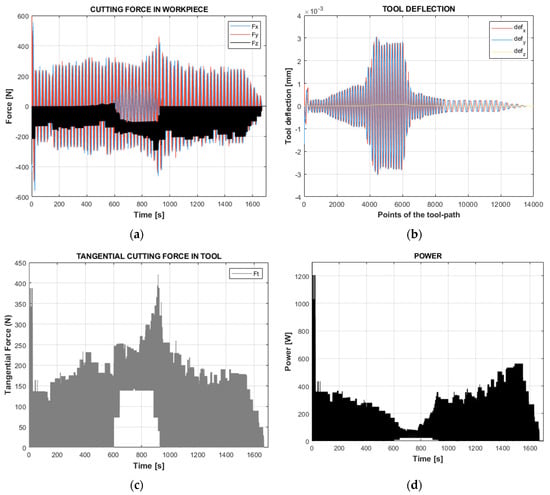
Figure 4.
Mechanistic simulation results. (a) Cutting forces in the workpiece coordinate system. (b) Quasi-static deflection of the tool. (c) Tangential force on tool. (d) Power.
In the central zone of the tool path, a slight increase in the cutting forces was observed, especially appreciable in the tangential force (Figure 4c), along with an increase in the tool deflection (Figure 4b). However, a drop in the power prediction was observed. This was because, in that zone, the end mill cuts with a part of the cutting edge close to the tip of the ball. It should be highlighted that the cutting speed was at its maximum in the widest area of the mill, while it was zero at the tip of the ball. Thus, in that intermediate zone of the tool path, the cutting speed of the active region of the tool was very low and this caused a drop in power.
In Figure 4c, in the intermediate position, it was appreciated that the tool–workpiece engagement happens in the ball tip zone. The power was obtained as a result of multiplying the tangential cutting force and the cutting speed. The cutting speed, in turn, depends on the rotational speed (constant) and the tool diameter (D) which is variable along the ball-nosed end mill’s profile.
4. Experimental Data Acquisition
This section details the experimental process carried out to manufacture the forged steel flange. The flange was milled on a ZAYER Arion G 5-axis machining center. The process was conducted in two stages: 3-axis roughing and 5-axis finishing, the last one being the object of the study. On the other hand, the online monitoring systems used for data acquisition during machining are described hereafter.
4.1. Three-Dimensional Scanning and Machining
A 3D scanning approach was developed using the Phoxi 3D Scanner M to obtain the forged steel flange, as illustrated in Figure 5. This equipment presents great versatility because the scanning area is variable depending on the distance to the part (i.e., it is 800 mm × 600 mm at a distance of 750 mm), with a resolution of 0.3 mm and a calibration accuracy of 0.1 mm. Additionally, it allows working with a collaborative robot. In this case, the selected robot is Fanuc R2000iB-210F, setting the scanner in Eye in Hand configuration as shown in Figure 5.
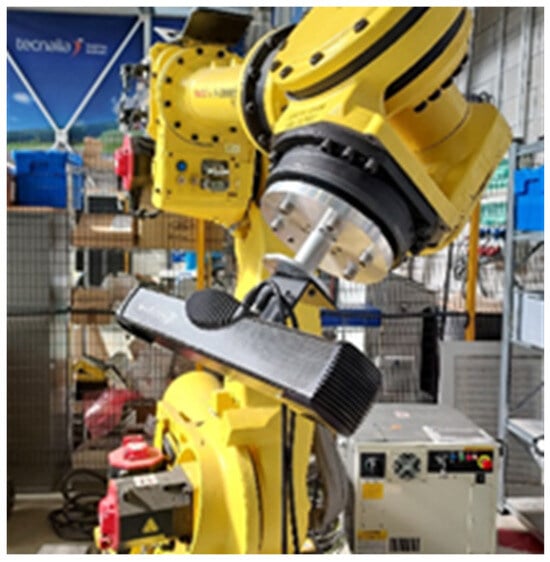
Figure 5.
Scanning and robot devices to scan the forged steel flange.
To select the scanning parameters, the scanner type is chosen considering the part dimensions and the working distance to minimize the number of scans to cover the whole part. The PhoXI M scanner’s field of view is about 800 × 600 mm over a distance of 850 mm. This field of view is enough to reconstruct the part using the selected robot. The internal parameters such as the shutting exposure of the laser power are selected considering the type of material and the surface brightness; in this case, the laser power selected is the maximum one, 4095, and it is recommended to decrease only when experiencing overexposure. The single pattern exposure is the duration of the projection of one pattern; in this case, it is set to 40 ms after experimental tests.
The matching strategy requires an automatic view registration to rebuild the flanges throughout the different machining processes and owing to the flange geometry. To obtain the optimal matching, two-point clouds were required to ensure the capture of the entire geometry. Nonetheless, at the same time, they must have a recognizable common surface to be able to put them together. These processes are automatically performed when the geometry presents distinguishable zones. An additional challenge needs to be considered when the component is symmetrical because a marker is needed on the piece to match the different views. In the selected case study, Figure 6 shows the matching reference to the optimal scanning process.
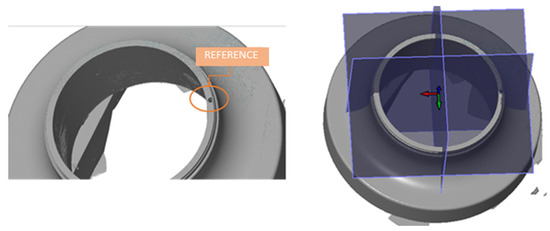
Figure 6.
Matching reference to scan the forged steel flange.
The main reason to select a marker is the ambiguity among references in the manufacturing stations. That is, this industrial component is symmetric and there could be an ambiguity between the reference-taking with the vision system and the reference-taking in the manufacturing machine when the piece moves from the scanning station to the machining stations. Therefore, a marker was selected in the industrial part as a distinguishable reference that defines the X-axis of the component.
The 3D scanner rebuilds the geometry according to the views and references the point cloud to the marker. To obtain the complete reconstruction of the component, the 3D scanner is moved around the piece and creates different views to rebuild the part. A total of eight capture positions on the flange were selected. In this way, the first view position was created by transforming the scanner positions into robot coordinates. Finally, an ICP algorithm was used to match the final profile.
Firstly, the rough part from the forging process (Figure 7a) was scanned in order to obtain a blank of revolution (ideal CAD geometry) that serves as the starting geometry when programming the machining by CAM in the roughing stage (Figure 7b).


Figure 7.
(a) Blank, result of the forging process. (b) CAD of ideal solid-of-revolution obtained from 3D scanning of the blank. (c) Roughed flange. (d) Matching profiles of roughed scanned flange. (e) Finished flange. (f) Matching profiles of finished scanned flange.
Secondly, the blank was roughed down by 3-axis milling. Thirdly, the rough-machined blank was scanned to obtain the intermediate geometry to ensure the dimensions after roughing. The system proved to be able to detect geometric errors of the order of a tenth of a mm. Figure 7c shows the flange after the rough machining process and Figure 7d shows the matching profile of the flange.
The industrial flange was placed and referenced again on the ZAYER Arion G machining center to proceed with the finishing operation. However, prior to the execution of the 5-axis finishing program, an offset of 0.5 mm in the X-axis direction deviation was induced on purpose in the part. Thus, the machining process removed more material than the theoretical on one side of the part and less material than estimated on the opposite side.
4.2. Online Monitoring during Machining
In this study, the Spike® commercial system was employed to conduct online monitoring of the 5-axis machining process [28]. This system incorporates a milling tool holder equipped with intelligent sensors for signal acquisition, enabling the recording of variables such as axial force, bending moment, or torque over time. In the subsequent analysis, the torque signal monitored by Spike® on a time basis was utilized. The set-up parameters for online monitoring are shown in Table 1.

Table 1.
Set-up parameters for online monitoring.
5. Signal Conditioning
In order to carry out the AI study and establish a correlation between process and product quality, the input data must be comparable, i.e., expressed with respect to a common reference variable. For this purpose, the process signals (theoretical and real) must be synchronized and homogenized. The Spike® capture system monitors variables on a time basis; it is not synchronized with the machine tool control. On the other hand, the theoretical signal from simulation can be obtained both on a theoretical time basis and on a tool path (position) basis.
In earlier studies, the power signal was monitored through the machine control. This allowed us to obtain the signal based on XYZ coordinates on the machine. However, when working in five axes, it is not possible to obtain the power from the control based on XYZ, since axes A and C are also moving. Thus, this monitoring method has been discarded, limiting the real signals to those obtained with the Spike® system.
Finally, the 3D scan of the part (quality) is focused on the point cloud describing the real geometry.
In order to be able to match theoretical signals, process signals and geometric quality, which feed the AI study, the following combination of signals was selected:
- Theoretical (simulated) tangential force on points of the tool path.
- Torque signal monitored by Spike® on a time basis.
- Three-dimensional point cloud of the scanned final part.
- CAD of the theoretical part.
A protocol was developed to transfer all the above signals to a single reference system on which the AI can work. In particular, the objective has been focused on transferring all the information to a geometric basis, specifically to the points that confer the theoretical surface to be able to perform the analysis using the minimum Euclidean distance.
6. Theoretical Tangential Force (Simulation)
The tangential force signal obtained from the simulation was originally located on the points describing the tool path in the CAM, although much more discretized. However, since all the tool position and velocity data are available for all the sections of the tool path, it is possible to calculate a theoretical time vector and express the theoretical tangential force signal as a function of time as well, as shown in Figure 8a.
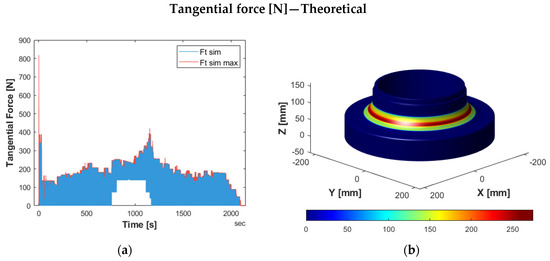
Figure 8.
Theoretical tangential force signal, obtained as a result of the mechanistic simulation. (a) Original tangential force signal and after application of maximum motion. (b) With color map, represented on the workpiece geometry.
On the other hand, the CLS tool path contains the positions of the tool’s tip. As mentioned above, the aim was to express the information based on the theoretical CAD surface. The tool’s tip does not usually correspond to the tool–workpiece contact point (see Figure 3). Therefore, it is necessary first to convert the points containing the positions of the ball tip to the centers of the ball. For this purpose, the ball diameter and the tool angle of inclination were considered. Then, the minimum Euclidean distance between the points on the surface of the workpiece and the tool centers was calculated and the contact points were obtained. The tangential force signal in space was expressed based on them (Figure 8b).
6.1. Real Tangential Force (Spike®)
The Spike® system is not able to measure the tangential force directly. It was therefore calculated from the measured torque. Specifically, the measured moment value is divided by an average tool radius of 10 mm in the case of the present case study.
In order to convert the tangential force from a base in the time regime to a base in XYZ coordinates, it is necessary to synchronize the real signal with the theoretical signal and linearize the XYZ values for each case. Thus, the point cloud obtained is the same as in the simulation stage over the tool path, but with a real value (Figure 9). It should be noted that instead of the original simulation tool path containing the positions of the tool’s tip, the tool path with the positions of the ball centers has been used (Figure 9a).
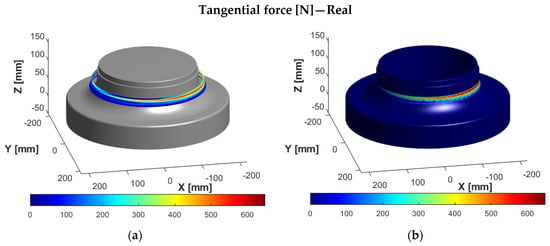
Figure 9.
Real tangential force calculated from the torque signal measured with Spike®, represented with color map on XYZ basis. (a) On the points of the tool path of the ball centers. (b) On the workpiece geometry.
In the colored tool path in Figure 9, it is observed that the tangential cutting forces are higher in the area of X(−) (on the right side of the workpiece, as shown in Figure 9) and lower in X(+) (left side of the workpiece, as shown in Figure 9). This is due to the induced offset of 0.5 mm, described in Section 3.1.
6.2. Dimensional Deviation: Scanned Part
The scanned part was evaluated by directly matching the clouds and obtaining the geometric error on the desired points (CAD). The matching strategy estimates the minimum distance between grid points against the CAD, taking into account that the reconstruction is focused on the selected marker—in this case, the inner drilled hole and the above surface. Figure 10 illustrates the geometric errors after roughing and scanning processes.
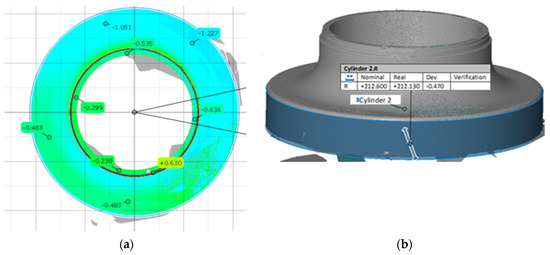
Figure 10.
(a) Geometric errors of 3D scanning of the finished flange. (b) Matching outer cylinder after finishing process.
The geometric errors in the positions of the inner and outer cylinder diameters are 0.032 mm and 0.079 mm, respectively. These results are reasonably reliable for detecting an artificial offset in the following machining process.
After finishing and scanning operations, the geometric errors were measured to detect the artificial offset before the finishing operation in the X direction, as observed in Figure 10a.
To verify the identification of the artificial offset, Figure 10b illustrates the geometric error of −0.47 mm in the X direction detected throughout the measurement of the outer cylinder.
All in all, the 3D scanning and the matching strategies are reasonably reliable as an input to predict a lack of quality during milling operations based on Artificial Intelligence strategies.
7. Analysis Using Artificial Intelligence (AI)
The aim of modelling this problem using AI algorithms is to be able to estimate or predict the deformation of the part using the data collected during its manufacture [32]. For that reason, supervised learning techniques are required, which are the part of ML that estimates a mathematical relationship between the input data and the output variable—in this case, the geometric deformation. All experimentation was carried out in R and data-driven modelling was conducted using functions from the caret library [33].
The data collected come from two different sources: on the one hand, the position in the 3-axis (x_sim, y_sim, z_sim) simulation by the theoretical model, the theoretical force (Fteor) and the recorded force (Ft) at each point and, on the other hand, the real trajectory (x_real, y_real, z_real) measured after machining. These data sets were aligned together using the minimal Euclidean distance between points. Finally, for each observation, an error was provided scanning the flange in eight positions and matching the geometric clouds according to the scanning and matching strategies (see Section 3.1. and Section 4.1.), respectively. The geometric error for each point was estimated by the minimum distance between each point of the scan and the closest point belonging to the CAD surface. In total, 15,665 multivariate data points are stored for the study and design of the predictive model of the geometric deformation of the part.
For the results obtained by these techniques to be robust, it is desirable to have high-quality data, as mentioned above. In manufacturing problems, apart from accuracy and completeness, it is important to consider the concept of repeatability. For the model to be rich in information, the training data should have sufficient variability so that the results can be transferred to industry [34].
In this case, it was treated as an experiment as a demonstrator but we stress the limitation of application in industry due to the lack of repeatability of the part. To simulate this repeatability, the position of the deformations was studied, and it was decided to partition the training and test set along the z-axis of the part.
Figure 11 shows the plan view of the part colored according to the deformation value found in each of the data collected. Clearly, the position has a direct relationship with the value of the error. However, introducing these variables as inputs to the model would give very accurate but unrealistic prediction results as known that the error will not appear in the same position when a new part is machined. For that reason, path variables cannot be used in the data model, and the only inputs available are those related to forces.
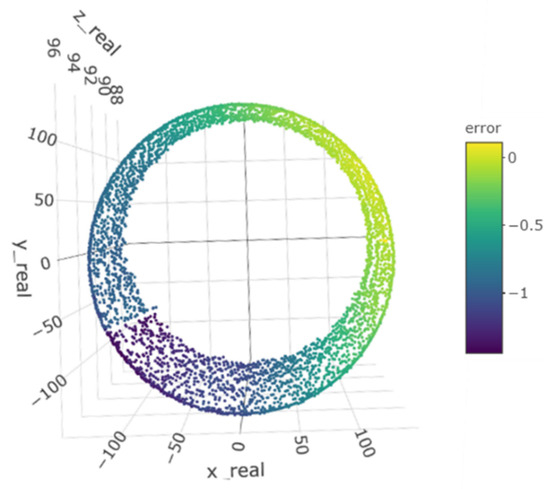
Figure 11.
Plan view of data points colored according to error values.
In order to have a similar distribution of the values of the geometric distortion in each of the training sets, it was decided to partition the data along the z-axis as shown in Figure 12. The z variable takes values between 95.60 mm and 114.96 mm and each partition has an altitude of 2.42 mm with a different color on the graph. After partitioning, each of the subsets contains between 1700 and 2300 observations and was used for one iteration in the training validation.
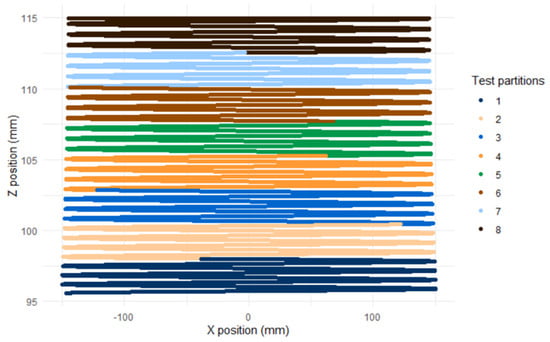
Figure 12.
Eight partitions of the data based on the values of the position on the z-axis.
Therefore, for the training of the models, the Leave-One-Group-Out Cross Validation (LOGOCV) technique is used. LOGOCV is a variation of k-fold cross-validation where the data was divided into groups, with one group left out as the validation set and the remaining groups used as the training set. This method is particularly useful when the goal is to assess the performance of the model for each group, being ideal for small sample sizes. LOGOCV can be computationally expensive, but it helps to reduce the risk of overfitting and provides more accurate estimates of the model performance [35].
Before starting the modelling, the error distribution shown in Figure 13 was checked on the left in the total data set and on the right, by partitions. It was observed that in both visualizations, there is an overlap of two normal distributions. The first one would have an approximate mean at −1 and the other one would have a slightly more doubtful mean at 0. The graph on the right shows that the distribution of errors is similar in all layers, which allows the model to be reasonably trained with the proposed approach.
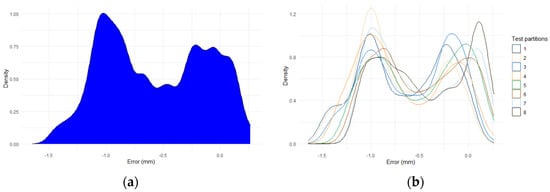
Figure 13.
Probability density function of the errors. (a) In the complete part. (b) In each of the partitions performed.
The force signal exhibits oscillatory behavior with decreasing variance throughout most of the process. The largest absolute errors appear at each of the peaks of these oscillations as can be seen in Figure 14a.
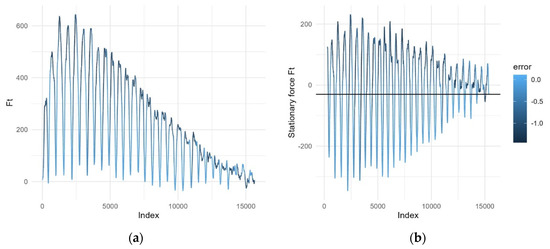
Figure 14.
(a) Evolution of the tangential force signal Ft, calculated from the torque signal measured with Spike®, colored according to the error appearing in each observation. (b) Stationary force signal Ft colored according to the error appearing in each observation.
To train a model based on data relating Ft to error, it should be possible to introduce a trend-following transform of the force. The oscillations occur with a periodicity of approximately 570 observations. This value was considered as the frequency of the time series and the series is decomposed into its trend and seasonality. The resulting stationary signal is shown in Figure 14b.
The linear relationship between the error and the other features, available to train the predictive model, has been calculated by Pearson’s correlation [36]. The transformation performed by converting the force signal to stationary (F_stationarity) proved to be a good strategy since this new feature had a correlation of −0.7 with the error, so it is intuited that it can be a good input for the predictive model. The other three correlation values are not considered significant enough to ensure a linear relationship. A correlation of 0.17 was obtained with the theoretical force (Fteor), −0.29 with the tangential force (Ft) and −0.07 with its derivative (Ft_diff). Despite these results, they are preserved in the study as there are ML algorithms that deal with more complex relationships.
Two different approaches were considered in supervised learning: regression and classification. In this case, the study was focused on regression since the output variable, the geometric error, took numerical values. Regression techniques aim to predict continuous numerical outcomes based on input features and linear regression (LR), support vector regression (SVR) and random forest regression (RF) were tested to predict the geometric error. LR and SVR with a linear kernel are chosen to assess whether relationships in the data are linear and straightforward. SVR with a radial kernel is selected for its ability to effectively capture non-linear relationships, especially in datasets with more complex and non-linear structures. The k-NN method is employed to evaluate similarities between inputs, leveraging the premise that similar instances tend to have similar values. Finally, RF is used to address datasets with complex and non-linear characteristics, owing to its ability to efficiently handle interaction among multiple predictor variables.
The metrics used to measure the prediction error were root mean squared error (RMSE) and mean absolute error (MAE), two common strategies to quantify the performance of the models. Dynamic time warping (DTW), an elastic measure of similarity in time series that allows the comparison of non-aligned values, is also used.
The results obtained in the experimentation with the regression algorithms are summarised in Table 2.

Table 2.
Prediction results of regression models.
- The first linear regression is the simplest possible with only one explanatory variable. In this case, a model was built taking as input the stationary tangential force (F_stationarity), the variable with a significant correlation with the geometric error. After validation by groups, the values of the three metrics and the average time taken to train each of the models were shown in the first row of the table.
- Given that the computational cost of the linear regression is very low, it was decided to re-train this algorithm by taking the four available inputs (Fteor, Ft, Ft_diff, F_stationarity) to check if the rest of the variables could provide relevant information to improve the estimates. Both the training cost and the static metrics of accuracy measurements remained at similar values. However, an improvement in the average DTW value was observed. This is because in some cases the magnitude of the error estimation did not improve, whereas the alignment did. The two most extreme cases are shown in Figure 15—firstly, the case of the partition where group 2 is kept for testing, where the DTW worsens by 119.07, and secondly, the case where group 8 is used for testing and the DTW is reduced by 63.47.
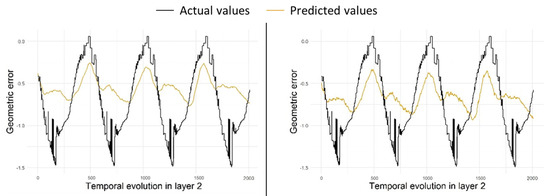
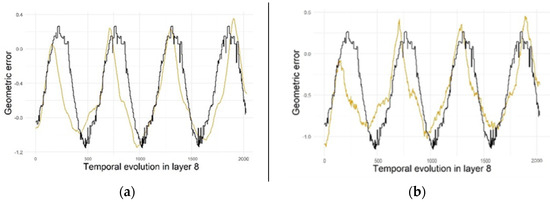 Figure 15. Prediction of errors in partitions 2 and 8 by linear regression. (a) Training the model with the stationary tangential force. (b) Training with the four available forces: theoretical force, tangential force and its derivative and stationary tangential force.
- 3.
- SVR with linear kernel is used when data are linearly separable. As the linear correlation with one of the features was high, it was a good option to test. However, keep in mind that if mostly one of the inputs was used in the regression, this algorithm eventually ends up estimating a line like the one obtained in the simple linear regression model. Therefore, as can be seen in the third row of the table, the accuracy results provided by the metrics were very similar to the previous cases but with a computational cost 33 times higher.
- 4.
- SVR with radial kernel, which is the most used and most successful kernel, due to its flexibility in separating observations.
- 5.
- The results obtained with the RF were not reported as they exceeded the accuracy obtained by the previous algorithms. In addition, most of the partitions exceeded 10 min of training. This excessive waiting time could make it difficult to maintain and update the predictive models if they are part of an industrial prediction system.
SVR with the radial kernel was the most accurate of the options tested in this experiment. Therefore, it was decided to tune the hyperparameters of this algorithm to achieve a setting that can be used in completely new parts without lowering the performance and without losing generality. The radial kernel function has the following mathematical expression:
The only hyperparameter specific to the kernel is gamma, which regulates the smoothness of the decision bands and controls the variance of the model. In addition, the common C parameter that regulates the margins is tuned to adjust the bands. It was decided to create a grid where ɣ = {0.3; 0.6; 0.8} and C = {0.5; 0.75} were tested. In all cases, the best result was obtained when ɣ = 0.8 and C = 0.75 with a mean RMSE of 0.21 and a mean MAE of 0.15. Those hyperparameters would be taken to train the final model in case of having more parts. A simulation test was conducted, and the results obtained for partition 5 are shown in Figure 16.
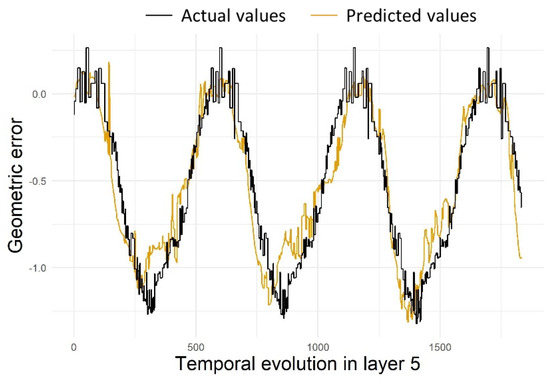
Figure 16.
Prediction of errors in partition 5 by Support Vector Machine with Gaussian kernel using ɣ = 0.8 and C = 0.75.
Although these results were promising and an accurate estimation of the errors was achieved by using only the features relating to the forces, it is necessary to point out that, for correct validation of the methods, it would be necessary to train the algorithm with data from different parts and to be able to validate it on a set of complete parts, instead of the procedure carried out by layers.
8. Conclusions
This paper presents a methodology and a case study combining theory and experimentation, in which AI techniques are used to predict the geometric error in machining as a function of the deviation of the cutting forces. For this purpose, a high-value-added component from the oil and gas industry was selected as a test piece: a flange made of AISI 1095, manufactured by forging and afterward subjected to 3- and 5-axis milling. To ensure the existence of errors to validate the proposed AI model, a deviation in the positioning of the part is provoked.
The present work reaches to the following conclusions:
- The use of AI requires digitalization and quality data, which are obtained from modelling and monitoring. On the one hand, the mechanistic simulation of milling operations results in cutting forces, power and deflection suffered by the tool. On the other hand, the Spike® device monitors the machining process and the 3D surface of the workpiece is scanned after each machining stage.
- The quality of the data is crucial but, in the case of being from a different nature or source, in order to carry out the AI study, the optimal synchronization and homogenization are needed to make them comparable. This issue depends not only on the data but on the previous knowledge of the process of study.
- In the mechanistic modelling phase, cutting forces in x,y,z, tangential cutting force, power and tool deflection were calculated for the region of the part with the biggest curvature. In the central zone of the tool path, an increase was observed in the cutting force and tool deflection, but a decrease was observed in the cutting power due to the low cutting velocity of the cutting tool area (close to the tip of the ball). It was observed that the feasibility of the mechanistic model will condition the feasibility of the AI model prediction.
- In the experimental data capture phase, the part underwent several 3D scans following each stage of machining. The artificial offset in the X direction induced during the finishing operation was estimated by the 3D scanning procedure. Consequently, this technique was considered acceptable for predicting a lack of quality during a cutting process. Furthermore, this approach can provide geometric information during the manufacturing operation to diagnose the final quality of the product.
- Regarding the AI study, in the layered exercise to simulate the training and test sets, it is concluded that the Support Vector Machine algorithm with a radial basis kernel provides accurate results for the estimation of geometric errors from the tangential forces.
As a future research thread, we aim to improve the AI-developed model using data from different high-added-value components with more complex geometries. In addition, filling in with extra data will improve the ML algorithm, and consequently the AI performance.
Author Contributions
Conceptualization, I.C.-M., M.G, D.F., A.G.D.V. and N.A.; methodology, M.G., D.F and A.G.D.V.; investigation, M.G., D.F., A.G.D.V. and N.A.; validation, M.G., D.F., A.G.D.V. and N.A.; writing—original draft preparation, I.C.-M., M.G, A.G.D.V. and H.G.; writing—review and editing, I.C.-M., M.G. and A.G.D.V.; project administration, D.F., A.G.D.V. and H.G. All authors have read and agreed to the published version of the manuscript.
Funding
This work was supported by the Department of Economic Development and Competitiveness of the Basque Government in the framework of ELKARTEK 2021–2022 project, OPTICED, Process Optimisation for Zero-Defect Manufacturing of Large Parts, under Grant KK-2021/00003.
Data Availability Statement
The data that support the findings of this study are available from the corresponding author, I.CM., upon reasonable request.
Acknowledgments
The contributions of all the members of the OPTICED team are gratefully acknowledged. The authors gratefully acknowledge the industrial flange received from ULMA Forged Solutions (ULMA Forja, S. Coop.).
Conflicts of Interest
The authors have no competing interests to declare that are relevant to the content of this article.
References
- Psarommatis, F.; May, G. A Systematic Analysis for Mapping Product-Oriented and Process-Oriented Zero-Defect Manufacturing (ZDM) in the Industry 4.0 Era. Sustainability 2023, 15, 12251. [Google Scholar] [CrossRef]
- Nti, I.K.; Adekoya, A.F.; Weyori, B.A.; Nyarko-Boateng, O. Applications of artificial intelligence in engineering and manufacturing: A systematic review. J. Intell. Manuf. 2021, 33, 1581–1601. [Google Scholar] [CrossRef]
- Ismail, M.; Mostafa, N.A.; El-assal, A. Quality monitoring in multistage manufacturing systems by using machine learning techniques. J. Intell. Manuf. 2022, 33, 2471–2486. [Google Scholar] [CrossRef]
- Jeon, B.; Yoon, J.S.; Um, J.; Suh, S.H. The architecture development of Industry 4.0 compliant smart machine tool system (SMTS). J. Intell. Manuf. 2020, 31, 1837–1859. [Google Scholar] [CrossRef]
- May, G.; Kiritsis, D. Zero Defect Manufacturing Strategies and Platform for Smart Factories of Industry 4.0. In Proceedings of the 4th International Conference on the Industry 4.0 Model for Advanced Manufacturing; Lecture Notes in Mechanical Engineering; Springer: Cham, Switzerland, 2019; pp. 142–152. [Google Scholar] [CrossRef]
- Goodfellow, I.; Bengio, Y.; Courville, A. Deep Learning; MIT Press: Cambridge, MA, USA, 2016. [Google Scholar]
- Garcia-Ceja, E.; Hugo, A.; Morin, B.; Hansen, P.O.; Martinsen, E.; Lam, A.N.; Haugen, O. Towards the Automation of a Chemical Sulphonation Process with Machine Learning. In Proceedings of the 2019 IEEE 7th International Conference on Control, Mechatronics and Automation, ICCMA 2019, Delft, The Netherlands, 6–8 November 2019; pp. 352–357. [Google Scholar] [CrossRef]
- Möhring, H.-C.; Wiederkehr, P.; Erkorkmaz, K.; Kakinuma, Y. Self-optimizing machining systems. CIRP Ann. 2020, 69, 740–763. [Google Scholar] [CrossRef]
- Urbikain, G.; Artetxe, E.; López de Lacalle, L.N. Numerical simulation of milling forces with barrel-shaped tools considering runout and tool inclination angles. Appl. Math. Model. 2017, 47, 619–636. [Google Scholar] [CrossRef]
- Li, Z.-L.; Niu, J.-B.; Wang, X.-Z.; Zhu, L.-M. Mechanistic modeling of five-axis machining with a general end mill considering cutter runout. Int. J. Mach. Tools Manuf. 2015, 96, 67–79. [Google Scholar] [CrossRef]
- Ducroux, E.; Fromentin, G.; Viprey, F.; Prat, D.; D’Acunto, A. New mechanistic cutting force model for milling additive manufactured Inconel 718 considering effects of tool wear evolution and actual tool geometry. J. Manuf. Process. 2021, 64, 67–80. [Google Scholar] [CrossRef]
- Sheikh-Ahmad, J.; He, Y.; Qin, L. Cutting force prediction in milling CFRPs with complex cutter geometries. J. Manuf. Process. 2019, 45, 720–731. [Google Scholar] [CrossRef]
- Schmucker, B.; Trautwein, F.; Semm, T.; Lechler, A.; Zaeh, M.F.; Verl, A. Implementation of an Intelligent System Architecture for Process Monitoring of Machine Tools. Procedia CIRP 2020, 96, 342–346. [Google Scholar] [CrossRef]
- Prometec. Available online: https://www.prometec.net/ (accessed on 22 March 2024).
- Artis. Available online: https://new.artis.de/eng/ (accessed on 22 March 2024).
- Arriandiaga, A.; Portillo, E.; Sánchez, J.A.; Cabanes, I.; Pombo, I. Virtual sensors for on-line wheel wear and part roughness measurement in the grinding process. Sensors 2014, 14, 8756–8778. [Google Scholar] [CrossRef] [PubMed]
- Agarwal, A.; Desai, K.A. Tool and workpiece deflection induced flatness errors in milling of thin-walled components. Procedia CIRP 2020, 93, 1411–1416. [Google Scholar] [CrossRef]
- Zhang, X.; Yu, T.; Wang, W. Prediction of cutting forces and instantaneous tool deflection in micro end milling by considering tool run-out. Int. J. Mech. Sci. 2018, 136, 124–133. [Google Scholar] [CrossRef]
- Cuypers, W.; van Gestel, N.; Voet, A.; Kruth, J.P.; Mingneau, J.; Bleys, P. Optical measurement techniques for mobile and large-scale dimensional metrology. Opt. Lasers Eng. 2009, 47, 292–300. [Google Scholar] [CrossRef]
- Wan, N.; Shen, X.; Chang, Z.; Chen, Z.C. A new localization theory of adaptive machining of near-net-shape blades. Chin. J. Aeronaut. 2021, 34, 18–32. [Google Scholar] [CrossRef]
- Lei, P.; Zheng, L. An automated in-situ alignment approach for finish machining assembly interfaces of large-scale components. Robot. Comput. Manuf. 2017, 46, 130–143. [Google Scholar] [CrossRef]
- Kovács, I.; Várady, T. Constrained fitting with free-form curves and surfaces. Comput. -Aided Des. 2020, 122, 102816. [Google Scholar] [CrossRef]
- Autodesk-Fusion 360. Available online: https://www.autodesk.com/products/fusion-360/overview (accessed on 7 February 2023).
- Creaform 3D. Available online: https://www.creaform3d.com/en (accessed on 7 February 2023).
- Software for Structured Light Scanners|Hexagon. Available online: https://hexagon.com/products/product-groups/measurement-inspection-hardware/structured-light-scanners/software-structured-light-scanners (accessed on 7 February 2023).
- 3D Software and Its Application. Available online: https://www.gom.com/en/topics/3d-software (accessed on 7 February 2023).
- Mendikute, A.; Yagüe-Fabra, J.A.; Zatarain, M.; Bertelsen, Á.; Leizea, I. Self-Calibrated In-Process photogrammetry for large raw part measurement and alignment before machining. Sensors 2017, 17, 2066. [Google Scholar] [CrossRef]
- Pro-Micron–Experten für Drahtlose Sensorsysteme. Available online: https://www.pro-micron.de/ (accessed on 7 February 2023).
- Sarasua, J.A.; Cascon, I. Integration of machining mechanistic models into CAM software. J. Mach. Eng. 2014, 14, 5–17. [Google Scholar]
- Gonzalez-Barrio, H.; Cascon-Moran, I.; Ealo, J.A.; Santos-Barrena, F.; Ostra-Beldarrain, T.; Cuesta-Zabaljauregui, M.; Madariaga-Zabala, A.; Arrazola-Arriola, P.; Lopez de Lacalle, L.N. A reliable machining process by means of intensive use of modelling and process monitoring: Approach 2025. Dyna 2018, 93, 689–696. [Google Scholar] [CrossRef]
- Altintas, Y. Manufacturing Automation: Metal Cutting Mechanics, Machine Tool Vibrations, and CNC Design; Cambridge University Press: Cambridge, UK, 2000; Available online: https://books.google.es/books?id=Xn9Y71zm6JAC (accessed on 27 February 2024).
- Arinez, J.F.; Chang, Q.; Gao, R.X.; Xu, C.; Zhang, J. Artificial Intelligence in Advanced Manufacturing: Current Status and Future Outlook. J. Manuf. Sci. Eng. 2020, 142, 110804. [Google Scholar] [CrossRef]
- Kuhn, M. Building predictive models in R using the caret package. J. Stat. Softw. 2008, 28, 1–26. [Google Scholar] [CrossRef]
- Bhargava, C. (Ed.) AI Techniques for Reliability Prediction for Electronic Components; IGI Global: Hershey, PA, USA, 2020. [Google Scholar] [CrossRef]
- Liu, Z.; Rue, H. Leave-group-out cross-validation for latent Gaussian models. arXiv 2022, arXiv:2210.04482. [Google Scholar] [CrossRef]
- Sedgwick, P. Pearson’s correlation coefficient. BMJ 2012, 345, e4483. [Google Scholar] [CrossRef]
Disclaimer/Publisher’s Note: The statements, opinions and data contained in all publications are solely those of the individual author(s) and contributor(s) and not of MDPI and/or the editor(s). MDPI and/or the editor(s) disclaim responsibility for any injury to people or property resulting from any ideas, methods, instructions or products referred to in the content. |
© 2024 by the authors. Licensee MDPI, Basel, Switzerland. This article is an open access article distributed under the terms and conditions of the Creative Commons Attribution (CC BY) license (https://creativecommons.org/licenses/by/4.0/).