Article

In Situ Measurement and Mapping of Lubricant Film Temperature in Cylindrical Roller Thrust Bearings Using Thin-Film Sensors

by
Manjunath Manjunath
1,2,*,
Patrick De Baets
1,2 and
Dieter Fauconnier
1,2
1
Soete Laboratory, Department of Electromechanical, Systems & Metal Engineering, Faculty of Engineering and Architecture, Ghent University, Technologiepark 903, 9052 Ghent, Belgium
2
Flanders Make @ UGent-Core Lab MIRO, Ghent University, 9000 Ghent, Belgium
*
Author to whom correspondence should be addressed.
Machines 2025, 13(4), 297; https://doi.org/10.3390/machines13040297
Submission received: 4 March 2025 / Revised: 31 March 2025 / Accepted: 1 April 2025 / Published: 2 April 2025

Abstract

This study explores the in situ measurement of contact temperature in thermo-elastohydrodynamic lubrication (TEHL) within cylindrical roller thrust bearings (CRTBs) utilizing vapour-deposited resistive thin-film sensors. The sensors, optimized for compactness and high spatial resolution, were strategically embedded on the stationary bearing raceways near the outer, inner, and mean radius. This configuration enabled a precise measurement of temperature variations in both pure rolling and rolling–sliding regions of the CRTBs. The experimental results revealed a consistent decrease in temperature from the inner and outer radius zones towards the mean radius as the slip-to-roll ratio (SRR) decreased in these regions. Temperature profiles showed an early rise in the inlet zone attributed to thermal inlet shear. At higher speeds, a secondary temperature peak indicative of full-film lubrication was observed in the outlet zone immediately following the Hertzian contact. The study further shows the influence of surface pressure, shear rates, sliding friction, and circumferential speed on contact temperature dynamics, offering insights into their complex interplay. Additionally, viscosity variations due to different oil temperatures were found to critically affect the rate of temperature rise and the propensity for mixed friction phenomena. A higher viscosity resulted in an earlier onset of the temperature rise in the contact, while a lower viscosity and higher speeds promote mixed lubrication, leading to reduced contact film temperatures. These findings provide valuable insights into the behaviour of CRTB-lubricated contacts under various operating conditions and serve as crucial validation data for advanced TEHL computational models.

1. Introduction

Rolling element bearings are pivotal in powertrain systems across automotive, industrial machinery, and wind turbine applications. Their performance directly impacts the efficiency, reliability, and durability of machinery, playing a significant role in the Total Cost of Ownership (TCO). With the increasing demand for higher power and torque density in modern powertrains, roller bearings face critical challenges, operating near their limits in terms of power transfer, load capacity, and energy efficiency [1].
Although roller bearings intrinsically rely on a pure rolling motion during rotation, the occurrence of micro- and macro-slip in the initial line contacts between the rollers and the raceways—depending on the bearing’s type and geometry—is attributed to sliding friction [2,3,4]. Ideally, thermo-elastohydrodynamic lubrication (TEHL) is achieved in the contacts, which implies that the opposing metal surfaces are separated by an ultra-thin lubricant film, barely 50 nm to 1 μm in thickness, depending on the contact load, entrainment velocity, and the thermomechanical properties of the lubricant, amongst others. In heavily loaded roller bearings, contact pressures may reach values up to 3 GPa. These extreme pressures cause the lubricant viscosity to increase by several orders of magnitude, which is consistent with elastohydrodynamic lubrication (EHL) regimes. Due to the high contact pressures, primarily elastic local surface deformation of the contact patch is induced, although localized subsurface plasticity may occur, typically as a result of stress concentration near inclusions in the bearing steel. When roller slippage occurs—whether due to structural factors or roller inertia—high shear rates are induced, causing the contact temperatures to rise substantially. This rise in temperature leads to a corresponding reduction in lubricant viscosity and, consequently, film thickness, potentially compromising the lubrication regime and overall bearing performance [5]. These elevated contact temperatures and the associated frictional heat are critical in determining the performance, reliability, and longevity of rolling–slipping contacts in bearings.
However, the small scale in combination with the complex physics inside those closed contacts hinders the direct in situ measurement of real contact conditions and in case temperatures, leaving a critical gap in our understanding and optimization of bearing performance.

1.1. State of the Art

Resistance-based thin-film sensors have been used for decades in measuring TEHL contacts. These transducers have enabled the measurement of TEHL film pressure and temperature, with detailed reviews available in [6,7]. However, their application for in situ measurements of TEHL contact parameters poses different challenges such as sensitivity to extreme pressures, issues with miniaturization and integration, and maintaining accuracy in small contact areas. Additionally, repeated exposure to high-pressure cycles or operating in mixed or boundary lubrication can degrade sensor performance, necessitating periodic recalibration or replacement.
In 1964, Kannel et al. [8] were the first to employ electrical manganin transducers to measure pressure profiles in TEHL contacts. Their results were consistent and reproducible, with manganin’s low temperature coefficient of resistivity ensuring that temperature-induced changes in resistance minimally impacted pressure measurements. This feature allowed temperature effects to be effectively disregarded when interpreting the pressure data.
In the following years, 1965–1966, Cheng and Orcutt [9,10] used a manganin–platinum resistance gauge to measure both pressure and temperature in lubricated cylindrical discs under rolling and rolling–sliding conditions. Although the spatial resolution was insufficient to observe the Petrusevic pressure peak near the outlet, their measurements indicated its presence through discontinuities in the pressure slope in that region.
By 1971, Hamilton and Moore [11] advanced this approach using an evaporated manganin gauge with improved dimensions—approximately 0.5 mm in length and 0.04 mm in width. Their results confirmed the existence and position of the theoretical pressure peak, though the magnitude was slightly attenuated.
With the evolution of sensor technology, the focus shifted toward miniaturization and enhanced resolution. In 1981, Safa et al. [12] developed thin-film manganin pressure transducers capable of capturing high-resolution measurements of the Petrusevic spike by improving the signal monitoring systems [13]. Safa further integrated a titanium thin-film temperature sensor atop a manganin pressure sensor to address the influence of pressure on temperature measurements. These sensors were tested in a twin-disc setup and on the outer ring of a real bearing, successfully measuring pressure, temperature, and film thickness profiles consistent with EHL theory. However, structural issues with the sensor design prevented Safa from measuring the temperature profile in the bearing’s outer ring.
In 1982, Kohler [14] examined pressure and temperature variations in a twin-disc contact configuration, integrating thin-film sensors into machine elements such as rolling and journal bearings. The sensors utilized materials like manganin, titanium, copper–nickel, or nickel–chrome alloys, with silicon oxide as an insulating layer. These experiments were conducted exclusively under fluid lubrication conditions to avoid mixed or boundary lubrication regimes.
Similarly, in 1984, Simon [15] explored the limitations of various thin-film sensors for measuring pressure and lubricant film thickness in a twin-disc contact under full-film lubrication. His film thickness measurements, performed with contact pressures up to 1.3 GPa, were consistent with the film thickness values calculated by Oster in 1982 [16].
In 1985, Baumann [17] introduced a double-layered sensor design, depositing manganin and titanium films on a silicon oxide insulating layer to address pressure measurement inaccuracies. He performed pressure and temperature measurements under TEHL conditions in twin-disc contacts, focusing on pure rolling and sliding scenarios using four reference oils [18]. Primarily focused on pure rolling and sliding conditions, using four reference oils, Baumann’s findings, comparing experimental data with published theoretical results, revealed a reasonable agreement, advancing the understanding of TEHL contact behaviour.
From 1990 to the late 1990s, researchers such as Peeken et al. [19] (1990), Kagerer [20] (1991), Tychsen [21] (1993), and Kuhl and Holland [22] (1998) pioneered the use of embedded sensors to investigate TEHL in gear contacts. These investigations measured pressure and temperature variations while exploring the effects of surface texture and coating materials (Table 1).
Mihara et al. [23] (1996–1998) later extended these techniques to plain bearing contacts, showing how bearing deformation at measurement points correlated directly with cylinder pressure.
In the 2000s, researchers like Sperrfechter [24] (2000), Dauber [25] (2002), Kreil [26] (2004), Höhn et al. [27] (2006), Miyata et al. [28] (2008), and Wilczek [29,30] (2011) advanced sensor applications for twin-disc contacts. Their work focused on measuring EHL pressure and temperature distributions, highlighting the piezoelectric properties of the sensors and emphasizing the importance of sensor position and dimensions for accurately capturing EHL temperature variations across the gap height (Table 1).
Most recently, in 2021, Stephan Emmrich [31] employed a four-wire measurement technique to explore mixed friction and EHL temperature distributions in twin-disc contacts. Using a thin-film chromium sensor coated with a-C:H:Si:O (Diamond-Like Carbon), Emmrich measured temperature rises under high loads (up to 1750 MPa), elevated oil temperatures (80 °C), and significant slip conditions (40%). His results indicated that temperature rises during mixed lubrication were lower than those observed under EHL conditions, providing new insights into the thermomechanical behaviour of lubricated contacts.
Table 1. Literature review.
AuthorComponentMeasurement
Type
Sensor MaterialCoatingKey Findings/Conclusions
Peeken et al. [19]Gear contact @
p H = 100 ,   185 ,   290   MPa
Oil: CLP 150
T oil = 20   ° C
Full-film lubrication
PressureMnAl2O3Measured temperature and pressure while varying surface texture.
Numerical calculations complemented experiments.
TemperatureTi
Kagerer [20]Gear contact @
p H = 0.6 1.3   GPa U = 1 24   m / s Slip   = 0 30 %
Oil: FVA 3
T oil = 40   ° C ,   99   ° C
Full-film lubrication
PressureMnNoneInvestigated pressure, temperature, and film thickness up to 1600 MPa.
Error analysis and comparison of the measurement data with the calculation tool developed by Oster [16].
TemperatureTi
Tychsen [21]Gear contact @
p H =   up   to   1   GPa
PressureMnSiO2Contributed significantly to the ongoing efforts to compare thermal EHL data with real experimental results.
Kuhl and Holland [22]Gear contact @
p H =   up   to   1.45   GPa
U: 1500 min−1
Slip: 50%
Oil: FVA 3
Regime: full-film lubrication
PressureCrSiO2Extended the work initiated by Tychsen without protective layers to confirm their suitability; sensors demonstrated high accuracy, durability, and dynamic performance under extreme mechanical stress, matching the resilience of case-hardened gears.
TemperatureTi
Sperrfechter [24]Twin-disc contact:
Steel vs. Ceramic Disc @
p H :   up   to   1.3   GPa
U: 3600 min−1
Slip: 3 to 40%
Oil: FVA 4
Regime: full-film lubrication
PressureUnknownAl2O3
ZrO2
Developed an iterative algorithm for error compensation in combined pressure–temperature sensors, providing an alternative to double-layer transducers by Baumann and Kuhl [8,9,15].
The method capacitively measured lubrication gap height while accounting for oil dielectric variations from temperature and pressure.
TemperatureUnknown
Dauber [25]Twin-disc contact:
Steel vs. Ceramic Disc @
p H :   up   to   0.9   GPa
U:13.09 m/s
Slip: 0
Oil: FVA 4
Regime: full-film lubrication
PressureMnAl2O3
ZrO2
Focused on friction factors and lubricant film thickness.
Studied non-Newtonian oil behaviour.
TemperatureTi
Kreil [26]Twin-disc contact
Steel with Al2O3, coating
Load: 0.6 to 1 GPa
U: 16 and 8 m/s
Slip: 30%
Oil: FVA 3A
Regime: full-film lubrication
PressureMn--Reported thin-film sensor lifetime of 2 h without a protective layer, avoiding mixed friction.
Höhn et al. [27]Twin-disc contact
Load: 0.6 to 1 GPa
U: 16 and 8 m/s
Slip: 0%
Oil: ISO VG 100 mineral
Regime: full-film lubrication
PressureMnNoneTo protect the sensors, tests were limited to pure rolling with a 2.5–3.5 μm film thickness resulting in mixed lubrication.
Provided valuable insights into surface roughness effects on pressure distribution under controlled conditions.
Miyata et al. [28]Twin-disc contact
Load: 0.98 to 1.5 GPa
U: 5 to 12 m/s
Slip = 0 to 4%
Oil: Santotrac 50
Regime: full-film lubrication
TemperaturePtAl2O3Temperature rise in an elliptical contact area increases with slip, circumferential velocity, and pressure. Under low-slip conditions, spin motion causes significantly higher temperature rise than no-spin motion. However, as slip increases, the temperature difference between spin and no-spin motion diminishes.
Wilczek [29,30]Twin-disc contact
Load: 0.5 to 0.9 GPa
U: 2.5 to 10 m/s
Slip = 0 to 30%
Oil: mineral gear oil
(Transol 75).
Regime: full-film lubrication
PressureMnSiO2Piezoelectric and self-induction effects were studied and found to be negligible with higher supply current.
Mayer [32]Twin-disc contact
Steel vs. Al2O3 Disc
PressureMnNoneThe sensor layer was directly coated on the surface. A focus on the influence of surface texture in the absence of a protective layer.
TemperaturePt
Ebner et al. [33]Twin-disc
Steel vs. AL2O3 and
ZrO2 Ceramic Disc @
Load: 0.6 to 1 GPa
U: 8 to 16 m/s
Slip = 20 to 30%
Oil: MIN100 (ISOVG100)
Regime: full-film lubrication
TemperaturePtDLCResults revealing differences in thermal inertia between two discs. Changing the sensor disc material highlighted the impact of thermal insulation on EHL temperature and fluid friction. TEHL simulations confirmed these findings, emphasizing the significance of sensor position and dimensions in capturing temperature variations across the film thickness.
The literature discussed above predominantly focuses on TEHL contact pressure and temperature measurements in twin-disc setups and gear contacts, as such ‘open’ contacts are accessible and hence much easier to deposit thin-film sensors than the often closed geometry of rolling element bearings. In the current paper, we intend to implement four-wire thin-film sensors in an off-the-shelf rolling element bearing to measure the spatiotemporal distribution of contact temperature.

1.2. Goal of This Paper

The primary objective of this paper is to accurately measure the spatiotemporal distribution of the temperature within the TEHL contacts in a cylindrical roller thrust bearing (CRTB) using thin-film sensors positioned at different locations on the raceway. Thereto, a four-wire resistive thin-film sensor is used. These sensors, optimized for size and spatial resolution, are strategically embedded at three radial key locations on the stationary bearing raceways as indicated in Figure 1, i.e., near the outer radius (positive slip), near the inner radius (negative slip), and at the mean radius (pure rolling). This strategic configuration allows us to measure the temperature profile along the circumferential direction and the radial direction in the CRTB.
Secondly, we aim to record contact temperature profiles as a function of axial load, speed, and supply oil temperature for fully flooded lubrication conditions. In particular, the interest is to measure not only the temperature in the Hertzian contact region but also the temperature rise due to shear heating in the entry region. Additionally, the frictional force is measured as well as the inlet temperature of the supply oil ( T i n ) and the bearing raceway temperature ( T b e a r i n g ). With this approach, the relationship between the thin-film temperature profile and the frictional forces is investigated.

2. Materials and Methods

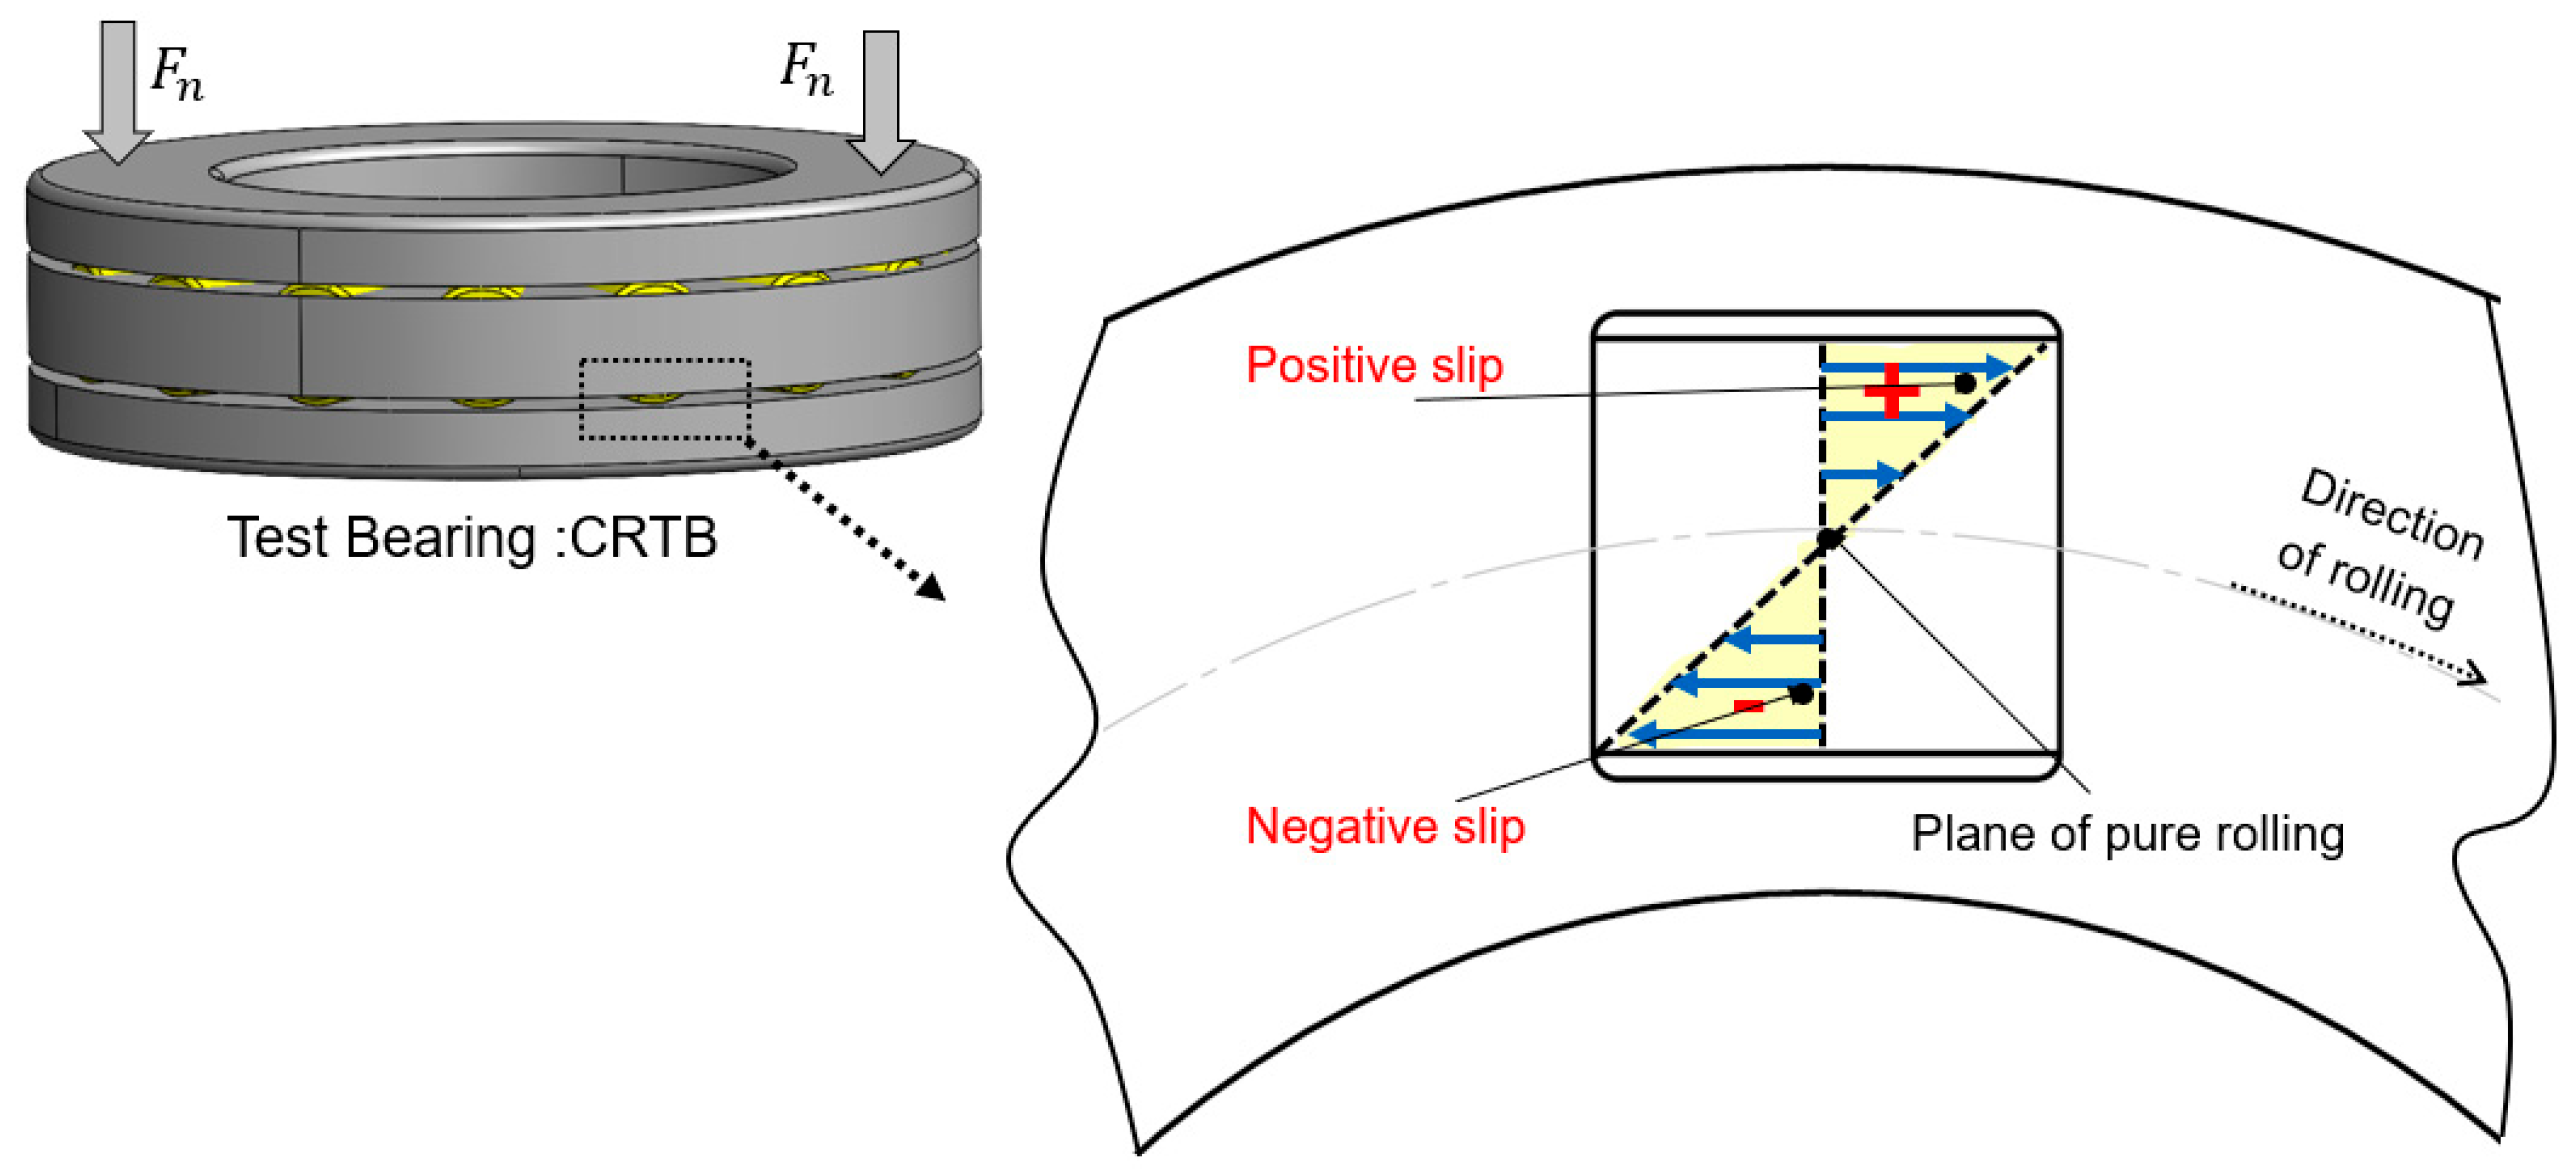
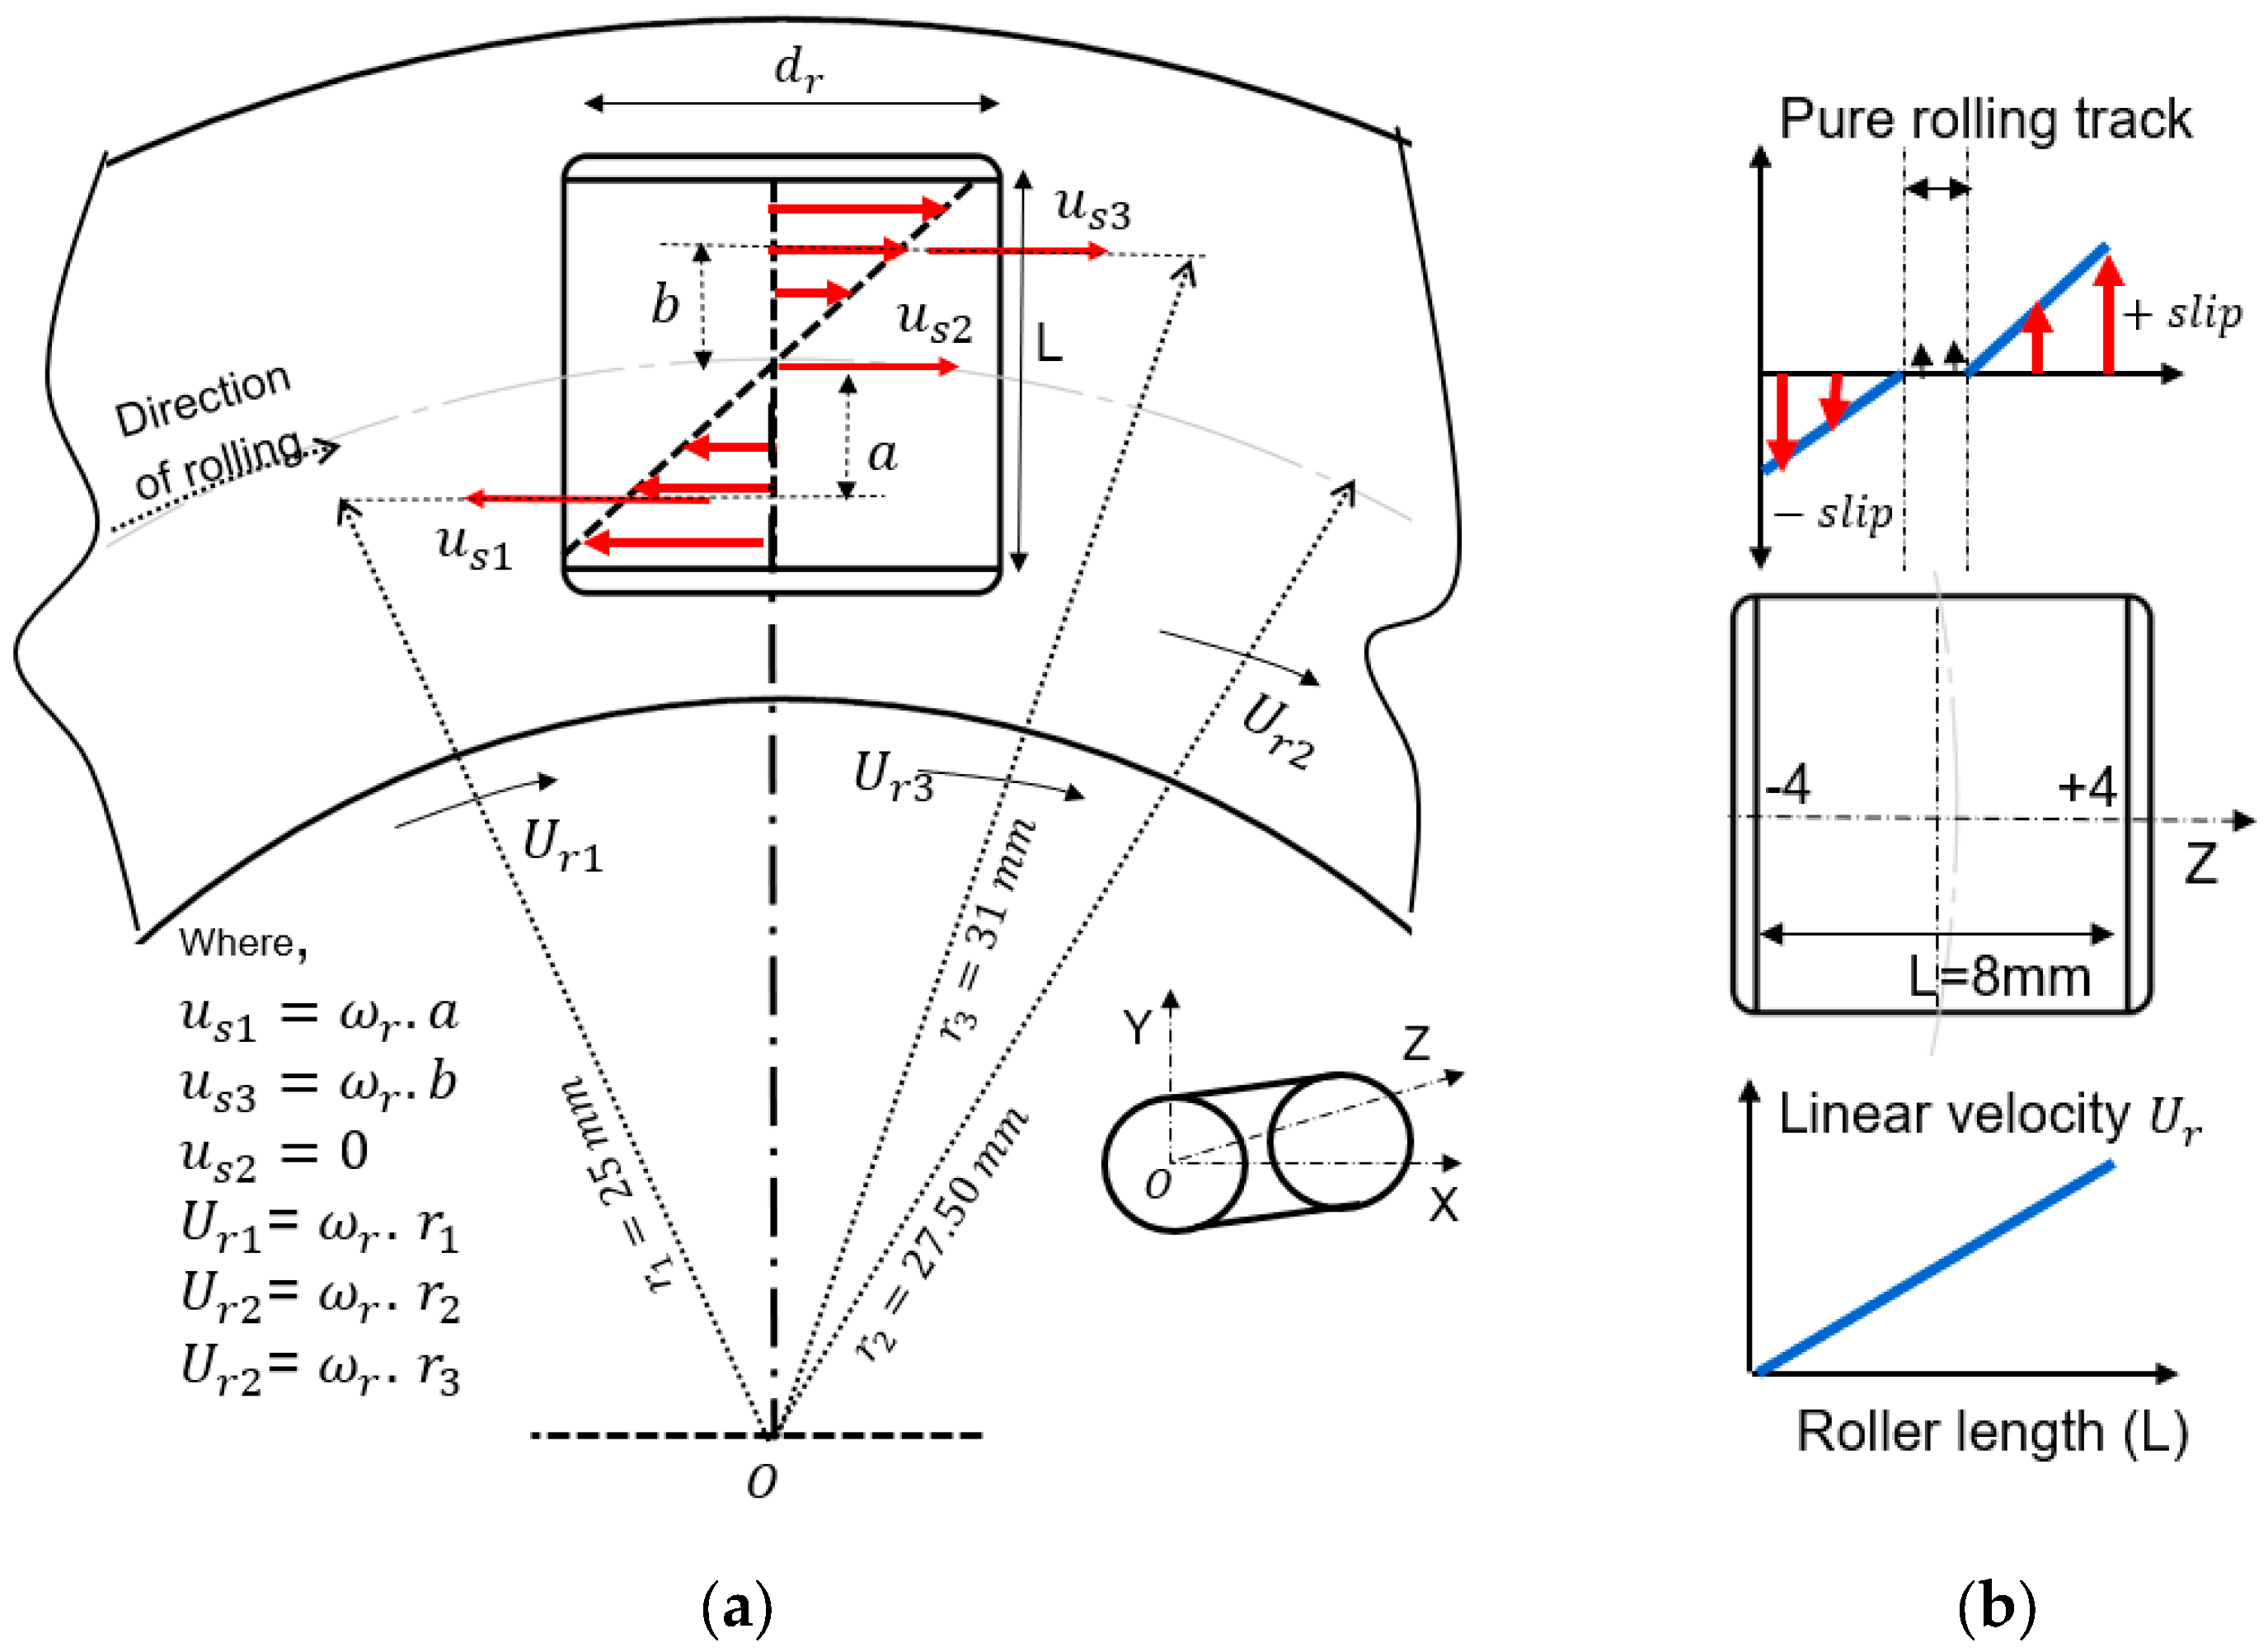
2.1. Characteristics of TEHL in CRTB

Compared to other roller bearings, cylindrical roller thrust bearings (CRTBs) typically exhibit a higher sliding friction torque [1]. The increase in sliding friction within CRTBs is influenced by the fluid properties within the Hertzian contact region due to higher shear rates and stress, leading to elevated contact film temperatures [34]. These contact temperatures and frictional heat play crucial roles in determining the performance and durability of CRTB rolling–slipping contacts.
A distinctive characteristic of CRTBs with respect to other rolling element bearings is the combination of rolling and sliding motions between the contacting surfaces. Particular emphasis must be placed on the slippage and hence slip-to-roll ratio along the radial direction of the bearing. As illustrated in Figure 2a, when the linear velocity at the centre of a roller is denoted as U r 2 , the linear velocity at the inner radius, U r 1 , will be smaller than U r 2 and the linear velocity at the outer radius, U r 3 , will be higher than U r 2 , even though the angular velocity ω is constant and independent of the radius. This demonstrates that significant sliding occurs at both ends of the rollers.
Theoretically, pure rolling motion only occurs at the pitch or centre radius where the sliding velocity is zero ( u s 2 ). In the rest of the contact area, slippage occurs because the roller surface velocity is either smaller (at the inner radius) or larger (at the outer radius) with respect to the raceway surface velocity. Between both ends, the surface velocity of the roller changes linearly (Figure 2b). The thin-film sensors are located beside the pitch line, at distances a and b from the centre radius. The slip-to-roll ratio (SRR) along the roller length is considered as
S R R = u s l i d e U r o l l = 2 × u r a c e w a y u r o l l e r u r a c e w a y + u r o l l e r = 2 y d p + y
in which u r a c e w a y and u r o l l e r denote the raceway and roller surface velocities in the contact, whereas y is the distance from the pitch radius. It should be noted that the SRR in a CRTB is primarily influenced by the bearing’s geometry rather than its rotational speed. This is illustrated in Figure 3. Notably, the variation in the SRR along the radial direction directly impacts the viscous heat generated within the contact. Consequently, the temperature of the lubrication film increases along the length of the roller due to this sliding motion, affecting all mechanical and thermodynamic lubricant properties in a highly nonlinear manner. In turn, the lubricant properties influence the viscous heating within the Hertzian contact region as well as in the inlet region, with the latter having a large impact on the film thickness [2,34,35].
Furthermore, the frictional heat generated due to this sliding motion (EHL friction) depends on the properties of the lubricant within the Hertzian contact region [2,34,35]. Along with the SRR, it also depends on shear stress in the contact film (Equation (2)). So, in this contact region, the lubricant experiences very high pressures, some sliding, and high strain rates γ ˙ , and its response is always highly non-Newtonian, even for simple liquids. In contrast, film thickness depends primarily on the properties of the lubricant in the critical inlet region of EHL.
γ ˙ u s l i d e h
At high shear stresses and SRRs, frictional heating causes the EHL film temperature within the contact zone to rise above the bulk temperature of the bearing raceways. This leads to the friction curves plateauing and, in some cases, even decreasing [2]. Indeed, an increase in shear rate results in a quadratic increase in shear heating, leading to higher bearing temperatures, which in turn will cause a near-exponential decrease in viscosity and a potential decrease in the resulting film thickness. In general, significant frictional heating results in a temperature rise and sharpening of temperature peaks [18,33].
The measurement of EHL friction, film thickness, and temperature contributes to a more comprehensive understanding of bearing lubrication and bearing efficiency. In the recent work of the authors, detailed EHL friction [1] and EHL film thickness [36] were measured for CRTBs under different operating conditions and the same method was applied here in this article. Specifically, in this study, we focused on measuring the TEHL temperature of CRTBs using thin-film sensors embedded within contact.

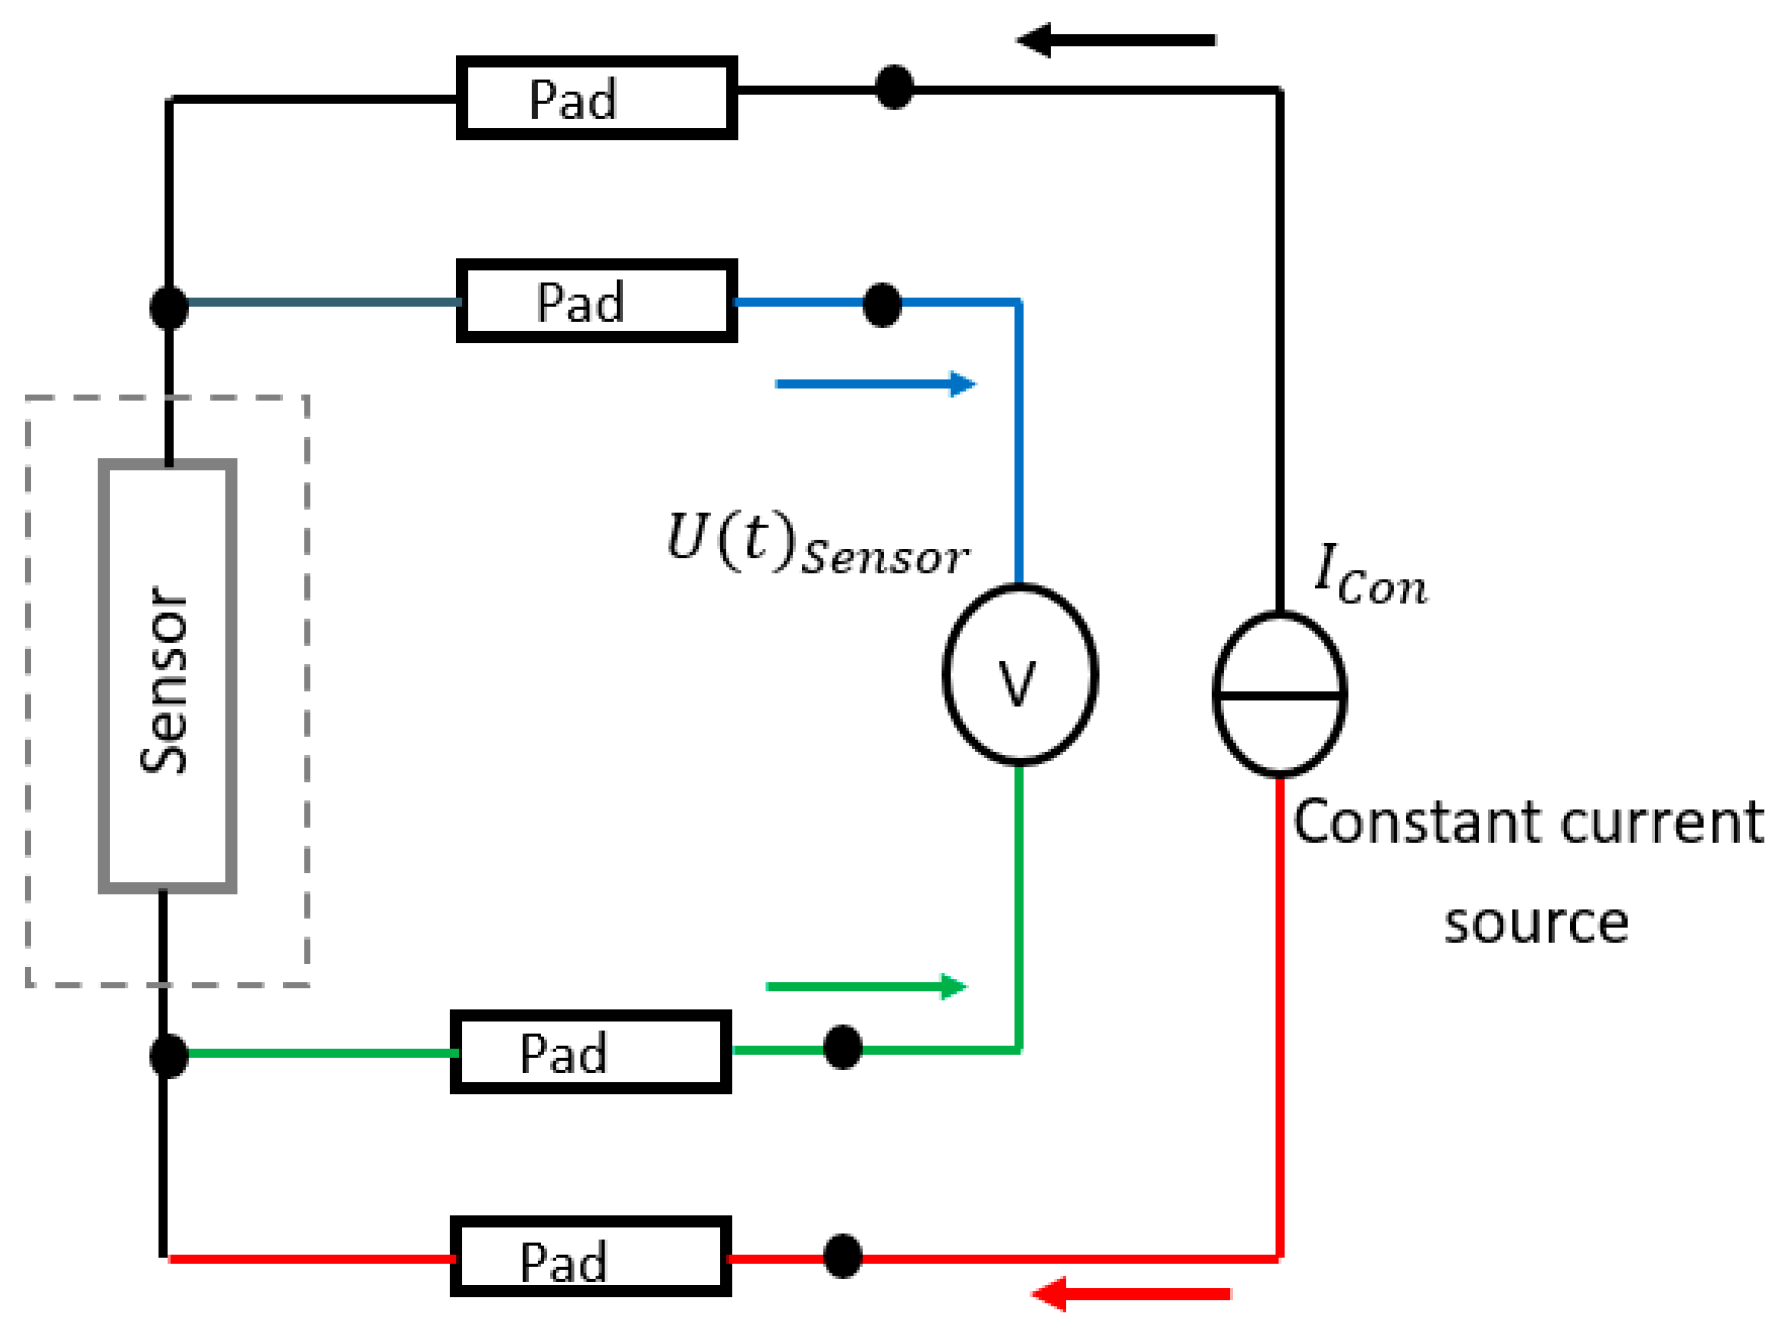
2.2. Thin-Film Sensor Measurement Principle

For our measurements, three-layer thin films were deposited on the stationary raceway of the CRTB (40 × 68 × 19mm), consisting of the following layers:
  • An electrically insulating Al2O3 layer applied to the steel surface.
  • A structured metallic sensor layer.
  • A Diamond-Like Carbon (SICON®) coating for wear protection, preventing direct contact of the roller with the metallic sensor strip.
The sensors used in this study were designed and manufactured by the Fraunhofer Institute for Surface Engineering and Thin Films (IST), Tribology and Sensor Technology, located at Riedenkamp 2, Braunschweig, Germany. These sensors were integrated into our test bearings, and further details regarding their design and manufacturing process are available in the corresponding documentation [31]. Similar sensors were embedded in the bearing washer, with their locations illustrated in Figure 4a,b. Three sensors were embedded and are indicated as 1 (−slip), 2 (PCD), and 3 (+slip). These sensors successfully recorded measurements.
The measurement of TEHL pressure and temperature is based on detecting changes in resistivity ( R ) within the vapour-deposited metallic sensor layer. These resistivity changes correspond to variations in TEHL pressure and temperature.
The careful and precise selection of sensor materials allows for optimizing sensitivity to either pressure or temperature while minimizing sensitivity to the other. In this work, only a temperature sensor was embedded. Platinum and titanium were identified as the most suitable materials for temperature sensing due to their pronounced sensitivity of electrical resistance to temperature changes, with negligible sensitivity to pressure variations. Conversely, manganin is commonly employed for pressure measurement because its electrical resistance is predominantly influenced by pressure, with a much smaller sensitivity to temperature changes.
Despite sensitivity tuning, it is essential to account for the fact that the temperature-dependent change in resistance ( R ) is influenced by both the temperature and the piezo-resistive effect of the transducer, albeit at different rates. The relationship between the change in electrical resistance and both temperature and pressure changes is observed to vary linearly and, hence, is mathematically expressed in Equation (3) as
R R o α T T t + α p P t
Here, α T and α p are coefficients representing the impact of temperature and pressure changes, respectively; T t denotes the temperature change; P t is the pressure change; and R o is the initial resistance of the sensor under atmospheric, stress-free conditions.
Using the four-wire technology, as shown in Figure 5, facilitates the precise measurement of resistance changes within the sensor structure, allowing for high spatial resolution in detecting temperature variations. In this configuration, two wires are connected to a constant current source, denoted as I C o n s t , while the other two wires are used to directly measure the voltage drop, U   t , across the sensor. This setup enables the detection of resistance changes by applying Ohm’s law, as described in Equation (4). The voltage drop U   t directly correlates with the dynamic changes in the sensor’s resistance, R , thereby capturing rapid temperature fluctuations with fine spatial resolution.
R = U   t I C o n s t
The excitation current I C o n s t supplied to the sensor is restricted to a maximum of 4   mA . This limitation ensures that the power dissipated in the resistive sensor remains within acceptable bounds ( P r = 1 6 × 10 4   W / m 2 ), thereby preventing unintended heating of the lubricant and avoiding inaccuracies in temperature measurements [29,30]. The dissipated power is related to the excitation current in Equation (5), where l 1   a n d   l 2 are sensor dimensions.
I C o n s t = P R l 1 l 2 R O  
By rearranging Equation (3), we determined the instantaneous temperature ( T t )   of the lubricant film on top of the sensor based on the measured electrical resistance. Here, P t is the EHL film pressure and α T and α P are calibration coefficients obtained through isothermal calibration at very low rotational speeds under different bearing loads.

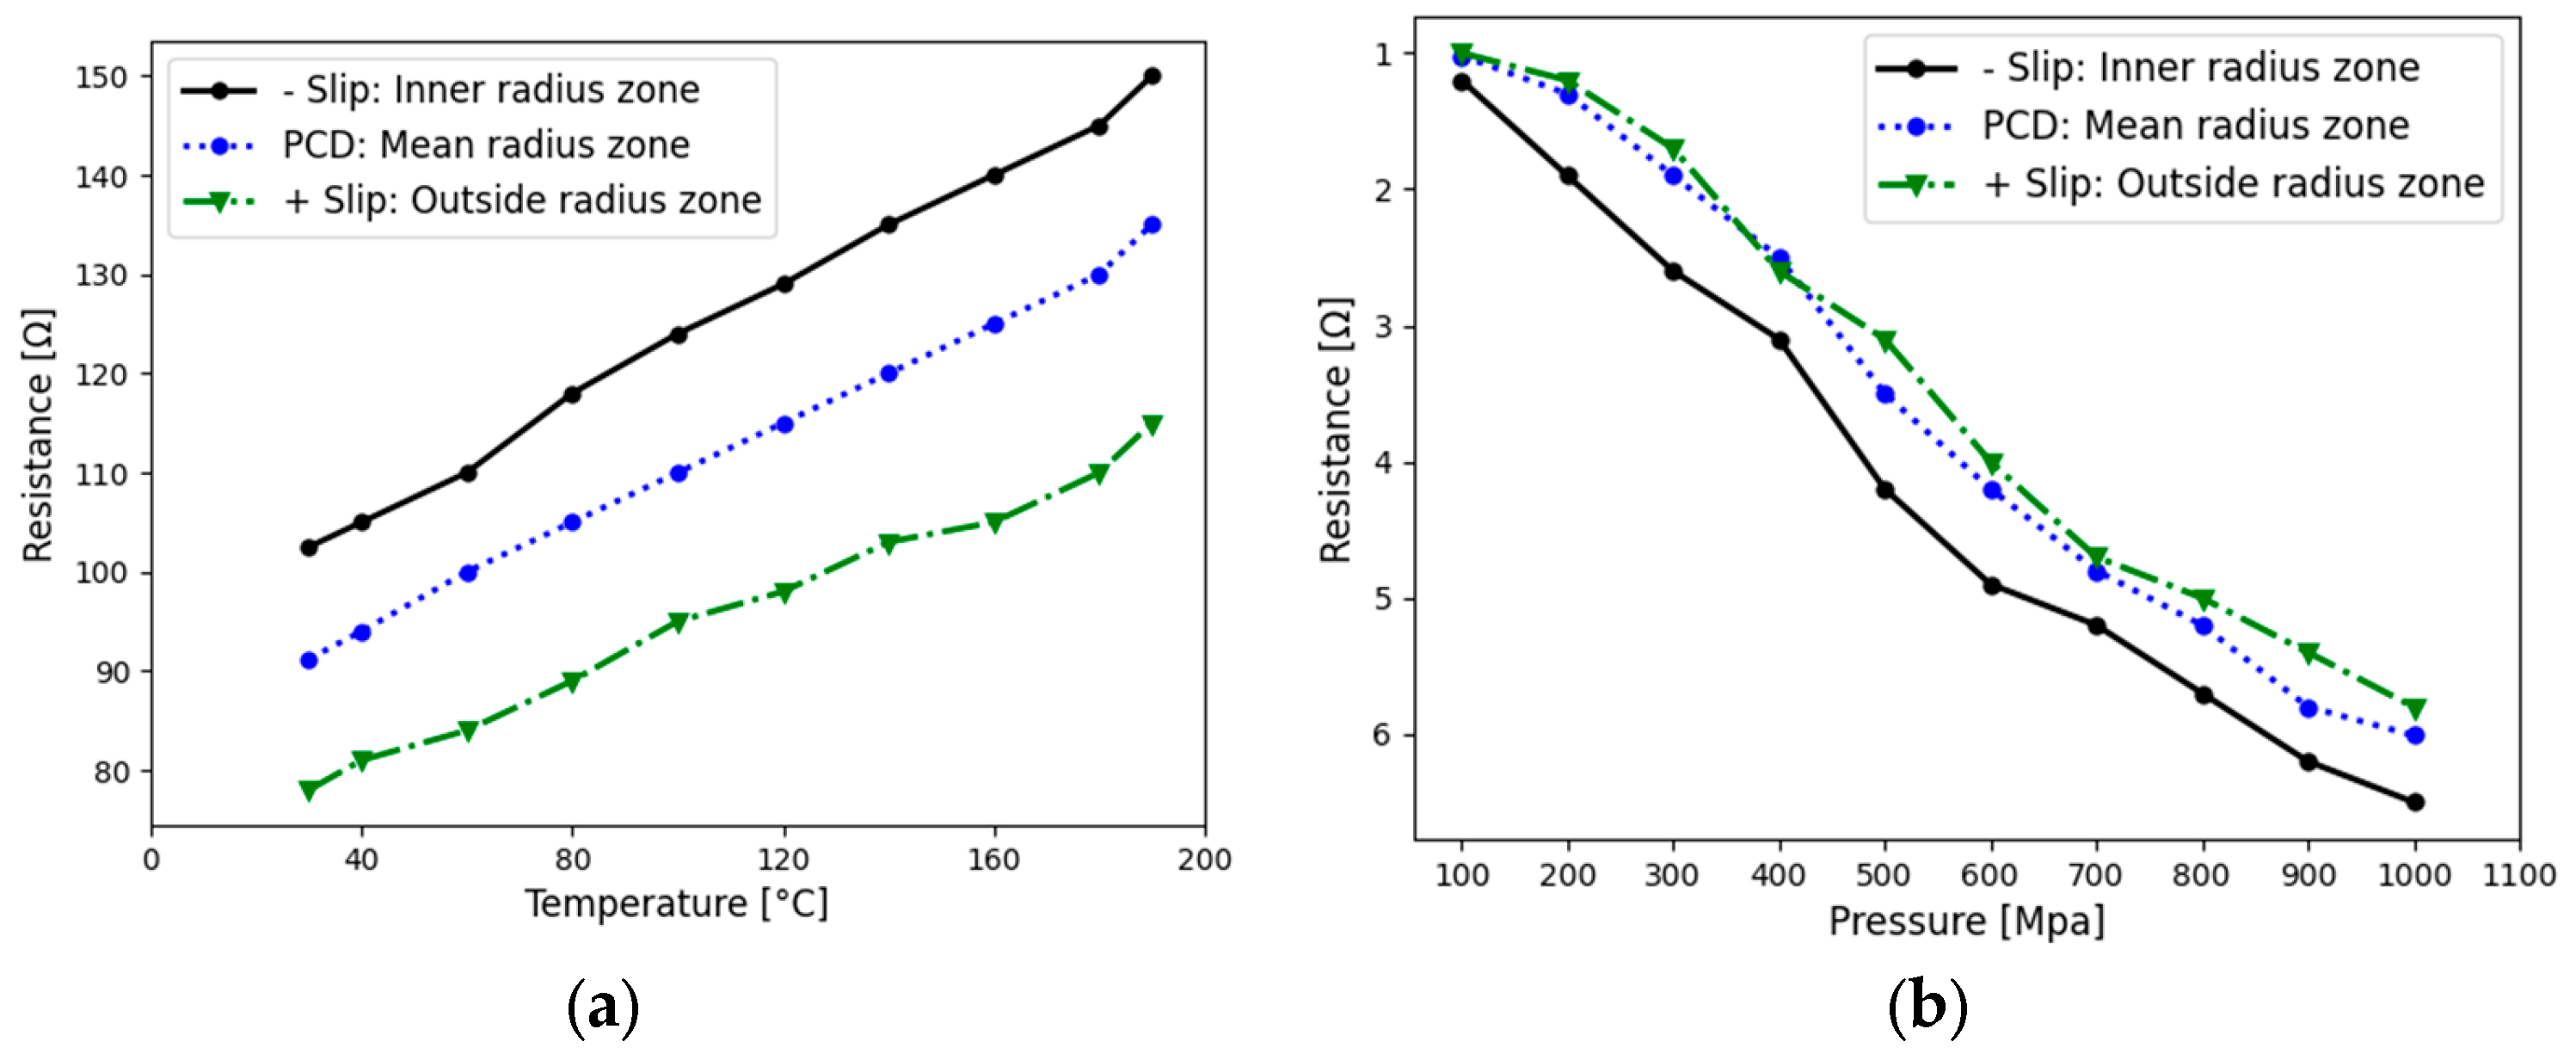
2.3. Thermo- and Piezo-Resistive Sensor Characterization

The thermoresistive sensors used in this study are classified as positive temperature coefficient (PTC) thermistors. These sensors exhibit a temperature-dependent variation in electrical resistance, approximately following a linear relationship characterized by a positive temperature coefficient α T in Equation (3). However, it is important to note that due to inherent variations in the deposition and structuring processes, the α T value may differ among individual sensors. Consequently, the precise value of α T must be determined separately for each sensor.
To perform this evaluation, a dedicated setup was used to record the thermoresistive characteristics ( α T ) of each individual sensor, as shown in Figure 6. The instrumented bearing raceway was subjected to controlled heating up to 190 °C within a heating cabinet, with a K-type thermocouple sensor acting as a reference temperature sensor placed on the coated sample. The temperature sensors were interconnected using four-wire technology. The results demonstrated that the sensors exhibit a linear relationship within the 30 to 190 °C temperature range. The resistance curves, which illustrate the temperature-dependent behaviour, show a consistent linear trend as the temperature increases across the entire range (Figure 7a). This behaviour aligns with the thermoresistive characteristic of the sensors.
In addition to the changes in sensor resistance caused by temperature variations, it is crucial to also account for changes induced by pressure, known as the piezo-resistive effect. When the bearing rollers pass over the sensor, it experiences a steep increase—followed by a steep decrease—in contact pressure, changing the electrical resistance of the metallic sensor strip. To comprehensively investigate this effect, tests were conducted on the roller-bearing tester (RBT) for contact pressures of up to 1100 MPa under isothermal conditions at 15 °C. The peak representing the maximum absolute resistance change was identified and correlated with the maximum pressure (Pmax), revealing a linear relationship.
The margin of error for the temperature coefficient of resistance is approximately ±2%, and for the pressure coefficient of resistance, it is around ±4%. Considering all influencing factors, the relative measurement error for temperature measurements is estimated to be about ±6%. The values and dependencies of temperature and pressure coefficients are detailed in Table 2, and a visual representation is provided in Figure 7b.

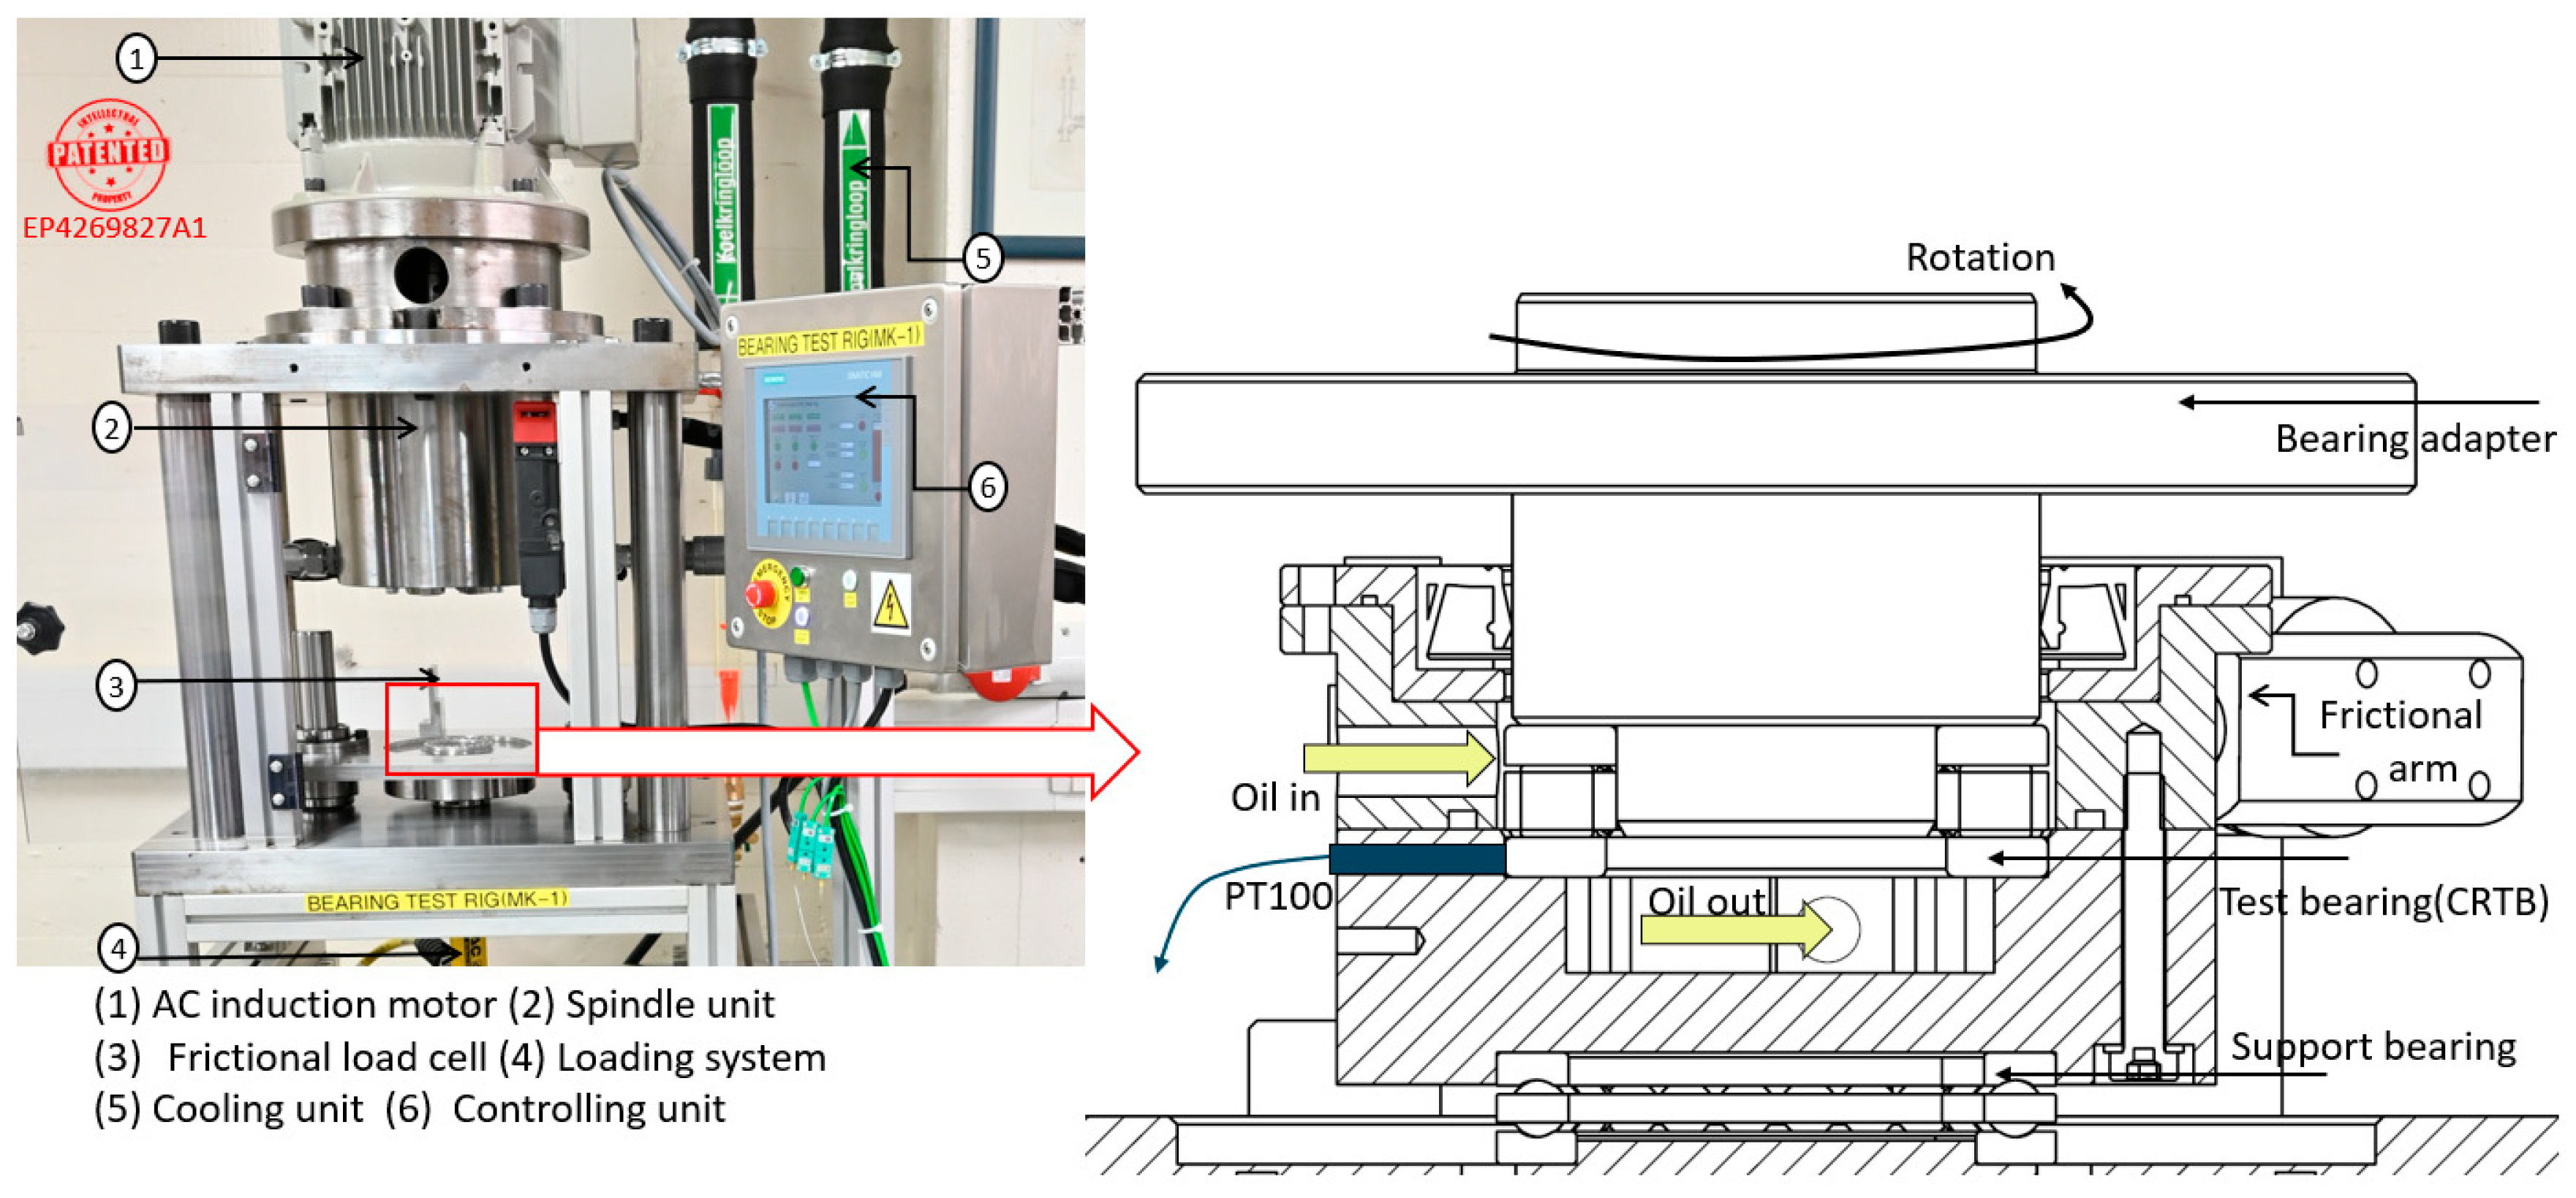
2.4. Experimental Setup

The experimental setup utilized in this study is a vertical-shaft roller-bearing tribometer (RBT: Figure 8) [1]. The test bearing is a cylindrical roller thrust bearing, and a hydraulic cylinder is employed to apply an axial load. An AC induction motor with variable-frequency drive is used for controlled rotation of the test bearing.
The RBT measures several parameters, including the temperature of the bottom washer T b e a r i n g via a Pt100 sensor, the oil inlet temperature T i n , the oil outlet temperature T o u t , and the total bearing frictional torque M t . The frictional torque is determined using a lever arm attached to the bearing housing. A load cell, positioned on the arm between the test-bearing housing and the bottom support bearing, measures the tangential frictional force while isolating the influence of the shaft’s support bearing.
A separate lubrication unit is responsible for supplying lubricant at a controlled temperature and mass flow rate to the test-bearing chamber. The lubricant used is the FVA3A reference oil, with its experimentally characterized properties provided in Table 3.

3. Design of Experiments

The methodology for studying the TEHL oil film temperature and friction in CRTB contacts is explained in Algorithm 1. For each set of operating conditions, indicated by the classical EHL parameters U = η o U r E R :   G = α E H L E :   W = F E L R , the system is allowed to reach tribo-mechanical and thermal steady-state conditions, implying a constant bearing temperature, oil outlet temperature, and steady-state frictional torques. Once in equilibrium, the sensor output voltage U   t , the frictional torque Mt, and the temperatures T b e a r i n g , T O i l , i n , and T O i l , o u t are recorded for about 5 min.
These experiments are performed for three Hertzian contact pressures, i.e., 628 MPa, 1028 MPa, and 1285 MPa, three supply oil temperatures, i.e., T O i l _ i n = 30   ° C ,   50   ° C ,   and   80   ° C , and a range of rotational velocities starting from 500   rpm to 2000   rpm in increments of 500.
Algorithm 1 measurement protocol
do determine the temperature and pressure coefficients α T and α p
for all U, G & W:
If Mechanical and thermal equilibrium/steady-state
do Supply a constant current of 4 mA for each sensor
do 1. Measure:
     • Sensor output voltage     U t @ f = 2   MHz
     • Total frictional torque M t
     • Temperatures T b e a r i n g , T O i l , i n and T O i l ,   out
   2. Calculate the change in resistance R using Equation (4)
   3. Calculate TEHL film temperature rise by rearranging Equation (3)

4. Results and Discussion

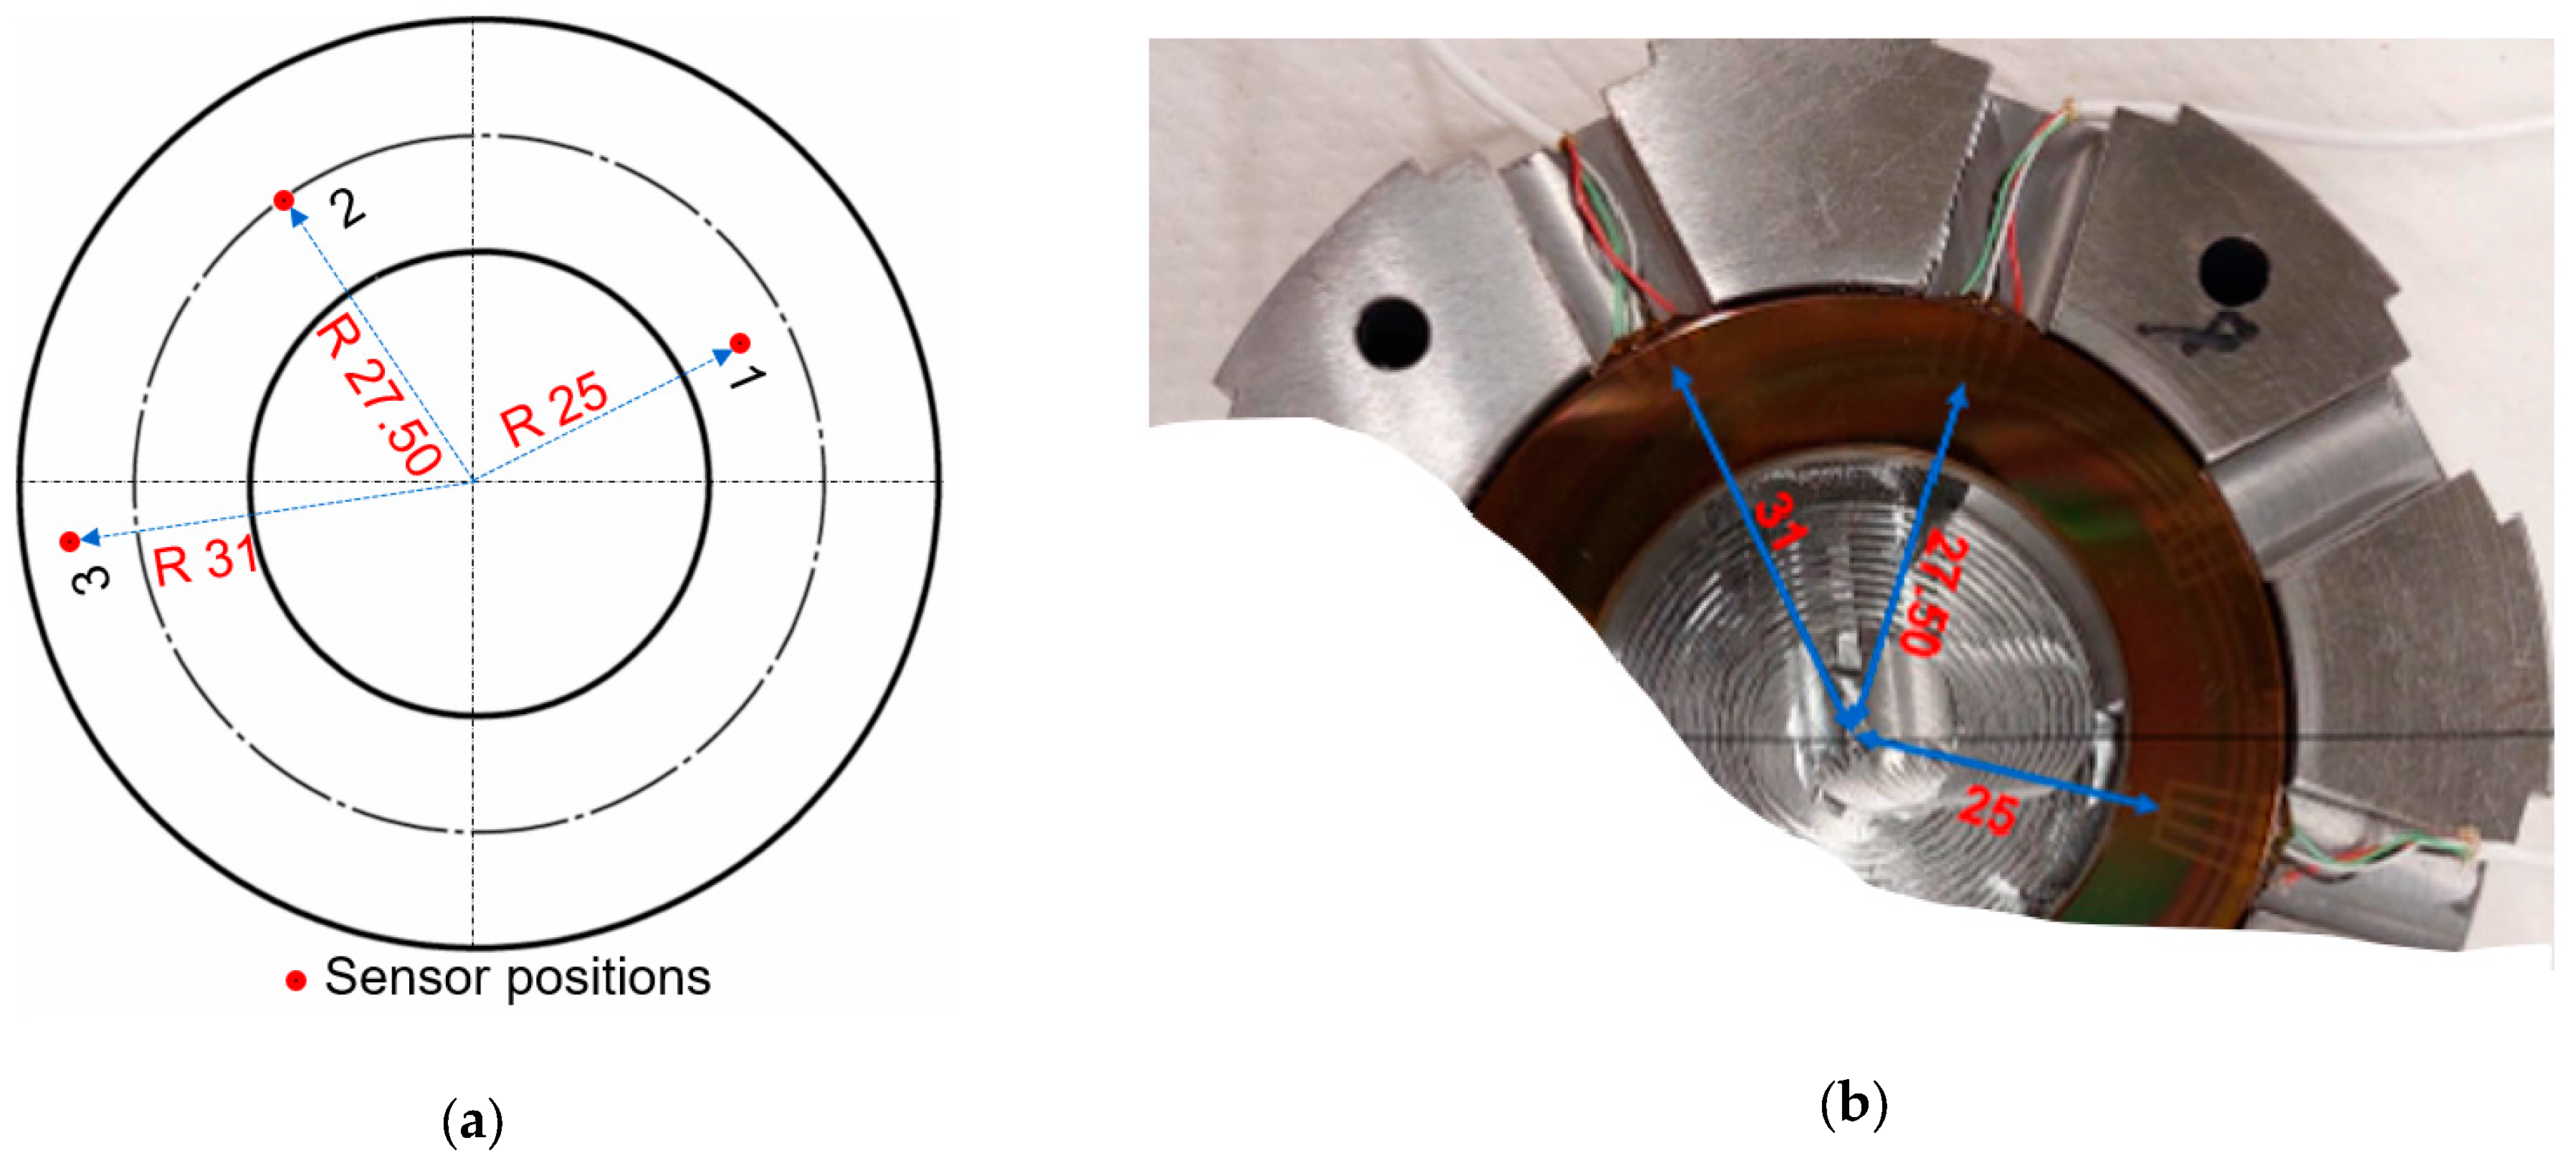
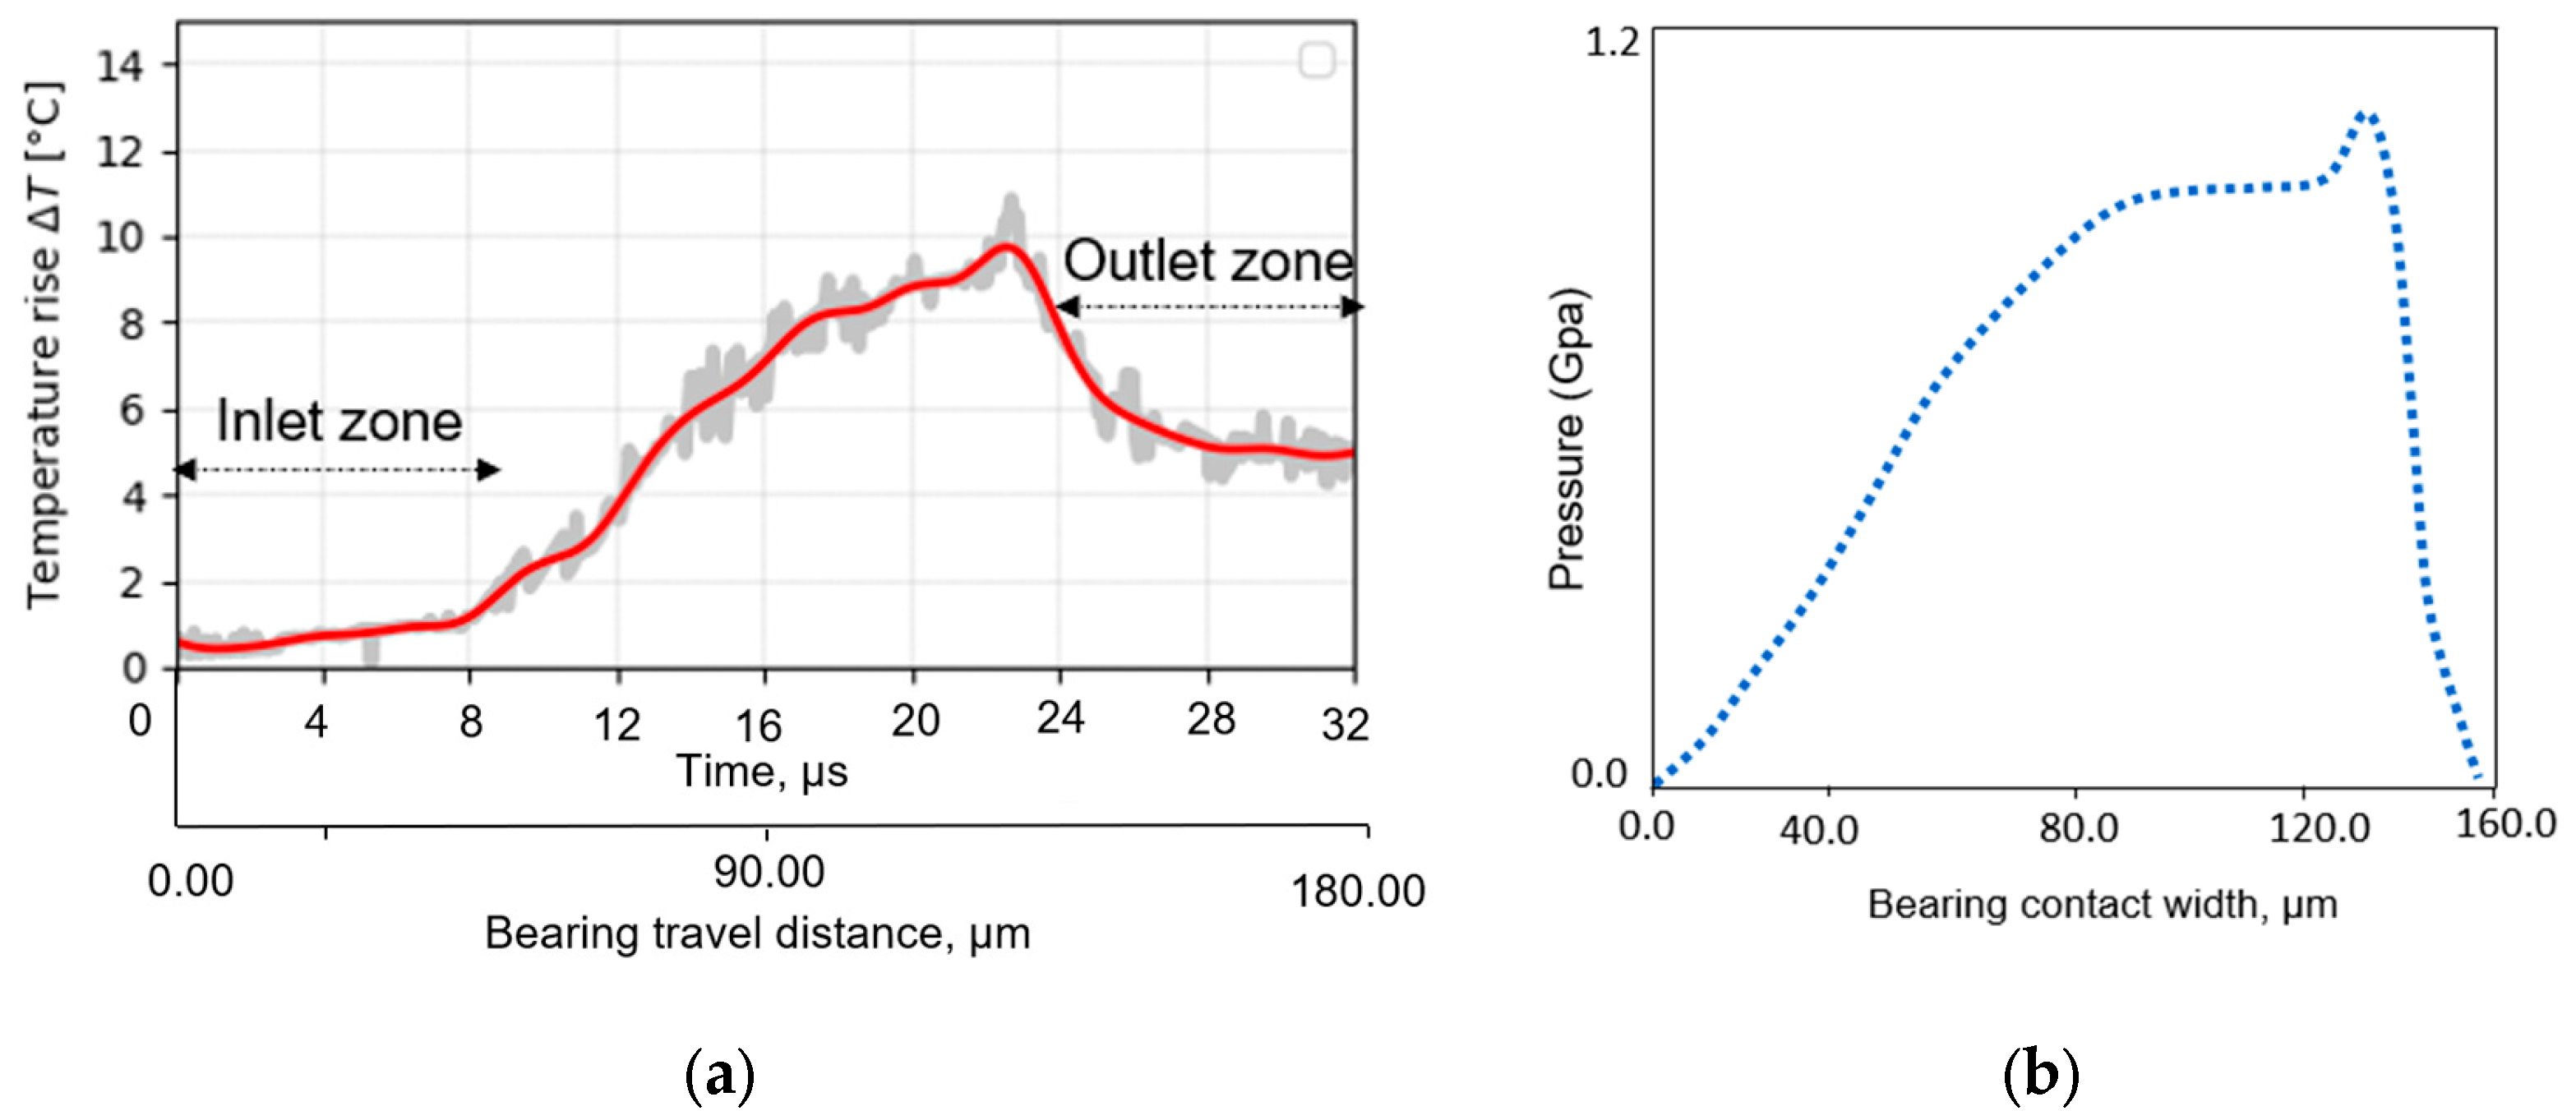
4.1. Measurement of TEHL Contact Temperature Distribution

Given a known rotational velocity, the time interval required for a Hertzian contact to roll past the sensor is directly correlated to the Hertzian contact width and vice versa. Consequently, temporal temperature measurements can be converted into spatial temperature distributions within the EHL contact. In the experiment, the observed temperature variation occurred over a time interval of approximately 32 μs as the roller passed over the sensor. This corresponds to a spatial width of the temperature profile of about 180 μm, and the calculated Hertzian contact width is 159 μm. It is, however, important to mention that it is not possible to precisely position the spatially reconstructed temperature profile with respect to the central origin of the Hertzian contact due to the lack of a precise reference time linking the start of the measurements to a precise position of the rollers. Moreover, a (small) time delay in the measurements due to the thermal inertia of the contact and/or due to the response time of the sensors could be present.
Figure 9a presents the raw measured temperature profiles (grey) obtained within the TEHL hydrodynamic film along the time and bearing travel distance. Utilizing a low-pass Butterworth filter, the noise was filtered out, obtaining a smooth temperature profile, as indicated in red. As expected, the temperature profile tends to follow the trend of the pressure profile (Figure 9b), which was calculated using a 2D CFD-FSI computational TEHL model for the same contact geometry and oil characteristics [37,38]. Similar to the Petrusevic spike observed in the pressure profile distribution, a temperature spike was detected in the measured profile. While we believe this temperature spike occurs near the pressure spike, its exact relative position cannot be precisely determined, as previously explained.
In contrast to the pressure profile, a steady increase in temperature is clearly observed in the inlet region ahead of the Hertzian contact. This phenomenon is readily explained as the result of viscous shear heating caused by the recirculation of excess lubricant in front of the Hertzian contact area. The observed trends in the results closely align with findings reported in the literature [18]. Due to positional uncertainty in converting time to space and vice versa, the results in Figure 9a,b cannot be overlaid directly.
Figure 10a–c present the raw and fitted data collected from three sensors positioned at distinct radial locations: one at the inner radius, characterized by negative slip (depicted in black); one at the outer radius, where positive slip occurs (shown in green); and one at the central pitch radius, where pure rolling occurs (depicted in blue).
Figure 10d shows the maximum temperature rise across the radial positions of the raceway. The smallest temperature rise is observed at the central pitch radius, where pure rolling occurs, while significantly larger temperature rises are seen at the inner and outer radii due to the contribution of slip (SRR > 0). Notably, the temperature profile at the pitch radius aligns well with results reported in the literature [18].
Additionally, the temperature decay observed at the outlet follows a consistent pattern across all radial zones. This indicates that higher temperature rises within the contact correspond to higher temperature rises on the outlet side, reflecting a proportional relationship between the in-contact peak temperature and the outlet temperature.

4.2. Influence of Operating Conditions on EHL Film Temperature Rise

Figure 11 presents a series of measured temperature profiles recorded at a constant load, corresponding to a maximum Hertzian contact pressure of 1028.6 MPa, with varying rotational speeds ranging from 500 to 2000 rpm. Since the load was held constant, the observed temperature changes are solely attributed to variations in rotational speed.
Figure 11a shows the temperature distribution measured by the sensor positioned at the inner radius. Figure 11b depicts the temperature distribution from the sensor at the central radius. Figure 11c shows the distribution from the sensor at the outer radius.
All sensors indicate a noticeable increase in temperature with increasing rotational velocity of the bearing. At speeds exceeding 1000 rpm, full-film EHL eliminates asperity friction, concentrating heat generation in the lubricant’s viscous shear. The abrupt pressure drop at the outlet (termed Petrusevich’s pressure spike [39]) constricts the film geometry, amplifying shear rates ( γ ˙ ) locally. Rapid lubricant transit through this narrowed zone creates near-adiabatic conditions, trapping heat.
Rapid lubricant flow through the narrowed outlet limits heat dissipation, creating near-adiabatic conditions that trap thermal energy. A self-reinforcing cycle intensifies the temperature spike: rising temperatures reduce lubricant viscosity, which further elevates shear rates and viscous heating, despite thicker films elsewhere in the contact. This mechanism aligns with experimental observations of localized outlet heating under EHL conditions [37,38].
Interestingly, at the pitch radius, where pure rolling conditions dominate, the temperature rise exhibits a distinct trend. Minimal temperature increases are observed at both the inlet and outlet, indicating negligible heat accumulation in the contact region. This suggests that for pure rolling, most of the generated viscous heat is dissipated via conduction to the solid surfaces.
In contrast, at the outer radii, where sliding and slip occur, more heat is generated by viscous heating in the contact, a significant portion of which is convected towards the outlet. This results in a higher outlet temperature, which depends on the rotational velocity. At higher speeds, the shear stresses within the contact become more pronounced, leading to increased shear heating. Consequently, the outlet temperature rises further compared to that at the pitch radius, highlighting the impact of slip on the thermal behaviour in bearing contacts.
Figure 11d displays the maximum temperature under various speed conditions across the roller length, showing an increased maximum temperature rise with higher speeds and slip-to-roll ratios (SRRs). As the bearing speed increases, the measured TEHL temperature also rises. However, the behaviour of the temperature increase varies across the contact length. At the pitch radius, where pure rolling occurs, the temperature profile remains relatively unaffected due to minimal shear heating caused by the lack of slip. In contrast, at the inner and outer radii, where sliding is more pronounced, the sliding velocity increases proportionally with rotational speed. This results in higher shear rates and stresses, leading to greater shear heating and a substantial rise in temperature at these regions. Thus, while the pitch radius experiences minimal temperature changes, the outer radii exhibit a more significant temperature rise as speed increases.
Figure 12a shows the measured global frictional torque and its calculated sub-components using the SKF frictional model. The analysis highlights sliding frictional torque as the primary contributor to the rise in the EHL temperature in the bearing. Interestingly, as the measured EHL temperature increases, the calculated sliding friction decreases with varying speeds.
In our previous study focused on film thickness measurement, we observed that as bearing speed increases, film thickness also tends to increase, particularly under fully flooded operating conditions [36]. At higher speeds, thicker films may result in slightly higher viscous shear losses within the lubricant, contributing to additional heat generation. Moreover, in thicker films, the conduction can impede heat transfer away from the contact area, potentially delaying heat dissipation temporarily. These factors collectively affect the overall rise in TEHL temperature at varying speeds.
Figure 12b depicts the increased bulk temperature of the stationary bearing raceways. Despite lower SRRs and shear stress, the bulk temperature of the raceway is expected to remain higher than the film temperature due to heat accumulation and slower dissipation rates [34,35].
In Figure 13, the temperature values immediately before the contact, i.e., at x/b = −1.25, and just behind the contact, i.e., at x/b = 1.25, are plotted against the rotational speed to analyze the correlation between contact temperature and rotational speed. Notably, these regions exhibit minimal pressure. As the bearing speed increases, the corresponding slip-to-roll ratio (SRR) also increases, directly influencing the maximum temperature rise observed across different radial zones. At the mean radius zone, where pure rolling conditions dominate, the temperature increase at the inlet zone remains minimal across all bearing speeds. However, under sliding conditions at the inner and outer radius zones, a pronounced temperature rise is observed, particularly near the Hertzian contact. This trend underscores the significant influence of sliding on thermal behaviour in these regions.
Next, the contact pressure was increased to study its effect on temperature. Figure 14 illustrates the maximum temperature rise under varying maximum Hertzian contact pressures. At a fixed bearing speed, an increase in contact pressure results in a corresponding increase in shear rate, due to a decrease in film thickness. Under EHL conditions, an increase in contact load results in thinner films, higher shear rates, increased shear heating, and higher contact temperatures. Consequently, viscosity decreases, which further contributes to even thinner films and higher shear rates. On the other hand, the shear stresses that influence the frictional torque are directly proportional to both shear rate and viscosity; the viscosity itself is affected by pressure, temperature, and shear rate. As the load increases, the resultant rise in shear rate outweighs the decrease in viscosity, causing an overall increase in frictional torque [40,41].
Consequently, the calculated Moes film thickness decreases (as shown in Table 4), leading to an increase in the measured contact film temperature. This relationship highlights the interplay between contact pressure, film thickness, and thermal behaviour in the contact zone.
In subsequent experiments, the supplied oil temperature was varied to 30, 50, and 80 °C (Table 5). These temperature changes had a significant impact on the oil’s viscosity and, consequently, on the film thickness. As viscosity decreases approximately exponentially with temperature, the film thickness reduces considerably at higher temperatures, which also leads to a decrease in viscous shear heating. This reduction in shear heating results in a smaller temperature rise throughout the contact area [18,33]. Similar to the behaviour observed at lower rotational velocities, it was noted that the temperature spike near the outlet of the contact became less pronounced at higher lubricant temperatures, indicating a transition toward mixed lubrication (Figure 15). This suggests that at elevated temperatures, the lubrication regime shifts, leading to less heat accumulation and more efficient heat dissipation.

5. Conclusions

In this work, we accurately measured the TEHL contact temperature distribution in a cylindrical roller thrust bearing (CRTB) using vapour-deposited four-wire resistive thin-film sensors positioned at eight angular and three radial locations on the stationary bearing raceways. These locations included the outer radius (positive slip), inner radius (negative slip), and mean radius (pure rolling), allowing us to assess the effect of slip on viscous shear heating and the contact temperature distribution. Through a series of carefully conducted experiments on a roller-bearing test rig (RBT), we gathered valuable in situ temperature profile data in the CRTB, providing insights into viscous shear heating and thermal transport. The key conclusions are summarized below:
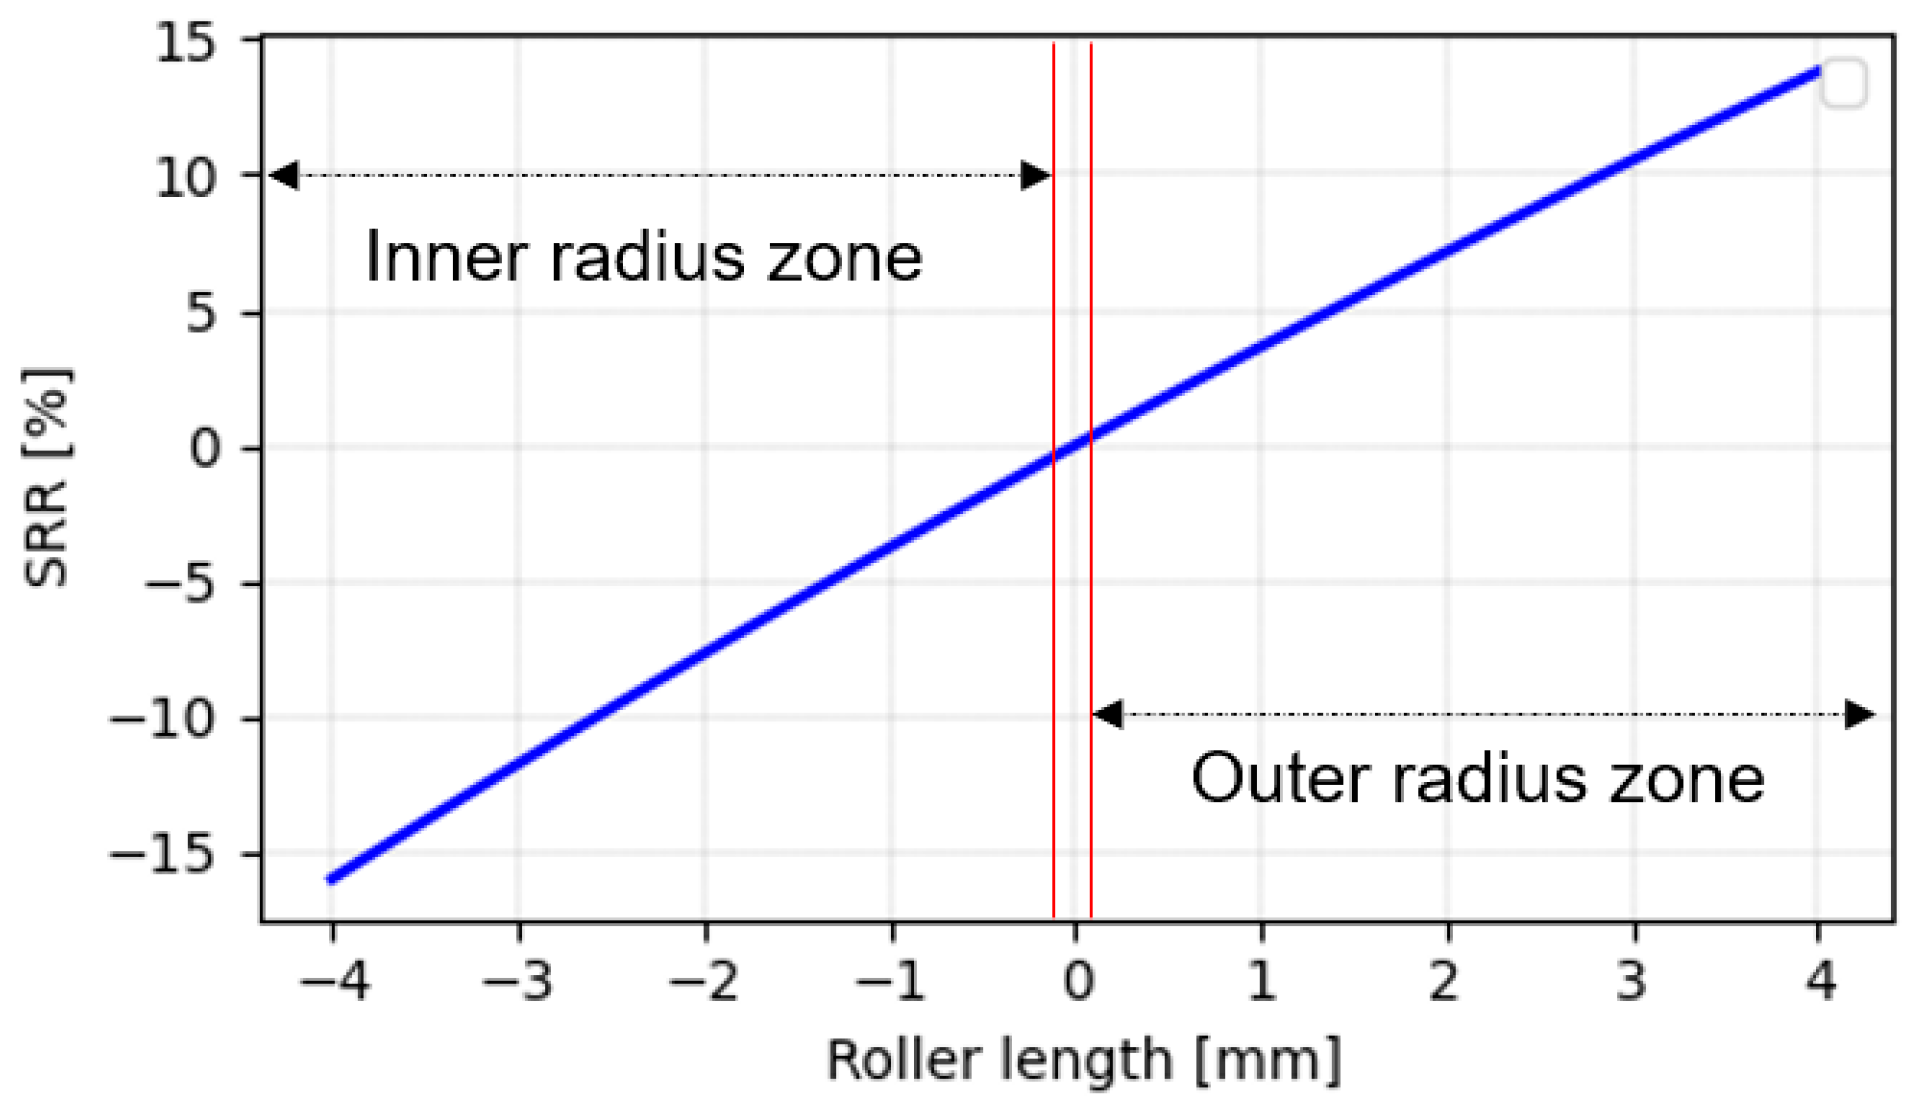
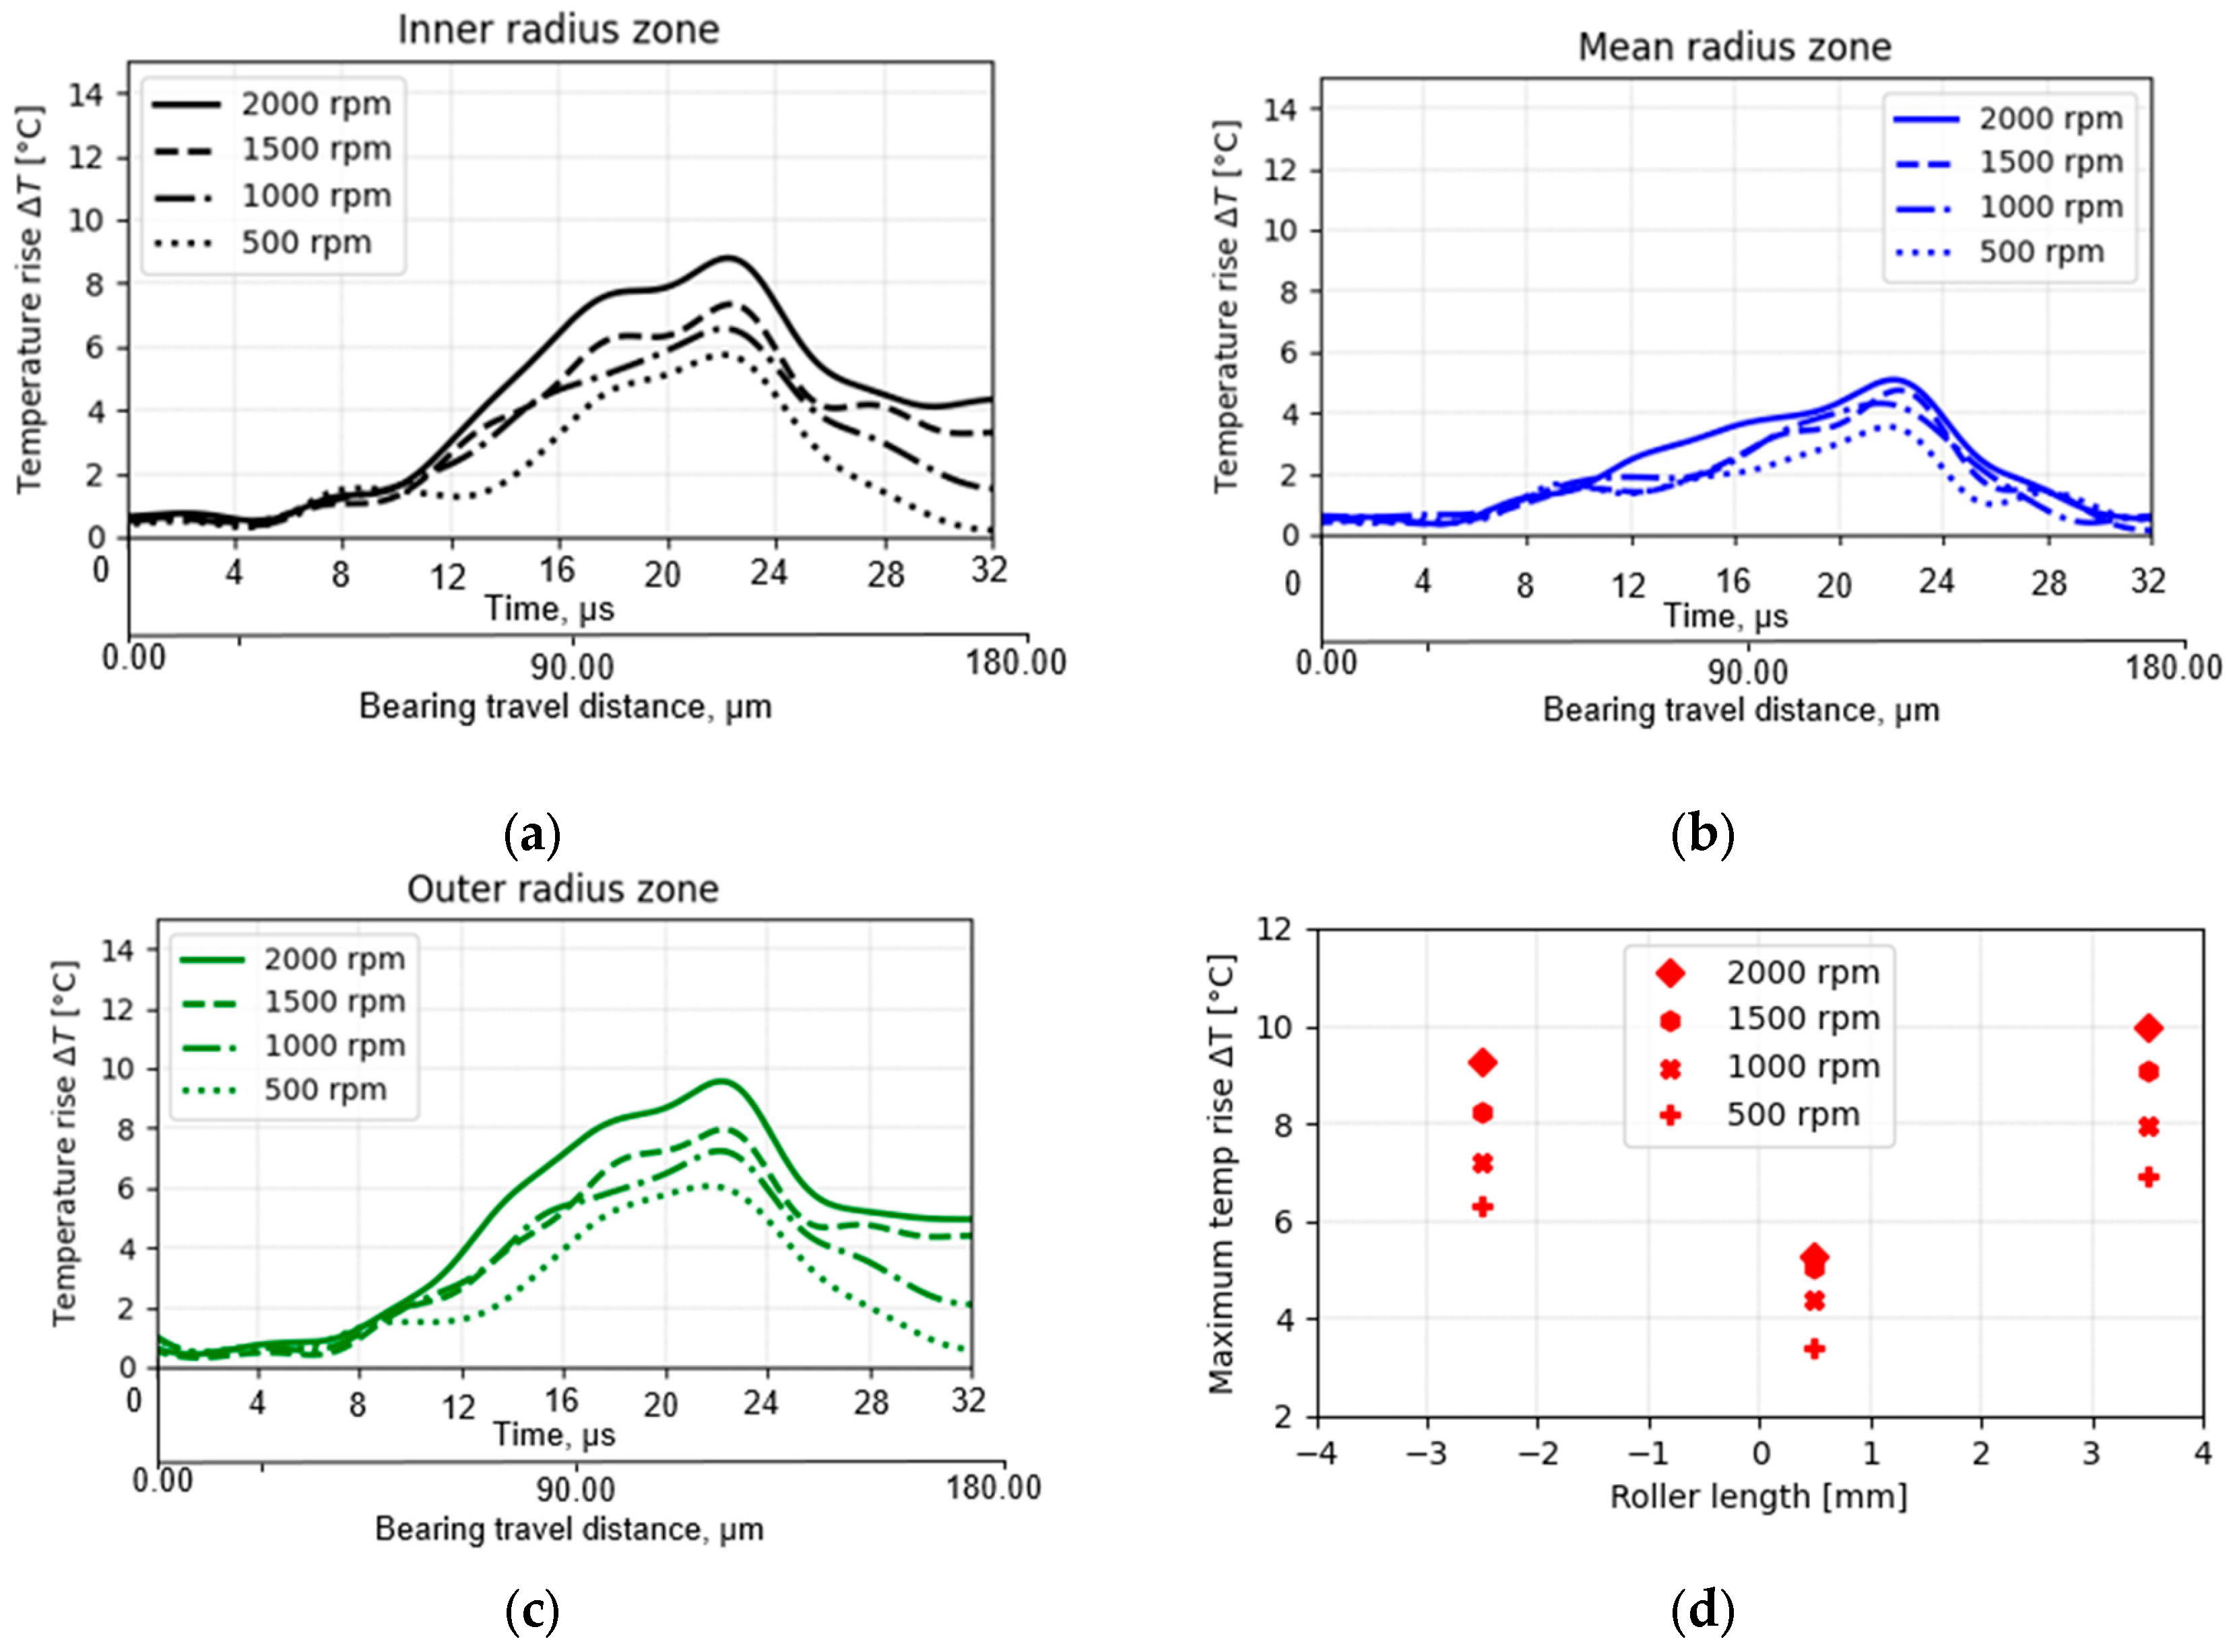
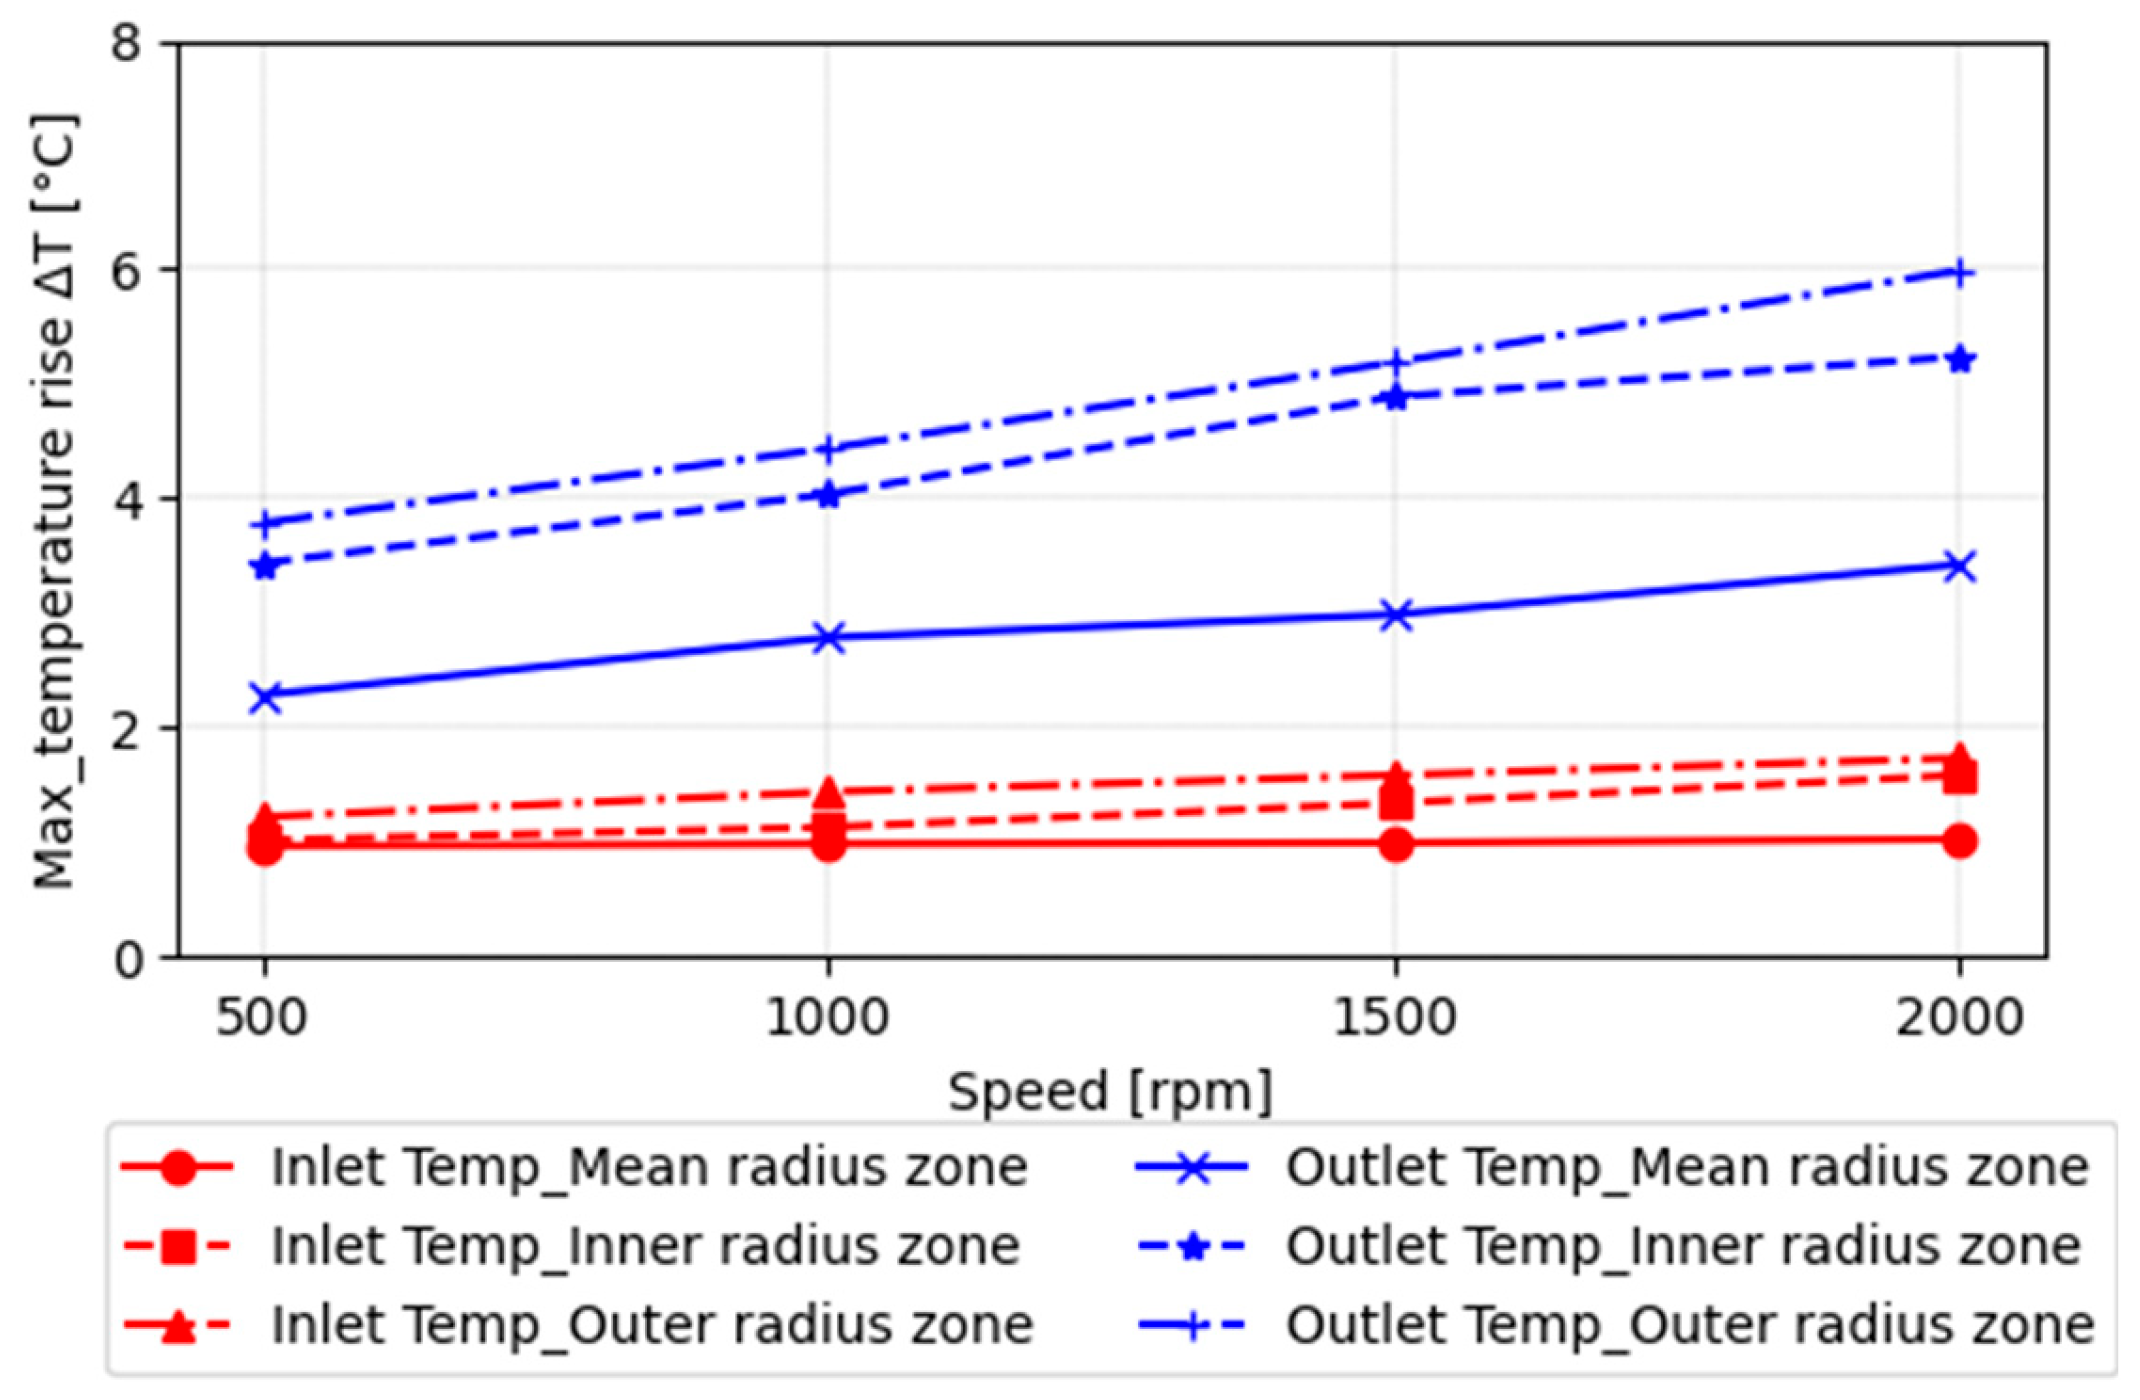
  • Slip vs. temperature rise—The experiments confirmed a direct correlation between the slip-to-roll ratio (SRR) and the temperature rise. As the SRR increases, the temperature also increases. At the pitch radius (centre of the raceway, where pure rolling occurs), the measured temperature profiles were consistently lower compared to locations near the inner or outer radii of the bearing. The temperature decreased from the inner raceway zone towards the mean radius and similarly from the outer raceway zone towards the mean radius.
  • Temperature spike—A small temperature spike was observed near the outlet region, approximately at the same location as the well-known Petrusevic spike for pressure, provided that sufficient film thickness existed for EHL operation. At lower rotational velocities or higher temperatures, leaning towards mixed lubrication, this spike tends to disappear as expected for Hertzian-like contacts. The results demonstrated that surface pressure, shear rates, sliding friction, and circumferential speed strongly influence the contact temperature.
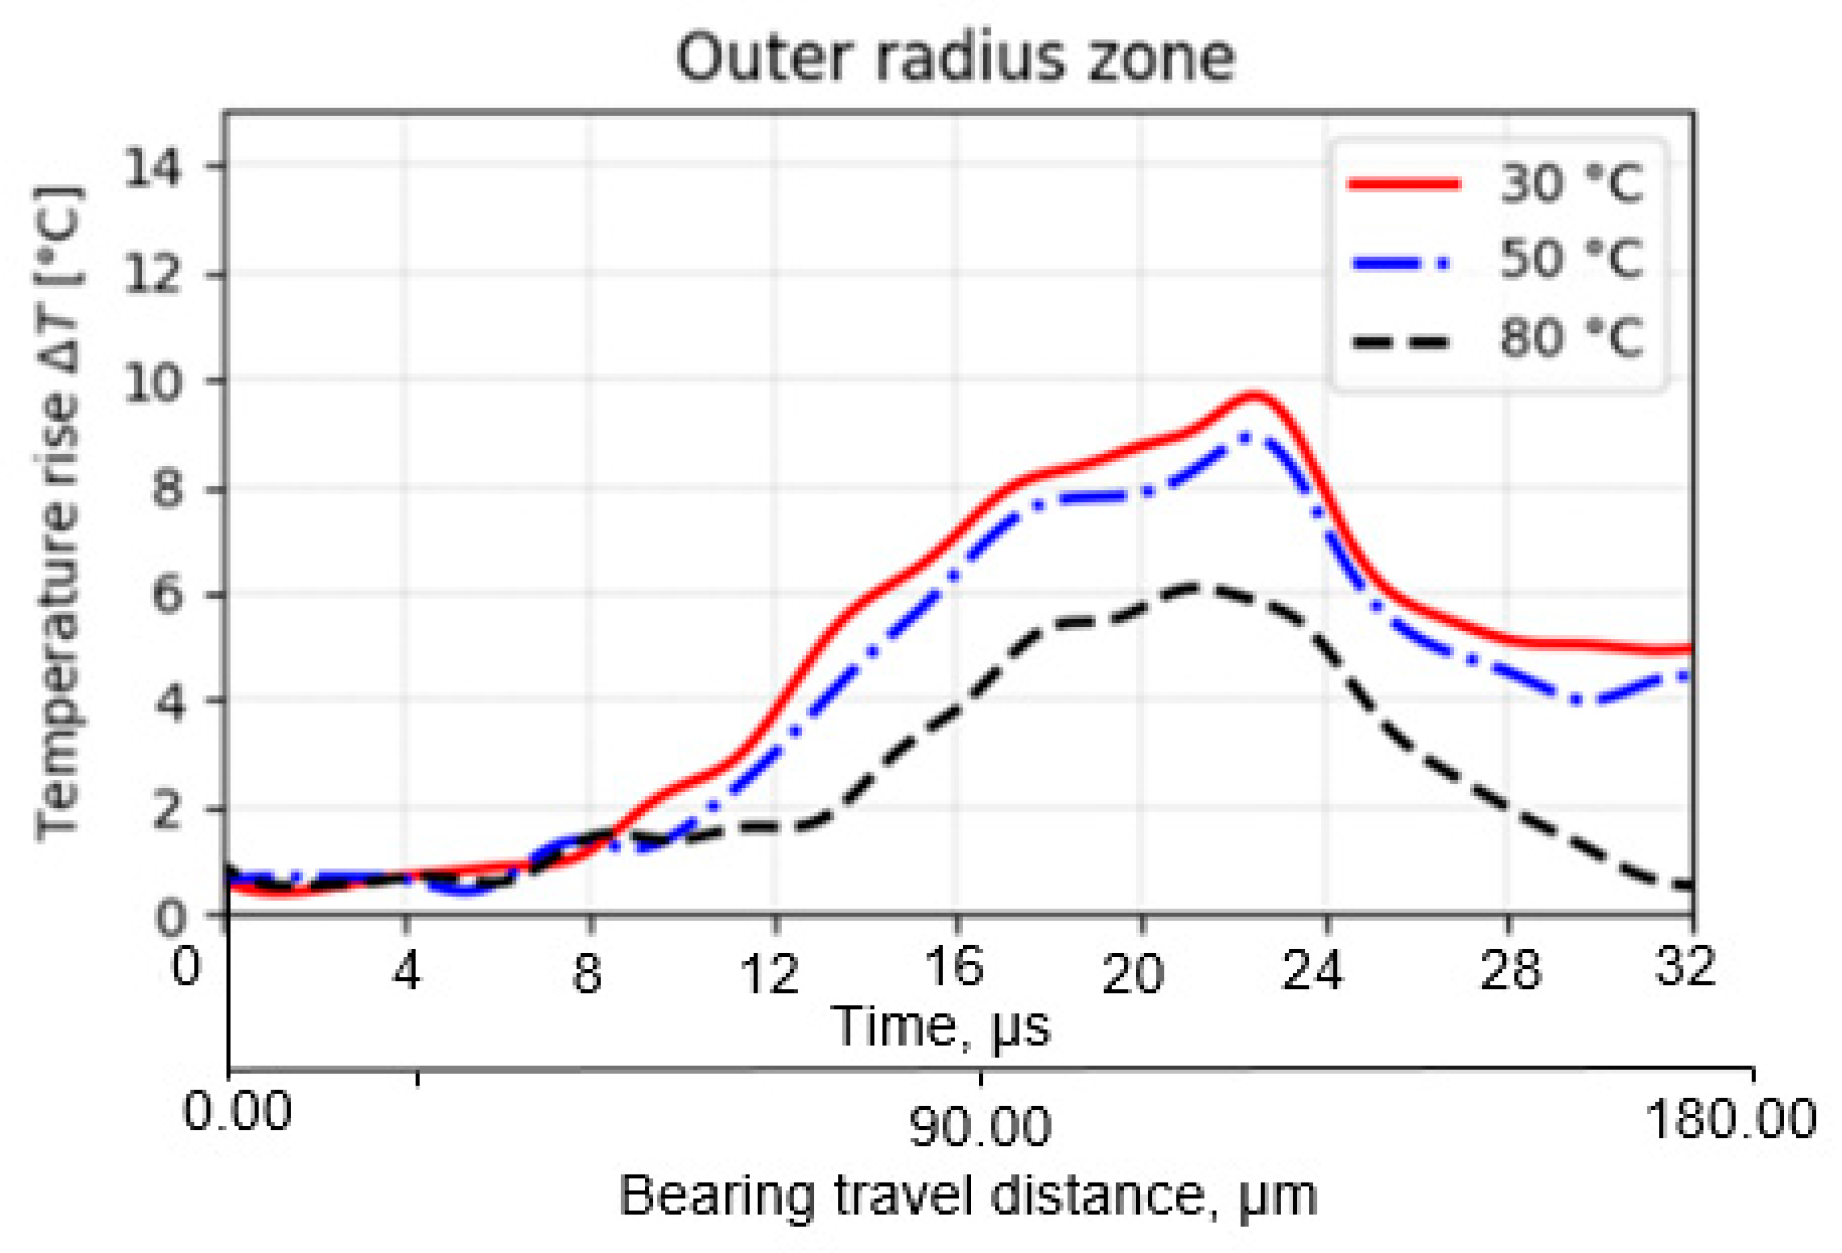
  • Inlet shear heating and Oil supply temperature—Using these thin-film sensors, it is possible to accurately measure the temperature rise in the inlet zone caused by viscous shear heating due to the recirculation of excess oil in front of the Hertzian contact area. Moreover, the contact temperature is significantly affected by the oil supply temperature, as expected. As lubricant viscosity decreases roughly exponentially with temperature, the film thickness reduces significantly at higher temperatures, as does the viscous shear heating, despite the higher shear rates. Consequently, this leads to a smaller temperature rise throughout the contact area.

6. Patents

The proposed test setup is under IP protection and covered in European patent EP4269827A1.

Author Contributions

Test rig conceptualization, M.M.; methodology, software, and validation, M.M.; resources, M.M.; writing—original draft preparation, M.M. and D.F.; supervision, D.F. and P.D.B.; project administration, D.F.; funding acquisition, D.F. All authors have read and agreed to the published version of the manuscript.

Funding

This research was funded by Flanders Make, the strategic research centre for the manufacturing industry of Flanders, Belgium, “ActiLub_SBO” project.

Data Availability Statement

Data are contained within the article.

Acknowledgments

The authors would like to extend their sincere gratitude to the Fraunhofer Institute for Surface Engineering and Thin Films (IST) in Braunschweig, Germany, for their invaluable support in embedding sensors on bearings.

Conflicts of Interest

The authors declare no conflicts of interest.

Nomenclature

bHertzian half-width contact (m)
d p Pitch diameter (m)
h Central film thickness of the oil (m)
l 1 , l 2 Sensors dimensions (µm)
u s 1 , 2 , 3 , 4 Sliding velocity (m/s)
u r a c e w a y Raceway surface velocities (m/s)
u r o l l e r Roller surface velocities (m/s)
tTime
wLoad-per-unit length (Nm)
y Distance from the pitch radius (m)
CRTBCylindrical roller thrust bearing
E Equivalent Young’s modulus (GPa)
EHLElasto–hydrodynamic lubrication
I C o n s t Excitation current (A)
FApplied load (N)
LLength of the roller (m)
M t Global frictional torque (Nm)
NNumber of rolling elements
RBTRoller-bearing tribometer
R q , r o l l e r Root mean square of roller surface roughness
R , r a c e Root mean square of raceway surface roughness
R o Initial resistance of the sensor (Ohm)
R Change in resistance (Ohm)
P R Power dissipation ( W / m 2 )
P t Change in pressure (bar)
T t Change in temperature (°C)
U r 1 , 2 , 3 Linear velocity (m/s)
U   t Measured voltage drop (V)
SRRSlip-to-roll ratio
TEHLThermo-elasto-hydrodynamic lubrication
T in _ c Temperature of oil at the entry of the Hertzian contact ( ° C ).
T b e a r i n g Bearing temperature °C
T O i l _ i n Oil inlet temperature °C
T O i l _ o u t Oil outlet temperature °C
T b e a r i n g Bearing temperature °C
α T Temperature coefficients 1/K
α p Pressure coefficients 1/bar
γ ˙ Strain rates

References

  1. Manjunath, M.; Fauconnier, D.; Ost, W.; De Baets, P. Experimental Analysis of Rolling Torque and Thermal Inlet Shear Heating in Tapered Roller Bearings. Machines 2023, 11, 801. [Google Scholar] [CrossRef]
  2. Spikes, H. Basics of EHL for Practical Application. Lubr. Sci. 2015, 27, 45–67. [Google Scholar] [CrossRef]
  3. Stratmann, A.; Jacobs, G.; Hsu, C.J.; Gachot, C.; Burghardt, G. Antiwear Tribofilm Growth in Rolling Bearings under Boundary Lubrication Conditions. Tribol. Int. 2017, 113, 43–49. [Google Scholar] [CrossRef]
  4. Paladugu, M.; Lucas, D.R.; Scott Hyde, R. Effect of Lubricants on Bearing Damage in Rolling-Sliding Conditions: Evolution of White Etching Cracks. Wear 2018, 398–399, 165–177. [Google Scholar] [CrossRef]
  5. Dieter, F.; Manjunath, M.; Ost, W. Bearing Lubrication Monitoring Probe Device, System, Method and Assembly; European Patent Office: Paris, France, 2023. [Google Scholar]
  6. Fatourehchi, E.; Mohammadpour, M.; Theodossiades, S.; Rahnejat, H. Thermal Modelling of Mixed Non-Newtonian Thermo-Elastohydrodynamics in Dry Sump Lubrication Systems. In Proceedings of the 6th World Tribology Congress, Beijing, China, 17–22 September 2017. [Google Scholar]
  7. Albahrani, S.; Philippon, D.; Vergne, P.; Bluet, J. A Review of in Situ Methodologies for Studying Elastohydrodynamic Lubrication. Proc. Inst. Mech. Eng. Part J J. Eng. Tribol. 2016, 230, 86–110. [Google Scholar] [CrossRef]
  8. Kannel, J.W.; Bell, J.C.; Allen, C.M. Methods for Determining Pressure Distributions in Lubricated Rolling Contact. ASLE Trans. 2008, 8, 250–270. [Google Scholar] [CrossRef]
  9. Cheng, H.S.; Orcutt, F.K. Paper 13: A Correlation between the Theoretical and Experimental Results on the Elastohydrodynamic Lubrication of Rolling and Sliding Contacts. Proc. Inst. Mech. Eng. Conf. Proc. 1965, 180, 158–168. [Google Scholar] [CrossRef]
  10. Orcutt, F.K. Experimental Study of Elastohydrodynamic Lubrication. ASLE Trans. 2008, 8, 381–396. [Google Scholar] [CrossRef]
  11. Hamilton, G.M.; Moore, S.L. Deformation and Pressure in an Elastohydrodynamic Contact. Proc. R. Soc. London A Math. Phys. Sci. 1971, 322, 313–330. [Google Scholar] [CrossRef]
  12. Safa, M.M.A.; Anderson, J.C.; Leather, J.A. Transducers for Pressure, Temperature and Oil Film Thickness Measurement in Bearings. Sens. Actuators 1982, 3, 119–128. [Google Scholar] [CrossRef]
  13. Taranto, J.; Stromsta, R.R.; Weir, R.C. Application of Thin Film Head Technology to a high performance head/track disk file. IEEE Trans. Magn. 1978, 14, 188–190. [Google Scholar] [CrossRef]
  14. Köhler, A. Die Entwicklung von Aufgedampften Messwertaufnehmern und Deren Anwendung Zur Druck- und Temperaturmessung in Geschmierten Wälz- und Gleitkontakten. Ph.D. Thesis, Rheinisch-Westfälische Technische Hochschule Aachen, Aachen, Germany, 1981. [Google Scholar]
  15. Simon, M. Messung von Elasto-Hydrodynamischen Parametern und Ihre Auswirkung auf die Grübchentragfähigkeit Vergüteter Scheiben und Zahnräder. Ph.D. Thesis, Technische Universität München, Munich, Germany, 1984. [Google Scholar]
  16. Oster, P. Beanspruchung der Zahnflanken Unter Bedingungen der Elastohydrodynamik. Ph.D. Thesis, Technische Universität München, München, Germany, 1982. [Google Scholar]
  17. Baumann, H. Druck- und Temperaturmessungen Mittels Aufgedampfter Dünnschichtaufnehmer in Einem Elasthydrodynamischen. Ph.D. Thesis, Universität Karlsruhe, Karlsruhe, Germany, 1985. [Google Scholar]
  18. Baumann, H. Measuring Surface Temperatures between Rolling Steel Cylinders Using Double-Layer Transducers. Proc. Inst. Mech. Eng. Part C J. Mech. Eng. Sci. 2016, 201, 263–270. [Google Scholar] [CrossRef]
  19. Peeken, H.; Ayanoglu, P.; Knoll, G.; Welsch, G. Measurement of Lubricating Film Thickness, Temperature and Pressure in Gear Contacts with Surface Topography as a Parameter. Lubr. Sci. 1990, 3, 33–42. [Google Scholar] [CrossRef]
  20. Kagerer, E. Messung von Elastohydrodynamischen Parametern Im Hochbelasteten Scheiben-und Zahnkontakt. Ph.D. Thesis, Technische Universität München, Munich, Germany, 1991. [Google Scholar]
  21. Tychsen, M. Zur Messung der Schmierspaltweite in Verzahnungen Mittels Dünnfilmsensoren. In VDI Fortschritt-Berichte, 31700; Ph.D. Thesis; VDI-Verlag: Düsseldorf, Germany, 1993; Volume 9, 171p. [Google Scholar]
  22. Holland, J.; Kühl, S. Dünnschicht-Sensoren Zur Gemeinsamen Resistiven Druck- und Temperaturmessung in Hochbelasteten Geschmierten Kontakten. Tech. Mess. 1998, 65, 48–52. [Google Scholar] [CrossRef]
  23. Mihara, Y. Measurement of Oil-Film Pressure and Strain Distribution in Engine and Machine Elements Using a Thin-Film Sensor. Tribol. Trans. 2008, 45, 11–20. [Google Scholar] [CrossRef]
  24. Sperrfechter, T.; Haller, R. Elastohydrodynamic Lubrication Between Rolling and Sliding Ceramic Cylinders: An Experimental Investigation. J. Tribol. 2000, 122, 721–724. [Google Scholar] [CrossRef]
  25. Dauber, O. Elastohydrodynamic Rolling Friction in Steel-Ceramic-Contacts. Ph.D. Thesis, Universität Karlsruhe, Karlsruhe, Germany, 2001. [Google Scholar]
  26. Kreil, O.; Schouten, M.J.W. Einfluss Der Oberflächenstruktur Auf Druckverteilung Und Schmierfilmdicke Im EHD-Kontakt. Ph.D. Thesis, Technischen Universität München, Munich, Germany, 2008. [Google Scholar]
  27. Höhn, B.R.; Michaelis, K.; Kreil, O. Influence of Surface Roughness on Pressure Distribution and Film Thickness in EHL-Contacts. Tribol. Int. 2006, 12, 1719–1725. [Google Scholar] [CrossRef]
  28. Miyata, S.; Höhn, B.R.; Michaelis, K.; Kreil, O. Experimental Investigation of Temperature Rise in Elliptical EHL Contacts. Tribol. Int. 2008, 41, 1074–1082. [Google Scholar] [CrossRef]
  29. Wilczek, A. Influence of Electrical Parameters of a Thin-Layer Sensor on the Accuracy of Pressure Measurement in an EHD Contact. J. Tribol. 2011, 133, 031504. [Google Scholar] [CrossRef]
  30. Wilczek, A. The Influence of Construction Features of a Thin-Layer Sensor on Pressure Distributions Recorded in an Elastohydrodynamic Contact. J. Tribol. 2012, 134, 011501. [Google Scholar] [CrossRef]
  31. Emmrich, S.; Plogmeyer, M.; Bartel, D.; Herrmann, C. Development of a Thin-Film Sensor for in Situ Measurement of the Temperature Rise in Rolling Contacts with Fluid Film and Mixed Lubrication. Sensors 2021, 21, 6787. [Google Scholar] [CrossRef] [PubMed]
  32. Mayer, J. Einfluss der Oberfläche und des Schmierstoffs auf das Reibungsverhalten im EHD-Kontakt. Ph.D. Thesis, Technische Universität München, Munich, Germany, 2014. [Google Scholar]
  33. Ebner, M.; Ziegltrum, A.; Lohner, T.; Michaelis, K.; Stahl, K. Measurement of EHL Temperature by Thin Film Sensors—Thermal Insulation Effects. Tribol. Int. 2020, 149, 105515. [Google Scholar] [CrossRef]
  34. Echávarri Otero, J.; de la Guerra Ochoa, E.; Chacón Tanarro, E.; Franco Martínez, F.; Contreras Urgiles, R.W. An Analytical Approach for Predicting EHL Friction: Usefulness and Limitations. Lubricants 2022, 10, 141. [Google Scholar] [CrossRef]
  35. Echávarri Otero, J.; De La Guerra Ochoa, E.; Chacón Tanarro, E.; Díaz Lantada, A.; Munoz-Guijosa, J.M. Analytical Model for Predicting Friction in Line Contacts. Lubr. Sci. 2016, 28, 189–205. [Google Scholar] [CrossRef]
  36. Manjunath, M.; Hausner, S.; Heine, A.; De Baets, P.; Fauconnier, D. Electrical Impedance Spectroscopy for Precise Film Thickness Assessment in Line Contacts. Lubricants 2024, 12, 51. [Google Scholar] [CrossRef]
  37. Havaej, P.; Degroote, J.; Fauconnier, D. Sensitivity of TEHL Simulations to the Use of Different Models for the Constitutive Behaviour of Lubricants. Lubricants 2023, 11, 151. [Google Scholar] [CrossRef]
  38. Havaej, P.; Degroote, J.; Fauconnier, D. A Quantitative Analysis of Double-Sided Surface Waviness on TEHL Line Contacts. Tribol. Int. 2023, 183, 108389. [Google Scholar] [CrossRef]
  39. Habchi, W. Finite Element Modelling of Elastohydrodynamic Lubrication Problems; John Wiley & Sons Ltd.: Hoboken, NJ, USA, 2018. [Google Scholar]
  40. Sui, P.C.; Sadeghi, F. Non-Newtonian Thermal Elastohydrodynamic Lubrication. J. Tribol. 1991, 113, 390–396. [Google Scholar] [CrossRef]
  41. Scott, S. Bair High Pressure Rheology for Quantitative Elastohydrodynamics; Elsevier: Amsterdam, The Netherlands, 2007. [Google Scholar]
Figure 1. Cylindrical roller thrust bearings and their slip.
Machines 13 00297 g001
Figure 2. Kinematics of CRTB (a) bearing velocity components and (b) roller liner velocity.
Machines 13 00297 g002
Figure 3. SRR of CRTB.
Machines 13 00297 g003
Figure 4. (a) Sensor position and (b) embedded sensors positions on test bearing.
Machines 13 00297 g004
Figure 5. Four-wire measurement of the sensor resistance.
Machines 13 00297 g005
Figure 6. SKF bearing heating cabinet.
Machines 13 00297 g006
Figure 7. (a) Thermoresistive and (b) piezo-resistive calibration.
Machines 13 00297 g007
Figure 8. Test rig and test-bearing arrangement.
Machines 13 00297 g008
Figure 9. (a) TEHL film temperature rise under conditions of 2000 rpm and T i n 50 °C and (b) computed TEHL film pressure using 2D CFD-FSI.
Machines 13 00297 g009
Figure 10. TEHL film temperature rise under conditions of 1028.6 MPa, 2000 rpm, and T i n 50 °C. Temperature distribution: (a) inner radius zone, (b) mean radius zone, (c) outer radius zone, and (d) the maximum temperature rise along the length of the roller.
Machines 13 00297 g010
Figure 11. EHL film temperature rise under conditions of 1028.6 MPa and T i n 50 °C. Temperature distribution: (a) inner radius zone, (b) mean radius zone, (c) outer radius zone, and (d) the maximum temperature rise along the length of the roller.
Machines 13 00297 g011
Figure 12. (a) Frictional torque and (b) bearing temperature under conditions of 1028.6 MPa and T i n 50 °C.
Machines 13 00297 g012
Figure 13. Critical inlet and outlet region temperature rise under conditions of 1028.6 MPa and T i n 50 °C.
Machines 13 00297 g013
Figure 14. (a) Temperature rise in the outer radius zone and (b) maximum temperature rise for different Hertzian pressures under conditions of 1500 rpm and T i n 50 °C.
Machines 13 00297 g014
Figure 15. TEHL film temperature rise under conditions of 1028.6 MPa and 2000 rpm.
Machines 13 00297 g015
Table 2. Elastic–plastic properties of the surfaces.
Sensor PositionTemperature Coefficient   α T   1/KPressure Coefficient   α P   1/bar
−Slip zone, 13.24 × 10−30.908 × 10−6
PCD zone, 23.19 × 10−30.918 × 10−6
+Slip zone, 33.22 × 10−30.923 × 10−6
Table 3. Oil FVA 3A properties [1].
FVA 3A Units
Oil typeParaffin-based solvent raffinate
Density884.1Kg/m3
Viscosity at 40 °C90.02mm2/s
Viscosity at 100 °C10.41mm2/s
Viscosity–pressure coefficient
(at 200 MPa)
2.16 × 10³ bar−1 @ 25 °C
1.58 × 10³ bar−1 @ 80 °C
Table 4. Measured COF and calculated film thickness under conditions of 1500 rpm and T i n 50 °C.
Hertzian pressure, MPa65510281285
Film thickness, µm1.080.9440.880
Shear rate, s−11.85 × 1052.11 × 1052.27 × 105
Sliding frictional torque, Nm0.5871.462.29
Bearing temperature, °C545961
Table 5. Measured COF and calculated film thickness under conditions of 1028.6 MPa and 2000 rpm.
Supply oil temperature, °C30 °C50 °C80 °C
Viscosity, Cst103.2876.7736.95
Film thickness, µm1.280.720.35
Sliding friction, Nm1.321.461.65
Bearing temperature, °C31.253.581.5
Disclaimer/Publisher’s Note: The statements, opinions and data contained in all publications are solely those of the individual author(s) and contributor(s) and not of MDPI and/or the editor(s). MDPI and/or the editor(s) disclaim responsibility for any injury to people or property resulting from any ideas, methods, instructions or products referred to in the content.

