Abstract
In induction motor bearings, distributed faults are prevalent, often resulting from factors such as inadequate lubrication and particle contamination. Unlike localized faults, distributed faults produce complex and unpredictable motor signal behaviors. Although existing research predominantly addresses localized faults in mains-fed motors, particularly single-point defects, a comprehensive investigation into particle contamination in bearings of inverter-fed motors is essential for a more accurate understanding of real-world bearing issues. This paper conducts a comparative analysis of vibration, stator current, speed, and acoustic signals to detect particle contamination through signal analysis across three domains: time, frequency, and time-frequency. These domains are analyzed to assess and compare the characteristics of each monitored signal in the context of bearing wear detection. The data were collected from both steady-state and startup transients of an induction motor controlled by a variable frequency drive. The experimental results highlight the most significant characteristics of each monitored signal, evaluated across the different domains of analysis. The primary conclusion indicates that, in inverter-fed motors, sound and vibration signals exhibit abnormal levels when the bearing is damaged but the related-fault signature becomes complicated. Additionally, the findings demonstrate that the analysis of startup stator current and speed signals presents the potential to detect distributed bearing damage in inverter-fed induction motors.
1. Introduction
Induction motors (IM) are essential components in the manufacturing sector due to their high reliability, efficiency, and low maintenance requirements. However, under extreme operating conditions, such as high inertia loads, demanding processes, or harsh environments, these machines are susceptible to failures, which can result in substantial economic losses that far exceed the initial cost of the motor. Rolling bearings are essential components to support the rotating shaft and guarantee proper alignment between the rotor and the mechanical load. According to [1], bearing faults (BF) are responsible for 41% of all motor failures in the industry, highlighting the importance of early detection for preventive maintenance to mitigate severe damage, reduce unplanned downtime, and improve overall productivity. Taking these factors into account, condition monitoring (CM) and utilising operational signals to identify diagnostic features become a crucial approach to achieving these goals [2,3]. As much as 80% of bearing failures are related to lubrication, and more than one-third of these are the result of contaminated lubricant [4]. Contamination occurs when particles enter the bearing or are produced inside. During bearing operation, these particles are pressed between balls and raceways, forming craves on the last [5]. This raises machine vibration and increases heat generation. The lubricant efficiency is then reduced, which accelerates corrosion and increases friction and wear, which can lead to the accumulation of more particles inside the bearing. Lubrication grease and oil can be contaminated during bearing operation due to seal malfunctioning, during storage and mounting or because of additive product depletion [4]. Bearing faults can be classified as localised and distributed [6]. This last type affects all bearing components and produces a more widespread degradation. Bearing particle contamination is considered a distributed type fault as it affects lubrication and all bearing components [7]. As will be seen in the following, the literature on detecting localized faults is extensive but not so much for detecting distributed faults. In these works, the study is focused on the isolated bearing of the machine, and for the detection of the fault, indicators calculated in the time domain, such as RMS, peak, peak-to-peak, or kurtosis, are used [7,8]. The signals monitored in these studies are vibrations, sound, and acoustic emissions [8]. In localized fault studies, if the bearing is integrated into an electrical machine, the stator current can also be monitored, and the analysis uses indicators in the frequency domain. This signal offers the following advantages compared to the above-mentioned: (a) it is non-invasive; (b) the required sensor is not special; (c) it is suitable for online monitoring [8].
With the accelerated advancement of computational technology and branches of artificial intelligence, such as machine learning and deep learning, knowledge-based (KB) approaches have increasingly focused on automatic diagnosis to support health-related decisions in IM. The literature on localized bearing fault detection and diagnosis is extensive. For example, in [9,10], a principal component analysis allows the selection of the most representative features for classification purposes by reducing the dimensionality of the data. In [11], the partial least squares method was used as a regression tool to estimate the parameters of a variational predictive model used to identify a faulty rolling bearing. Ref. [12] uses a support vector machine to classify bearing failure modes effectively. Recent developments in deep learning techniques also allow the identification of faulty bearings. Of particular interest is the use of convolutional neural networks [13], auto-encoders [14], deep belief networks [15], recurrent neural networks [16], generative adversarial networks applied to imbalanced scenarios [17], and other variants [18,19]. KB methodologies cited can simulate the performance of a functional machine and assess whether the performance of the target motor differs from that of a healthy motor. These KB-based algorithms achieve detection accuracies greater than 90%. However, all of these approaches require extensive information on different operating scenarios to maintain the ability to generalize, which requires a large amount of data [20]. However, such an amount of data is generally unavailable for faulty scenarios [21], and in the case of inverter-fed motors, it introduces noise that can sometimes hinder the development of automatic diagnostic approaches [22].
In addition, signal-based (SB) condition monitoring methods have advanced to identify bearing faults in induction motors. Several research groups have used time-domain features extracted from measured signals for motor diagnosis [23]. However, the robustness of these time-domain features is affected by factors such as environmental and measurement noise, limiting their efficacy.
Frequency-domain signal analysis is an alternative to time-domain analysis and has provided better fault detection reliability. Several techniques based on the frequency domain have been developed and used in industrial systems to detect particular signatures in the spectrum of measured signals [24,25,26]. Approaches focused on steady-state conditions for detecting faults in induction motors may encounter certain limitations in their practical application. This is because achieving these conditions in the industry can be challenging, and even the oscillating behaviour of low loads can cause false fault indications, contributing to reduced diagnostic performance [27].
Lately, it has been shown that the analysis of signals collected during IM startup transients provides effective information for fault detection and avoids some false indicators that can occur in the analysis of stationary signals [28,29,30]. The study of non-stationary signals is known as time-frequency (t-f) analysis and offers significant benefits over the occurrence and magnitude of characteristic frequencies by considering their temporal evolution. A recent publication in 2024 considers that machine learning approaches can benefit from features extracted in the time-frequency domain [8]. Recently, transient-based approaches for fault detection have been proposed in the t-f domain [31,32,33] to improve the effectiveness of BF diagnosis. In addition, recent advances in digital instrumentation allow for the acquisition of alternative vibration signals at a reasonable cost. Vibration signals have been widely used to diagnose main-power machines. Most diagnostic methods have been proposed for this mains power supply. As a result, there is scientific interest in understanding what happens to the diagnostic capability of different types of signals for fault detection with inverter power supply. Comparison and evaluation of the effectiveness of various monitoring signals for the analysis of bearing fault detection techniques are essential and relevant given the significant presence of motors in countless applications.
The primary purpose of this paper is to conduct a comparative study of various signals for detecting particle-bearing contamination. Most of the existing literature on this topic focuses on bearings installed in test benches where the bearing is isolated from other sources of vibration [8,34,35,36]. In contrast, this work presents a study of bearing contamination detection within an inverter-fed induction machine, which presents greater challenges for fault detection. This paper provides a comprehensive comparative analysis of different signals to evaluate their effectiveness in detecting particle contamination in bearings, which is characterized as a distributed fault type. The signals compared include vibration, sound, stator current, and rotor speed. The inclusion of stator current and rotor speed in this analysis represents an aspect not previously studied in this context. In many industrial environments, abrasive bearing wear is typically caused by inadequate lubrication or the intrusion of hard contaminants. This study aims to evaluate which signals and analysis domains (time, frequency, and time-frequency) are most suitable for the early detection of bearing contamination in inverter-fed motors. To our knowledge, this comparative analysis is being conducted for the first time. The signals were recorded while the motor operated under steady-state conditions and during startup transients. A systematic comparison and high-resolution analysis of the monitored signals enabled to evaluate the effectiveness of each signal in detecting bearing wear failures in induction motors, highlighting their advantages and limitations. In this study, data were collected by subjecting the bearing of an induction motor to a controlled destructive testing process, in which silicon carbide (SiC) particles were introduced into the bearing.
2. Theoretical Background
This section details bearing failure signatures based on the monitored signal and explains the frequency domain technique and time-frequency decomposition used for comparison.
2.1. Signatures in the Vibration Spectrum
Rolling bearings are known to have cyclical movement at a constant rotational frequency, and their vibrations can be modelled by periodic behaviour. An anomaly in the mechanical structure of the rolling element (defective bearing) causes a characteristic frequency to arise in the vibration spectrum. The characteristic pattern of the fault is a function of the mechanical frequency of the rotor and the geometry of the bearing. There are four bearing defects distinguished by periodic vibrations. These four fault-related frequencies, which are the inner ball pass (), the outer ball pass (), the ball spin frequency (), and the fundamental train frequency (), are given by:
where is the number of balls in the bearing, is the pitch or cage diameter, is the diameter of the balls, and is the contact angle between a ball and the raceway. In induction motors, the mechanical speed of the rotating magnetic field and the mechanical speed of the rotor are related as follows:
where s is the dimensionless parameter known as slip, and and are the respective speeds in of the rotating magnetic field and the rotor. Taking into account that the mechanical speed and the frequency in are related by , the following equation can be derived:
where is the frequency of the rotating magnetic field or the frequency of the voltage supply, and p is the number of pole pairs of the machine. Equation (6) can be introduced in Equations (1)–(4). Therefore, these fault-related frequencies will depend on the frequency of the voltage supply and the level of motor load through the slip.
2.2. Fault Signatures in the Stator Current Spectrum
Bearing defects produce slight airgap modifications that affect the airgap flux density, and this generates additional components in the stator current of an inverter-fed induction motor according to the following equations [37]:
where is the fundamental frequency of the supply voltage, k is the harmonic order of the fundamental frequency supply, (, , , and ) are the vibration characteristic frequencies, which are directly related to the rotor frequency, and n is the harmonic order of the vibration fault related frequency. Radial rotor movement produced by the bearing faults results in additional signatures in the stator current, which are explained in [38]:
2.3. Signatures in the Rotor Speed Spectrum
The vibration components of the characteristic frequencies of the fault impact the induction motor as torque oscillations that produce speed ripples. Consequently, vibrations are reflected in the shaft speed as additional frequency components. The total load torque of the induction motor can be described as follows:
where is the principal mode of the torque, and , , and are the amplitude, angular frequency, and phase of the bearing fault oscillation, respectively. This leads to an effect of the torque on the rotor speed, which can be expressed by:
where J is the total inertia of the mechanical system and is the constant value of the rotational speed. The effect of the fault-related speed oscillations on the stator current is, therefore, a frequency modulation, which is equivalent to a non-stationary spectral content.
2.4. Signatures in the Sound Spectrum
The sound emissions of inverter-driven induction motors are significantly impacted by vibrations and electromagnetic noise produced by the stator current properties associated with inverter operation. The characteristic frequencies of sound are a function of the inverter control switching frequency and the fundamental supply voltage frequency :
If is an odd integer, will be an even integer and vice versa, that is, , , and , . The harmonics with frequencies = even and = odd will dominate for lower modulation indices of the controller. For a higher modulation index, the harmonics with frequencies and = even play a more significant role in the sound spectrum [39].
2.5. Minimum Norm
Subspace methods based on eigenanalysis have recently been proposed in the literature [40,41] due to their better frequency estimation and resolution capabilities than classical spectral methods such as the Fourier transform or quadratic distributions. This is particularly relevant with low signal-to-noise ratio (SNR) signals, where the latter techniques fail to estimate and distinguish close frequency components due to spectral leakage and noise interference. The Minimum-Norm technique belongs to this family of subspace methods and can decompose multicomponent signals, providing high resolution and high accuracy on spectral estimations. This algorithm considers that signals are multicomponent and embedded in additive noise. The signals are modelled in the discrete-time domain as follows:
where is the angular frequency vector , which is composed of sinusoids uniformly distributed over the interval , denotes the l-th component, and is white Gaussian noise with zero mean , and variance . This method uses an eigendecomposition of the signal to obtain the orthogonal subspace, and from this orthogonality condition, the power spectral density (PSD) of is given by:
where and are interpreted as weights in the eigenspace algorithm. The expression (18) exhibits spectral singularities at the frequencies of the principal sinusoidal components while avoiding spectral leakage and spurious peaks in the spectrum estimation.
2.6. Short-Time Minimum Norm
Short-Time Minimum Norm (STMN) is a technique used to examine signals whose frequency content varies over time. Unlike traditional frequency analysis, which assumes that the signal is stationary, STMN allows for the analysis of non-stationary signals by sectioning them into smaller time segments. This method provides a high-resolution time-frequency representation. It provides a detailed picture of how the frequency signatures of a signal evolve throughout its duration. It is particularly useful in signal analysis where system behavior changes dynamically, such as in induction motor systems. The time-frequency representation of the signal can be computed by dividing it into overlapping frames, multiplying each frame by an analysis window, and applying the Minimum Norm algorithm to each frame as follows [42]:
where is the signal length, k is the signal index, is a rectangular sliding window, m is the analysis window index, l is the leap size between consecutive sections, t is the time index, and f is the frequency index in the decomposition.
3. Experimental Setup
The experimental tests were conducted on the laboratory bench, as shown in Figure 1. The test bench is equipped with a three-phase induction motor, model AEG AM 80 NY4, with the following specifications: rated power: 0.75 kW; rated frequency: 50 Hz; rated voltage: 400 V ± 10%; rated current = 2.05 A; stator connection: star; rated speed = 1400 rpm; power factor: 0.75; rotor slots: 24. This machine is loaded with a magnetic powder brake, producing a constant load torque. The motor incorporates an SKF Explorer 6004 bearing, with technical specifications detailed in Table 1. This machine is powered by an ABB inverter, model ACS355-03E-15A6-4, with the following specifications: Rated power: 4 kW; Rated voltages: 380 to 480 V; PWM switching frequency: 4 kHz.
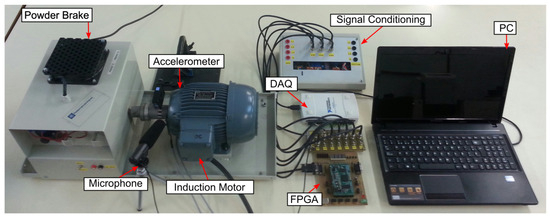
Figure 1.
Experimental setup of the test bench.

Table 1.
Technical specifications of SKF Explorer 6004 bearing.
The test bench, as seen in Figure 1, was equipped with sensors to measure different physical variables as described below:
- Stator current was measured using a Hall-effect transducer by LEM, model LA25-P.
- Rotor speed was measured using an optical sensor from Datalogic, model S60-PA-5-W08-NH.
- Sound was measured using a directional microphone, model SG-108.
- Vibration signals were collected with a triaxial accelerometer by STMicroelectronics. The best results were obtained along the x-axis (see Figure 2a) because vibrations in induction motors are typically radial.
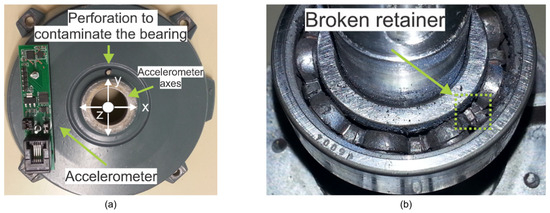 Figure 2. (a) Motor side cover with the hole for particle ingression; (b) 6004-Type deep groove ball bearing with abrasive wear.
All these signals were collected using a National Instruments DAQ board, model NI-6210, which features an ADC with 16 bits of resolution. The sampling frequency was 16.384 kHz.
Each laboratory test consisted of a controlled start followed by a time when the motor ran at a constant speed. The inverter controlled the 10 s startup transient, linearly increasing the frequency from 0 to the final value of Hz using a scalar control . For this study, mechanical and electrical variables were recorded for a time interval of 20 s. The recording included 10 s of start transient and 10 s of steady-state regimes.
The motor was considered healthy in the first set of tests, where a new and adequately lubricated bearing was used. The bearing lubricant is then externally contaminated with silicon carbide (SiC) powder. Bearing contamination is performed incrementally by adding this SiC powder through a hole in the side cover of the motor. Figure 2a shows the side cover with the hole made to contaminate the lubricant. Figure 2b shows one of the bearings mounted with SiC contamination. Figure 3 describes the experimental procedure designed to replicate the contamination of a bearing with external particles until its total failure.
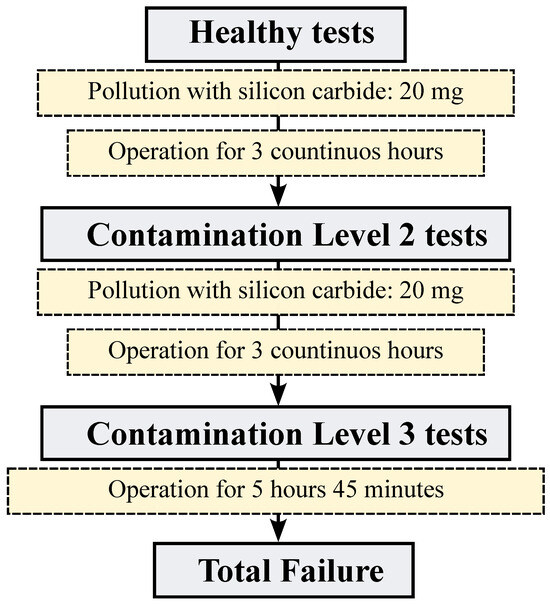
Figure 3.
Detailed description of the experimental procedure to emulate the bearing external contamination with SiC particles.
4. Experimental Results
4.1. Time-Domain Analysis
Figure 4 and Figure 5 show some signals captured by the accelerometer, the current sensor, the optical sensor, and the microphone. These figures present time domain signals recorded during the experiments for different bearing health conditions: non-contaminated or healthy bearing, contamination level 2 (CL2), and contamination level 3 (CL3) (see Figure 3 for an explanation of contamination levels). Figure 4a shows vibration signals, , which illustrate the mechanical responses of the motor frame at varying levels of bearing contamination. Figure 4b displays stator current signals, , exposing the influence of the startup transient and rated load on the electrical signals even when the motor had not started to rotate (0 s to 2 s). Figure 4c shows speed signals, , which capture the dynamics of the rotor under the tested conditions. It should be noted that the instantaneous speed of faulty cases is lower than that of healthy cases due to bearing wear, leading to poorer motor efficiency. Finally, Figure 4d displays sound signals, , which demonstrate the acoustic changes associated with each level of contamination.
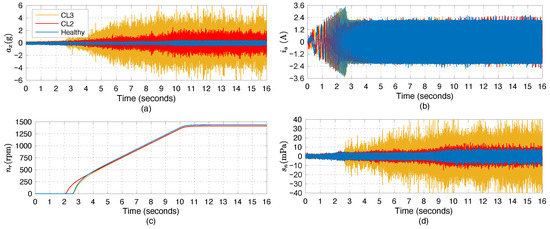
Figure 4.
Experimental results of rated-load motor operation. Time-domain signals comparison of healthy bearing and two contamination levels for the following: (a) Vibration, (b) Stator current, (c) Rotor speed, and (d) Sound.
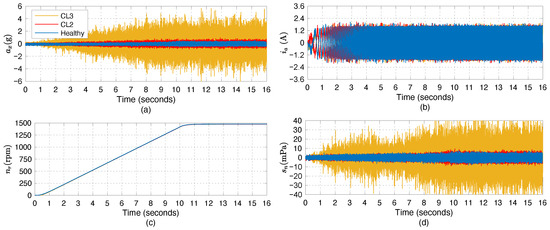
Figure 5.
Experimental results of no-load motor operation. Time-domain signals comparison of healthy bearing and two contamination levels for the following: (a) Vibration, (b) Stator current, (c) Rotor speed, and (d) Sound.
The above-mentioned results belong to experimental trials conducted on motors operating under rated load conditions. Likewise, Figure 5 presents the results of the same experimental trials when the motor operates under no-load conditions. Figure 4 and Figure 5 show that motor vibrations and emitted sound increase as the level of particle contamination of the bearing increases, compared to the uncontaminated cases. The analysis of the experimental tests demonstrates that as SiC particles contaminate the rolling bearing, the mechanical load is affected by the friction generated. As the mechanical load increases, the motor decelerates, increases the slip, and elevates the induced voltage and rotor current. This disruption results in a loss of proper lubrication, leading to increased vibrations and consequently generating higher levels of sound.
To quantify the changes shown by the motor measurements, the following time-domain characteristics were evaluated:
where is the signal energy, is the arithmetic mean, and is the variance. These characteristics are commonly employed in fault detection methodologies, as each provides a distinct characterization of the signal. Specifically, the mean represents the overall trend of the signal, the variance quantifies signal fluctuations around the mean, and the energy reflects the intensity of the overall measurement. Table 2 and Table 3 show the results of these statistics calculated for each motor health condition and motor load. The values in the tables are the average of five laboratory tests.
Table 2.
Time-domain statistical features for measured signals of the motor at rated-load.
Table 3.
Time-domain statistical features for measured signals of motor under no-load.
Figure 6 and Figure 7 show histograms of the signals captured in the experimental tests. These histograms illustrate the statistical distribution of signal amplitudes for the various bearing states. Figure 6a displays the vibration distribution, and the experimental results reveal notable variations in the distributions of these mechanical variables as the level of bearing contamination increases. Figure 6b presents the histograms of the stator currents. The histogram shape corresponding to the CL2 condition exhibits a slight increase in the density distribution as the degradation of the bearing progresses, while the CL3 condition shows a considerable increase. Figure 6c presents the probability density distribution for the speed signals, and this statistical analysis captures the shifts in the asynchronous speed under the different motor health conditions. This result corroborates the findings presented in Figure 4c, where a slight decrease in speed is observed as the bearing undergoes more significant wear. The histograms of the sound signals are illustrated in Figure 6d; the distributions demonstrated changes in the amplitudes of the acoustic signal correlated with the progression of bearing contamination.
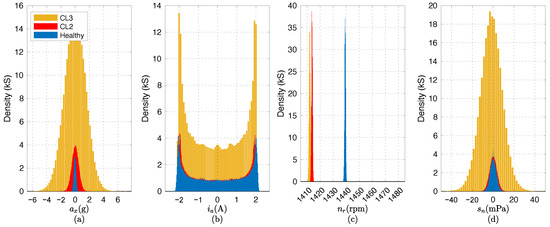
Figure 6.
Experimental results of rated-load motor operation. Probability density functions comparison of healthy bearing and two contamination levels for: (a) Vibration, (b) Stator current, (c) Rotor speed, and (d) Sound.
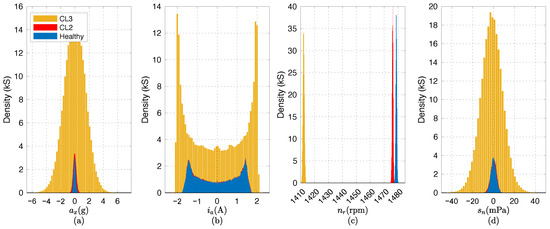
Figure 7.
Experimental results of no-load motor operation. Probability density functions comparison of healthy bearing and two contamination levels for: (a) Vibration, (b) Stator current, (c) Rotor speed, and (d) Sound.
Figure 7 presents the histograms of the same tests conducted for Figure 6 but with the motor operating under no load. These figures facilitate the assessment of the load torque’s impact on the motor analyzed’s physical variables. Figure 7c shows that lower load levels result in higher rotational speeds (up to 1480 rpm) and lower current consumption by the motor (approximately 1.6 A). Notably, these two monitoring signals, current and speed, provide critical information for distinguishing between a healthy bearing and one with advanced wear based on the statistical characteristics of the signals in the time domain.
The histogram shapes (probability density distributions) displayed in Figure 6 and Figure 7 can provide a comparative comparison of the different signals in the time domain. The calculation of some statistics facilitates the identification of patterns associated with the progression of bearing wear. Vibration distributions under healthy conditions are concentrated around a zero mean value with minimal variability and low density. As the bearing deteriorates due to SiC contamination, the arithmetic mean remains constant; however, the distributions exhibit a broader spread and higher density in the central amplitude ranges, showing increased mechanical instability. Similar behavior is developed by the sound levels generated by the motor. Particle contamination leads to a higher density and broadening of the sound distribution, reflecting the increase in acoustic emissions associated with bearing wear. Lately, the rotor speed distribution remains relatively concentrated around its central value in healthy states. However, it exhibits a broader spread for CL2 and CL3 contamination levels, which implies increased speed fluctuations due to mechanical imbalances.
The statistics calculated from the histograms (see energy, mean, and variance in Table 2 and Table 3) confirm the mechanical instability of the bearing as its contamination increases. The experimental results show that the temporal information provided by the mechanical variables helps to detect progressive bearing wear. Although sound and vibration signals exhibit evident changes in the time domain (see Figure 4 and Figure 5), these measurements are sensitive to external interference, measurement noise, and environmental interference [43,44]. In industrial applications, it is difficult, if not impossible, to isolate motors from external sounds, vibrations, or measurement errors for condition monitoring purposes. Consequently, the time-domain characteristics are unreliable indicators for early fault detection techniques, mainly when motors operate in harsh environments.
4.2. Frequency-Domain Analysis
On the other hand, frequency-domain analysis, also well-known as spectral analysis, is less sensitive to external interferences than time-domain analysis, and it offers several advantages over time-domain statistical features, especially for detecting faults in rotating machines. Figure 8 and Figure 9 show spectra of the motor operating under rated load and no-load, respectively.
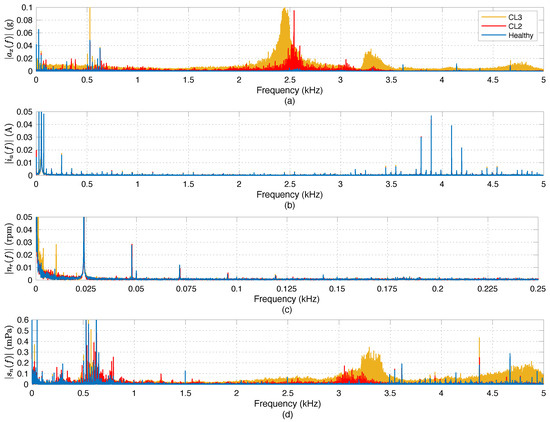
Figure 8.
Experimental results of rated-load motor operation. Spectra comparison of healthy bearing and two contamination levels for: (a) Vibration, (b) Stator current, (c) Rotor speed, and (d) Sound.
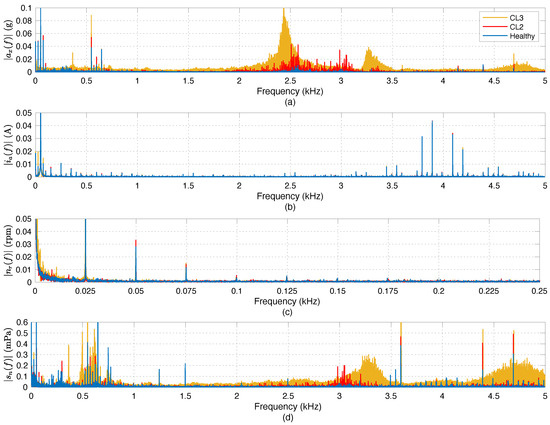
Figure 9.
Experimental results of no-load motor operation. Spectra comparison of healthy bearing and two contamination levels for the following: (a) Vibration, (b) Stator current, (c) Rotor speed, and (d) Sound.
Figure 8a and Figure 9a show some acceleration signal spectra and reveal the natural vibration components resulting from motor rotation. These frequency components are located at , and their integer harmonics (2nd, 3rd, and 7th) are also observed in the low-frequency band. Other frequency components with significant amplitudes are also in the range of 500 to 750 Hz. These components correspond to the rotor frequency’s 21st, 22nd, and 23rd harmonics. It is important to note that the harmonics associated with the bearing geometry ((1)–(4)) are also present in the spectrum of the healthy motor, although with relatively small amplitudes. Furthermore, the 22nd harmonic (at 528 Hz) exhibits a notable increase in amplitude as the bearing experiences severe wear. It has been observed that as the level of SiC contamination in the bearing increases, the number of components in the intermediate frequency range (2 to 3.5 kHz) also increases. In addition, the amplitude of these frequencies becomes larger and broader. A comparison of current spectra for healthy and faulty states (Figure 8b and Figure 9b) shows that the magnitude of the current components does not exhibit significant changes when the motor operates in a faulty and steady state. The most prominent current harmonics include the fundamental component at 50 Hz and the harmonics generated by the electronic power converter.
Figure 8c and Figure 9c present the rotor speed spectra of the motor under the three different health conditions. These spectra are shaped by an irregular noise floor with few harmonic components in the high frequency region, which is attenuated due to the inertia of the rotor and load (15). In contrast, the low-frequency band (0 to 250 Hz) displays the first six harmonics of the rotational speed , with amplitudes decreasing as the harmonic order increases. The speed spectrum for the case with the most worn bearing reveals the presence of a fundamental train fault; this is suggested by the appearance of the harmonic component at 10 Hz and two additional components at 1.6 and 3.2 Hz.
Figure 8d and Figure 9d illustrate the power spectral density of the sound signals for the healthy and fault motor before total bearing failure. A dissimilarity is observed among the spectral content of these three conditions: When the motor is healthy, only spectral lines associated with the rotational frequency of the rotor , are present. The presence of other frequency components is insignificant. In contrast, for faulty levels CL2 and CL3, several high spectral density peaks are evident across the high-frequency range, and the noise floor level increases as the bearing wear progresses. The spectral lines corresponding to the rotational frequency become increasingly indistinct in both the rated-load and no-load conditions. This overlap is due to the spectral variance from the distributed damage within the bearing system, which conceals the rotational frequency components and makes their identification more challenging.
A detailed analysis of the experimental results reveals that in the vibration spectra, the most significant changes occur around the 2.5 kHz frequency range. Both contamination levels (CL2 and CL3) exhibit increased amplitude and spectral density compared to the healthy case, with the CL3 condition showing the highest energy levels, suggesting a more severe impact of particle contamination on the bearing structure. For the stator current, the most noticeable deviations are observed at very low frequencies, particularly below 75 Hz, where slight increases in amplitude at specific frequencies are detected compared to the healthy case. This effect may be attributed to a possible shaft misalignment caused by bearing wear. Rotor speed fluctuations exhibit significant spectral variations mainly in the low-frequency range, particularly below 125 Hz, where both contamination levels introduce additional peaks. Lastly, in the sound spectrum, the effects of the SiC particles are most pronounced in the higher frequency range above 2.5 kHz, where both the CL2 and CL3 conditions show elevated amplitude levels relative to the uncontaminated case. These findings highlight the potential of spectral analysis as a valuable tool to detect distributed faults in rolling bearings.
To quantify spectral density, Figure 10 illustrates a comparative analysis of the spectral energy of each signal at varying contamination levels and under two different load conditions. Quantitatively, the spectral density of the stator current in Figure 10b and the motor speed in Figure 10c signals do not exhibit a significant correlation with the progression of bearing wear. This lack of a clear trend suggests that the total spectral energy is not a reliable indicator of bearing degradation for these physical variables. In contrast, the spectral energy of both sound (Figure 10c) and vibrations (Figure 10a) demonstrates a direct, proportional and almost linear relationship with bearing wear. As the contamination level increases from uncontaminated to CL2, there is a noticeable positive trend in the total energy values for both acoustic emission and mechanical vibrations. This trend indicates that spectral energy is suitable and effective for monitoring and diagnosing distributed bearing failures, even for an incipient stage.
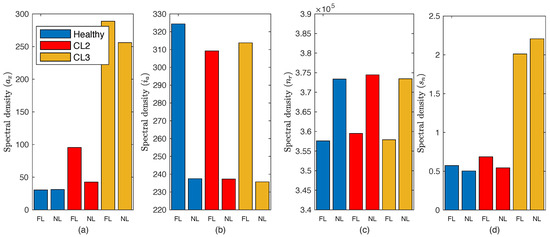
Figure 10.
Experimental results of full-load and no-load motor operation. Spectral energy comparison of healthy bearing and two contamination levels for the following: (a) Vibration, (b) Stator current, (c) Rotor speed, and (d) Sound.
Additionally, a maximum load variation (from full load to no load) does not interfere with fault detection when a vibration-based methodology is employed.
4.3. Time-Frequency Analysis
Time-frequency analysis combines spectral estimation information with short-time location. The STMN transforms one-dimensional measurements into three-dimensional maps: one axis is for time, a second axis is for frequency, and the third axis is the amplitude or energy; when the amplitude is projected into the time-frequency plane and its value is represented by a colour scale, a more common two-dimensional representation is obtained. The STMN algorithm was applied to all start-up signals to convert the time domain signal information into time-frequency matrices, which made it possible to track the time-varying spectral signatures in the (t,f) plane. The STMN analysis was implemented using MATLAB software (2019) with a rectangular window and without zero-padding to avoid signal alteration and frequency interpolation, respectively. A signal window size of 4098 samples was selected, considering the trade-off between time and frequency resolution, while a window step size between consecutive windows was set to 64 samples. The resulting time-frequency decompositions offer a broad picture of the spectral energy distribution for a healthy and contaminated bearing (CL3). This section presents the results in the frequency band where each experimental signal contains a notable change in the power spectral density.
4.3.1. Motor Vibrations
Figure 11 illustrates (t-f) decompositions for vibration signals around a higher frequency range, where these decompositions show a higher spectral density. Figure 11a (healthy motor case) shows different trajectories starting from kHz frequency. These signatures correspond to motor harmonics modulated by a constant carrier frequency of kHz, which the VSI injects. On the other hand, when the front bearing of the motor is contaminated, the time-frequency analysis, shown in Figure 11b, does not show the spectral trajectories produced by the geometry of the bearing (raceway, train, or spin ball damage). However, vibrations show a significant magnitude increase in the frequency gap between 2.4 and 2.5 kHz. Particle contamination produces strong vibrations in the machine frame but without specific harmonic signatures, showing the random distribution of the fault.
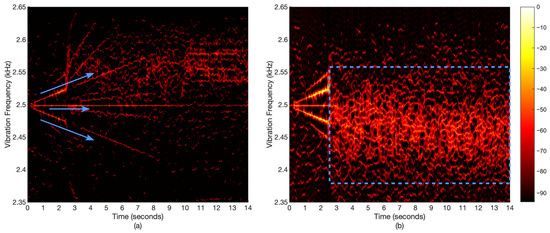
Figure 11.
Time-frequency analysis (high-frequency bandwidth) of the captured vibrations under starting for the motor with: (a) Healthy bearing, and (b) Worn bearing.
4.3.2. Electrical Current
Figure 12 shows the time-frequency (t-f) decompositions for the stator currents. Both healthy and faulty cases show the highest spectral density concentrated below 100 Hz due to the supply frequency . As expected for an inverter-fed IM due to the PWM operation, stator current measurements are rich in harmonic content. For the healthy IM, the highest amplitude spectral signature is the fundamental component (), while its harmonics ( and ) have lower amplitudes Figure 12a. Although sideband signatures () are present due to airgap eccentricity, fault spectral components are absent in the t-f decomposition. However, Figure 12b shows the presence of not only electrical components and eccentricity but also fundamental train fault signatures. These components, || and ||, indicate the presence of a motor anomaly, in this case, the worn bearing.
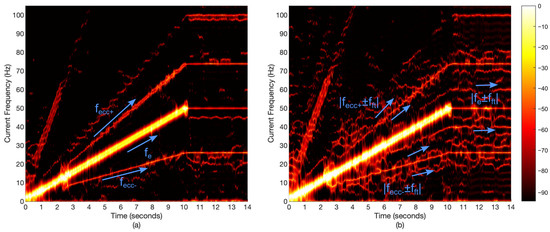
Figure 12.
Time-frequency analysis of the captured stator current under starting for the motor with: (a) Healthy bearing, and (b) Worn bearing.
4.3.3. Rotor Speed
Another important signal for condition monitoring is instantaneous speed; this variable allows locating fault-related harmonics while avoiding environmental interference. Figure 13 shows the behavior of the speed signals in the t-f plane for the two bearing conditions studied (Healthy and CL3). The maximum harmonic content is concentrated in the low-frequency range. The fundamental rotational frequency and its first harmonics, and , are noticeable in both healthy (Figure 13a) and faulty (Figure 13b) cases. In the latter case, in addition to the trajectories, another component related to the fundamental bearing train, , is noticeable. This harmonic component increases in amplitude compared to the healthy case in Figure 13a.
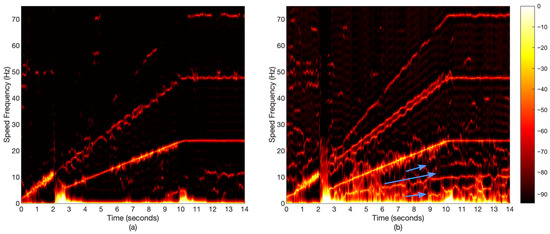
Figure 13.
Time-frequency analysis of the captured motor speed under starting for the motor with: (a) Healthy bearing, and (b) Worn bearing.
4.3.4. Sound
Finally, Figure 14 presents the t-f distributions of the sound signals emitted by the motor. The measurements taken by the microphone indicate that the sound is concentrated across a frequency range of 500 Hz from 3 kHz to 3.5 kHz. The analysis reveals significant differences between the healthy and contaminated bearing cases, particularly regarding energy density levels. In Figure 14a, the healthy case, the decomposition exhibits defined frequency signatures that evolve primarily from 3.1, 3.2, and 3.5 kHz, with constant energy levels (−60 dB) over time. The sound energy is localized in thin trajectories, with minimal spectral leakage below −75 dB. The noise floor is relatively low, staying below −85 dB. In contrast, the contamination condition shown in Figure 14b introduces a more extensive spread of energy, where the localised trajectories become less distinct and diffused due to elevated sound energy levels up to −35 dB. The overall spectral density rises significantly to around −50 dB, and in some regions −40 dB, suggesting the presence of increased frictional and structural irregularities increasing the sound pressure level. It is important to note that the analysis of the motor startup transient allows for the distinction between harmonics generated by the power electronic converter and those produced by the mechanical system. This is possible because the motor can be evaluated under standstill conditions (0 to 2.5 s).
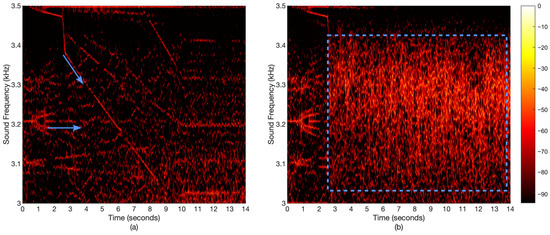
Figure 14.
Time-frequency analysis of the captured sound signals under starting for the motor with: (a) Healthy bearing, and (b) Worn bearing.
5. Discussion
Analyzing the time-domain waveforms and statistical characteristics of sound and vibration signals reveals distinct trends as particle contamination increases from an uncontaminated state to contamination level 1 (20 mg of SiC) and subsequently to contamination level 2 (40 mg of SiC).
For acceleration signals (), both the energy () and the standard deviation () exhibit a pronounced increase with increasing SiC concentration within the bearing. This rise suggests that the motor experiences vibrational disturbances and irregularities as contamination increases, manifesting as high amplitude values. Furthermore, the sound pressure level () demonstrates a substantial increase from the healthy state to contamination level 3, indicating that increased particle contamination contributes to increased mechanical noise. This observation is aligned with the increase in acceleration values. In contrast, the stator current () exhibits a minor increase with contamination, implying that this electrical variable remains relatively stable in the time domain despite the presence of mechanical wear. Similarly, the rotor speed () signal remains invariant across different health conditions, as expected, given that the stator current and the rotor speed are directly related by the mechanical load and the supply frequency. Despite the clear correlation between sound and vibration signals with the bearing condition, environmental and measurement noise pose significant challenges to the reliability of fault detection methodologies based on time-domain features. Some of these effects arise when acoustic waves or vibration reflections interfere with the original signals, leading to amplitude distortions. In the time domain, reverberation can obscure transient events associated with bearing faults, complicating the differentiation between original waves and reverberation artefacts. Similarly, echoes can introduce spurious peaks in the amplitude of monitored signals, potentially resulting in erroneous fault diagnoses, including false positives and false negatives.
On the other hand, frequency-domain analysis demonstrates superior efficacy in detecting fault patterns compared to time-domain analysis. Additionally, it facilitates the segmentation of frequency bands of interest, thereby mitigating interferences unrelated to the motor under investigation. Specifically, vibration spectra exhibit pronounced alterations in response to particle contamination across distinct frequency ranges, with both contamination levels presenting progressively amplified spectral magnitudes relative to the healthy bearing. These findings underscore the value of frequency-domain analysis in detecting distributed bearing faults. Furthermore, sound signals in this domain also provide valuable information about bearing conditions. However, due to modulated pulse width modulation (PWM) systems, fault indicators are predominantly localized in high-frequency bands, necessitating high-speed acquisition systems for effective monitoring. In the case of the stator current, the most relevant components emerge in the low-frequency bandwidth, wherein the contamination conditions induce amplitude increases compared to the healthy case. Furthermore, fluctuations in the rotor speed reveal significant spectral variations in the very low frequency range, particularly at , where both levels of contamination introduce additional spectral peaks.
Finally, time-frequency analysis exhibits the capability to track fault signatures not only during steady-state motor operation but also under non-stationary conditions. Under such startup transients, speed and stator current signals reveal specific signatures at low frequencies. These patterns are particularly significant as they suggest that distributed bearing failures can be effectively identified using these measurement techniques. Moreover, this implies that bearing failures can be detected using high-resolution techniques. Given that most electronic converters incorporate such sensors for operational control, using these measurements for distributed bearing fault detection in inverter-fed motors present a promising alternative for condition monitoring.
6. Conclusions
This paper presents an experimental study on particle contamination detection in inverter-fed induction motors by comparing the monitoring signals analyzed in the time, frequency, and time-frequency domains. The comparative study involved monitoring signals from IMs under steady-state, startup transients, and in three health conditions: uncontaminated and two contamination levels of the rolling bearing. The results show that a damaged bearing causes an increase in sound and vibration levels. However, the frequency bandwidth where the increment occurs is susceptible to sounds produced by human speakers and ambient noise. In addition, sound and vibrations often suffer from echo effects and reverberation phenomena that mask harmonic components. The research concludes that although the vibration signal exhibits abnormal levels when the bearing is damaged, it does not show specific fault signatures. Therefore, it is difficult to accurately identify the motor health condition and distinguish between a damaged bearing and other motor failures in this inverter-fed case. However, the study reveals the potential of the stator current and speed signal to detect bearing wear in inverter-fed induction motors successfully. For further research, it will be interesting to evaluate the performance of these monitoring signals under challenging scenarios that may complicate the detection of particle contamination of the motor bearing.
In future works, efforts could be directed toward improving the reliability of diagnosis techniques by mitigating the adverse effects of echo and reverberation. From a signal analysis perspective, advanced preprocessing techniques could be explored, including complex transformations, adaptive filtering, and time-variant mode decompositions, to isolate the original signal from undesired effects effectively. Additionally, from a model-based standpoint, experimental setups in acoustically controlled environments incorporating damping materials could be employed to minimise reflections, thereby facilitating the development of more accurate and reliable motor system models. These approaches could contribute to improving the reliability of fault detection techniques.
Author Contributions
Conceptualization, T.G.-C., D.M.-S. and R.J.R.-T.; data curation, I.M.-D.; methodology, T.G.-C. and D.M.-S.; software, I.M.-D. and Ó.D.-P.; validation, I.M.-D. and Ó.D.-P.; writing—original draft, I.M.-D., T.G.-C. and D.M.-S.; writing—reviewing and editing, Ó.D.-P. and R.J.R.-T. All authors have read and agreed to the published version of the manuscript.
Funding
This research received no external funding.
Data Availability Statement
The data presented in this study are available on request from the corresponding author (accurately indicate status).
Conflicts of Interest
The authors declare no conflicts of interest.
Abbreviations
The following abbreviations are used in this manuscript:
| CL | Contamination level |
| Supply rated frequency | |
| Bearing ball spin frequency | |
| Fundamental supply frequency | |
| Bearing fundamental train frequency | |
| Bearing ball pass inner frequency | |
| Bearing ball pass outer frequency | |
| Sampling frequency | |
| Switching frequency | |
| FL | Rated-load |
| IM | Induction motor |
| Min-Norm | Minimum norm |
| NL | No-load |
| PSD | Power spectral density |
| PWM | Pulse width modulation |
| SNR | Signal-to-noise ratio |
| STMN | Short-time minimum norm |
| VSI | Voltage source inverter |
References
- Kumar, S.; Mukherjee, D.; Guchhait, P.K.; Banerjee, R.; Srivastava, A.K.; Vishwakarma, D.; Saket, R.K. A comprehensive review of condition based prognostic maintenance (CBPM) for induction motor. IEEE Access 2019, 7, 90690–90704. [Google Scholar] [CrossRef]
- Javed, K.; Gouriveau, R.; Zerhouni, N.; Nectoux, P. Enabling health monitoring approach based on vibration data for accurate prognostics. IEEE Trans. Ind. Electron. 2014, 62, 647–656. [Google Scholar] [CrossRef]
- Zhang, Y.; Xiao, X.; Han, Y. Abnormal Detection of Rolling Bearing Based on Multidimensional Feature Prediction. In Proceedings of the 2023 3rd Asia-Pacific Conference on Communications Technology and Computer Science (ACCTCS), Shenyang, China, 25–27 February 2023; pp. 542–546. [Google Scholar] [CrossRef]
- Palmer, C. Lubricant Contamination: The Prime Cause of Mechanical Machinery Failure. Available online: https://www.machinerylubrication.com/Read/32725/lubricant-contamination-prime-cause-of-mechanical-machinery-failure (accessed on 2 February 2025).
- GMN Bearing USA. 8 Common Ball Bearing Problems. Available online: https://www.gmnbt.com/resources/guides/ball-bearing/fixing-common-bearing-problems/ (accessed on 16 February 2025).
- Kulkarni, S.; Wadkar, S. Investigation for distributed defects in ball bearing using vibration signature analysis—A review. Int. J. Sci. Res. 2012, 2, 157–160. [Google Scholar] [CrossRef]
- Morales-Espejel, G.E.; Zhou, Y. Rolling Bearing Damage from Particle Contamination–Diagnosis via Inspection. Tribol. Online 2024, 19, 95–104. [Google Scholar] [CrossRef]
- Rameshkumar, K.; Nataraj, K.; Krishnakumar, P.; Saimurugan, M. Machine Learning Approach for Predicting the Solid Particle Lubricant Contamination in a Spherical Roller Bearing. IEEE Access 2024, 12, 78680–78700. [Google Scholar] [CrossRef]
- Stief, A.; Ottewill, J.R.; Baranowski, J.; Orkisz, M. A PCA and two-stage Bayesian sensor fusion approach for diagnosing electrical and mechanical faults in induction motors. IEEE Trans. Ind. Electron. 2019, 66, 9510–9520. [Google Scholar] [CrossRef]
- Zhu, J.; Hu, T.; Jiang, B.; Yang, X. Intelligent bearing fault diagnosis using PCA–DBN framework. Neural Comput. Appl. 2020, 32, 10773–10781. [Google Scholar] [CrossRef]
- Cui, H.; Hong, M.; Qiao, Y.; Yin, Y. Application of VPMCD method based on PLS for rolling bearing fault diagnosis. J. Vibroengineering 2017, 19, 160–175. [Google Scholar] [CrossRef]
- Huo, Z.; Zhang, Y.; Shu, L.; Gallimore, M. A new bearing fault diagnosis method based on fine-to-coarse multiscale permutation entropy, laplacian score and SVM. IEEE Access 2019, 7, 17050–17066. [Google Scholar] [CrossRef]
- Wang, H.; Xu, J.; Yan, R.; Gao, R.X. A new intelligent bearing fault diagnosis method using SDP representation and SE-CNN. IEEE Trans. Instrum. Meas. 2019, 69, 2377–2389. [Google Scholar] [CrossRef]
- Zhiyi, H.; Haidong, S.; Lin, J.; Junsheng, C.; Yu, Y. Transfer fault diagnosis of bearing installed in different machines using enhanced deep auto-encoder. Measurement 2020, 152, 107393. [Google Scholar] [CrossRef]
- Wen, L.; Li, X.; Gao, L.; Zhang, Y. A new convolutional neural network-based data-driven fault diagnosis method. IEEE Trans. Ind. Electron. 2017, 65, 5990–5998. [Google Scholar] [CrossRef]
- An, Z.; Li, S.; Wang, J.; Jiang, X. A novel bearing intelligent fault diagnosis framework under time-varying working conditions using recurrent neural network. ISA Trans. 2020, 100, 155–170. [Google Scholar] [CrossRef] [PubMed]
- Mao, W.; Liu, Y.; Ding, L.; Li, Y. Imbalanced fault diagnosis of rolling bearing based on generative adversarial network: A comparative study. IEEE Access 2019, 7, 9515–9530. [Google Scholar] [CrossRef]
- Zhang, S.; Zhang, S.; Wang, B.; Habetler, T.G. Deep learning algorithms for bearing fault diagnostics—A comprehensive review. IEEE Access 2020, 8, 29857–29881. [Google Scholar] [CrossRef]
- El Bouharrouti, N.; Koveshnikov, S.; Garcia-Calva, T.A.; Vehviläinen, M.; Kudelina, K.; Naseer, U.M.; Vaimann, T.; Belahcen, A. Multi-Rate Vibration Signal Analysis for Enhanced Data-Driven Monitoring of Bearing Faults in Induction Machines. In Proceedings of the 2024 International Conference on Electrical Machines (ICEM), Torino, Italy, 1–4 September 2024; pp. 1–7. [Google Scholar] [CrossRef]
- Gao, Z.; Cecati, C.; Ding, S.X. A survey of fault diagnosis and fault-tolerant techniques—Part I: Fault diagnosis with model-based and signal-based approaches. IEEE Trans. Ind. Electron. 2015, 62, 3757–3767. [Google Scholar] [CrossRef]
- El Bouharrouti, N.; Sitnikov, M.; Hemeida, A.; Martin, F.; Kudelina, K.; Naseer, M.U.; Belahcen, A. Co-simulations of induction machines coupled with a radial ball bearing for mechanical defects analysis. IET Electr. Power Appl. 2024, 1–13. [Google Scholar] [CrossRef]
- Martin-Diaz, I.; Garcia-Calva, T.; Duque-Perez, O.; Morinigo-Sotelo, D. Imbalanced Diagnosis Scheme for Incipient Rotor Faults in Inverter-Fed Induction Motors. Appl. Sci. 2024, 14, 7237. [Google Scholar] [CrossRef]
- Frosini, L.; Harlişca, C.; Szabó, L. Induction machine bearing fault detection by means of statistical processing of the stray flux measurement. IEEE Trans. Ind. Electron. 2014, 62, 1846–1854. [Google Scholar] [CrossRef]
- Aviña-Corral, V.; Rangel-Magdaleno, J.; Morales-Perez, C.; Hernandez, J. Bearing Fault Detection in Adjustable Speed Drive-Powered Induction Machine by Using Motor Current Signature Analysis and Goodness-of-Fit Tests. IEEE Trans. Ind. Inform. 2021, 17, 8265–8274. [Google Scholar] [CrossRef]
- Liu, C.; Gryllias, K. A semi-supervised Support Vector Data Description-based fault detection method for rolling element bearings based on cyclic spectral analysis. Mech. Syst. Signal Process. 2020, 140, 106682. [Google Scholar] [CrossRef]
- Sun, M.; Wang, H.; Liu, P.; Long, Z.; Yang, J.; Huang, S. A Novel Data-Driven Mechanical Fault Diagnosis Method for Induction Motors Using Stator Current Signals. IEEE Trans. Transp. Electrif. 2023, 9, 347–358. [Google Scholar] [CrossRef]
- Lee, S.B.; Stone, G.C.; Antonino-Daviu, J.; Gyftakis, K.N.; Strangas, E.G.; Maussion, P.; Platero, C.A. Condition Monitoring of Industrial Electric Machines: State of the Art and Future Challenges. IEEE Ind. Electron. Mag. 2020, 14, 158–167. [Google Scholar] [CrossRef]
- Antonino-Daviu, J. Electrical monitoring under transient conditions: A new paradigm in electric motors predictive maintenance. Appl. Sci. 2020, 10, 6137. [Google Scholar] [CrossRef]
- Frosini, L. Novel diagnostic techniques for rotating electrical machines—A review. Energies 2020, 13, 5066. [Google Scholar] [CrossRef]
- Chen, B.; Hai, Z.; Chen, X.; Chen, F.; Xiao, W.; Xiao, N.; Fu, W.; Liu, Q.; Tian, Z.; Li, G. A time-varying instantaneous frequency fault features extraction method of rolling bearing under variable speed. J. Sound Vib. 2023, 560, 117785. [Google Scholar] [CrossRef]
- Vitor, A.L.O.; Goedtel, A.; Castoldi, M.F.; Souza, W.A.; Bazan, G.H. Induction Machine Fault Diagnosis with Quadratic Time–Frequency Distributions: State of the Art. IEEE Trans. Instrum. Meas. 2023, 72, 1–16. [Google Scholar] [CrossRef]
- Feng, Z.; Yu, X.; Zhang, D.; Liang, M. Generalized adaptive mode decomposition for nonstationary signal analysis of rotating machinery: Principle and applications. Mech. Syst. Signal Process. 2020, 136, 106530. [Google Scholar] [CrossRef]
- Yu, G. A concentrated time–frequency analysis tool for bearing fault diagnosis. IEEE Trans. Instrum. Meas. 2019, 69, 371–381. [Google Scholar] [CrossRef]
- Inturi, V.; Sabareesh, G.; Supradeepan, K.; Penumakala, P. Integrated condition monitoring scheme for bearing fault diagnosis of a wind turbine gearbox. J. Vib. Control 2019, 25, 1852–1865. [Google Scholar] [CrossRef]
- Sahu, P.K.; Rai, R.N.; Kumar, T.C.A. Grease Contamination Detection in the RollingElement Bearing Using Deep Learning Technique. Int. J. Mech. Eng. Robot. Res. 2022, 11, 275–280. [Google Scholar] [CrossRef]
- Kulkarni, S.; Bewoor, A. Vibration Based Condition Assessment of Ball Bearing with Distributed Defects. J. Meas. Eng. 2016, 4, 87–94. [Google Scholar]
- Duque-Perez, O.; Del Pozo-Gallego, C.; Morinigo-Sotelo, D.; Fontes Godoy, W. Condition Monitoring of Bearing Faults Using the Stator Current and Shrinkage Methods. Energies 2019, 12, 3392. [Google Scholar] [CrossRef]
- Blodt, M.; Granjon, P.; Raison, B.; Rostaing, G. Models for bearing damage detection in induction motors using stator current monitoring. IEEE Trans. Ind. Electron. 2008, 55, 1813–1822. [Google Scholar] [CrossRef]
- Tsoumas, I.P.; Tischmacher, H. Influence of the Inverter’s Modulation Technique on the Audible Noise of Electric Motors. IEEE Trans. Ind. Appl. 2014, 50, 269–278. [Google Scholar] [CrossRef]
- Garcia-Calva, T.A.; Morinigo-Sotelo, D.; de Jesus Romero Troncoso, R. Fundamental Frequency Normalization for Reliable Detection of Rotor and Load Defects in VSD-Fed Induction Motors. IEEE Trans. Energy Convers. 2022, 37, 1467–1474. [Google Scholar] [CrossRef]
- Frini, M.; Choqueuse, V.; Auger, F. Parametric Tracking of Electrical Current Components Using Gradient Descent Algorithm. Proc. Inst. Mech. Eng. Part C J. Mech. Eng. Sci. 2022, 236, 8834–8841. [Google Scholar] [CrossRef]
- Garcia-Calva, T.A.; Morinigo-Sotelo, D.; Duque-Perez, O.; Garcia-Perez, A.; Romero-Troncoso, R.d.J. Time-Frequency Analysis Based on Minimum-Norm Spectral Estimation to Detect Induction Motor Faults. Energies 2020, 13, 4102. [Google Scholar] [CrossRef]
- Jalali-Farahani, B.; Ismail, M. Adaptive Noise Cancellation Techniques in Sigma–Delta Analog-to-Digital Converters. IEEE Trans. Circuits Syst. Regul. Pap. 2007, 54, 1891–1899. [Google Scholar] [CrossRef]
- Nandi, S.; Toliyat, H.; Li, X. Condition Monitoring and Fault Diagnosis of Electrical Motors—A Review. IEEE Trans. Energy Convers. 2005, 20, 719–729. [Google Scholar] [CrossRef]
Disclaimer/Publisher’s Note: The statements, opinions and data contained in all publications are solely those of the individual author(s) and contributor(s) and not of MDPI and/or the editor(s). MDPI and/or the editor(s) disclaim responsibility for any injury to people or property resulting from any ideas, methods, instructions or products referred to in the content. |
© 2025 by the authors. Licensee MDPI, Basel, Switzerland. This article is an open access article distributed under the terms and conditions of the Creative Commons Attribution (CC BY) license (https://creativecommons.org/licenses/by/4.0/).