Article

Improved Nonlinear Dynamic Model of Helical Gears Considering Frictional Excitation and Fractal Effects in Backlash

School of Mechanical Engineering, Qingdao University of Technology, Qingdao 266000, China
*
Author to whom correspondence should be addressed.
Machines 2025, 13(4), 262; https://doi.org/10.3390/machines13040262
Submission received: 15 January 2025 / Revised: 24 February 2025 / Accepted: 25 February 2025 / Published: 23 March 2025
(This article belongs to the Special Issue Advances in Noises and Vibrations for Machines)

Abstract

:
Surface roughness and sliding friction are pivotal in determining the dynamic meshing performance of helical gears, especially under conditions of flexible support. In addition, the meshing parameters influenced by gear vibrations exhibit time-varying characteristics under flexible support stiffness, which is disregarded by many scholars. Based on this, a nonlinear dynamic model of a helical cylindrical gear system under flexible support conditions is developed, considering the coupling effects of dynamic friction and backlash influenced by fractal surface roughness. The motion differential equations of the system are derived using the Lagrange method, and numerical solutions are obtained through the Runge–Kutta method. The effect of several control parameters (driving speed, surface roughness and fractal dimension) on the dynamic response of gear system is studied, and the proposed dynamic model is compared with the traditional model under different support stiffness to demonstrate its adaptability to highly flexible support scenarios. The results indicate that the proposed dynamic model is better suited for flexible support structures. Moreover, the coupling effects of sliding friction and fractal backlash amplify the dynamic response of the gear system and introduce complex spectrum characteristics. This study provides theoretical guidance for the optimization of vibration and noise reduction designs in helical gear systems.

1. Introduction

As a common gear transmission device, helical gears have been widely used in mechanical manufacturing, automotive transmission, wind power generation and other fields due to their high contact ratio characteristics [1,2,3,4]. Under special working conditions such as high precision, high load, and flexible support, sliding friction influenced by surface roughness have a significant impact on the dynamic performance of gear systems [5]. Therefore, to accurately analyze and evaluate the dynamic performance of gear systems and to reduce system vibration and noise, it is essential to develop an accurate dynamic model of the gear system that considers the effects of surface roughness and sliding friction.
The establishment of gear dynamic models has always been a focus in the field of gear research. Researchers first established a 1-DOF dynamic model considering speed coordination to roughly analyze the dynamic behavior of gears [6,7]. Higher demands for vibration reduction and noise control in gearboxes have been proposed in aerospace applications, necessitating the consideration of multidirectional vibrations in gear dynamic models [8,9]. In recent years, the study of multi-degree-of-freedom (MDOF) gear systems has become a research focus. Wang et al. [10] established a 5-DOF gear system to represent the dynamic response of its flex-twist coupling. Jiang et al. [11,12] analyzed X and Z translations based on 6-DOF helical gear models. Wan et al. [13] analyzed helical gear dynamics due to Y and Z translations based on 6-DOF models. Sun et al. [14] used finite element method to build a MDOF gear model and analyzed the influence of temperature and bearing type on gear system dynamics. With the demand for lightweight gear systems in aviation and military equipment, bearing stiffness structures will no longer be suitable for the future development of the helical gear system industry, and flexible support structures such as thin hollow shafts and thin-walled gearboxes will become the future development trend [15]. However, after introducing a flexible support structure, its support stiffness will be significantly lower than that of the bearing structure. This will result in greater displacement of the two gears during operation, and the original model will not be able to accurately predict the dynamic behavior of the gears. Therefore, the dynamic modeling of helical gears under flexible support stiffness remains a challenge for the future.
In addition, tooth surface friction is an important source of gear vibration and noise that affects the system dynamics in terms of external excitation [16]. Therefore, a large number of scholars have studied the impact of this factor on gear systems. Singh analyzed the dynamic behavior of a single degree of freedom gear pair, including sliding friction, by using Floquet theory [17], the harmonic balance method [18], and the numerical method [19], and extended the influence of sliding friction to a multi-free gear pair [20]. Kar et al. [21] proposed a method and algorithm for solving the torsional friction moment of a helical gear system under constant friction coefficient. Wang et al. [22] studied the vibration characteristics of the star bearing based on the dynamic response under constant friction coefficient excitation and controlled the dynamic behavior by changing the support stiffness. Chen et al. [23] calculated the meshing efficiency of gear pairs considering sliding friction losses by studying the tooth surface meshing force and relative sliding/entrainment velocity and incorporating them into the formula for sliding friction coefficient. Chen et al. [24] found that at low driving speeds, friction increases the displacement amplitude and has a significant impact on the high-frequency part of the frequency domain by considering friction and dynamic backlash in the dynamic study of the system. Building on this foundation, Kang et al. [25] introduced fractal theory to characterize rough surfaces based on their study of friction. While this approach improved the understanding of microstructural surface properties, it still lacks comprehensive exploration of its impact on system dynamics. Therefore, further studying the coupling effect between sliding friction and fractal tooth gaps is crucial for accurate gear dynamics analysis.
Focusing on the issues, this paper establishes a dynamic model of a helical gear system considering fractal backlash and sliding friction under flexible support and analyses the dynamic characteristics of the system based on this model. The rest of this article is organized as follows: In Section 2, dynamic meshing parameters and corresponding dynamic mesh force and friction forces affected by lateral vibration were presented, and a 7-degree-of-freedom nonlinear dynamic model of a helical gear system with velocity coordination, time-varying pressure angle, dynamic clearance, and sliding friction was established. And the Lagrange method was used to derive the equation. In Section 3, the proposed dynamic model is compared with the traditional model under different support stiffness to demonstrate its adaptability to highly flexible support scenarios. In the following section, Section 4, the effects of friction and Fractal Effects in Backlash on the dynamic response of the gear system are analyzed. Finally, some brief findings of this study are provided.

2. Model and Methodology

Considering the effects of input, output, and supporting bearings, the dynamic lumped parameter model of the helical gear-rotor-bearing system is shown in Figure 1. The system is simplified into a 7-degree-of-freedom (DOF) bending-torsion coupled generalized lumped parameter model, comprising the driving gear and driven gear. Among them, k x 1,2 , k y 1,2 and k z 1,2 represent the support stiffness of the gear mesh in the x , y and z directions, respectively, while c x 1,2 , c y 1,2 and c z 1,2 denote the corresponding bearing damping. The gear pair is simplified as two rigid disks connected through the meshing stiffness k m and meshing damping c m . The driving speed θ ˙ 1 is exerted on the pinion, and the output torque T 1 is loaded to the gear. In addition, a representation of the pressure plane is also illustrated, depicted as a two-dimensional “unwrapping band” that unwinds from one base cylinder and winds onto the other. In this figure, solid lines represent changes in the contact line, while dashed lines represent extensions of the contact line.
According to the research of Liu et al. [26], a general expression of the excitation speed of pinion for rigid-body conditions can be rewritten as:
θ ˙ 1 t = θ ˙ 1 m 1 + i = 1 λ i sin i ω t + φ 2
here, θ ˙ 1 m denotes the average driving speed, λ i and φ i denote the fluctuation amplitudes of driving speed and the phase of the i t h harmonic, respectively. The excitation frequency ω mainly depends on the relevant configuration of the prime mover [27].
Based on the geometric relationship, the relative displacement of the gear system δ L along the line-of-action ( L O A ) and the dynamic transmission error components δ L along the L O A and δ O along the off-line-of-action ( O L O A ) are derived [28]. These parameters can be expressed as:
δ L = x 1 x 2 sin ψ + y 1 y 2 cos ψ + θ 1 R 1 + θ 2 R 2 cos β z 1 z 2 sin β
δ O = x 1 x 2 cos ψ y 1 y 2 sin ψ cos β + z 1 z 2 sin β
Considering the positive or negative values of the transmission error, the angle ψ can be expressed as:
ψ = a n b n δ t 0 a n b n δ t < 0
The lateral relative position angle of the gear pair b n can be expressed as:
b n = tan 1 y 1 y 2 + d 0 sin β 0 / x 1 x 2 + d 0 cos β 0
The transverse working pressure angle of the gear a n can be expressed as [29]:
a n = cos 1 R 1 b + R 2 b / d
To facilitate the analysis, the transverse displacement of the gear center is magnified. As shown in Figure 2, L O A represents the line of action, while O L O A is perpendicular to the meshing line. d τ denotes the surface center distance, a n is the surface meshing angle, and b n is the relative position angle at any given time. O 1 and O 2 represent the initial center positions of gear p and gear g , respectively. d 0 refers to the initial center distance, and a 0 is the initial pressure angle, which is assumed to be 20 ° in this paper.
Due to the translational motion of the drive and driven wheels, the surface center distance of the gear changes from d 0 to d [30]. The time-varying center distance d can be given as:
d = x 1 x 2 + d 0 cos β 0 2 + y 1 y 2 + d 0 sin β 0 2
where the original center distance is calculated as d 0 = R 1 + R 2 , and R 1 and R 2 denote the radii of the indexing circle for the large and small gears, respectively.
The meshing process of helical gears involves alternating logarithmic cycles of different teeth, with the tooth width determining the instantaneous meshing number. Mo et al. [31] discussed the calculation of the meshing teeth logarithm but did not account for the z-axis vibration error affecting the tooth width. To address this, the variation in tooth width during meshing is analyzed based on the helical gear’s force angle. Using the actual center distance d from Equation (7), the total contact ratio of helical gears and the length of the line of action Z a c t , which can be expressed as:
Z z c t = R 1 o 2 R 1 b 2 + R 2 o 2 R 2 b 2 d sin a n
here, R 1 o and R 2 o represent the pinion and gear’s tooth top circle radii, respectively. The initial contact surface tooth width is defined as L τ . When considering the influence of helix angle β on axial transmission error, the positive and negative directions of gear helix angle can be defined as:
β > 0   if   gear   has   right - hand   teeth < 0   if   gear   has   left - hand   teeth
According to left-hand helical gear as shown in Figure 1, the axial force of the master and slave gears can be determined based on the spiral direction. Therefore, the relative axial vibration mode of the driven gear relative to the driving gear is determined. The tooth width L n of the contact surface at this time can be expressed as:
L n = L + sign β z 1 z 2
here, L in the above equation is the initial tooth width, set to 30 mm.
With the contact surface tooth width determined, the instantaneous number of meshing teeth n can be calculated. Considering the influence of the helix angle on axial vibration, the diagonal pitch length along the line of action L n can be evaluated, alongside the number of teeth behind N b and in front N f of the current contact location. The number of contacted mesh teeth at any given moment is established as:
n = 1 + floor l / P b N b + floor Z a c t / sin γ l / P b N f
The function rounds off the ratio ( x / y ) to the nearest inter (toward a lower value); Z a c t is represented by the equation above Equation (8); P b = P b c o s β / s i n γ + β represents the projection of tooth width on the diagonal; φ m =   Z a c t / R 1 b is the theoretical meshing cycle. The γ = tan 1 Z z c t / L n angle is shown in the figure above as the angle formed by the diagonal A B and L τ of the 3-dimensional unfolded band; l is the parameter increased diagonally from point A to point B , which can be expressed as:
l = φ m 1 mod θ 1 R 1 , Z a c t cos β b / sin γ + β b
mod y , z = y z floor y / z   z 0
here, β b = tan 1 tan β × cos a 0 is the base circular helix angle.

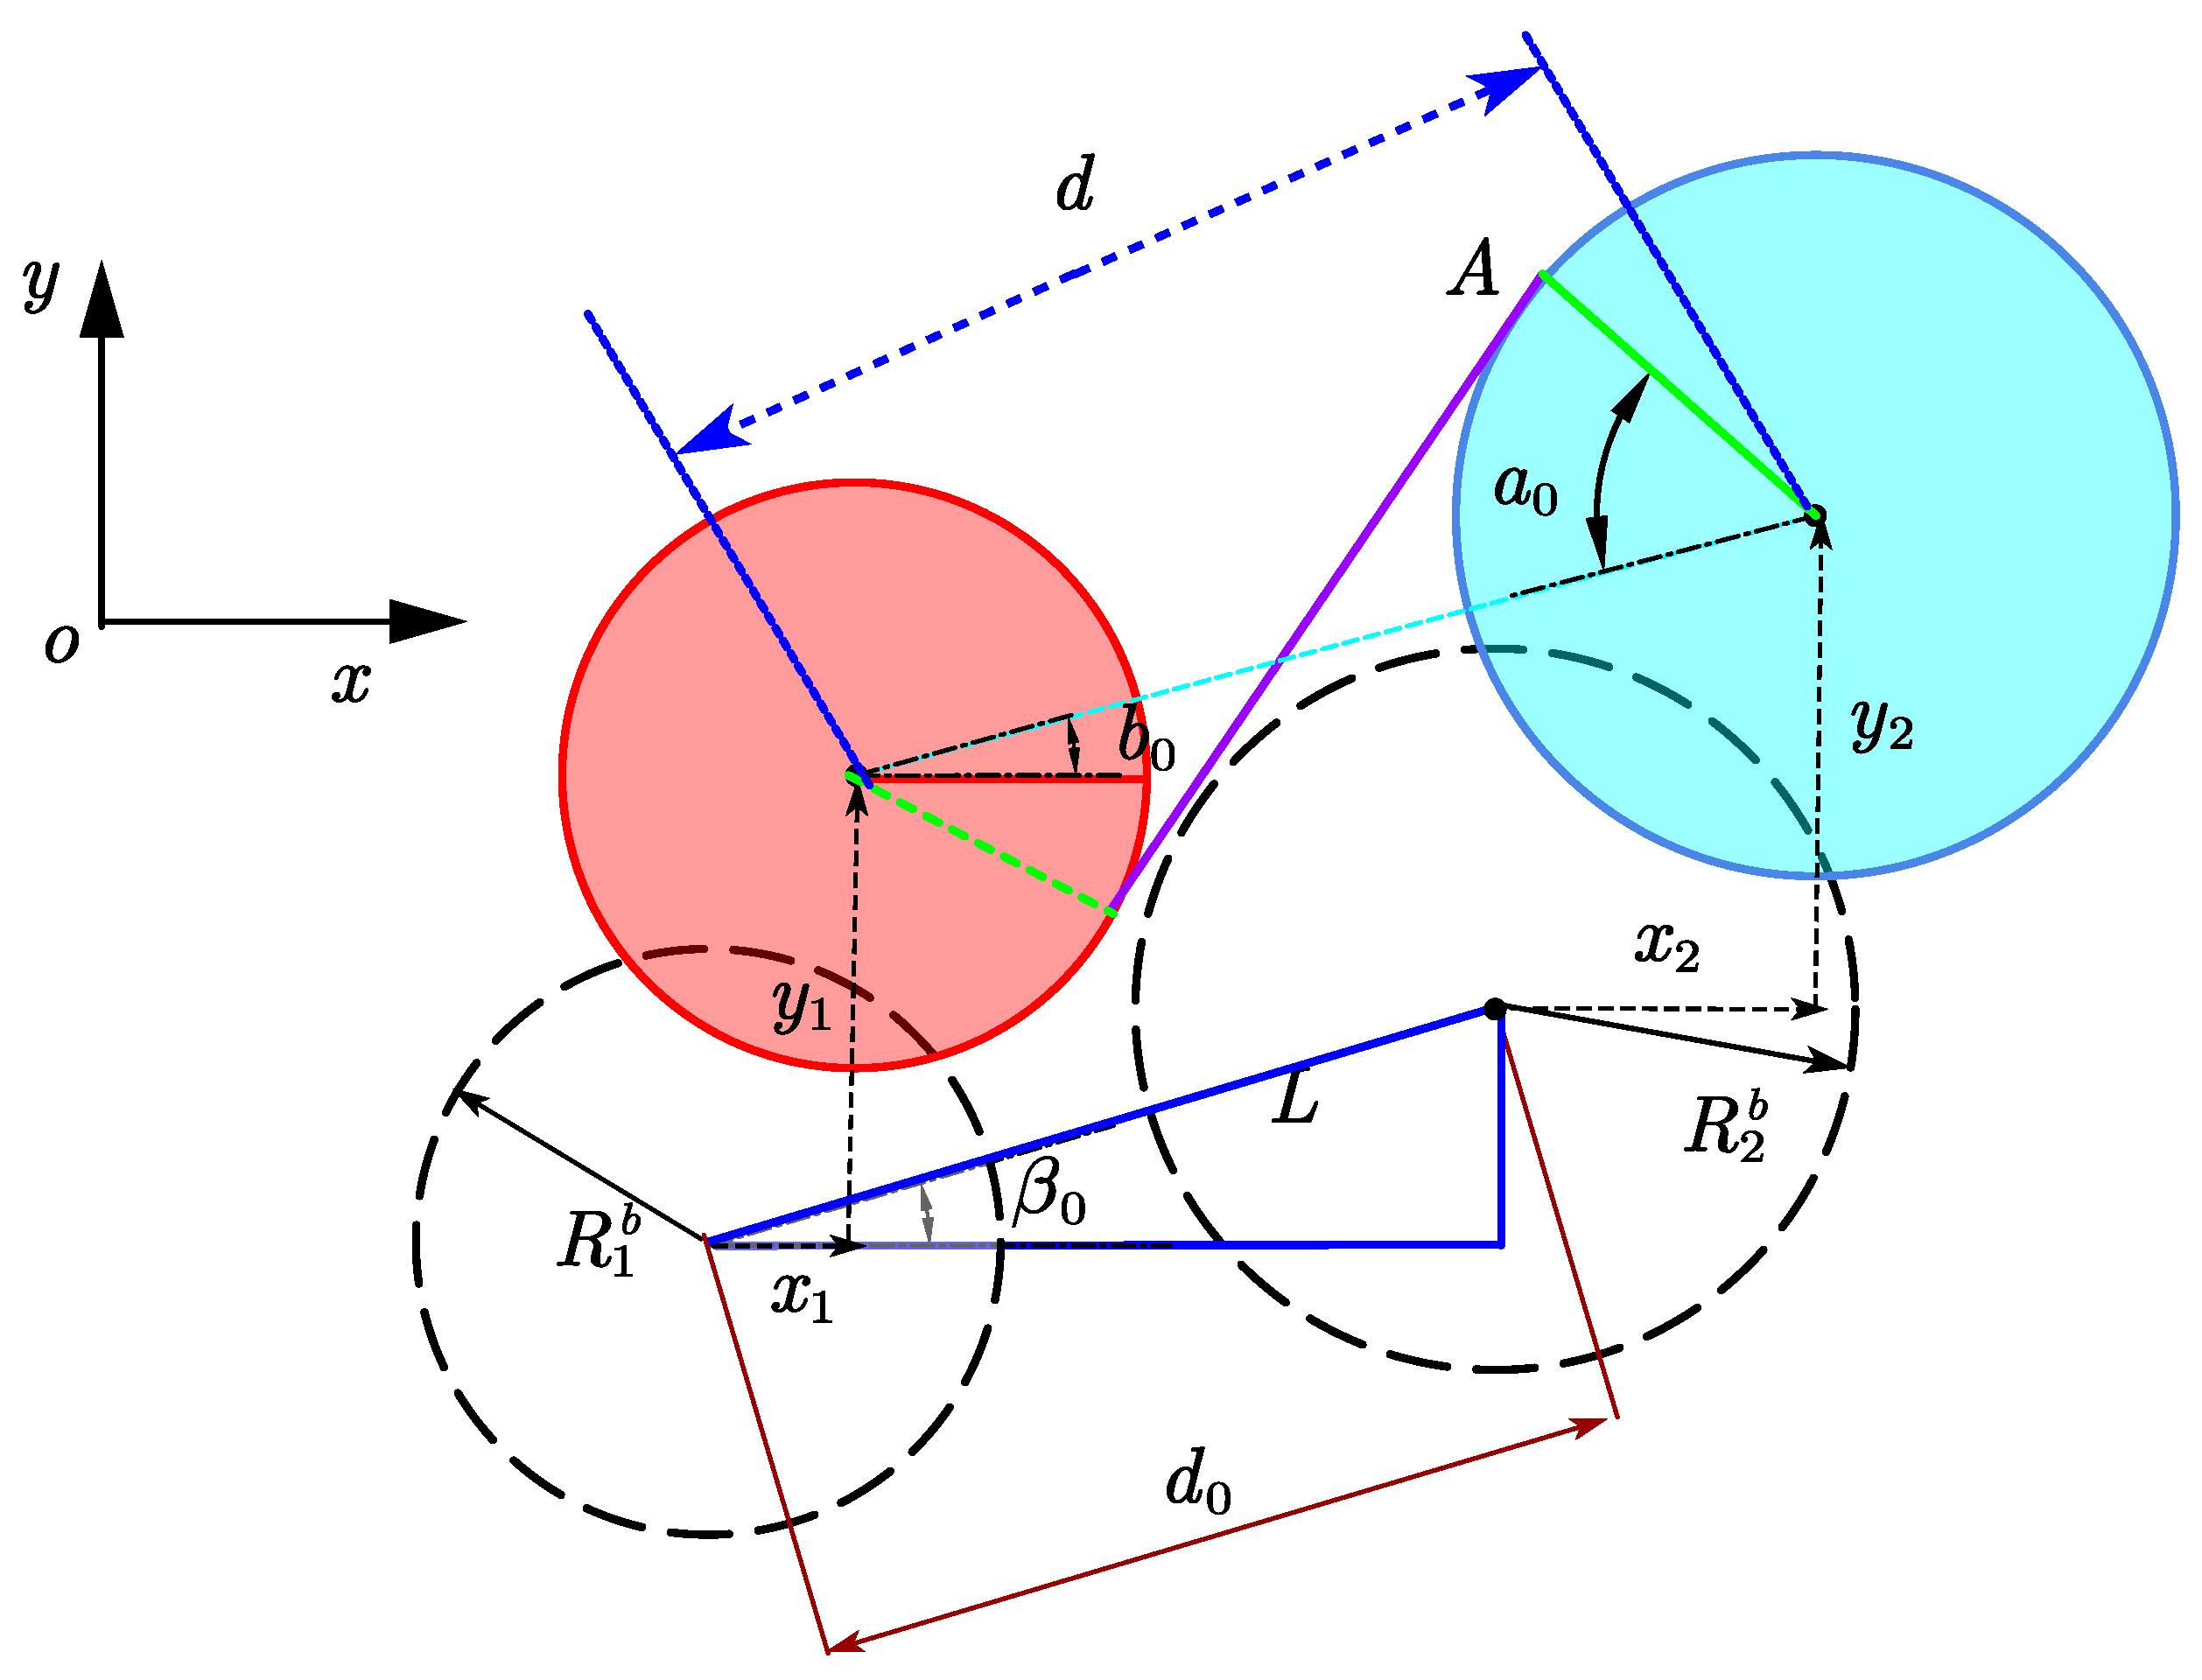
2.1. Time-Varying Gear Backlash Based on Fractal Theory

To analyze the dynamic performance of gears under specific parameters, researchers simplify gear contact into spring-damping models and establish corresponding dynamic equations. For example, Yi et al. [32] incorporated the calculation of time-varying clearance at the gear end face, which provides a significant advantage in analyzing the time-varying backlash of helical gears. Additionally, the true contour of the rough gear surface, characterized by a series of peaks and valleys, has been found to considerably influence the variation in backlash between meshing teeth [33]. In fractal modeling approaches for different surface characteristics, the microscopic morphology of surfaces with varying roughness can be simulated by adjusting the fractal dimension as well as other fractal parameters, such as the roughness scale [34].
As illustrated in Figure 3, the contact characteristics of helical gear pairs exhibit marked disparities between ideal and actual tooth surfaces. The dashed lines represent the ideal tooth surface, while the solid lines represent the actual tooth surface affected by manufacturing errors and roughness. Fractal theory, characterized by inherent self-affinity and self-similarity, provides a robust framework for describing the complex surface morphology of mechanical interfaces. Accordingly, the Weier-Mandelbrot (W-M) function is widely employed to simulate rough surfaces [35], and its mathematical expression is given by:
z x = G D 1 n = n l γ D 2 n cos 2 π γ n x , 1 < D < 2 , γ > 1
here, γ n is the discrete frequency spectrum, n l is the low cut-off frequency of minimum frequency index.
When considering the surface roughness values of two gears. The mathematical expression for the distance between the end faces in the normal direction Δ b f can be calculated by Ref. [35] as:
Δ b f = R a k = n l γ D 2 k sin 2 π N s γ k mod θ 1 , θ m 1 θ m 1 / R ¯ D
here, N denotes the intermediate variables affecting the value of the sampled wave crest of the calculated roughness curve, R a is the arithmetic mean deviation ( μ m ) ; The torsional angular displacement θ m 1 = m π / R 1 b for one meshing cycle; m denotes the gear module; In this paper, γ and D are set as 1.5 and 1.1, respectively.
R ¯ D = 0 θ m 1 k = n l γ D 2 k sin 2 π N s γ k mod θ 1 , θ m 1 θ m 1 d θ 1 / θ m 1
The total backlash, namely the normal backlash of the helical gear on the end face is expressed as:
b t = b 0 + Δ b cos β + Δ b f
here, b is caused by changes in the center distance, which can be expressed as [36]:
Δ b = R 1 b + R 2 b i n v a n i n v a 0
where i n v ( x ) is the involute function; i n v x = tan x x . The above derivation gives the basic theory of backlash. More detailed research of backlash can refer to Refs. [24,32].

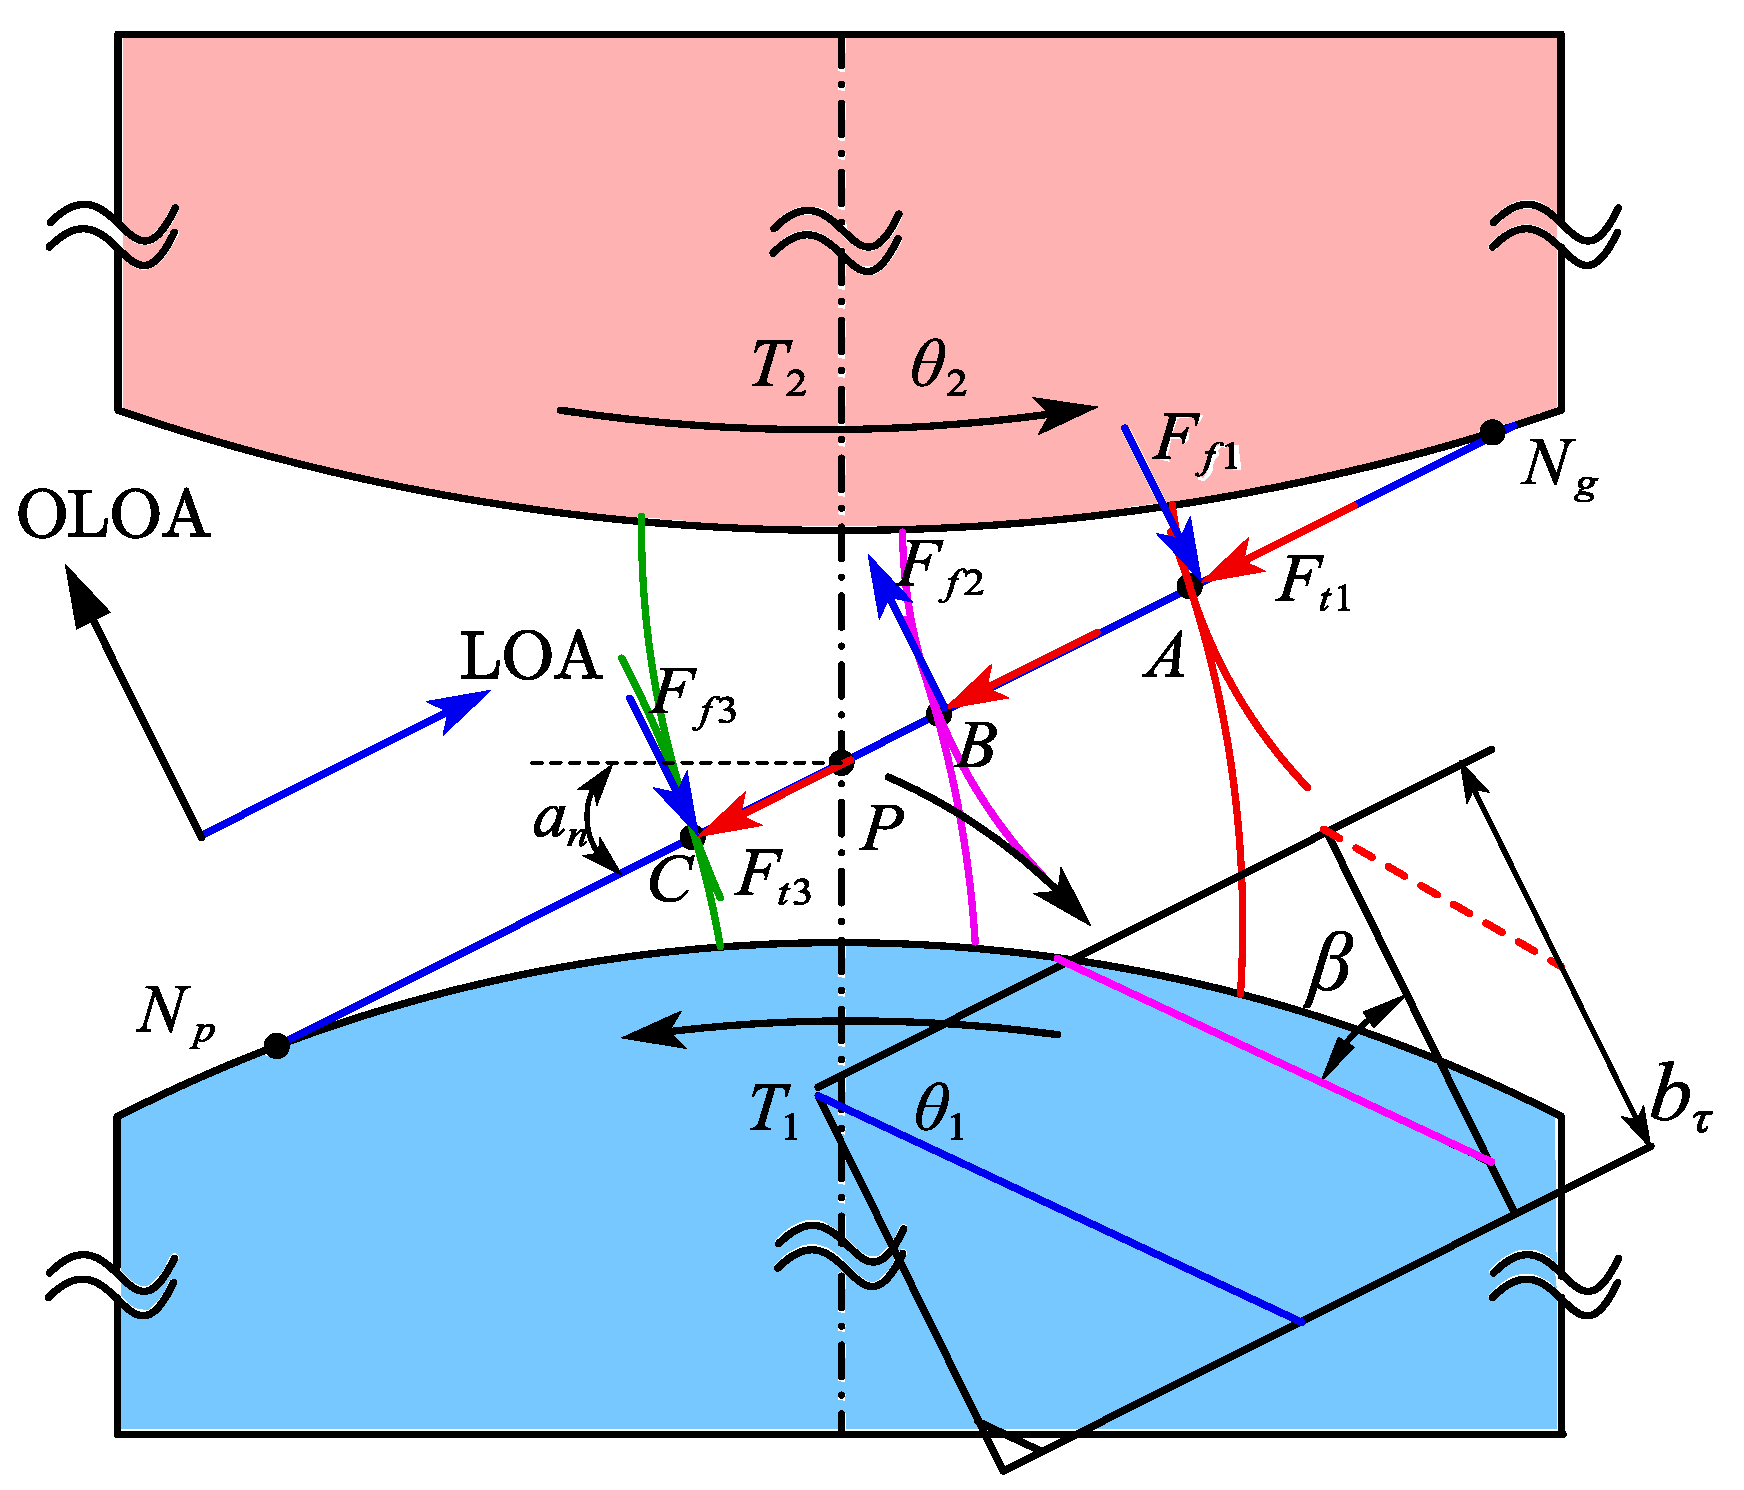
2.2. Dynamic Model of the Gear System

The different equations of motion for the gear pair can be derived by the seven generalized coordinates, whose vector form is expressed as:
q = x 1 y 1 z 1 x 2 y 2 z 2 θ 2
where x 1 , y 1 , z 1 , x 2 , y 2 , z 2 , θ 2 represent the translational and angular vibration displacements of the active and driven wheels, respectively, along the x , y and z -axis.
The displacement vectors for the centers of gears p and g in the coordinate system are subsequently derived, which can be given as:
r 1 = x 1 i + y 1 j + z 1 k ,   r 2 = x 2 i + y 2 j + z 2 k
where i and j and k are unit vectors along the x and y and z , respectively.
The kinetic energy T E of the system can be expressed by mass and driving speed, can be calculated as:
T E = i = 1 2 m i r ˙ i 2 + J i θ ˙ i 2 / 2
The energy generated by gear pairs and bearings can be expressed as elastic potential energy U and dissipated energy as follows:
U = i = 1 2 k x i x i 2 + k y i y i 2 + k z i z i 2 + j = 1 n k m j f 2 δ L , b t / 2
here, b t is helical gear end normal backlash, which can be obtained from Equation (17);
The total dissipation function R C consists of the dissipation function of radial bearing damping and gear meshing damping:
R C = i = 1 2 c x i x ˙ i 2 + c y i y ˙ i 2 + k z i z ˙ i 2 + j = 1 n c m j f ˙ 2 ( δ L , b t ) / 2
Considering the effect of gravity, the generalized force vector Q can be expressed as:
Q j = 0 m 1 g 0 0 m 2 g 0 T 2
Q f = j = 1 n F x f 1 , j j = 1 n F y f 1 , j j = 1 n F z f 1 , j j = 1 n F x f 2 , j j = 1 n F y f 2 , j j = 1 n F z f 2 , j j = 1 n T θ f 2 , j
The differential equation of motion was derived using the Lagrange equation:
d d t T E q ˙ i T E q i + U q i + R C q ˙ i = Q j + Q f
Substituting the four equations T E , R C , U , Q j in the above equation into the Lagrange Equation (26) can produced:
m i x ¨ i + c x i x ˙ i + k x i x i + j = 1 n F x i j = 1 n F x f i , j = 0
m i y ¨ i + c x i y ˙ i + k x i y i + j = 1 n F y i j = 1 n F y f i , j = m i g
m i z ¨ i + c x i z ˙ i + k x i z i + j = 1 n F z i j = 1 n F z f i , j = 0
J 2 θ ¨ 2 + j = 1 n F θ 2 j = 1 n T θ f 2 , j = T 2
here, superscripts (⋅) and (⋅⋅) denote the first and second order derivatives with respect to time, respectively.
The equivalent stiffness and damping coefficients are employed to simulate the flexibility of shafts and bearings. Under the condition of flexible support stiffness, the system’s support stiffness is not merely approximated as the bearing stiffness k x , y , z 1,2 . Instead, it considers the series stiffness of the shaft stiffness k x , y , z j and the bearing stiffness k x , y , z 1,2 . In this case, the calculation utilizes the empirical Formula (26). Consequently, the total equivalent stiffness of the bearing system can be obtained as follows:
k x , y , z 1 , 2 = k x , y , z b 1 , b 2 k x , y , z j k x , y , z b 1 , b 2 + k x , y , z j ,   c x , y , z 1 , 2 = 2 ξ s m 1 , 2 k x , y , z 1 , 2
where support damping coefficient ξ s is 0.025.
The x , y and z directions of the dynamic meshing force F 1,2 can be expressed as:
F Δ 1 , 2 = c m j + k m j f / Δ , Δ = x i , y i , z i , θ i
where k m i is the mesh stiffness of the helical gear.
The nonlinear function of backlash f ( δ L , b t ) and its relative speed f 1 δ L , b t of the gear system can be given as:
f ( δ L , b t ) = δ L t sign δ L b t δ L > b t 0 δ L b t , f 1 ( δ L , b t ) = δ ˙ L t sign δ L b ˙ t δ L > b t 0 δ L b t
f ( δ L , b t ) / Δ = δ L / Δ sign ( δ L ) b t / Δ 0 δ L > b t else ,   Δ = x i , y i , z i , θ i
b t / x 1 b t / y 1 b t / z 1 = b t / x 2 b t / y 2 b t / z 2 = sin a n cos β 0 0 0 sin a n cos β 0 0 0 1 cos b n sin b n 0
where f 1 δ ˙ , b ˙ t i ˙ = f δ , b t i . i = x i , y i , z i , θ i .
The individual derivation components in the gear dynamics equation can be expressed as:
δ ˙ L t = i = 1 2 x ˙ i δ L / x i + y ˙ i δ L / y i + z ˙ i δ L / z i + θ ˙ i δ L / θ i
δ L / x 1 δ L / y 1 δ L / z 1 δ L / θ 1 = δ L / x 2 δ L / y 2 δ L / z 2 R 2 / R 1 * δ L / θ 2 = 1 0 0 0 0 1 0 0 0 0 1 0 0 0 0 1 sin ψ cos β + δ O ψ / x 1 cos ψ cos β + δ O ψ / y 1 sin β R 1 b cos β
The frictional force components of each axis in the above formula are expressed as follows:
F x f i , j = δ O / x i sign V s μ k m j f δ L , b t + c m j f 1 δ L , b t
F y f i , j = δ O / y i sign V s μ k m j f δ L , b t + c m j f 1 δ L , b t
F z f i , j = δ O / z i sign V s μ k m j f δ L , b t + c m j f 1 δ L , b t
T θ f 2 , j = sign V s μ R f i , j k m j f δ L , b t + c m j f 1 δ L , b t
where R f i , j is the friction arm of the driving and driven gear, respectively, and the detailed information of these variables are elaborately expressed in Appendix A. μ is the coefficient of friction of the system; its calculations can be obtained by empirical formulas in Ref. [37] as:
μ = 0.127 * 1.27 / 1.27 S Log 10 29.66 * W / v * V s * V r 2
Regarding the calculation of the normal force W on the tooth surface, He provided the formula W = T p / ( L R 1 c o s a n ) in Ref. [38]. However, this calculation method ignores the situation where the tooth surface is not in contact, which is obviously inconsistent with the modeling method in this article. Therefore, for the normal force F on the tooth surface, it can be improved to W = i = 1 n F x 1 i 2   +   i = 1 n F y 1 i 2 / L τ N / m ; L τ is the width of the contact surface (mm), given by (10), F x 1 and F y 1 are the meshing forces on the x- a x i s and y- a x i s during meshing on the pinion, respectively; S is R M S of surface roughness in μ m on Ref. [25] and can be calculated as S = 1.1 R a .
The vibratory velocity influences the relative sliding velocity between meshing teeth, which, in turn, alters the friction force, potentially increasing gear vibrations [39]. Therefore, the sliding speed of the gear and the speed of the entrainment motion can be expressed by the following equation as:
V s = v p i v g i + x ˙ 1 x ˙ 2 cos ψ + y ˙ 1 y ˙ 2 sin ψ cos β + z ˙ 1 z ˙ 2 sin β
V r = v p i + v g i + x ˙ 1 + x ˙ 2 cos ψ + y ˙ 1 + y ˙ 2 sin ψ cos β + z ˙ 1 + z ˙ 2 sin β
where v p i and v g i are the viscosity coefficient of the gear and the tooth surface velocity of the driving and driven wheels, and can be derived from Ref. [40].
The derivative of the frictional force components of each axis in the above formula can be expressed as:
δ O / x 1 δ O / y 1 δ O / z 1 = δ O / x 2 δ O / y 2 δ O / z 2 = 1 0 0 0 1 0 0 0 1 cos ψ cos β δ L ψ / x 1 sin ψ cos β + δ L ψ / y 1 sin β
The planar displacement along the L O A direction and the L O A in the normal direction are defined as δ L and δ O , calculated as:
δ L = δ L θ 1 R 1 + θ 2 R 2 cos β + z 1 z 2 sin β
δ O = δ O z 1 z 2 sin β
where ψ / x 1 , ψ / y 1 are partial derivatives of ψ ( t ) with respect to the x and y axes, respectively, and can be given as:
ψ x 1 = cos a n b n / d sin a n δ L 0 cos a n + b n / d sin a n δ L < 0 ,   ψ y 1 = sin a n b n / d sin a n δ L 0 sin a n + b n / d sin a n δ L < 0
The magnitude of dynamic meshing force and friction force can be expressed as:
F m = k m f δ , b t + c m d f δ , b t / d t ,   F f = μ F m
Therefore, we do not consider z-axis friction and Lang-range residual terms δ O = 0 and δ L = 0 , The dynamic equation can be transformed into the following form Equations (27)–(30).
m i x ¨ i + c x i x ˙ i + k x i x i + 1 i 1 F m sin ψ cos β + 1 i F f cos ψ cos β = 0
m i y ¨ i + c y i y ˙ i + k y i y i + 1 i 1 F m cos ψ cos β + 1 i + 1 F f sin ψ cos β = m i g
m i z ¨ i + c z i z ˙ i + k z i z i + 1 i F m sin β + 1 i F f sin β = 0
J 2 θ ¨ 2 F m R 2 cos β F f R f 2 sin β = T 2
The time-varying mesh stiffness of the system is a periodic excitation with a contact ratio of m p (2 < m p < 3) and a mesh period of T m ( T m = 2 π / ω m ). The contact ratio of the system is closely related to the variation in gear mesh stiffness, so the stiffness variation in the system is determined by the variation in the contact ratio of the system, as shown in Figure 4. For any integer n n 1 , the stiffness of the contact area of the three tooth pair ranges from m p 2 T m to m p + n 3 T m , and the stiffness of the double tooth pair ranges from 3 m p T m to n T m . In order to achieve higher accuracy in dynamic calculations, this study used the finite element method to calculate the time-varying mesh stiffness of helical gears.

3. Model Validation and Adaptability

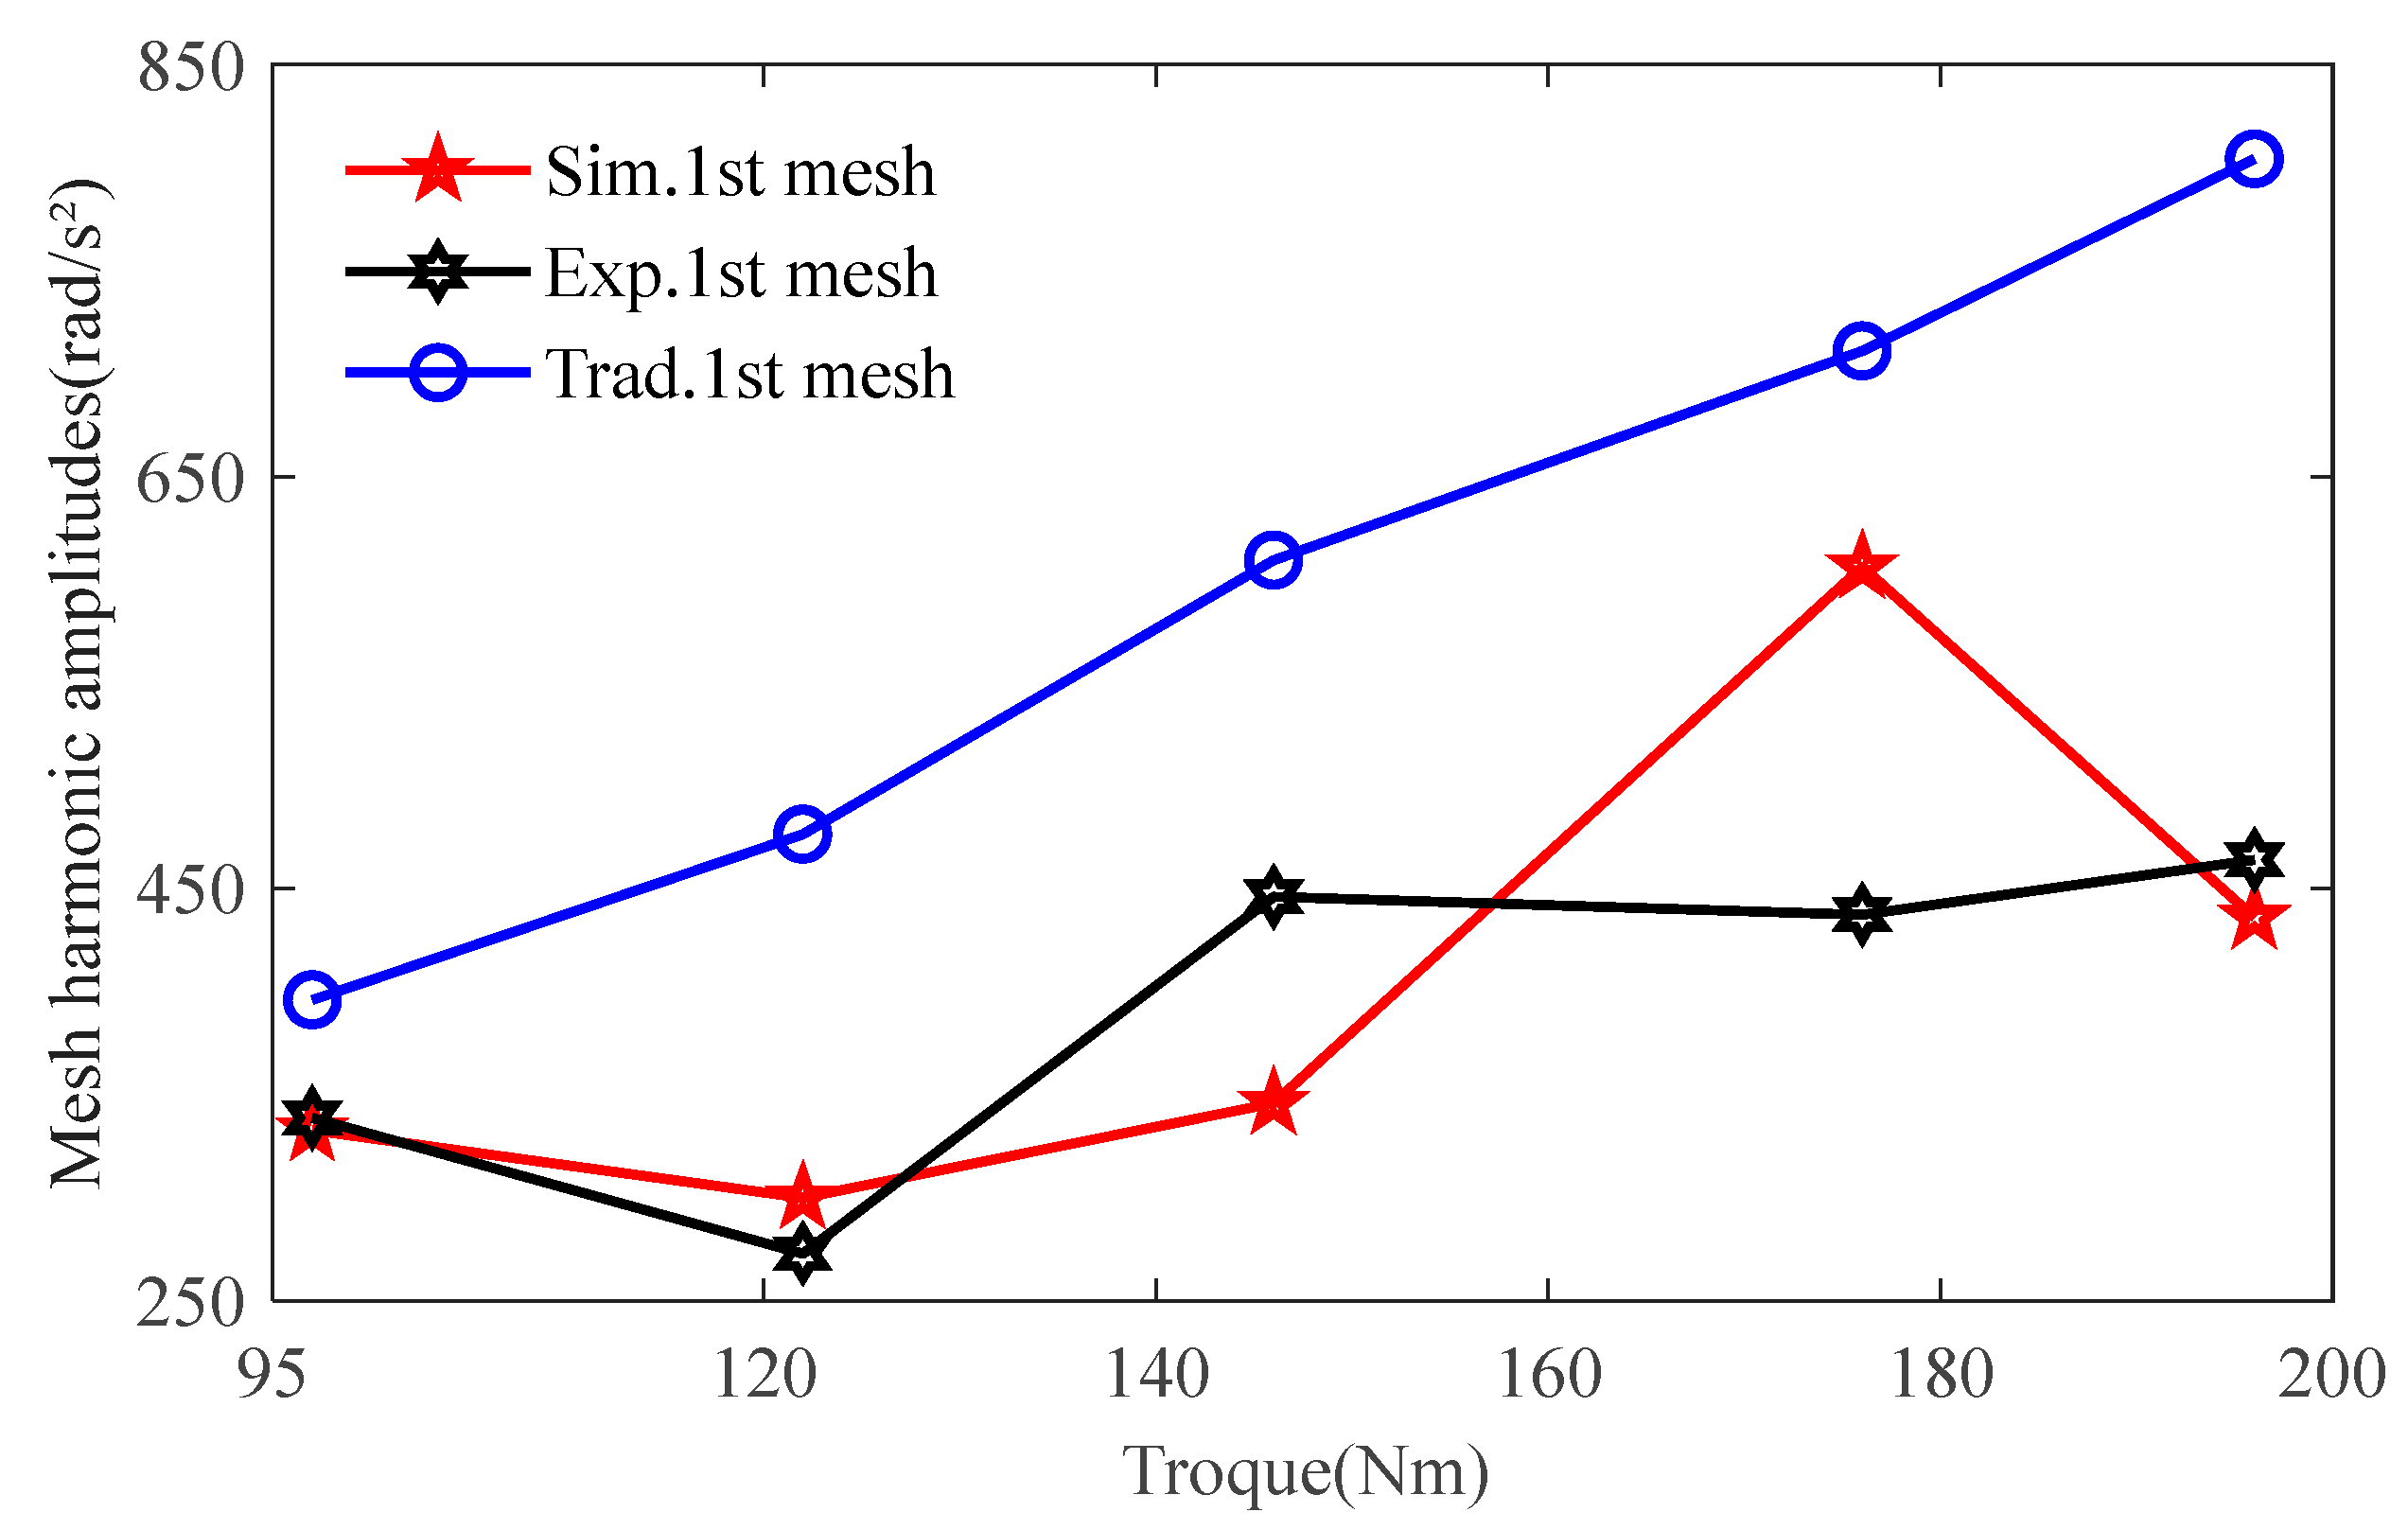
3.1. Model Experimental Verification

To validate the accuracy of the gear dynamics model proposed in this paper, the experimental results from Feng [41] were compared with the simulation results obtained herein. The gear pair parameters used in the experimental verification are listed below in Table 1.
The amplitude of the acceleration signal from the driven wheel was selected as the dependent variable, while the input torque was treated as the independent variable, resulting in Figure 5. As shown in the figure, the simulation results (Sim) are in closer agreement with the experimental data (Exp) compared to the traditional numerical method (Trad). Furthermore, the figure clearly illustrates that the simulation curve generated by the proposed model provides a more accurate reflection of the actual gear behavior compared to the reference model [41]. This improvement is attributed to the fact that the proposed modeling method projects forces onto each axis more accurately than traditional approaches, making it particularly suitable for simulating and predicting dynamic scenarios under flexible support conditions.

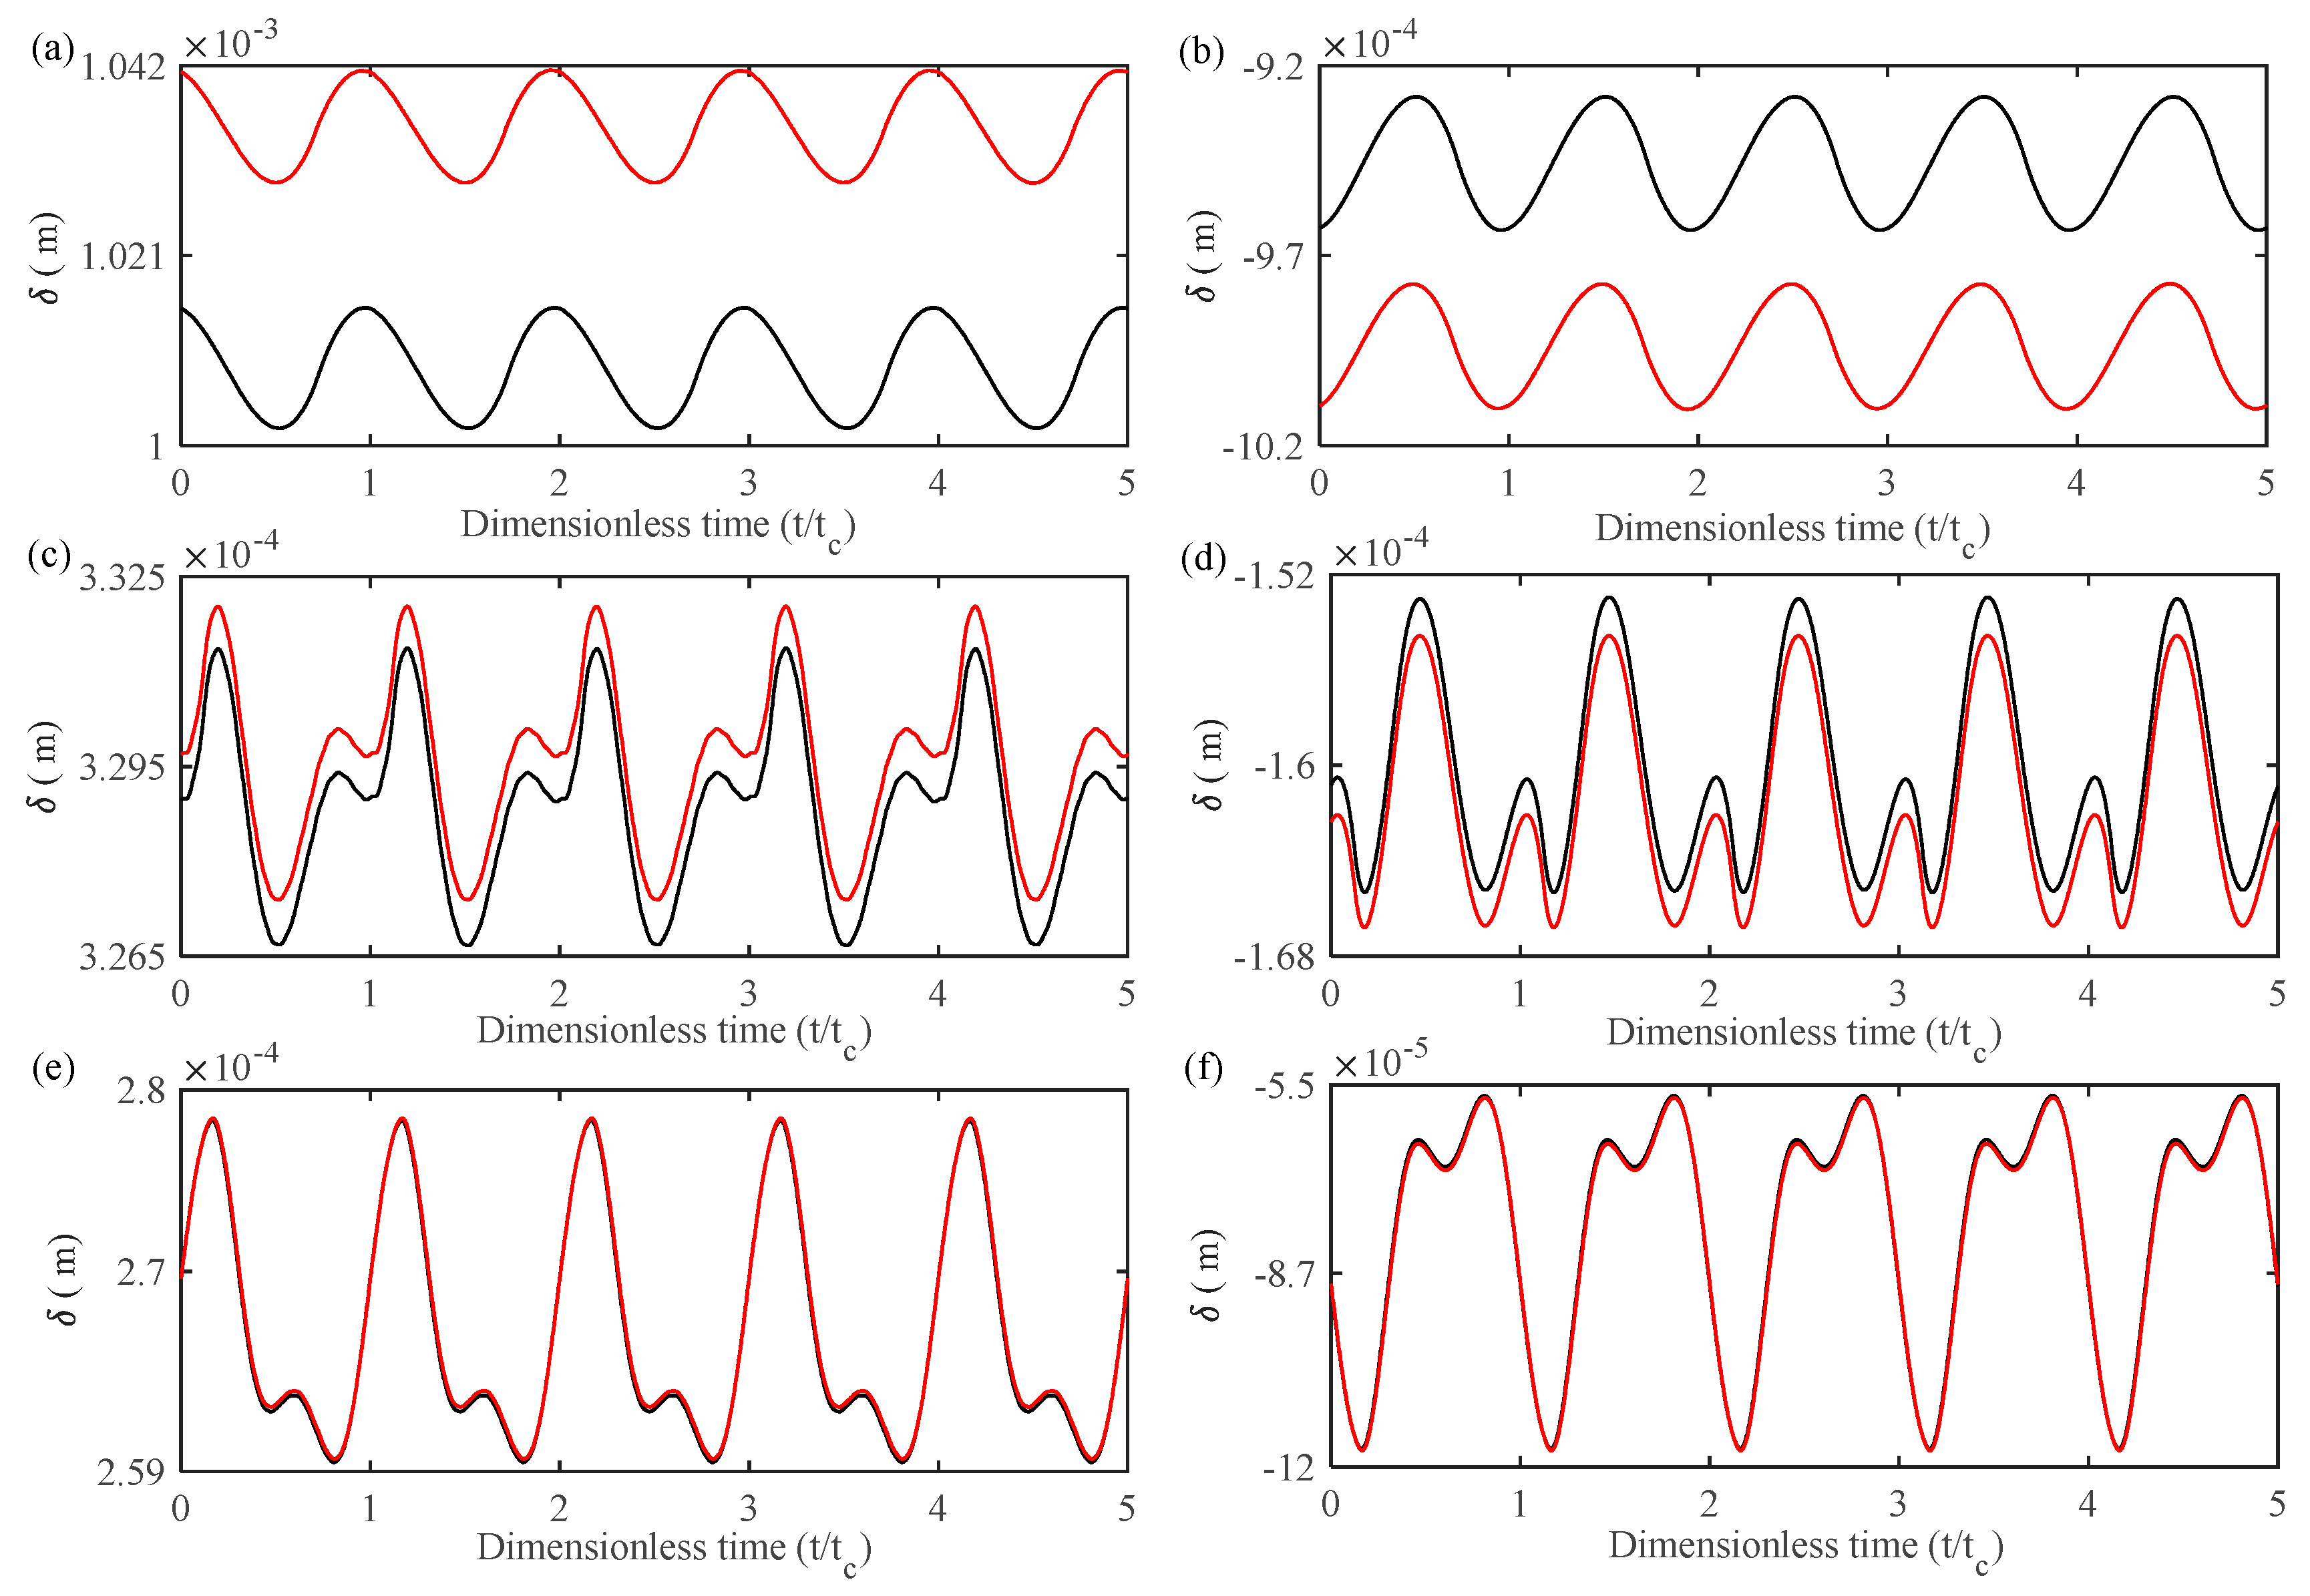
3.2. Universal Adaptability of Model

To explore the differences between the proposed model using the Lagrange method and traditional models under varying stiffness and driving speeds, the kinetic equation derived from the energy method in Ref. [29] is cited for comparison. The results of the two models are analyzed as follows. To ensure computational accuracy, the surface roughness coefficient is set to 0.1 μ m , and the driving speed is set to 800 RPM. Since the primary focus of this paper is on the steady-state response of the gear system, the numerical procedure should be executed for a sufficiently extended duration until the difference between the last two cycles of the δ L is less than 10 8 m. The comparative analysis of δ L O A and δ O L O A is presented in the following results: The gear pair parameters used in the comparison are listed below in Table 2.
From Figure 6, it can be preliminarily concluded that as the radial stiffness increases, the results of the model established in this study gradually converge with those obtained using traditional methods. As shown in Table 3, at a support stiffness of 10 6   N m , the difference in δ L O A between the two models is approximately 25.6 % , while δ O L O A reaches about 50.2 % , highlighting a significant disparity. Moreover, it is expected that as the support stiffness decreases, this divergence will further increase. This observation provides valuable insights for practical engineering applications. To quantify the system’s impact, an impact (residual) factor is introduced to represent the magnitude of the deviation. This factor is defined as m = D T E B D T E P / D T E P , Among them, D T E B is the model proposed in this article, while D T E P is the model proposed in Ref. [29].
To more clearly illustrate the differences between the two models under varying driving torques, Figure 7 depicts the relationship between dynamic response amplitude differences and driving torque. A total of 150,000 simulation data points were extracted to ensure the accuracy of the calculated dynamic response amplitudes. It is evident that significant deviations exist between the traditional method and the method proposed in this study, particularly when applied to scenarios involving different control parameters. Since helical gear systems are widely used under heavy load conditions, the traditional method is inadequate for accurately modeling systems with low support stiffness. Therefore, the dynamic model developed in this study is of great significance for improving the performance of helical gears in precision instruments.

4. Result and Analysis

4.1. Effect of Frictional Excitation on the Gear System

In order to explore the influence of friction on the helical gear system as a whole, based on the established lumped mass model in Section 2, a series of numerical simulations are conducted to illustrate the influence of driving speed on the dynamic characteristics of the gear system. The seven -order Runge–Kutta method with variable time steps is employed to solve the dynamic equations of the gear systems. Since the primary focus of this paper is on the steady-state response of the gear system, the numerical procedure should be executed for a sufficiently extended duration until the difference between the last two cycles of the δ L is less than 10 8 m. The following are the changes in the maximum transmission error corresponding to different driving speeds.
From the observations in Figure 8, the gear system exhibits volatility in the low driving speed range due to the effects of friction. Specifically, at a driving speed of 1160 RPM, a significant change in transmission error occurs. This phenomenon is caused by the strong coupling effect between friction force and dynamic backlash, leading to resonance in the gear system. When the excitation frequency approaches the gear’s natural frequency ( ω 1 = 444.4 Hz), resonance occurs. At low driving speeds, friction can alter the excitation frequency of the gear system. When this excitation frequency nears the output shaft’s natural frequency ( ω 2 = 222 Hz), resonance peaks are also observed. This highlights the significant influence of friction-induced nonlinear dynamics on the gear system, particularly under low driving speed operating conditions. This kind of jump clearly has a significant impact on the stability of the system, so it is necessary to study the reasons for the occurrence of the “jump” at this time to maintain the stability of the system. Therefore, the first studied point ω 2 = 575 RPM ( f m = 222.2 H z ). To investigate the reason for the “jump” of frictional force at this time, two resonant speeds were analyzed in the following content.
As shown in Figure 9, at a driving speed of 1160 RPM, when friction is neglected, the corresponding Poincare diagram exhibits nine distinct points, indicating that the system operates in a 9-periodic motion. The FFT analysis reveals the presence of a fourth order meshing frequency. However, when the influence of friction is considered, the phase-frequency diagram shows only two regular circles, and the corresponding Poincare diagram reduces to two discrete points. From the FFT spectrum of the system, it can also be observed that only the second order meshing frequency remains, indicating a transition of the system from 9-periodic motion to 2-periodic motion.
As illustrated in Figure 10, at a driving speed of 1160 RPM and without considering the effects of friction, the corresponding Poincare map displays five distinct points, indicating that the system operates in a 5-period motion. The FFT analysis reveals the presence of a fourth order meshing frequency. However, when the influence of friction is taken into account, the phase-frequency diagram reduces to a single regular circle, and the Poincare map consists of only one point. The FFT spectrum further confirms that only the first order meshing frequency remains, signifying a transition of the system from 5-period motion to 1-period motion.
To better observe the frequencies at points A and B in Figure 8, a three-dimensional frequency spectrum was constructed based on the driving speed range of 500–2000 RPM. As shown in Figure 11, when the system operates within the a-band (0–580 RPM), the first order meshing frequency resonates with both the output shaft and the input shaft in the subharmonic mode. In the three-dimensional spectrum, the vibration amplitude at point A is greater than that at point B. Consequently, the sudden increase in transmission error between points A and B can be attributed to the excitation of transverse resonance frequency by the frictional force present at this specific speed.
Based on the aforementioned findings, it is evident that in helical gear systems with flexible supports, particularly under low driving speed conditions, friction has a significant influence on gear dynamics. Therefore, the surface roughness coefficient R a can be used as a control parameter to further investigate the dynamic behavior of helical gear systems. This study selects a helical gear system operating under low driving speed conditions (0–740 RPM) as the research object. According to Refs. [25,42], the system exhibits complex dynamic behavior under these conditions. Therefore, the surface roughness range [0, 0.82] is chosen to analyze the bifurcation characteristics of the system. The bifurcation diagram provides a visual representation of the system’s dynamic characteristics under varying surface roughness conditions, revealing the relationships between periodic behavior and key parameters such as surface roughness. It also identifies potential critical points in the system and determines the response characteristics under different operating scenarios.
In Figure 12, the dynamic behavior of the gear system exhibits notable variations as surface roughness R a changes. At lower roughness values R a   [0.1, 0.48], the system demonstrates stable periodic motion, characterized by minimal displacement variations. During this range, the Largest Lyapunov exponents remains negative, further confirming the system’s stability and periodic behavior. As the roughness increases beyond R a = 0.48, the system undergoes period-doubling bifurcations, leading to increasingly complex dynamics. At approximately R a = 0.54, the system transitions into a chaotic state, as evidenced by the scattered points in the bifurcation diagram. This transition is also reflected in the Largest Lyapunov exponents, which shifts to positive values, signifying the onset of chaotic behavior. At higher roughness values R a   [0.63, 0.82], the system alternates between chaotic and quasi-periodic motion. In this range, the Largest Lyapunov exponents oscillates between positive and negative values, indicating the dynamic transitions between chaotic and quasi-periodic states. This observation highlights the complex interplay between surface roughness and the gear system’s nonlinear dynamics.
To more clearly demonstrate the dynamic characteristics of the helical gear system before and after the critical roughness values, time-domain responses, phase-frequency plots, Poincare maps, and FFT spectra under various critical roughness values ( R a = 0.48, 0.52, 0.54, 0.63) are presented. Figure 13 shows that the motion period of the system undergoes significant changes under different critical roughness levels. Specifically, low roughness gear systems will experience continuous subharmonic motion. In this case, changes in roughness will not cause significant changes in gear dynamics, as shown in [0.1, 0.48] where the system is always in 2-period motion. As the roughness increases, the system will exhibit a period doubling phenomenon and become a stable 4-period motion; As R a continues to increase, the final Poincare map will exhibit chaotic attractors, and the corresponding Largest Lyapunov exponents will show positive values, indicating that the system is in a chaotic state. However, chaotic changes are not static. When R a   [0.63, 0.82], the motion of the system will transition from chaos to quasi periodic motion and then enter periodic motion.
Figure 14 illustrates the effect of surface roughness on the system in frequency domain. It can be clearly seen that within the roughness range [0.1, 0.52], the mesh frequency f m and its second harmonic are the dominant frequencies, with no other frequency components present. As the friction coefficient increases from 0.52 to 0.54, periodic motion is replaced by quasi-periodic motion. While f m remains the primary response, additional frequency components begin to emerge. When the friction coefficient exceeds 0.63, the gear system enters a chaotic state. The meshing frequency f m slightly decreases, while the amplitude of its subharmonic component 0.5 f m increases significantly, surpassing the amplitude of f m and becoming the dominant system response. As surface roughness increases further, the system alternates between chaotic and periodic motion, and 0.5 f m exhibits an initial decline followed by a sharp increase.

4.2. The Coupling Effect of Frictional Excitation and Fractal Excitation

In current studies on fractal theory, the influence of fractal dimension on the system cannot be ignored. Fractal dimension serves as a key parameter in describing the spatial distribution characteristics of surface roughness, which directly impacts the meshing behavior and dynamic performance of gear systems. To investigate the effect of fractal dimension, this paper analyzes the dynamic behavior of the system under varying surface roughness levels and fractal dimensions ( R a = 0.2, 0.4, 0.6, 0.8).
From Figure 15, it can be observed that the effect of fractal dimension on the dynamic response of the gear system is not significant when the surface roughness is relatively low. As the surface roughness increases, the peak value of the dynamic response gradually intensifies. Simultaneously, the maximum dynamic transmission error shifts forward with the increase in surface roughness. This phenomenon is attributed to the alteration of the excitation frequency caused by changes in surface roughness, leading to an earlier resonance peak. When the roughness increases to R a = 0.8 μ m , the influence of the fractal dimension under different driving speeds becomes significant. Notably, at low driving speeds ( θ ˙ 1 < 864 RPM), the peak value of the dynamic response increases, resulting in larger vibrations within the gear system. However, when the driving speed exceeds 864 RPM, the low driving speed vibration is alleviated, leading to a noticeable reduction in gear system vibrations caused by the fractal dimension. This reduction occurs because a higher fractal dimension corresponds to a smoother tooth surface, which reduces the impact of friction on the gear system.
To investigate the forward-shifting phenomenon in the dynamic response of gear systems caused by fractal effects, three-dimensional spectrum diagrams under different surface roughness R a conditions are analyzed. From Figure 16, it can be observed that when the surface roughness is relatively low ( R a = 0.2 μ m ), the first order meshing frequency remains stable, with consistent amplitude. This indicates that under smooth surface conditions, the impact of fractal characteristics on the gear system has not yet become evident. However, as the surface roughness increases to R a = 0.4 μ m , fluctuations in the dynamic response amplitude of the gear system begin to appear. Simultaneously, at a driving speed of 1437 RPM, the excitation frequency changes, leading to a shift in the resonance peak position. With further increases in roughness, the dynamic response peaks of the gear system exhibit more pronounced fluctuation characteristics, and the excitation frequency undergoes further alterations, causing significant changes in the second- and third order meshing frequencies. Finally, when the roughness reaches R a = 0.8 μ m , the impact of roughness on the excitation frequency of the gear system reaches its maximum. At this point, higher surface roughness results in the gear system exhibiting spectrum characteristics that fluctuate with driving speed.
To more clearly investigate the influence of fractal dimension on the spectrum characteristics of gear systems, the driving speed corresponding to the maximum transmission error is analyzed. From Figure 17, it is observed that when the fractal dimension remains constant, the driving speed corresponding to the maximum transmission error decreases as the surface roughness increases. This phenomenon primarily occurs because the uneven distribution of backlash regions induces elastic deformation of the gear surface in different directions as the driving speed changes, causing a lag in the dynamic response. Consequently, the maximum transmission error shifts forward in speed. Furthermore, an analysis of the fractal dimensions (D = 1.1, 1.5, 1.9) reveals that the driving speed corresponding to the maximum transmission error increases with higher fractal dimensions. This indicates that a larger fractal dimension suppresses the excitation frequency, thereby mitigating the lag effect in the gear system.
To further investigate the impact of driving speed on the system, this study represents the maximum dynamic response based on input speed. By comparing Figure 8 and Figure 18, it is evident that when considering the coupled effects of fractal backlash and friction, the system’s primary resonance points (A and B) show no significant changes. However, new resonance points (C and D) emerge between points A and B within the two resonance regions. To explore the influence of this coupling relationship on the system in deep, a three-dimensional spectrum of the driving speed in the range of 500–2000 RPM is presented, illustrating the frequency variations.
From the spectrum shown in Figure 19, it can be observed that the amplitude variations of the resonance frequencies are minimal when coupling effects are considered. Nevertheless, as the speed increases, the number of frequency peaks grows, reflecting increasingly complex dynamic behavior. At lower driving speeds, the system spectrum response remains relatively stable, with amplitude unaffected by speed changes. However, as speed increases, the first noticeable frequency peak emerges at 0.5 f m . At approximately 850 RPM, a smaller amplitude frequency peak appears at 1 / 5 f m . These findings demonstrate that new frequency components arise at higher driving speeds, highlighting the influence of the fractal structure on the system spectrum response.
To further investigate the impact of coupling effects on the dynamic characteristics of gears under low driving speed conditions, the influence of surface roughness on motion periodicity is analyzed. Figure 20 compares the dynamic behavior under coupling effects, considering only friction, with the results in Figure 12. By revealing the relationship between coupled periodic motion and key parameters such as surface roughness Ref. [35]. this analysis delves deeper into the periodic motion of the system under coupling effects.
From the figure, it can be seen that after considering the coupling effect, the motion period significantly increases, and the dynamic response of the system undergoes significant changes, especially in the nodes; The time-domain diagrams, Poincare maps, and FFT logarithmic amplitude diagrams of the system under different roughness conditions ( R a = 0.4, R a = 0.52, R a = 0.6) were presented to analyze the nodes. As shown in Figure 21, it can be clearly observed from the figure that with the increase in roughness, compared to only considering the friction effect, the transition from 2-period to 4-period-chaotic motion is presented. Considering the coupling phenomenon, the transition from multi period chaotic multi period motion is exhibited. Specifically, when R a = 0.4, the Poincare diagram considering only the friction effect presents two isolated points, and the corresponding FFT spectrum only shows integer order meshing frequencies, indicating that the system’s motion exhibits a motion period characteristic of 1 t c . However, considering coupled motion, in addition to an increase in Poincare points, the spectrum shows a multiplication and division component of the meshing frequency 0.5 f m , which is different from the subharmonic motion characteristic indicating that the system’s motion exhibits 2 t c ; when the roughness R a = 0.52, the four isolated steady-state attractors without considering coupling effects are replaced by chaotic attractors, and the spectrum shows chaotic edge frequency phenomena, indicating that the steady-state motion of the system has been replaced by chaotic motion and that the system has transformed from multi period motion to chaotic motion. As the roughness increases, R a = 0.6, the opposite phenomenon occurs, that is, the chaotic attractor without considering coupling effects is replaced by the steady-state attractor, and the chaotic edge frequency phenomenon of the spectrum becomes a stable spectrum phenomenon dominated by 0.5 f m , indicating that the chaotic phenomenon of the system is suppressed.
As shown in Figure 22, with the change in motion period, the frequency of the system shows that R a   [0, 0.17] system maintains multi period motion, and no other frequency components appear in the corresponding three-dimensional spectrum. When the motion period of R a [0.17, 0.45] system changes, the phenomenon of increasing motion period corresponds to the multiplication and division components of meshing frequency 0.5 f m appearing in the three-dimensional spectrum; when R a   [0.48, 0.53], considering the coupling effect, the system will enter a chaotic state, and the corresponding Largest Lyapunov exponents graph will show positive values, indicating that it is in a chaotic state. At this time, there are more frequency components in the three-dimensional spectrum, but the amplitude value of the meshing frequency f m is much larger than that of other frequency components; As the roughness increases, the amplitude value of the system frequency component will also increase. Unlike not considering coupling effects, in the roughness range of R a   [0.6, 0.69] at higher roughness, considering coupling effects will actually reduce the instability factor of the system, and the system will transition from chaos to periodic motion; As the roughness continues to increase, the system enters a chaotic state with an increasing number of attractors, and similarly to not considering coupling effects, 0.5 f m will suddenly increase, becoming the main system frequency exceeding the first-order meshing frequency, and other frequency components will increase.

5. Conclusions

This article proposes a new 7-DOF dynamic model for helical cylindrical gear systems with dynamic meshing parameters, which focuses on the influence of sliding friction and fractal roughness on gear vibration under high flexibility support stiffness conditions. The effects of the modulated input speed and the new dynamic model on the dynamic response and frequency of the gear system are analyzed. The simulation results demonstrate that the proposed dynamic model can produce a more realistic dynamic response than the previous model under high flexibility support stiffness. The input speed has a significant influence on the dynamic characteristics of the gear system. In the low-to-medium input speed range, two resonance points, V 1 (575 RPM) and V 2 (1160 RPM), are observed. Notably, at low driving speeds, the resonance effect of the flexible shaft results in the maximum dynamic transmission error of the system.
Moreover, as surface roughness increases, friction induces transitions in the system’s motion, including double-period bifurcations, quasi-periodic to chaotic motion evolution. During chaotic periodic motion, the system’s 0.5 f m vibration frequency exceeds the primary meshing frequency f m , becoming the dominant vibration frequency of the system. When the fractal effect couples with friction in the gear system, the motion periods significantly increase, and the resonance points exhibit slight shifts with changes in speed. In the corresponding second-order steady-state period (c) and fifth-order steady-state period, two abrupt changes occur, as revealed in the three-dimensional frequency diagram with sudden peak values at 0.5 f m and 0.2 f m . This indicates that the coupled effects of friction and fractals not only enhance the system’s dynamic response but also lead to more complex nonlinear spectral dynamics.
In future work, this model will be applied to analyze the dynamic characteristics of gear-shaft-bearing systems, and finite element methods will be employed to design the shafts.

Author Contributions

Conceptualization, writing—original draft preparation, software, methodology, G.M.; data curation, validation, C.L.; writing—review and editing, visualization, G.L.; supervision, project administration, funding acquisition, F.L. All authors have read and agreed to the published version of the manuscript.

Funding

This research was funded by National Natural Science Foundation of China (Grant No. 52375104, 51305378, 51605412), Shandong Provincial Science and Technology Department (Grant No. ZR2021ME010).

Data Availability Statement

Due to the nature of this research, participants of this study did not agree for their data to be shared publicly, so supporting data is not available.

Conflicts of Interest

The authors declare that there are no conflicts of interest regarding the publication of this paper.

Nomenclature

Remarks: In the following formula, i = 1, 2, respectively, represent the gears of different sizes.
Alphabets
a 0 Initial normal pressure angle
a n Time-varying normal pressure angle
b 0 Initial normal backlash of gears
b n Time-varying normal position angle
b t Gear time-varying normal backlash
c m 1,2 Time-varying mesh damping
c x , y , z 1,2 Support damping in the x , y and z directions
d The time-varying center distance
d 0 Initial Normal center distance of gears
D The fractal dimension
F m t Dynamic mesh force of the tooth pair
F f t Dynamic friction force of the tooth pair
F x , y , z 1,2 The component of meshing force on the x , y , and z axes
F x , y , z f 1,2 The component of fiction force on the x , y , and z axes
G The characteristic-scale coefficient
J 1,2 Moment of inertia with respect to the mass center
k m 1,2 Time-varying mesh stiffness
k x , y , z 1,2 Support stiffness in the x , y and z directions
k x , y , z b 1 , b 2 Bearing stiffness in the x , y and z directions
k x , y , z j Shaft stiffness in the x , y and z directions
lProjection distance of theoretical meshing line
L Initial tooth width
L p Projection length of base circle tooth pitch
L n Time-varying contact surface tooth width
m 1,2 Mass of gear
m p Gear contact ratio
n Number of pairs of instantaneously engaged teeth
P b Base pitch
Q Generalized force vector
R 1,2 Pitch radius of pinion and gears
R a Average surface roughness
R b 1,2 Radius of the base circle
R C Total dissipation function
R f 1,2 Moment arm of the friction force for the pair
R O 1,2 Tooth tip circle radius of gears
T 1,2 Input and output working torque
T E Kinetic energy of gear system
T m System engagement cycle
T θ f 1,2 Gear friction torque
U Energy generated of gear system
υ The viscosity coefficient of the gear
V s The sliding speed
V r The speed of entraining motion
W Normal force of tooth surface contact
Z a c t Contact wire length
β Helical angle of helical gear
β b Base helix angle
δ L Transmission error along the LOA direction
δ L Translational displacement along the LOA direction
δ O Transmission error along the OLOA direction
δ O Translational displacement along the OLOA direction
θ 1,2 Torsional vibration displacement of pinion and gear
μ Coefficient of friction
ξ m Mesh damping ratio
ξ s Support damping ratio
ψ Time-varying normal meshing angle
O L O A Off-line-of-action
D T E Dynamic transmission error
L O A Line-of-action
E H L Electrohydrodynamic lubrication

Appendix A

Figure A1. Normal and friction forces of analytical (MDOF) helical gear system model.
Machines 13 00262 g0a1
The calculation formula for the friction arm of the helical gear system from the above figure can be derived as follows:
R f 1 , 2 , 3 p = L p N p + ρ g = R p sin a + L m sin β b + ρ g 1 / 2 R p sin a + L m sin β b + ρ g 2 / 2 R p sin a + L m sin β b + ρ g 3 / 2
R f 1 , 2 , 3 g = L P N g ρ g = R g sin a L m sin β b ρ g 1 / 2 R g sin a L m sin β b ρ g 2 / 2 R g sin a L m sin β b ρ g 3 / 2
where L m is the instantaneous contact line length of the system.
L m = L max τ / min ε α , ε β 0 τ < min ε α , ε β L max min ε α , ε β τ < max ε α , ε β L max τ ε / min ε α , ε β max ε α , ε β τ < ε 0 e l s e
where τ = θ R 1 b / P t is the period of rotation of the pinion, ε = ε α + ε β is the total overlap ratio and L m a x is the maximum length of the contact line. With the change in tooth width and lateral and longitudinal overlap ratio, two different cases occur and can be given as:
L max = b n sec β b ε α ε β Z a c t csc β b ε α > ε β
ρ g 1 is the distance between node P and meshing point A when the first pair of teeth contact, which can be calculated as:
ρ g 1 = R g sin α n R 2 O 2 R 2 b 2 + γ 1
ρ g 2 is the distance between node P and meshing point B when the first pair of teeth contact, which can be calculated as:
ρ g 2 = R 2 sin α n R 2 O 2 R 2 b 2 + γ 2
ρ g 3 is the distance between node P and meshing point C when the first pair of teeth contact, which can be calculated as:
ρ g 3 = R 2 sin α n R 2 O 2 R 2 b 2 + γ 3
γ is a cyclic variable that describes the contact between different tooth pairs, calculated as:
γ 1 = R 1 b mod θ p , φ m p + P b * cos β b * sin γ / sin β b + γ
γ 2 = R 1 b mod θ p , φ m p * cos β b * sin γ / sin β b + γ
γ 3 = R 1 b mod θ p , φ m p P b * cos β b * sin γ / sin β b + γ
In summary, the frictional moment arms of the large and small gears in the helical gear system can be obtained as:
R f 1 , 2 , 3 g = R 2 o 2 R 2 b 2 L m sin β b sin γ + β b R 1 b mod θ p , φ m p / 2 sin γ + β b R 2 o 2 R 2 b 2 L m sin β b sin γ + β b R 1 b mod θ p , φ m p + P b / 2 sin γ + β b R 2 o 2 R 2 b 2 L m sin β b sin γ + β b R 1 b mod θ p , φ m p + 2 P b / 2 sin γ + β b
R f 1 , 2 , 3 p = R p + R g sin a n + L m sin β b R 2 o 2 R 2 b 2 sin γ + β b + R 1 b mod θ p , φ m p + P b / 2 sin γ + β b R p + R g sin a n + L m sin β b R 2 o 2 R 2 b 2 sin γ + β b + R 1 b mod θ p , φ m p + P b / 2 sin γ + β b R p + R g sin a n + L m sin β b R 2 o 2 R 2 b 2 sin γ + β b + R 1 b mod θ p , φ m p + 2 P b / 2 sin γ + β b
where φ m p is the theoretical meshing period, R p and R g respectively represent the meshing radius of the gear.
R f 1 , 2 , 3 p = d sin a n R 2 o 2 R 2 b 2 + L m sin β b sin γ + β b + R 1 b mod θ p , φ m p / 2 sin γ + β b d sin a n R 2 o 2 R 2 b 2 + L m sin β b sin γ + β b + R 1 b mod θ p , φ m p + P b / 2 sin γ + β b d sin a n R 2 o 2 R 2 b 2 + L m sin β b sin γ + β b + R 1 b mod θ p , φ m p + 2 P b / 2 sin γ + β b
Thus, the sliding speeds v p i and v g i of the tooth surfaces of the large and small gears can be obtained as follows:
v p i v g i = θ ˙ p 0 0 θ ˙ g R f p R f g

References

  1. Roda-Casanova, V.; Gonzalez-Perez, I. Investigation of the effect of contact pattern design on the mechanical and thermal behaviors of plastic-steel helical gear drives. Mech. Mach. Theory 2021, 164, 104401. [Google Scholar] [CrossRef]
  2. Jordan, J.M.; Blockmans, B.; Desmet, W. A linear formulation for misaligned helical gear contact analysis using analytical contact stiffnesses. Mech. Mach. Theory 2023, 187, 105373. [Google Scholar] [CrossRef]
  3. Guilbert, B.; Velex, P. Investigations on mesh stiffness functions in three-dimensional spur and helical gear models. Definitions and numerical simulations. Mech. Mach. Theory 2024, 203, 105823. [Google Scholar] [CrossRef]
  4. Bozca, M. Transmission error model-based optimisation of the geometric design parameters of an automotive transmission gearbox to reduce gear-rattle noise. Appl. Acoust. 2018, 130, 247–259. [Google Scholar] [CrossRef]
  5. He, Z.; Zhang, T.; Lin, T. Novel mathematical modelling method for meshing impact of helical gear. Mech. Mach. Theory 2020, 152, 103949. [Google Scholar] [CrossRef]
  6. Wang, J.G.; Lv, B.; Sun, R.; Zhao, Y.X. Resonance and stability analysis of a cracked gear system for railway locomotive. Appl. Math. Model. 2020, 77, 253–266. [Google Scholar] [CrossRef]
  7. Yu, W.; Mechefske, C.K. Analytical modeling of spur gear corner contact effects. Mech. Mach. Theory 2016, 96, 146–164. [Google Scholar] [CrossRef]
  8. Kim, W.; Yoo, H.H.; Chung, J. Dynamic analysis for a pair of spur gears with translational motion due to bearing deformation. J. Sound Vib. 2010, 329, 4409–4421. [Google Scholar] [CrossRef]
  9. Kim, W.; Lee, J.Y.; Chung, J. Dynamic analysis for a planetary gear with time-varying pressure angles and contact ratios. J. Sound Vib. 2012, 331, 883–901. [Google Scholar] [CrossRef]
  10. Wang, J.; Zhang, J.; Yao, Z.; Yang, X.; Sun, R.; Zhao, Y. Nonlinear characteristics of a multi-degree-of-freedom spur gear system with bending-torsional coupling vibration. Mech. Syst. Signal Process. 2019, 121, 810–827. [Google Scholar] [CrossRef]
  11. Jiang, H.; Liu, F. Dynamic features of three-dimensional helical gears under sliding friction with tooth breakage. Eng. Fail. Anal. 2016, 70, 305–322. [Google Scholar] [CrossRef]
  12. Jiang, H.; Liu, F. Mesh stiffness modelling and dynamic simulation of helical gears with tooth crack propagation. Meccanica 2020, 55, 1215–1236. [Google Scholar] [CrossRef]
  13. Wan, Z.; Cao, H.; Zi, Y.; He, W.; Chen, Y. Mesh stiffness calculation using an accumulated integral potential energy method and dynamic analysis of helical gears. Mech. Mach. Theory 2015, 92, 447–463. [Google Scholar] [CrossRef]
  14. Sun, Z.; Chen, S.; Hu, Z.; Lei, D. Vibration response analysis of a gear-rotor-bearing system considering steady-state temperature. Nonlinear Dyn. 2022, 107, 477–493. [Google Scholar] [CrossRef]
  15. Kong, X.; Hu, Z.; Tang, J.; Chen, S.; Wang, Z. Effects of gear flexibility on the dynamic characteristics of spur and helical gear system. Mech. Syst. Signal Process. 2023, 184, 109691. [Google Scholar] [CrossRef]
  16. Abdallah, O.; Sassi, S. Contribution of friction-induced vibration to the realistic failure analysis of spur gear cracked teeth. Eng. Fail. Anal. 2024, 158, 107956. [Google Scholar] [CrossRef]
  17. Vaishya, M.; Singh, R. Analysis of periodically varying gear mesh systems with coulomb friction using floquet theory. J. Sound Vib. 2001, 243, 525–545. [Google Scholar] [CrossRef]
  18. Vaishya, M.; Singh, R. Sliding friction-induced non-linearity and parametric effects in gear dynamics. J. Sound Vib. 2001, 248, 671–694. [Google Scholar] [CrossRef]
  19. Gunda, R.; Singh, R. Dynamic Analysis of Sliding Friction in a Gear Pair. In Proceedings of the International Design Engineering Technical Conferences and Computers and Information in Engineering Conference, Chicago, IL, USA, 2–6 September 2003; Volume 2003, pp. 441–448. [Google Scholar]
  20. He, S.; Gunda, R.; Singh, R. Effect of sliding friction on the dynamics of spur gear pair with realistic time-varying stiffness. J. Sound Vib. 2007, 301, 927–949. [Google Scholar] [CrossRef]
  21. Kar, C.; Mohanty, A.R. An algorithm for determination of time-varying frictional force and torque in a helical gear system. Mech. Mach. Theory 2007, 42, 482–496. [Google Scholar] [CrossRef]
  22. Wang, S.; Zhu, R. Nonlinear dynamic analysis of GTF gearbox under friction excitation with vibration characteristics recognition and control in frequency domain. Mech. Syst. Signal Process. 2021, 151, 107373. [Google Scholar] [CrossRef]
  23. Wang, C.; Shi, Z. A dynamic calculation method of sliding friction losses for a helical gear pair. J. Braz. Soc. Mech. Sci. Eng. 2016, 39, 1521–1528. [Google Scholar] [CrossRef]
  24. Siyu, C.; Jinyuan, T.; Caiwang, L.; Qibo, W. Nonlinear dynamic characteristics of geared rotor bearing systems with dynamic backlash and friction. Mech. Mach. Theory 2011, 46, 466–478. [Google Scholar] [CrossRef]
  25. Huang, K.; Xiong, Y.; Wang, T.; Chen, Q. Research on the dynamic response of high-contact-ratio spur gears influenced by surface roughness under EHL condition. Appl. Surf. Sci. 2017, 392, 8–18. [Google Scholar] [CrossRef]
  26. Jiang, H.; Liu, F.; Zhang, J.; Xiao, Y.; Liu, J.; Xuan, Z.; Li, B.; Yang, X.; Kong, X. Mesh stiffness modeling and dynamic simulation of spur gears with body crack under speed fluctuation condition. Mech. Based Des. Struct. Mach. 2024, 52, 8371–8397. [Google Scholar] [CrossRef]
  27. Arrospide, E.; Bikandi, I.; García, I.; Durana, G.; Aldabaldetreku, G.; Zubia, J. 7-Mechanical properties of polymer-optical fibres. In Polymer Optical Fibres; Bunge, C.-A., Gries, T., Beckers, M., Eds.; Woodhead Publishing: Cambridge, UK, 2017; pp. 201–216. [Google Scholar] [CrossRef]
  28. Yilmaz, M.; Kratzer, D.; Lohner, T.; Michaelis, K.; Stahl, K. A study on highly-loaded contacts under dry lubrication for gear applications. Tribol. Int. 2018, 128, 410–420. [Google Scholar] [CrossRef]
  29. Yan, P.; Liu, H.; Gao, P.; Zhang, X.; Zhan, Z.; Zhang, C. Optimization of distributed axial dynamic modification based on the dynamic characteristics of a helical gear pair and a test verification. Mech. Mach. Theory 2021, 163, 104371. [Google Scholar] [CrossRef]
  30. Chen, Y.-C. Time-varying dynamic analysis for a helical gear pair system with three-dimensional motion due to bearing deformation. Adv. Mech. Eng. 2020, 12, 1687814020918128. [Google Scholar] [CrossRef]
  31. Mo, W.; Jiao, Y.; Chen, Z. Dynamic Analysis of Helical Gears With Sliding Friction and Gear Errors. IEEE Access 2018, 6, 60467–60477. [Google Scholar] [CrossRef]
  32. Yi, Y.; Huang, K.; Xiong, Y.; Sang, M. Nonlinear dynamic modelling and analysis for a spur gear system with time-varying pressure angle and gear backlash. Mech. Syst. Signal Process. 2019, 132, 18–34. [Google Scholar] [CrossRef]
  33. Chen, Q.; Ma, Y.; Huang, S.; Zhai, H. Research on gears’ dynamic performance influenced by gear backlash based on fractal theory. Appl. Surf. Sci. 2014, 313, 325–332. [Google Scholar] [CrossRef]
  34. Yu, X.; Sun, Y.; Li, H.; Wu, S. Nonlinear characteristics of gear pair considering fractal surface dynamic contact as internal excitation. Int. J. Non-Linear Mech. 2022, 143, 104027. [Google Scholar] [CrossRef]
  35. Huang, K.; Cheng, Z.; Xiong, Y.; Han, G.; Li, L. Bifurcation and chaos analysis of a spur gear pair system with fractal gear backlash. Chaos Solitons Fractals 2021, 142, 110387. [Google Scholar] [CrossRef]
  36. Yang, H.; Shi, W.; Chen, Z.; Guo, N. An improved analytical method for mesh stiffness calculation of helical gear pair considering time-varying backlash. Mech. Syst. Signal Process. 2022, 170, 108882. [Google Scholar] [CrossRef]
  37. Wan, Z.; Cao, H.; Zi, Y.; He, W.; He, Z. An improved time-varying mesh stiffness algorithm and dynamic modeling of gear-rotor system with tooth root crack. Eng. Fail. Anal. 2014, 42, 157–177. [Google Scholar] [CrossRef]
  38. He, S.; Cho, S.; Singh, R. Prediction of dynamic friction forces in spur gears using alternate sliding friction formulations. J. Sound Vib. 2008, 309, 843–851. [Google Scholar] [CrossRef]
  39. Jiang, H.; Liu, F. Dynamic modeling and analysis of spur gears considering friction–vibration interactions. J. Braz. Soc. Mech. Sci. Eng. 2017, 39, 4911–4920. [Google Scholar] [CrossRef]
  40. Xie, C.; Yu, W. Gear dynamic modelling based on the concept of dynamic mesh stiffness: Theoretical study and experimental verification. J. Mech. Sci. Technol. 2022, 36, 4953–4965. [Google Scholar] [CrossRef]
  41. Feng, K. Effect of Shaft and Bearing Flexibility on Dynamic Behavior of Helical Gears: Modeling and Experimental Comparisons. J. Adv. Mech. Des. Syst. Manuf. 2012, 6, 1190–1205. [Google Scholar] [CrossRef]
  42. Liu, H.; Zhang, D.; Liu, K.; Wang, J.; Liu, Y.; Long, Y. Nonlinear Dynamic Modeling and Analysis for a Spur Gear System with Dynamic Meshing Parameters and Sliding Friction. Symmetry 2023, 15, 1530. [Google Scholar] [CrossRef]
Figure 1. The three-dimensional meshing diagram after meshing.
Machines 13 00262 g001
Figure 2. The two-dimensional projection on the plane.
Machines 13 00262 g002
Figure 3. Contact representation of helical gear pair with surface topography and asperity details.
Machines 13 00262 g003
Figure 4. Time-varying mesh stiffness of helical gears.
Machines 13 00262 g004
Figure 5. Comparison between traditional numerical methods and experimental results and simulation results from mesh harmonic amplitudes.
Machines 13 00262 g005
Figure 6. Comparison diagram of two models at 800 RPM. (a,b) 10 6   N m ; (c,d) 6× 10 6   N m ; (e,f) 1.2 ×   10 7   N m ; Present model (); Traditional model ().
Machines 13 00262 g006
Figure 7. Schematic diagram of the variation in influence factor m with torque.
Machines 13 00262 g007
Figure 8. Transmission error-Max varies with driving speed. (a): with friction; (b): without friction.
Machines 13 00262 g008
Figure 9. Comparison of gear dynamics with friction () and without friction () at a driving speed of 570 RPM. (a) Time-domain response; (b) Phase portrait; (c) Poincare map; and (d) FFT spectrum.
Machines 13 00262 g009
Figure 10. Comparison of gear dynamics with friction () and without friction () at a driving speed of 1160 RPM. (a) Time-domain response; (b) Phase portrait; (c) Poincare map; and (d) FFT spectrum.
Machines 13 00262 g010
Figure 11. 3−D FFT at different driving speeds.
Machines 13 00262 g011
Figure 12. Dynamic response of the gear system alongside its corresponding Largest Lyapunov exponent. (a) bifurcation chart; (b) Largest Lyapunov exponent.
Machines 13 00262 g012
Figure 13. Vibration response of relative displacement in gear system. (a1a4): RA = 0.48; (b1b4): RA = 0.52; (c1c4): RA = 0.54; (d1d4): RA = 0.63.
Machines 13 00262 g013
Figure 14. 3D spectrogram (only considering friction effects (a) 3D spectrum; (b) Top view).
Machines 13 00262 g014
Figure 15. The influence of fractal dimension under different roughness conditions.
Machines 13 00262 g015
Figure 16. 3D spectrogram only considering fractal effects.
Machines 13 00262 g016
Figure 17. Changes in maximum driving speed of animals corresponding to different fractal dimensions.
Machines 13 00262 g017
Figure 18. The maximum transmission error varies with the driving speed.
Machines 13 00262 g018
Figure 19. 3D spectral analysis of dynamic responses in fractal-coupled gear systems. (a) 3D spectrum; (b) Top view.
Machines 13 00262 g019
Figure 20. The dynamic response of the relative displacement of gear pair. (a,c) without fractal coupling; (b,d) with fractal coupling.
Machines 13 00262 g020
Figure 21. Vibration response of relative displacement in gear system. (a1c1): RA = 0.4; (a2c2): RA = 0.52; (a3c3): RA = 0.6.
Machines 13 00262 g021
Figure 22. 3D spectral analysis of dynamic responses in coupled gear systems. (a) 3D spectrum; (b) Top view.
Machines 13 00262 g022
Table 1. Geometrical and material parameters of helical gear pairs in Ref. [41].
ParametersPinion/Gear
Number   of   teeth   Z g ,   p 30/53
Helix   angle β   ( ° ) 30
Pressure   angle   a   ( ° ) 20
Tooth   width   L m m 20
Module   m m m 2.5
Face   width   m m 20
Module   m m m 2.5
Base   circle   diameter   m m 79.83/141.04
Reference   diameter   m m 86.60/153.00
Center   distance   m m 12.01
Total   contact   ratio   m m 2.65
Shaft   length   m m 160
Shaft   average   radius   m m 50
Shaft   inner   radius   m m 25/30
Gear   damping   coefficient   ξ m 5 × 10 6
Table 2. Geometrical and material parameters of helical gear pairs.
ParametersPinion/Gear
Number   of   teeth   Z g ,   p 23/47
Inertia   I g , p ( k g / m m 2 ) 501.6/8748
Gear   mass m   K g 0.78/3.28
Radial   bearing   stiffness   D K z   N / m 5 × 10 8
Radial   axis   stiffness   D K x , y   N / m 6.17 × 10 6
Module   m m m 2.5
Helix   angle   β   ( ° ) 8.0
Pressure   angle   a   ( ° ) 20
Tooth   width   L m m 30
Backlash   2 C b μ m 120
Contact   surface   roughness   R a μ m 0.1
Tooth   top   height   factor   h a * H / a 1.0
Damping coefficient of the shaft ξ s 0.05
Gear   damping   coefficient   ξ m 0.025
Table 3. Different flexible support stiffness.
Driving Speed (RPM)Support Stiffness (Nm)
δ L O A (1 × 10⁶) δ O L O A (1 × 10⁶) δ L O A (6 × 10⁶) δ O L O A (6 × 10⁶) δ L O A (1.2 × 10⁷) δ O L O A (1.2 × 10⁷)
800 25.6 50.2 1.8 10.98 0.36 0.89
1800 27.4 51.7 2.12 10.18 0.74 1.68
2800 26.5 48.8 2.15 9.56 0.66 2.14
Disclaimer/Publisher’s Note: The statements, opinions and data contained in all publications are solely those of the individual author(s) and contributor(s) and not of MDPI and/or the editor(s). MDPI and/or the editor(s) disclaim responsibility for any injury to people or property resulting from any ideas, methods, instructions or products referred to in the content.

