Abstract
Addressing the challenge of manual dependency and the difficulty in automating the online detection of height discrepancies following engine oil seal assembly, this paper proposes a composite vision-based method for the post-assembly size inspection of engine oil seals. The proposed method enables non-contact, online three-dimensional measurement of oil seals already installed on the engine. To achieve accurate positioning of the inner and outer ring regions of the oil seals, the process begins with obtaining the center point and the major and minor axes through ellipse fitting, which is performed using progressive template matching and the least squares method. After scaling the ellipse along its axes, the preprocessed image is segmented using the peak–valley thresholding method to generate an annular ROI (region of interest) mask, thereby reducing the complexity of the image. By integrating three-frequency four-step phase-shifting profilometry with an improved RANSAC (random sample consensus)-based plane fitting algorithm, the height difference between the inner and outer rings as well as the press-in depth are accurately calculated, effectively eliminating interference from non-target regions. Experimental results demonstrate that the proposed method significantly outperforms traditional manual measurement in terms of speed, with the relative deviations of the height difference and press-in depth confined within 0.33% and 1.45%, respectively, and a detection success rate of 96.35% over 1415 samples. Compared with existing methods, the proposed approach not only enhances detection accuracy and efficiency but also provides a practical and reliable solution for real-time monitoring of engine oil seal assembly dimensions, highlighting its substantial industrial application potential.
1. Introduction
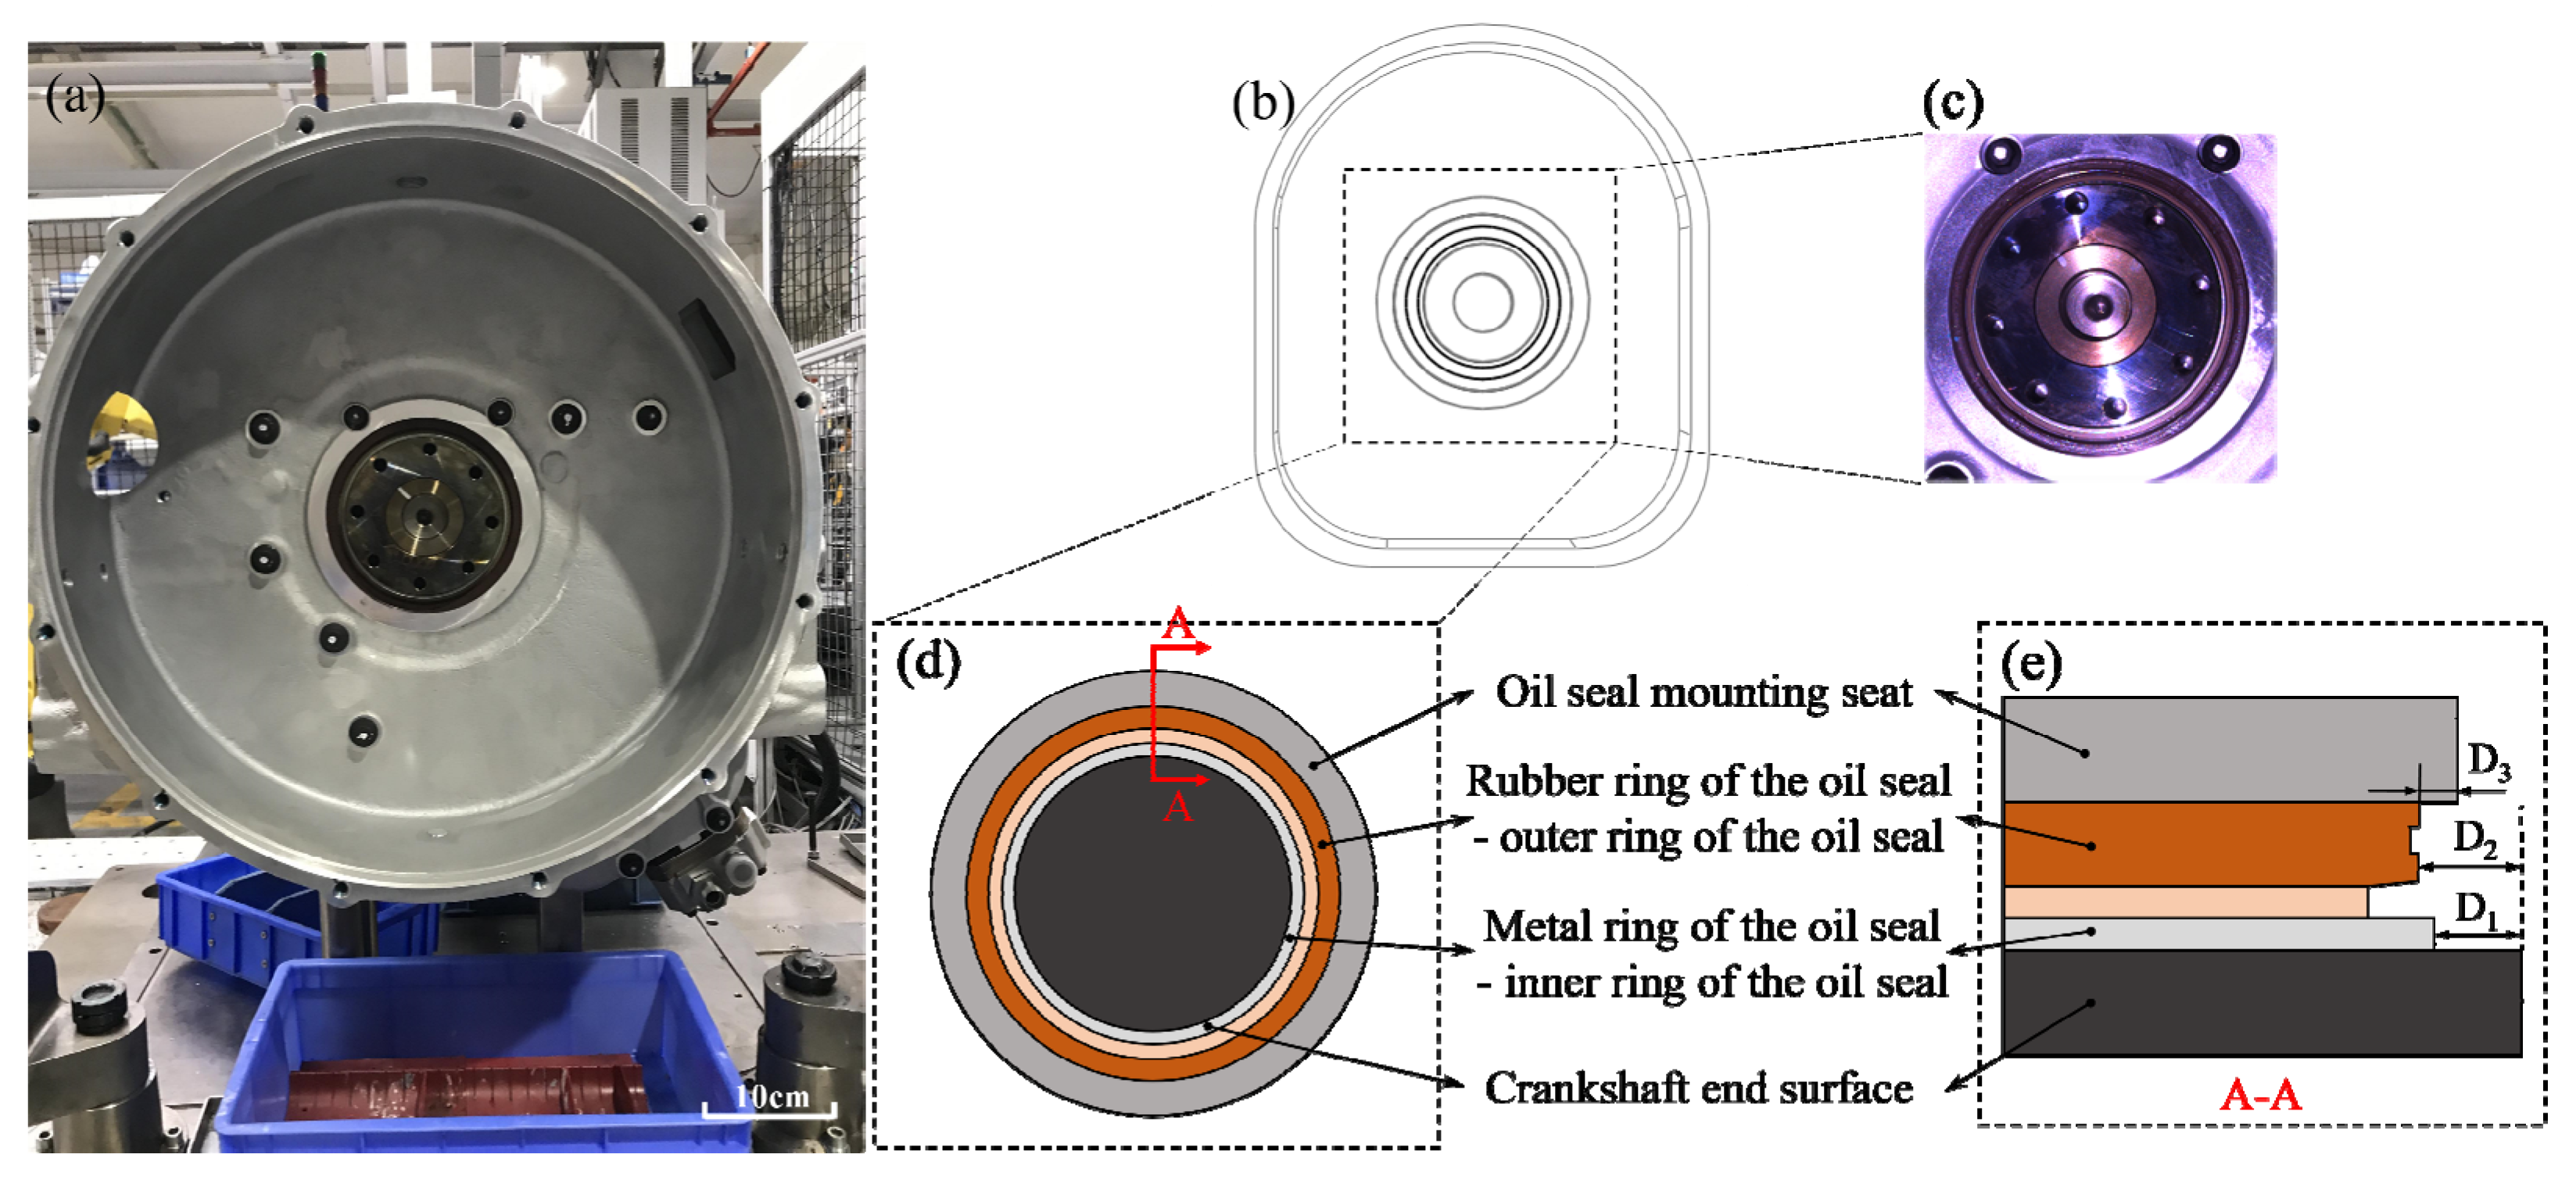
Engine oil seals are important mechanical sealing parts, mainly used to prevent oil leakage and isolation of dust. To ensure proper functioning of the engine, the quality of the oil seal between the crankshaft and assembly directly affects engine life and performance, so for the assembly, the accuracy of oil seal detection is critical [1]. An oil seal assembly diagram is shown in Figure 1, where Figure 1d represents the four areas to be measured. From outer to inner, these areas are the oil seal seat, the outer ring of the oil seal (rubber material), the inner ring of the oil seal (metal material), and the crankshaft end. Figure 1e is a cross-sectional view of Figure 1d, where the letters indicate three measurement heights. D1 represents the height between the crankshaft end and the inner ring of the oil seal, D2 represents the height between the crankshaft end and the inner ring of the oil seal, and D3 represents the height between the oil seal seat and the outer ring of the crankshaft.
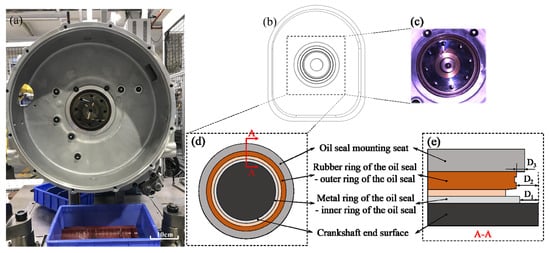
Figure 1.
Oil seal assembly diagram. (a) Actual assembly drawing of oil seal, (b) simulated assembly drawing of oil seal, (c) close-up drawing of oil seal and crankshaft, (d) simulated drawing of main measurement part of oil seal, (e) simulated cross-sectional structure drawing of oil seal.
To ensure the quality of oil seals in the process of use, they are usually inspected before and after assembly. However, at present, the inspection of oil seal dimensions after assembly mainly relies on contact methods such as manual measurement, and these traditional manual inspection methods have the problems of long inspection time and large subjective errors. As computer technology advances, an increasing number of researchers are researching non-contact methods to detect the production quality of oil seals.
Comparatively speaking, most of the current inspections of oil seals mainly focus on the pre-assembly stage, i.e., only inspecting the production quality of oil seals, such as inspecting the structural sealing of oil seals, outer ring burrs [2], roundness [3], and surface scratches [4]. In order to detect the rationality of oil seal structural design before assembly, Park et al., on the other hand, analyzed the oil leakage performance of oil-sealed seals through the use of finite elements and computational fluid dynamics, and performed structural optimization mainly in the design stage of the oil seals [1]; Bzura et al. investigated the diagnostic model used for radial lip seals on the crankshafts of piston internal combustion engines in order to check the sealing characteristics of the oil seals [5]. However, the above finite element method cannot guarantee the production quality; therefore, many researchers have proposed the method of defect and size detection of oil seals by machine vision technology. Liu Jie et al. proposed an oil seal defect detection method based on entropy rate clustering segmentation and ring-band differencing for problems such as gnawing defects on the surface of the oil seal and the difficulty in region segmentation [6]; Zhang Guoping et al. extracted defect information by segmenting the edge information of an image and constructing a graphical segmentation model for defect detection [7]. Shi Lei et al. proposed an edge detection method for oil seal defects based on threshold segmentation and chain code and applied least squares fitting to the circular contour of the oil seal lip for defect detection [8]. Xia Guifang et al. proposed an improved algorithm for multi-scale feature fusion based on a deep learning Faster R-CNN framework to improve the accuracy of oil seal defect detection [4].
All of the above seal inspection, size inspection, or defect detection methods must be focused on the oil seal before assembly; however, there is a lack of methods for inspecting the dimensions of oil seals after assembly, so there is an urgent need for a fully automated, high-precision, high-stability visual inspection method. Although there is a lack of methods for the measurement of oil seal assembly dimensions, domestic and foreign researchers have long studied the size measurement of other targets. Del Olmo Ander et al. achieved the automatic assessment of cutting tool wear by combining real-time monitoring with offline tool wear detection [9]. Aldekoa, Inigo et al. implemented early detection of tool wear in electromechanical broaching machines by monitoring the main stroke servo motor, mechanical system, and signal processing using vision and other sensors [10]. In addition to utilizing electrical signals for automated assessment, structured light sensors and point cloud processing have also been widely applied in automated measurement. Xu Lei et al. used line-structured light for the three-dimensional reconstruction of tires to achieve tire tread depth measurements [11]. Similarly, Xu Dashuai et al. proposed the application of a line-structured light sensor to accomplish the dimensional measurement of order difference and gap [12], but the use of line-structured light for height difference measurements can only deal with objects where there is a single feature or a region of similar order difference in the distribution of features. In addition, Shuang Yu et al. proposed an innovative structural parameter correction method for a structured light depth imager to reduce the depth measurement error caused by structural parameter errors [13]; Zhao Hongwei et al. proposed an aircraft hatch gap measurement method based on binocular surface structured light, which is based on the structured light three-dimensional reconstruction method, where a certain cross-section is selected for the point cloud obtained from the acquisition, and then, based on the cross-section curve breaks as the gap feature, the gap size is finally obtained [14]; Shengyuan Li et al. utilized multi-angle 2D images to reconstruct 3D point clouds, which were subsequently sliced along the direction of the largest plane’s normal vector. The slices were projected onto a coordinate plane perpendicular to the point cloud’s largest plane normal vector, revealing the contour of the exposed bolt positions [15]. Furthermore, Zhihao Zheng et al. applied a random sampling consistency algorithm to fit a circle and locate the conical and cylindrical boundaries based on the variation in the circle size, enabling the segmentation of the stress-resistant cone region [16]. Wang et al. proposed using binocular structured light to obtain the point cloud, followed by point cloud edge feature extraction, to extract the concave polygonal aperture features and then obtain the concave hexagonal dimensions of the automobile dashboard [17]. However, all of the above methods start from the edge of the point cloud or the cross-sectional features, and if there is more complex morphological information, the edge extraction and the cross-sectional feature extraction are prone to being extracted incorrectly. The above structured light-based dimensional measurement method proves the feasibility of structured light when it is used for oil seal measurement. Due to the large number of point clouds and low computational efficiency when reconstructing the inspection area as a whole after oil seal assembly, as well as the problems of non-targeted area interference, large size, and high reflectivity, the above method cannot be directly applied to oil seal assembly dimensional measurement.
In the quality inspection of engine oil seal assembly, traditional methods mainly rely on manual inspection or single-vision technology, which suffer from low detection efficiency, susceptibility to external interference, and a high false detection rate, making it difficult to meet the requirements of high-precision online inspection. To address these issues, this paper proposes a composite vision-based method for oil seal dimension inspection to improve detection accuracy and robustness.
The proposed method employs multi-step progressive template matching and least squares ellipse fitting to precisely obtain the center point and major/minor axes of the oil seal. A ring-shaped ROI mask is then applied to reduce interference from non-target regions. Additionally, three-frequency, four-step phase-shift fringe projection is combined with an improved RANSAC plane fitting algorithm to achieve high-precision calculations of the height difference and compression depth between the inner and outer rings of the oil seal. Compared with traditional monocular or binocular vision-based inspection methods, the proposed approach not only enhances reconstruction accuracy but also significantly improves resistance to complex background interference. This method also fills the gap in the automated inspection of oil seal compression depth, providing a novel and effective solution for precise, high-efficiency measurement in industrial applications.
In an industrial manufacturing environment, manual inspection of engine oil seal assembly quality is often complex, prone to subjective errors, and inefficient, making it unsuitable for large-scale production. The proposed method enables efficient and stable online 3D inspection, reducing manual intervention and enhancing the automation level of production line inspection. Experimental results in this study demonstrate that the method can accurately reconstruct the target inspection region of the oil seal and obtain post-assembly height difference information, providing an effective solution for high-precision automated inspection.
The rest of this paper is as follows: Section 2 introduces the principles of structured light, multilevel sub-template matching, and distance computation; Section 3 conducts related experiments to compare with other depth or size measurement methods to verify the effectiveness and reliability of the proposed composite vision inspection method; and Section 4 summarizes this paper.
2. Principle
2.1. Basics of PSP
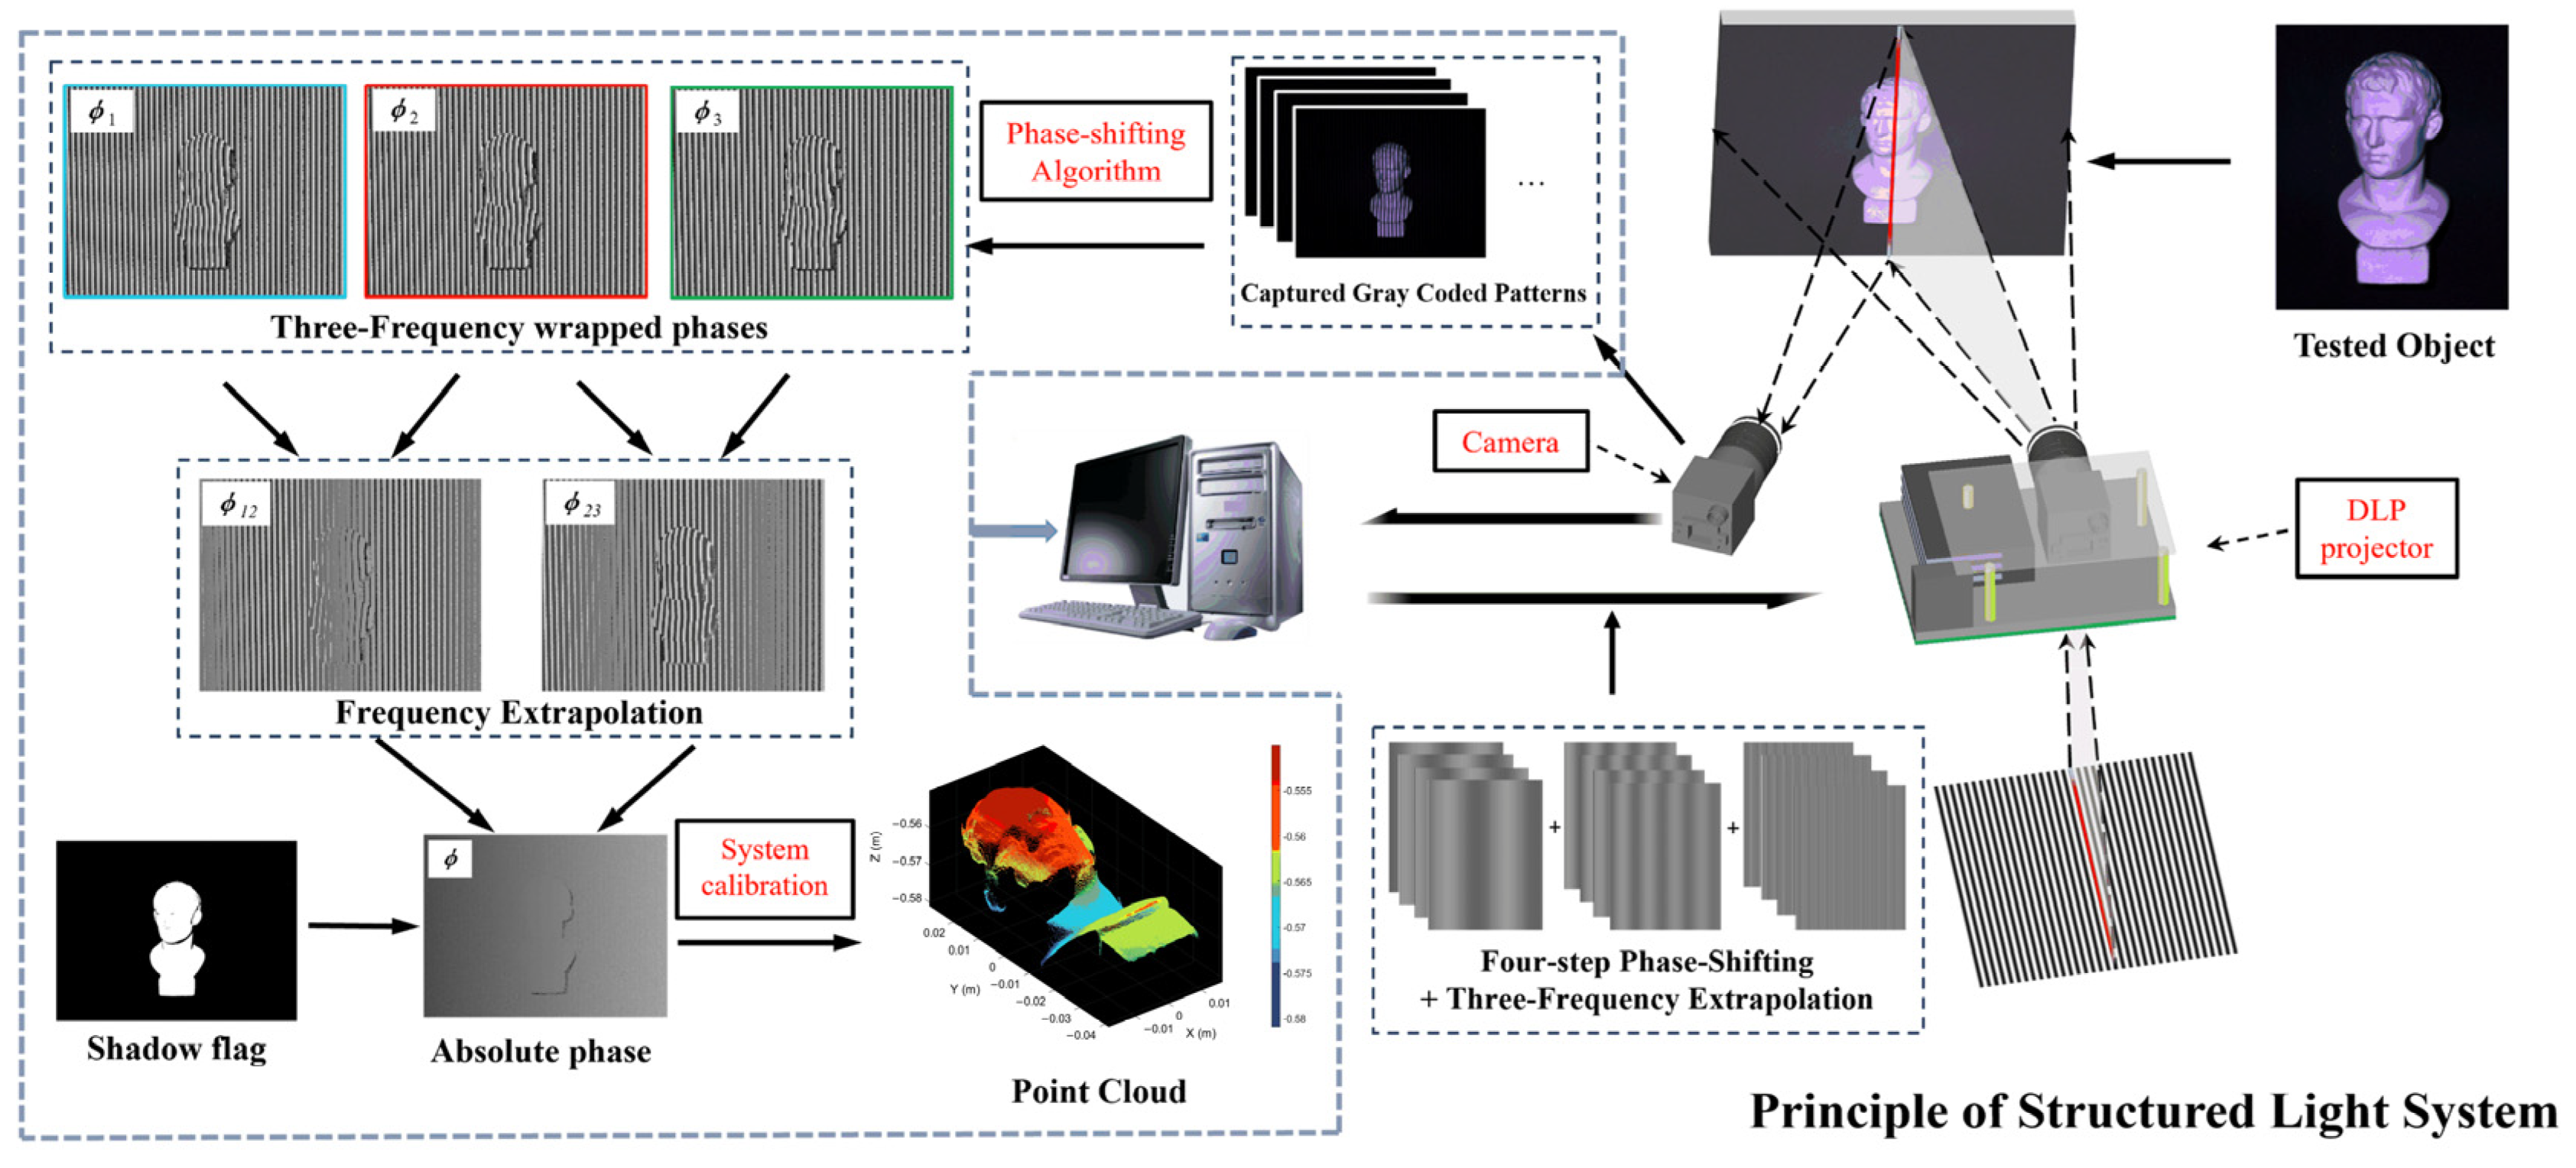
Phase shift profilometry (PSP) is characterized by high accuracy, robustness, etc. As an active structured light measurement method, it is necessary to burn the sinusoidal or cosinusoidal structured light grating stripe image to the projector device; after signal conversion processing, the projection device projects the transformed digital image onto the surface of the object to be measured, the grating stripe information on the surface of the object undergoes twisting and deformation, and the deformed grating stripe information is captured with a charge coupled device (CCD) camera. The information on the deformed grating stripes is collected by the CCD camera, the phase of the oil seal is obtained by demodulation of the deformed grating stripes, the relationship between the phase and the actual height is then established, and finally the three-dimensional coordinate information of the surface of the object is obtained [18,19]. An overall description of the imaging system is shown in Figure 2.
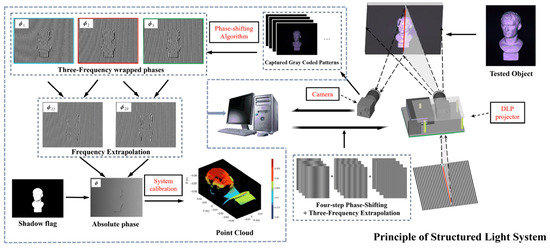
Figure 2.
PSP principle.
Compared with other common three-dimensional measurement methods—such as Fourier transform profilometry (FTP), moiré fringe methods, white-light interferometry, and time-of-flight (ToF) laser ranging technology—PSP (phase-shifting profilometry) has the following advantages: First, although FTP can extract phase information from a single image, its robustness against noise and edge information is relatively poor, making it susceptible to demodulation errors due to environmental light interference. Second, moiré fringe methods in industrial applications often rely on complex optical interference, which is significantly affected by the object’s surface reflectivity and environmental vibrations. Third, while white-light interferometry offers extremely high precision, its measurement range is limited and requires high system stability, rendering it unsuitable for online detection of large oil seals. ToF laser ranging technology, on the other hand, exhibits relatively lower precision, making it difficult to meet the requirements for detecting the fine surface morphology of oil seals.
Therefore, employing the PSP three-frequency, four-step phase-shifting algorithm not only fully exploits the high-precision phase encoding advantages of sine fringes, but also reduces noise interference through multi-step acquisition, achieving both high precision and robust phase extraction, thereby providing reliable technical support for the accurate reconstruction of oil seal surface height information. The encoded stripes used in the phase shift algorithm of this paper are sinusoidal stripes, and the pattern is projected on the object surface by a projector. The striped images can usually be represented as Equation (1):
where is the pixel coordinate, denotes the light intensity at the pixel , is the background light intensity, is the modulation amplitude, is the corresponding phase value at the pixel point, and is the amount of phase shift applied; the of each image of the four-step phase-shift method adopted can be expressed as follows:
where , , , and represent the light intensity values when the phase shift step is , , , and , respectively. The projected image is captured by the camera, and then the wrapped phase modulated by the height information of the object can be obtained by Equation (4):
Phase unwrapping is required to obtain the continuous absolute phase after calculating the wrapped phase. The multi-frequency heterodyne algorithm is commonly used for phase unwrapping. It facilitates the unwrapping of the selected fringe by projecting multiple sets of auxiliary fringes with different frequencies. Due to the versatility of the three-frequency interpolation method, this paper employs the three-frequency interpolation method for phase unwrapping [20], with the selected frequencies being 140, 134, and 129.
Once the absolute phase information is obtained, the three-dimensional coordinates can be mapped from the phase information through system calibration. After system calibration, the 3D point cloud of the acquired oil seal assembly model can be obtained, allowing for the extraction of information such as the height difference of the oil seal to be inspected.
2.2. Multiple Progressive Template Matching Method
When 3D reconstruction of oil seals is performed based on the structured light 3D reconstruction technique, the proportion of effective detection region is small among the regions to be detected, and a new detection region extraction method is needed in order to improve the extraction and reconstruction accuracy and speed.
Template matching is a commonly used machine vision technique that is mainly used to locate the template position in the image, so it was chosen to use template matching to obtain the target region. In the research object of this paper, the oil seal structure is generally circular with rotational invariance characteristics, which has less influence on the use of template matching, so template matching is used to locate the target region.
However, directly using a single template for matching poses some issues. First, when reconstructing multiple target regions, employing multiple templates for direct matching can easily lead to matching failures; secondly, if the template image is significantly smaller than the target image, every pixel must be traversed, resulting in high computational costs and large computation loads, making it difficult to meet the requirements for real-time or online detection. Additionally, since the size and position of the target region may vary considerably, single-template matching lacks sufficient flexibility in terms of scale and position, making it challenging to balance global search with local fine localization. Since the four target regions in this paper are distributed from outside to inside, the multiple progressive template matching method is proposed for target region localization, and the template matching method is utilized to obtain accurate images of each region of the oil seal for subsequent accurate reconstruction of the region to be detected [21].
The multiple progressive template matching method means that each time the matching image is performed with the result of the previous matching, in multilevel sub-matching, the first round of matching can be performed on the whole image to find the approximate matching position. In subsequent rounds, further fine matching is performed by matching in the region of the first match. By gradually narrowing the matching region, the positions to be checked in each round of matching can be reduced, thereby reducing the amount of computation. The effect is especially obvious when the image is large, and at the same time, multiple matching can focus on localized regions during the gradual refinement process, which mitigates occlusion, especially when the template may only match part of the target at a certain stage.
In this approach, oil seal assembly images with clear and well-defined features are selected as template images. Template matching is then performed on a specific region of the oil seal image to be measured, effectively minimizing interference from other areas. An enclosing rectangle is employed as the optimal bounding region to precisely identify the most suitable boundary pixels [22].
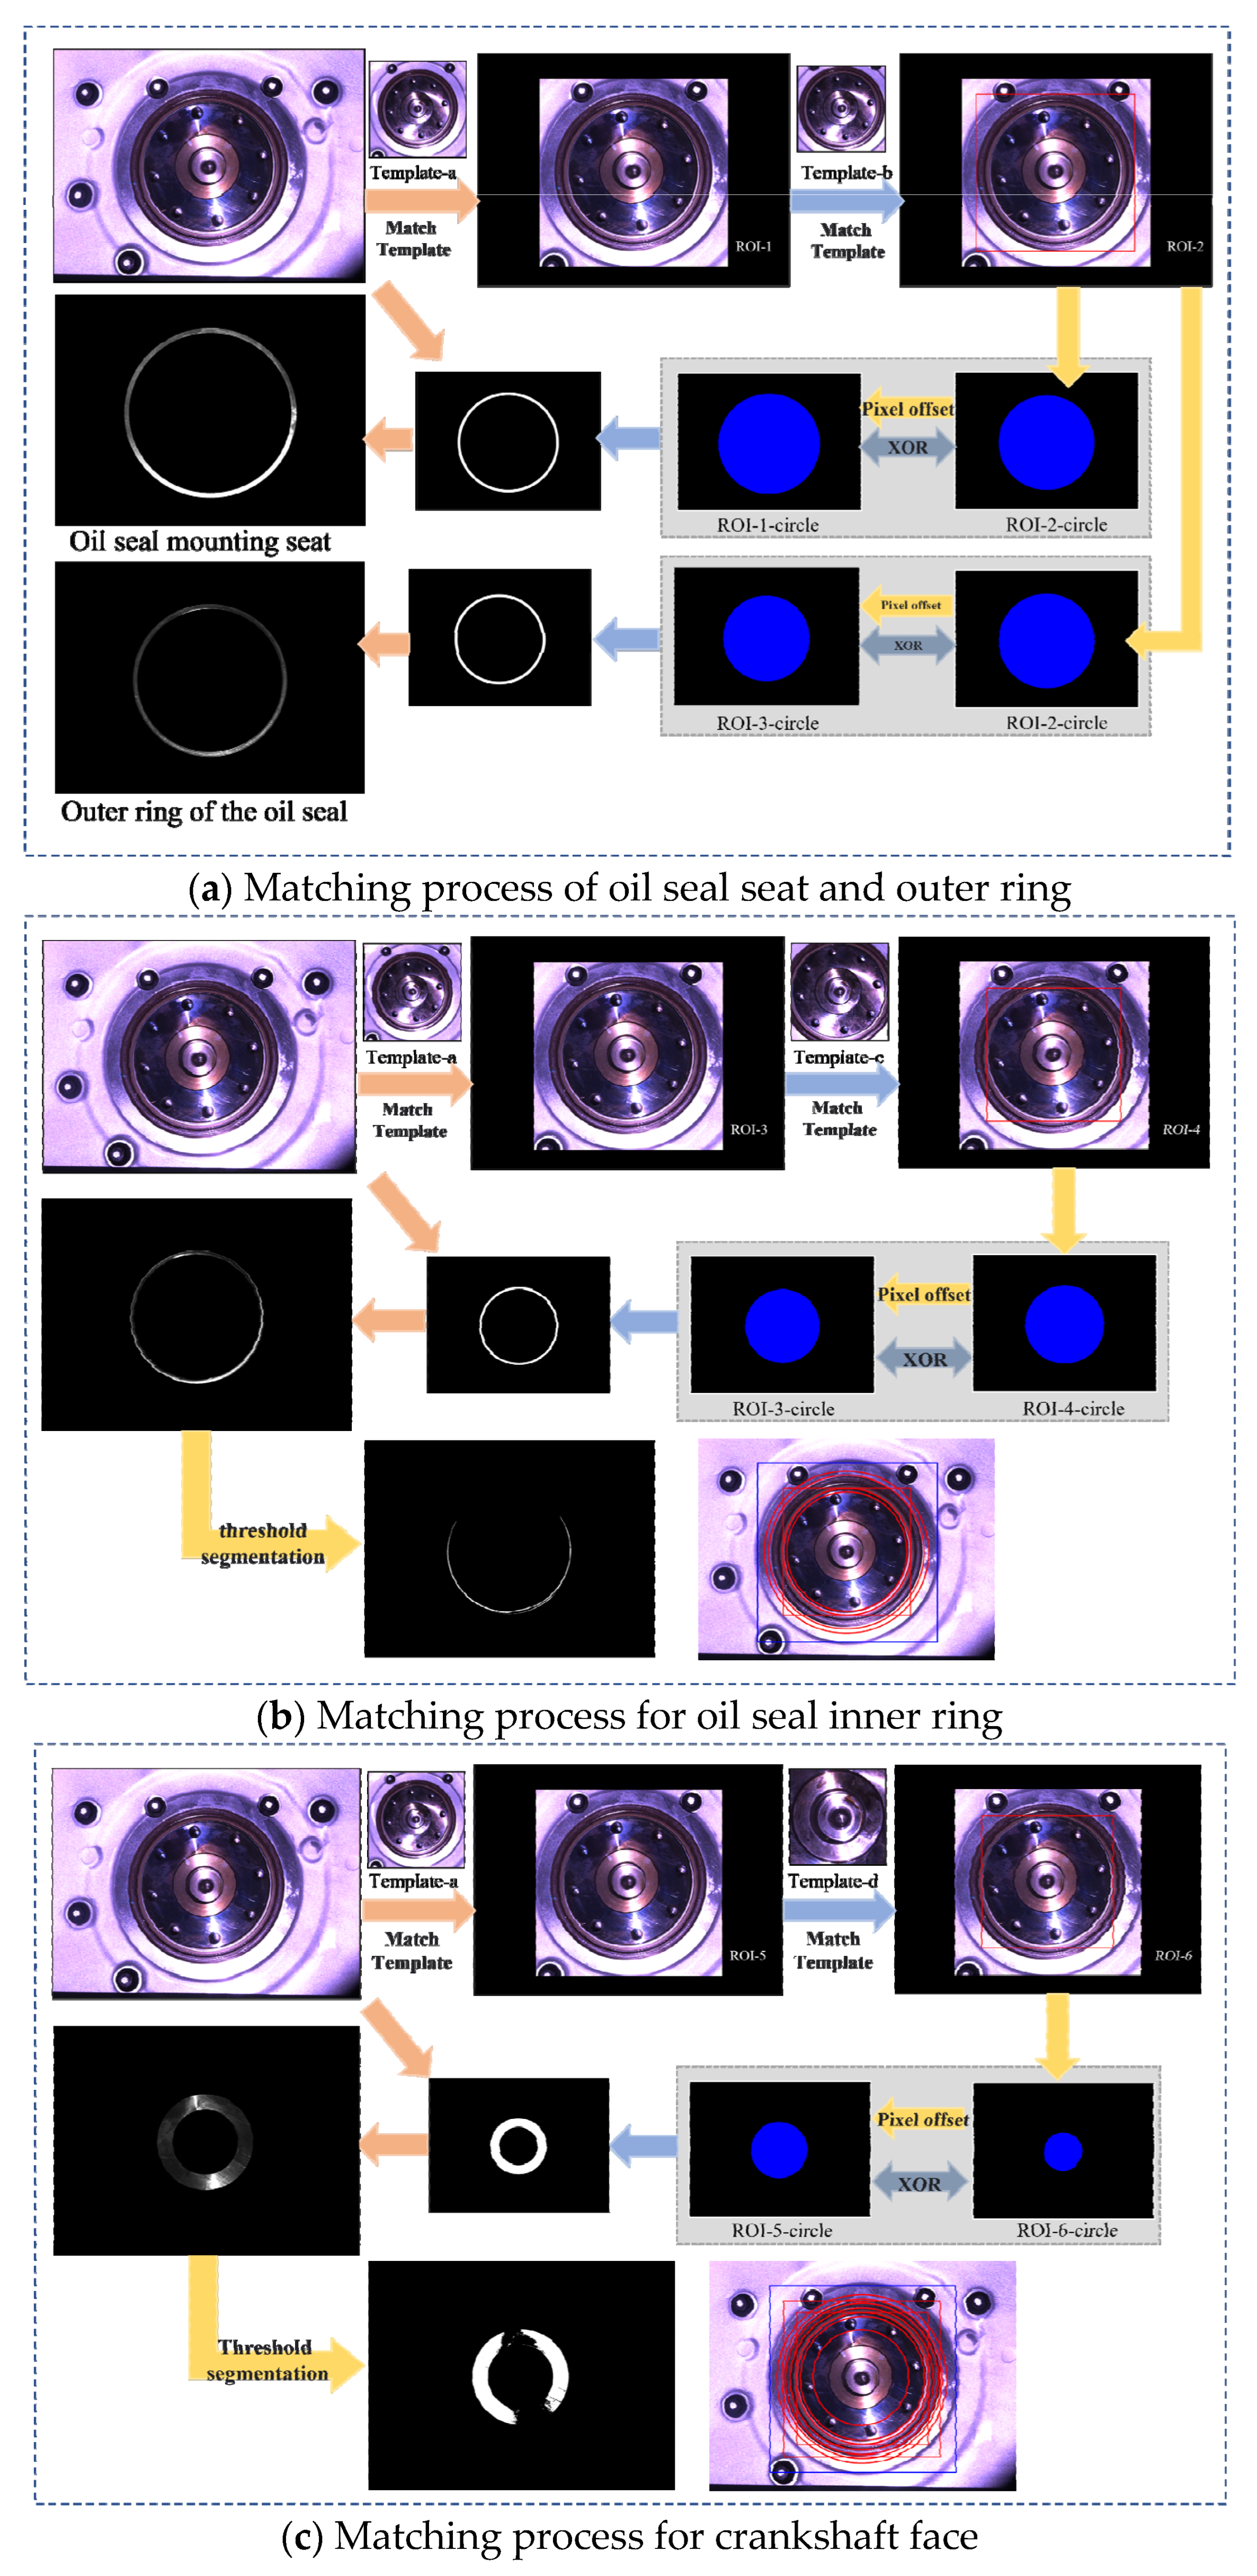
Since the oil seal profile features present an elliptical distribution, in this paper, the main process to extract the ROI region is as follows:
(1) Suppose the image is , the template is , and the coordinate range of the rectangular ROI is obtained by template matching:
where and represent the coordinates of the upper-left corner of the rectangle obtained through matching, while and denote the width and height of the rectangle, respectively. Thus, the result obtained from the first template matching is
where is the best position of template to match in image .
(2) For the obtained rectangle , the centers of each of the four sides are denoted:
(3) The four center points , , , and are used as input points for ellipse fitting using the least squares method, where the ellipse region can be expressed as
where , are the coordinates of the center image of the ellipse, and , denote the long and short axes of the ellipse, respectively.
(4) Since the region to be detected is an approximate annular region, it is necessary to scale the obtained ellipse by changing the long and short axes of the ellipse based on the initial ellipse to obtain the new long and short axes, and further obtain the new two ellipse regions and :
(5) Based on the obtained and , use Boolean operation to obtain the difference set and hence the ROI of the annular region to be detected, i.e.,:
(6) On the basis of the obtained from the previous template matching, the above steps are repeated to finally obtain four different annular regions. Further, as shown in Equation (11), the annular regions are thresholded and segmented, the high exposure and oiled regions are removed to obtain a mask, and the obtained streak image is processed using the mask to obtain a final streak image containing only ROIs. It is important to note that variations in illumination and reflection conditions significantly affect the quality of fringe images. Excessive illumination can lead to overexposure, reducing the contrast of the captured fringe images and blurring fringe details, thereby hindering optimal reconstruction outcomes. Conversely, regions with oil contamination exhibit lower reflectivity, appearing darker, which similarly impacts the clarity of fringes and the signal-to-noise ratio, subsequently affecting the accuracy of 3D reconstruction. Therefore, during the threshold segmentation phase, it is crucial to accurately identify and exclude these overexposed and oil-contaminated areas. By generating reliable masks, subsequent processing stages can focus solely on regions with favorable optical characteristics for reconstruction, thereby enhancing overall measurement accuracy and robustness.
where and denote the thresholds for removing oil contamination and high exposure areas, respectively.
As shown in Figure 3, the effective ROI can be observed: after the extraction, the non-detection area pixel points are obviously filtered out, and the required pixel values from the whole map to the ROI are reconstructed, which greatly reduces the overall amount of computation, improving the efficiency and accuracy of online detection.
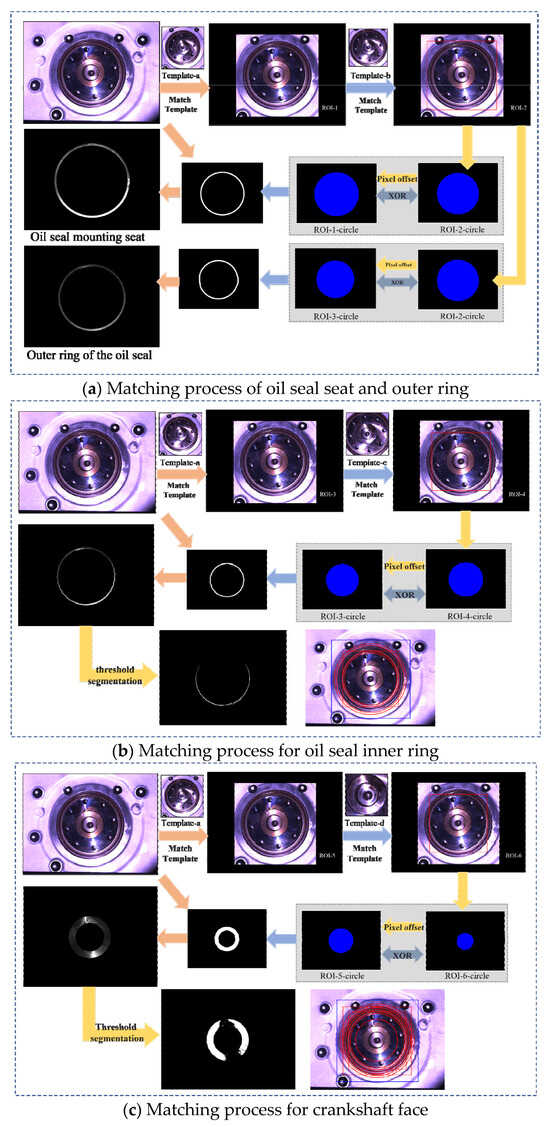
Figure 3.
ROI mask.
Continuing, to verify the effectiveness of the proposed method, a comparison experiment with the traditional single-template matching method was conducted [23]. In the experiment, the single-template matching method directly matches and localizes the target region by presetting a fixed rectangular template. Although the single-template matching method has the advantages of simple implementation and fast computation speed, its robustness decreases significantly when facing complex scenes. Particularly in the presence of scale change, deformation, or light interference in the target region, the matching accuracy is limited, which easily leads to inaccurate ROI extraction. Single matching was performed on 100 groups of acquired images using the templates in Figure 4, respectively, and it was difficult to match the target region due to the harder-to-match region, Figure c in Figure 4, so whether it matched successfully or not was taken as the final result. In contrast, the multiple progressive template matching method proposed in this paper can dynamically adapt to the changing characteristics of the target region by gradually optimizing the matching process, which significantly improves the extraction accuracy and stability of the ring ROIs. As shown in Table 1, in the experimental scenarios where the target region is subject to different degrees of interference, the success rate of the single-template matching method is 85%, while the success rate of the multiple progressive template matching method reaches 97%. To evaluate the robustness of the proposed method, Gaussian noise with a variance of 20 was added to each image. The matching accuracy was tested, revealing that the success rate of the single-template matching method was 83%, while the success rate of the multi-step progressive template matching method remained at 96%.
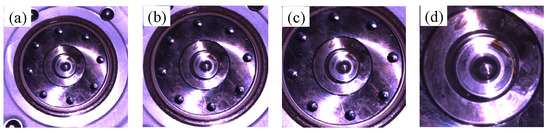
Figure 4.
Template image. (a–d) are the 1st to 4th matching templates, respectively.

Table 1.
Matching accuracy and time results.
In terms of processing time, although the computation time of multiple progressive template matching increases slightly, it remains within the range of real-time processing. Therefore, compared with the single-template matching method, the method in this paper has significant advantages in terms of accuracy and robustness, which is particularly suitable for the task of oil seal assembly size detection in complex scenarios.
2.3. Three-Dimensional Reconstruction of Composite Vision
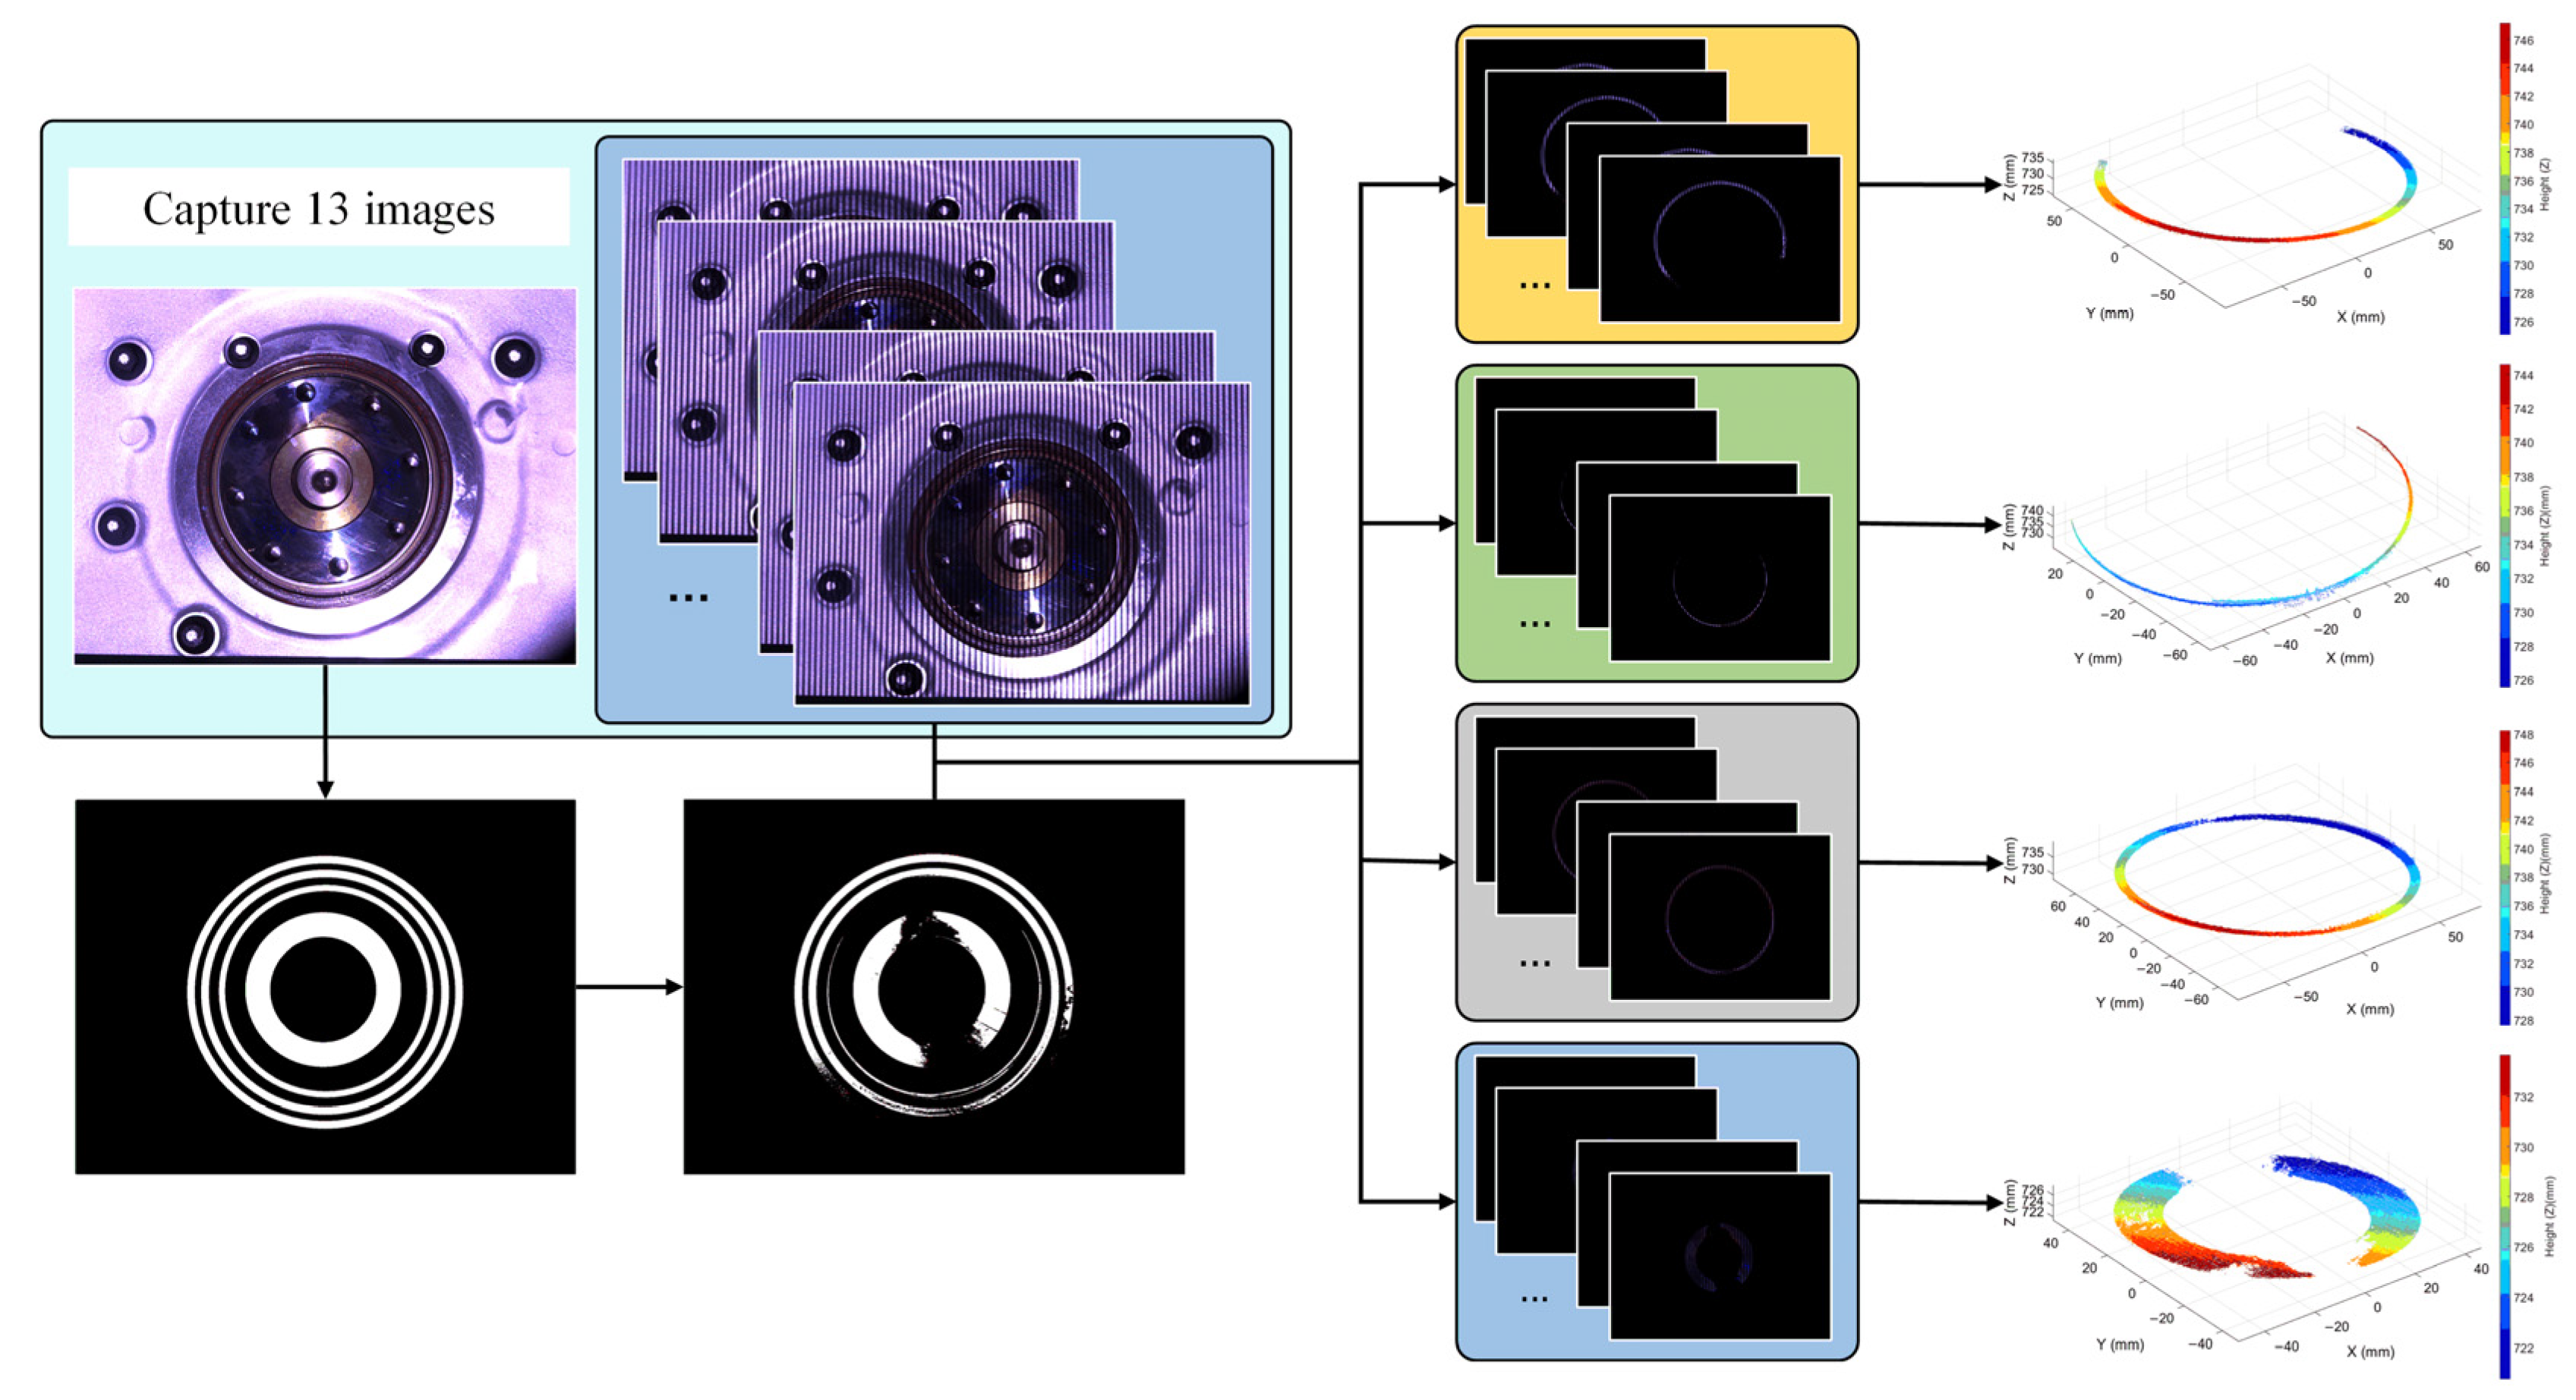
Using the mask pattern obtained in Section 2.2, region extraction of the acquired stripline was performed to obtain the stripline containing only the ROIs; then, 3D reconstruction was performed on the ROI groups, respectively, and finally, the point clouds corresponding to the four regions were obtained according to the camera calibration [24] and the system calibration [25]. The process is shown in Figure 5.

Figure 5.
Three-dimensional reconstruction based on PSP using ROI region extraction.
2.3.1. Modified RANSAC Plane Fitting Algorithm
After obtaining the three-dimensional point clouds of oil seals and crankshaft end faces, it was necessary to preprocess the point cloud data in order to improve the accuracy and efficiency of the subsequent calculations. First of all, radius outlier filtering was performed on the four groups of point clouds obtained to remove the noise point interference; further downsampling of the point cloud voxel filtering was performed to homogenize the distribution of the point clouds and reduce the redundancy of the data, so as to obtain the inner ring of the oil seal PInner, the outer ring of the oil seal POut, the crankshaft end face point cloud PEnd, and the point cloud of the oil seal seat PSeat, so that the four parts of the point clouds were obtained separately by the method of this paper, and the noise points and non-target areas were excluded, which significantly improved the efficiency of the subsequent calculation.
In order to further analyze the relative positional relationship between the oil seal and the crankshaft end face and the assembly characteristics, the crankshaft end face was used as the reference surface for distance calculation. For the crankshaft end face point cloud PEnd, this paper improves the traditional RANSAC algorithm and proposes an improved random sampling consistency algorithm (M-RANSAC) using dynamic thresholding and weighted optimization to obtain the fitting plane FP1 of the crankshaft end face filtered point cloud.
Conventional RANSAC treats the contribution of all points equally during the random sampling process. However, for the crankshaft end face point cloud, the local sampling density and curvature characteristics can reflect the geometric stability of that region. Based on this insight, M-RANSAC further introduces sampling weights in two specific aspects: in regions with higher local density—indicating that the sampling points are more concentrated and of better quality—those points are assigned higher weights during inlier counting; and because the oil seal primarily measures planar regions, areas with lower curvature correspond to flatter surfaces that better adhere to the planar assumption. Therefore, points in low-curvature regions are given higher weights, thereby gaining an advantage in both inlier selection and model scoring.
Furthermore, in standard RANSAC, a fixed distance threshold is usually preset to determine whether a sampled point qualifies as an inlier. However, this fixed-threshold method often lacks flexibility in the face of noise interference and uneven data distribution in practical applications, which adversely affects both the model’s accuracy and its convergence speed. The core idea of the improved RANSAC method is to adaptively adjust the distance threshold in each iteration based on the current model’s fitting performance and the inlier distribution—by using the mean distance of the point cloud as the new threshold. This not only avoids repetitive manual parameter tuning but also accelerates the algorithm’s convergence.
Combined with these two enhancements, M-RANSAC can converge more rapidly to the optimal planar model FP1 that best reflects the geometric characteristics of the crankshaft end face. This model is not only more representative in terms of inlier distribution but also serves as a reliable reference plane for subsequent analysis of the relative positional relationship between the oil seal and the crankshaft end face.
Assuming that the point cloud is , the fitting plane is , and the initial set of sampling points is , the sampling weights are defined as follows:
where is the sampling weight, is the density information, is the local curvature information, and is the weight term that prioritizes sampling points with high density and low curvature. Fitting to the set of sampled points yields the planar model , at which point the planar equations are
Calculate the standard deviation of the mean distance from the point cloud to the plane . The interior point distance threshold and the interior point ensemble are obtained according to Equations (14) and (15):
Further, the planar model is re-optimized using weighted least squares:
Set the termination condition of the iteration to reach the maximum number of iterations or for the proportion of interior points to reach more than 80%, and finally obtain the fitting plane .
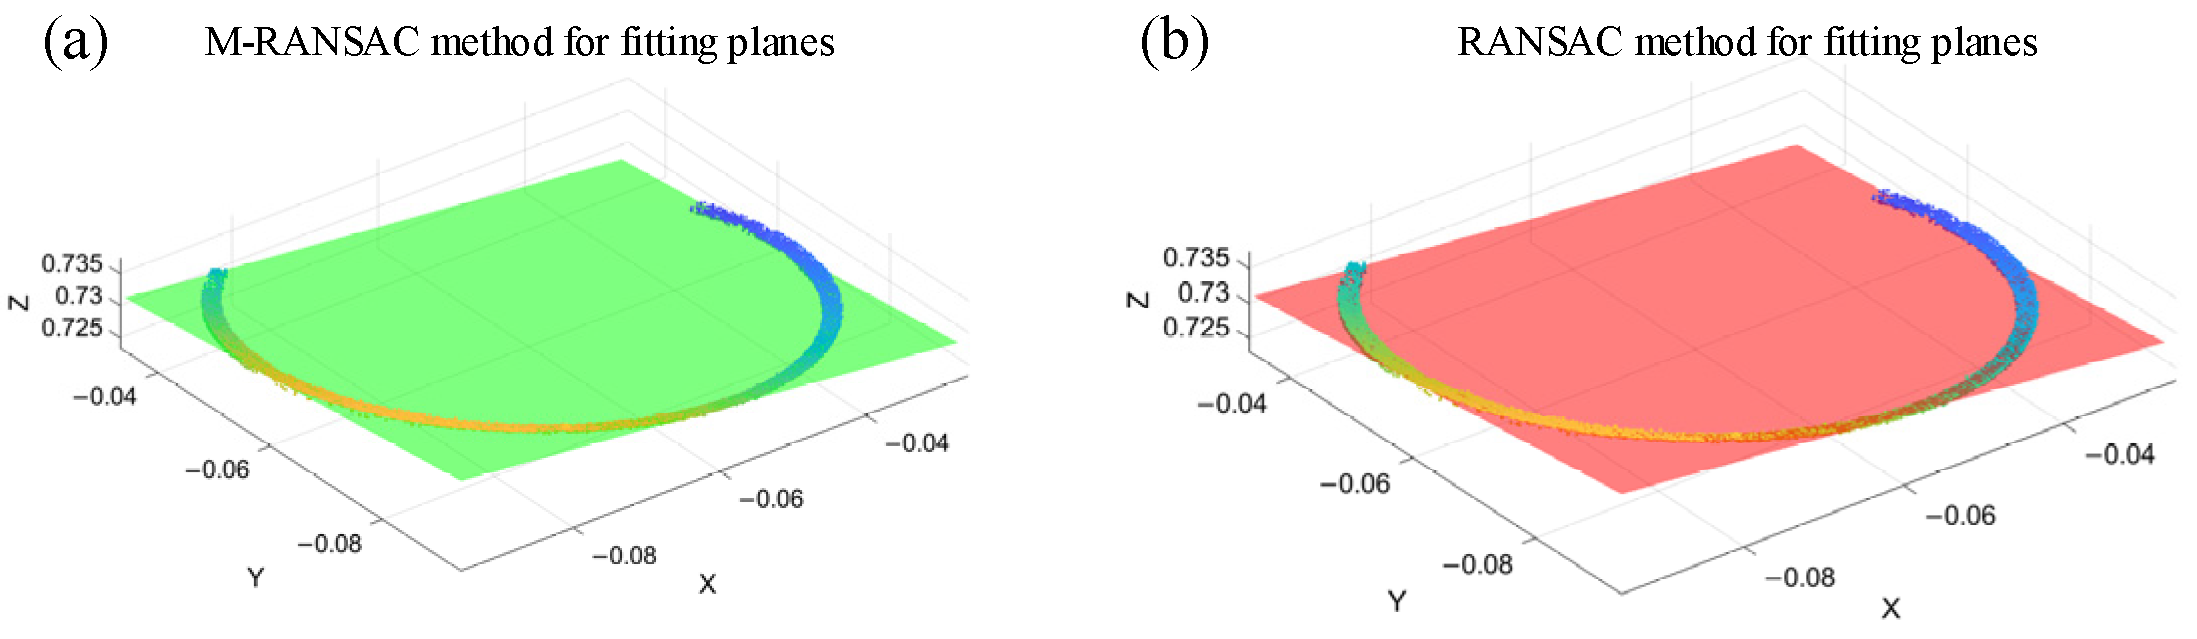
The M-RANSAC method is compared with the conventional RANSAC [26], and the relevant parameters are shown in Table 2 below. The selection of these parameters is based on a comprehensive empirical consideration of data characteristics and algorithm performance requirements. The maximum number of iterations is set to 100, aiming to ensure finding the best fitting result within a limited computing time. Due to the fact that the size of the object to be tested is generally around 10 mm, the initial distance threshold is set to 0.001 mm. At the same time, setting the voxel downsampling resolution to 0.001 mm, consistent with the initial threshold, can effectively reduce the amount of point cloud data, improve processing efficiency, and ensure that key details are not lost. The parameter α (between 0.3 and 0.5 is sufficient) is used to adjust the angle or error tolerance, so that the selection of inliers is neither too loose nor too strict when dealing with noise, and τ (1.5) is used to balance the stability and robustness of data fitting in model evaluation, thereby further optimizing overall algorithm performance. The comparison results are shown in Figure 6 and Table 3.
Table 2.
M-RANSAC-related parameters.

Figure 6.
M-RANSAC plane fitting results.
Table 3.
Comparative results.
Among them, M-RANSAC’s running time is 0.0019 s, RANSAC’s running time is 0.0024 s, the mean plane distance for ordinary RANSAC is 0.3232 mm, and the mean plane distance for M-RANSAC is 0.2747 mm. The root mean square error is reduced to 0.0124 compared to conventional RANSAC. There is an improvement in the running speed, while better plane fitting results can be obtained.
2.3.2. Distance Calculation
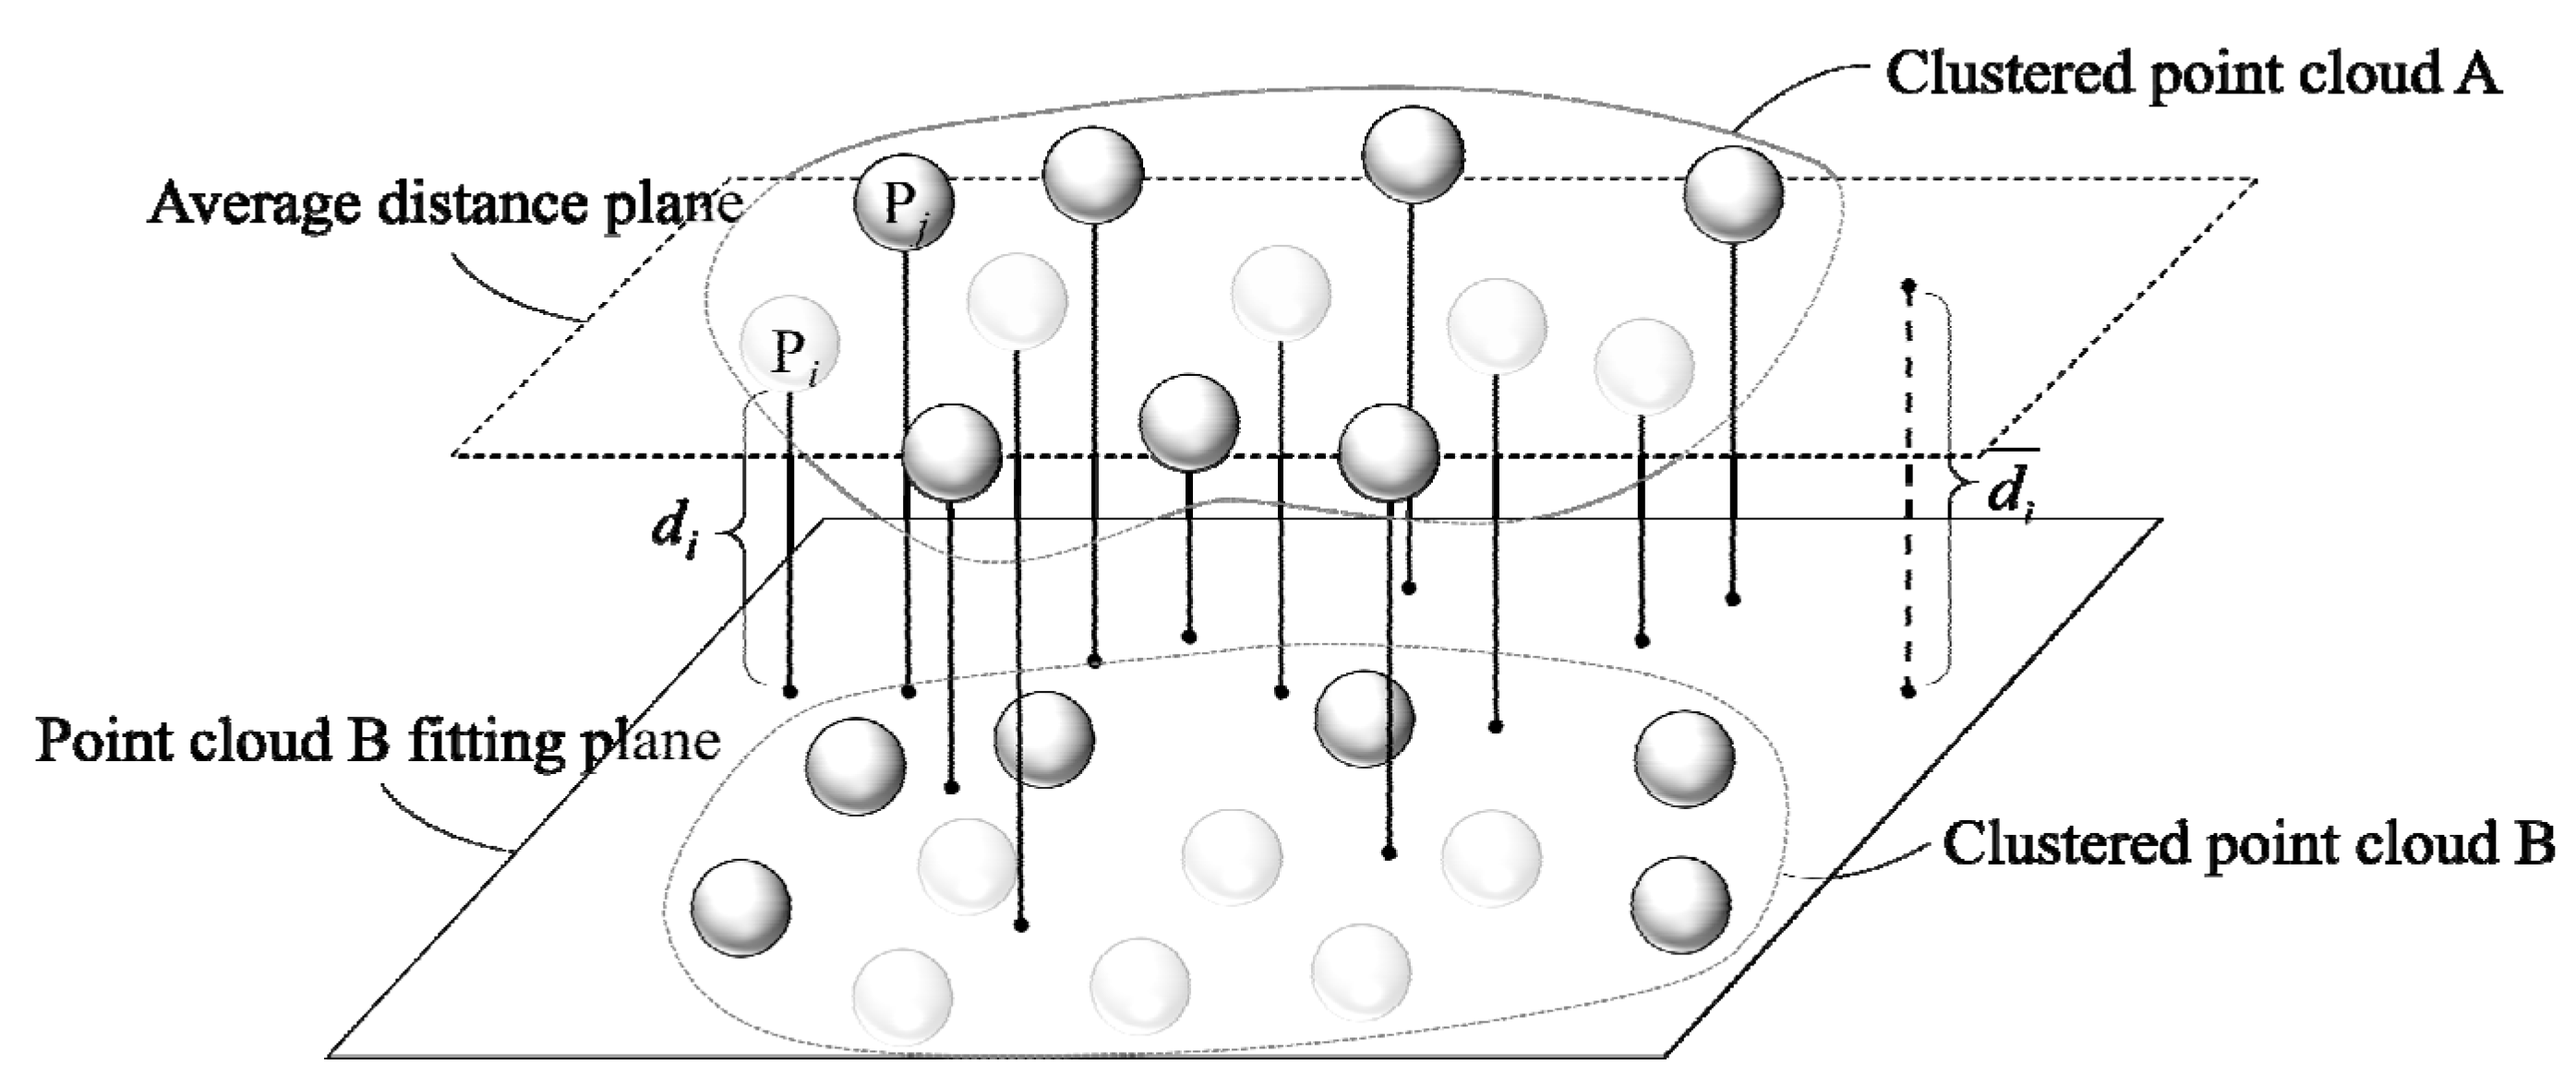
During the process measurement, the mean value of the height difference between the four points above, below, left, and right of the corresponding measurement target is measured manually to measure the height of the oil seal assembly. In order to keep the consistency with the actual measurement process, the crankshaft end face and the fitting surface of the oil seal seat are selected as the reference plane, and we assume that the reference plane is flat. After obtaining the crankshaft end face and oil seal seat fitting plane, use the Euclidean distance calculation formula to calculate the average Euclidean distance D1 from the inner ring of oil seal point cloud PInner to the fitting plane and the average Euclidean distance D2 from the outer ring of oil seal point cloud POut to the fitting plane, respectively. Based on the average distance D1 and the average distance D2, the difference between the inner and outer heights of the oil seal of the final assembled size is obtained as follows:
The principle of distance calculation is shown in Figure 7. The mean distance of all points in the target point cloud to the target plane is calculated, respectively. Similarly, the plane fitting of PSeat is carried out and the average Euclidean distance D3 from the outer ring of oil seal point cloud POut to the fitting plane is obtained, so that all the required distances have been obtained.
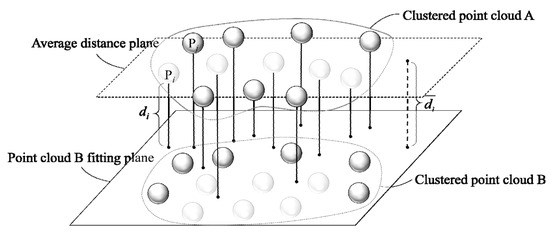
Figure 7.
Principle of distance calculation.
3. Experiments and Results
3.1. Experimental Setup
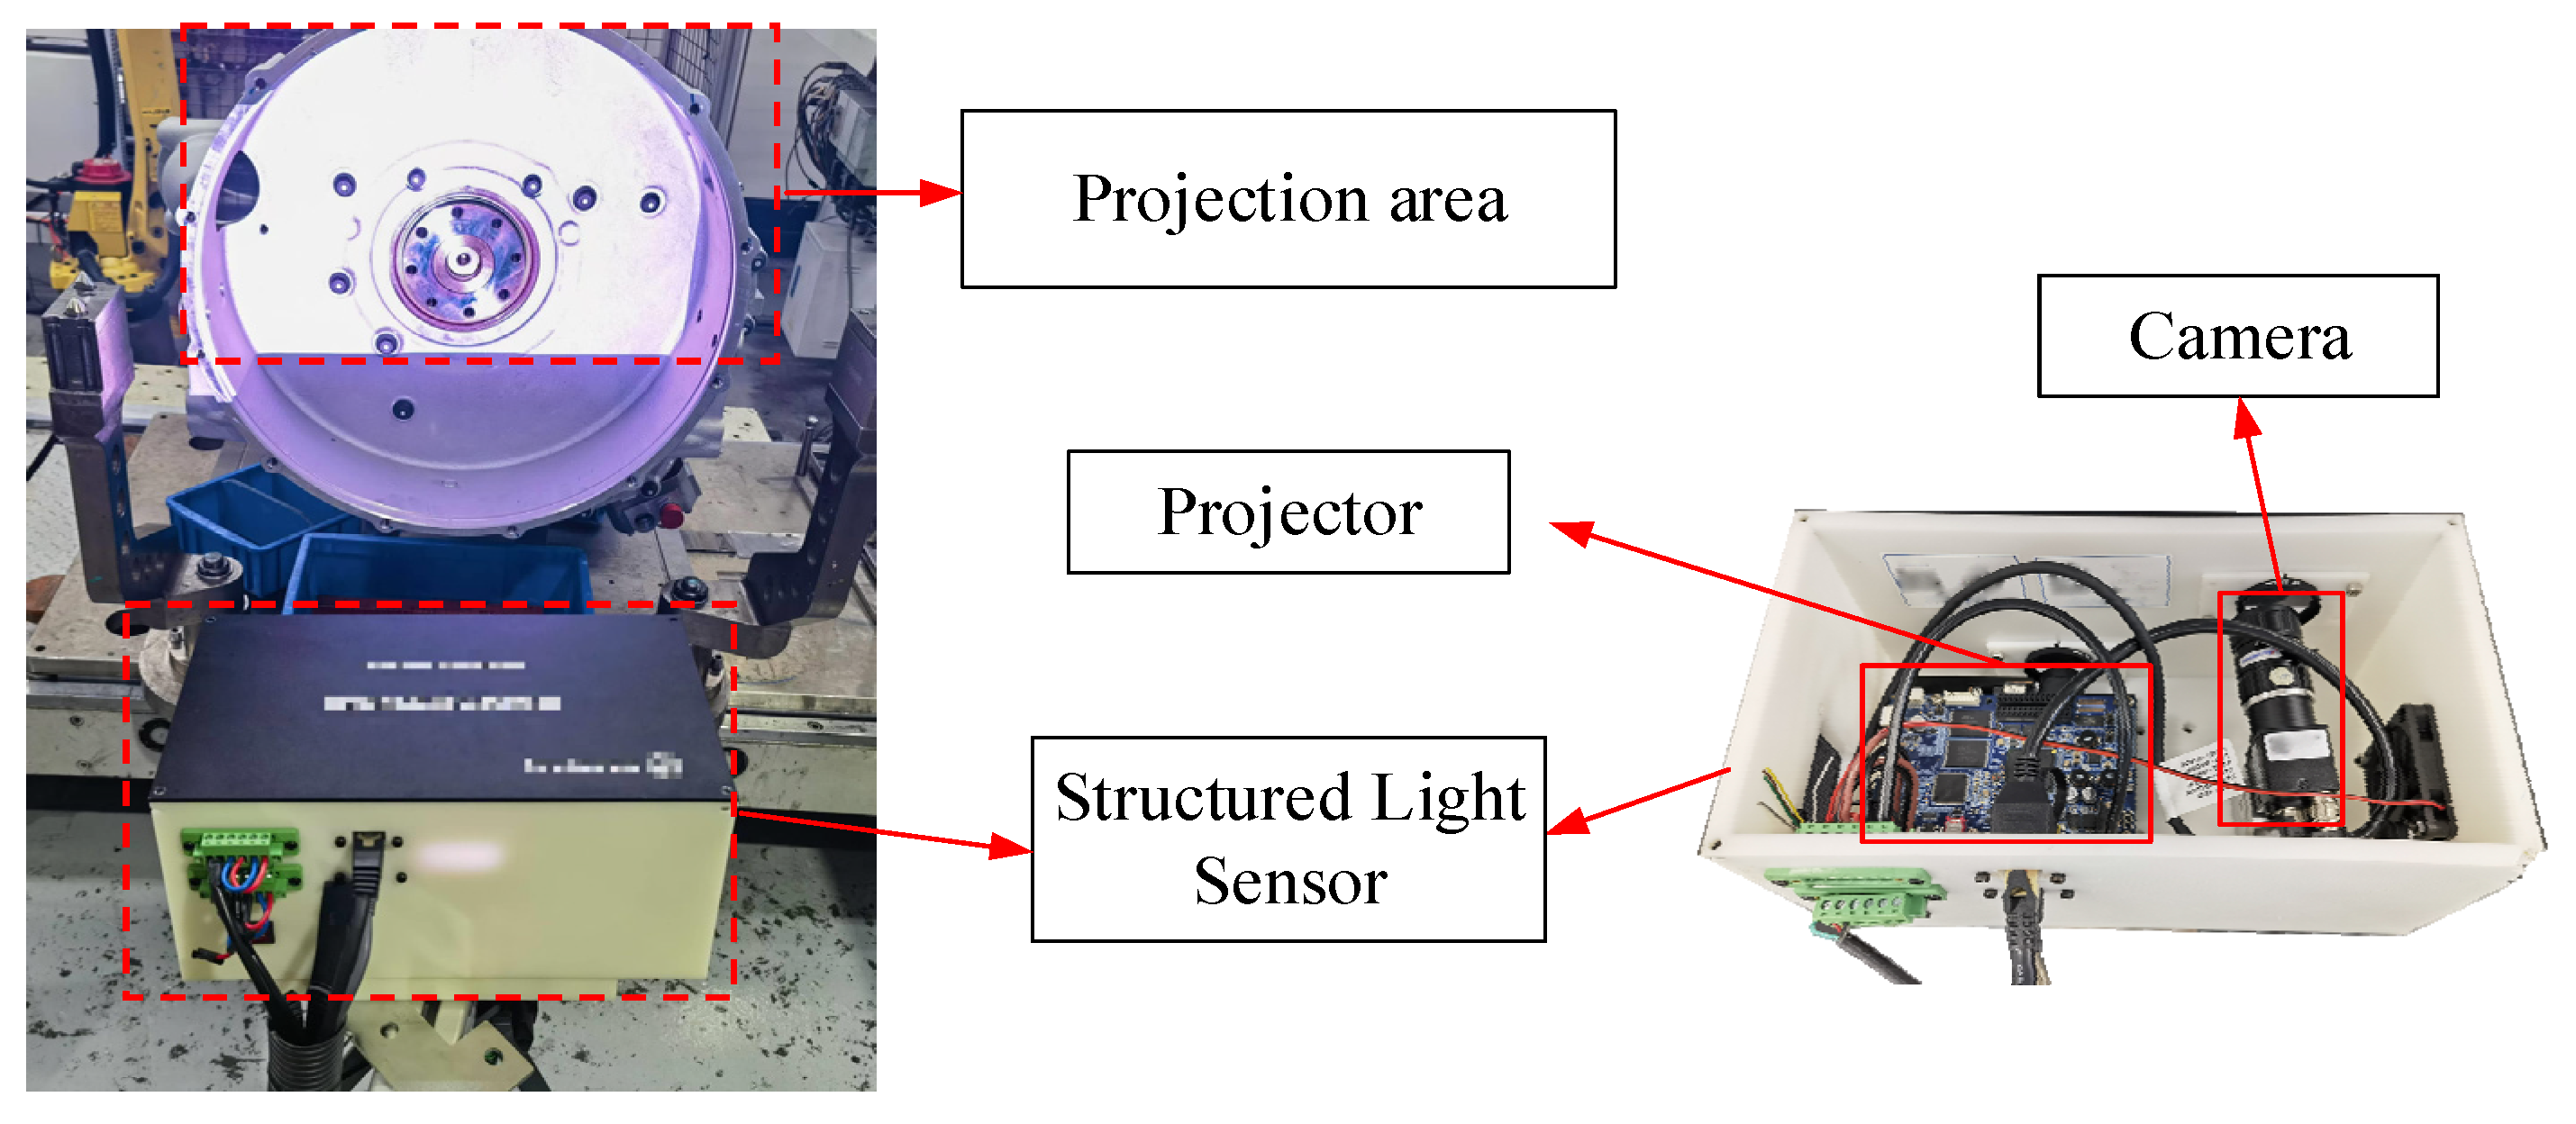
In order to further validate the performance of the algorithm in real scenarios, we built a 3D vision measurement sensor based on the fringe projection profilometry, including a digital light processing (DLP) projector (Light-Crafter-4500, Texas Instruments, Dallas, TX, USA) and a CCD camera (MV-EM 200C, Shaanxi MicroVision, Xi’an, China).
Due to space constraints at the actual production assembly station, the sensor was installed on a fixed base at a distance of 600 mm from the assembly line and at a height of 800 mm. Furthermore, the projector resolution was set to 912 × 1140 pixels to ensure that phase variations were distinct, thereby facilitating subsequent phase unwrapping and contour reconstruction. This resolution strikes a balance by capturing sufficient details while keeping the data volume in check, which avoids the computational burden of excessively high resolutions.
The camera resolution was configured to 1600 × 1200 pixels. Compared to the projector, the higher resolution of the camera helped to clearly record subtle variations in the sine fringe patterns across the entire projection area, ultimately enhancing the accuracy of the 3D reconstruction. At a measurement distance of 600 mm, a 16 mm focal-length lens was selected to cover the target area while ensuring minimal distortion and an appropriate field of view, allowing for the camera to capture the entire projected area completely.
A large aperture (f/1.4) guarantees sufficient light flux under low-light conditions, capturing clear images with adequate depth of field so that every point within the measurement area is accurately recorded. During measurement, the projector displays sine fringe patterns with phase shifts of 0, π/2, π, and 3π/2; the frequencies of the projected sine fringe patterns were 140, 134, and 129, respectively. The camera and projector were synchronized via trigger signals to ensure that the multiple phase-shifted fringe images were captured simultaneously.
Overall, the selected parameters meet the measurement accuracy requirements while balancing the measurement range and stability, thereby providing high-precision 3D point cloud data for the analysis of the assembly characteristics of oil seals and crankshaft end faces. The projected area is shown in Figure 8.
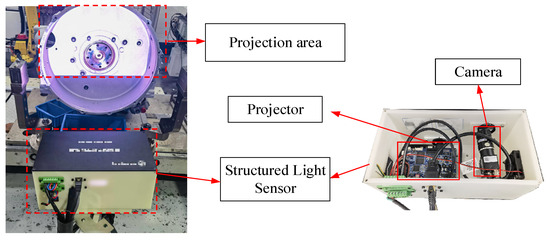
Figure 8.
Experimental equipment.
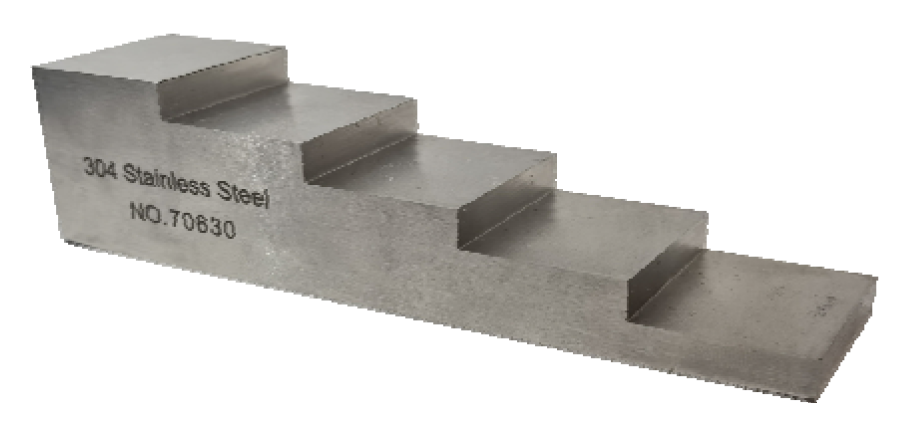
For the sensor reconstruction effect, a standard step block, as seen in Figure 9, was reconstructed in three dimensions, and a total of 10 measurements were made. The obtained point cloud is shown in Figure 10. The sensor height measurement accuracy is calculated by calculating the height difference between each small plane through point cloud fitting, and the results are shown in Table 4; the average error between stepped surfaces is 0.0203 mm and the RMSE is 0.0198 mm, meeting the measurement accuracy requirements.

Figure 9.
Standard stepped block.
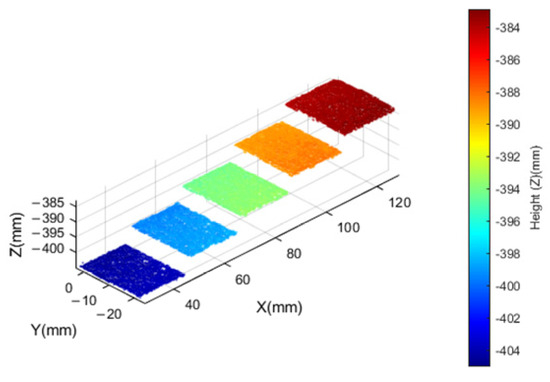
Figure 10.
Standard stepped block point cloud.
Table 4.
Standard stepped block measurement error.
For the oil seal parameters to be inspected, four corresponding templates were created based on the actual captured images, as shown in Figure 4. These templates correspond to the outermost edge of the oil seal seat, the outermost edge of the oil seal outer ring, the outermost edge of the oil seal inner ring, and the outermost circular boundary of the crankshaft shaft end, respectively, which were used as matching regions to improve the accuracy of the matching results.
The inspection area was divided into four main sections. Since the captured target areas are not standard circles, using a uniform scaling factor could lead to matching errors. Therefore, based on practical testing experience, specific scaling factors and are set for different regions to accommodate their shape characteristics, ensuring the accuracy and reliability of the matching process. Additionally, considering the effects of surface heat treatment, oil contamination, and high exposure, parameters and are set based on empirical knowledge. These parameters are determined through multiple experiments and practical tests, aiming to optimize the effectiveness of template matching. The above parameters are shown in Table 5 below. Meanwhile, the standard range of assembly for measuring height difference D was within 0.2 mm, the number of standard assemblies on the assembly line that meets the requirement of more than 98% within 0.2 mm, and subsequent experiments were carried out to compare the data between the results of automatic measurement and manual measurement.
Table 5.
ROI extraction parameter table.
3.2. Oil Seal Actual Measurement Analysis
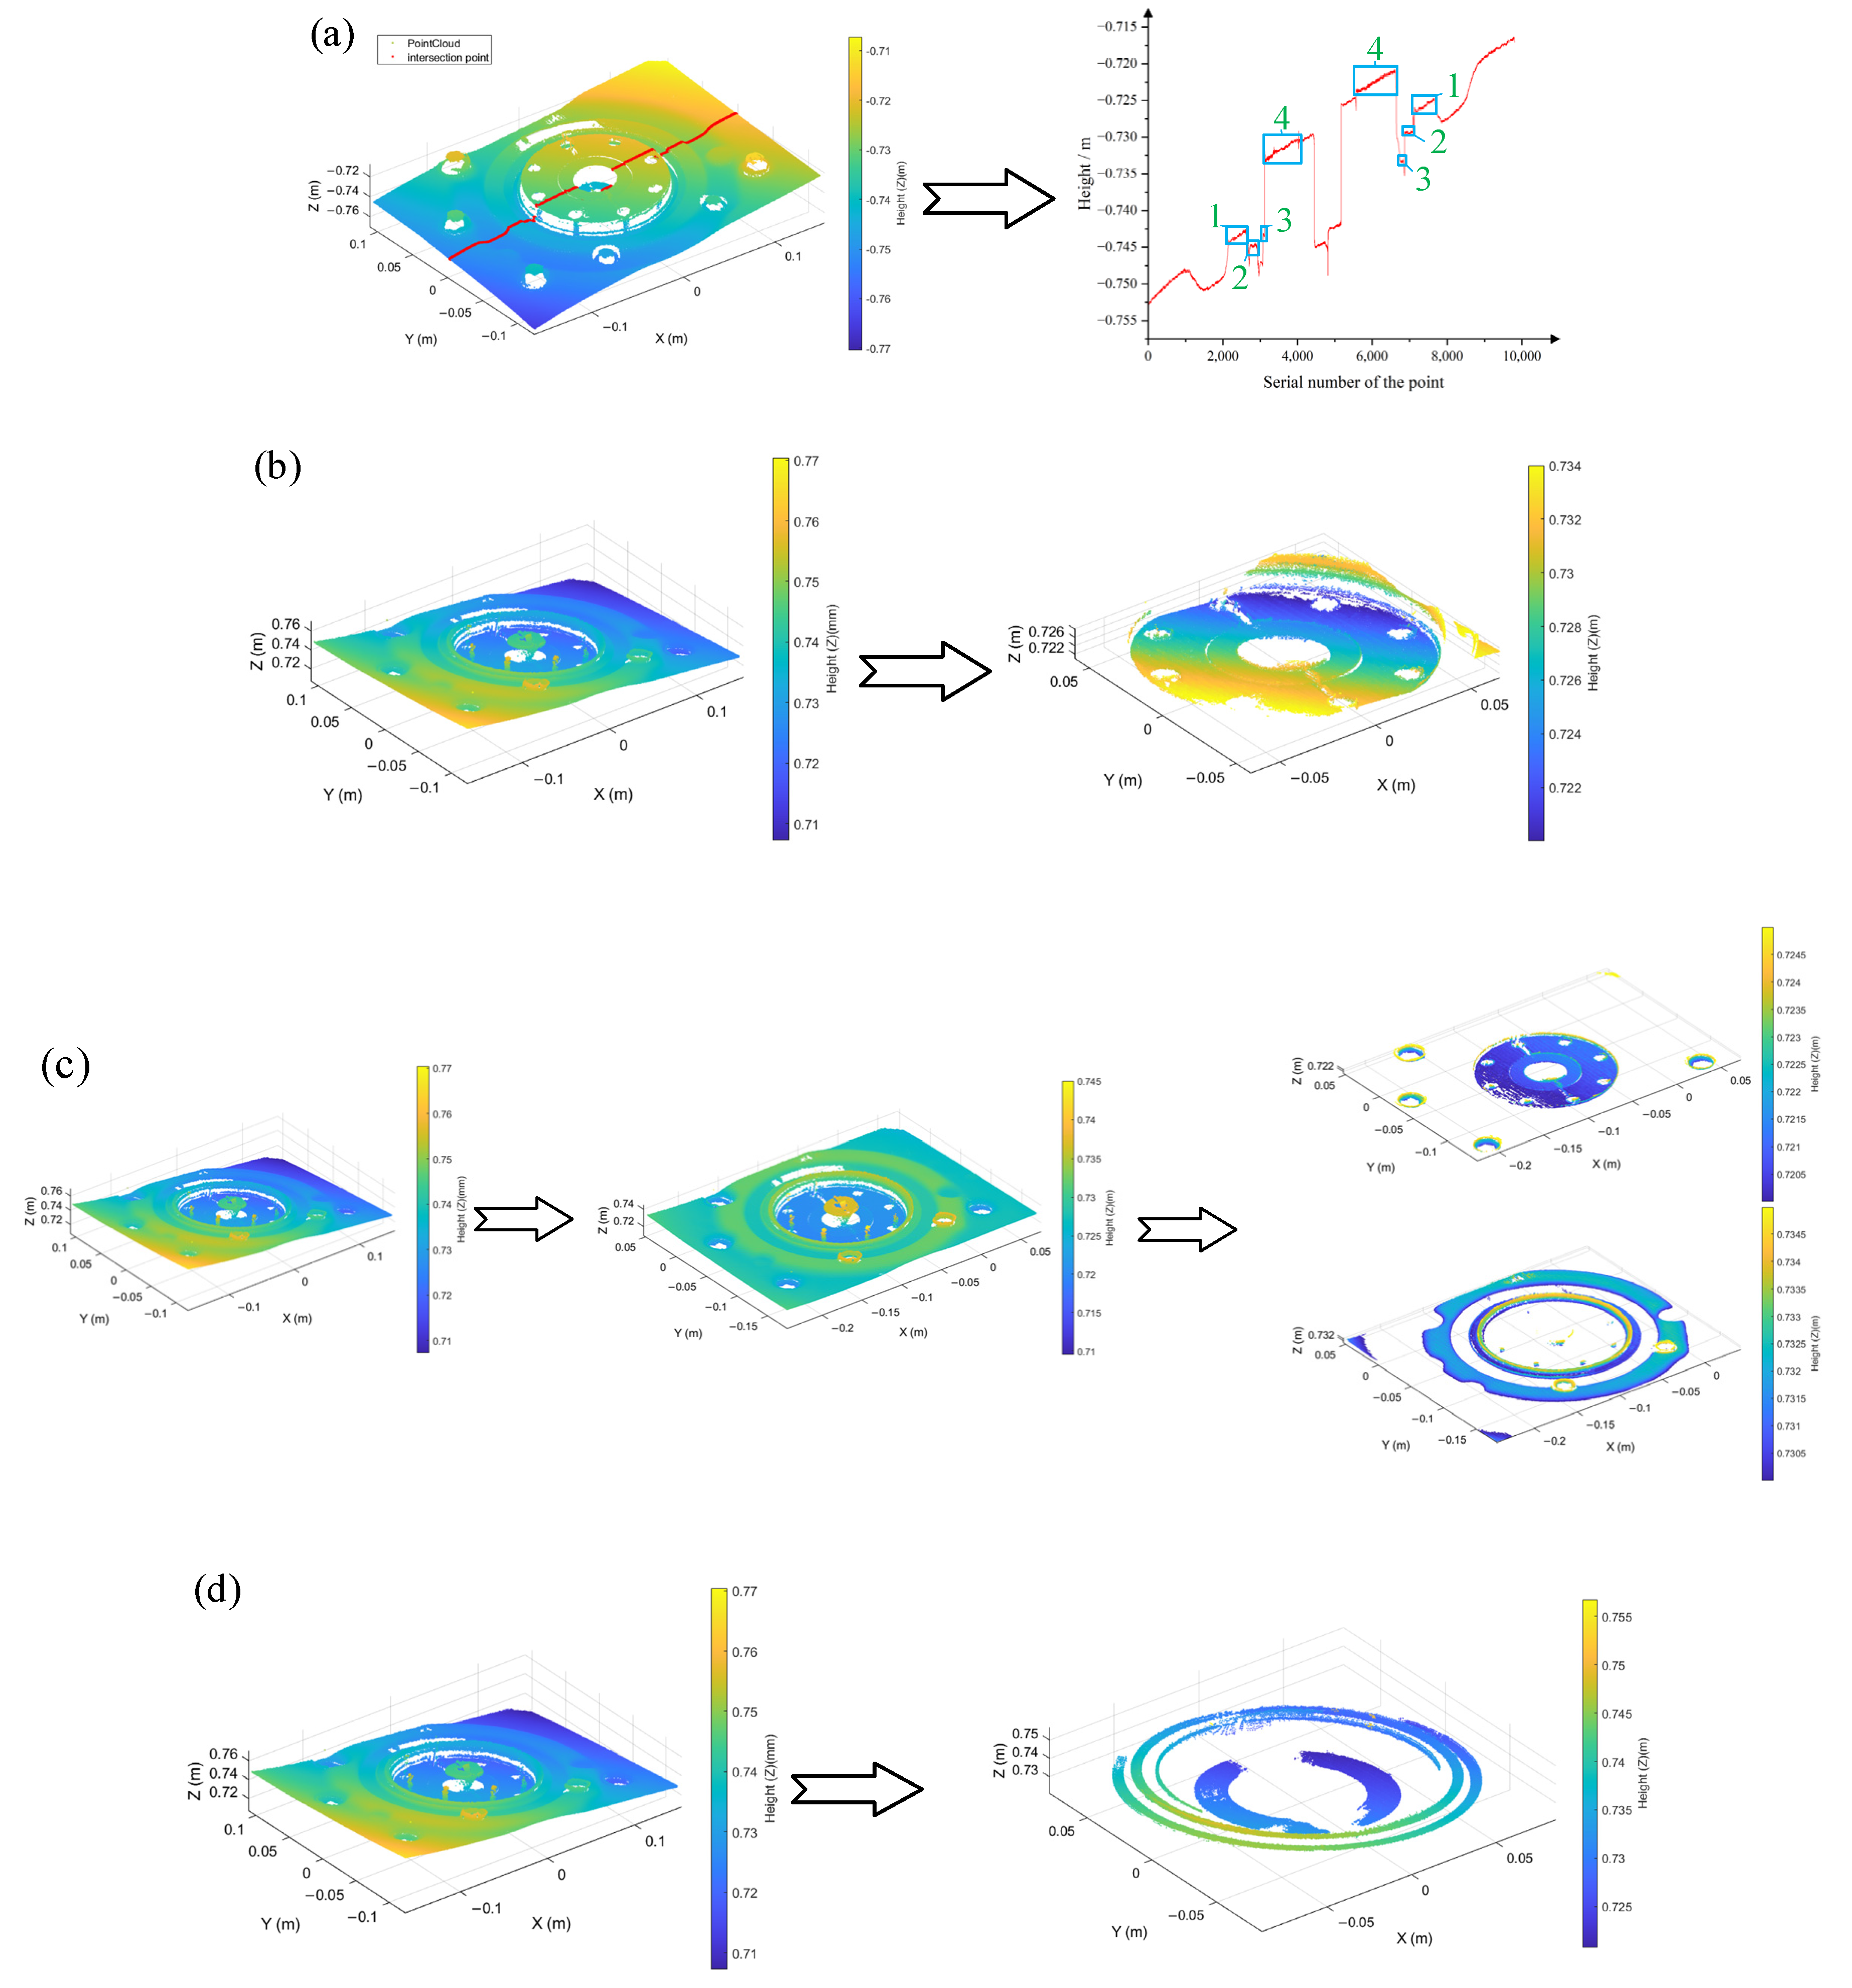
In order to verify the advantages of this paper’s method, it is compared with three other methods [14,15,27], and the results of point cloud processing are shown in Figure 11.
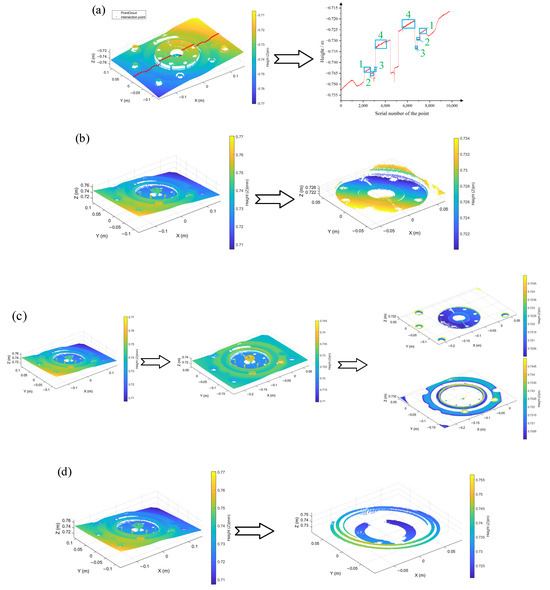
Figure 11.
Comparison of four methods. (a) Using the cross-section intersection method, the four blue box regions 1, 2, 3, 4 in the figure have small gradient differences and cannot be segmented. (b) Using the direct filtering method for processing, the corresponding inner and outer ring regions cannot be obtained. (c) The plane fitting method is used to fit the maximum clustering point cloud, and the fitting plane is rotated to XOY parallel. The origin cloud is adjusted in the same rotation mode, and then direct filtering is performed. It can be seen that although the crankshaft end face is well segmented, the inner and outer ring areas are still mixed together. (d) Method proposed in this paper.
In Method I [14], after obtaining the point cloud information, a certain cross-section is selected for the acquired point cloud, and then the cross-section curve break is used as a gap feature according to the cross-section curve, and the gap size is finally obtained. Similarly, the sensors are arranged on the engine assembly line to be inspected, projecting preset structured light streaks, containing 1 streak-free map and 12 (three-frequency, four-step) streak maps. The overall 3D reconstruction of the internal region of the engine flywheel housing is performed using the acquired streak maps, and the complete point cloud obtained is shown in Figure 11a, with a reconstruction time of 17.655 s and a point cloud number of 118,001, where the red part is the cross-section intersection line between the Y = 0 plane and the complete point cloud. From the figure, it can be seen that due to a certain inclination of the camera, it is not possible to ensure that the camera axis is perpendicular to the surface to be measured, and therefore the obtained point cloud is not completely parallel to the XOY plane. The height information of the intersection line is shown in Figure 11a, and the regions 1, 2, 3, and 4 correspond to the four parts of the ROI, where it can be seen that if the localized height information has a larger error, for example, in the part of region c, where the point cloud is less, the error is larger when solving the height difference.
Further, the point cloud data are preprocessed using the straight pass filtering method mentioned in Method II [27] with a view to segmenting the target region. However, since straight-pass filtering is mainly based on spatial coordinate ranges, it is difficult for the filtering process to accurately distinguish the target region from the background noise when the non-planar features of the local region are obvious. As shown in Figure 11b, there is a certain overlap between the target region and the interference point cloud in terms of height and spatial distribution, which leads to the straight-pass filtering being unable to effectively eliminate the non-target point cloud.
Even if the filtering range is expanded or narrowed by adjusting the filtering parameters, it is still impossible to retain the complete target region while removing the interference points, thus affecting the subsequent plane fitting accuracy. Therefore, in this scenario, it is also difficult to achieve accurate segmentation of the target region by simply relying on the straight-pass filtering method, and it is necessary to combine with more refined segmentation algorithms or other data processing strategies to obtain ideal segmentation results.
Similarly, when the planar rotation method mentioned in Method III [15] is used here, it is found that there are significant non-planar features in the localized region, as shown in Figure 11c. The existence of these non-planar features leads to difficulties in effectively distinguishing the target region from the planar interference region in the subsequent cluster segmentation process. Specifically, although clustering segmentation can divide the point cloud into several subsets, the largest clustered portion tends to contain more non-planar points due to the complexity of the geometric features within the local region. At this point, even if planar fitting is performed on the maximum clustered portion, the fitting result will have a large deviation due to the influence of noisy and interfering points, which does not accurately describe the actual planar structure. Therefore, in this scenario, the clustering segmentation method cannot be effectively applied, and a more robust plane fitting strategy must be used to improve the accuracy and robustness of plane fitting. The advantages and disadvantages of the four methods, along with their applicable scenarios, are presented in Table 6.
Table 6.
Comparison of the four methods.
Therefore, it is difficult to realize accurate target area acquisition when area extraction and distance calculation are carried out from the aspect of point cloud features, due to the more complex profile and more feature interference. Specifically, Method I is unable to accurately segment different height regions when the point cloud is not completely parallel to the XOY plane, there may be camera angle errors, and the local area height error is large; Method II relies on spatial coordinate range screening, which is difficult to cope with complex background noise. It is not possible to accurately distinguish the target region from the noise; Method III is difficult to accurately distinguish the target region from the interference region when the local non-planar features are significant. The clustering results are interfered by noise, and the plane fitting deviation is large. The method in this paper can accurately and effectively segment the target region and avoid the defects of the above three methods. It provides higher plane fitting accuracy and robustness, and is suitable for complex backgrounds and noises, and requires high-precision plane fitting scenarios, such as high-precision measurements or complex equipment detection.
After obtaining the image with stripes based on the camera acquisition, the first image is processed to obtain the corresponding mask; continuing, the mask is applied to the other 12 images with stripes to obtain the final ROI, and its distance information is calculated. The four parts of the obtained point cloud and the overall point cloud are schematically shown in Figure 12, where the green part is the point cloud obtained by reconstruction after extraction. The numbers of point clouds for the oil seal seat PSeat, the oil seal outer ring POut, the oil seal inner ring PInner, and the crankshaft end face PEnd are 43,299, 8644, 53,947, and 66,186, respectively, and the reconstruction time totaled 8.575 s. Compared with the global reconstruction, the reconstruction time was shortened by 51.4% due to the significant reduction in the number of point clouds, which significantly improved calculation speed.
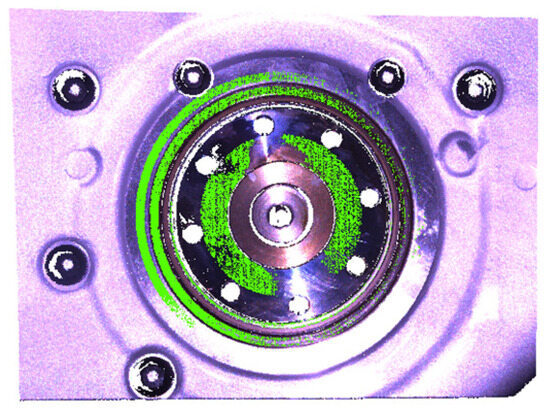
Figure 12.
Target point cloud and complete point cloud.
By counting the distance information obtained from the acquisition, we verified the effectiveness of the composite vision-based engine oil seal post-assembly size detection method, comparing the results of automatic measurement and manual measurement, in which the manual measurement is the actual measurement by the workers in this assembly line, and after sensor measurement, the skilled workers then measured the same equipment and recorded the results, respectively. The following four groups of experiments were conducted:
(1) The first group is the sensor assembly reliability experiment. The experimental process is repeated disassembly of the sensor, using the same calibration parameters, and the same engine for the oil seal assembly size measurement. Repeated disassembly experiments are conducted on the sensors mainly to evaluate their assembly stability during repeated disassembly and reassembly, because the sensors may be affected by external shocks, pressure changes, loose electrical connections during disassembly, etc. Repeated disassembly experiments help to confirm whether the sensors can continuously maintain a stable working condition. The mean values of heights D1, D2, D, and D3 obtained from measurements taken by specialized workers were 10.65 mm, 10.70 mm, 0.05 mm, and 2.10 mm, respectively. The experimental data obtained are shown in Figure 13 and Table 7.
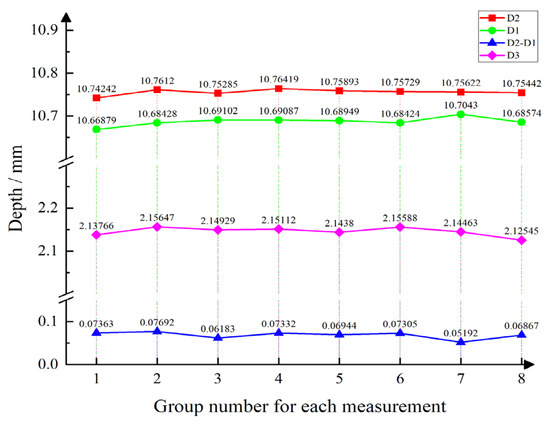
Figure 13.
Automatic measurement of repeatable assembly reliability.
Table 7.
Repeated assembly measurement error.
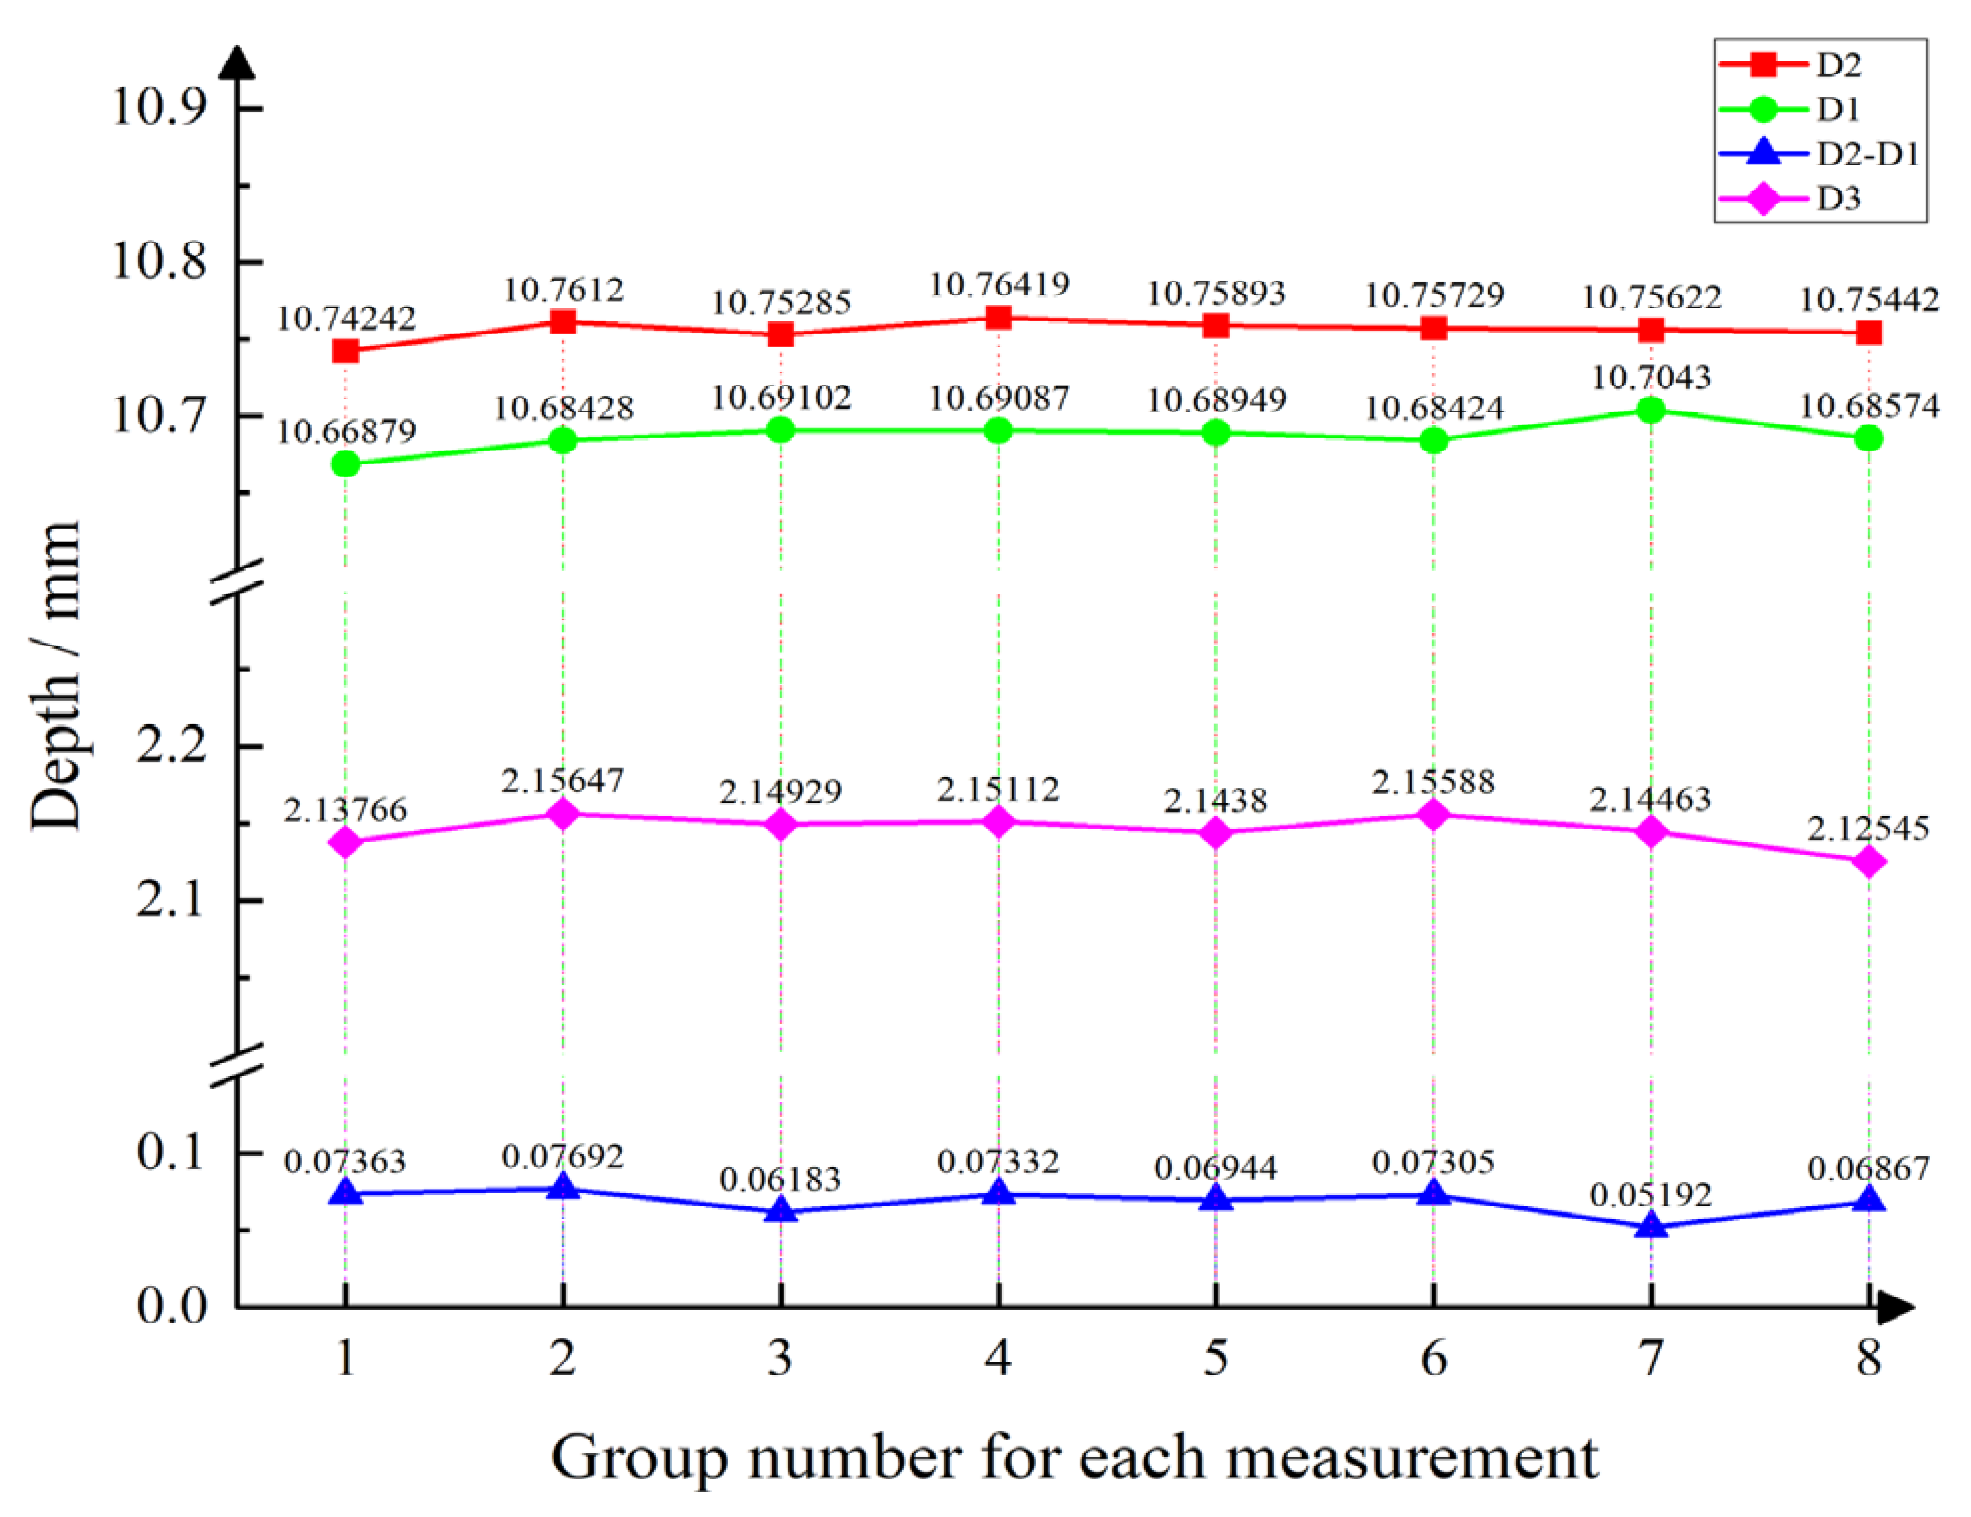
As can be seen from the statistical data, after many repeated assemblies, the result is that the relative polarity of the measured value of the inner ring and outer ring of the oil seal is within 0.3323%, and when measuring the distance D3, the relative polarity is 1.4461% and the root mean square error of the height difference is 0.0201. The distance fluctuations are all small, which further verifies the reliability of the present sensor when measuring.
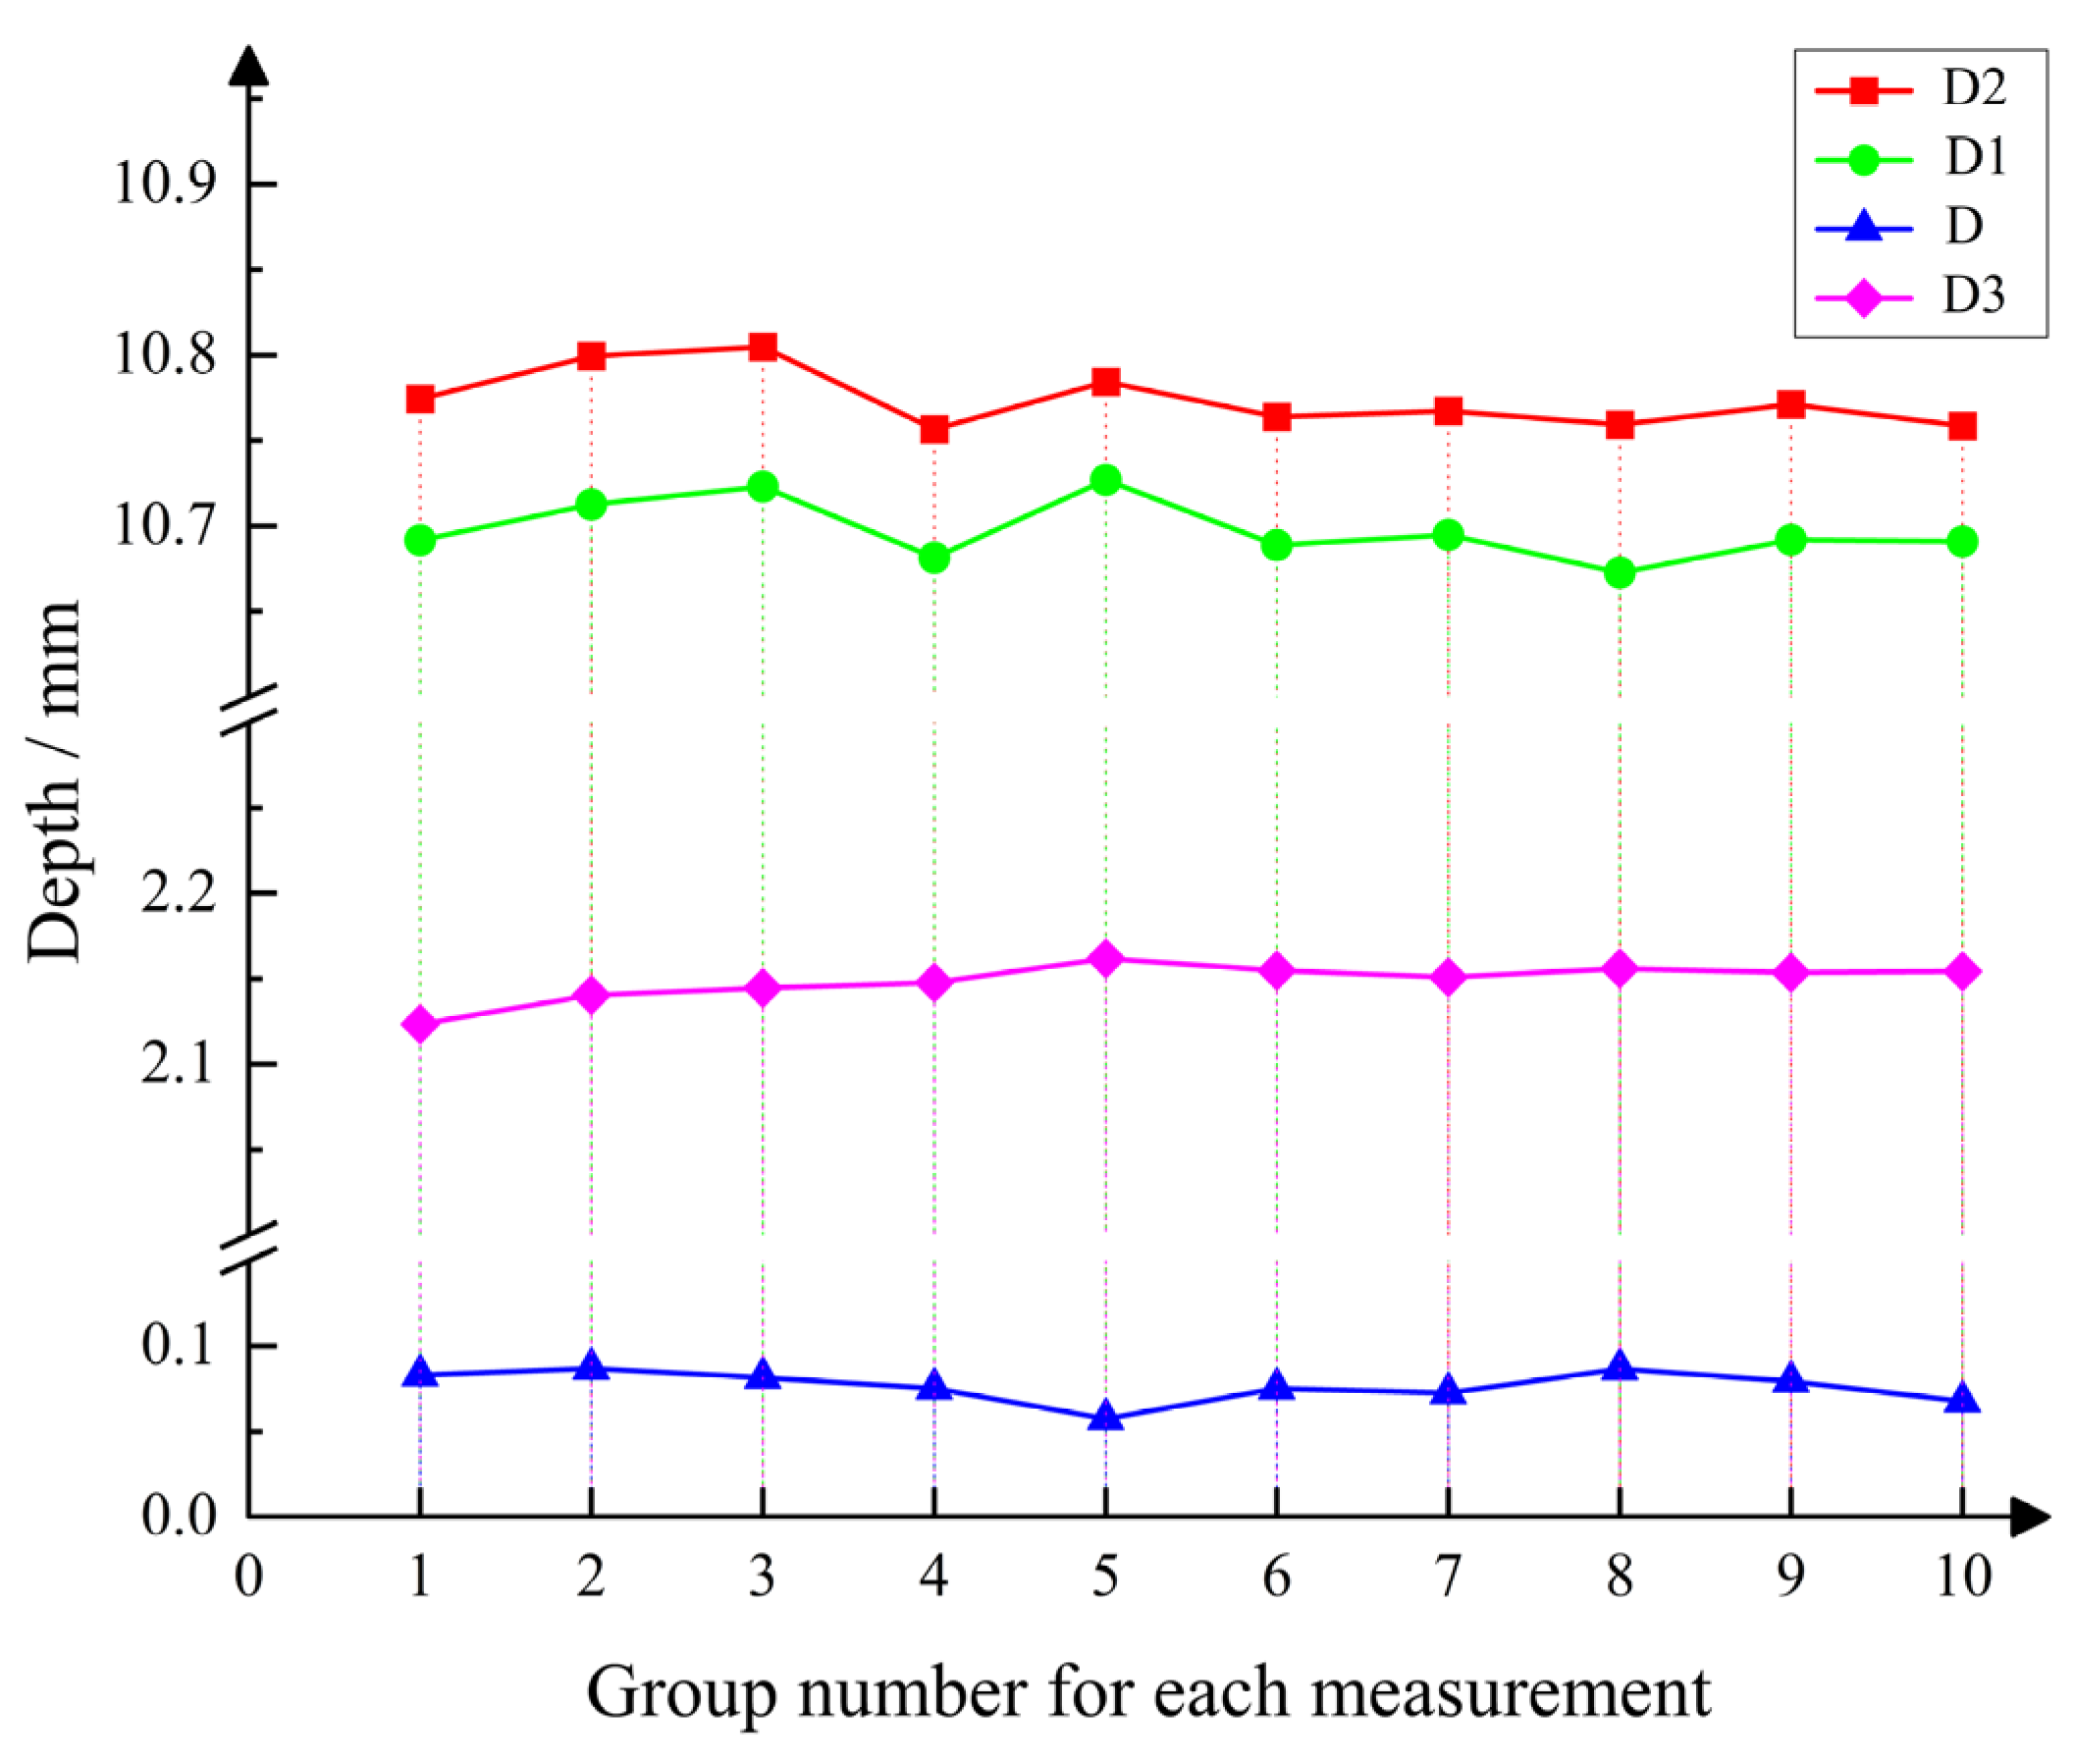
(2) The second group of experiments, for the same engine oil seal assembly size of the repeated stability measurement experiments, for the same engine oil seal, measurements were repeated ten times. As seen in Figure 14, the D1 height average measurement value is 10.6975 mm, with an extreme difference of 0.0542 mm. The fluctuation range relative to the measurement of the average value of the other measurements of the distances D2, D, and D3 was 0.4464. As shown in Table 8, it can be seen that the repeated measurement results for the same station are relatively stable. Similar to the first group of experiments, the results also exhibit fluctuations. By comparing the point clouds before and after, it is evident that the reconstructed point clouds are not completely identical. Additionally, due to the small size of the measurement object, there are errors during the fitting process, which lead to fluctuations in the measurement results. However, based on the experimental data, it is clear that the measurement results fall within an acceptable range of fluctuation.
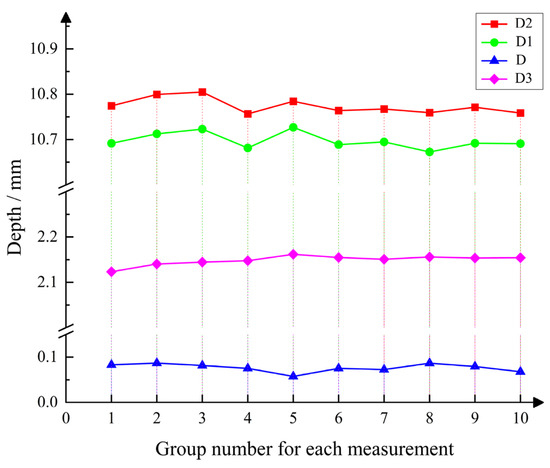
Figure 14.
Automatic measurement repeatability experiment.
Table 8.
Repeated measurement error.
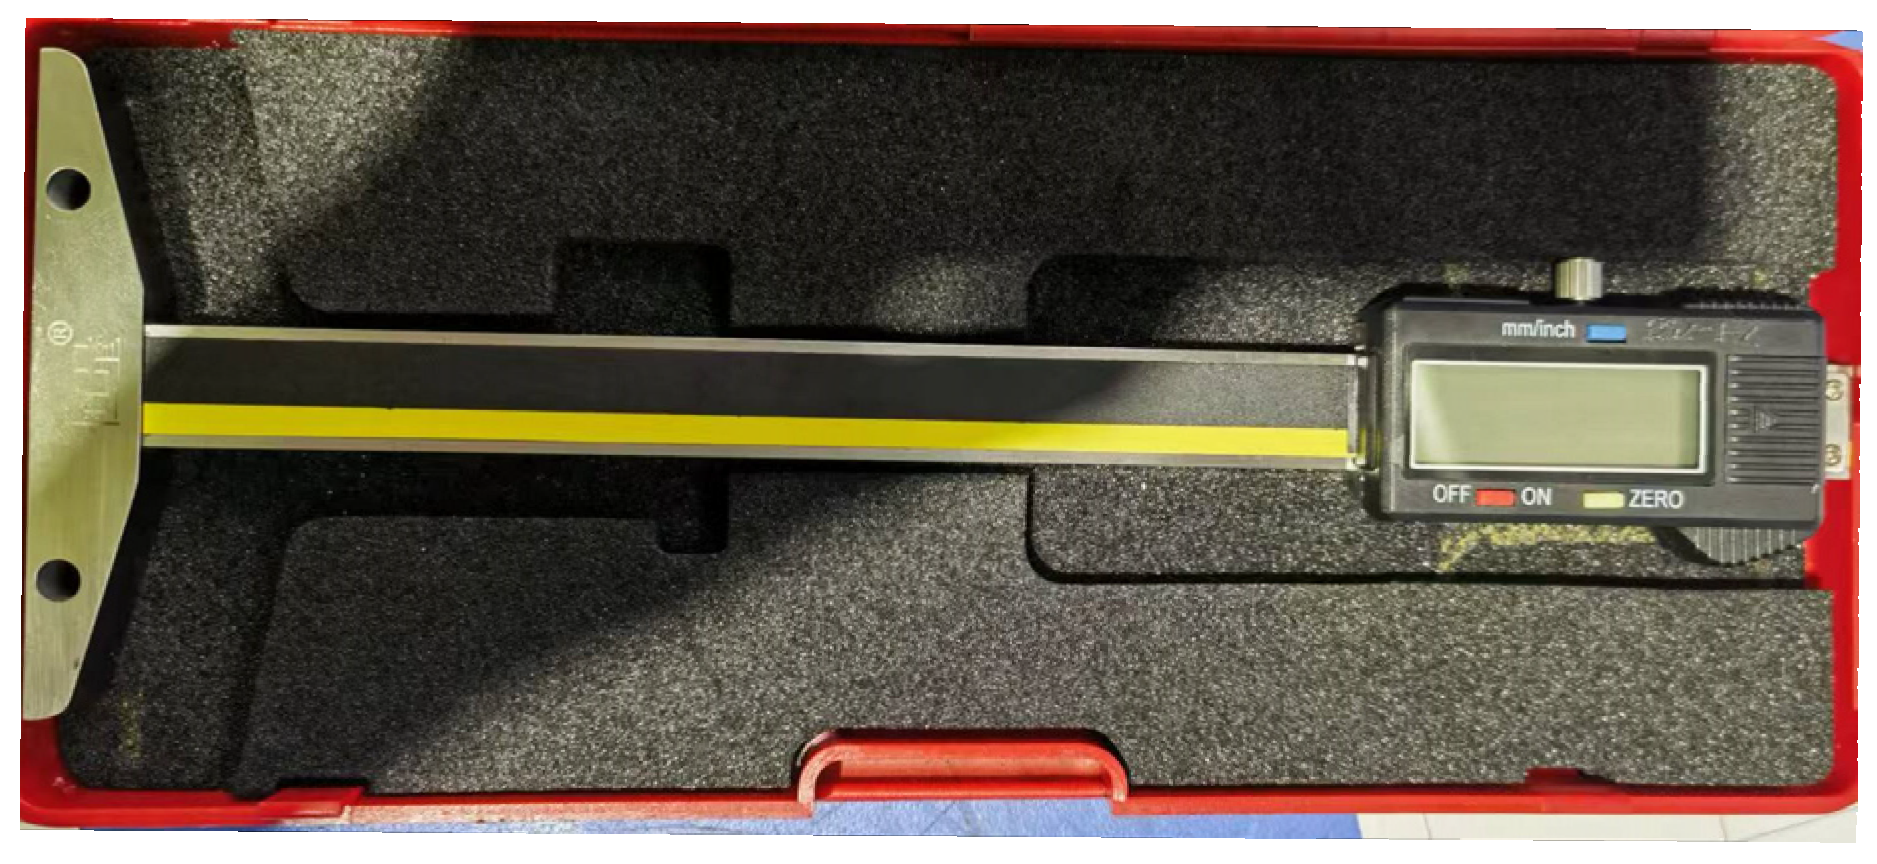
(3) The third group of experiments for manual and automatic measurement comparison experiments comprised a total of 20 groups of measurements, with height differences D1, D2, D, and D3. The depth gauge shown in Figure 15 is used for measuring the oil seal depth. During the measurement, the caliper is held perpendicular to the surface being measured, with the base of the caliper in contact with the reference surface. The measuring probe extends until it touches the opposite surface, and the displayed value is the measured depth. When measuring the heights D1 and D2 with the depth gauge, the crankshaft end face is used as the reference surface (as shown in Figure 3c). The corresponding target points on the upper, lower, left, and right sides are measured, and the distance D is obtained by calculating the average value. Next, using the oil seal seat as the reference surface and the outer ring of the oil seal as the other surface, four points are measured, and the average value gives D3.

Figure 15.
Depth gauge used for measurement.
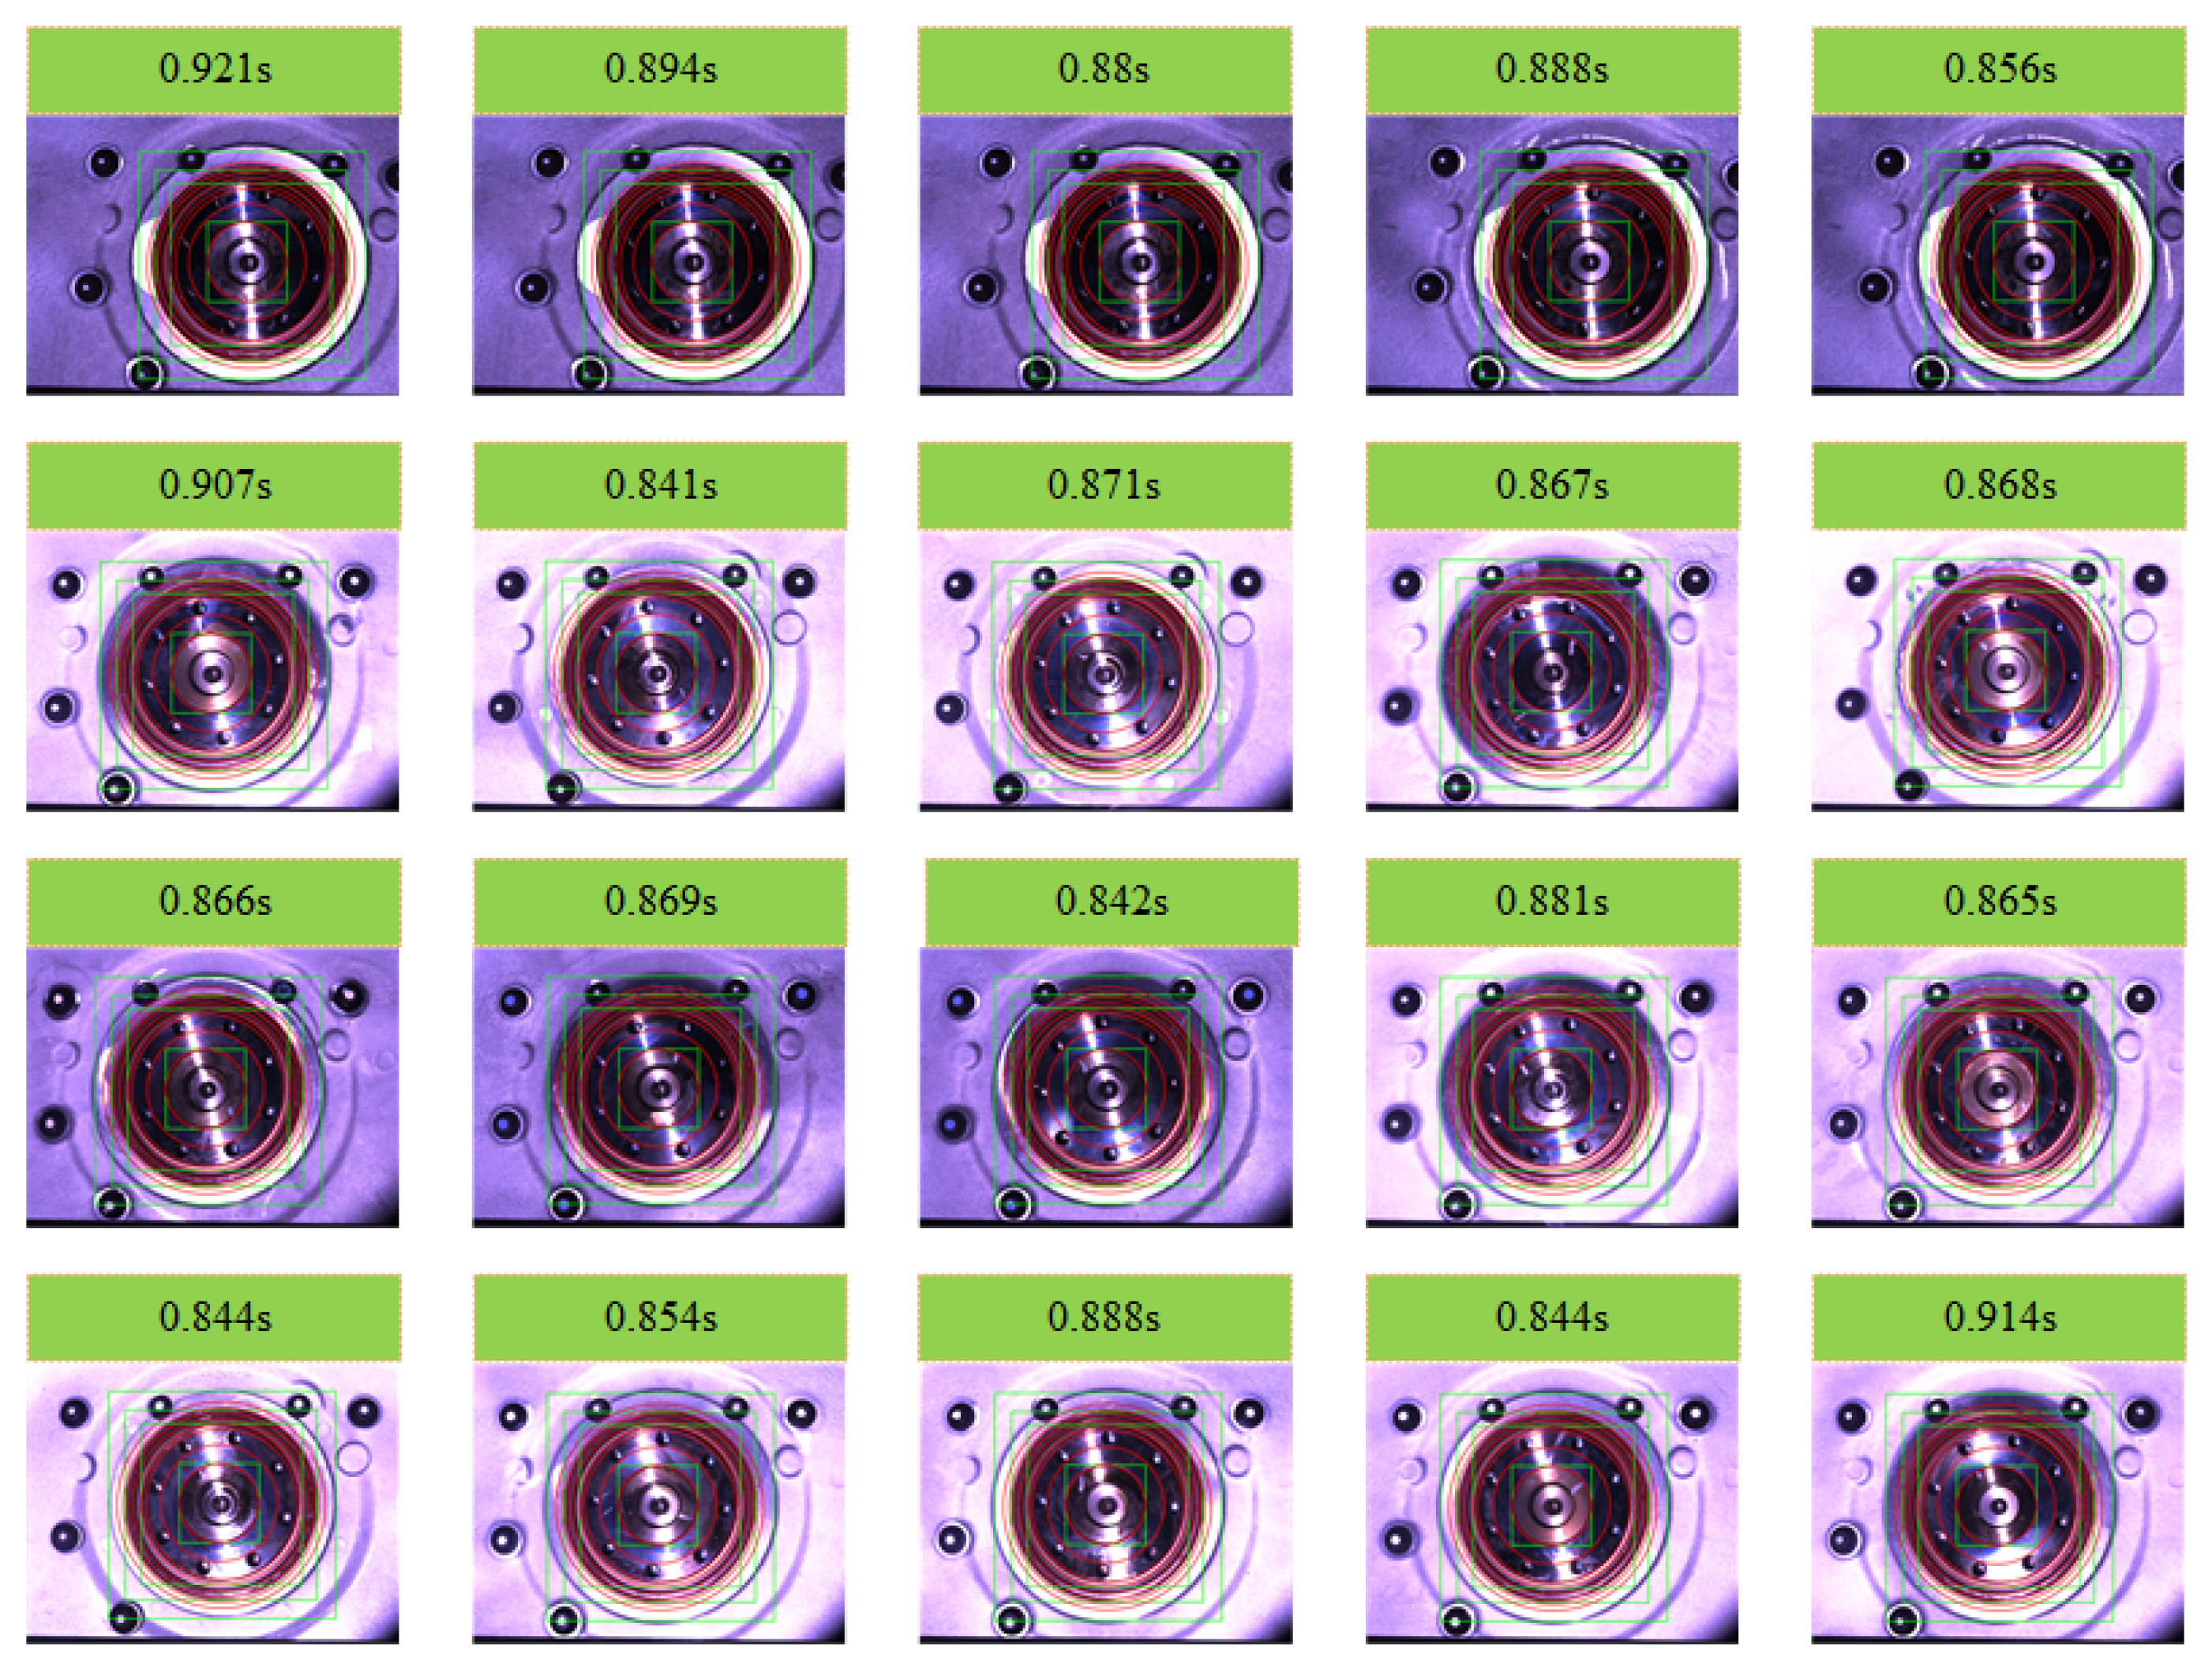
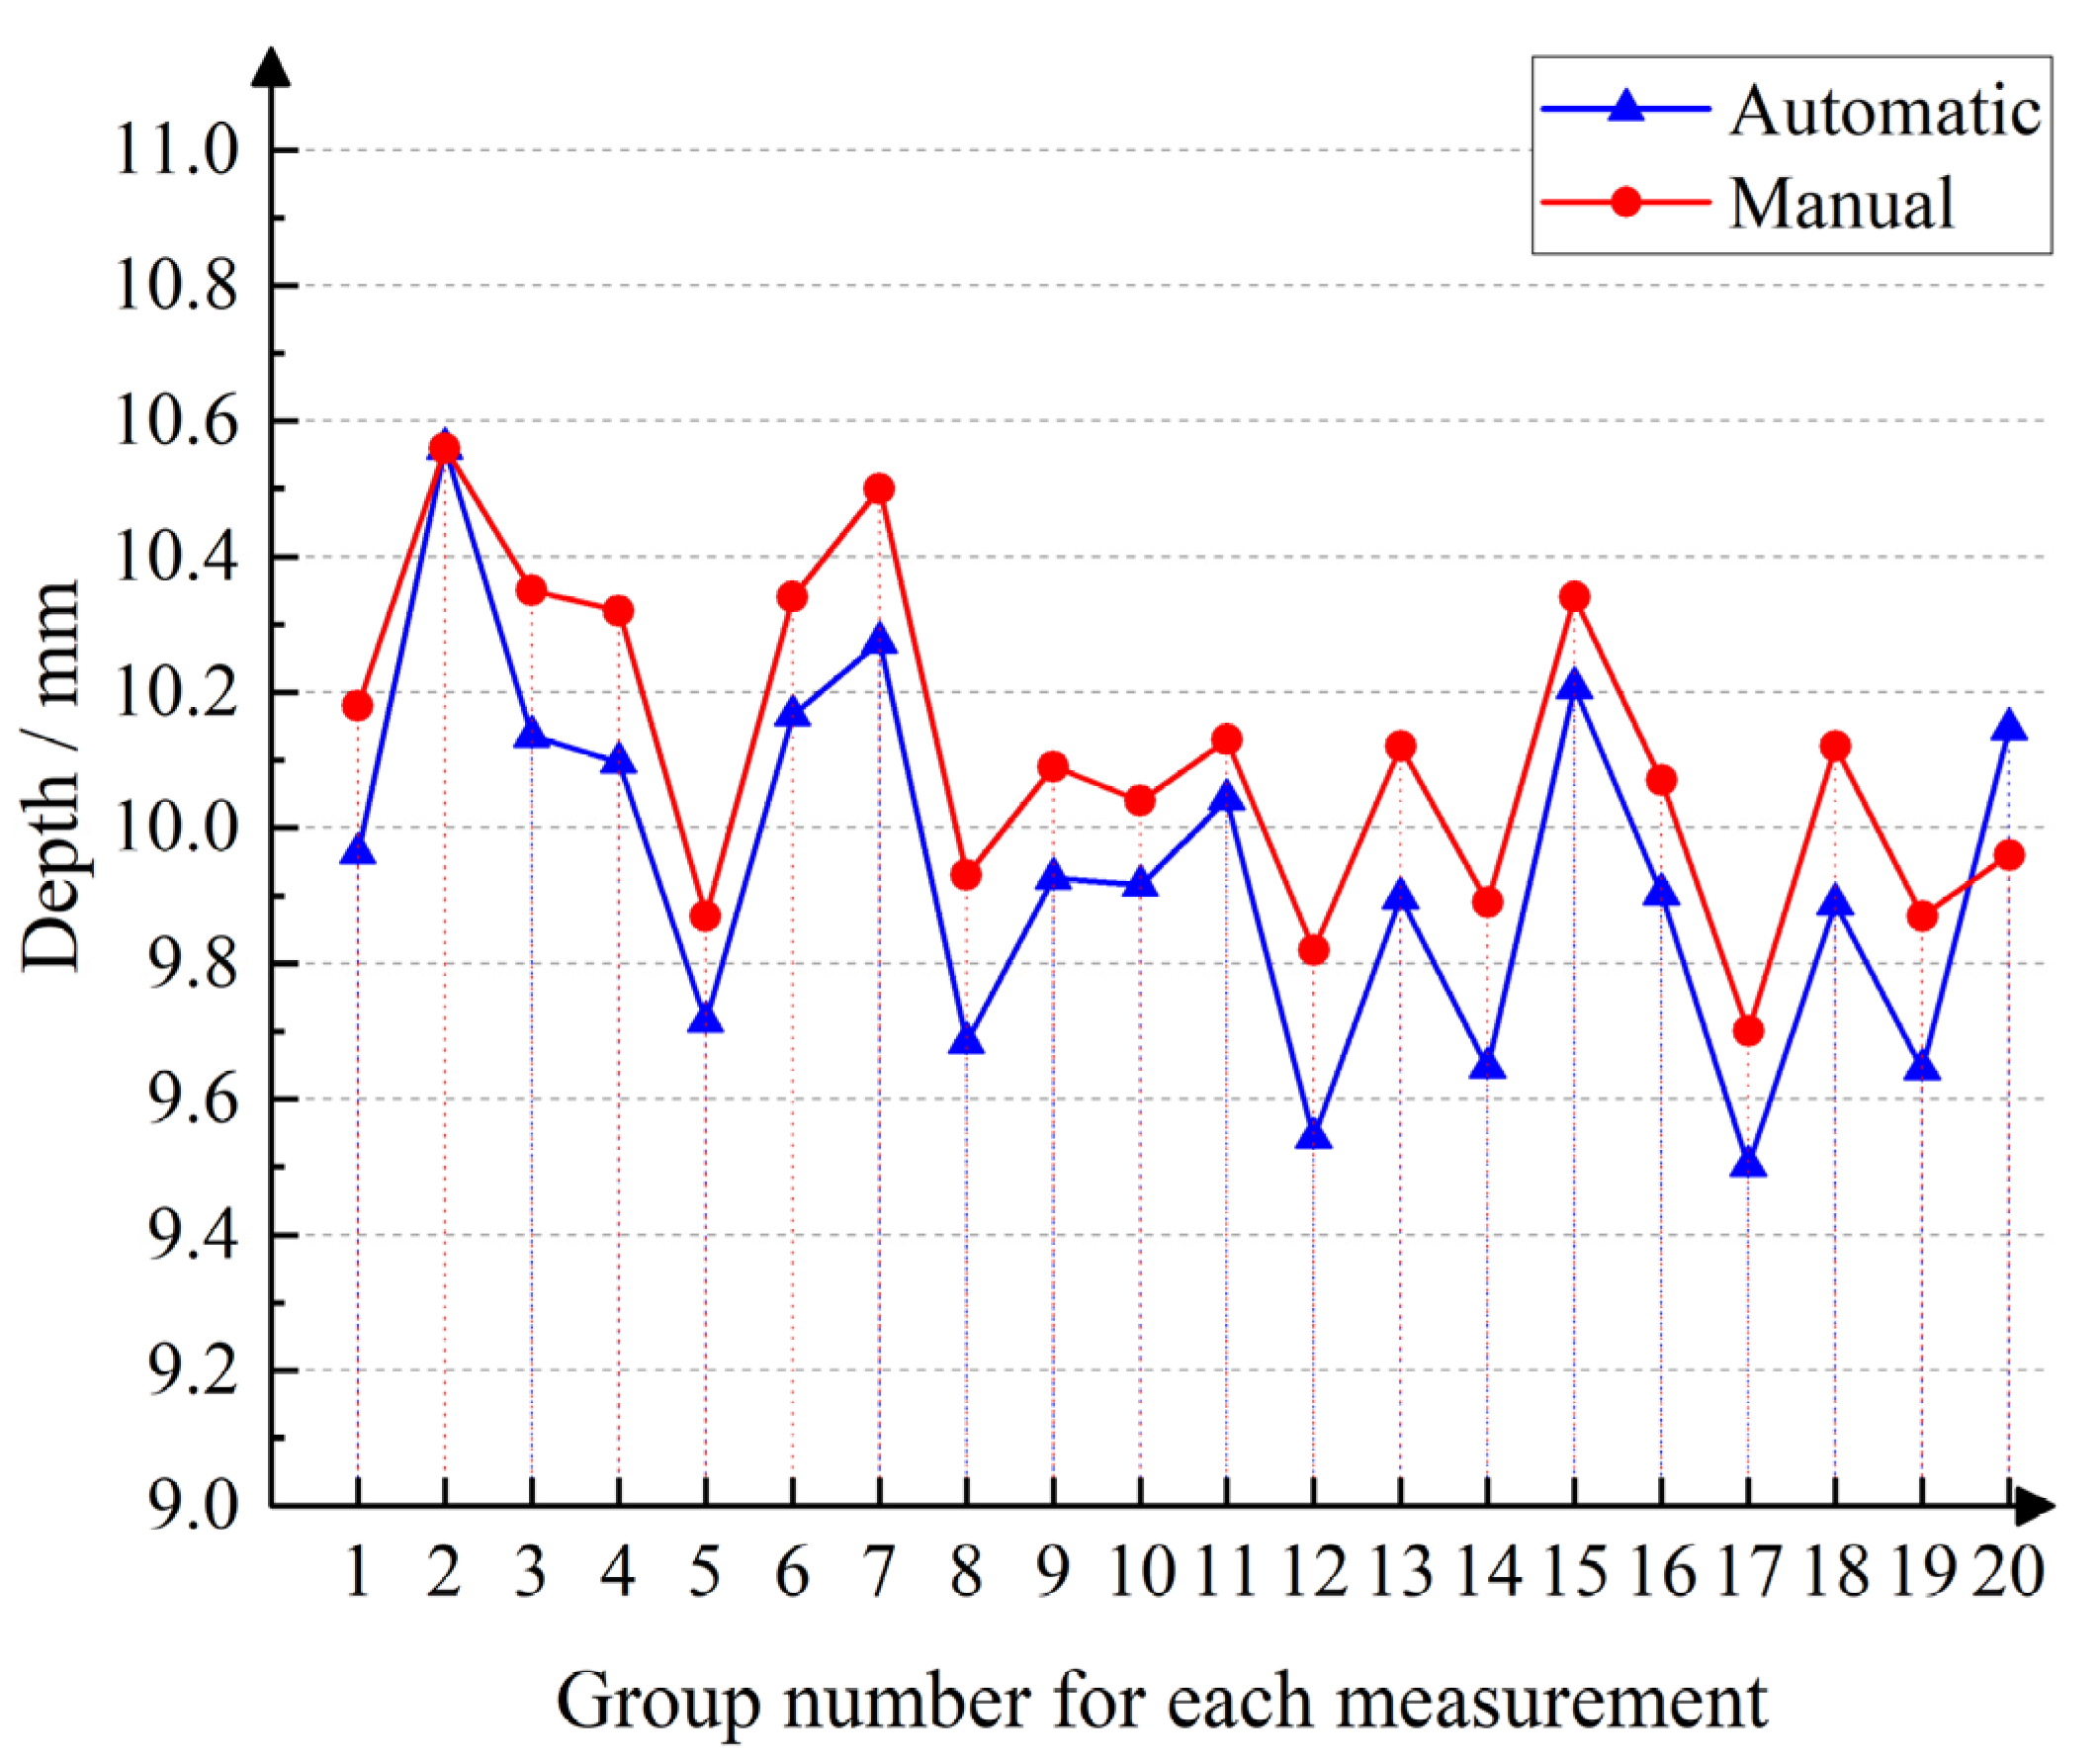
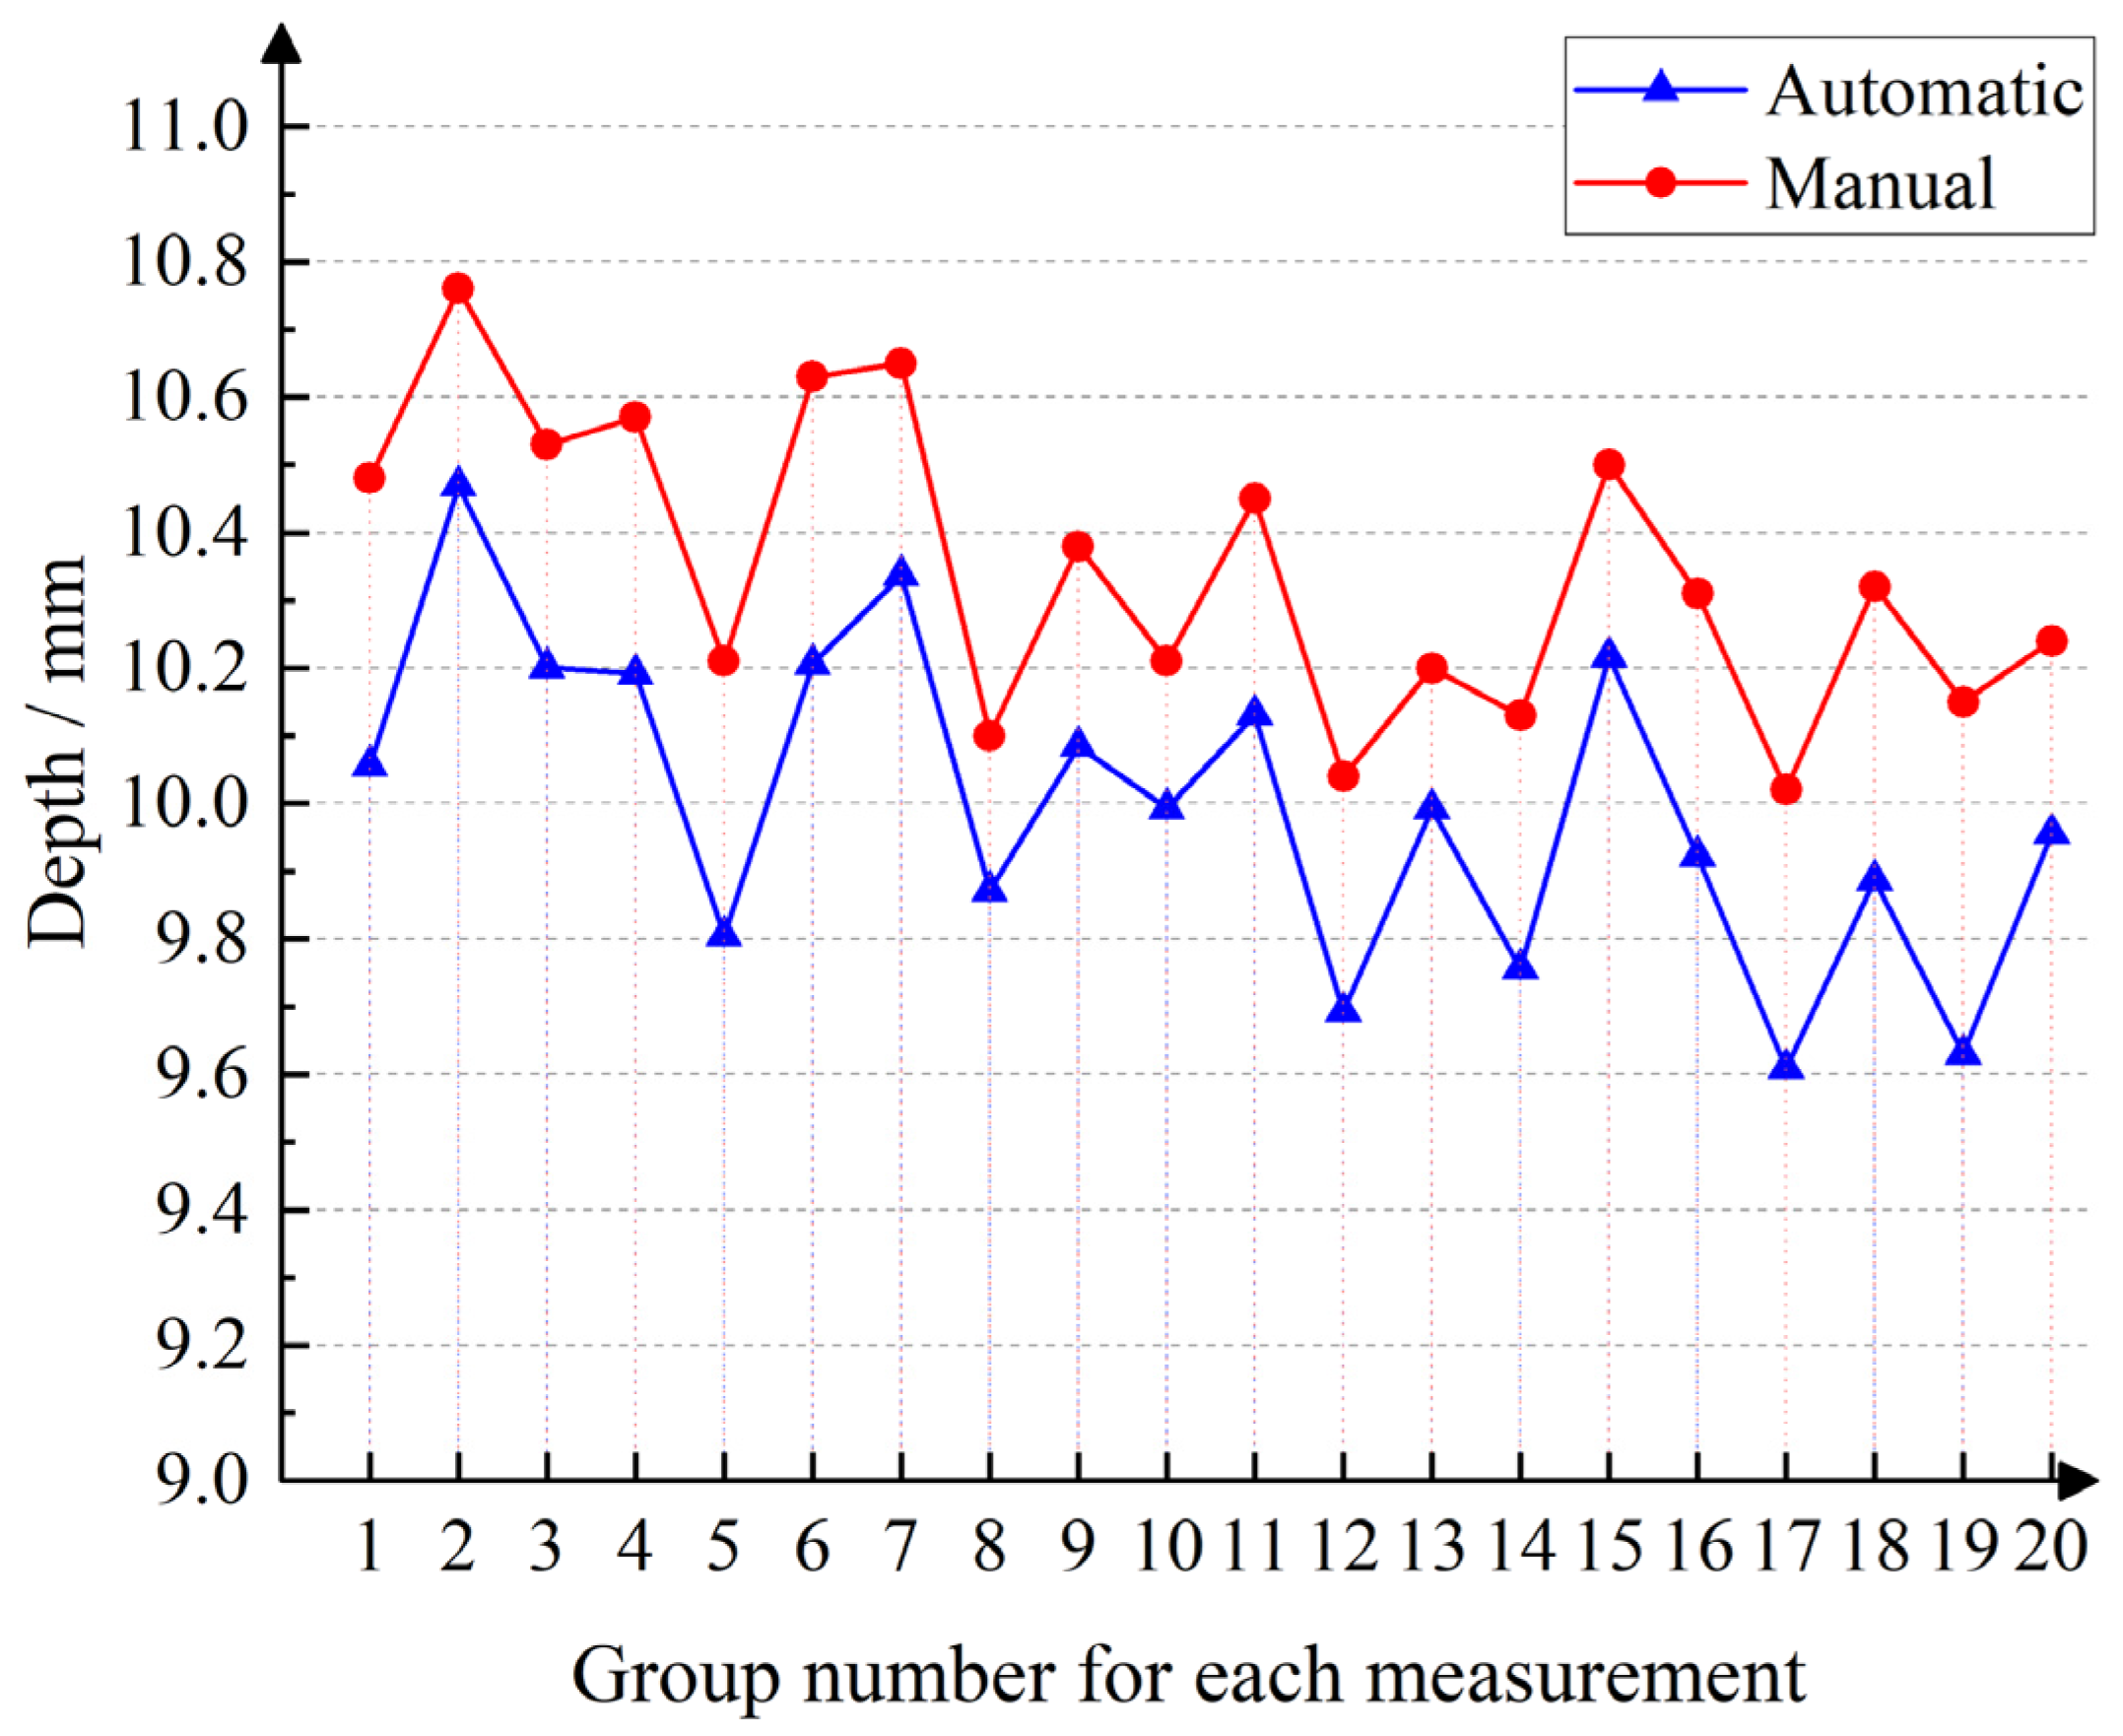
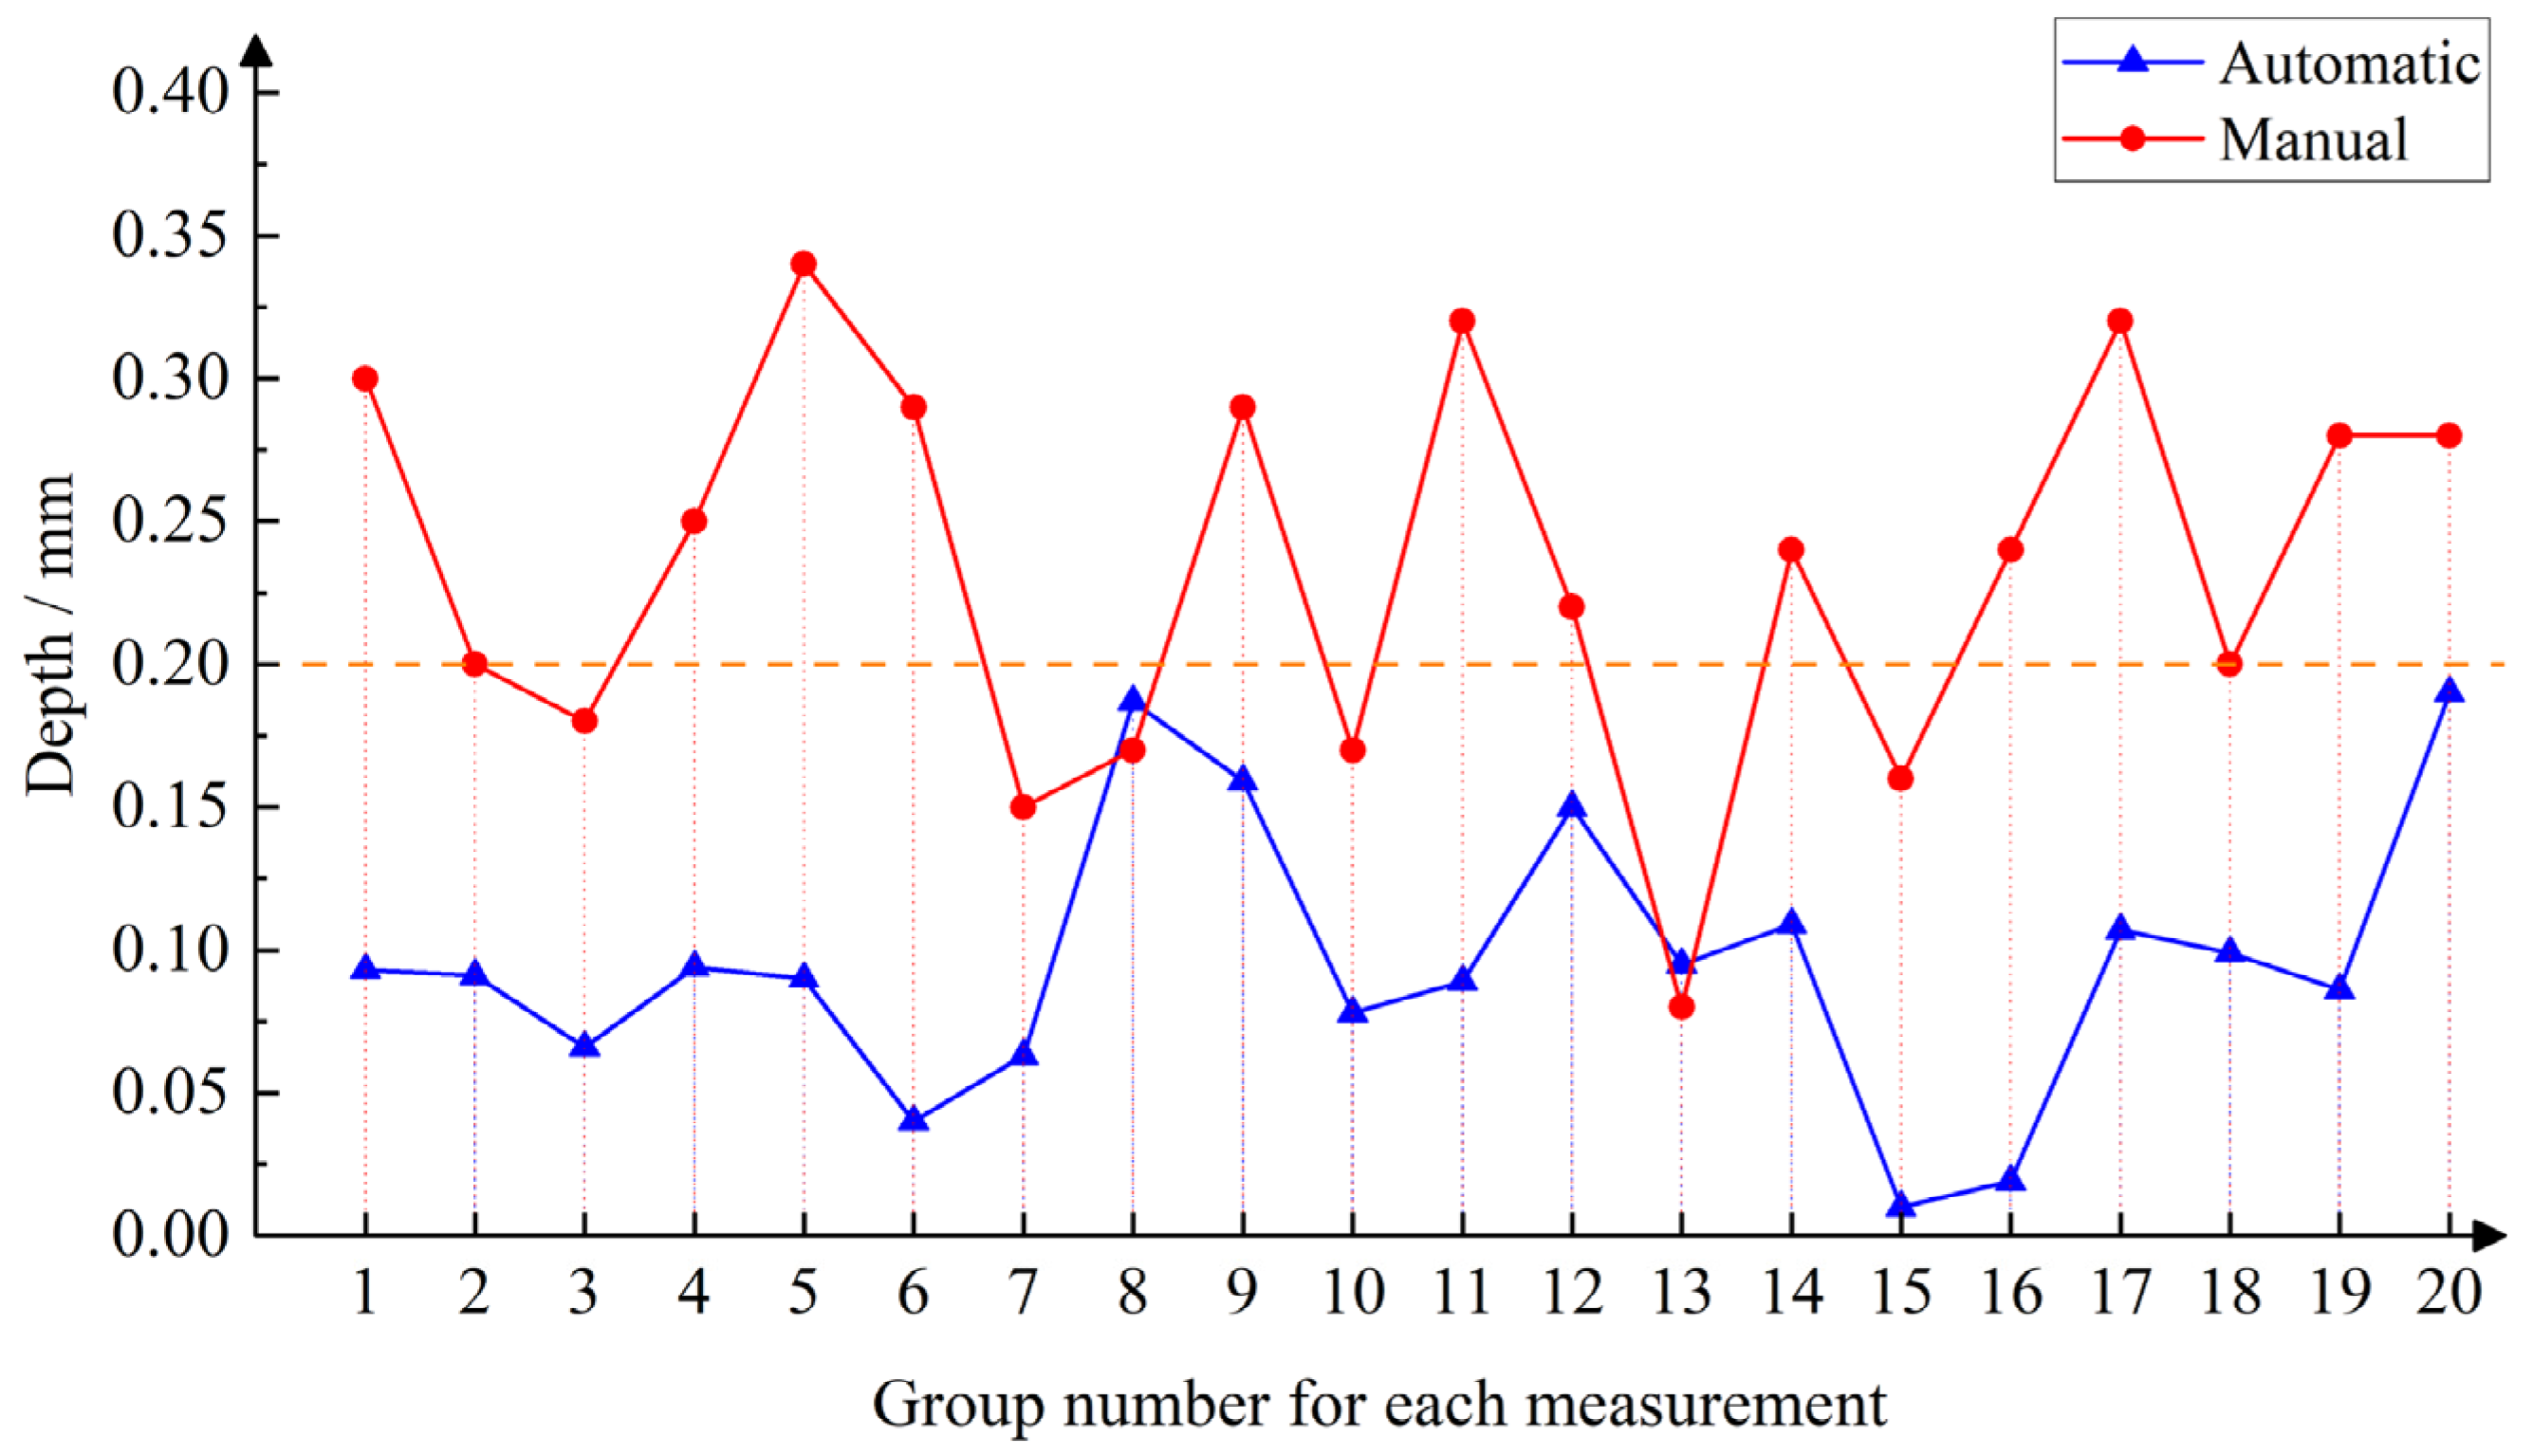
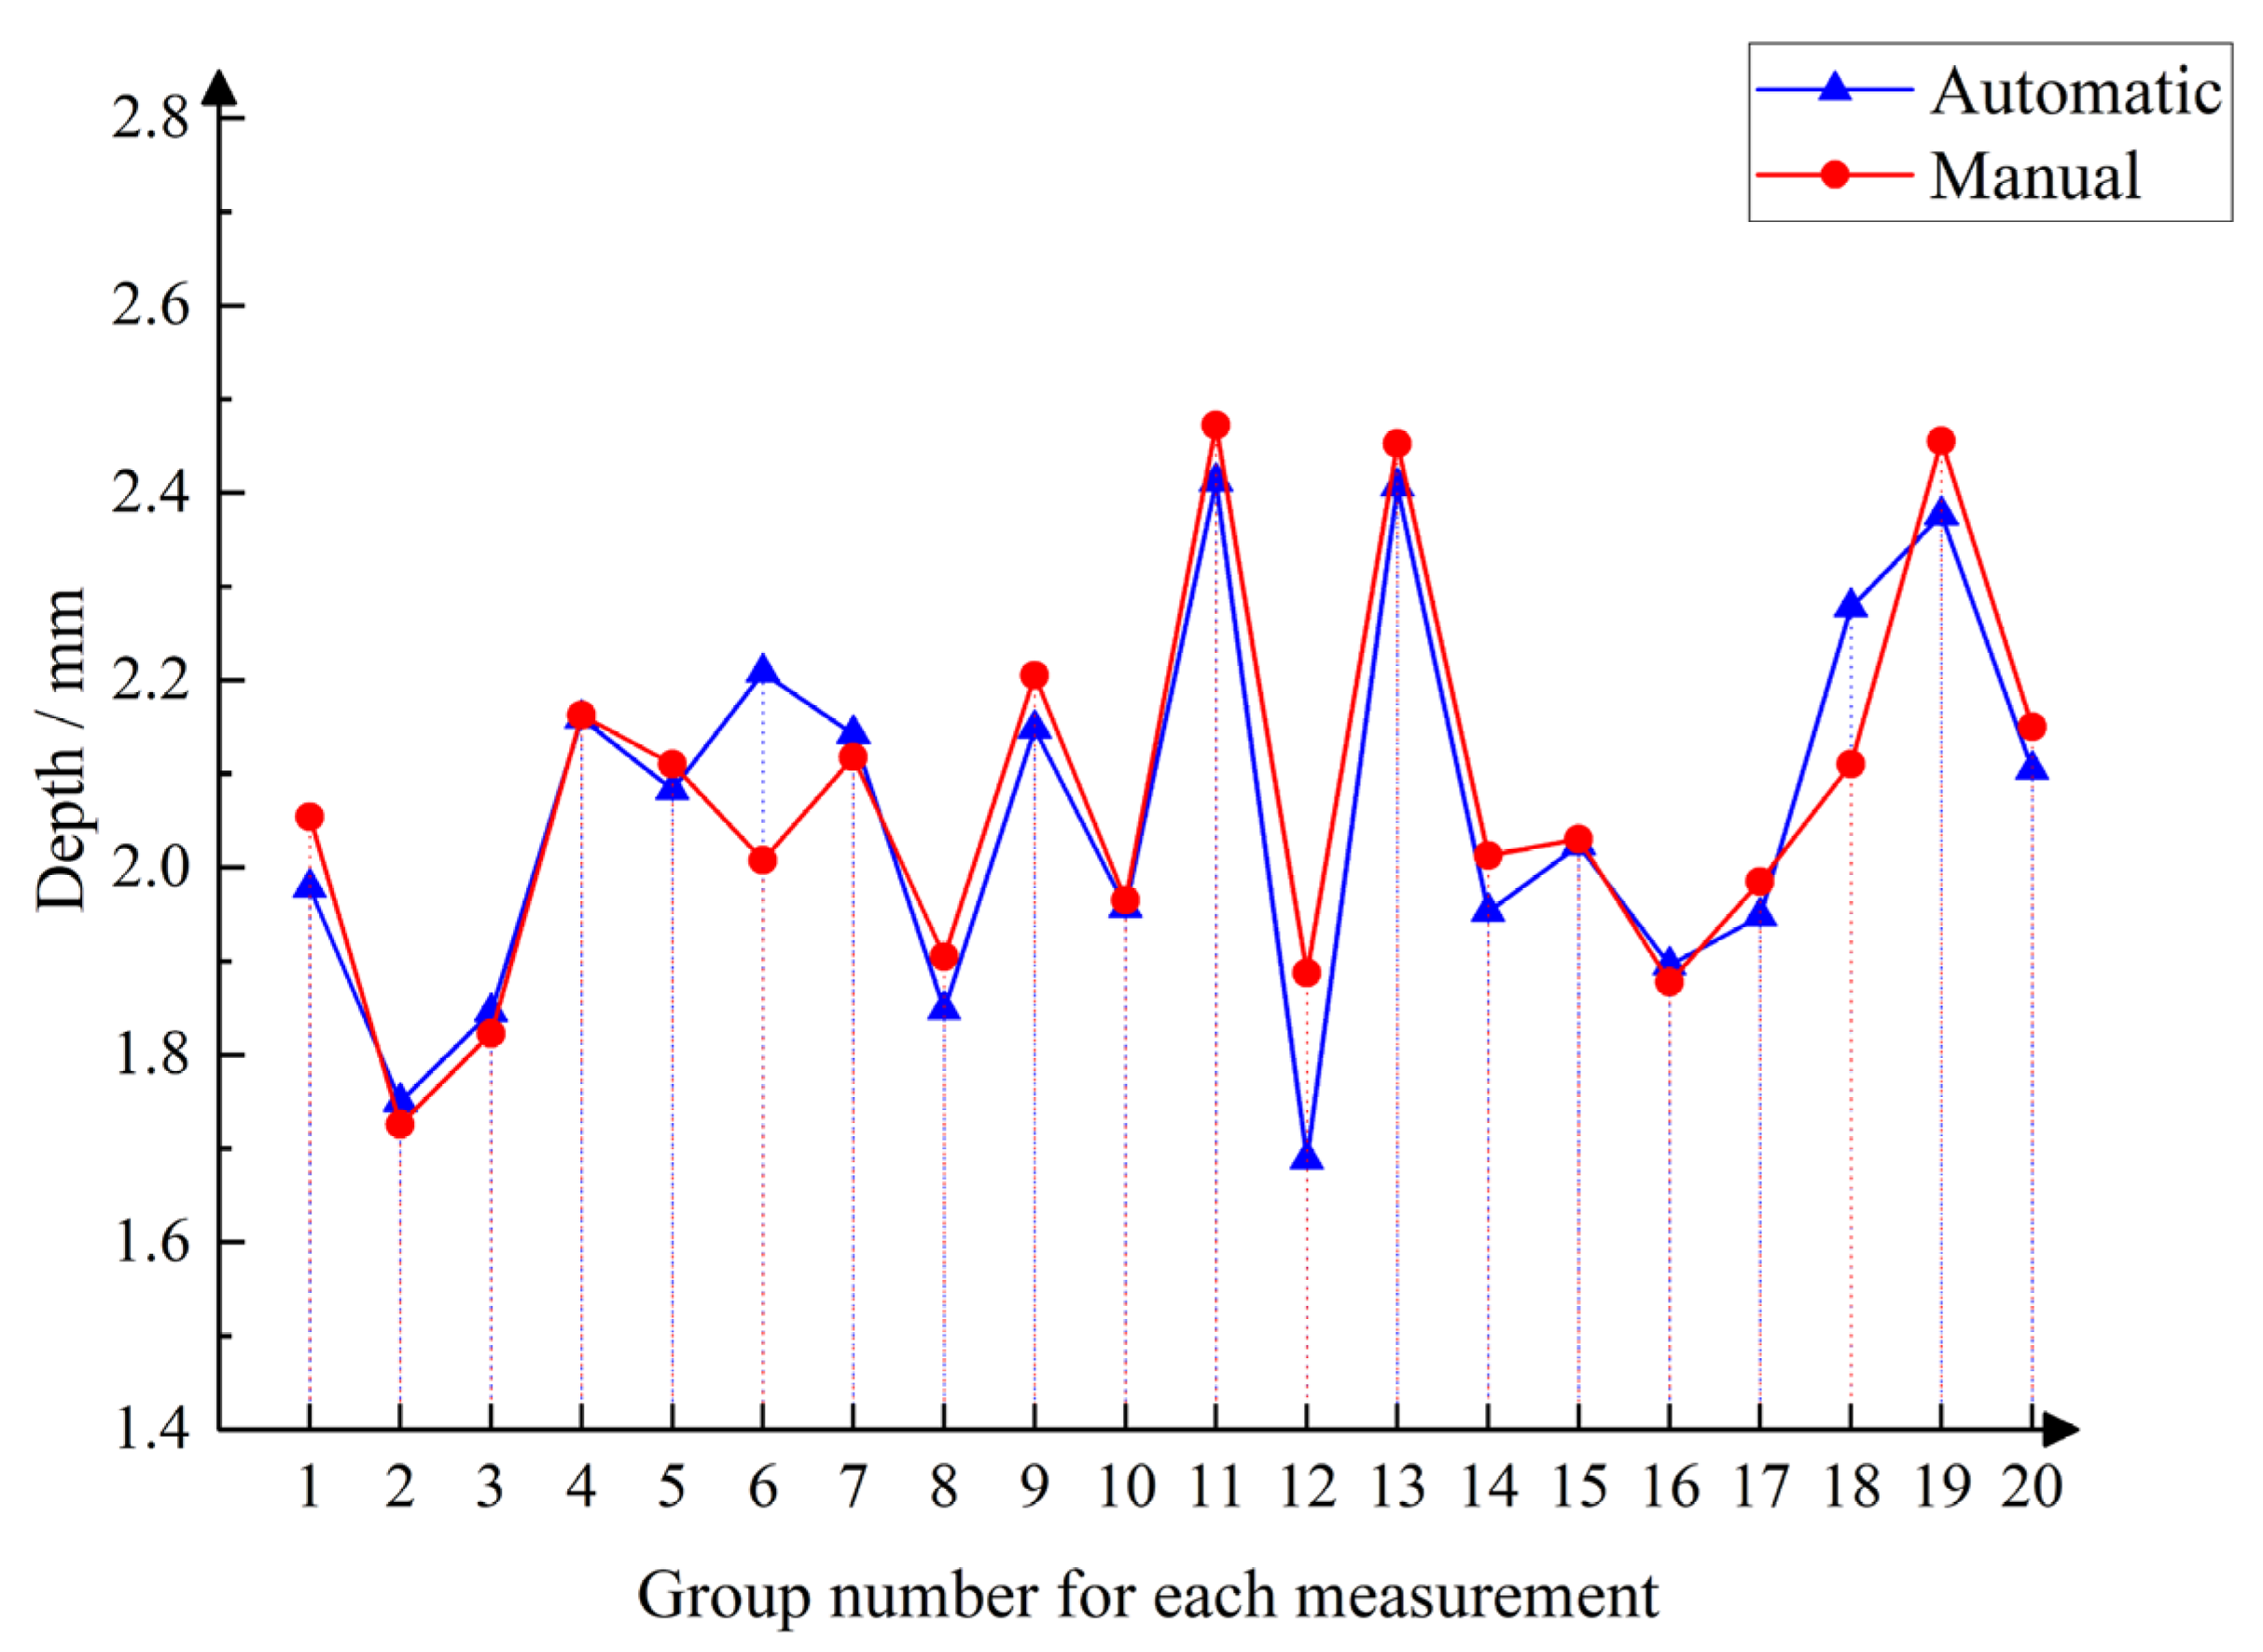
Matching results are shown in Figure 16, and the results of the statistics are shown in Figure 17 and Figure 18. The distance from the inner and outer rings of the oil seal to the end face of the crankshaft was measured, and it can be seen that when comparing the automatic measurement with the manual measurement, the measured value is small, and the height change trend remains the same. In Figure 19, it is evident that manual measurement involves significant subjectivity. On the assembly line, the number of measurements meeting the 0.2 mm assembly requirement should account for more than 98%, whereas the automatic measurement values are more stable. Figure 20 shows the comparison of D3 automatic measurement and manual measurement data, where it can be seen that the trend of manual measurement and automatic measurement is consistent, which again verifies the reliability of this testing method.
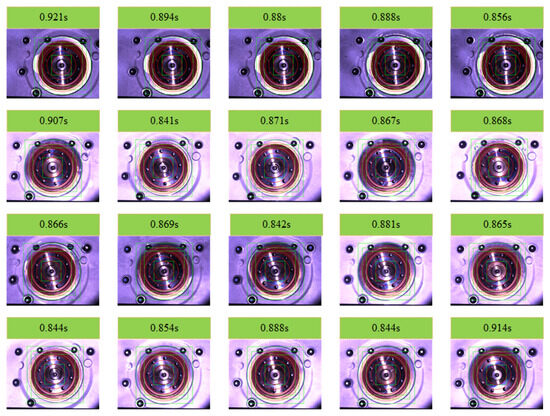
Figure 16.
ROI region extraction results and time.
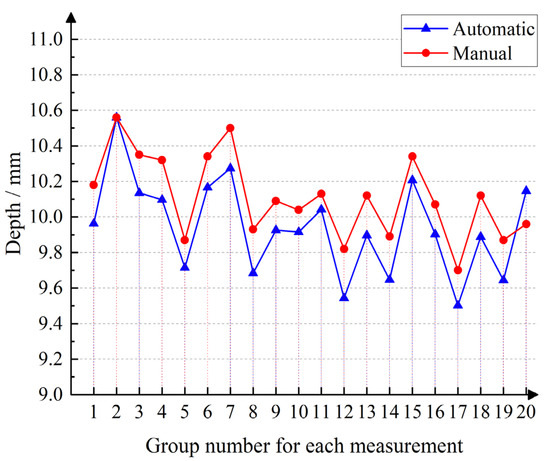
Figure 17.
Automatic vs. manual measurement—D1.

Figure 18.
Automatic vs. manual measurement—D2.
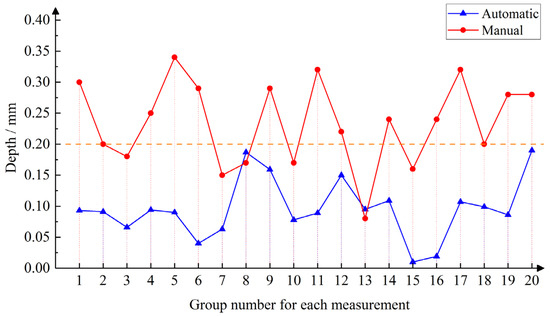
Figure 19.
Automatic vs. manual measurement—D.
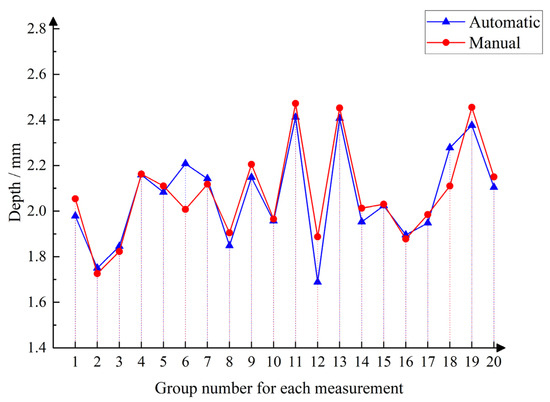
Figure 20.
Automatic vs. manual measurement—D3.
Finally, during the experiment, the overall measurement time of the sensor was analyzed in detail, and the total measurement time was 11.448 s, including the image stable acquisition time of 2 s, the average time of the multi-stage progressive template matching, and the final annular ROI streak map extraction of 0.873 s, as well as the total time consumed by the three-dimensional reconstruction, the distance computation, and the result display and data saving of 8.575 s. It meets the beat requirement of the assembly line, and at the same time, the speed is much higher than that of the manual measurement method, showing strong real-time and practicality. Further, the method was applied to the continuous measurement of multiple devices on the assembly line, and a total of 1415 devices were tested. The results show that under complex working conditions, the number of matched failed devices is 26, and the detection success rate reaches 98.16%, which fully meets the requirements of measurement accuracy and stability. The experimental data show that in the vast majority of cases, the system can accurately locate the target area and complete the subsequent measurement, proving its reliability and adaptability in industrial sites.
Despite the overall excellent performance, a small number of failure cases were observed, accounting for approximately 2%. Furthermore, an analysis of the failure cases revealed that the main causes could be attributed to the following factors: In certain testing environments, fluctuations in lighting conditions had a significant impact on the sensor’s projection and image capture, leading to template matching failures. This was particularly true when ambient light intensity was unstable or there was the strong reflection, causing errors in fringe phase unwrapping and affecting the accuracy of the matching. Additionally, variations in the heat treatment process led to changes in the surface texture of the crankshaft end face, preventing the sensor from properly recognizing the target area, which resulted in matching failures. This issue can be addressed by accumulating templates of different heat treatment process textures to improve matching accuracy. Additionally, the sensor system now includes a measurement prompt, and when matching failures occur, an NG warning is triggered, prompting manual re-inspection to ensure 100% measurement accuracy on the production line.
Taken together, the proposed measurement method not only meets the real-time requirements of the assembly line but also has obvious advantages in terms of detection accuracy and stability, fully demonstrating its potential for application in real production environments.
4. Discussion and Conclusions
This paper proposes a composite vision-based method for post-assembly size detection of engine oil seals. By using progressive template matching to obtain an annular ROI mask and combining three-frequency, four-step phase-shifting for three-dimensional reconstruction, the method applies modified RANSAC for plane fitting, enhancing the accuracy of plane fitting and height difference calculation. Experimental data show that the proposed composite vision method for oil seal assembly size detection significantly outperforms manual measurement in speed. The relative deviations of the measured height difference and compression depth are within 0.3323% and 1.4461%, respectively, meeting the repeatability and reliability requirements of the equipment. A total of 1415 devices were measured, and the automatic measurement success rate reached 98.16%, meeting the standard assembly height difference of within 0.2 mm. This demonstrates the system’s reliability in real-world assembly lines, providing an efficient and reliable solution for online detection of engine oil seal assembly dimensions.
Although the composite vision method proposed in this paper achieved significant results in engine oil seal assembly size detection, there are still some limitations. First, the method relies on high-precision sensors and complex computational processes, which may result in higher costs in high-demand application scenarios, especially for small and medium-sized enterprises. Additionally, while the method operates stably in most cases, it may encounter mismatches or inaccurate measurements under extreme environmental conditions, such as significant lighting variations or complex workpiece surfaces (e.g., differences in heat treatment processes), which could affect its robustness and adaptability.
Future research can address these issues by optimizing hardware configurations and algorithm efficiency. For example, using smaller projectors and board-level cameras can reduce system costs and decrease the sensor size, minimizing the impact on production line space. Furthermore, the ROI areas obtained after template matching can be optimized through parallel computation and linear processing, while rebuilding all four sections simultaneously to shorten calculation time effectively. To enhance system adaptability in complex environments, more advanced light compensation and environmental adaptation algorithms can be employed to address lighting changes, surface reflections, and occlusion issues, such as using multi-exposure stripe methods to remove overexposed areas.
Given the large sample size of the measured objects, future work will incorporate artificial intelligence and machine learning techniques for precise segmentation of the oil seal inspection area, which will further improve the system’s stability and detection accuracy. With these improvements, the proposed detection method will be able to achieve more efficient and reliable applications in a wider range of industrial production scenarios.
Author Contributions
Conceptualization, Y.L. and X.G.; methodology, Y.L.; software, R.J.; validation, G.T., Y.L. and S.C.; formal analysis, Y.H.; resources, W.L.; data curation, J.Z.; writing—original draft preparation, Y.L.; writing—review and editing, X.G. and W.L.; supervision, R.J.; project administration, S.C.; funding acquisition, X.G. All authors have read and agreed to the published version of the manuscript.
Funding
The work reported herein was financially supported by the National Natural Science Foundation of China (Grant No. 52005119), and Nanning Major Science and Technology Project funded by Nanning science and Technology Bureau in 2023 (Grant No. 20231034), and Guangxi Natural Science Foundation Youth Science Fund Project funded by Department of Science and Technology of Guangxi Zhuang Autonomous Region in 2024 (Grant No. 2024JJB160101), and Innovation Project of GUET Graduate Education funded by Guilin University of Electronic Technology in 2023 (2023YCXB02, 2023YCXB03).
Data Availability Statement
Data will be made available upon request from the corresponding author.
Conflicts of Interest
The authors declare no conflicts of interest.
Abbreviations
The following abbreviations are used in this manuscript:
| PSP | phase shift profilometry |
| FPP | fringe projection profilometry |
| ROI | region of interest |
| M-RANSAC | modified random sample consensus |
References
- Park, W.; Son, S.; Choi, D. Oil-Sealing Performance Evaluation of Labyrinth Seal Using Combined Finite Element Analysis and Computational Fluid Dynamics. Lubricants 2023, 11, 400. [Google Scholar] [CrossRef]
- Jiang, L.; Zhang, X. Inspection algorithm based on Gaussian filtering for oil seal spring. Opt. Eng. 2014, 53, 102–108. [Google Scholar] [CrossRef]
- Wu, Z.J.; Sun, C.K.; Liu, J. An Online Visual Inspection System for Oil-Seal Dimension. Appl. Mech. Mater. 2012, 130–134, 3548–3552. [Google Scholar] [CrossRef]
- Xia, G.F.; Yu, Z.L. Oil Seal Defect Detection Method Based on Deep Learning. J. Mech. Electr. Eng. 2023, 40, 69–75. [Google Scholar]
- Bzura, P. Diagnostic Model of Crankshaft Seals. Pol. Marit. Res. 2019, 26, 39–46. [Google Scholar] [CrossRef]
- Liu, J.; He, Z.D.; Lou, T.S.; Wang, C.D. Oil seal defect detection based on entropy rate clustering and ring-band differencing. Modul. Mach. Tool. Auto. Manu. Technol. 2018, 8, 90–92+96. [Google Scholar]
- Zhang, G.; Li, Y.; Xu, X.Y. Application of image processing technology in oil seal defect detection and identification. Inf. Technol. Informat. 2020, 11, 72–73. [Google Scholar]
- Shi, L.; Yu, Z.L. Research on oil seal defect detection method based on image processing. J. Changchun University Sci. Technol. 2021, 44, 48–54. [Google Scholar]
- Del Olmo, A.; De Lacalle, L.N.L.; De Pissón, G.M.; Pérez-Salinas, C.; Ealo, J.A.; Sastoque, L.; Fernandes, M.H. Tool wear monitoring of high-speed broaching process with carbide tools to reduce production errors. Mech. Syst. Signal Process. 2022, 172, 109003. [Google Scholar] [CrossRef]
- Aldekoa, I.; del Olmo, A.; Sastoque-Pinilla, L.; Sendino-Mouliet, S.; Lopez-Novoa, U.; de Lacalle, L.N.L. Early detection of tool wear in electromechanical broaching machines by monitoring main stroke servomotors. Mech. Syst. Signal Process. 2023, 204, 110773. [Google Scholar]
- Xu, L.; Pang, M. Research on tire tread depth measurement system based on structured light. Laser J. 2022, 43, 179–183. [Google Scholar]
- Xu, D.S.; Du, F.Z. Research on gap and step measurement technology of aircraft skin seams based on line structured light. Aerosp. Manuf. Technol. 2017, 5, 77–81. [Google Scholar]
- Yu, S.; Guo, H.; Yang, W.; Zhao, Y.; Wu, H.; Sun, X.; Yu, X. Depth Measurement Error Analysis and Structural Parameter Correction of Structured Light Depth Imager. Photonics 2024, 11, 396. [Google Scholar] [CrossRef]
- Zhao, H.; Hu, P.; Yang, S. Aircraft cabin door gap measurement technology and applications based on planar structured light. Sci. Technol. Eng. 2024, 24, 1045–1051. [Google Scholar]
- Li, S.Y.; Le, Y.S.; Gao, J.C.; Zhao, X.F. Bolt loosening angle measurement along full range of screw exposure length based on 3D point cloud. Automat. Constr. 2024, 168, 105785. [Google Scholar] [CrossRef]
- Zheng, Z.H.; Gao, Y.Q.; He, Z.B.; Wang, C.Y.; Xie, H.; Liu, G.H. Dimensional measurement of anti-stress cone of HV cable joints based on 3D point cloud. Meas. Sci. Technol. 2023, 34, 115009. [Google Scholar] [CrossRef]
- Wang, C.Y.; Zhou, Z.F.; Wang, Y.Q.; Wu, M.H. Measurement of concave polygon of automotive dashboard based on planar structured light. J. Appl. Opt. 2023, 43, 143–149. [Google Scholar]
- Wang, J.; Yang, Y.; Xu, P. Noise-induced phase error comparison in multi-frequency phase-shifting profilometry based on few fringes. Opt. Laser Technol. 2023, 159, 109034. [Google Scholar] [CrossRef]
- Yan, H.; Chen, Q.; Feng, S.J.; Zuo, C. Microscopic fringe projection profilometry: A review. Opt. Lasers Eng. 2020, 135, 106192. [Google Scholar]
- Tomislav, P.; Tomislav, P.; Damagoj, Z. Selection of optimal frequencies in multiple-frequency fringe projection profilometry. Opt. Lasers Eng. 2023, 163, 107455. [Google Scholar]
- Duan, S.S. Detection method of downhole belt conveyor deviation fault based on ROI edge image straight line feature. China Min. Mag. 2024, 33, 162–167. [Google Scholar]
- Han, Y. Reliable Template Matching for Image Detection in Vision Sensor Systems. Sensors 2021, 21, 8176. [Google Scholar] [CrossRef] [PubMed]
- Wang, S.C.; Wang, H.; Zhou, Y.L.; Liu, J.B.; Dai, P.; Du, X.Y.; Wahab, M.A. Automatic laser profile recognition and fast tracking for structured light measurement using deep learning and template matching. Measurement 2021, 169, 108362. [Google Scholar]
- Zhang, Z.Y. A flexible new technique for camera calibration. IEEE Trans. Pattern Anal. Mach. Intell. 2000, 22, 1330–1334+472. [Google Scholar]
- Liu, Y.; Zhang, B.; Yuan, X. An Improved Projector Calibration Method by Phase Mapping Based on Fringe Projection Profilometry. Sensors 2023, 23, 1142. [Google Scholar] [CrossRef]
- Shui, W.Y.; Zhou, M.Q.; Maddock, S.; He, T.P.; Wang, X.C.; Deng, Q.Q. A PCA-Based method for determining craniofacial relationship and sexual dimorphism of facial shapes. Comput. Biol. Med. 2017, 90, 33–49. [Google Scholar]
- Huang, J.; Zhang, D.; Xu, B. Research on Fingerprint Precision Recognition Method Based on Structured Light. J. Appl. Opt. 2025, in press.


Disclaimer/Publisher’s Note: The statements, opinions and data contained in all publications are solely those of the individual author(s) and contributor(s) and not of MDPI and/or the editor(s). MDPI and/or the editor(s) disclaim responsibility for any injury to people or property resulting from any ideas, methods, instructions or products referred to in the content. |
© 2025 by the authors. Licensee MDPI, Basel, Switzerland. This article is an open access article distributed under the terms and conditions of the Creative Commons Attribution (CC BY) license (https://creativecommons.org/licenses/by/4.0/).