Article

Fault Diagnosis of Reciprocating Compressor Valve Based on Triplet Siamese Neural Network

1
College of New Energy, China University of Petroleum (East China), Qingdao 266580, China
2
China Petroleum Technology and Development Corporation, No. 8 Taiyanggongjinxingyuan, Chaoyang District, Beijing 100028, China
3
CNPC JCPC Chengdu Compressor Branch, No. 3 Century Avenue, Longquanyi District, Chengdu 610100, China
*
Author to whom correspondence should be addressed.
Machines 2025, 13(4), 263; https://doi.org/10.3390/machines13040263
Submission received: 22 February 2025 / Revised: 15 March 2025 / Accepted: 18 March 2025 / Published: 23 March 2025
(This article belongs to the Section Automation and Control Systems)

Abstract

:
A fault diagnosis method for reciprocating compressor valves suitable for variable operating conditions is presented in this paper. Firstly, a test bench is independently constructed to simulate fault scenarios under diverse operating conditions and with various faults. The two types of p-V diagrams are gathered, and the improved logarithmic p-V diagram acquisition method is used for logarithmic transformation to obtain the multi-conditional logarithmic p-V diagram dataset and the fault logarithmic p-V diagram dataset. Subsequently, to predict the fault-free logarithmic p-V diagram under different operating conditions, a BP neural network is trained with the multi-condition logarithmic p-V diagram dataset. Next, the fault sequence is derived by subtracting the fault logarithmic p-V diagram from the fault-free logarithmic p-V diagram acquired under the same operating condition. Ultimately, the feature extraction of the fault sequence and the fault classification are accomplished by the employment of a triplet Siamese neural network (SNN). The results indicate that the fault classification accuracy of the method presented in this paper can attain 100%, which confirms that differential processing on the logarithmic p-V diagram is effective for fault feature preprocessing. This study not only improves the accuracy and efficiency of valve fault diagnosis in reciprocating compressors but also provides technical support for maintenance and fault prevention.

1. Introduction

With the rapid expansion of various industries, reciprocating compressors have become indispensable equipment for pressurized gas transportation. The reciprocating compressor cyclically completes gas expansion, suction, compression, and exhaust based on valve opening and closing. The valve is vulnerable to airflow and impact from the valve seat, leading to a relatively high failure rate of approximately 36% [1]. The occurrence of valve failures leads to abnormal exhaust temperature, reduced air capacity, increased resistance losses, decreased unit efficiency, and other related issues. As the fault worsens, broken valve discs and springs may even damage the cylinder, causing it to break down. Given the need for stable operation and cost savings through reduced on-site inspections in actual production [2], it is crucial to develop an intelligent method for diagnosing valve faults.
Knowledge-based, model-based, and data-driven approaches are three kinds of fault diagnosis methods [3]. Knowledge-based approaches rely on the expertise of professionals to identify faults through the construction of knowledge bases and reasoning mechanisms, while model-based methods depend on precise mathematical models, and data-driven techniques draw upon extensive operational data for fault identification. The data-driven approach does not require the establishment of an exact mathematical model and avoids reliance on subjective expert judgment. However, it involves statistically analyzing large amounts of data to identify potential features [4]. Traditional neural networks used in previous studies tend to focus solely on classification and overlook the boundaries between categories. When the boundary between two categories is ambiguous, it becomes challenging for the neural network to determine which category a tested sample belongs to. One approach to addressing this issue is the utilization of the triplet Siamese neural network (SNN). Given that SNN is designed to prioritize the learning of image similarities rather than content, it offers the advantage of robustness to class imbalance. As a result, SNN has been widely applied in target tracking [5,6,7], liquid crystal classification [8], hyperspectral image classification [9,10,11], and open-set recognition [12,13,14]. These applications all demonstrate the ability of SNN to effectively cluster similar samples and disperse different samples across various fields of data, ultimately leading to improved classification outcomes.
In addition to potential challenges in the classification process, the data utilized for analysis is also a critical consideration. The specific mode extracted from the vibration signal can effectively indicate the abnormal state of rotating machinery [15]. Therefore, preprocessing and denoising of vibration signals are commonly performed prior to inputting them into distinct networks for fault classification, which has emerged as a prevalent approach in fault detection. In terms of vibration signal preprocessing, Zhang [16] used sparse filtering to extract information from vibration signals and then input it into a convolutional deep belief network to further extract features; finally, they used the softmax regression classifier for fault identification. Similarly, Zhang [17] also proposed a mode isolation convolutional deep belief network (MI-CDBN) to process vibration signals after sparse filtering and finally used a multi-class logistic regression method for fault identification. Yu [18] used decision tree and support vector machine to process typical features of gearbox vibration signals for classification. Medina [19] used random forest subspace discriminant (RFSD) and convolutional neural network (CNN) to process the MFDFA features based on quadratic approximation calculation and obtained good fault identification results after extracting the fault features of vibration signals through multi-fractal detrended fluctuation analysis (MFDFA). Li [20] proposed an improved filter based on the health index similarity matching method, which solves the problem that particle filters cannot produce accurate long-term predictions in the traditional way without updating model parameters during the prediction process. In the domain of vibration signal denoising, Zhang [21] used CEEMDAN in combination with wavelet transform to reduce noise interference from vibration signals. Mondal [22] applied a modulation signal bispectrum (MSB) to effectively suppress noise, resulting in a stable modulation component for accurate diagnosis. In order to solve the adverse effects of large environmental noise interference on vibration signal fault diagnosis, Zhang [23] presented novel global multi-attention–deep residual shrinkage networks (GMA-DRSNs) by using an attention mechanism. Zhang [24] fed signals from different RC sensors into a self-de-noising network, an integrated empirical model decomposition–convolutional deep belief network, de-noised the signals, extracted more robust features through unsupervised learning, and then relied on these features to complete the classification. Zhang [25] performed singular value decomposition (SVD) de-noising for signals larger than the threshold to retain more effective information in the original signal. However, in industrial applications, because each valve needs to install vibration probes, the hardware investment cost is high, and the measurement system is complex. Additionally, the compressor exhibits significant vibrations, which pose challenges due to strong non-stationarity and a low signal-to-noise ratio. Consequently, the use of a cylinder dynamic pressure signal for valve fault diagnosis has the characteristics of small signal interference and low hardware investment cost; it can well reflect the fault characteristics after converting it into a p-V diagram. Lv et al. [26] used the hit-or-miss transform to extract the comprehensive gradient of the expansion curve and compression curve of the p-V diagram, and the vertical projection transform was used to extract vertical projection features. Li et al. [27] extracted four-dimensional characteristic variables such as pressure ratio, process angle coefficient, area coefficient, and polytropic exponent coefficients from the p-V diagram as input. However, they utilized the original p-V diagram or the logarithmic p-V diagram without additional processing. Furthermore, the current research fails to consider the variable of changing operating conditions, which could lead to fault signals and consequently result in false alarms.
To solve the above problems, a method of obtaining logarithmic p-V diagrams is improved to avoid the pressure fluctuation caused by the unstable opening and closing of the gas valve in the compression and expansion stage; based on the method, this paper establishes a prediction model for the logarithmic p-V diagram under varying operating conditions and uses the two characteristic parameters of the output to generate a predictive p-V diagram as a standard reference. In order to eliminate the influence of variable operating conditions on fault detection, a method for processing fault features is proposed to quantify the difference between the measured and predicted logarithmic p-V diagrams, enabling fault analysis to be conducted based on this discrepancy. Subsequently, with the advantage of SNN in classification, we employ the logarithmic p-V diagram difference sequence for feature extraction and utilize a classification approach based on Euclidean distance. Finally, comprehensive experiments are conducted to validate the efficacy of the aforementioned methodologies.

2. Methodology

2.1. Establishment of Standard Reference for Logarithmic p-V Diagram

The actual operating process of reciprocating compression machinery includes expansion, suction, compression, and exhaust processes. p-V diagrams are good for reflecting the above thermodynamic processes. The presence of valve faults can induce changes in the p-V diagram. Different types of faults can result in distinct alterations, and these modifications exhibit a strong correlation with the specific fault. For variable operating conditions, the same cylinder has a different p-V diagram, which has complex and unquantifiable characteristic parameters, so logarithmic p-V diagrams are used for quantitative analysis.
When the valve is closed, the pressure of the gas in a closed volume, which is formed by piston and cylinder, changes as the volume changes. During the process, the state equation of a gas is [28]:
p V N = C o n s t
where N denotes the polytropic exponent, a crucial parameter determining variations in thermal processes. Therefore, N serves as a quantitative measure of the compression and expansion processes carried out by the compressor. For the convenience of subsequent processing, take the logarithm of the left and right sides of the equation to form a logarithmic p-V diagram as follows:
ln   p + N l n V = C o n s t
After the logarithm, we obtained the linear equation with ln   V and ln   p as the independent and dependent variable, respectively, and N as the slope, the original p-V diagram becomes a logarithmic p-V diagram, as shown in Figure 1. Expansion of the polytropic exponent k e and compression polytropic exponent k c can be obtained by calculating the slope N.
However, the polytropic exponents currently exhibit slight variations due to the unstable thermal exchange between the cylinder wall and the gas contained within it. Consequently, the expansion and compression process lines deviate from straight lines with a constant slope. To simplify the computation, this method employs the concept of the equal end-point method and makes the polytropic exponents in the logarithmic p-V diagram constant.
Firstly, we draw the suction and exhaust pressure line on the logarithmic p-V diagram, where these lines intersect the compression and expansion segments at points 1, 2, 3, 4, as shown in Figure 2. Subsequently, four intersections are incorporated into the logarithmic p-V diagram through linear interpolation. Utilizing points 1 and 2 as the initial and final stages of compression, points 3 and 4 are employed to represent the expansion process. A simplified compression segment is established by connecting points 1 and 2 and linking points 3 and 4. Ultimately, to find the simplified equation of compression and expansion segments, we obtain the slope k c and k e as polytropic exponents.
In order to predict the standard reference of the logarithmic p-V diagram under different operating conditions, the three-layer backpropagation (BP) neural network is used. The operating condition parameters are taken as the input features of the network, and the characteristic parameters characterizing the compressor operating process are taken as the output features. In this manner, the connection between the operating parameters and the operating process of the compressor can be established. As the operating process is a thermodynamic process, the polytropic exponent is affected by factors such as pressure conditions and heat exchange between the gas and cylinder wall [29]. Therefore, we consider selecting suction and exhaust temperature and pressure, along with cylinder wall temperature, as the key operating parameters that affect the polytropic exponent—these five parameters are considered input features. The output features are the expansion and compression polytropic exponent, which are predicted separately. For the hidden layer nodes, the number is determined to be 23 by trial and error. Figure 3 shows the structure of the final BP neural network model.
Due to the randomness of the initial weights and bias in the training of the BP neural network, it will converge to different local optimal solutions in different training processes. To solve this problem, The whale optimization algorithm (WOA) [30] is employed to optimize the initial weight and bias; the flow chart is illustrated in Figure 4. WOA is a meta-heuristic optimization algorithm based on the hunting behavior of humpback whales in nature, which has the advantages of fast convergence speed and strong global search ability. The WOA-BP neural network is used to obtain the predicted polytropic exponents under the corresponding operating conditions, then point 3 mentioned above is taken as the expansion starting point, point 1 is taken as the compression starting point, and the predicted polytropic exponents are taken as the slope. Then, the linear equation of the expansion and compression section can be obtained. The logarithmic volume values of the actual expansion and compression sections can be substituted into the linear equation to calculate each corresponding logarithmic pressure value. The expansion section terminates at the logarithmic line of suction pressure, while the compression section ends at the logarithmic line of exhaust pressure, and finally, the predicted expansion and compression process line is obtained. Further, the predicted p-V diagram of the same operating condition is obtained.

2.2. Preprocessing Method of Logarithmic p-V Diagram Difference

The tested logarithmic p-V diagram was generated into a fault-free logarithmic p-V diagram for the operating condition via the multi-condition prediction model. For the purpose of clarifying terminology, this paper designates the fault-free logarithmic p-V diagram as the standard logarithmic p-V diagram. It can be noted that in the normal operating state, compression and expansion segments of the tested and standard logarithmic p-V diagram are in good consistency, but great difference in the suction and exhaust process because of valve disc fluctuation and resistance loss. To quantify the disparities, the method computes the difference in the logarithm of the pressure between the tested logarithmic p-V diagram and the standard logarithmic p-V diagram of the same volume. Then, the method normalizes all differences using one-dimensional tiling and max–min normalization based on expansion, suction, compression, and exhaust processes, as described by Equations (3) and (4). After this method of preprocessing, each data sample is transformed into a sequence of logarithmic p-V diagram differences that reflect relative features.
= ln   p V ln   p V
where ln   p V is the pressure natural logarithm for volume V in the standard p-V diagram. ln   p V is the pressure natural logarithm for volume V in the tested p-V diagram.
i = i m i n m a x m i n
where i is the i-th number in .
Figure 5a shows the difference sequence curves of the p-V diagram under different normal operating conditions of the gas valve after difference processing. It can be seen that the difference curve can still maintain similar characteristics even under different operating conditions: In the normal state, its expansion and compression stages tend to be straight lines, and the suction and exhaust stages fluctuate somewhat. In the failure state, as shown in Figure 5b, the above four stages are different from the normal state, and the curves have different performances under different fault types. For example, when the valve leakage fault occurs, the waveforms in the expansion and compression stage will rise or fall sharply. When the valve spring fails, the fluctuation increases or decreases in the suction and exhaust stages. Therefore, this preprocessing method can fully reflect the abnormal characteristics of the p-V diagram and distinguish the normal and abnormal data. It also has the characteristics of reducing the dimension of the two-dimensional p-V diagram characteristics of pressure and volume to one dimension, which greatly improves the efficiency of subsequent calculation and processing.

2.3. Feature Extraction for Logarithmic p-V Diagram Difference Sequence

The Siamese neural network (SNN) includes two parallel, identical convolutional neural networks (CNNs) to extract features, followed by a function that quantifies the dissimilarity between the two feature vectors [31]. The proposed network enhances the discriminative power among different sample types while reducing intra-class variations, effectively grouping similar samples together thereby facilitating efficient similarity learning [32]. There are two types of SNN: the original network and the triplet network [33].
The Siamese neural network structure is shown in Figure 6. Pairs of samples, X 1 and X 2 , are input into two identical CNNs. Outputs G W X 1 and G W X 2 are obtained after CNNs. Then, the Euclidean distance D W X 1 , X 2 is computed as the distance between the samples. Furthermore, the contrastive loss function [34] is calculated to minimize the distance between the same samples and maximize it between different samples as much as possible.
D W X 1 , X 2 = i = 1 m x 1 i , x 2 i 2
where m is the number of sample pairs, X 1 and X 2 is the sample pair. To shorten notation, D W X 1 , X 2 is written D W . Then, the contrastive loss function is:
L W , Y , X 1 , X 2 = 1 2 1 Y D W 2 + 1 2 Y m a x 0 , m D W 2
where m is a margin. Y is a binary label assigned to the pair. If Y = 0, the samples are similar, and the parameters need to be adjusted to minimize the distance; if Y = 1, the samples are dissimilar, adjustments should be made to increase the distance to the margin if it is less than the margin, while no adjustments are necessary if the distance exceeds the margin.
Although the original SNN can learn the similarity between two samples (tested sample and positive or negative sample), the distance between positive and negative samples is not considered. If the distance between positive and negative samples is too small, the tested sample will fall into two categories instead of one. The triplet network learns the similarity between the two samples and also avoids gathering samples in a small area by constraining the distance using the triple-based loss function. The triplet SNN structure is shown in Figure 7.
The triplet network fed with three samples: anchor sample x, positive sample x + , and negative sample x [35]. They are put into three same networks with shared parameters and characteristics G W x , G W x + , and G W x are obtained. Then, the distance between D G W x , G W x + and D G W x , G W x is calculated, and backpropagation and parameter updating are carried out through the triple-based loss function, which can be expressed as:
L x , x + , x = m a x 0 , m + D G W x , G W x + D G W x , G W x
where m is a margin. The function can minimize the distance between x and x + and maximize the distance between x and x . Additionally, it facilitates the clustering of similar samples together while ensuring the segregation of dissimilar samples.
The choice of a negative sample influences the loss function in the case of the determination of anchor and positive sample. For example, if there are lots of easy triplets in the dataset, the parameters cannot be optimized since the loss function evaluates to zero. For randomly selected triplets, there are three possible cases illustrated in Table 1 according to loss function (7). G W x , G W x + , and G W x are succinctly abbreviated to A, P, and N. It can be concluded that easy triplets should be avoided during training. In order to improve the training effect, this paper adopts the online triplet strategy.
Firstly, the distance between the anchor samples and both the positive and negative samples should be calculated. Subsequently, the sum of the distance between each anchor-positive sample pair and a predefined margin value is calculated, subtracting from it the distance between that anchor-negative sample pair. This difference is referred to as the loss value. Finally, all sample triples with loss values greater than zero are identified as evaluated triples.

2.4. Classification

After the original data are processed using the preprocessing method, one-dimensional sequence data are used as input to SNN. In the design of CNN in SNN, since the data are a one-dimensional series, the convolution and pooling operations involved are all one-dimensional. The size of the convolutional kernel is an important parameter. A large convolution kernel can cover more input features and improve the model receptive field but increase the computational complexity and parameter number of the model. A small convolution kernel is suitable for capturing partial features and consumes fewer computing resources. In view of the limitation of computing power, this study aims to maximize the capture of local information, so convolution kernels of sizes 5 and 3 are selected, and the number is set to 128, 64, and 32, respectively. On this basis, the number of convolution layers and the selection of activation function are further determined by several experiments. To prevent the model from overfitting, Dropout layers are added after the convolution of the second and last layers, which enhances the model’s generalization performance by deactivating a portion of neurons in a certain proportion during forward propagation [36]. The structure parameter of the feature extraction network is shown in Table 2.
In addition to determining the structural parameters, the hyperparameters in the training process are also determined: a two-layer Dropout ratio of 0.2 and 0.1, a learning rate of 0.000167092, a threshold value of 4, a sample size of 5 for each class, and RMSprop as the chosen optimizer.
The following classification method is designed to complete the classification task, as shown in Figure 8. Firstly, the trained triplet SNN is used to compute the embedding features of each sample in the training set. Further, the Euclidean distance between each sample and other similar samples is calculated, and the maximum value of all distances is calculated, denoted as d m a x . Then, the embedding feature E m of the averaging is calculated for all samples of each class according to the Function (8).
E m = i = 1 n e i , 1 m n , i = 1 n e i , 2 m n i = 1 n e i , 11 m n
where E m is the embedding feature of the averaging of class m samples; n is the number of samples for each type; e i , 1 m is the value of the first position of the feature embedding array of the i-th sample in class m.
The tested samples are also input into the SNN to compute the embedding features and calculate the Euclidian distance between them and the average features of all kinds of samples in the training set. Subsequently, the minimum value of this Euclidean distance is determined. If the value is greater than α · d m a x , it is judged as an unknown fault; otherwise, the tested sample can be judged as the class with the smallest averaging Euclidian distance. The judgment logic is shown in Function (9).
l a b e l = u n k n o w n f a u l t , D m i n m > α d m a x m , D m i n m α d m a x
where D m i n m represents the minimum Euclidean distance between the embedding feature of the tested sample and the average embedding feature of class m samples in the training set. α is the margin.
The advantage of this approach lies in its ability to not only classify learned valve states but also detect and raise alarms for unlearned abnormal situations. This dual functionality reduces fault classification error rates and enhances the model’s robustness.

3. Experimental Setup and Data Acquisition

The test bench is composed of a compressor, tank, intake pressure and temperature regulation system, and sensor and data acquisition system, as displayed in Figure 9. A vertical two-cylinder single-acting, two-stage reciprocating compressor was modified for experimental study, and the parameters of it are listed in Table 3. In this paper, the first cylinder is used as the monitoring object for follow-up research. The data acquisition system uses the data acquisition card (model NIUSB6218) for high-speed acquisition of voltage signals within ±10 V. In order to monitor the signals required for the experiment, the high-frequency dynamic pressure sensor obtains the dynamic pressure signal of the primary cylinder, two pressure sensors monitor the primary suction and exhaust pressure, two temperature sensors monitor the suction and exhaust temperature, and the key phase sensor is used to identify the operating position of the piston.
The test bench uses open ring valves and realizes the simulated common faults of many types of valves by destroying and reforming the valve disc and spring, covering the main fault types in the use of valves (Table 4). Under the experimental conditions, the inadequate force of the suction valve spring results in a thermal process alteration in the cylinder, similar to valve leakage, leading to more pronounced suction valve leakage. Conversely, insufficient force of the exhaust valve spring shows minimal deviation from the normal state. Therefore, for the valve spring fault, this paper only considers the fault type of the spring force to be too large.
On the basis of determining the valve fault simulation scheme, the data collection of the valve under normal and fault conditions is carried out. The sampling rate of the compressor is 4128 Hz. Starting from the outer dead center of the piston, 360 data points are collected every turn of the crankshaft rotation, and the interval of each sampling period is 150 ms. When collecting the normal operation data, different intake air temperature (heater temperature is 25 °C, 55 °C, 45 °C, 55 °C, 65 °C, 75 °C, 85 °C, 95 °C, 105 °C, the intake temperature can be raised from 18 °C to 34 °C), intake air pressure (97~99 kPa, 99~101 kPa, 101~103 kPa), and cylinder wall temperature (30 °C, 40 °C, 50 °C) are set to simulate different operating conditions. In fault tests, the normal valve is substituted with a faulty valve while maintaining air intake conditions at room temperature and atmospheric pressure. Additionally, the initial temperature of the cylinder wall is also set to room temperature.
The cylinder dynamic volume, dynamic pressure, and the average of inlet temperature, inlet pressure, outlet pressure, outlet temperature, and cylinder wall temperature in a single cycle tested by the experiment are taken as a set of data. Due to the different durations of the compressor boost process under different conditions, the amount of data collected under various conditions is different. In order to balance the amount of data, 1000 groups of data are extracted under each condition by a random sampling method to build a data set. Through this method, 16 kinds of normal p-V diagrams under different operating conditions are obtained as a normal data set, and 10 kinds of p-V diagrams under different valve faults are used as a fault data set.
When building the normal logarithmic p-V diagram prediction model, we use the normal data set, which contains 1000 data points for each operating condition, for a total of 16,000 data points. In order to carry out model training, optimization, and testing, all of the data from the above 16 conditions were mixed together and randomly divided into the training set, verification set, and test set according to the ratio of 6:2:2. In fault feature extraction, we collected a total of 10,000 samples comprising 1000 samples for each of the 10 types of faults and randomly selected an additional 1000 samples from the normal data set. Using the normal logarithmic p-V diagram prediction model, each sample in the new data set is calculated according to the logarithmic p-V diagram difference processing method proposed above, and the relative characteristics of each sample are used as the input of SNN. Subsequently, the relative characteristics of each sample were divided into training (60%), validation (20%), and test sets (20%) according to a predefined ratio. The structure of the fault feature extraction data set is presented in Table 5.

4. Results and Discussion

4.1. Fault Classification Effect

We have selected the confusion matrix and the t-distributed stochastic neighbor embedding algorithm for the purpose of evaluating the effectiveness of fault classification. Figure 10 shows the confusion matrix for the test results of the proposed SNN-based classification method. It can be seen that for a total of 2200 tested samples of 11 categories, the classification accuracy reaches 100%, indicating that the fault classification model constructed in this paper has a good effect.
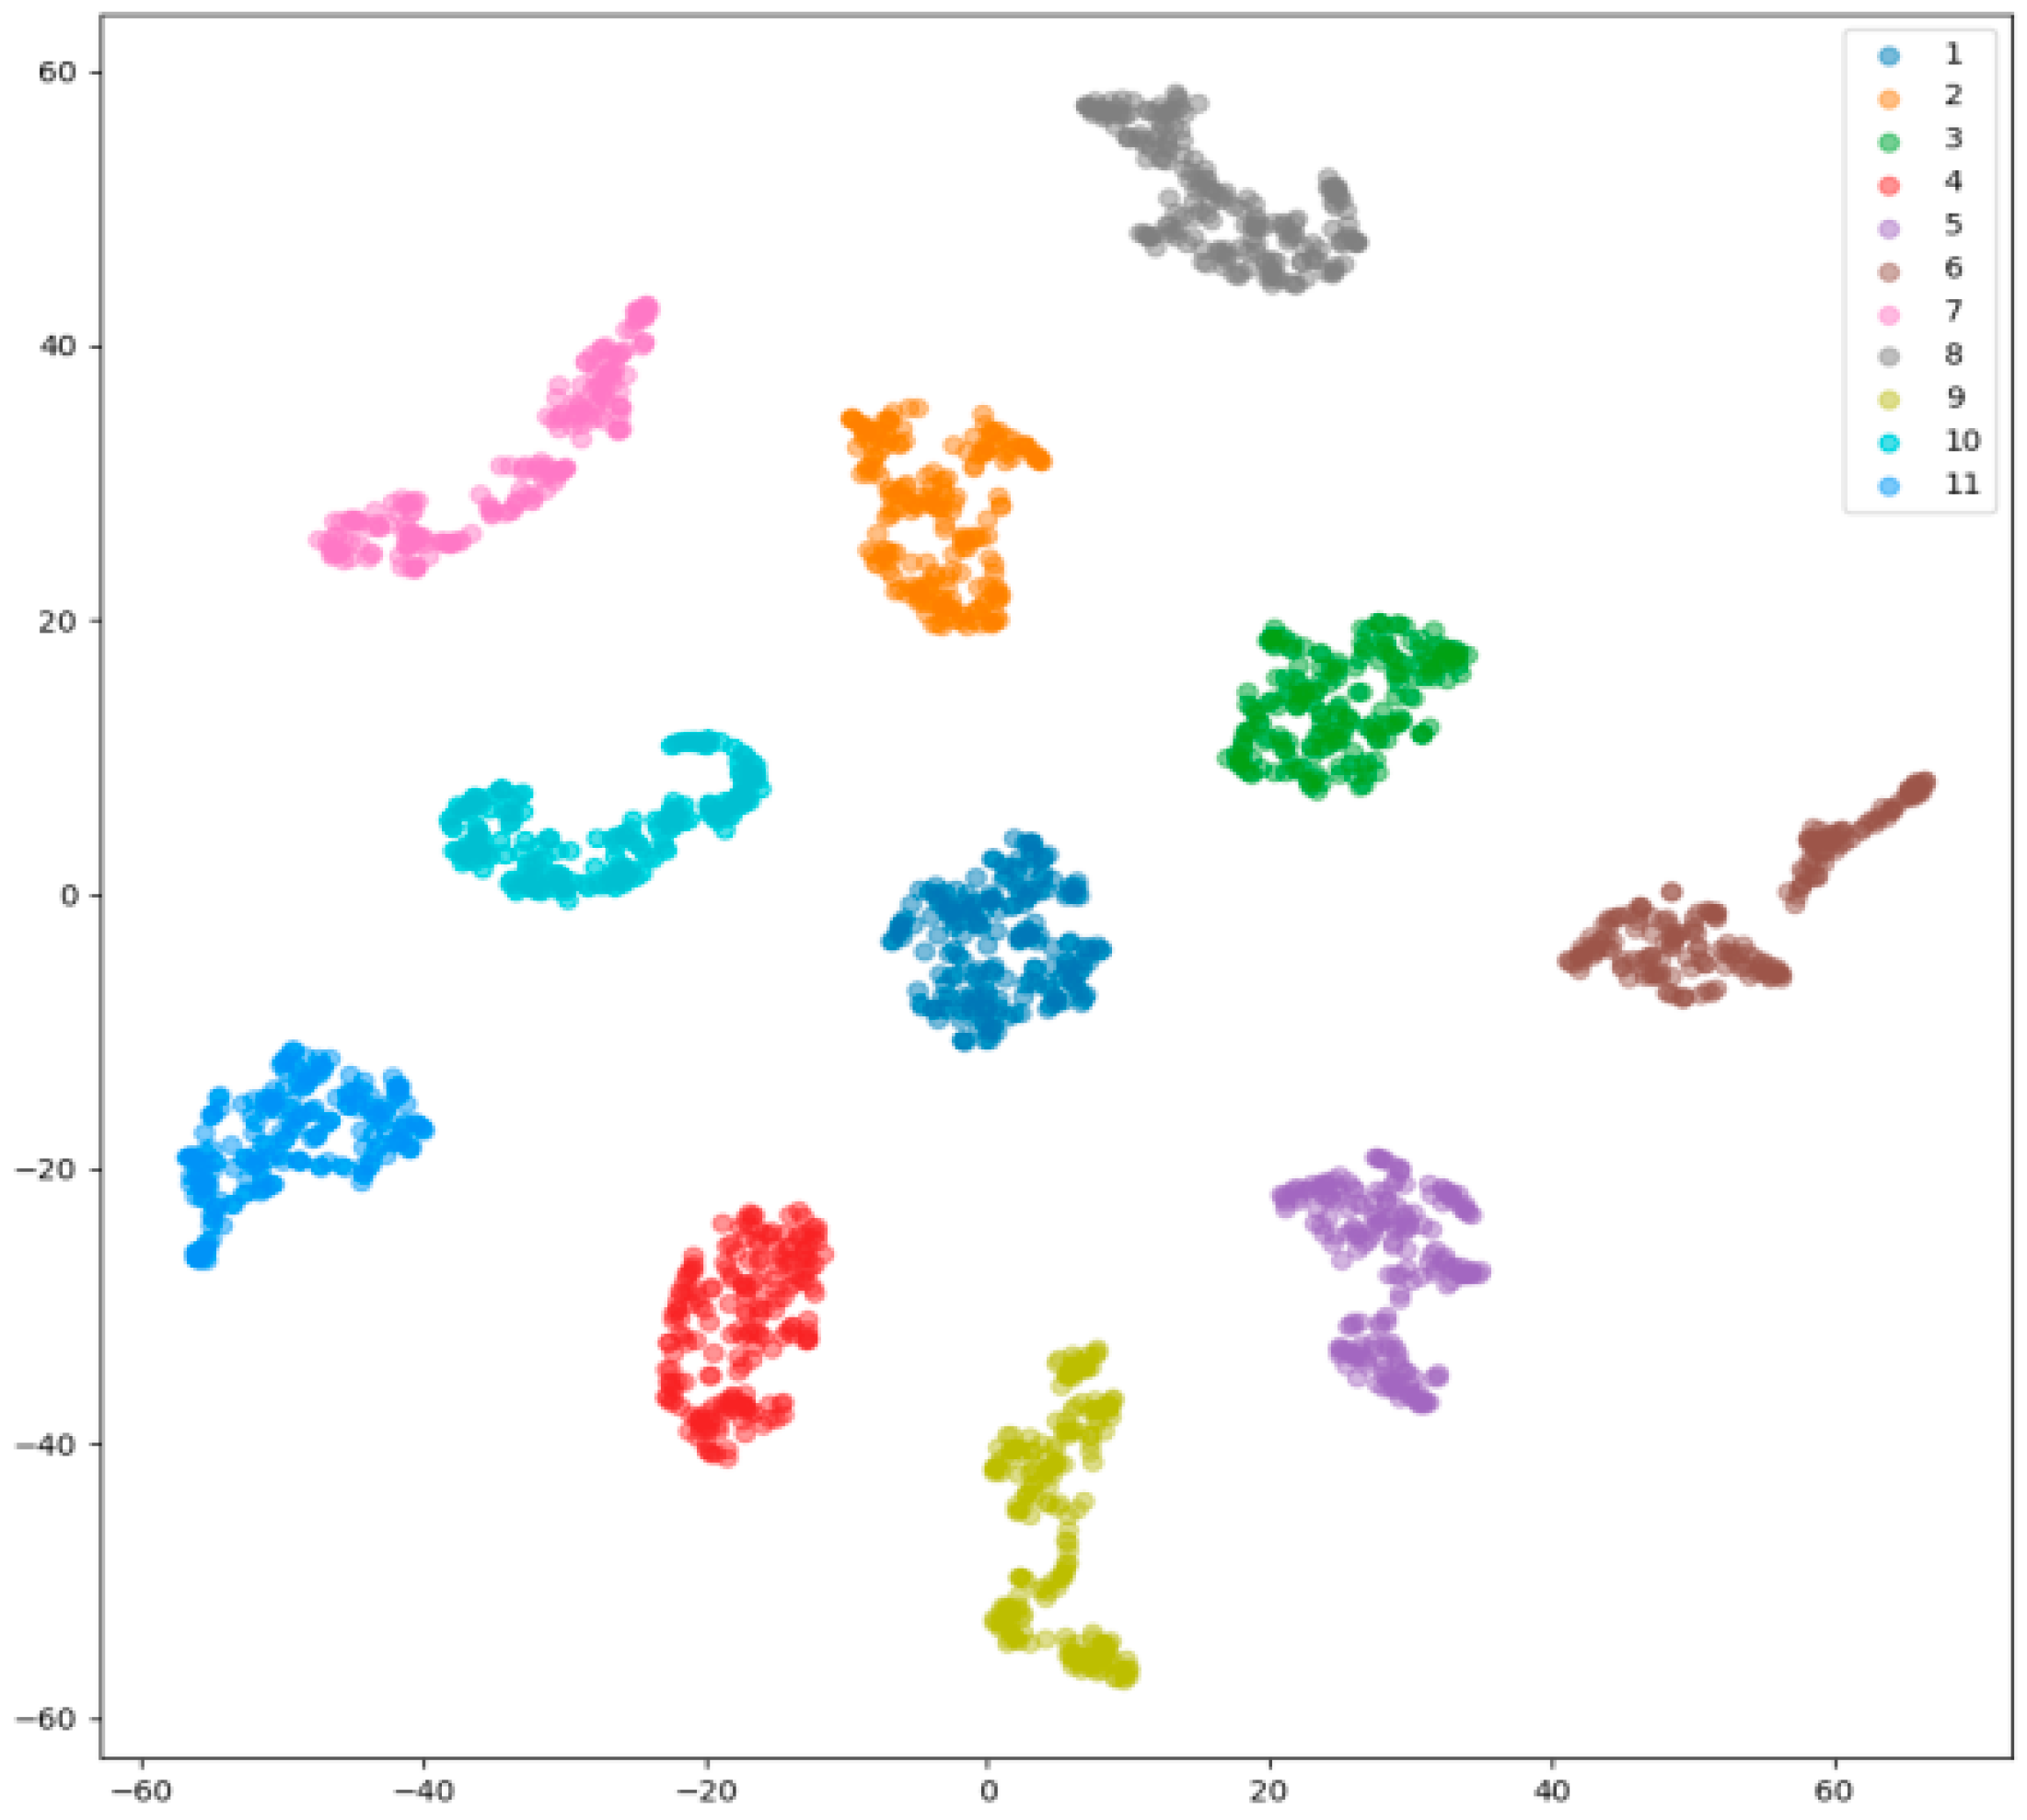
The t-distributed stochastic neighbor embedding algorithm visualizes the feature extraction capability of SNN. The relative features of the test set sample are processed by SNN to obtain the embedding feature, which is used as the input of the t-SNE algorithm and is reduced in dimension to two dimensions. As shown in Figure 11, the two-dimensional features of samples sharing the same valve state exhibit good cohesion. The boundary between samples having different valve states is distinct, and there is no phenomenon of feature overlap, which shows the effectiveness of the feature extraction network constructed in this paper and the superiority of the SNN training strategy.

4.2. Comparisons with Other Methods

In this section, the other three established methods were utilized to process the data of the test set, including Siamese neural network (SNN), convolutional neural network (CNN), and support vector machine (SVM). Among them, CNN uses the same structural parameters and hyperparameters as those of the feature extraction network in SNN and adopts the cross-entropy loss function and the SoftMax layer for the final classification. We utilized the original p-V diagram and logarithmic p-V diagram difference sequence as input and conducted five groups of training using the same data set for each collocation. The accuracy of the classification results is shown in Table 6, and the histogram compares the accuracy of the classification results, as presented in Figure 12.
In the five test groups, when using the same classification model, the accuracy of the test using logarithmic p-V diagram difference sequence as input is significantly higher than that using the original p-V diagram. Specifically, in SNN and CNN models, logarithmic p-V diagram difference sequences can be tested with 100% accuracy, while original p-V diagrams have relatively low accuracy. In the SVM model, the test accuracy of the logarithmic p-V diagram difference sequence is 99.86%, which is slightly lower than 100%, but the accuracy improvement is 25.59% compared to the original p-V diagram. This shows that the logarithmic p-V diagram difference sequence can reflect the fault features more effectively than the original p-V diagram. This advantage is mainly due to the improved logarithmic p-V diagram extraction method, which makes the predicted process line more closely fit the actual process line, thus significantly improving the test accuracy of the model.
In the case of using the same input type, the fault classification method established in this paper has advantages compared with the other two methods. Even with the original p-V diagram, the lowest fault classification accuracy is not less than 94%. When tested using logarithmic p-V diagram difference sequences, SNN and CNN performed equally with 100% accuracy. In contrast, SVM has a slightly lower test accuracy of 99.86%, but the difference is not significant.
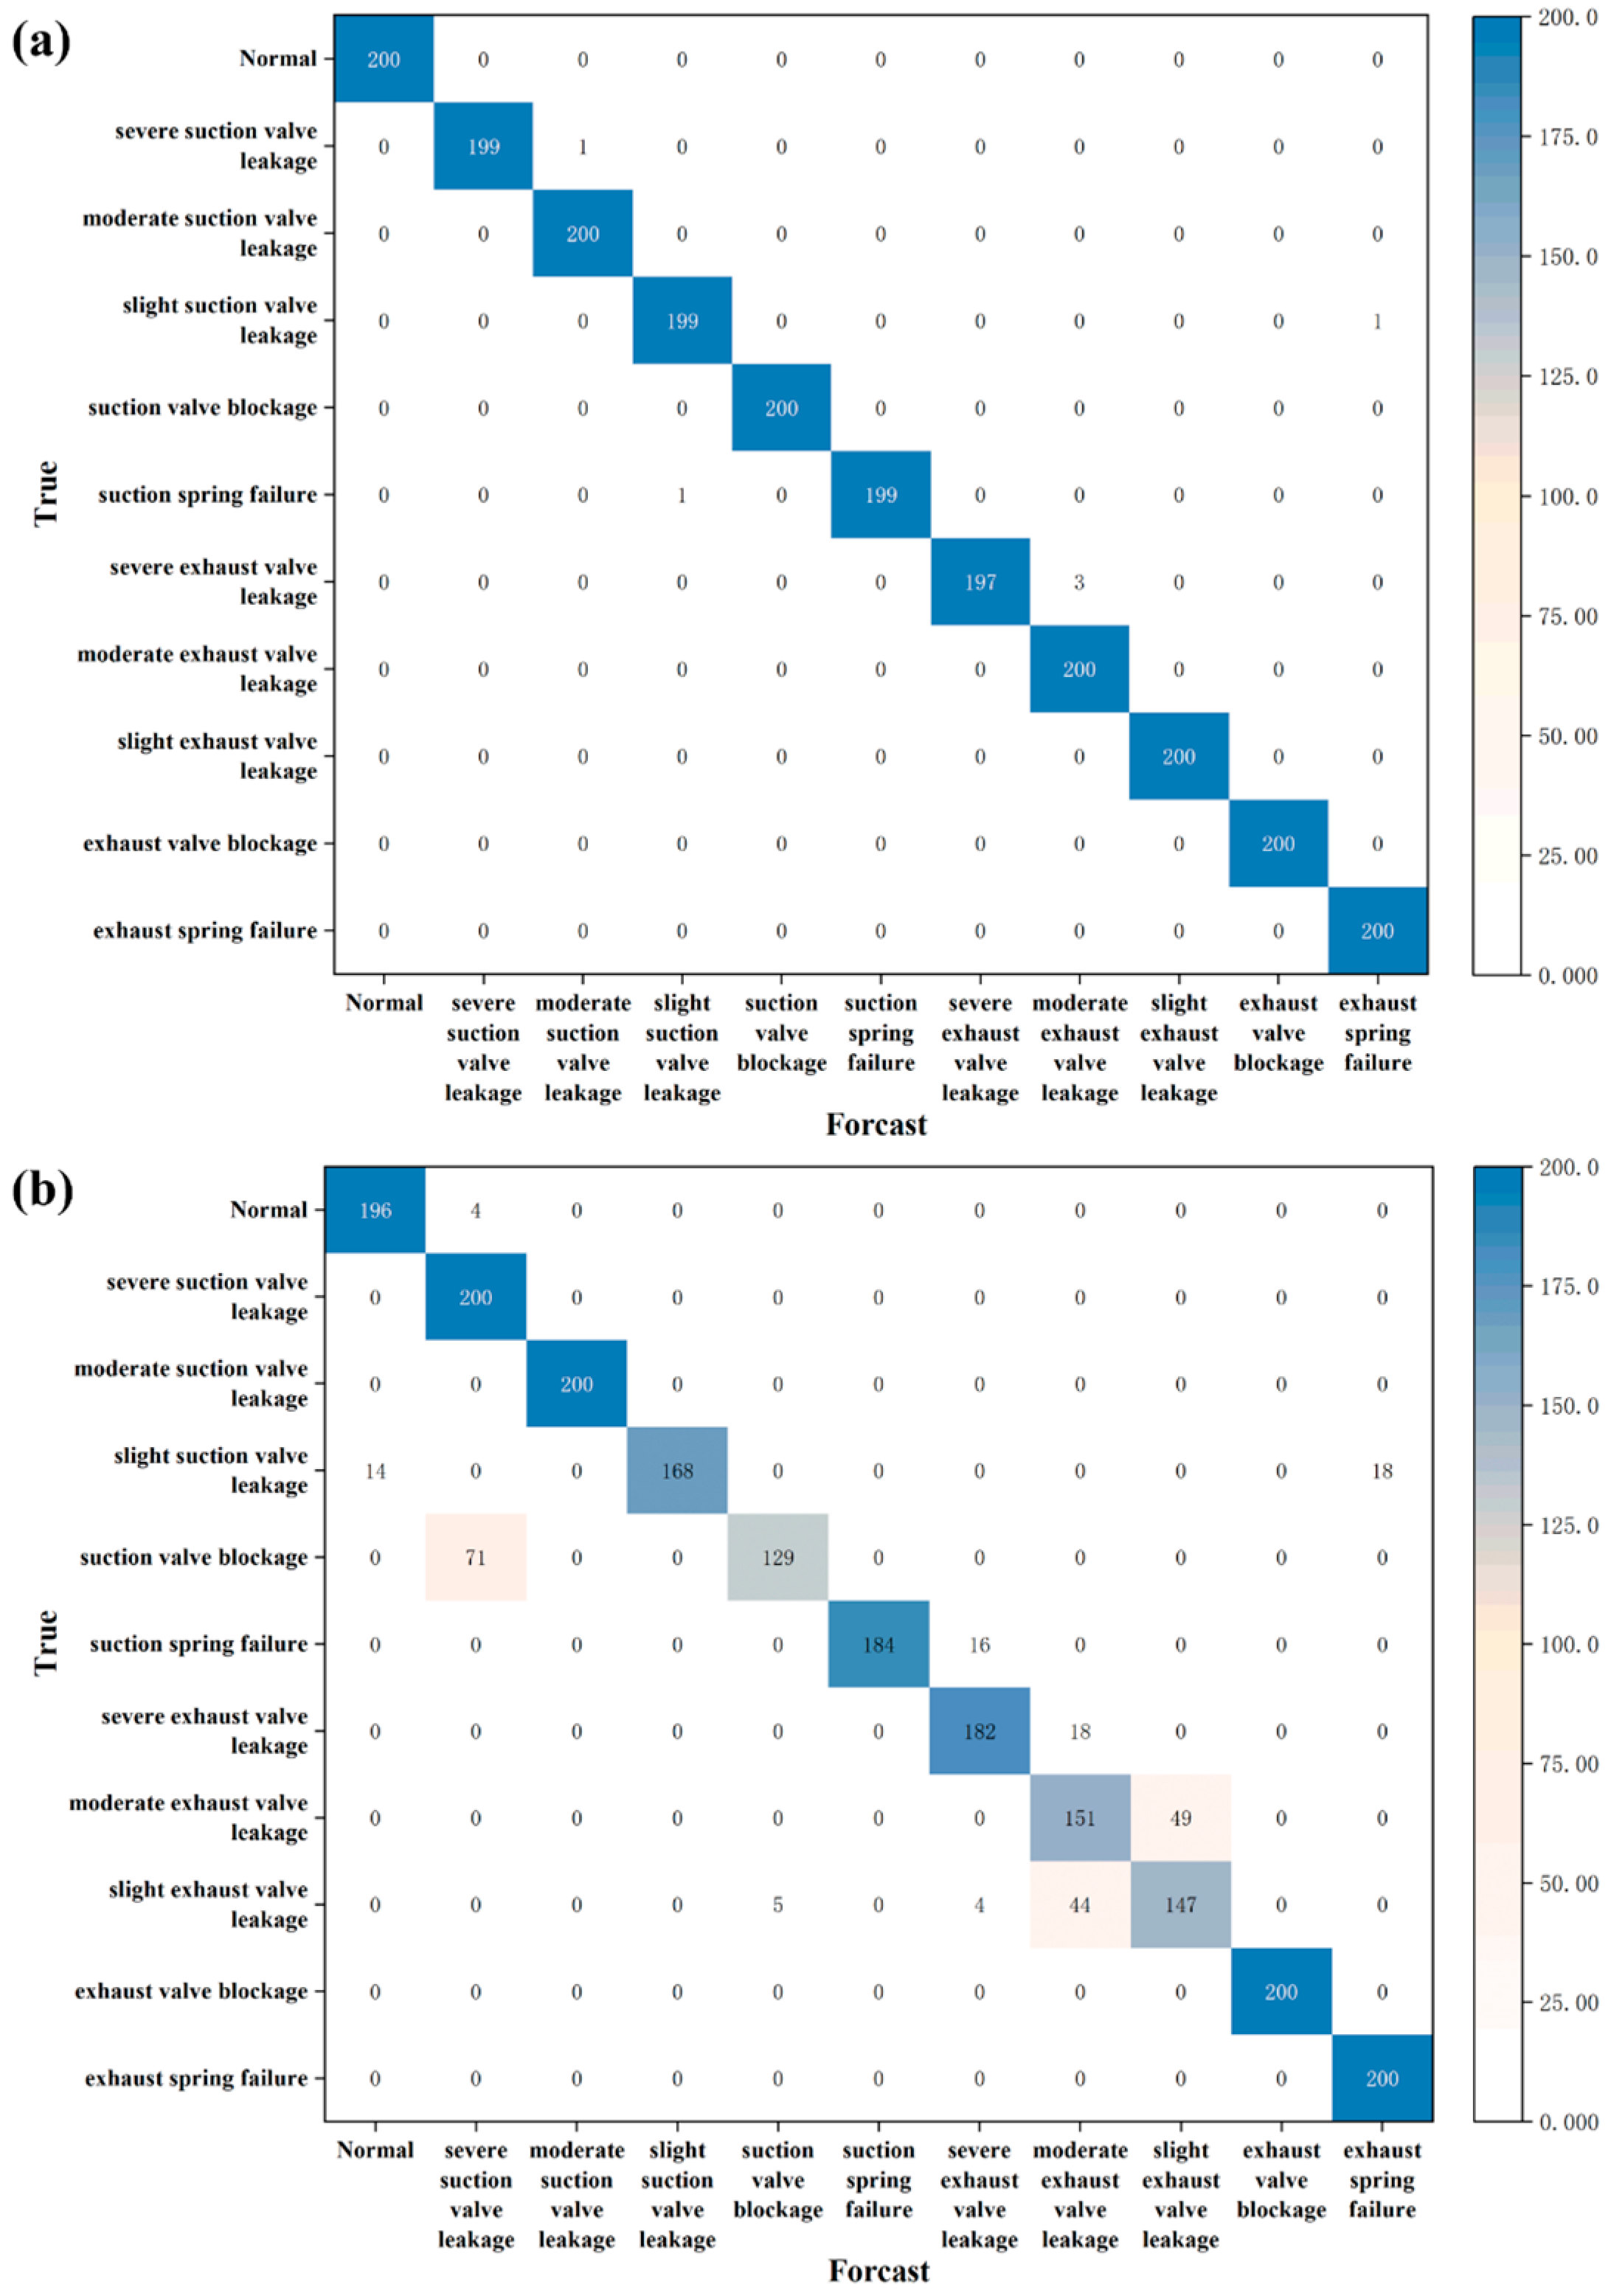
Since CNN and SNN share the same feature extraction network structure and hyperparameters, their differences lie in training strategies and classification methods. For further comparative analysis, the original p-V diagram was used as input. As can be seen from Figure 13, feature similarity is one of the main causes of misclassification when using CNN for prediction. Among the 244 misclassified samples, 129 were similar to the real category, accounting for 52.87%. In contrast, when using SNN for prediction, only four samples were misclassified into categories similar to the true category, which indicates that SNN alleviates the problem of feature similarity, and the number of misclassified samples has been greatly reduced. This is attributed to the fact that SNN uses the same feature extraction network as CNN; its training strategy is to cluster and widen the differences with other categories as much as possible, thus achieving a better classification effect.
To further compare the influence of different types of input on feature extraction, the feature vectors of logarithmic p-V diagram difference sequence and original p-V diagram in the test set are calculated by CNN. Subsequently, 11-dimensional feature vectors were obtained for each sample, and their dimensions were reduced to two using the t-SNE algorithm, as illustrated in Figure 14. Each type of sample can be grouped together by using CNN when taking the logarithmic p-V diagram difference sequence and the original p-V diagram as input. However, when the original p-V diagram is used as the input, although a certain clustering effect can be observed, the features of some mild faults are less different from those of normal samples on the original p-V diagram, resulting in partial overlap between these samples, thus reducing the classification accuracy. In contrast, this overlap is resolved when a logarithmic p-V diagram difference sequence is used as input. In the comparison in Figure 12, the accuracy difference between the two is as high as 20.32%.

5. Conclusions

This paper proposes a fault diagnosis approach for a reciprocating compressor based on the Siamese neural network, the acquisition method of logarithmic p-V diagram is innovatively improved, and a preprocessing method of logarithmic p-V diagram difference. This paper first uses the new p-V diagram acquisition method and a multi-condition prediction model to predict the logarithmic p-V diagram of the test condition, then uses the preprocessing method of taking the difference of the logarithmic p-V diagrams to transform the absolute features of the samples in the original p-V diagram data set into the relative features with obvious differences between normal and abnormal states. Afterward, the SNN utilized for feature extraction is constructed, which uses a one-dimensional convolutional layer network structure derived from a convolutional autoencoder as the feature extraction module. To mitigate overfitting, a dropout layer is incorporated. Additionally, a fully connected layer is introduced for feature compression. Since the SNN can not complete the classification task directly, the fault classification method is designed by processing the feature embedding of the network output.
The effectiveness of the proposed fault classification model was compared and analyzed, along with the superiority of the preprocessing method for differentiating logarithmic p-V diagrams. The results demonstrate that the fault classification method based on SNN achieves 100% accuracy. Additionally, a comparison was made between the feature performance of the difference sequences of the logarithmic p-V diagrams and original p-V diagrams after processing and dimensionality reduction using a feature extraction network within the same classification model. The results indicate that the proposed fault feature preprocessing method effectively highlights various fault features and contributes to enhancing fault classification outcomes.

Author Contributions

Conceptualization, Z.Z., W.W., W.C., Q.X., W.X., Q.L., J.W. and Z.L.; Methodology, Z.Z., W.W., W.C., Q.X., W.X., Q.L., J.W. and Z.L.; Software, J.W.; Data curation, J.W.; Writing—original draft, Z.Z. and J.W.; Writing—review & editing, Z.Z.; Visualization, W.W., W.C., Q.X., W.X., Q.L. and Z.L.; Supervision, W.W., W.C. and Q.X.; Project administration, W.W. All authors have read and agreed to the published version of the manuscript.

Funding

This research was funded by the National Natural Science Foundation of China (No. 52176050), and the General Program of Natural Science Foundation of Shandong Province (ZR2020ME174).

Data Availability Statement

Data are contained within the article.

Conflicts of Interest

Authors Wenbo Wang and Wenzheng Chen were employed by the company China Petroleum Technology and Development Corporation, author Qiang Xiao was employed by the company CNPC JCPC Chengdu Compressor Branch. The remaining authors declare that the research was conducted in the absence of any commercial or financial relationships that could be construed as a potential conflict of interest.

References

  1. Pichler, K.; Lughofer, E.; Pichler, M.; Buchegger, T.; Klement, E.P.; Huschenbett, M. Detecting cracks in reciprocating compressor valves using pattern recognition in the pV diagram. Pattern Anal. Appl. 2015, 18, 461–472. [Google Scholar] [CrossRef]
  2. Pichler, K.; Lughofer, E.; Pichler, M.; Buchegger, T.; Klement, E.P.; Huschenbett, M. Fault detection in reciprocating compressor valves under varying load conditions. Mech. Syst. Signal Process. 2016, 70, 104–119. [Google Scholar] [CrossRef]
  3. Frankt, P.M. Fault Diagnosis in Dynamic Systems Using Analytical and Knowledge-Based Redundancy a Survey and Some New Results; Pergamon Press, Inc.: Oxford, UK, 1990. [Google Scholar]
  4. Luo, K.; Huang, J.; Sun, S.; Guo, J.J.; Wang, X. Research on a generic diagnostic model for reciprocating compressors in a data-driven mode. Equip. Manag. Maint. 2014, 6, 60–64. [Google Scholar] [CrossRef]
  5. Miao, Z.C.; Gao, S.Y.; He, Z.M.; Ou, Y. Single-objective tracking algorithm based on Siamese networks. Chin. J. Liq. Cryst. Disp. 2023, 38, 256–266. [Google Scholar] [CrossRef]
  6. Zhao, X.; Liu, Y.; Han, G. Cooperative Use of Recurrent Neural Network and Siamese Region Proposal Network for Robust Visual Tracking. IEEE Access 2021, 9, 57704–57715. [Google Scholar] [CrossRef]
  7. An, N.; Yan, W.Q. Multitarget Tracking Using Siamese Neural Networks. ACM Trans. Multimed. Comput. Commun. Appl. 2021, 17, 1–16. [Google Scholar] [CrossRef]
  8. Osiecka-Drewniak, N.; Deptuch, A.; Urbanska, M. A Siamese neural network framework for glass transition recognition. Soft matter 2024, 20, 2400–2406. [Google Scholar] [CrossRef]
  9. Xue, Z.; Zhu, T.; Zhou, Y.; Zhang, M. Bag-of-Features-Driven spectral-spatial Siamese neural network for hyperspectral image classification. IEEE J. Sel. Top. Appl. Earth Obs. Remote Sens. 2023, 16, 1085–1099. [Google Scholar] [CrossRef]
  10. Zhan, T.; Song, B.; Xu, Y.; Wan, M.; Wang, X.; Yang, G.; Wu, Z. SSCNN-S: A Spectral-Spatial Convolution Neural Network with Siamese Architecture for Change Detection. Remote Sens. 2021, 13, 895. [Google Scholar] [CrossRef]
  11. Liu, B.; Yu, X.; Zhang, P.; Yu, A.; Fu, Q.; Wei, X. Supervised deep feature extraction for hyperspectral image classification. IEEE Trans. Geosci. Remote Sens. 2017, 56, 1909–1921. [Google Scholar] [CrossRef]
  12. Huang, Y.; Li, Y.; Heyes, T.; Jourjon, G.; Cheng, A.; Seneviratne, S.; Thilakarathna, K.; Webb, D.; Da Xu, R.Y. Task adaptive siamese neural networks for open-set recognition of encrypted network traffic with bidirectional dropout. Pattern Recognit. Lett. 2022, 159, 132–139. [Google Scholar] [CrossRef]
  13. Djamaluddin, M.; Munir, R.; Utama, N.P.; Kistijantoro, A.I. Open-Set profile-to-frontal face recognition on a very limited dataset. IEEE Access. 2023, 11, 65787–65797. [Google Scholar] [CrossRef]
  14. Liu, P.; Zhang, Y.; Ma, M.; He, Z.; Zhang, W. Open-Set Recognition Algorithm of Signal Modulation Based on Siamese Neural Network; Springer: Cham, Switzerland, 2022. [Google Scholar] [CrossRef]
  15. Tiboni, M.; Remino, C.; Bussola, R.; Amici, C. A review on vibration-based condition monitoring of rotating machinery. Appl. Sci. 2022, 12, 972. [Google Scholar] [CrossRef]
  16. Zhang, Y.; Ji, J.; Ma, B. Reciprocating compressor fault diagnosis using an optimized convolutional deep belief network. J. Vib. Control 2020, 26, 1538–1548. [Google Scholar] [CrossRef]
  17. Zhang, Y.; Ji, J. Intelligent fault diagnosis of a reciprocating compressor using mode isolation convolutional deep belief networks. IEEE/ASME Trans. Mechatron. 2020, 26, 1668–1677. [Google Scholar] [CrossRef]
  18. Yu, Z.; Zhang, B.; Hu, G.; Chen, Z. Early fault diagnosis model design of reciprocating compressor valve based on multiclass support vector machine and decision tree. Sci. Program. 2022, 2022, 1–7. [Google Scholar] [CrossRef]
  19. Medina, R.; Sánchez, R.-V.; Cabrera, D.; Cerrada, M.; Estupiñan, E.; Ao, W.; Vásquez, R.E. Scale-Fractal Detrended Fluctuation Analysis for Fault Diagnosis of a Centrifugal Pump and a Reciprocating Compressor. Sensors 2024, 24, 461. [Google Scholar] [CrossRef]
  20. Li, X.; Lin, T.; Yang, Y.; Mba, D.; Loukopoulos, P. Index similarity assisted particle filter for early failure time prediction with applications to turbofan engines and compressors. Expert Syst. Appl. 2022, 207, 118008. [Google Scholar] [CrossRef]
  21. Zhang, L.; Duan, L.; Hong, X.; Zhang, X. Fault diagnosis method of reciprocating compressor based on domain adaptation under multi-working conditions. In Proceedings of the 2021 IEEE International Conference on Mechatronics and Automation (ICMA), Takamatsu, Japan, 8–11 August 2021; pp. 588–593. [Google Scholar]
  22. Mondal, D.; Gu, F.; Ball, A.D. Condition Monitoring of a Reciprocating Air Compressor Using Vibro-Acoustic Measurements. In Proceedings of the IncoME-VI and TEPEN 2021: Performance Engineering and Maintenance Engineering; Springer International Publishing: Cham, Switzerland, 2022; pp. 615–628. [Google Scholar]
  23. Zhang, Z.; Chen, L.; Zhang, C.; Shi, H.; Li, H. GMA-DRSNs: A novel fault diagnosis method with global multi-attention deep residual shrinkage networks. Measurement 2022, 196, 111203. [Google Scholar] [CrossRef]
  24. Zhang, Y.; Ji, J.; Ma, B. Fault diagnosis of reciprocating compressor using a novel ensemble empirical mode decomposition-convolutional deep belief network. Measurement 2020, 156, 107619. [Google Scholar] [CrossRef]
  25. Zhang, J.; Duan, L.; Luo, S.; Li, K. Fault diagnosis of reciprocating machinery based on improved MEEMD-SqueezeNet. Measurement 2023, 217, 113026. [Google Scholar] [CrossRef]
  26. Lv, Q.; Cai, L.; Yu, X.; Ma, H.; Li, Y.; Shu, Y. An automatic fault diagnosis method for the reciprocating compressor based on HMT and ANN. Appl. Sci. 2022, 12, 5182. [Google Scholar] [CrossRef]
  27. Li, X.; Ren, P.; Zhang, Z.; Jia, X.; Peng, X. A p-V diagram based fault identification for compressor valve by means of linear discrimination analysis. Machines 2022, 10, 53. [Google Scholar] [CrossRef]
  28. Shen, W.D.; Tong, J.G. Thermodynamics of Engineering; Higher Education Press: Beijing, China, 2007; pp. 267–269. [Google Scholar]
  29. Dong, C.Q.; Liang, Z.; Tian, J.L.; Tian, F.; Li, X.R.; Li, S.S.; He, H.G. Determination of gas variability index for natural gas compressors. Compress. Technol. 2013, 4, 7–10. [Google Scholar] [CrossRef]
  30. Mirjalili, S.; Lewis, A. The Whale Optimization Algorithm. Adv. Eng. Softw. 2016, 95, 51–57. [Google Scholar] [CrossRef]
  31. Bromley, J.; Guyon, I.; LeCun, Y.; Säckinger, E.; Shah, R. Signature verification using a “Siamese” time delay neural network. Adv. Neural Inf. Process. Syst. 1993, 6, 737–744. [Google Scholar] [CrossRef]
  32. Serrano, N.; Bellogín, A. Siamese neural networks in recommendation. Neural Comput. Appl. 2023, 35, 13941–13953. [Google Scholar] [CrossRef]
  33. Hoffer, E.; Ailon, N. Deep metric learning using Triplet network. In Proceedings of the International Conference on Learning Representations, Banff, AB, Canada, 14–16 April 2014. [Google Scholar]
  34. Hadsell, R.; Chopra, S.; Lecun, Y. Dimensionality Reduction by Learning an Invariant Mapping. In Proceedings of the 2006 IEEE Computer Society Conference on Computer Vision and Pattern Recognition (CVPR’06), New York, NY, USA, 17–22 June 2006. [Google Scholar] [CrossRef]
  35. Wang, J.; Song, Y.; Leung, T.; Rosenberg, C.; Wu, Y. Learning fine-grained image similarity with deep ranking. In Proceedings of the IEEE Conference on Computer Vision and Pattern Recognition, Columbus, OH, USA, 23–28 June 2014; pp. 138–1393. [Google Scholar]
  36. Hinton, G.E.; Srivastava, N.; Krizhevsky, A.; Sutskever, I.; Salakhutdinov, R.R. Improving neural networks by preventing co-adaptation of feature detectors. arXiv 2012, arXiv:1207.0580. [Google Scholar]
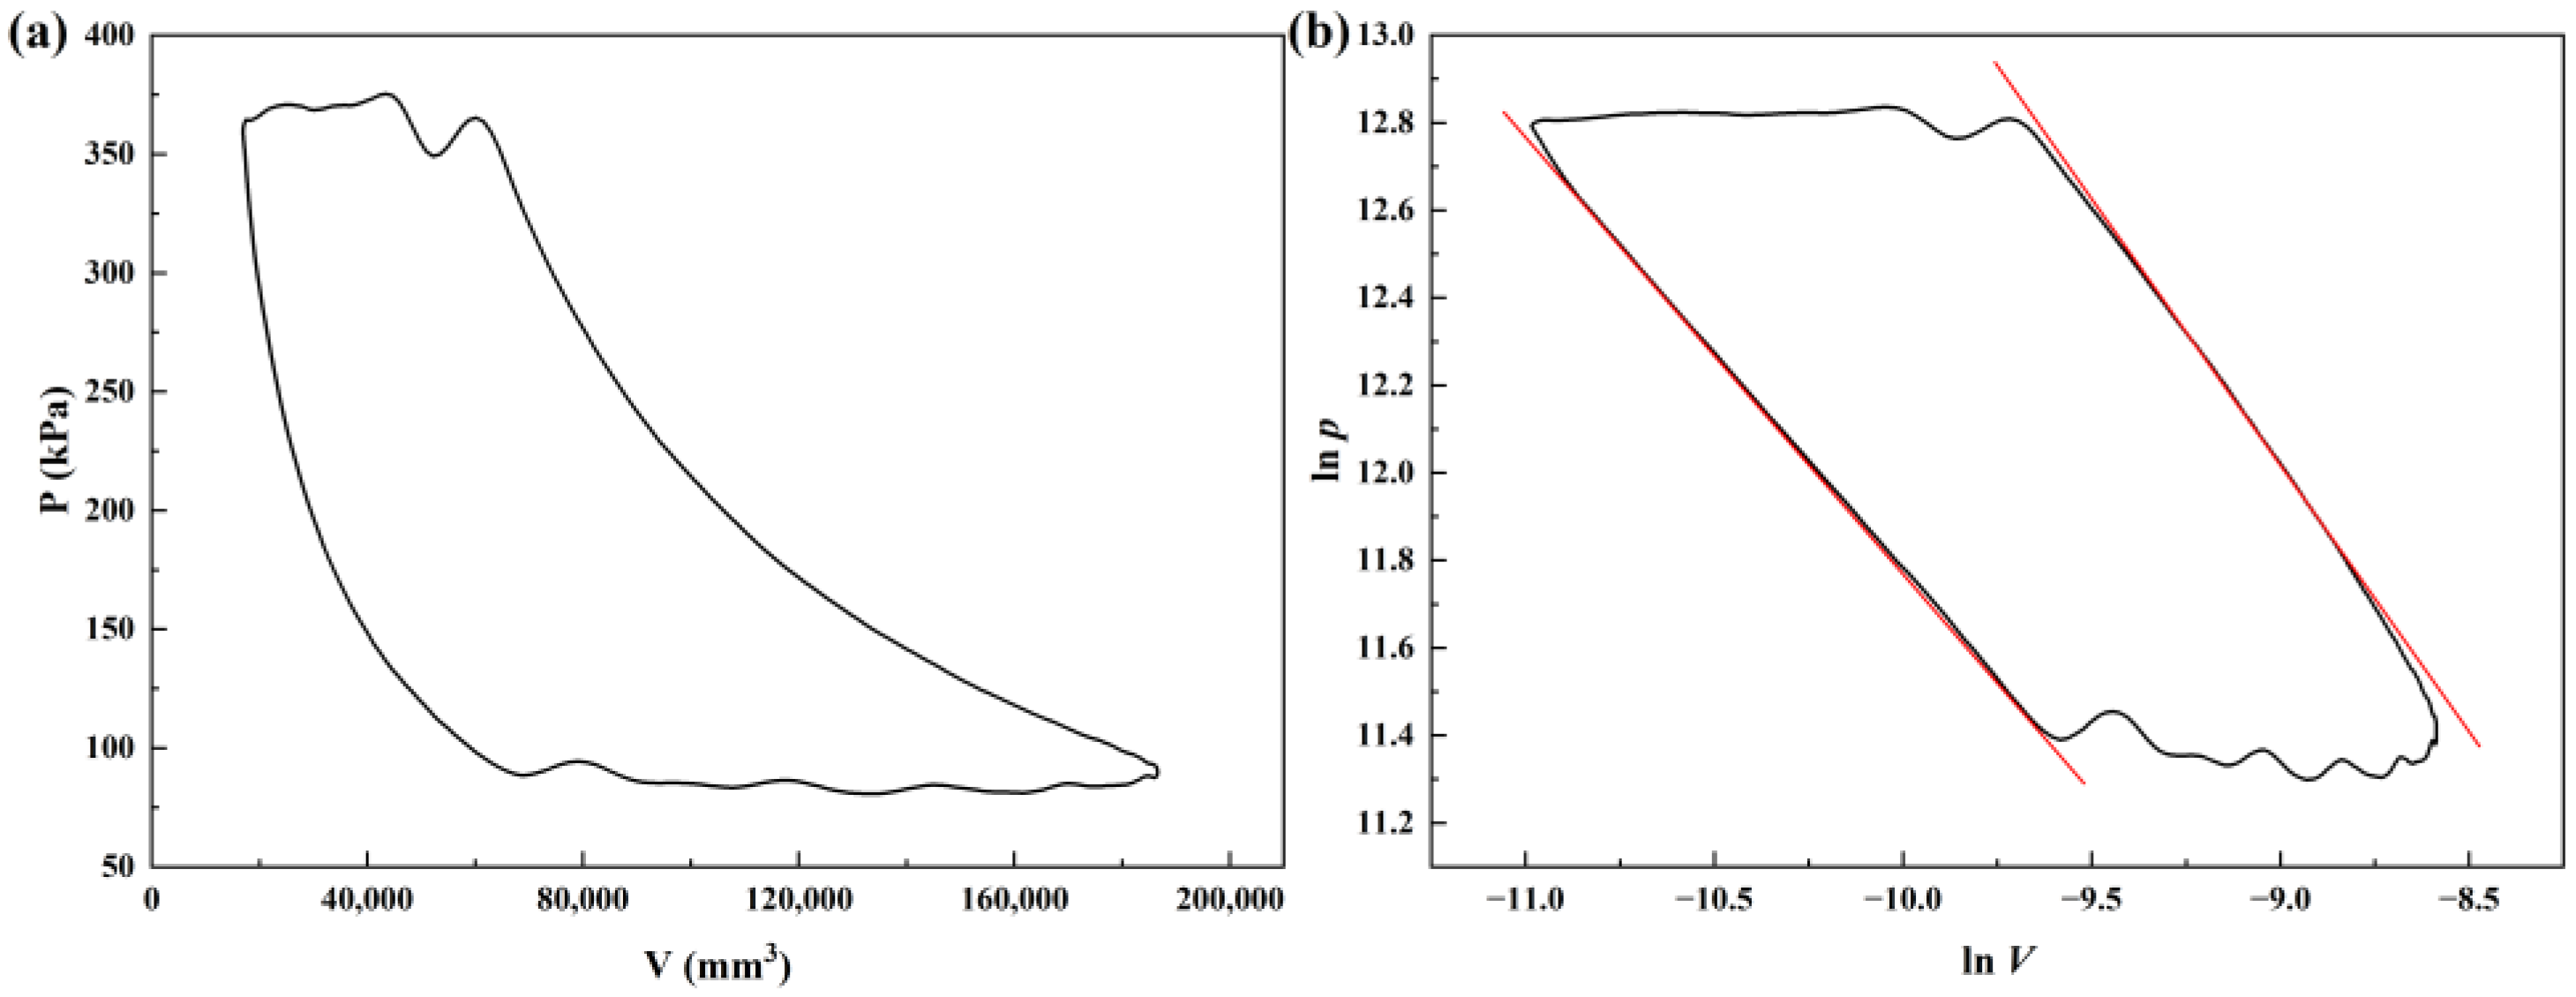
Figure 1. (a) The p-V diagram and (b) logarithmic p-V diagram. The red line represents the fitted process line to obtain the polytropic exponents.
Machines 13 00263 g001
Figure 2. Schematic diagram of simplified method for logarithmic p-V diagram polytropic exponents. Points 1, 2, 3, 4 are the points where the suction and exhaust pressure lines intersect with the p-V diagram.
Machines 13 00263 g002
Figure 3. BP neural network model structure. Different colored circles represent neurons: red—Input, green—Hidden, and blue—Output.
Machines 13 00263 g003
Figure 4. Flowchart of the WOA-BP.
Machines 13 00263 g004
Figure 5. Series curve of logarithmic p-V diagram under (a) different operating conditions and (b) faults.
Machines 13 00263 g005
Figure 6. The Siamese neural network structure.
Machines 13 00263 g006
Figure 7. Triplet Siamese neural network structure.
Machines 13 00263 g007
Figure 8. Flowchart of classification methods.
Machines 13 00263 g008
Figure 9. The test bench composed of compressor, tank, intake pressure and temperature regulation system, sensor, and data acquisition system.
Machines 13 00263 g009
Figure 10. Confusion matrix of prediction results.
Machines 13 00263 g010
Figure 11. Scatterplot of features after feature embedding.
Machines 13 00263 g011
Figure 12. Histogram of classification accuracy for different models and inputs.
Machines 13 00263 g012
Figure 13. Confusion matrix of (a) SNN and (b) CNN model using p-V diagram as input.
Machines 13 00263 g013
Figure 14. Scatterplot of features after CNN feature extraction and dimensionality reduction for different input types.
Machines 13 00263 g014
Table 1. Possible triplet cases.
Possible CasesCharacteristicSchematic Diagram
Easy tripletparameters cannot updateMachines 13 00263 i001
Hard tripletparameters can update
Semi-hard tripletparameters can update
Table 2. Parameter list of feature extraction network structure.
LayerKernel NumberKernel SizeActivation Function
convolutional layer1285PReLU
convolutional layer643PReLU
pooling layer-2-
dropout layer---
convolutional layer323PReLU
pooling layer-2-
dropout layer---
linear layer-1024PReLU
linear layer-512PReLU
linear layer-11-
Table 3. Parameters of main parts of the reciprocating compressor.
NameParameter
volume flow (m3/min)0.1
speed (rpm)688
inlet/outlet pressure (MPa)0/0.6
volume flow (m3/min)0.1
speed (rpm)688
inlet/outlet pressure (MPa)0/0.6
Table 4. Simulation of air valve failure.
Failure TypeSimulation MeasureDetail
leakagevalve plate trepanningsuction valverA * = 0.05%
rA = 0.17%
rA = 0.22%
exhaust valverA = 0.1%
rA = 0.15%
rA = 0.20%
blockagecatching addingsuction valveadd trepanning catching on valve seat
exhaust valveadd trepanning catching on lift limiter
spring failurelength changinglow elastic force10 mm spring truncated to 5 mm
high elastic force10 mm spring is replaced with an 18 mm spring of the same material and diameter
* rA: opening area ratio.
Table 5. Dataset structure.
Valve ConditionTag
normal1
severe leaking suction valve2
moderate leaking suction valve3
slight leaking suction valve4
blocked suction valve5
spring failure suction valve6
severe leaking exhaust valve7
moderate leaking exhaust valve8
slight leaking exhaust valve9
blocked exhaust valve10
spring failure exhaust valve11
Table 6. Classification accuracy under different models and inputs.
NumberLogarithmic p-V Diagram Difference Sequencep-V Diagram
SNNCNNSVMSNNCNNSVM
110010099.8695.8185.5974.27
210010099.8699.4079.6874.27
310010099.8699.7288.9574.27
410010099.8695.7283.2374.27
510010099.8694.0088.0974.27
Disclaimer/Publisher’s Note: The statements, opinions and data contained in all publications are solely those of the individual author(s) and contributor(s) and not of MDPI and/or the editor(s). MDPI and/or the editor(s) disclaim responsibility for any injury to people or property resulting from any ideas, methods, instructions or products referred to in the content.