1. Introduction
The rapid electrification of public transportation has introduced new paradigms in vehicle propulsion, particularly regarding reliability, efficiency, and safety [
1,
2]. As cities increasingly transition to electric mobility, buses equipped with dual-drive systems have become a cornerstone of sustainable urban infrastructure [
3,
4]. This evolution necessitates rigorous investigations into the design, control, and optimization of electric powertrains to ensure robust performance under diverse conditions [
5,
6]. Among these technologies, dual-drive architectures with synchronous motors present specific challenges and opportunities in control complexity, dynamic response, and thermal behavior [
7,
8,
9].
The integration of advanced control methodologies, such as fuzzy logic-based algorithms, requires systematic evaluation of their adaptability within transmission control units [
10,
11]. Thermal management of electric motors also remains critical, directly influencing efficiency, durability, and safety [
12,
13,
14]. We have already discussed the possible ways to measure and calculate waste heat in our previous IEEE paper [
1]. This paper addresses these issues as a follow-up to the previous IEEE paper [
1] by developing a simulation model that combines dynamic control strategies with comprehensive heat loss analysis, providing insight into the interaction between control optimization and thermal behavior in dual-drive buses [
1,
15]. In systems with two synchronous machines, precise heat loss calculation is essential due to compounded thermal interactions. Accurate thermal modeling prevents overheating, ensures stability, and preserves system integrity [
9,
16,
17]. Here, the drive is embedded within a transmission designed to maintain operation within the optimal efficiency region on the torque–speed curve [
2,
18,
19]. This approach maximizes efficiency and stabilizes thermal behavior, improving both service life and consistency [
20].
The highly dynamic nature of urban traffic—frequent acceleration, deceleration, and low-speed operation—imposes additional thermal and mechanical stress [
21,
22,
23]. These challenges necessitate adaptive control mechanisms and robust thermal management to sustain drivetrain efficiency and passenger safety under varying load profiles [
24,
25,
26]. Accordingly, combined analysis of control strategy effectiveness, traffic influence, and heat generation is vital for resilient and energy-efficient dual-drive systems [
27,
28].
A further focus of this research is the selection of synchronous motors as traction units. These machines provide superior torque density, high efficiency, and excellent controllability under demanding load conditions, making them well suited for public transport [
29,
30,
31]. Their ability to sustain constant rotational speed across load variations supports consistent performance, while their compatibility with modern algorithms, such as fuzzy and adaptive logic, enables efficient multi-motor integration [
32,
33,
34]. High efficiency across a broad operating range reduces thermal stress and energy consumption, thereby extending driving range and component life [
35,
36,
37]. Thus, adopting synchronous machines is not merely a technical choice but a strategic decision aligned with the requirements of low-emission, high-efficiency bus propulsion [
38,
39,
40].
The paper is structured as follows:
Section 2 presents the methodology for heat loss and efficiency analysis in a dual-drive drivetrain, including the simulation model and experimental investigations.
Section 3 addresses modeling of transport phenomena based on the similarity theory.
Section 4 introduces mathematical models of heat conduction and thermal propagation, with emphasis on machine and coupling behavior.
Section 5 discusses experimental evaluation of thermal loading in couplings, supported by thermographic measurements. The conclusion summarizes the findings and highlights the practical and environmental significance of the proposed methodology.
2. Methodology of Thermal and Efficiency Analysis in Dual-Drive Systems
This study employs a comprehensive methodological approach to investigate the operational efficiency and thermal performance of electric dual-drive systems equipped with synchronous electrical motors. The research framework integrates advanced modeling, simulation, and experimental validation to ensure both theoretical rigor and practical relevance [
1,
2].
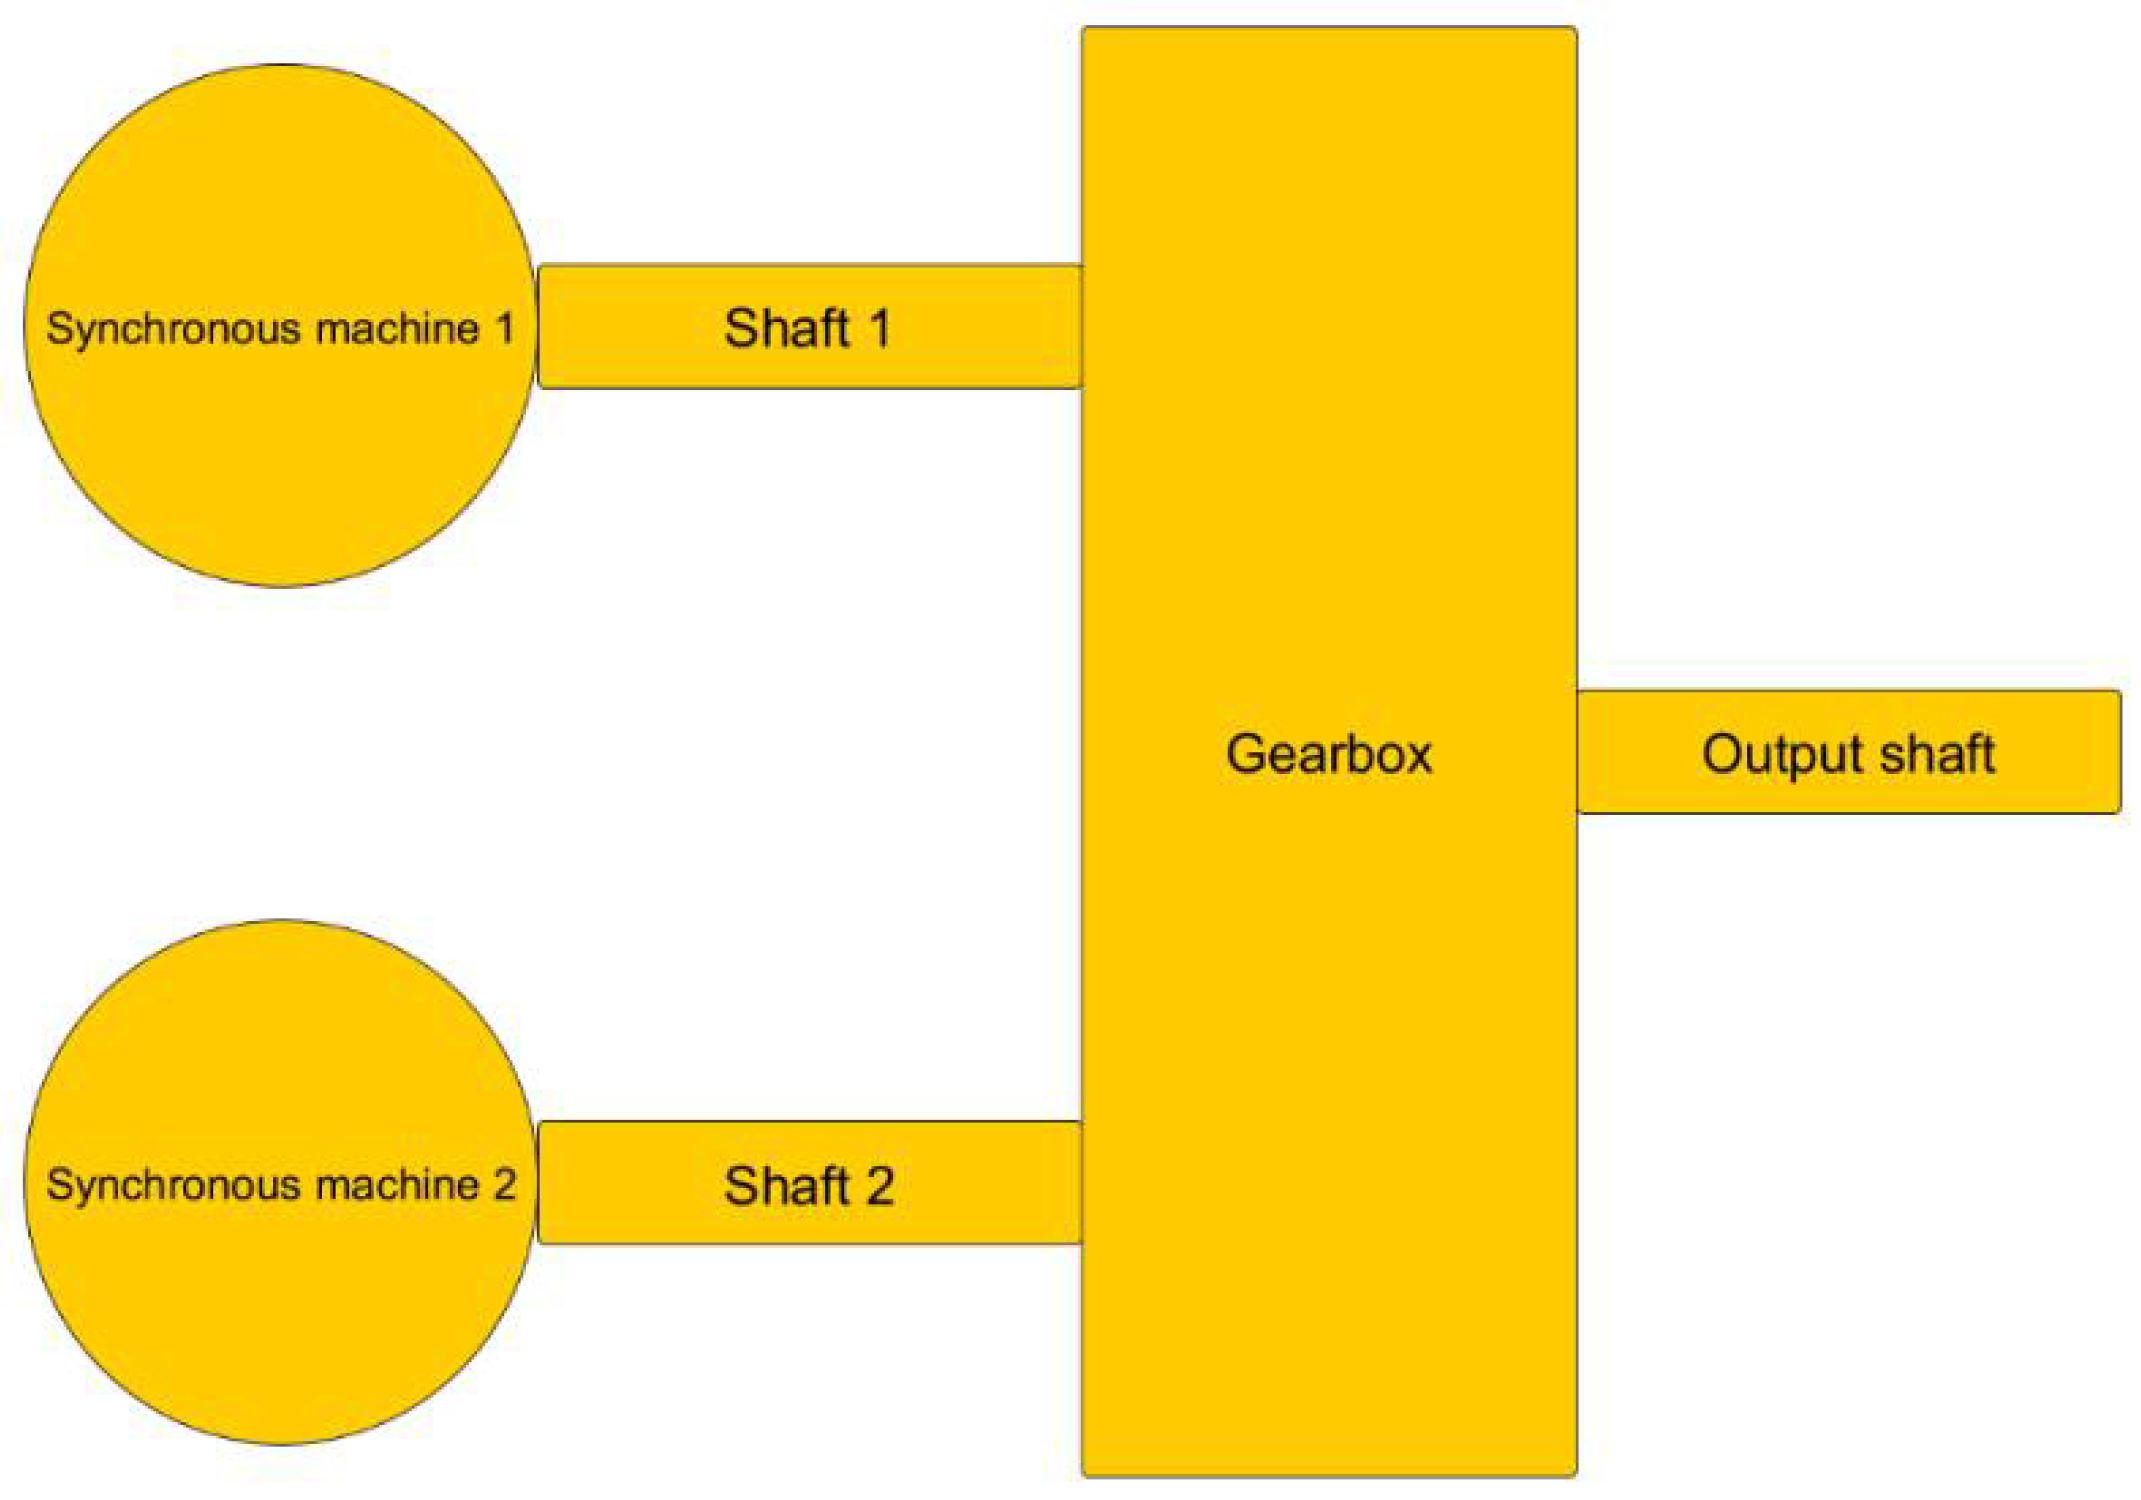
First, a detailed simulation model of the dual-drive system was developed using MATLAB Simulink R2024b. The drivetrain consists of two synchronous traction motors connected via a specialized transmission system designed to operate consistently within the optimal efficiency range of the torque–speed characteristic curve [
2,
3]. The control strategy includes a Fuzzy Logic-based decision-making unit within the transmission control unit, which dynamically selects gear ratios based on driving conditions and system load [
4]. To enhance drivetrain protection, a torque-limiting safety algorithm was implemented to prevent overspeed scenarios, supplemented by a supervisory override function during gear-shift events [
5,
6].
To validate the simulation model, extensive experimental investigations were conducted on a custom dynamometer test bench. Both synchronous motors were subjected to variable load profiles simulating typical urban driving conditions, including stop-and-go sequences and rapid acceleration–deceleration cycles [
7]. During these tests, real-time temperature measurements were recorded using embedded high-accuracy thermal sensors positioned at key locations on the motor housings, stator windings, and transmission casings [
8,
9].
The experimental results were analyzed using the principles of similarity theory and thermodynamic analogy, which are widely applied in heat transfer and fluid flow modeling [
10,
11]. This framework facilitated accurate modeling of heat generation, conduction, convection, and energy accumulation in rotating components under transient operating regimes [
12,
13]. The thermal loss behavior observed in the experimental setup aligns with prior numerical models established for synchronous motor assemblies [
14].
A core methodological innovation of this study is the direct integration of heat loss data into the gear-shifting logic. The thermal maps derived from simulation and test data were embedded in the fuzzy inference system, enabling adaptive gear selection not only based on torque efficiency but also thermal state estimation [
9,
15]. This dual-criterion approach offers real-time control advantages by optimizing drivetrain performance while maintaining thermal safety margins in high-load situations.
Overall, this multi-layered methodology—encompassing modeling, hardware-in-the-loop validation, and thermal-aware control logic—constitutes a robust framework for developing intelligent control strategies in electric public transportation systems [
16].
3. Transport Phenomena Modeling Based on Similarity Theory in Dual Synchronous Drives
The thermal analysis conducted in this study is grounded in the rigorous mathematical framework provided by similarity theory, which serves as a fundamental pillar in the dimensional analysis and modeling of transport phenomena [
21,
22]. By applying the principles of similarity, complex thermodynamic systems can be systematically reduced to simplified, dimensionless formulations that preserve the governing physical relationships of the original system [
23,
24]. In the context of heat transfer and energy dissipation in electric drives, similarity theory enables the prediction of transient and steady-state temperature fields under dynamically varying operational conditions, while accounting for key mechanisms such as conduction, convection, and localized thermal storage [
12,
13].
The theoretical foundation of this approach is based on the Buckingham π-theorem [
26,
41], which states that any physically meaningful equation involving a set of dimensional variables can be equivalently expressed using a reduced number of independent dimensionless groups [
21,
27]. In thermal systems characterized by n physical variables and k fundamental dimensions (such as mass, length, time, and temperature), the resulting number of π-groups is (n-k), providing a compact yet physically consistent representation of the governing equations [
28,
29]. This methodology is particularly relevant for heat propagation modeling in electromechanical systems, where multi-scale thermal behavior and geometrical complexity would otherwise render direct numerical evaluation inefficient or intractable [
9,
15].
Moreover, the application of similarity principles is extended in this work by incorporating Onsager’s reciprocal relations, which describe coupled transport processes and analogical symmetry in irreversible thermodynamic systems [
21,
30]. According to Onsager’s theorem, the time derivative of any extensive quantity (e.g., internal energy or entropy) is directly proportional to the spatial gradient of the corresponding intensive quantity (e.g., temperature or chemical potential), scaled by the conductance coefficient and flow geometry [
31,
32]. This theoretical formalism provides a valuable bridge between the macroscopic description of thermal fields and the microscopic understanding of transport fluxes in materials and machine components [
33,
34].
Extensive quantities—those that scale with system mass or volume—are particularly relevant in the modeling of electric motors and drivetrains, where mass-dependent energy accumulation contributes significantly to overall thermal dynamics [
35,
36]. This analytical framework thus facilitates the interpretation and generalization of thermal measurement data from real-world experiments, supporting the development of predictive models applicable to a wide range of electric vehicle architectures and operating environments [
2,
20].
3.1. Short-Time Fourier Transform as a Complement to Similarity-Based Heat Transfer Modeling
In the study of heat transfer phenomena, the application of similarity theory provides a robust framework for reducing complex thermal processes to dimensionless forms that preserve the underlying physical principles. This abstraction is particularly valuable when investigating non-stationary thermal responses, as it allows for generalized interpretations across scales and materials. However, to complement such theoretical approaches, advanced signal-processing techniques are required to capture the transient and localized nature of thermal behavior observed in experimental measurements.
The Short-Time Fourier Transform (STFT) is a mathematical tool used to analyze the frequency content of non-stationary signals by applying the Fourier Transform over short, overlapping segments of the signal [
42]. In the context of thermographic measurements, where temperature fields can exhibit transient or periodic variations under dynamic excitation, the STFT provides valuable time–frequency information for characterizing localized thermal processes. Mathematically [
42]:
where x(τ) is the input temperature signal (or temperature variation in a pixel over time), ω(τ − t) is a sliding window function, centered at time t, ω is the angular frequency, X(t, ω) describes the spectral content of the signal at time t.
3.2. Application in Thermographic Measurements
In infrared thermography and lock-in thermography, temperature signals often contain periodic components induced by external excitations (e.g., modulated heat sources, cyclic loading, or pulsed laser heating). The STFT enables the following:
In thermographic measurements, particularly in infrared and lock-in thermography, temperature signals often contain periodic components induced by external excitations such as modulated heat sources, cyclic loading, or pulsed laser heating. The application of the Short-Time Fourier Transform enables the identification and characterization of these thermal responses in both the time and frequency domains. By detecting periodic heat sources, the STFT makes it possible to differentiate between background temperature drift and active heating signals. Moreover, it facilitates the analysis of transient thermal behavior, capturing rapid fluctuations during short heating or cooling cycles and providing insight into frequency-dependent penetration depth, which is closely related to thermal diffusivity.
A further advantage of this approach lies in its ability to reveal material defects. Local anomalies such as delaminations, voids, or cracks produce characteristic frequency-domain signatures in the thermal response, and the STFT allows these signatures to be isolated with higher precision than traditional time-domain evaluations. In addition, the method contributes to noise reduction, since dominant thermal frequency bands can be separated from stochastic background variations, thereby improving the signal-to-noise ratio. Overall, the use of STFT in thermographic analysis enhances defect detection, supports accurate thermal modeling, and strengthens the interpretability of experimental results by linking localized frequency information with the underlying heat transfer processes.
The Short-Time Fourier Transform [
43] serves as one such tool, enabling the time–frequency decomposition of thermal signals obtained from infrared thermography or lock-in thermography experiments. While similarity theory offers dimensionless scaling laws for conduction, convection, and energy dissipation, the STFT provides a direct method for quantifying how these processes manifest dynamically in the measured temperature field. Together, these approaches establish a link between theoretical modeling and experimental observation [
44] similarity theory ensures physical consistency across systems, whereas STFT enhances the interpretability of transient data by isolating periodic and localized frequency components. This synergy is particularly relevant in thermographic analysis of electric drive systems and material defect detection, where both theoretical generalization and precise experimental evaluation are essential.
3.3. Comparative Time–Frequency Signal Processing Methods for Thermographic Data
While the Short-Time Fourier Transform (STFT) has been widely applied in the analysis of non-stationary thermal signals [
45] obtained from thermographic measurements, several alternative transformations exist that may provide complementary insights. Among these, the Wavelet Transform (WT), the Hilbert–Huang Transform (HHT), and the Wigner–Ville Distribution (WVD) represent notable approaches for capturing the time–frequency dynamics of temperature signals under transient thermal excitation [
46].
The Wavelet Transform offers a multi-resolution analysis framework, allowing simultaneous characterization of both slowly varying thermal drifts and rapid transient fluctuations. This property is particularly advantageous in thermographic data, where long-term heating trends may overlap with localized, short-duration effects. The Hilbert–Huang Transform, based on empirical mode decomposition, provides an adaptive decomposition of the signal into intrinsic mode functions, making it highly suitable for irregular or non-linear thermal responses often observed in heterogeneous materials and complex boundary conditions. The Wigner–Ville Distribution yields a high-resolution representation of thermal processes in the joint time–frequency domain, without reliance on windowing. However, the method is often affected by cross-term interference, which can obscure the interpretation of thermographic signals in experimental practice.
Compared to these methods, the STFT offers a balance between interpretability, computational efficiency, and robustness. Its fixed time–frequency resolution, governed by the choice of analysis window, limits its ability to simultaneously resolve both very short and very long thermal events. Nevertheless, the simplicity of its implementation and its proven performance in applications such as defect detection and lock-in thermography render it a practical choice in experimental studies. By contrast, wavelet-based approaches are preferable when both fine temporal detail and long-term thermal trends must be captured, while HHT is particularly effective for non-linear, irregular thermal responses. WVD provides sharper localization of transient events but is less commonly applied in thermographic practice due to the presence of spurious cross-terms [
47].
Overall, these transformations represent complementary tools for the interpretation of thermographic data. Their selection should be guided by the specific thermal process under investigation, the excitation type employed, and the desired balance between resolution, robustness, and physical interpretability. In this way, advanced time–frequency analysis methods extend the capability of similarity-theory-based models by offering experimental verification and improved understanding of complex heat transfer dynamics in electric drive systems and material diagnostics.
4. Thermal Loss Modeling and Mathematical Formulation
Heat conduction is one of the fundamental modes of thermal energy transfer in engineering and physical sciences. In many applications, heat transfer processes can be simplified by assuming steady-state conditions, where temperature remains constant over time. One-dimensional steady-state heat conduction represents a core case in which thermal energy flows along a single spatial axis under uniform material properties. This assumption simplifies the governing differential equations, allowing analytical solutions across a range of boundary conditions and configurations [
4,
9].
The analysis of one-dimensional conduction is particularly relevant for understanding the thermal behavior of elements such as rods, plates, pipes, and extended surfaces (fins). It provides the foundation for more complex formulations involving multi-dimensional geometries or transient effects [
13,
14]. In this context, Fourier’s law of heat conduction establishes the relationship between heat flux and temperature gradient, expressed in both Cartesian and cylindrical coordinates to accommodate different geometries [
20,
29]. Common boundary conditions include fixed temperature, specified surface heat flux, or convective exchange with surrounding media [
23,
30].
In this study, emphasis is placed on applying one-dimensional steady-state conduction theory to electric drives. These systems, including motors, inverters, and power electronics, are subject to internal heat generation from electrical resistance, hysteresis, and eddy currents [
17,
18]. Without proper thermal management, such losses may cause local overheating, insulation degradation, and eventual failure.
Accurate thermal modeling is therefore essential to ensure reliability and performance. The framework used here applies directly to components such as stator cores, windings, housings, and heat sink structures [
19,
20]. By applying one-dimensional conduction principles, engineers can evaluate resistance paths, assess gradients, and optimize cooling configurations to improve efficiency and durability in electric drivetrain applications [
5,
6].
This methodology supports the design of compact, high-performance cooling systems in both industrial and vehicle-integrated drives, where spatial constraints and thermal loading require precise predictive capability [
7,
26]. Moreover, combining analytical conduction models with experimental validation and computational fluid dynamics (CFD) enhances the fidelity of thermal management strategies [
8,
10].
4.1. Temperature Distribution and Gradient Analysis
Heat is transferred by conduction when there are temperature differences between various points within a body. In general, the temperature can vary with both spatial coordinates (x, y, and z) and time (τ). The analytical study of heat conduction primarily focuses on examining the variation in temperature in space and time, as well as on formulating the governing equations that describe this behavior [
21]:
which is the mathematical expression of the temperature field. Equation (2) represents a set of temperatures at all points of the space at any given time.
The temperature field expressed by Equation (2) is referred to as transient or non-steady temperature field. If the temperature in the space does not change with time, the temperature field is a function of the space coordinates only and it is referred to as a steady state.
Mathematically, it is expressed as [
21]:
and
The temperature fields represented by Equations (2) and (4) are three-dimensional fields since they are function of three coordinates [
21].
A temperature field, which is a function of two coordinates, say, x and y, is termed as two-dimensional and is described by the following equation [
21]:
and
Similarly for a one-dimensional case, the equation of temperature field is:
and
If different points of the body having the same temperature are joined, we obtain an isothermal surface. Intersection of such isothermal surfaces by a plane gives a family of isotherms on this plane. The isotherms corresponding to distinct temperature levels ±δt.
The temperature gradient is a vector normal to the isothermal surface. Mathematically, it is the derivative in this direction [
21]:
where
is the unit vector normal to the isothermal surface and
is the temperature derivative along the normal.
Accordingly, the components of the normal heat flow
are:
where the negative sign indicates that the heat flow is in the direction of negative temperature gradient [
21].
The vector representing the rate of heat flow is [
21]:
The vector q at a point is along a path normal to the isothermal surface at that point.
4.2. Extended Heat Conduction Models with Focus on Shaft Coupling Heating in Electric Drives
In the following, we extend our analysis to two-dimensional steady-state heat conduction in solid bodies, assuming the absence of internal heat generation. The temperature distribution in such systems is governed by the Laplace equation, which provides the fundamental mathematical framework for describing steady-state thermal behavior in two dimensions [
21].
Once the temperature distribution within the solid has been determined as a function of the spatial coordinates x and y, the corresponding components of the heat flux in the x- and y-directions at any given point can be calculated using the appropriate form of Fourier’s law of heat conduction [
21].
The rate of heat flow at the point is the resultant of the components q
x and q
y [
21]:
It follows, therefore, that in order to evaluate the heat flow within the solid, it is essential to first determine the temperature field throughout the domain. Consequently, the task of computing the heat transfer reduces to solving Equation (14). Several established analytical and numerical techniques are commonly employed for obtaining solutions to this equation. Solution variants:
Mathematical analysis (analytical solution), Graphical analysis, Method of analogy, Numerical solutions using either a finite-difference or finite-element method [
21].
4.3. Unsteady-State Thermal Conduction in Solids
When a solid body is suddenly subjected to an environment with a different temperature, it does not reach thermal equilibrium instantly. Instead, it takes a certain amount of time for the temperature within the body to stabilize. This final, stable condition is known as the steady state, which was discussed in earlier chapters.
In contrast, this section focuses on the transient or unsteady-state heat conduction—namely, the process of heating or cooling that occurs before equilibrium is achieved. In this unsteady phase, the temperature within the solid varies not only with position but also with time. Such scenarios are highly relevant, as they commonly arise in a wide range of industrial applications [
16].
From a practical standpoint, transient heat conduction problems can generally be classified into two main categories: Those in which the body approaches thermal equilibrium over time, and those in which the body is exposed to temperature variations that are periodic in nature [
21].
Consider a solid body in which the temperature can be assumed to remain uniform throughout its entire volume at any given moment in time. This assumption is approximately valid for materials that possess very high thermal conductivity in combination with a low convective heat transfer coefficient at the surface. In some cases, even small-sized bodies with relatively low thermal conductivity may fulfill this condition due to their limited thermal mass. For the purposes of analysis, this situation is often idealized by assuming the body has infinite thermal conductivity, thereby eliminating internal temperature gradients. This simplified approach to analyzing transient heat conduction is known as the lumped heat capacity method [
21].
where [
21]:
h: is the convection heat transfer coefficient;
As: is the surface area of the body;
t: is the temperature of the body at any instant;
t∞: is the temperature of the ambient fluid;
c: is the specific heat of the body;
: is the density of the material of the body;
is the mass of the body of volume V;
is the rate of change in temperature of the body;
If the body initially has a uniform temperature t
i at time
s = 0, its temperature at any later time
s can be obtained by performing an integration of the corresponding equation [
21].
or
The constant of integration C
1 can be found from the condition that t = t
i at τ = 0. Following
Lumped heat capacity analysis is important because it simplifies the calculation of heat transfer in cases where temperature differences within the body can be neglected. This allows for quick and efficient estimation of temperature changes over time, especially for small-sized or highly conductive objects, making it valuable in engineering design and industrial applications [
21].
4.4. Application Example for Thermal Transients
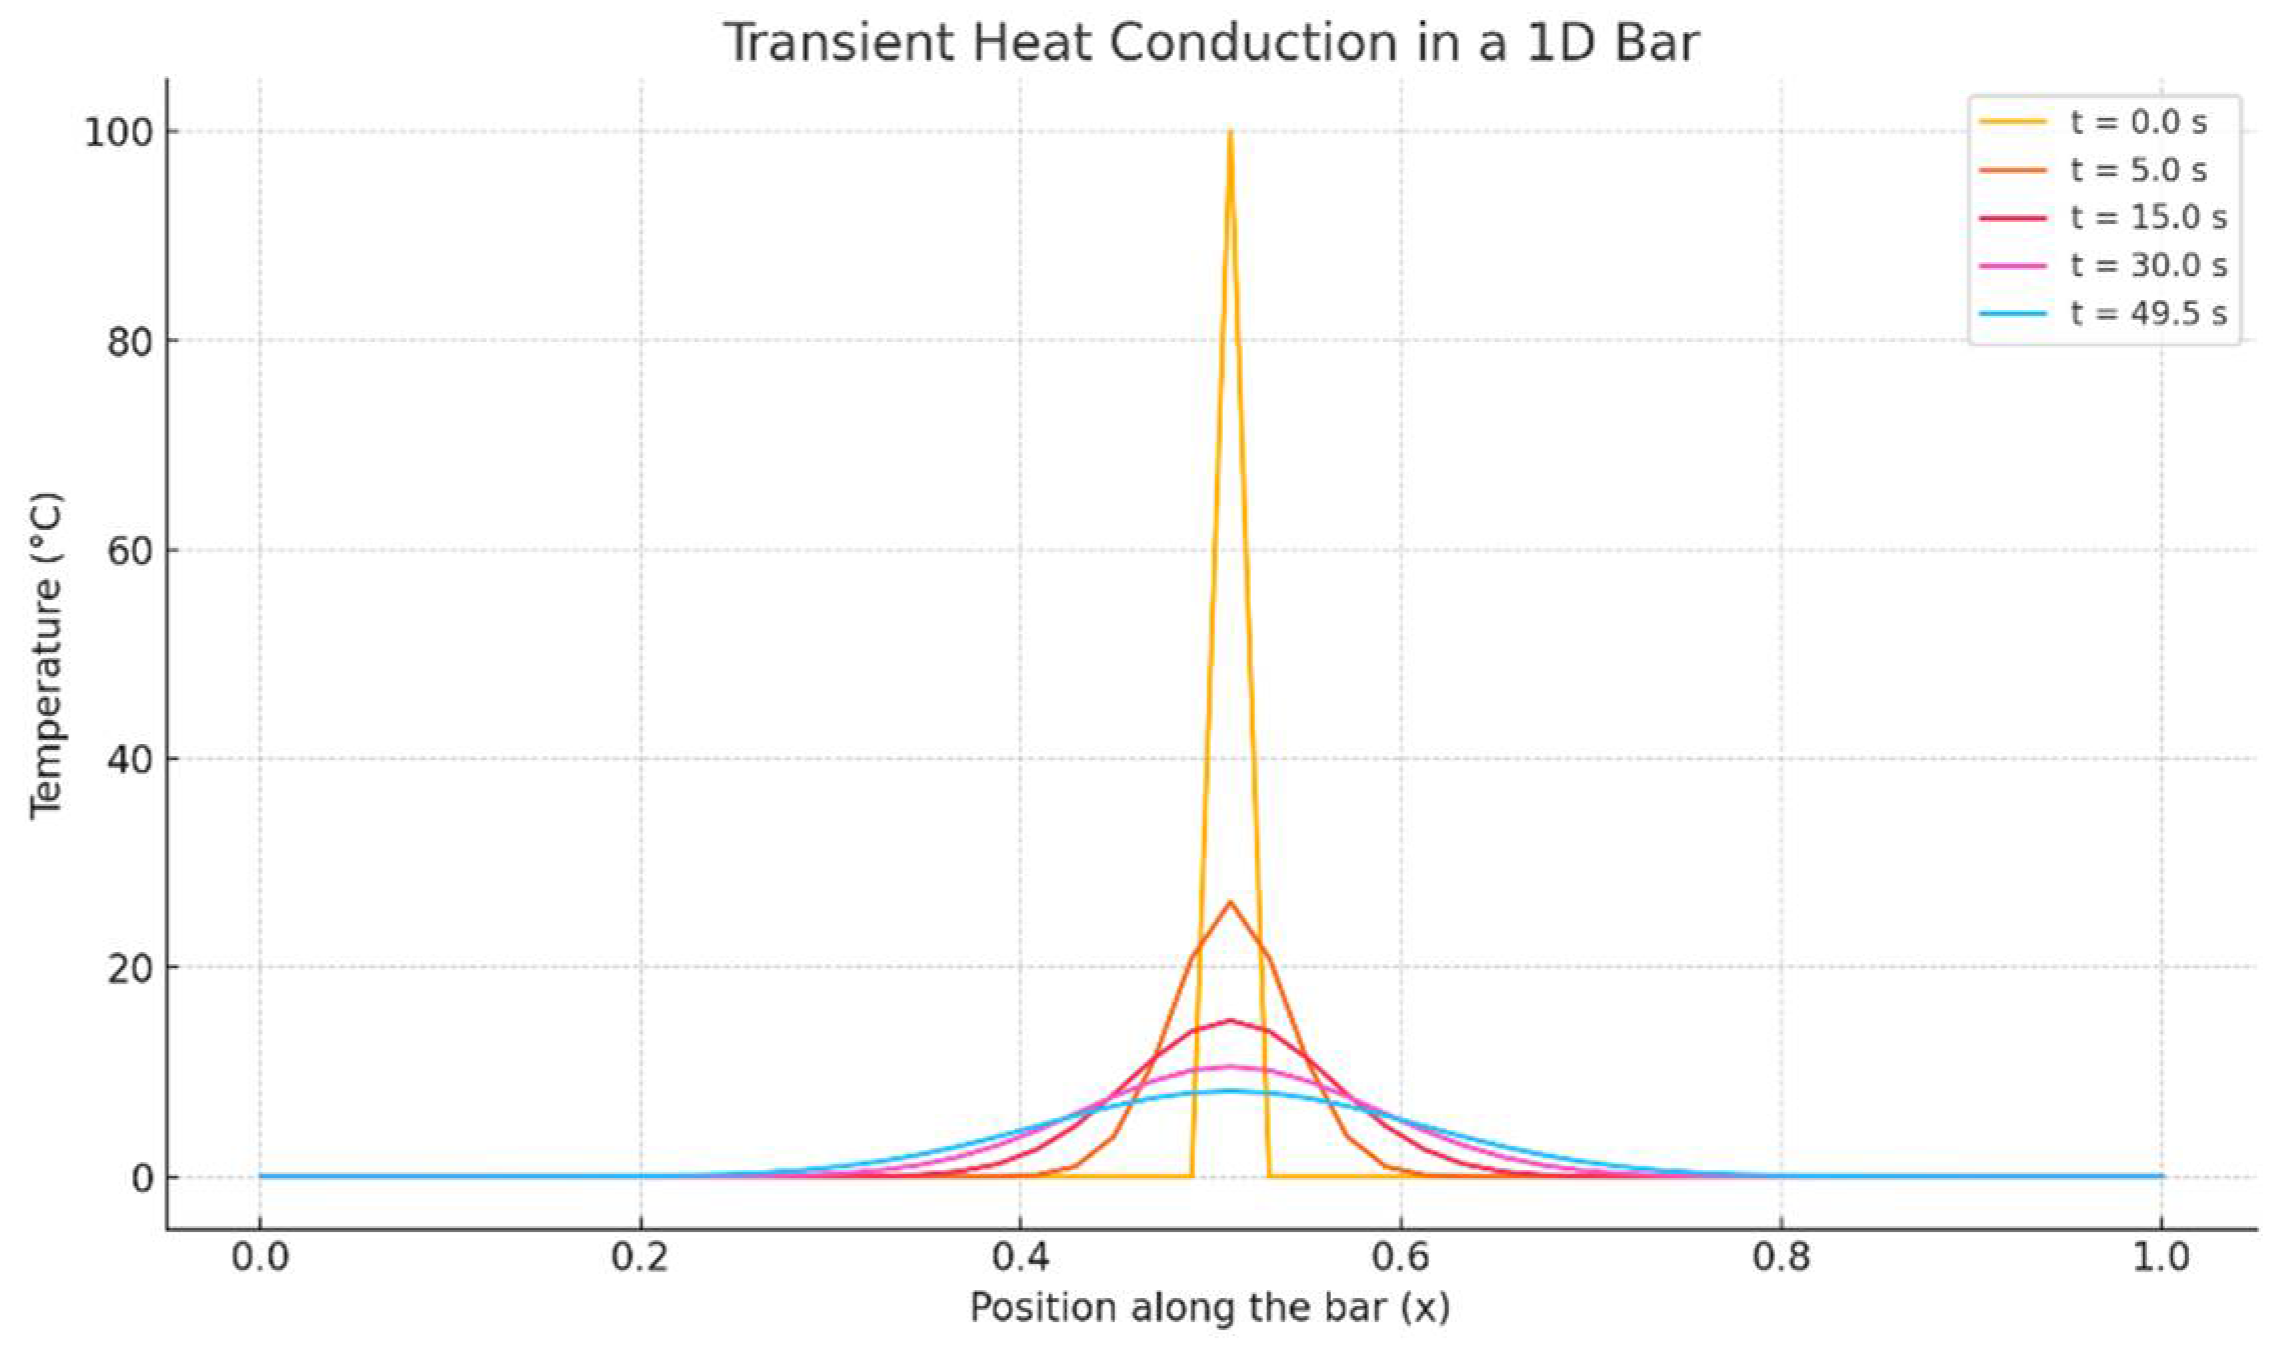
In electric drives, this model is used to analyze the temperature evolution during start-up, overloads, or cooling periods. It is essential for understanding how quickly motor windings or other components heat up or cool down, which affects performance and insulation life. The plot above (
Figure 1) shows the transient heat conduction in a 1D bar. Initially, there is a sharp temperature spike in the center of the bar (at x = 0.5), simulating a localized heat source. Over time, the heat diffuses outward, and the temperature profile becomes smoother and broader.
Figure 1 description: A sharp peak in the center represents the initial heat input, t = 0. The temperature spreads symmetrically along the bar, t = 5, 15, 30, 49.5 s.
This diffusion follows the heat equation, showing how temperature depends on both position x and time t. This demonstrates classic transient (non-steady-state) behavior, where the temperature evolves over time.
4.5. Phase-Change Heat Conduction Models (e.g., Melting, Freezing)
Used where phase changes (e.g., solid–liquid) occur.
Special models;
Include latent heat (L) effects;
Various solution methods;
Stefan problem (classical phase change model).
Though less common in everyday electric drive applications, phase-change models are applicable in systems using phase-change materials (PCMs) for thermal energy storage or advanced cooling solutions in electric motors and power electronics. In specialized couplings, phase-change mechanisms might be employed for passive temperature control.
4.6. Microscopic and Quantum Heat Conduction Models
Relevant for very small-scale systems (e.g., nanotechnology);
Example: Boltzmann transport equation (phonon-heat interactions);
Classical Fourier’s law is not valid here.
Emerging electric drive technologies at micro- and nanoscale, such as MEMS actuators or nanoscale sensors, require these advanced models to capture heat transfer effects accurately, which are not addressed by classical theories. While not directly applied to traditional shaft couplings, future miniaturized coupling systems in microdrives may benefit from such modeling.
4.7. Analog (Electrical) Heat Conduction Models
Based on analogies with electrical circuits;
Thermal resistance, electrical resistance;
Thermal capacitance, electrical capacitance;
Heat flow electric current;
Useful for quick modeling of complex systems.
These models are widely applied in electric drive system design for rapid estimation of thermal behavior. They are particularly useful during early design phases or when integrated with electrical equivalent circuit models to study electro-thermal interactions. For couplings, simplified analog models can be used to estimate heat dissipation through friction interfaces and to analyze thermal coupling with adjacent components.
5. Thermal Propagation in Shaft Couplings
The thermal behavior of shaft couplings plays a critical role in the overall performance, efficiency, and reliability of rotating machinery systems. Heat generation within couplings primarily arises from frictional interactions, misalignment-induced contact forces, and torque transmission under varying load conditions [
4,
5]. The resulting temperature rise can significantly alter the mechanical and tribological properties of coupling materials, potentially leading to thermal expansion, wear, fatigue, and premature failure [
6,
7]. Accurate modeling of heat propagation in couplings is therefore essential for predicting temperature fields and establishing safe thermal operating limits [
8,
9].
This modeling requires the application of classical heat conduction theory, governed by Fourier’s law, and must account for boundary conditions specific to the coupling geometry and material interfaces [
10,
13]. Both transient and steady-state thermal responses must be analyzed to fully capture the time-dependent temperature distribution during operation [
12,
14]. Material properties such as thermal conductivity, density, and specific heat capacity exert a strong influence on the rate and extent of heat propagation [
15,
16]. Advanced mathematical modeling approaches, including finite difference and finite element formulations, are employed to simulate these thermal mechanisms and their sensitivity to structural parameters [
17,
20].
In parallel with theoretical analysis, experimental investigations were conducted to validate the predicted thermal behavior in multiple coupling configurations. Temperature measurements were acquired using embedded thermocouples strategically placed at the coupling hub, sleeve, and shaft interface to capture spatial temperature gradients [
18,
19]. These tests involved dynamic loading conditions, including variable torque levels, angular misalignments, and rotational speed fluctuations representative of real-world mechanical drive systems [
26].
The experimental data reveal localized thermal hotspots, asymmetrical heat flow patterns, and coupling-type-dependent heat dissipation characteristics [
9,
27]. For example, flexible jaw couplings exhibited lower peak temperatures due to increased compliance, while rigid and gear couplings showed more pronounced thermal gradients under similar conditions [
28]. These results were instrumental in refining the mathematical model and improving its accuracy in representing thermal processes under operational loads [
29].
By integrating analytical predictions with empirical findings, this investigation provides a comprehensive understanding of heat transfer phenomena in shaft couplings. The insights gained support the development of more thermally robust coupling designs and offer practical guidelines for their selection and implementation in thermally demanding applications such as electric drivetrains, turbine assemblies, and high-performance industrial machinery [
30,
31].
5.1. Thermal and Mechanical State Analysis During Gear Shifting in Electric Drives
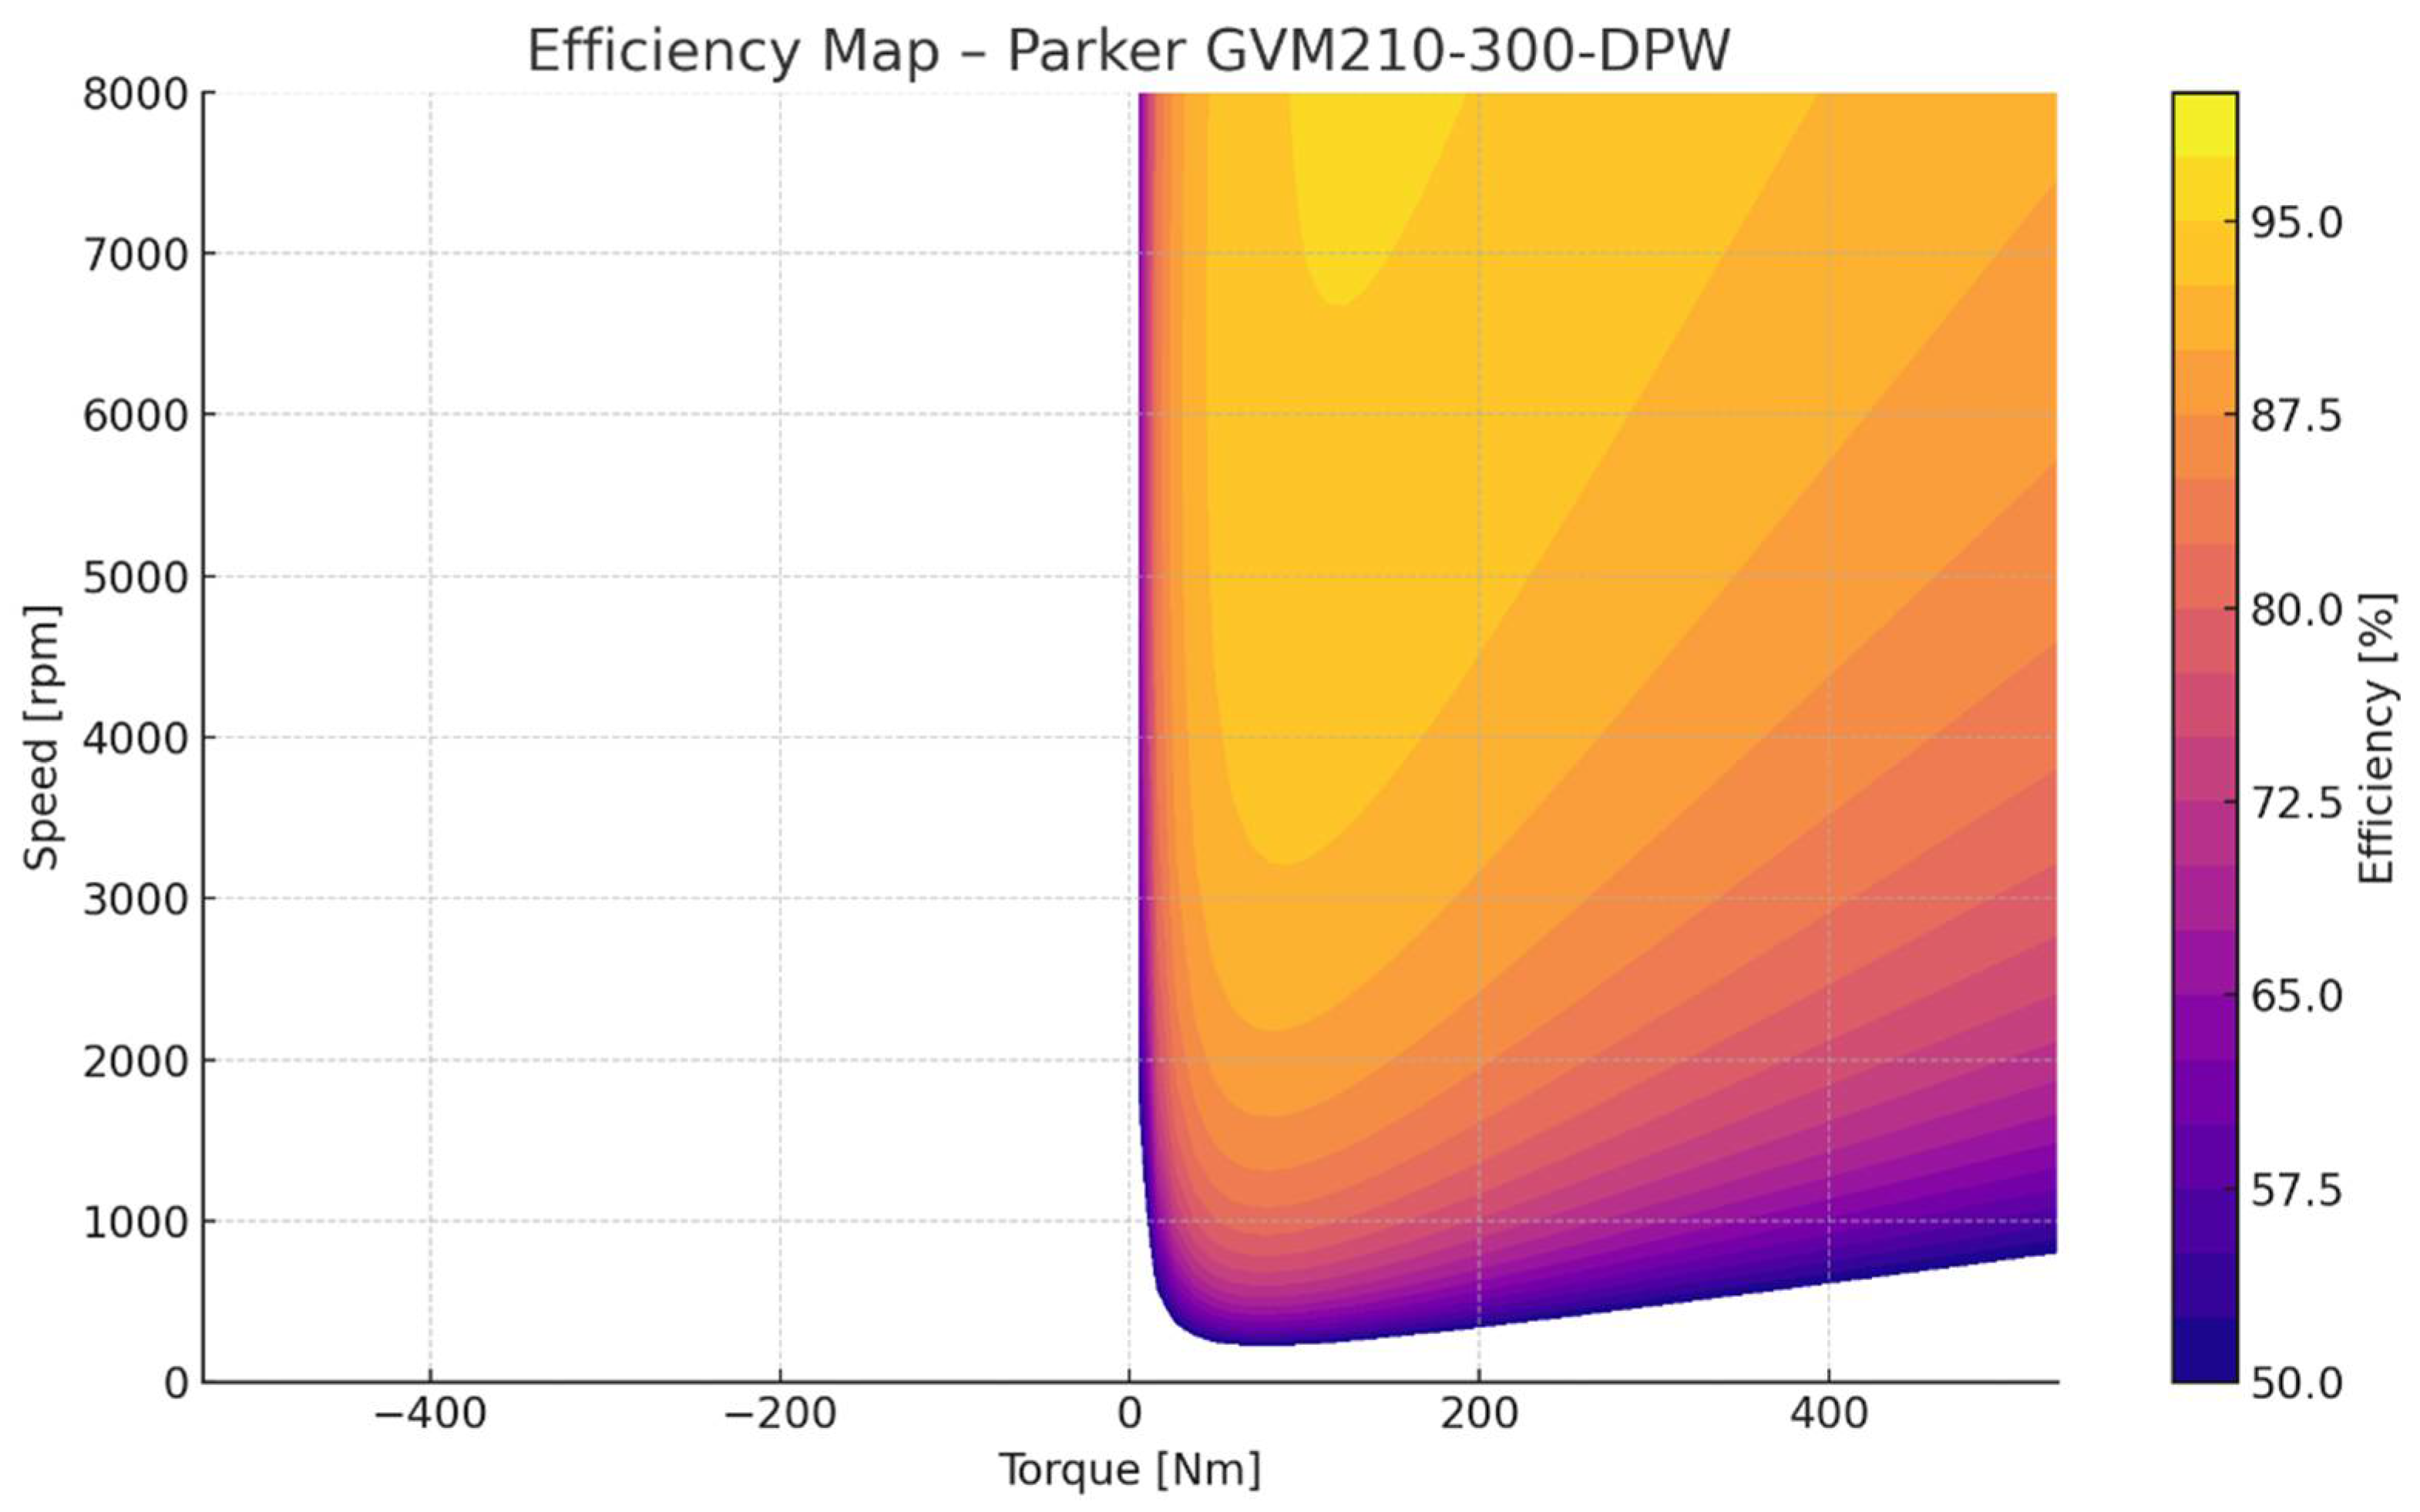
The image represents a process visualization related to the gear-shifting mechanism of an electric drive system. It likely illustrates the transient behavior of mechanical and control variables during gear shifting, focusing on dynamic interactions within the drivetrain.
The image features (
Figure 2). a structured, grid-like or matrix-based plot, typically used for process visualization and state mapping (
Figure 3 and
Figure 4).
Distinct regions with varying intensities suggest segmentation into operational zones or phases of the gear-shifting process.
The image shows a gradual variation in color tones, likely corresponding to different operational intensities such as (
Figure 3 and
Figure 4):
Torque Transmission Intensity;
Speed Differences Across Components;
Mechanical Stress in the Coupling or Clutch Mechanisms.
Brighter areas generally indicate higher activity or stress points, such as rapid changes in torque or actuator engagement during shifting.
The horizontal axis likely represents process duration or time steps during the gear shift.
The vertical axis probably denotes critical system variables, such as:
The process illustrated here appears to capture fine transitions between different states of the drivetrain, highlighting precise control and synchronization actions.
Such diagrams are essential for:
Evaluating torque delivery continuity during gear shifts;
Identifying regions prone to mechanical stress concentration or thermal load spikes;
Assessing the performance of adaptive control algorithms in electric drivetrains.
Optimizing switching strategies to reduce wear and ensure smooth operation.
Dual-clutch systems;
Automated manual transmissions (AMTs) integrated into electric drives;
Direct-drive gear stages with active thermal management;
Coupling elements in high-efficiency drive trains.
This image provides a comprehensive visual representation of the dynamic state transitions and control behavior during a gear-shifting event within an electric drive system. It captures the intricate interplay between mechanical components and control strategies, highlighting the temporal evolution of critical variables such as torque transmission, rotational speed synchronization, and thermal stresses.
The diagram offers valuable insights into the shifting process, revealing key phases including torque handover, synchronization of rotating elements, load redistribution, and re-engagement stability. Such visualization enables engineers to identify potential performance bottlenecks, abrupt torque variations, or thermal hotspots that may affect the system’s durability and efficiency.
Furthermore, the diagram serves as an essential analytical tool for drivetrain designers and control engineers aiming to optimize shifting smoothness, minimize energy losses, and enhance overall system reliability. It supports the development of advanced control algorithms and thermal management strategies that ensure superior performance and driver comfort in modern electric vehicle propulsion systems.
5.2. Block-Diagram Representation of Gear-Shift Dynamics, Structural Layout
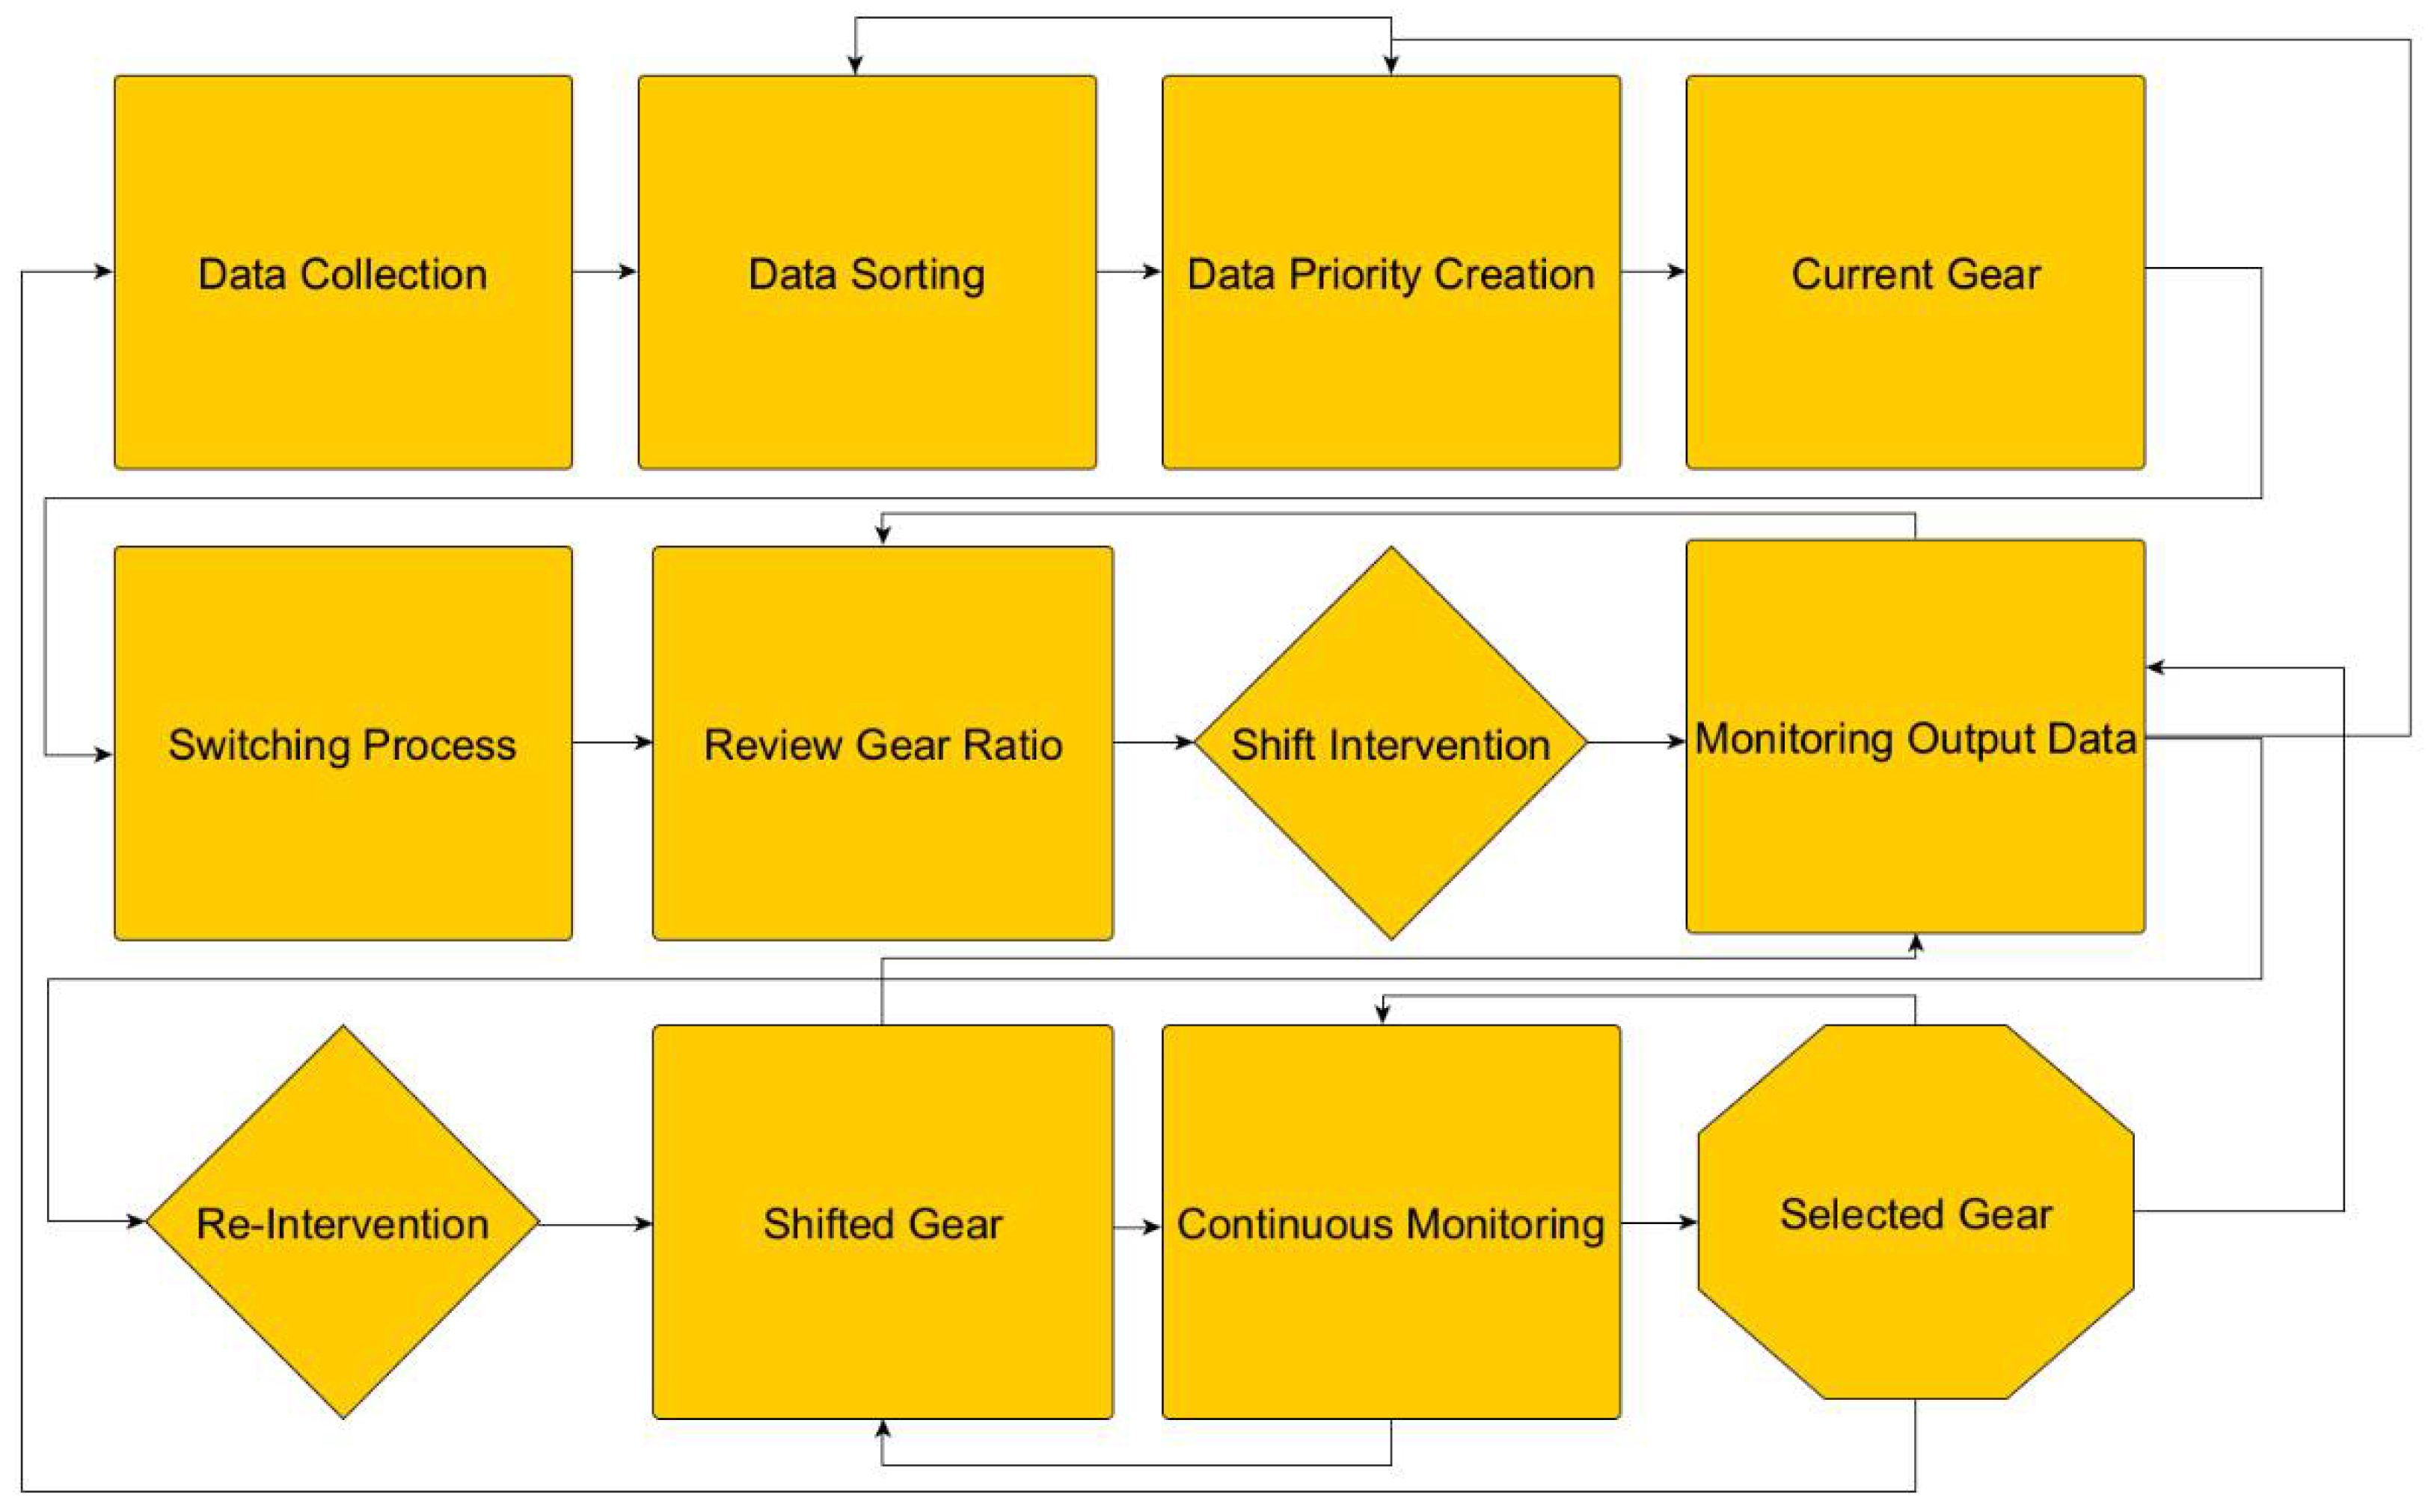
The image is presented (
Figure 3 and
Figure 4) in the form of a block diagram with a grid-structured background and illustrates the distinct operational states and process stages associated with gear shifting. Each segment of the diagram corresponds to a specific phase within the shifting sequence, including torque transfer initiation, synchronization, load transition, and torque rebuild completion. The variation in shading, ranging from darker to lighter tones, is indicative of different levels of physical variables, such as torque magnitude, speed variation, and the thermal or mechanical loads acting on coupling and drivetrain components. Brighter regions can be interpreted as critical zones characterized by elevated mechanical stress or rapid transitions in the operational state, whereas darker regions denote more stable or quasi-steady phases. Although axis labels are not explicitly discernible, it can reasonably be inferred that the horizontal axis represents the temporal evolution or duration of the gear-shift phase, while the vertical axis denotes control parameters such as torque, rotational speed, or actuator displacement during the shifting process. Such a diagram is of particular importance in optimizing gear-shift control strategies, reducing mechanical wear on clutch and coupling elements, minimizing torque interruption during gear transitions in electric drive systems, and enabling the analysis and fine-tuning of thermal and mechanical performance under dynamic operating conditions. Typically, these diagrams are derived either from model-based simulations of drivetrain control systems or from experimental data acquisition, where prototype vehicles are instrumented with dedicated sensors for monitoring gear-shift events.
They help engineers visualize the entire shift process, identifying any abnormal behavior or performance bottlenecks.
This process diagram (
Figure 4) provides a visual representation of the gear-shifting mechanism integrated into an electric drive system. It effectively maps the interaction of control signals, torque transmission, and mechanical states over time [
1,
2]. By analyzing such diagrams, engineers can improve system efficiency, enhance operational smoothness, and ensure reliability in modern electric drivetrain applications.
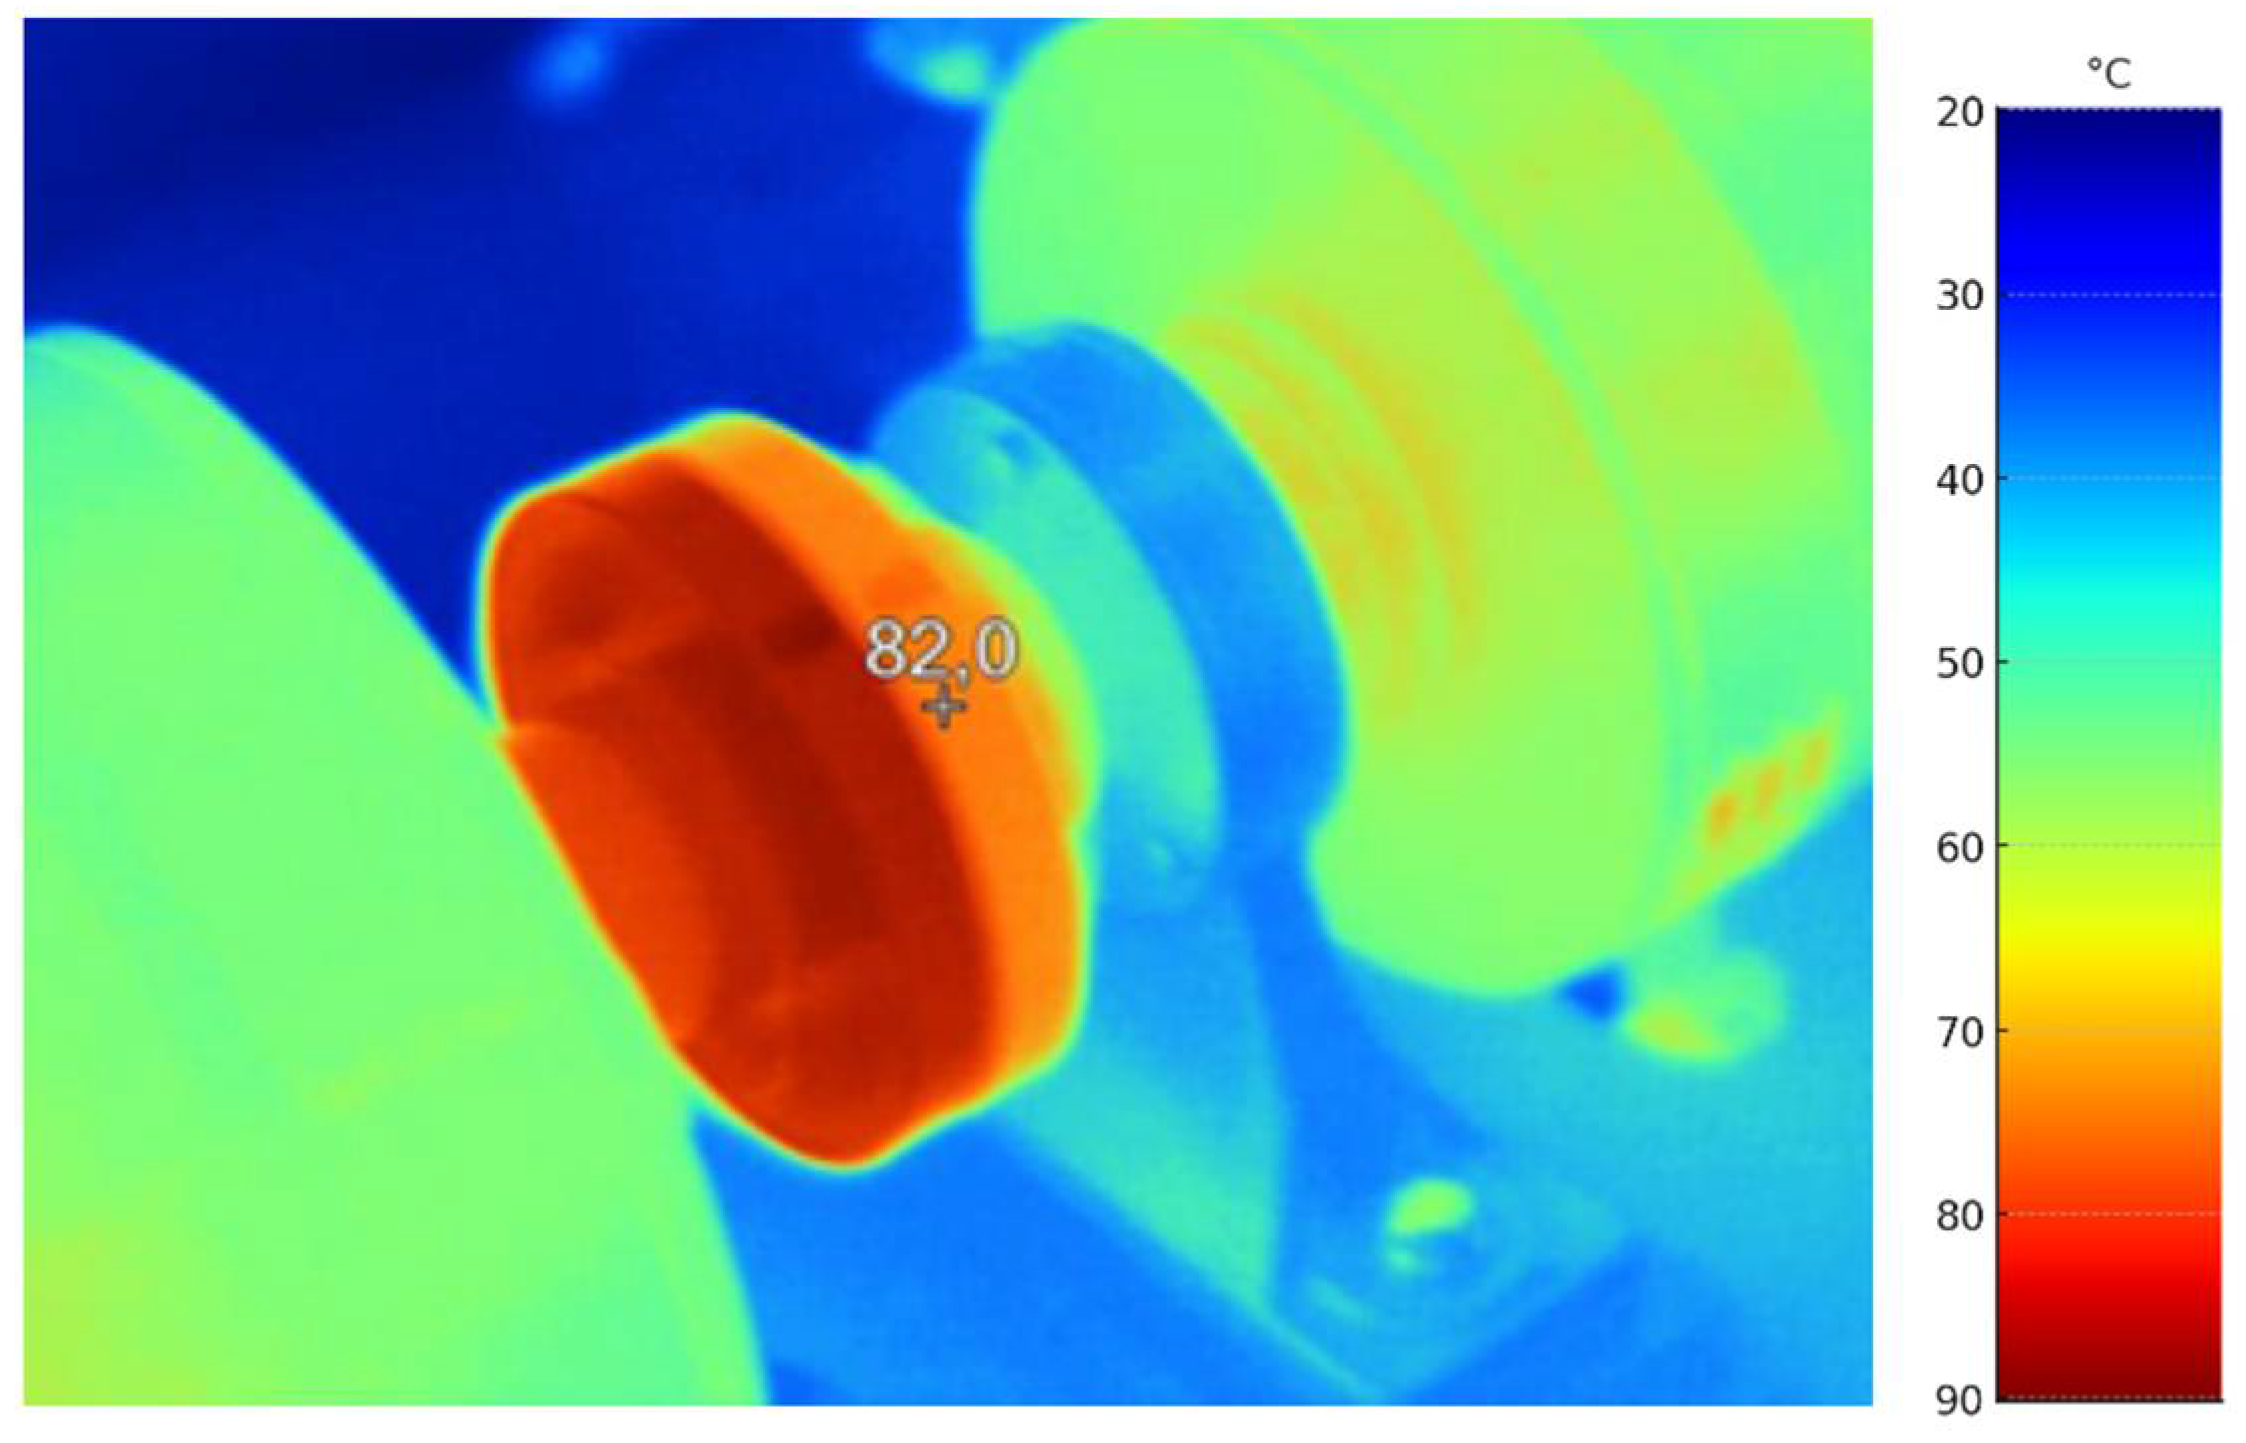
The image presents a thermal infrared (IR) visualization of a shaft coupling system under operational conditions. The central focus is on the coupling element, which shows a distinct temperature concentration (
Figure 5) marked at 27.77 °C, displayed in bright orange-red tones, indicating a significant thermal hotspot. The surrounding shaft components exhibit lower temperatures, represented by greenish and bluish shades, reflecting cooler regions. This thermal distribution suggests localized heating, likely due to friction, mechanical loading, or misalignment within the coupling. The image clearly demonstrates the heat transfer paths and highlights the importance of thermal monitoring in mechanical drive systems. Such thermographic analysis is crucial for identifying potential overheating risks and optimizing the thermal design of coupling assemblies in rotating machinery.
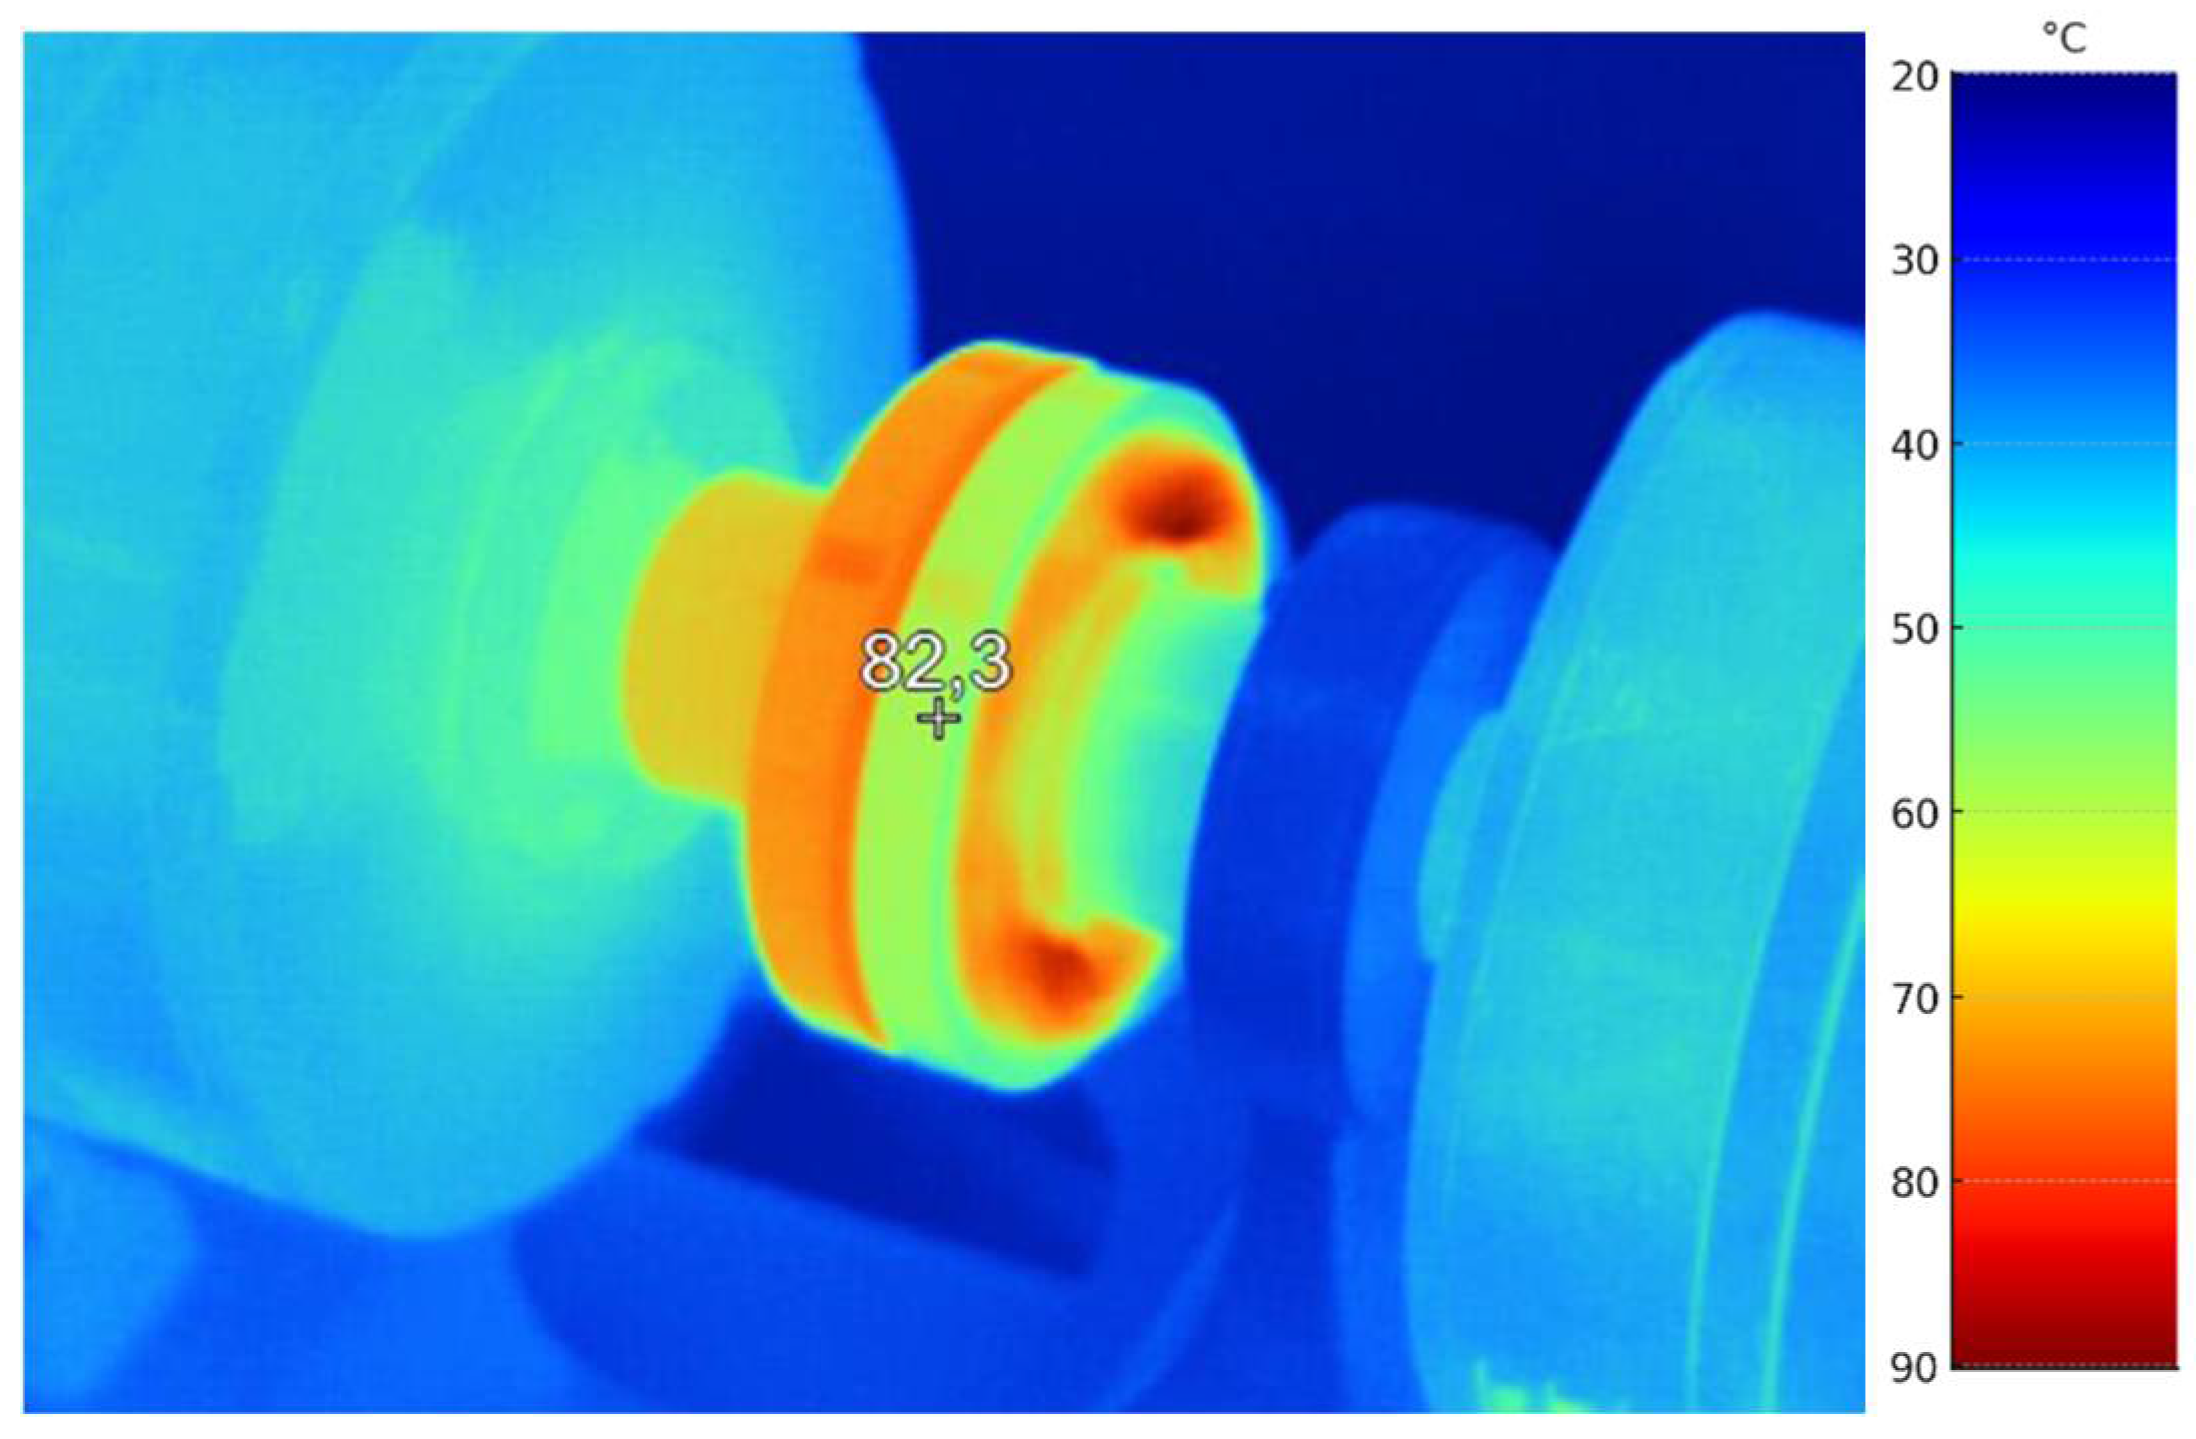
This thermal infrared image illustrates another shaft coupling assembly during operation, showing a clear temperature distribution across the components. The coupling itself exhibits a peak (
Figure 6) temperature of 27.94 °C, highlighted in bright red and orange tones, indicating concentrated heat generation. The adjacent shafts and supporting elements appear in cooler blue shades, indicating lower surface temperatures. The symmetrical heating pattern in the coupling suggests thermal buildup likely caused by rotational motion and internal friction within the coupling interface. This thermal signature highlights the critical area where thermal stresses are most prominent, emphasizing the need for continuous thermal monitoring. The image provides valuable insight into the operational thermal behavior of the coupling and supports further analysis for preventive maintenance and thermal optimization.
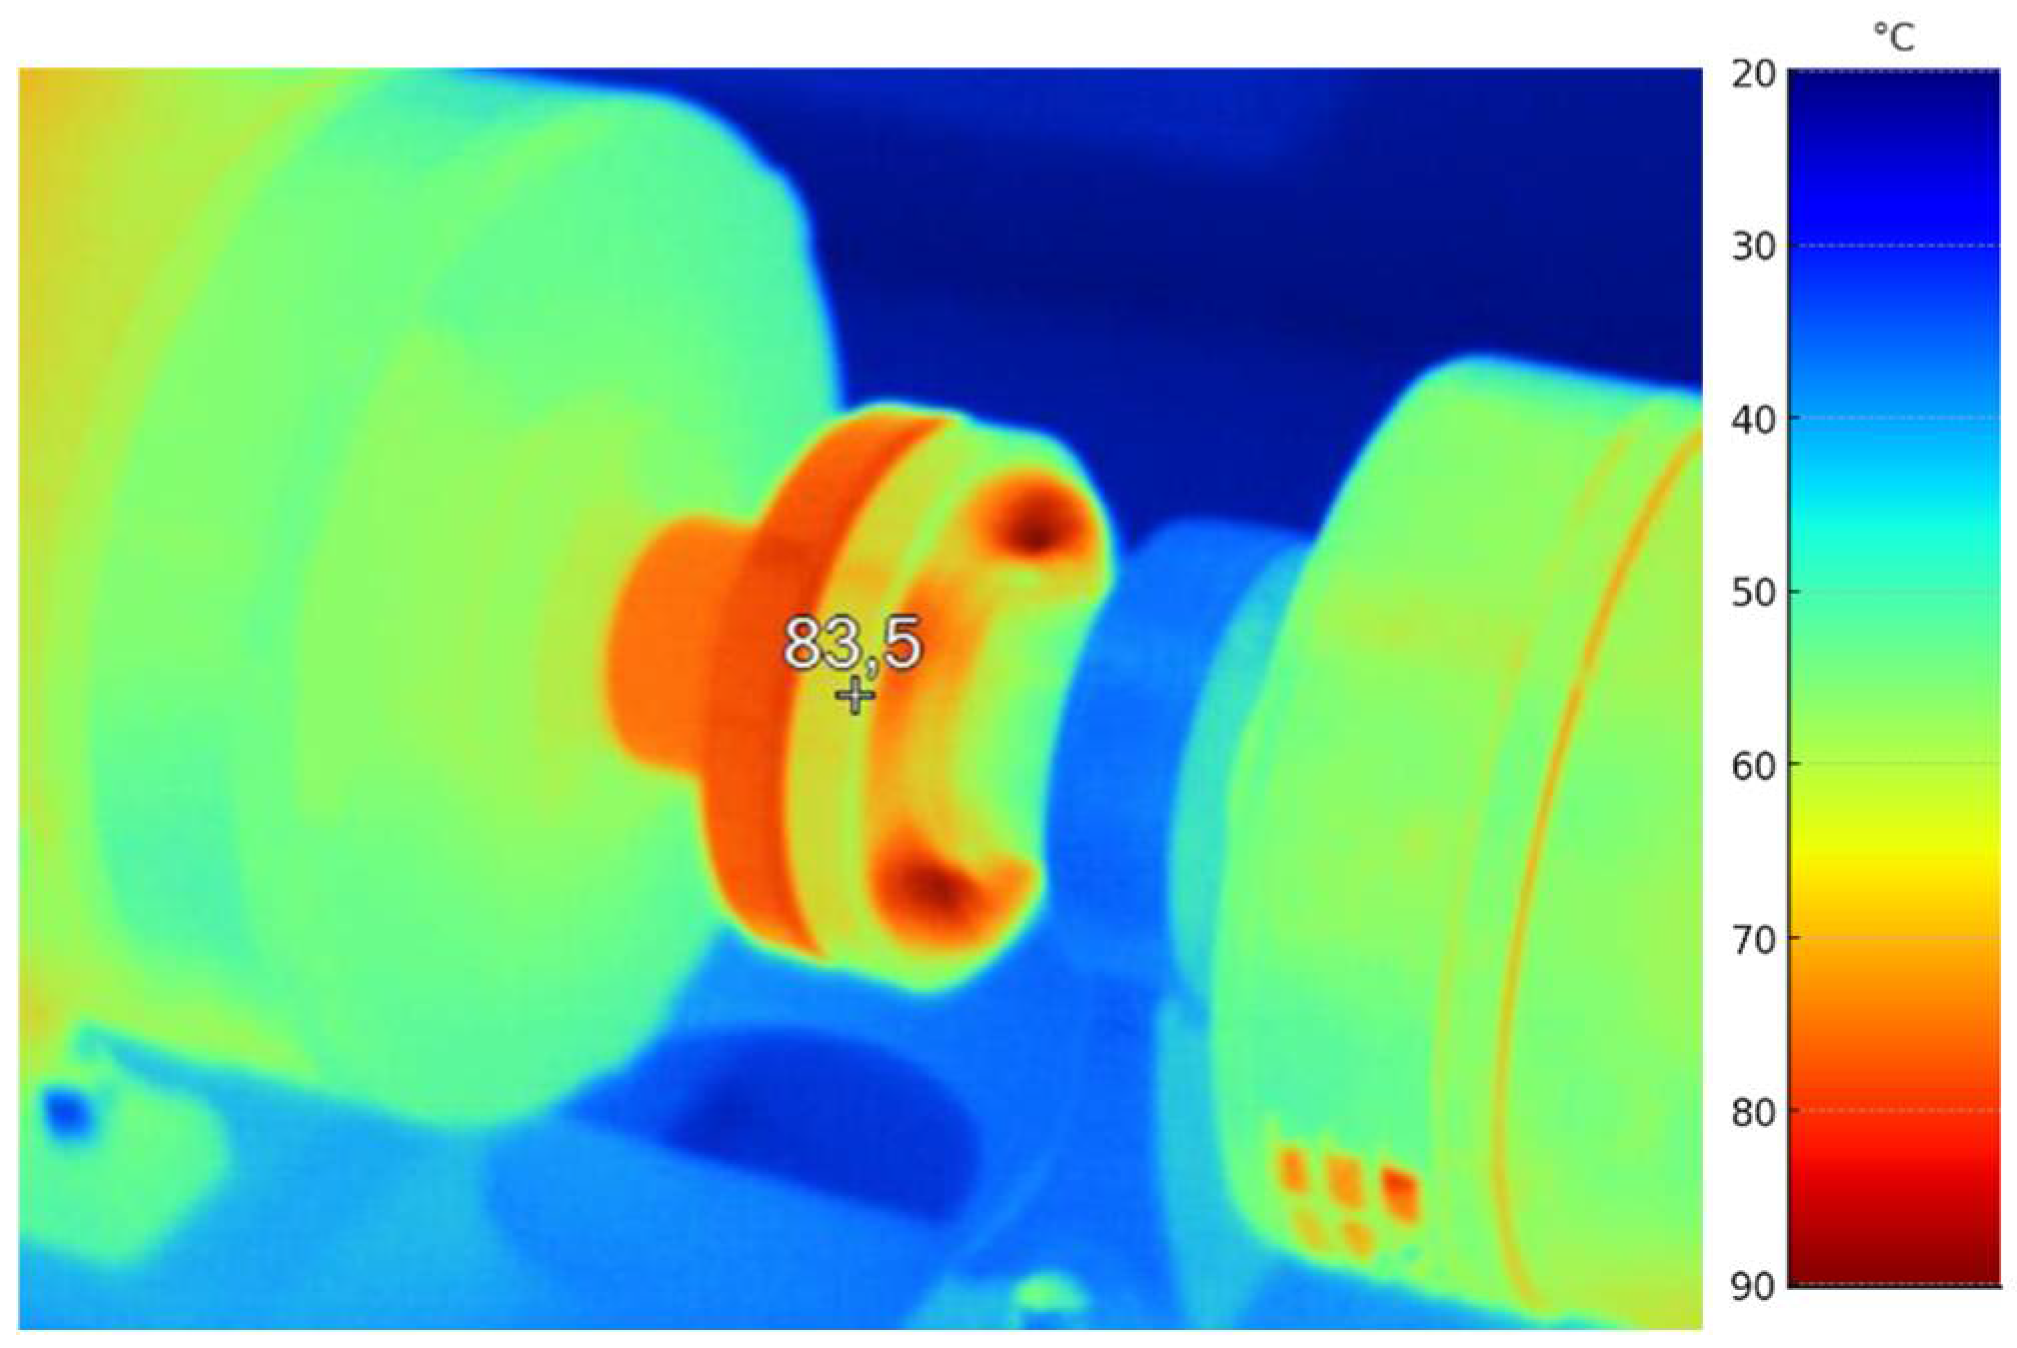
This thermal infrared image depicts a shaft coupling assembly under operational conditions, focusing on the thermal characteristics of the coupling. The highest recorded temperature in the coupling (
Figure 7) is 28.61 °C, clearly visible in bright red and orange shades, indicating an intensified thermal hotspot compared to the previous cases. The surrounding components remain at lower temperatures, shown in green and blue tones, suggesting effective heat dissipation through the connected shafts and supports. The heating pattern around the coupling teeth suggests localized frictional heating, potentially caused by load transmission or slight misalignments. The image emphasizes the importance of thermal control and monitoring in couplings subjected to continuous mechanical loads. This thermal mapping provides critical data for predicting potential overheating and for improving the thermal resilience of mechanical coupling designs.
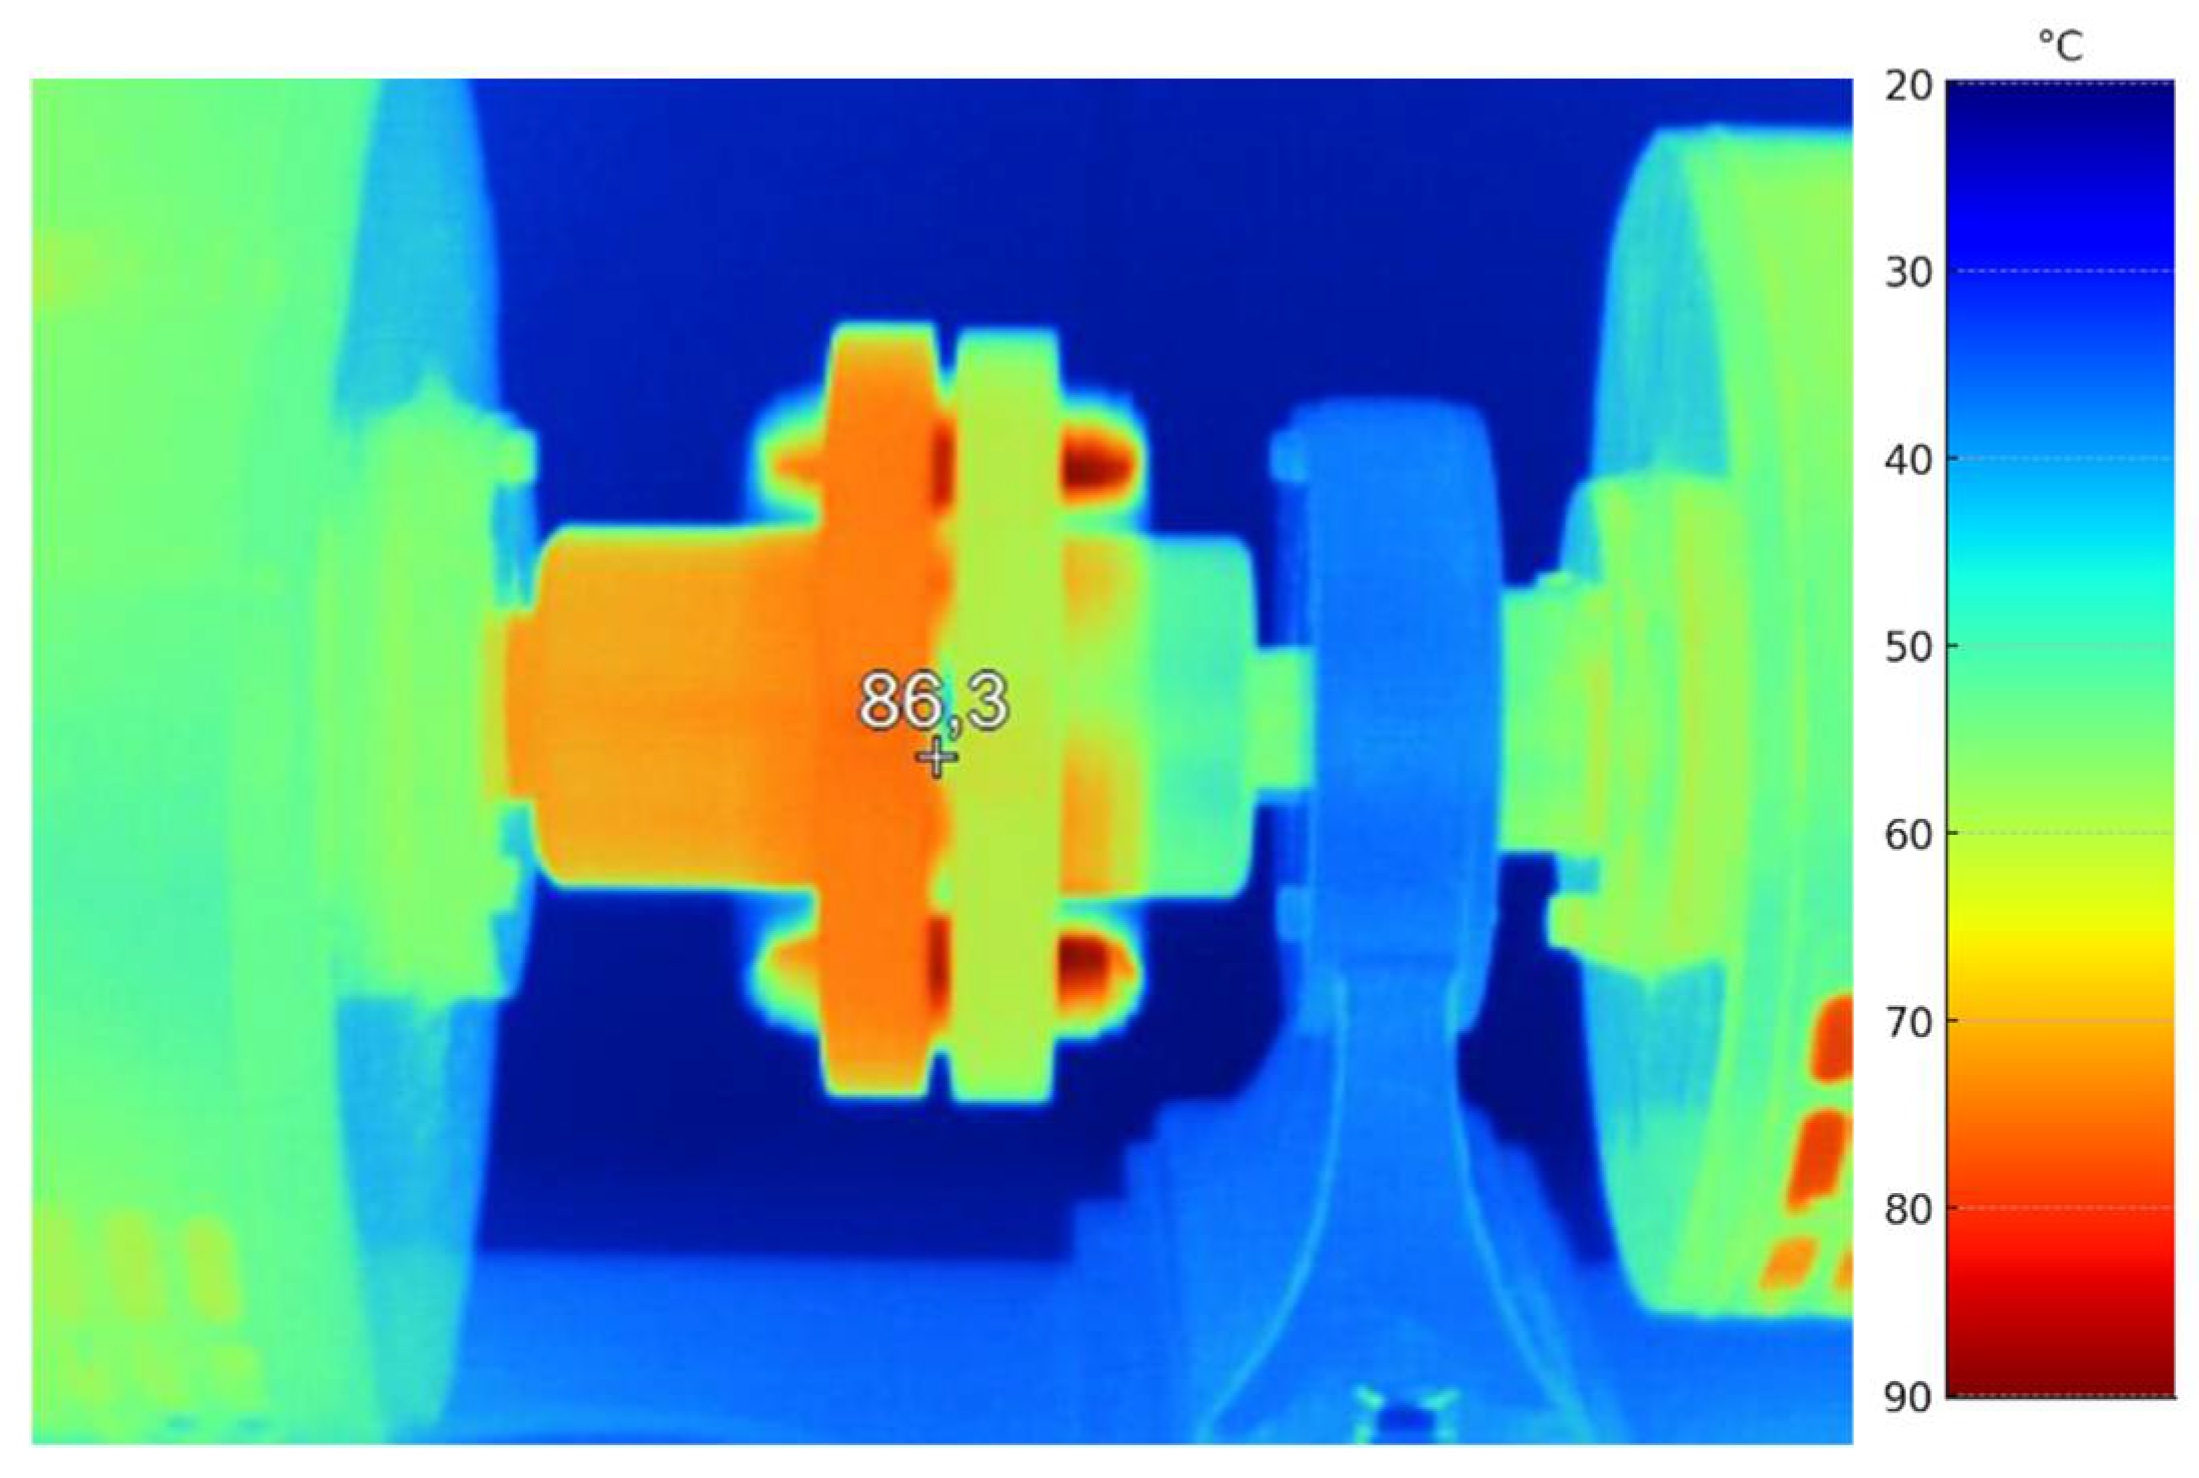
This thermal infrared image presents another operational view of a shaft coupling, revealing elevated temperature regions within the assembly. The coupling shows a maximum temperature of 29.11 °C (
Figure 8), displayed in intense red and orange colors, indicating the highest thermal concentration among the observed images. The surrounding areas, including the shafts and supports, remain cooler, depicted in green and blue shades. The distinct heat buildup at the coupling interface suggests sustained frictional heating under operational load, possibly exacerbated by misalignment or high torque conditions. The thermal gradient across the coupling teeth becomes more prominent in this image, indicating localized stress points. This thermographic evidence underlines the necessity for detailed thermal analysis and proactive maintenance in mechanically loaded coupling systems to prevent premature wear or failure.
This thermal infrared image captures a shaft coupling assembly operating under load, clearly highlighting its thermal profile. The highest temperature recorded in this (
Figure 9) coupling is 30.16 °C, shown in bright red and orange tones, marking the most significant thermal hotspot among the analyzed images. Notably, the coupling’s entire structure appears more uniformly heated compared to previous cases, suggesting a higher or more evenly distributed thermal load. The surrounding shafts and structural supports remain cooler, visible in blue and green shades, indicating minimal heat transfer to adjacent components. The uniform heating may result from sustained high torque, continuous friction, or thermal saturation effects under prolonged operation. This thermal pattern underscores the importance of effective thermal management in coupling systems, especially in high-load applications. The image highlights the potential for advanced wear or material fatigue if temperatures are not carefully controlled.
This study presents a comparative thermal analysis of five shaft coupling assemblies captured under operational conditions using infrared thermography. The thermal images reveal significant variations in temperature distribution, indicating different thermal behaviors across the tested coupling configurations.
5.3. Comparative Thermal Analysis of Shaft Coupling Assemblies
In the first image, the coupling exhibits a localized thermal hotspot with a maximum (
Figure 5) temperature of 27.77 °C. The heat concentration is primarily limited to the central region of the coupling, with surrounding areas remaining relatively cool. This suggests moderate operational load with localized frictional heating at the coupling interface.
The second image displays a slightly higher (
Figure 6) temperature of 27.94 °C. The thermal hotspot appears more symmetric, covering a broader section of the coupling teeth. This indicates an increase in mechanical load or improved thermal conductivity, leading to a more uniform temperature spread around the coupling interface.
In the third image, the recorded temperature rises (
Figure 7) to 28.61 °C. The thermal profile becomes even more pronounced, with larger areas of the coupling showing elevated temperatures. This suggests a higher level of internal friction or misalignment, potentially resulting in increased heat generation during torque transmission.
The fourth image continues this trend, with a temperature (
Figure 8) peak of 29.11 °C. The heat distribution reveals intensified localized heating at the contact surfaces, likely due to sustained loading or a combination of misalignment and friction. The clear thermal gradients along the coupling teeth emphasize the accumulation of heat at specific contact points under stress.
The fifth image presents the highest temperature among the observed cases, reaching (
Figure 9) 30.16 °C. Unlike the previous images, this coupling shows a more uniformly heated body, with the entire coupling element appearing in bright red and orange tones. This uniform heating pattern suggests continuous high-torque operation or extended running time, leading to thermal saturation. The broader spread of heat across the coupling body implies either advanced thermal conductivity effects or accumulated thermal fatigue.
Overall, the thermal analysis highlights a clear progression of heat accumulation across the five couplings, with increasing temperatures and widening thermal spreads. The findings suggest that operational factors such as torque levels, alignment precision, coupling material properties, and duration of operation significantly affect heat generation and distribution. These results emphasize the critical role of thermal monitoring in coupling systems, particularly in high-load or continuous-duty applications.
Infrared thermography proves to be an effective diagnostic tool for detecting localized overheating, evaluating coupling condition, and preventing premature failures. The thermal patterns observed in this study offer valuable insights for optimizing coupling design, improving maintenance strategies, and enhancing the thermal resilience of mechanical power transmission systems.
Thermal analysis of shaft couplings is critically important for enhancing energy efficiency in vehicle drivetrain systems, as a significant portion of mechanical energy losses occurs within these components. During operation, couplings generate heat due to friction, elastic deformations, and internal damping associated with torque transmission. This heat generation directly reduces the mechanical efficiency of the drivetrain, as the wasted energy is ultimately dissipated as heat.
Excessive temperature rise can negatively affect the mechanical properties of coupling materials, reducing their strength, fatigue resistance, and wear resistance, which may lead to accelerated degradation and shorter service life. Additionally, high thermal loads can compromise lubrication conditions, increasing friction losses and the risk of component failure.
By carefully analyzing thermal propagation, it becomes possible to identify critical areas where energy losses and mechanical stresses are most significant. This information allows for optimized cooling designs, improved lubrication strategies, and enhanced coupling material selection or geometry adjustments to maximize energy transfer efficiency
In summary, effective thermal management and optimized heat propagation in couplings are essential for improving drivetrain energy efficiency, minimizing mechanical losses, and ensuring the durability and reliability of vehicle power transmission systems.
5.4. Image-Domain Frequency Decomposition of Thermal Fields
In addition to time–frequency analysis methods applied to transient thermal signals, the frequency-domain representation of thermographic images provides an effective means for characterizing spatial temperature distributions. A thermographic image can be interpreted as a two-dimensional scalar field, where pixel intensity corresponds to surface temperature. By applying spectral methods, such as the two-dimensional Fourier transform, the spatial frequency content of the temperature field can be decomposed into global trends, mesoscale variations, and fine structural details. This decomposition enables a more rigorous interpretation of thermographic measurements, complementing conventional pixel-based or region-of-interest evaluations.
The 2D Fourier spectrum captures the relative contribution of low-, mid-, and high-frequency components in the image. Low-frequency components represent large-scale thermal gradients and global heating patterns, whereas mid-frequency components emphasize geometrical structures such as couplings, joints, or housing edges. High-frequency contributions are associated with sharp transitions and localized anomalies, which may indicate material discontinuities, mechanical wear, or surface defects. Furthermore, the radial averaging of the power spectral density provides a compact representation of the energy distribution across spatial scales, facilitating quantitative comparisons between different thermal states or operational conditions.
By reconstructing the thermographic image with selective frequency filters low-pass, band-pass, and high-pass researchers can isolate global temperature fields, structural patterns, and edge details, respectively. Such analyses are particularly valuable in experimental diagnostics of electric drive systems, where mechanical couplings, bearings, and housings often exhibit overlapping thermal signatures. In this way, spatial frequency analysis serves as a complementary diagnostic approach, bridging classical thermographic interpretation with advanced signal-processing techniques.
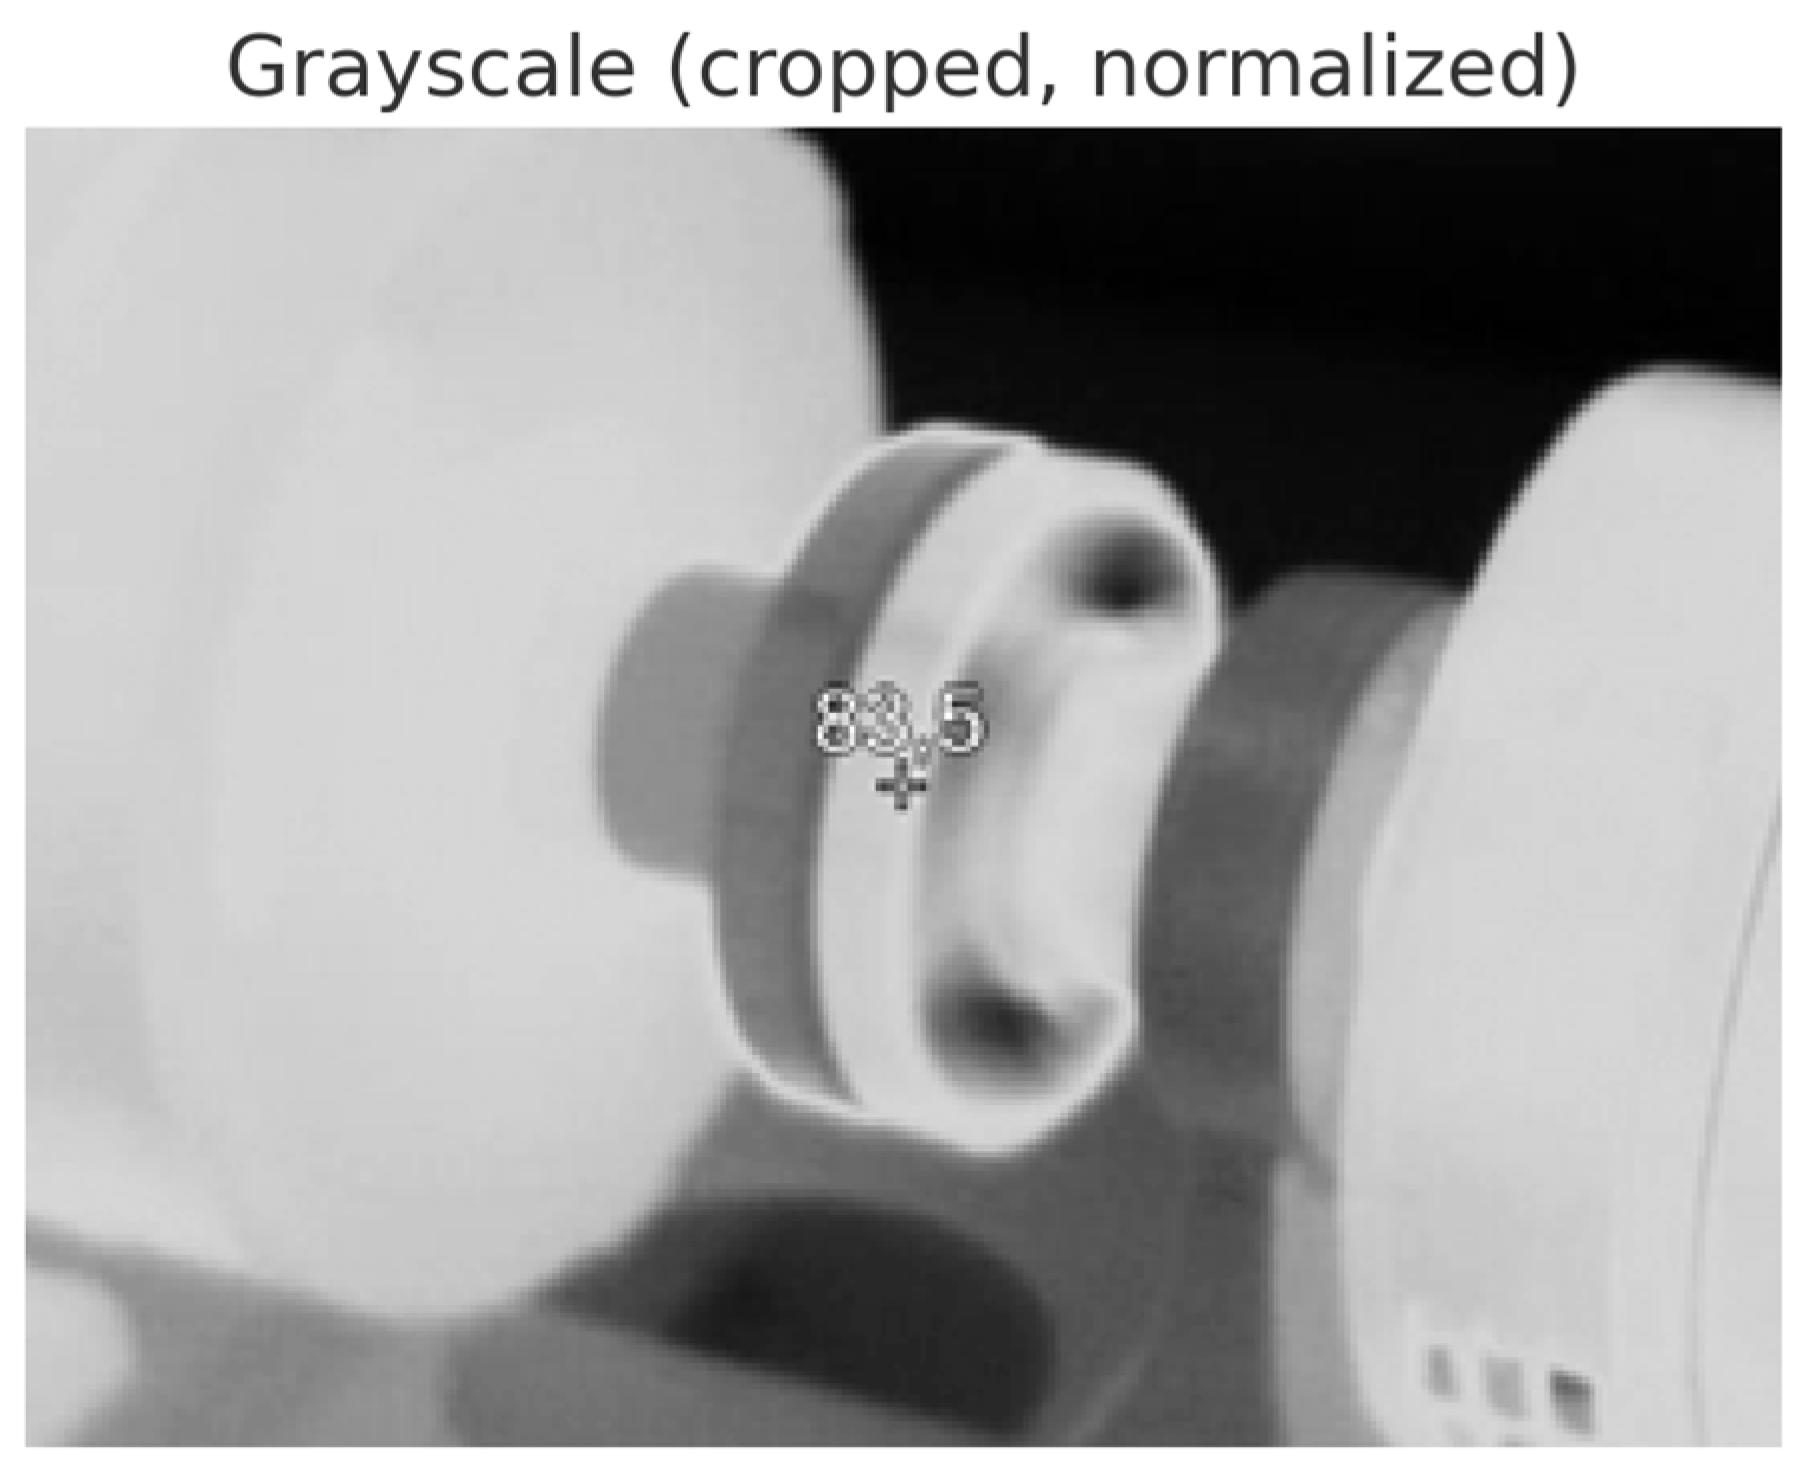
The original infrared (
Figure 10) image converted to grayscale, normalized for analysis. This serves as the basis for the frequency-domain evaluation.
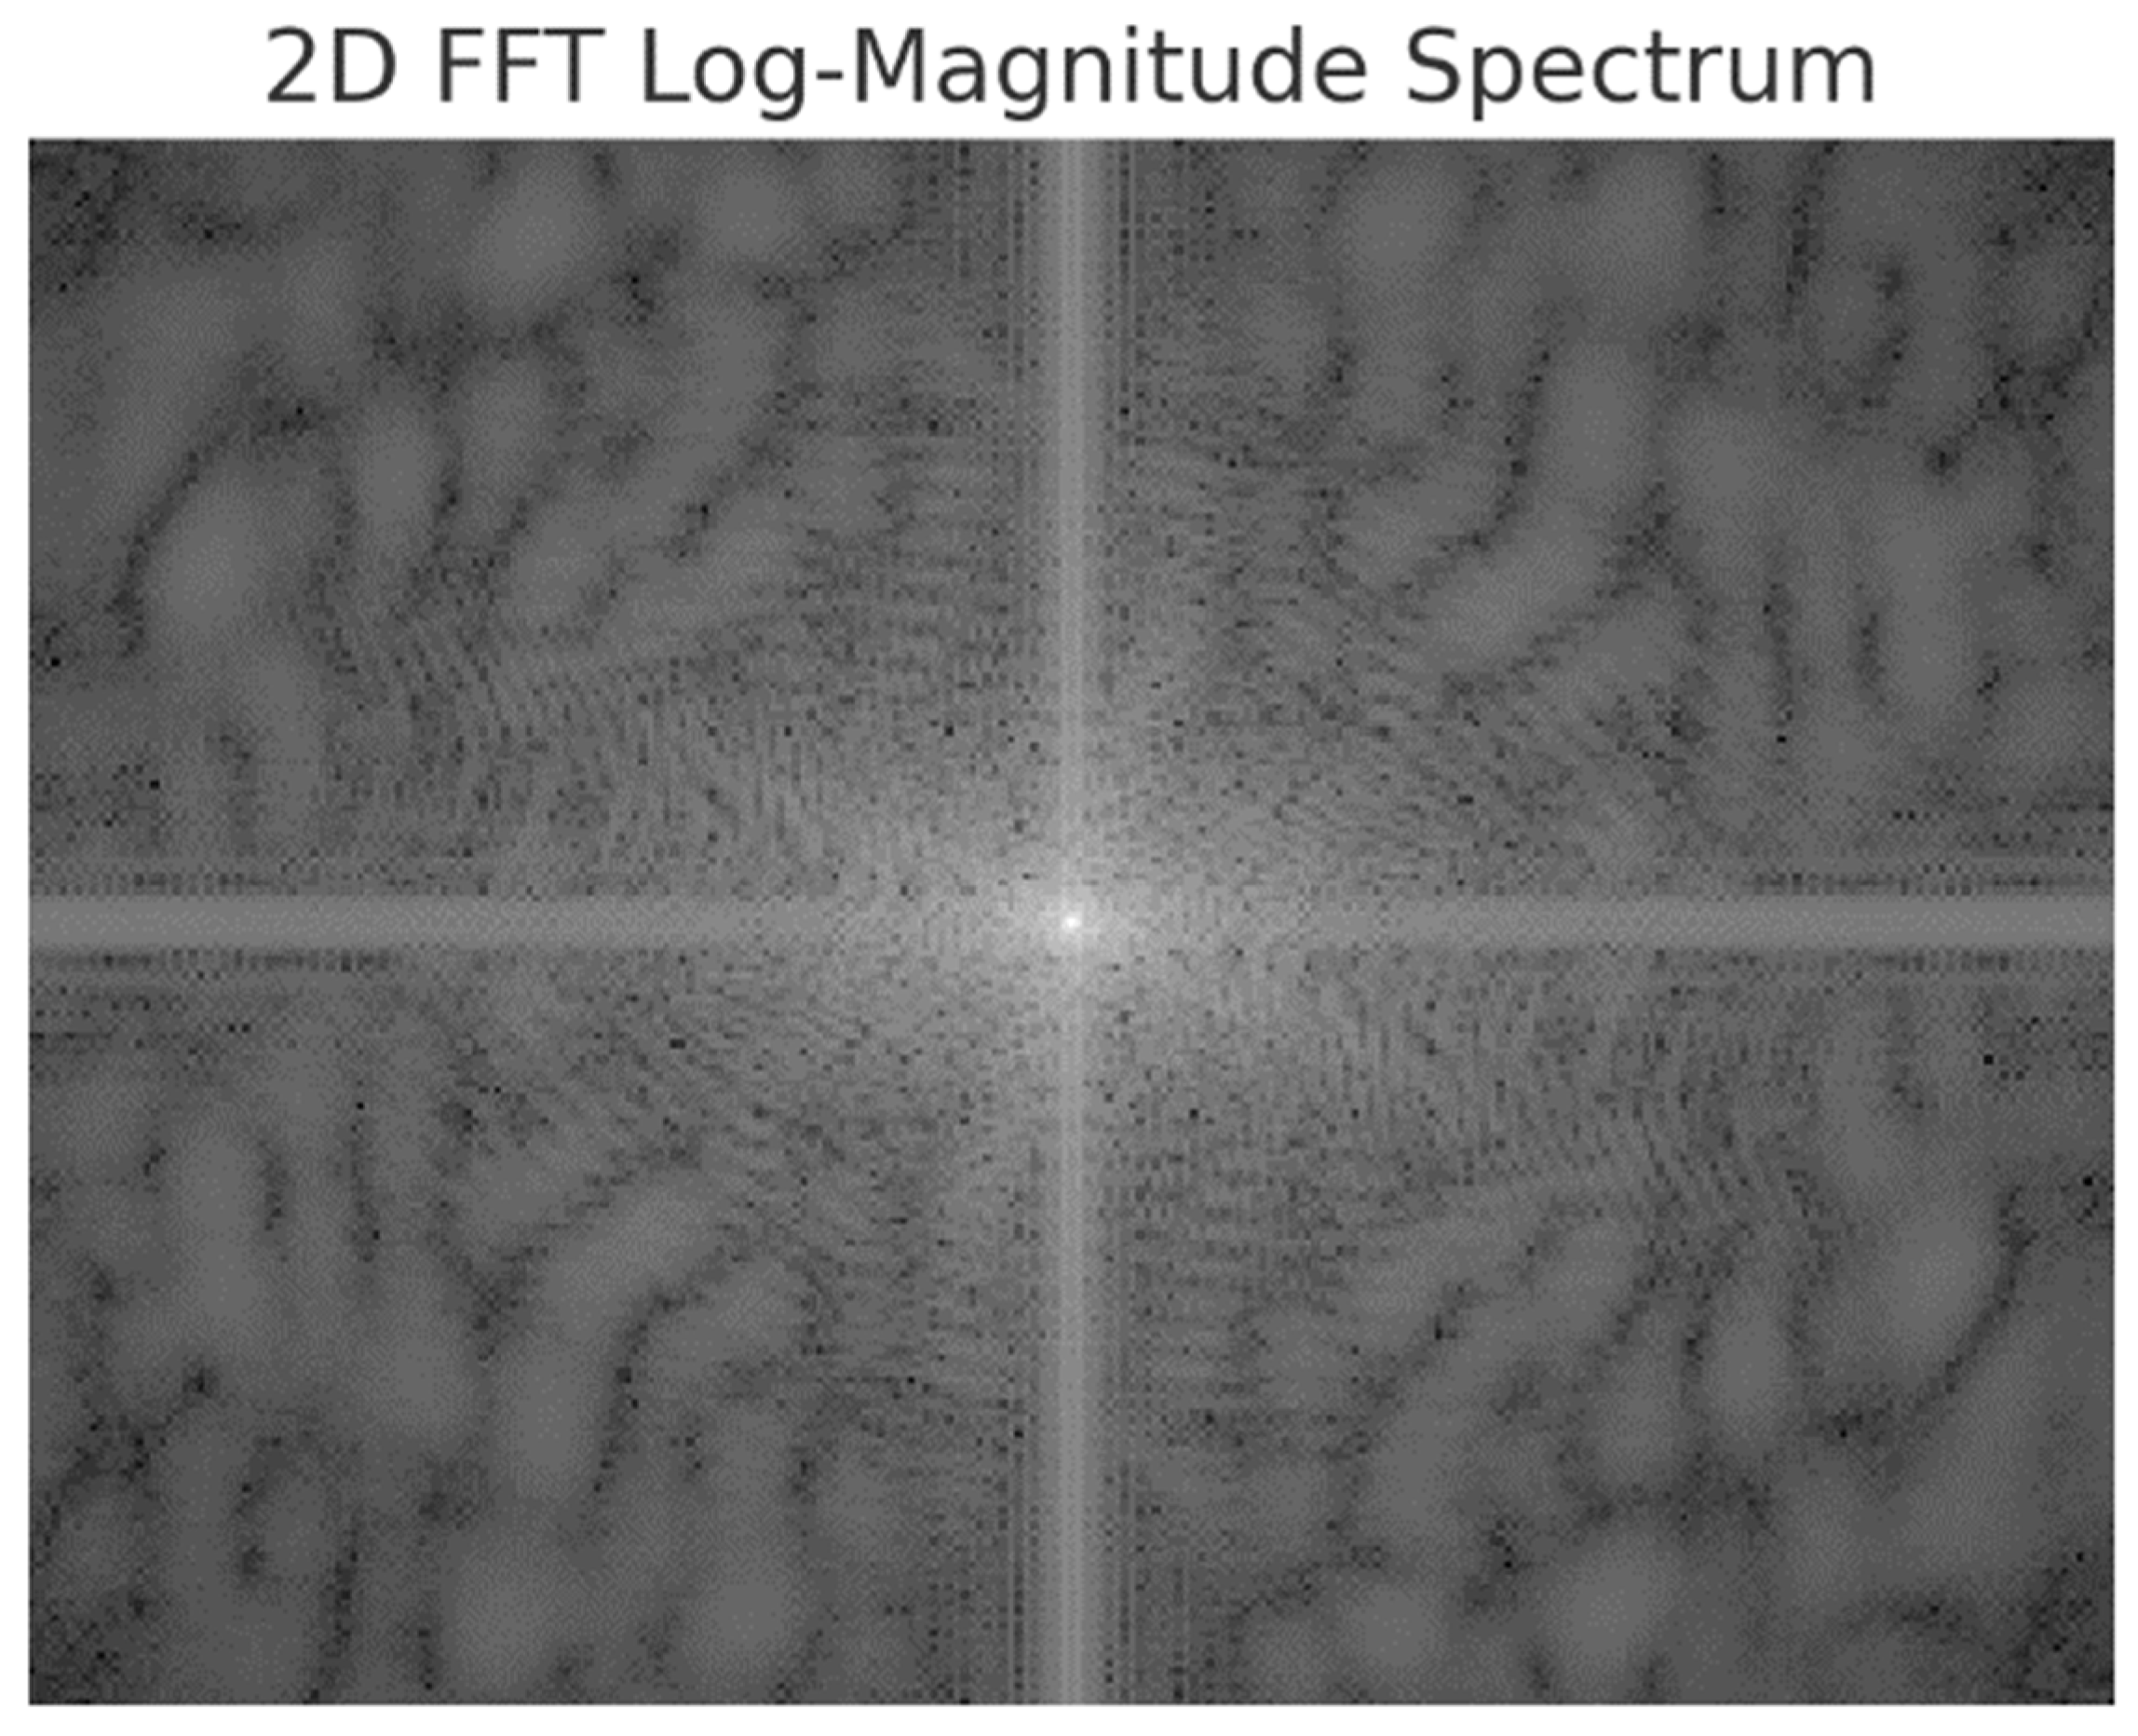
The logarithmic magnitude of the 2D Fourier transform shows the spatial frequency content of the image (
Figure 11). Bright areas near the center indicate dominant low-frequency components, corresponding to global temperature gradients.
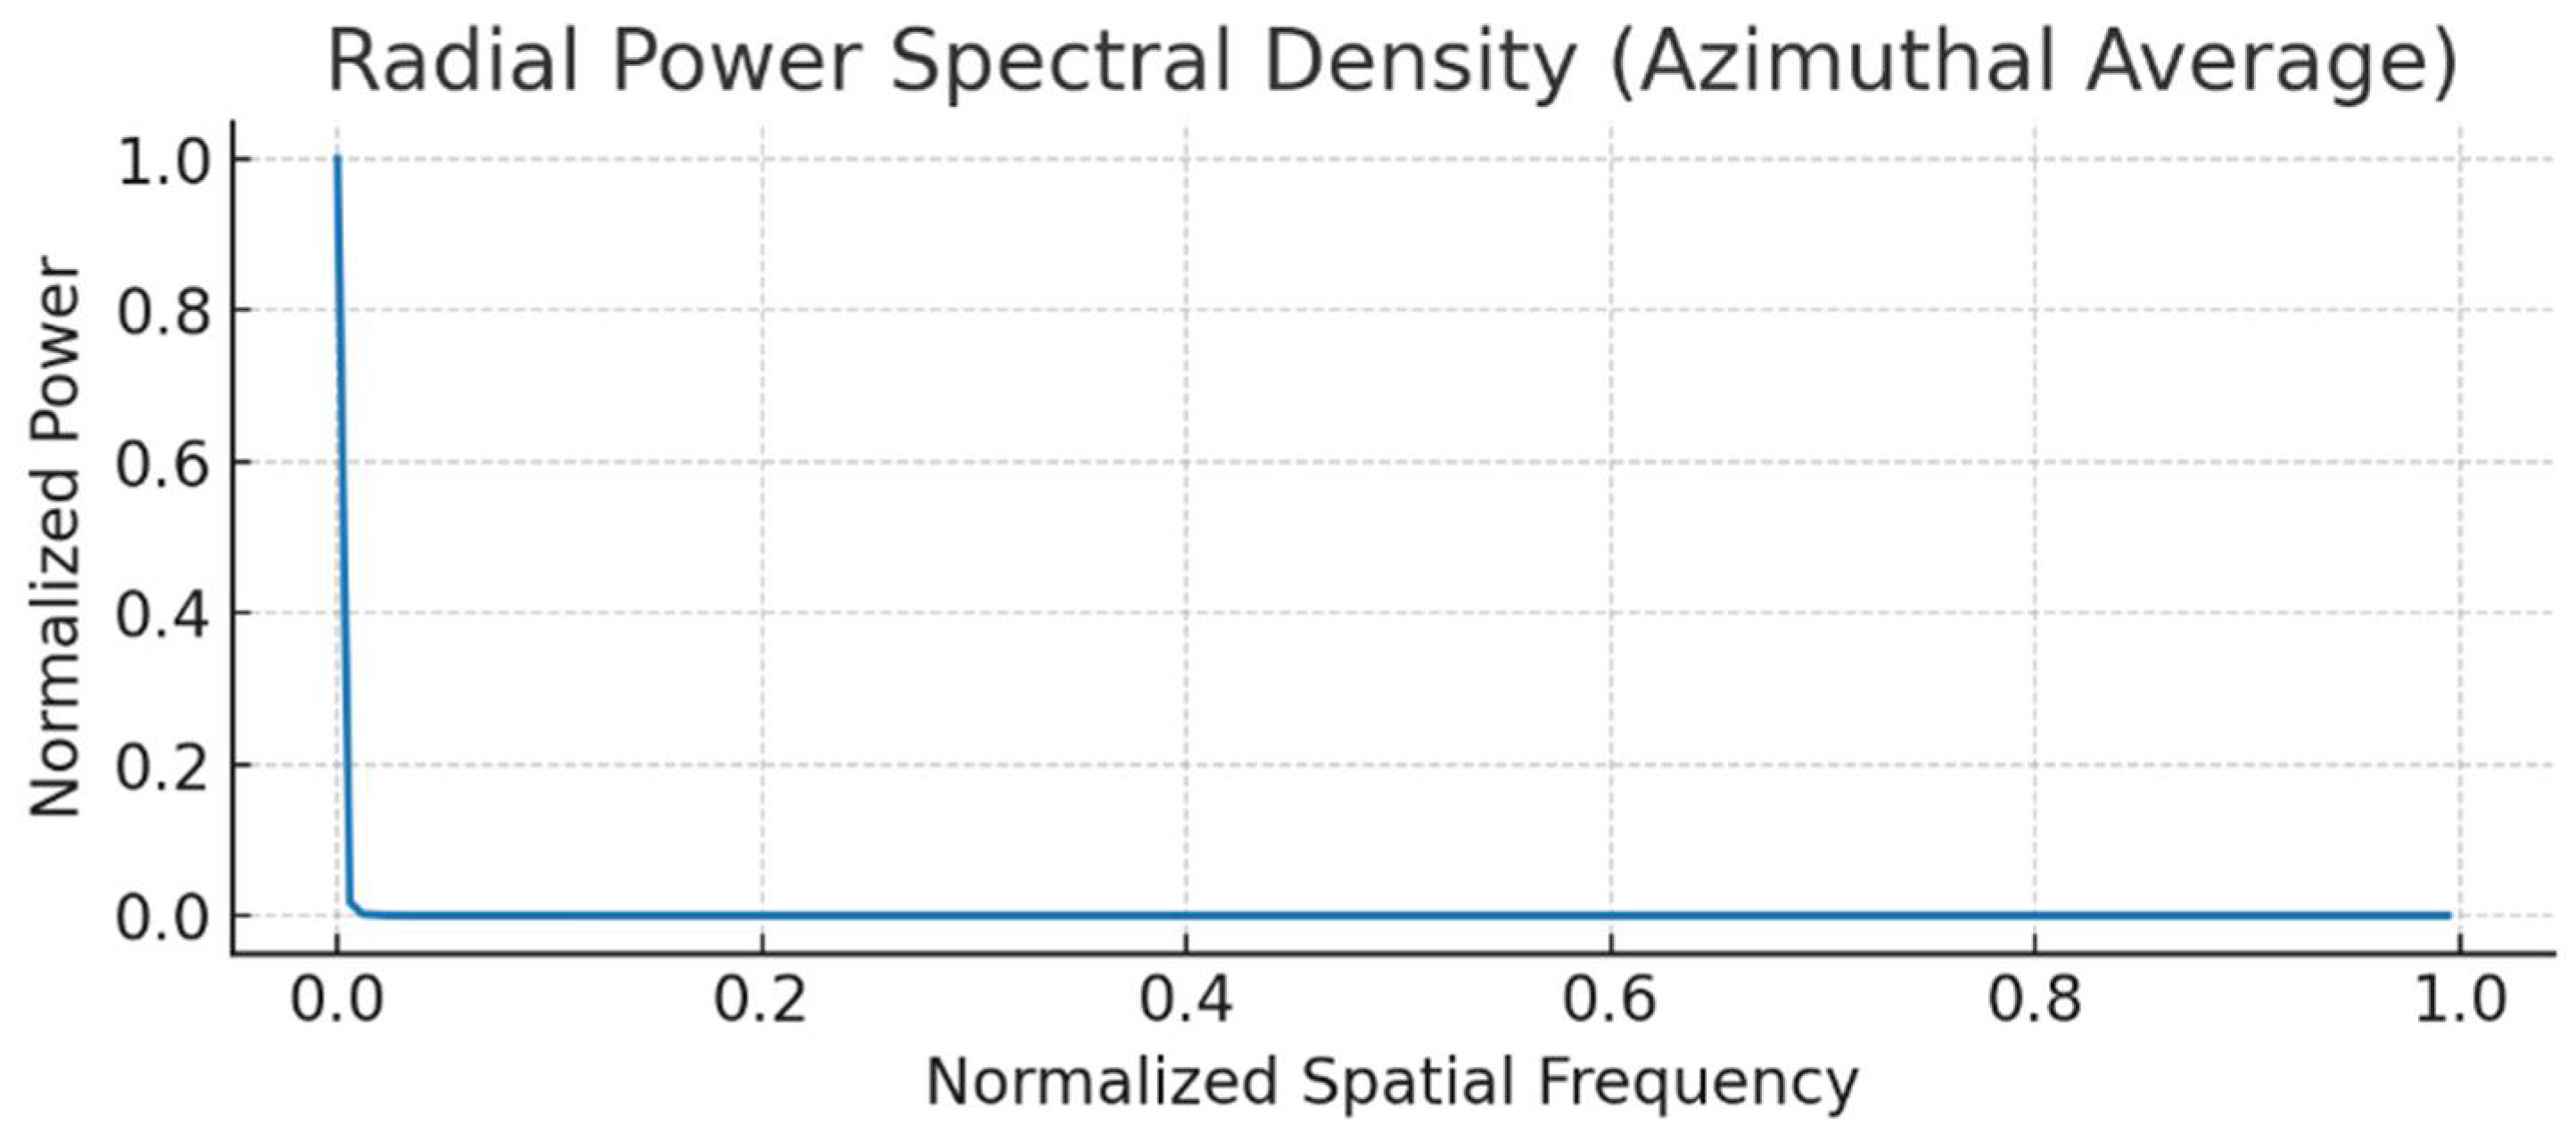
The azimuthally averaged power spectral density illustrates (
Figure 12) how energy is distributed across normalized spatial frequencies. The curve highlights that most of the thermal information is concentrated at low frequencies, with reduced contributions from higher-frequency details.
Low-pass filtering emphasizes the global thermal distribution (
Figure 13), band-pass filtering highlights structural details and intermediate patterns, while high-pass filtering isolates edges and sharp transitions corresponding to fine-scale anomalies.
The spatial frequency analysis of thermographic images provides a complementary framework for interpreting thermal processes beyond conventional pixel-wise evaluation. The initial grayscale representation establishes the baseline thermal field, while the two-dimensional Fourier transform reveals the spatial frequency components underlying the image. The logarithmic magnitude spectrum highlights the dominance of low-frequency contributions, which correspond to large-scale thermal gradients and global heating patterns, while higher-frequency components capture finer details and localized irregularities [
42].
The radial power spectral density offers a quantitative description of how thermal energy is distributed across spatial scales, demonstrating that the majority of the image content is concentrated in low frequencies [
48]. This provides a consistent metric for comparing thermal responses under different operating states or experimental conditions. The filtered reconstructions further enhance interpretability: low-pass filtering isolates global propagation trends, band-pass filtering emphasizes meso-scale structures such as couplings or junctions, and high-pass filtering accentuates edges, hotspots, and discontinuities [
49].
Together, these results show that frequency-domain analysis extends the capability of thermographic investigations by separating overlapping phenomena across different spatial scales. This approach is particularly useful for detecting subtle defects, identifying critical hotspots, and differentiating between global, structural, and localized effects. In the context of electric drive systems and material diagnostics, such methods significantly strengthen both the qualitative and quantitative understanding of thermal behavior, supporting more reliable condition monitoring and predictive analysis.
In addition to enhancing defect detection, spatial frequency analysis also provides a bridge between experimental thermographic observations and theoretical modeling approaches such as similarity theory. By decomposing temperature fields into frequency-dependent components, it becomes possible to compare experimental measurements with model-based predictions of heat transfer behavior across multiple scales. This integration not only improves the reliability of diagnostic evaluations but also supports the development of generalized frameworks for understanding thermal propagation in complex engineering systems.
Thermal camera data used in measurement: The Fluke FLK-Ti480-PRO thermal camera (Fluke Corporation, Eindhoven, The Netherlands) is a high-performance infrared imaging device designed for professional diagnostic applications in engineering systems. It is equipped with a 640 × 480 pixel infrared detector (307,200 measurement points), providing detailed thermal images with a wide temperature measurement range from −20 °C to +1000 °C and an accuracy of ±2 °C or 2% of the reading at 25 °C. The thermal sensitivity reaches up to 50 mK (0.05 °C NETD at 30 °C), enabling the detection of even very small temperature differences. The spatial resolution of the system is 0.93 mrad with a distance-to-spot ratio of 1065:1, and the standard lens offers a field of view of 34° × 24° with a minimum focus distance of 15 cm.
The device incorporates advanced focusing technologies such as MultiSharp™ Focus (Fluke Corporation, Eindhoven, The Netherlands), which produces uniformly sharp images across the entire field of view, and LaserSharp® Auto Focus (Fluke Corporation, Eindhoven, The Netherlands), which uses a built-in laser distance meter to guarantee precise focusing. In addition, the super resolution software feature can reconstruct images up to 1280 × 960 pixels, improving the visibility of fine details. The instrument also supports IR-Fusion® technology, allowing the blending of infrared and visible light images, and offers Picture-in-Picture visualization modes for enhanced interpretability.
Data visualization and user interaction are facilitated by a rugged 3.5-inch LCD touch display. The camera further supports wireless communication through the Fluke Connect® system, enabling image transfer via Wi-Fi to mobile devices and PCs for real-time sharing and analysis. Additional features include IR-PhotoNotes™, audio annotations, and extended data storage capabilities with 4 GB internal memory and expandable micro-SD cards. Connectivity options comprise USB, HDMI, LAN, and video streaming functions, supporting flexible integration into laboratory or field workflows.
Power is supplied by rechargeable lithium-ion smart batteries, each capable of providing 2–3 h of operation, with charging options available both in the instrument and via a dual charging station. The housing is designed to withstand harsh environments, with an operating temperature range from −10 °C to +50 °C and IP54 environmental protection against dust and water ingress. With its compact dimensions of 27.7 × 12.2 × 16.7 cm and ergonomic pistol-grip design, the Fluke FLK-Ti480-PRO offers an excellent balance of portability, durability, and measurement capability.
In summary, this thermal camera combines high resolution, wide dynamic measurement capability, superior focusing technologies, and robust connectivity features, making it a highly versatile instrument for thermographic investigations, fault detection, and predictive diagnostics in electric drives and other complex engineering systems.
5.5. Thermal Conductivity and Material Properties
Thermal conductivity is a material property that measures the ability of a material to conduct heat. It directly influences the rate of heat transfer within a solid and plays a critical role in determining temperature distribution under steady-state conditions.
Thermal diffusivity represents how quickly a material (
Table 1) can adjust its temperature when subjected to a thermal gradient. It combines thermal conductivity, density, and specific heat, indicating the speed of heat propagation within the material, especially under transient conditions.
Both properties are fundamental in heat conduction analysis, as they govern the heat flow behavior and temperature response of materials in engineering systems.
6. Discussion
The integrated analysis of thermal management and drivetrain waste heat recovery in electric vehicles demonstrates significant potential for improving overall energy efficiency, enhancing component reliability, and supporting the sustainability goals of electric mobility. Simulation results and system-level evaluations confirm that effective thermal control of critical subsystems—namely batteries, inverters, and electric motors—reduces overheating risk, mitigates thermal fatigue, and contributes to extended component lifespan. Moreover, the utilization of recovered waste heat for auxiliary functions such as cabin heating or battery pre-conditioning has been shown to lower battery energy demand, particularly under low ambient temperature conditions, thereby increasing vehicle driving range.
However, the implementation of such integrated thermal systems introduces challenges in terms of system complexity, control coordination, and cost. The trade-off between thermal efficiency and system simplicity was evident in design optimization studies, where advanced control algorithms and multi-domain simulation tools were necessary to identify feasible configurations. Despite these constraints, ongoing developments in materials, power electronics integration, and real-time control strategies increasingly enable the deployment of high-performance thermal architectures without significantly compromising design compactness or cost-efficiency.
In parallel, drivetrain optimization with dual synchronous motor configurations revealed that energy efficiency can be further improved through intelligent gear-shifting control. A gear-selection algorithm was developed that dynamically tracks the torque–speed efficiency maps of both electric machines, ensuring operation within their optimal efficiency zones across variable load conditions. This control method relies on real-time load estimation and torque–speed trajectory forecasting to determine the most energy-efficient gear ratio at each moment. The resulting strategy successfully minimized system losses and enhanced thermal performance by reducing unnecessary heat buildup in motors and power electronics.
Overall, the results indicate that the coordinated optimization of thermal management and gear-shift control is a technically viable and strategically effective approach to increasing driving range, extending component longevity, and improving the performance of electric vehicle propulsion systems under dynamic operating conditions.
7. Conclusions
The advancement of thermal management strategies and energy efficiency optimization in electric drive systems has emerged as a critical focus area across mechanical, electrical, and energy engineering domains. As the electrification of transportation accelerates, the performance, safety, and durability of key subsystems—including electric motors, inverters, batteries, and cooling structures—depend increasingly on the accurate prediction, control, and reuse of thermal energy [
1,
2,
3,
4,
5,
6]. Experimental and numerical research has consistently demonstrated that uncontrolled thermal loads lead to performance degradation, shortened component lifespan, and in extreme cases, system failure [
7,
8,
9,
10,
11].
High-fidelity thermal modeling has become indispensable for understanding complex heat propagation mechanisms in multi-material, transient environments, especially in applications involving power-dense rotating machines and compact electric drivetrain architectures [
12,
13,
14,
15,
16,
17]. Techniques such as finite element methods, lumped parameter thermal networks, and computational fluid dynamics offer powerful tools for simulating the temperature distribution, heat accumulation, and cooling dynamics in critical regions such as motor windings, shaft couplings, and inverter modules [
18,
19,
20,
21,
22,
23,
24].
In addition to dissipation modeling, significant attention has been directed toward heat recovery and reuse, particularly in the context of vehicle thermal integration. Research shows that recapturing waste heat for auxiliary loads—such as cabin heating, battery pre-conditioning, and defrosting—can substantially reduce HVAC-related energy consumption, especially in cold climates, and thereby extend driving range [
25,
26,
27,
28,
29,
30,
31]. Integrated thermal loops, thermally aware control strategies, and optimized transmission-shifting algorithms all contribute to more efficient energy utilization across various driving conditions [
32,
33,
34,
35,
36,
37].
Recent work also emphasizes the coupling between mechanical losses and heat generation, particularly in drive elements such as bearings, gearboxes, and couplings [
38,
39,
40,
50,
51]. The influence of torque transmission, misalignment, and frictional heating in these components not only affects local thermal fields but also introduces significant implications for global system efficiency and mechanical reliability [
52,
53,
54]. Accurate measurement methods—including infrared thermography, embedded thermal sensors, and neutron imaging—have improved the resolution and fidelity of experimental validation [
55,
56,
57], while hybrid analytical–numerical approaches increasingly allow for real-time thermal behavior prediction [
58,
59,
60].
The role of material properties—thermal conductivity, specific heat capacity, viscosity, and emissivity—has also been recognized as central to the formulation of heat transfer models under both steady-state and transient boundary conditions [
61,
62,
63,
64,
65,
66,
67]. The application of generalized and non-linear heat transfer models, including those accounting for temperature-dependent properties, has further enhanced the accuracy of simulations and expanded their applicability to non-Newtonian fluids, hybrid cooling media, and extreme environmental scenarios [
68,
69,
70].
In conclusion, the collective body of research affirms that effective thermal management, predictive modeling, and strategic waste heat recovery are not only essential for improving energy efficiency but also represent critical enablers of reliability, safety, and sustainability in next-generation electric vehicle systems. The integration of thermal considerations into early-stage design, combined with real-time control and system-level coordination, defines the path forward for high-performance, thermally resilient electric propulsion platforms [
71,
72].
