Article

On the Use of the Detectivity Parameter for the Condition Monitoring of Wind Turbines

1
Department of Sciences and Method for Engineering, University of Modena and Reggio Emilia, Via Amendola 2, 42122 Reggio Emilia, Italy
2
Interdepartmental Center En&Tech, University of Modena and Reggio Emilia, Tecnopolo di Reggio Emilia—Area Ex-Reggiane, Piazzale Europa, 1, 42124 Reggio Emilia, Italy
*
Author to whom correspondence should be addressed.
Machines 2025, 13(11), 980; https://doi.org/10.3390/machines13110980
Submission received: 11 September 2025 / Revised: 21 October 2025 / Accepted: 22 October 2025 / Published: 24 October 2025

Abstract

This study investigates the application of Detectivity, a composite metric derived from Hjorth’s parameters, for the condition monitoring of wind turbines. These parameters were originally introduced to describe the morphology of biomedical signals, and they consist of three scalar descriptors: Activity, Mobility, and Complexity, capturing, respectively, signal variance, frequency content, and waveform shape. Detectivity, proposed in a previous work by the authors as a condensation of Hjorth’s parameters, can be interpreted as the total gain in these parameters with respect to a reference condition corresponding to a healthy component. The analysis is conducted on two distinct datasets. The first, publicly available from the Luleå University website, contains vibration data from six wind turbines in a Swedish wind farm, one of which is affected by a bearing fault. A robust methodology was developed to manage the strong variability in rotational speed. The second dataset includes vibration signals from a 2 MW commercial turbine, acquired over 50 consecutive days during which an inner race fault progressively developed. The use of the Detectivity cumulant proved particularly effective: in the first case, it clearly identified the faulty machine; in the second, it enabled the detection of the time at which the probable onset of the fault occurred.

1. Introduction

1.1. Motivation and Background

Wind turbines are critical assets in the transition toward sustainable energy production. Their continuous operation in harsh and variable environmental conditions makes them susceptible to mechanical faults, particularly in components such as bearings and gearboxes. Early fault detection is essential to avoid unexpected failures, reduce maintenance costs, and ensure energy efficiency. Traditional condition monitoring techniques often rely on complex signal processing or machine learning models, which may require extensive training data and computational resources. In contrast, scalar indicators offer a simpler and more interpretable alternative, especially for real-time monitoring. Hjorth’s parameters have shown promise in capturing essential features of vibration signals, whereby, building on this foundation, the Detectivity parameter represents a composite metric that condenses the information from Hjorth’s descriptors into a single value. This study aims to evaluate the effectiveness of Detectivity both in identifying faults in wind turbines under non-stationary operating conditions using a real-world dataset, and in capturing the early-stage onset of damage using a real-world dataset from a turbine tested under controlled conditions. The goal is to provide a robust, scalable, and interpretable tool for condition monitoring that can be integrated into industrial maintenance workflows.

1.2. Literature Review

A wide range of techniques has been developed and is present in the literature for vibration signal analysis and extracting features that reflect the status of mechanical components, such as gearboxes [1], ball bearings [2], and rotating shafts [3]. The most adopted approach for condition monitoring and diagnostics involves processing the vibration signal captured via an accelerometer positioned near the bearing [4]. Early-stage faults generate cyclic impacts from the rolling elements, which can be detected and analyzed. These impacts exhibit periodicity in the frequency domain, although enhancing the signal-to-noise ratio is often necessary to mitigate mechanical and electrical noise [5]. To date [6], thousands of studies on condition monitoring have been published, ranging from simple statistical indicators [7] to advanced cyclostationary metrics [8]. These studies are grounded in the mechanical behavior of faulty bearings and their dynamic response, as well as in the characteristics of the resulting vibration signals [9]. In the field of signal processing, sparsity measures are employed to identify peaks within noisy signals. A signal is considered sparse when a small number of samples concentrate most of its energy. Hurley and Rickard [10] evaluated sixteen sparsity metrics based on six desirable properties defined in their work. Among these, the Gini index, Hoyer index, L2/L1-norm, and kurtosis emerged as particularly promising. More recently, Wang [11] compared several of these metrics (excluding the Hoyer index) in terms of their effectiveness in extracting repetitive transients from vibration signals, and they proposed a unified framework to integrate them. Wang et al. [12] also demonstrated that several sparsity-based spectral metrics, namely spectral Kurtosis, spectral Negative Entropy, spectral Gini Index, and spectral Smoothness Index, can all be expressed as a sum of weighted normalized squared envelopes. The key distinction among these metrics lies in the specific weighting functions applied to the normalized envelope. In this work, these metrics will be used as benchmarks, though they will be evaluated in the time domain, rather than in their spectral form. Albezzawy et al. [13] proposed an adaptive Morlet wavelet filter that leverages the Gini index for condition monitoring. Antoni [14] introduced the concept of kurtosis maximization to identify the most informative frequency band in vibration signals, a technique that has proven highly effective and is now widely adopted as a benchmark in the field. For further insights into the application of sparsity metrics in the fault diagnosis of rotating machinery, the reader is referred to [15]. In the context of gearbox condition monitoring, the use of scalar indicators to assess gear health dates back to the 1980s [16]. To this day, parameters such as FM0, FM4, NA4, M6A, and NB4 remain widely used for gear fault detection [17]. These indicators are typically associated with gear mesh frequencies or derived from the residual signal, obtained after removing deterministic components. More recently, Antoni and Borghesani [18] proposed a statistical framework based on the generalized likelihood ratio for designing condition indicators. Their approach aims to define optimal metrics tailored to the statistical nature of the signal, e.g., stationary, cyclostationary, or otherwise. While the proposed indicators offer strong performance, they come at the cost of increased computational complexity. One of the main advantages of using scalar metrics is their simplicity, which allows even non-expert operators to monitor machinery health. These parameters can be tracked over time and integrated into automated systems that trigger warnings or alarms when predefined thresholds, typically set by experienced technicians, are exceeded. In parallel, machine learning techniques have gained significant traction [19]. These methods analyze raw signals or extracted features from both healthy and faulty bearings to assess similarity with reference datasets. However, a key limitation is their reliance on historical data, which may not always be available. A promising direction involves combining model-based and data-driven approaches to deliver fast diagnostics and ensure robust algorithm maintenance [20]. For some additional advanced techniques, recently introduced in the literature, the reader is referred to [21,22,23,24].

1.3. Present Study Overview

With reference to both simple-to-implement and effective parameters for signal analysis, it is appropriate to mention time-domain descriptors known as Hjorth’s parameters, e.g., Activity, Mobility, and Complexity, originally introduced for EEG signal analysis [25], which have proven effective in summarizing the temporal and spectral characteristics of signals. These parameters have been successfully applied in various engineering contexts, including electroencephalography signals and robotics. Cocconcelli et al. [26] proposed a new metric called Detectivity, which combines the three Hjorth’s parameters into a single scalar value expressed in decibels relative to a reference condition, typically corresponding to a healthy machine state. This formulation allows Detectivity to be suitable for the continuous monitoring of machines. The present work extends a preliminary study [27] in which the authors applied a refined version of Detectivity to analyze a dataset of wind turbines [28], publicly available on the LuleåUniversity website, to monitor the occurrence of damage in one of the six tested turbines. Martin-del-Campo et al. [29] conducted a study that explored an autonomous dictionary learning approach to monitoring the conditions of six wind turbines by analyzing vibration data collected over a period of 46 months during standard activities. During the test, bearings from the first planetary stage and the helical gear stage experienced a fault on the inner race. Wind turbines are characterized by a non-stationary working condition, with abrupt changes in the speed of the main shaft. Both Hjorth’s parameters and Detectivity are sensitive to the machine’s instantaneous speed, making a pre-processing step essential to ensure robust fault detection. Specifically, data within a restricted speed range were selected, and the cumulant of the Detectivity was computed over the entire duration of the lifetime test. The resulting trends are consistent across all turbines, except for the one affected by a fault, demonstrating the effectiveness of the parameter in such a detection. This study is complemented by an additional analysis performed on a second dataset, which can be made available upon request [30], consisting of vibration signals acquired from a 2 MW utility-scale wind turbine over a 50-day period during which an inner race fault progressively developed [31]. The analysis confirms the effectiveness of the Detectivity cumulant not only in detecting the fault but also in identifying its onset timing. This is evidenced by the deviation of the trend from linearity over the period of monitoring, which would otherwise indicate a lack of variation in signal amplitude. The observed bifurcation instead suggests the localized emergence of a fault-related dynamic. The paper is structured as follows: Section 2 provides the theoretical background from Hjorth’s parameters to the definition of Detectivity; Section 3 presents the analysis of the first dataset, whose results were previously discussed in the preliminary study mentioned earlier; Section 4 extends the investigation to a second dataset, offering further validation of the approach. Finally, Section 5 summarizes the main findings and outlines the conclusions.

2. Theory of Hjorth’s Parameters and Detectivity

2.1. Synopsis

The need for quantitative descriptors of biomedical signals, particularly EEG traces, has long motivated the development of compact and interpretable parameters. Until the 1960s, traditional approaches to signal characterization predominantly relied on transforming the amplitude-time representation into the frequency domain, most commonly through Fourier analysis. Although such methods yield valuable spectral insights, they inherently discard phase information and impose a sinusoidal basis that may not accurately reflect the underlying generative mechanisms of the signal. These limitations highlight the need for compact and interpretable alternative descriptors that can capture the essential morphological features of a signal without relying on assumptions about its spectral composition. In his seminal work, Hjorth [25] proposed an alternative framework grounded in the time domain, emphasizing that a purely descriptive system based on temporal characteristics may offer a more physiologically relevant representation. He distinguished between two fundamental objectives in signal analysis: (a) the general characterization of signal morphology and (b) the detection of specific, predefined patterns. Hjorth’s parameters were designed to address the first one, providing a statistical summary of signal shape without requiring assumptions about underlying frequency components. Rather than relying on detailed histograms or zero-crossing intervals, Hjorth’s method focuses on the standard deviations of the signal and its derivatives. This leads to three scalar parameters named Activity, Mobility, and Complexity that together capture the variability of the amplitude, the average frequency content, and the complexity of the waveform of the signal. These parameters are not only computationally efficient but also robust to transformations, preserving their interpretability across both time and frequency domains. This time-domain approach offers a bridge between intuitive physical interpretations and rigorous statistical foundations, enabling real-time, low-complexity analysis of signals such as EEG, vibration, or other biomedical and mechanical data streams. To further reinforce the theoretical grounding of these parameters, Hjorth demonstrated that Activity, Mobility, and Complexity can also be derived from the statistical moments of the signal power spectrum. Specifically, Activity corresponds to the zeroth-order moment, representing total signal power; Mobility relates to the second-order moment, capturing the spread of frequency content; and Complexity involves a normalized ratio of higher-order moments, reflecting the signal’s deviation from sinusoidal regularity. This dual-domain formulation ensures that Hjorth’s parameters retain their descriptive power whether computed directly in the time domain or inferred from spectral characteristics. Building on this foundation, Cocconcelli et al. [26] proposed the Detectivity, a scalar index that fuses the three Hjorth’s parameters into a unified metric. Defined as a weighted combination of Activity, Mobility, and Complexity (typically expressed on a decibel scale relative to a reference condition), Detectivity enhances sensitivity to signal changes and facilitates long-term condition monitoring. Its robustness across domains and computational efficiency make it particularly suitable for applications in fault detection and lifecycle tracking of dynamic systems.

2.2. Time-Domain Hjorth’s Parameters Definition

Given a signal, x ( t ) , and its time derivatives, x ˙ ( t ) and x ¨ ( t ) , Hjorth’s parameters are defined as follows:
  • Activity (Act): as a measure of variance, reflects the overall energy or intensity of the signal:
    Act ( x ( t ) ) = σ 2 ( x ( t ) )
    In practical terms, it is sensitive to amplitude fluctuations and can be used to detect changes in signal power due to external perturbations, noise, or the dynamics of the underlying system. For example, in mechanical systems, an increase in Activity may indicate the onset of wear or imbalance.
  • Mobility (Mob): measures the standard deviation of the signal’s frequency content,
    Mob ( x ( t ) ) = Act ( x ˙ ( t ) ) Act ( x ( t ) ) 1 / 2
    It is particularly useful for identifying transitions in operating regimes or shifts in dominant frequency components. Since it is normalized via Activity, Mobility is invariant to amplitude scaling, making it robust for a comparative analysis across different signal magnitudes.
  • Complexity (Comp): quantifies the variation in frequency, indicating how similar the signal is to a pure sine wave,
    Comp ( x ( t ) ) = Mob ( x ˙ ( t ) ) Mob ( x ( t ) )
    It serves as a higher-order descriptor, capturing the intricacy of the waveform, and it is sensitive to the presence of fine-grained structures, such as modulations, transients, or irregular oscillations. A signal with high complexity may exhibit non-stationary behavior, multi-frequency content, or structural irregularities that are not evident from Activity or Mobility alone.
Together, these parameters form a minimal, yet expressive, feature set for the characterization of time-domain signals. Their simplicity enables efficient computation, while their interpretability supports fault-detection reasoning and pattern recognition. Moreover, their formulation based on standard deviations ensures statistical robustness and compatibility with both raw and preprocessed signals.

2.3. Frequency-Domain Interpretation of Hjorth’s Parameters

Although Hjorth’s parameters are originally formulated in the time domain, they can be rigorously interpreted through the lens of frequency-domain analysis using the concept of spectral moments. This dual representation reinforces their theoretical robustness and enables their application in contexts where spectral data is more readily available or more informative.
Let x ( t ) be a real-valued signal with Fourier transform X ( ω ) = F { x ( t ) } , whereas X * ( ω ) represents its complex conjugate, and let S ( ω ) denote its power spectral density (PSD), defined as follows:
S ( ω ) = | X ( ω ) | 2 = X ( ω ) · X * ( ω )
The n-th order spectral moment  m n is given as follows:
m n = + ω n S ( ω ) d ω
These moments describe the distribution of spectral energy across frequencies and are directly linked to Hjorth’s parameters:
  • Activity is associated with the zeroth-order spectral moment:
    Act = m 0 = + S ( ω ) d ω
    This represents the total power of the signal and corresponds to its variance in the time domain, as established by Parseval’s theorem.
  • Mobility is related to the second-order spectral moment and is defined as follows:
    Mob = m 2 m 0 1 / 2 = ω 2 S ( ω ) d ω S ( ω ) d ω 1 / 2 ,
    where the integration bounds ( to + ) are omitted to avoid overloading the notation (this simplification will be used hereafter). The given expression reflects the spread of the spectral energy around the origin and can be interpreted as the standard deviation of the frequency content. Signals with higher Mobility exhibit more rapid fluctuations or higher dominant frequencies.
  • Complexity involves a normalized combination of the fourth, second, and zeroth-order moments:
    Comp = m 4 · m 0 m 2 2 1 / 2 = ω 4 S ( ω ) d ω · S ( ω ) d ω ω 2 S ( ω ) d ω 2 1 / 2
    This parameter quantifies the deviation of the signal from a pure sinusoid. A Complexity value close to 1 indicates a narrow-band, regular waveform (e.g., a sine wave), while higher values suggest richer spectral content, broader bandwidth, or structural irregularity in the signal.
Spectral Summary:
  • m 0 : Total signal power (area under the PSD curve).
  • m 2 : Frequency-weighted power, emphasizing higher frequencies.
  • m 4 : Sensitivity to bandwidth and sharpness of spectral peaks.
The present frequency-domain formulation not only validates the time-domain definitions of Hjorth’s parameters but also extends their applicability to spectral analysis frameworks. It enables consistent feature extraction across domains and supports hybrid diagnostic strategies where both temporal and spectral characteristics are relevant. This is particularly advantageous in vibration-based monitoring, EEG analysis, and rotating machinery fault detection, where signal behavior may manifest differently, depending on the domain of observation.

2.4. Definition of Detectivity

As was extensively discussed in the previous section, each of the presented parameters captures a distinct aspect of signal behavior and contributes valuable insight into the condition of mechanical components. However, interpreting them jointly can be challenging due to their differing units, scales, and trends during fault progression. For instance, Activity and Complexity tend to increase with fault severity, while Mobility typically decreases. Moreover, Activity and Mobility are not dimensionless, which complicates direct comparison. To overcome these limitations, Cocconcelli et al. [26] introduced a new composite indicator, referred to as Detectivity; where the guiding principle that led to the development of this metric was the objective of unifying the descriptive contributions of the individual Hjorth’s parameter into a single, coherent indicator, that can effectively track the degradation of a component throughout its operational life, with particular sensitivity to changes occurring in the later stages of wear.
Detectivity is defined as a weighted combination of Hjorth’s parameters, according to the following general formulation:
Dtc dB ( x ( t ) ) = Act dB ( x ( t ) ) Mob dB ( x ( t ) ) + Comp dB ( x ( t ) ) ,
where each contribution is normalized with respect to itself computed under healthy conditions (reference), in order to have sensitivity to deviations from such a baseline:
Act dB ( x ( t ) ) = 10 log 10 Act ( x ( t ) ) Act ref Mob dB ( x ( t ) ) = 10 log 10 Mob ( x ( t ) ) Mob ref Comp dB ( x ( t ) ) = 10 log 10 Comp ( x ( t ) ) Comp ref
This normalization enables the coexistence of the three Hjorth’s parameters within the same formula, considering that mobility has significantly different dimensional characteristics compared to the other two. The use of decibels (dB) is advantageous from a graphical representation standpoint. The formulation given by Equation (9) allows Detectivity to act as a trend-sensitive indicator, where the following applies:
  • Activity increases with signal energy, often associated with fault onset or increased dynamic excitation.
  • Mobility tends to decrease when the signal becomes more irregular or lower in frequency content.
  • Complexity increases with waveform irregularity and spectral density.
Detectivity was originally developed for prognostic purposes, and in its initial formulation, it employed the healthy signal as a reference; this approach aimed to quantify deviations from the nominal operating condition of the machine over time. In more recent developments, D’Elia et al. [32] proposed a redefinition of Detectivity that does not rely on historical healthy data. Instead, Hjorth’s parameters are normalized with respect to a synthetic Gaussian reference signal, s ( t ) , with zero mean and unit variance:
Dtc ( x ( t ) ) = Act ( x ( t ) ) Act ( s ( t ) ) · Mob ( s ( t ) ) Mob ( x ( t ) ) · Comp ( x ( t ) ) Comp ( s ( t ) )
This formulation enables the use of Detectivity even in the absence of baseline data, making it suitable for single-signal analysis. Furthermore, by applying this metric across frequency bands using a filter bank or wavelet decomposition, a Spectral Detectivity map named Detectogram can be constructed. This allows for the localization of informative frequency bands associated with fault signatures.
In the present study, the availability of reliable healthy data enabled a return to the original formulation using the healthy signal as reference. Nevertheless, the considerable variability observed in the data was such that no significant fault-indicative trends could be identified. To address this issue, a refinement was introduced through the use of the cumulant of the Detectivity. Given a collection of n  D e t e c t i v i t y values, where k denotes the dynamic index associated with the current position within the cumulative vector, the k-th element of this vector is expressed as follows:
C U M k Dtc = i = 1 k Dtc i , k = 1 , 2 , , n ,
this statistical transformation generally enhances the robustness of the method, while in cases such as this, it allows for clear identification of damage, where the method in its standard version fails.
Detectivity has been successfully applied to both simulated and real-world datasets, to track rolling bearing degradation [26] and, in a preliminary work, for condition monitoring of wind turbines [27], demonstrating its robustness, sensitivity, and suitability for real-time condition monitoring: it is a statistical parameter easy to apply and effective, offering a practical alternative to more complex signal analysis techniques and machine learning algorithms, which may lead to similar results with significantly greater effort.

3. LTU Wind Turbines Dataset

3.1. Dataset Description

The Luleå University Wind Turbines Dataset, made publicly available by Martin-del-Campo, Sandin, and Strömbergsson [28], offers open access to raw time-domain vibration signals and rotational speed data collected from six wind turbines. The data were sampled at 12.8 kHz, with each signal segment lasting 1.28 s (equivalent to 16,384 samples). These segments were recorded approximately every 12 h for a period of nearly four years for each turbine. In particular, Turbine 5 experienced bearing and gearbox problems during this period. A brief overview of the experimental setup is provided below; for further technical details, readers are referred to the original publication [29]. The dataset originates from a wind farm located in northern Sweden, where all six turbines are of the same model and equipped with integrated condition monitoring systems. These systems continuously transmit data to a centralized database. Each turbine features a three-stage gearbox, comprising two planetary stages followed by a helical stage. Four accelerometers are mounted near the various gear stages within each gearbox. This study focuses on the raw axial vibration signals collected from the output shaft bearing casing of each turbine. Among the six turbines, five (Turbine 1, 2, 3, 4, and 6) remained in good operating condition throughout the data collection period. In contrast, Turbine 5 experienced two distinct bearing failures, described in detail by Martin-del-Campo et al. [29]:
  • Inner raceway failure on a four-point ball bearing on the output shaft: the output shaft bearing was replaced after 1.2 years in operation.
  • Inner raceway failure in one of the four cylindrical roller bearings that support one of the planets in the first planetary gear: the entire gearbox was replaced after 2 years in operation.
For each dataset [28], the first column contains the time stamp (in years), the second column reports the turbine rotational speed (in rpm), and the remaining columns include the raw vibration signals acquired from the accelerometer mounted on the housing of the output shaft bearing of each turbine.

3.2. Analysis Methodology

It is important to highlight that Hjorth’s parameters are sensitive to speed variations, particularly the Activity, which by definition, as previously seen, corresponds to the variance of the input signal.
As an illustrative example, Figure 1 presents the speed profile of Turbine 1 during the test period, showing continuous fluctuations between 700 and 1200 rpm. The corresponding Detectivity values (as defined in Equation (9)) are also shown, using the first acquisition in the series as a reference.
The resulting trend appears highly irregular, with significant fluctuations in the output parameter. However, it should be noted that the variations in Detectivity closely follow changes in turbine speed. This observation suggests that meaningful comparisons of Detectivity values should be made under similar speed regimes.
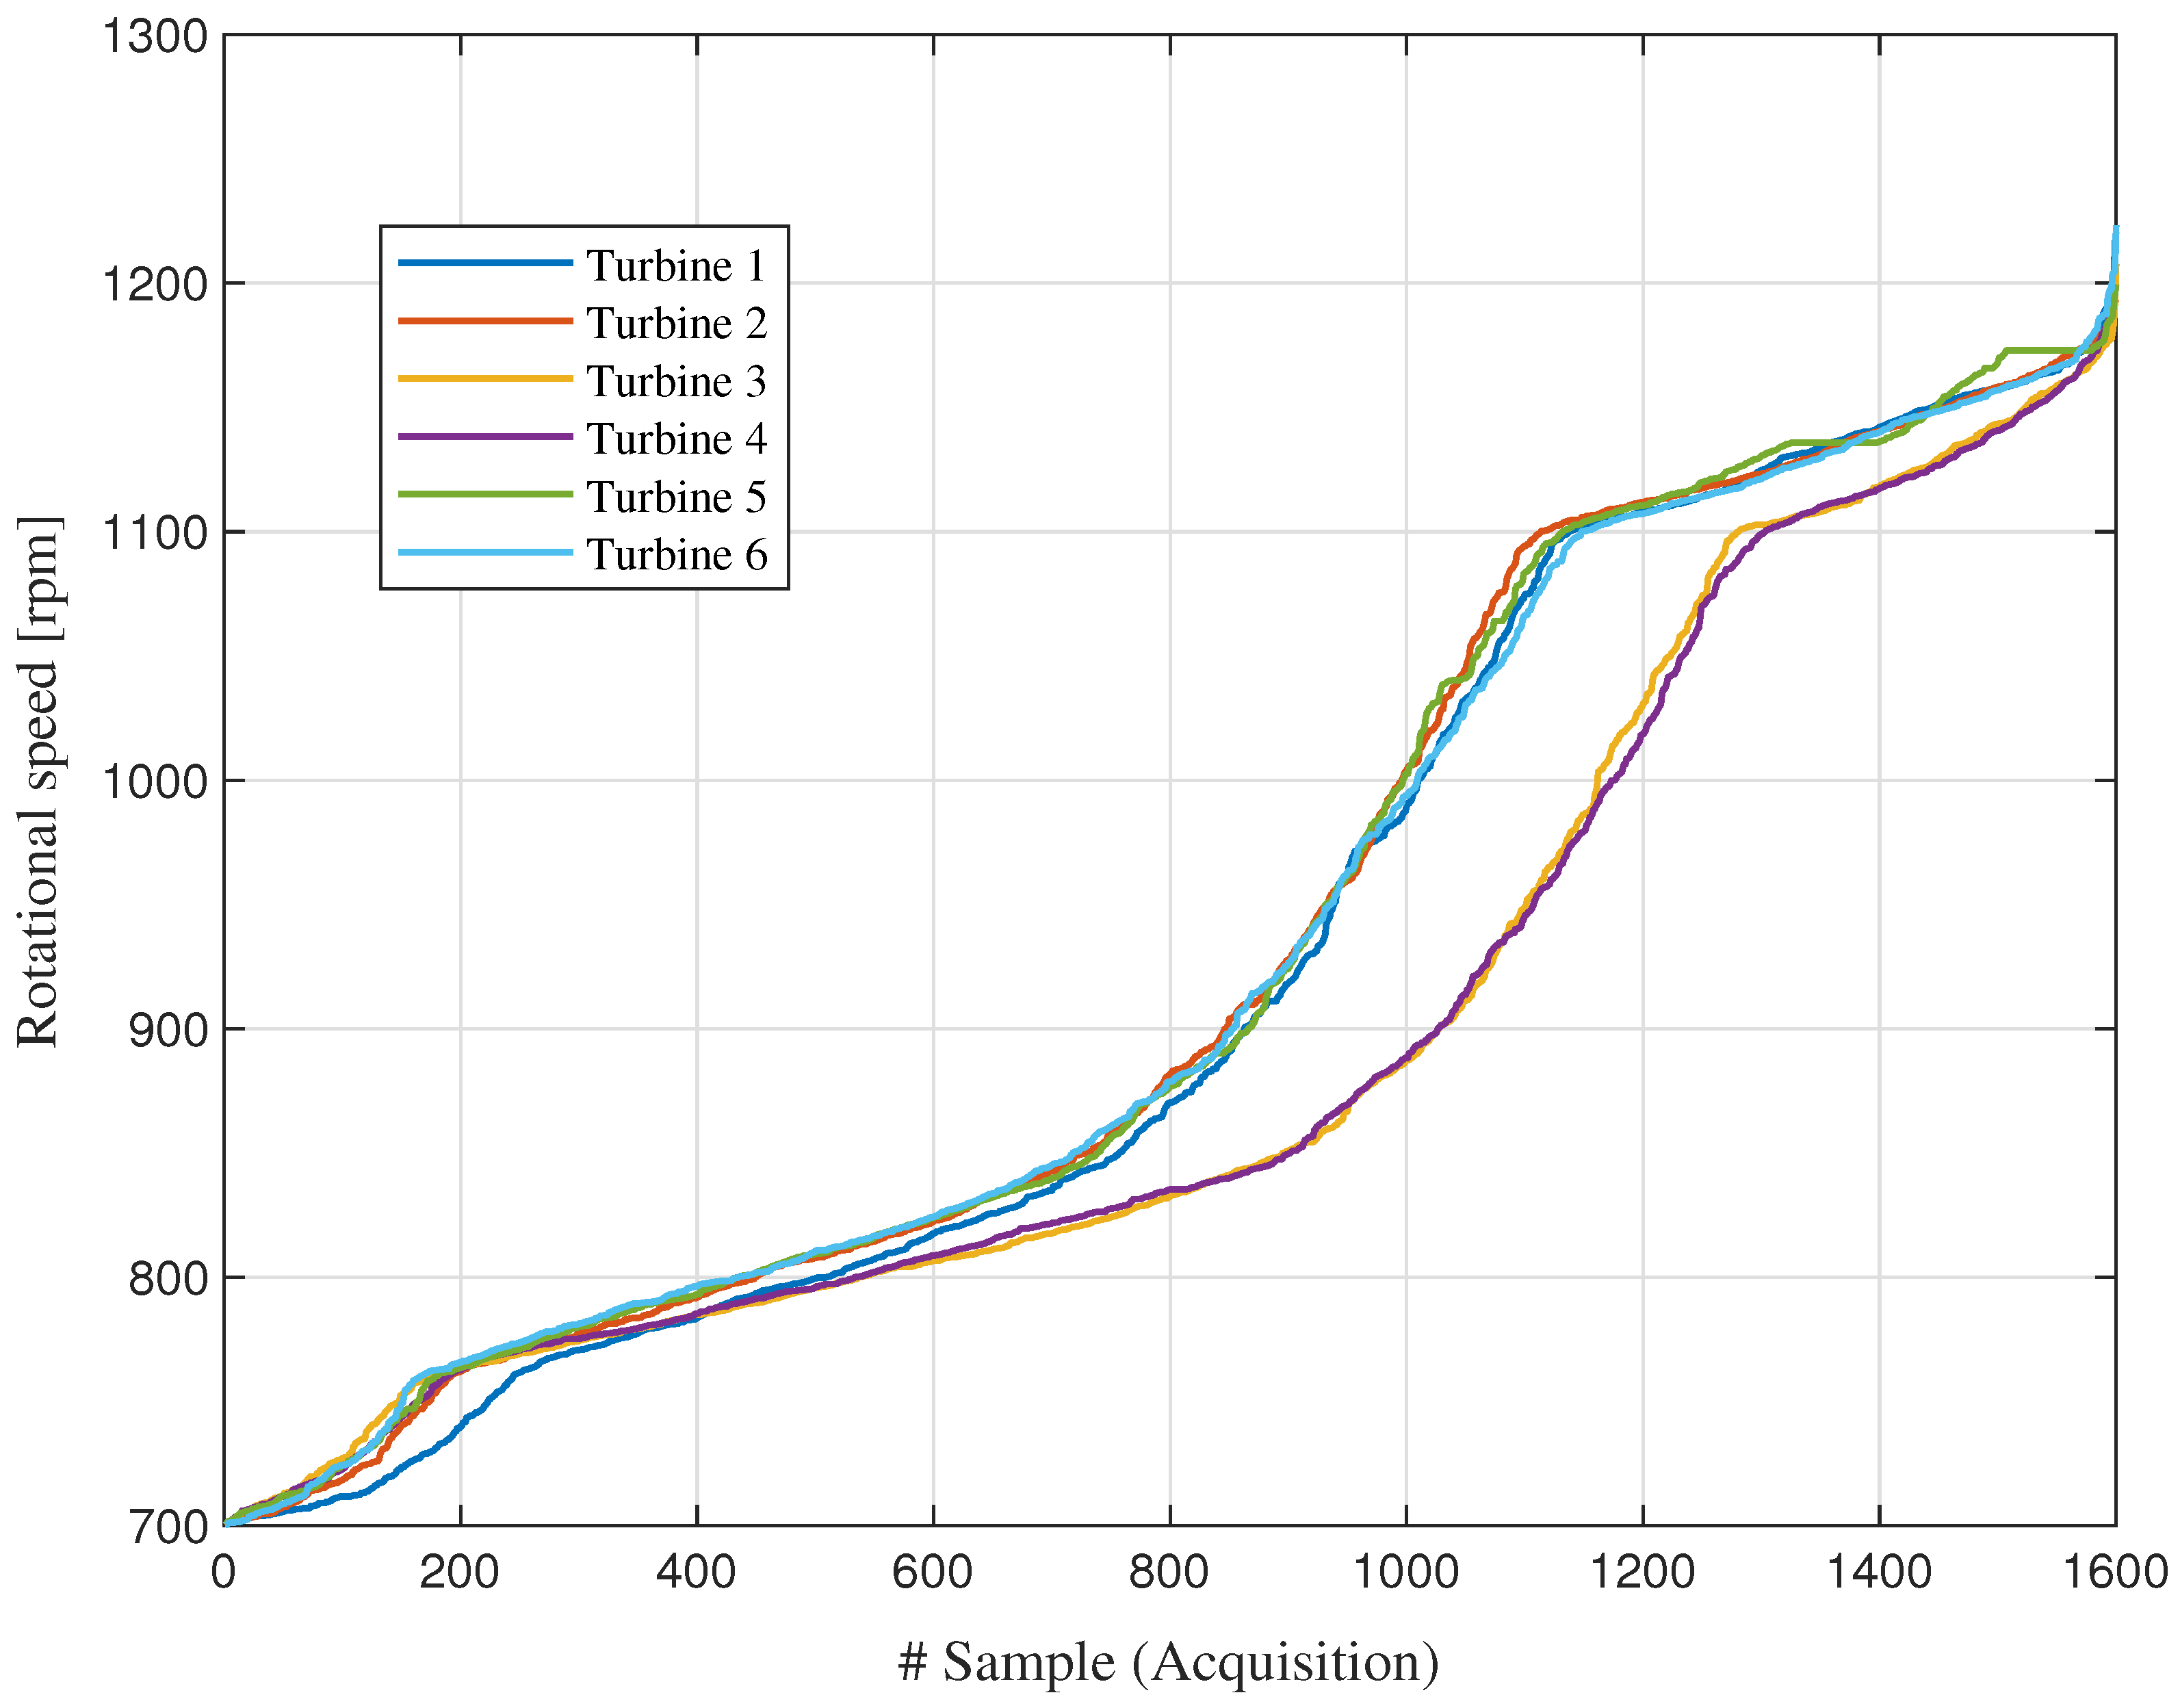
Figure 2 shows the sorted speed values for each wind turbine during the test. Since the data are no longer presented in chronological order, the x-axis represents sample indices, rather than time (years). It can be observed that certain speed intervals occur more frequently than others, indicating a higher density of samples at specific instantaneous speeds.
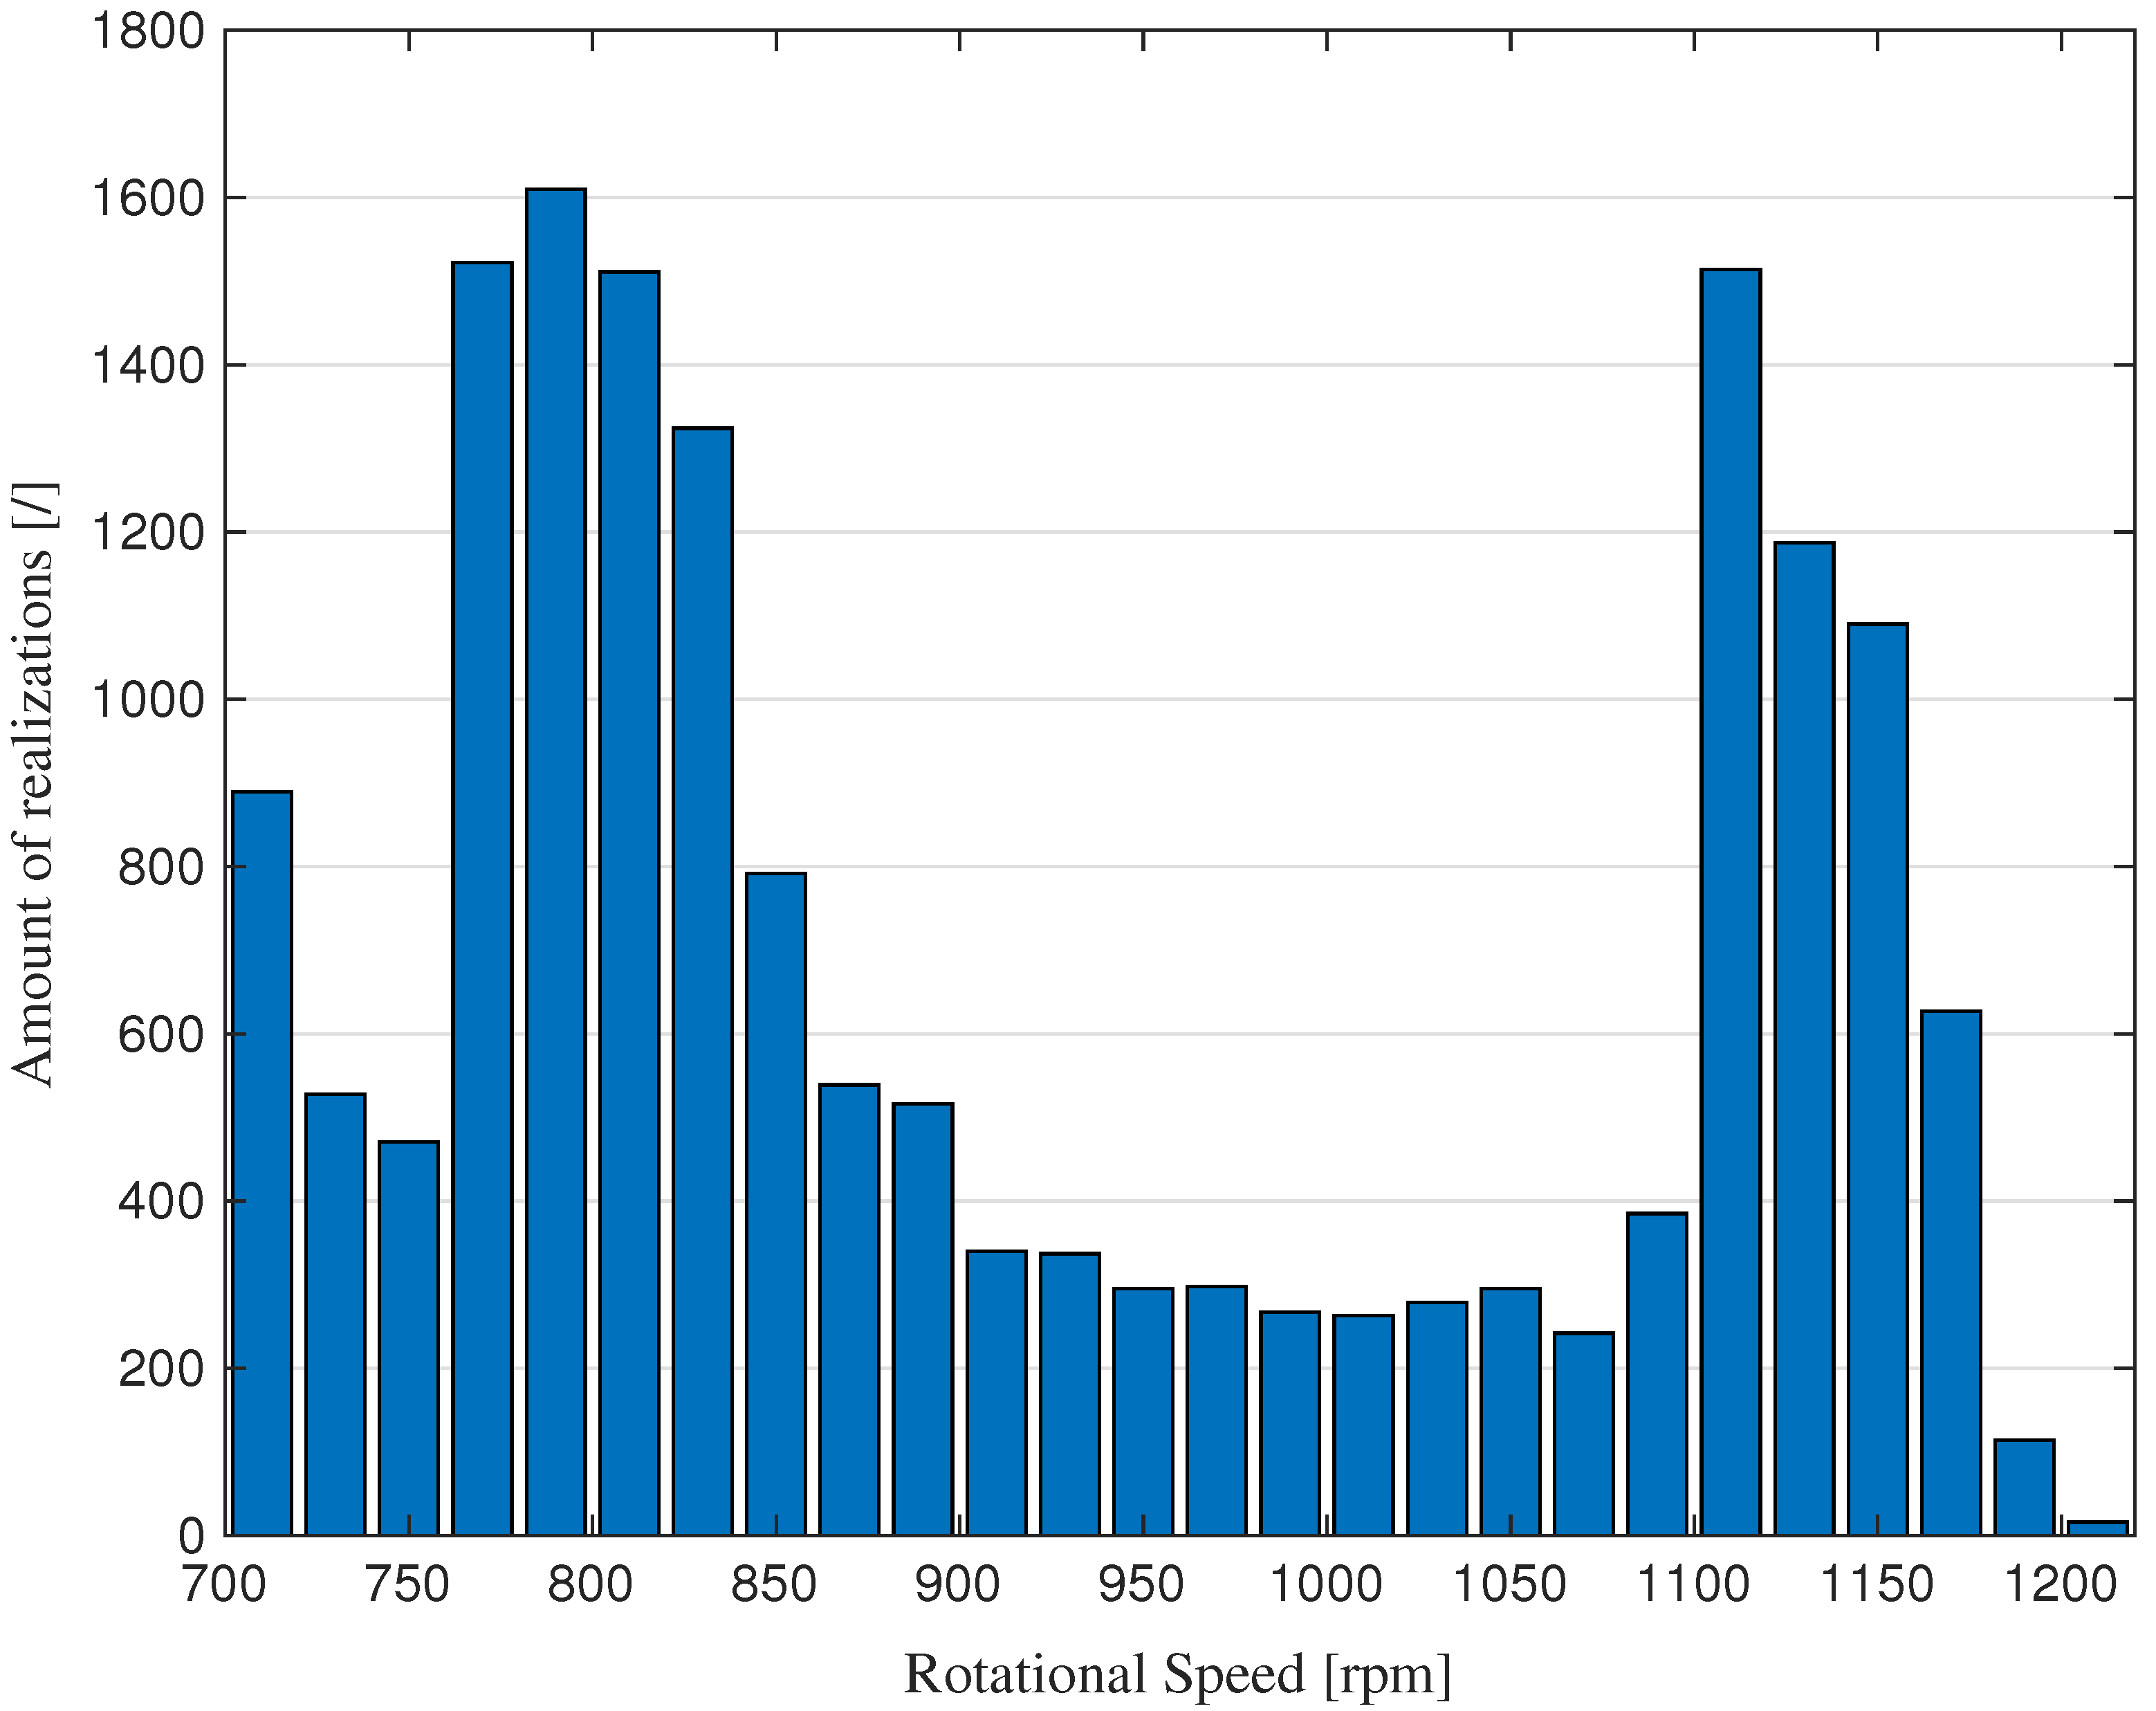
To minimize the impact of speed variability while maximizing the number of usable samples, Figure 3 presents the histogram of speed values across the six turbines. Two distinct speed intervals exhibit the highest concentration of data points (number of realizations), with the most populated range falling within [ 750 , 850 ] rpm. For each turbine, a subset of the raw data was selected, including only the measurements corresponding to this specific speed range. Then, Hjorth’s parameters were computed on these filtered subsets. The mean values of the parameters, calculated over the last 10 samples with the highest speeds (i.e., approaching 850 rpm), were used as reference values for the Detectivity computation. In this analysis, the reference values were arbitrarily derived from Turbine 1.

3.3. Results

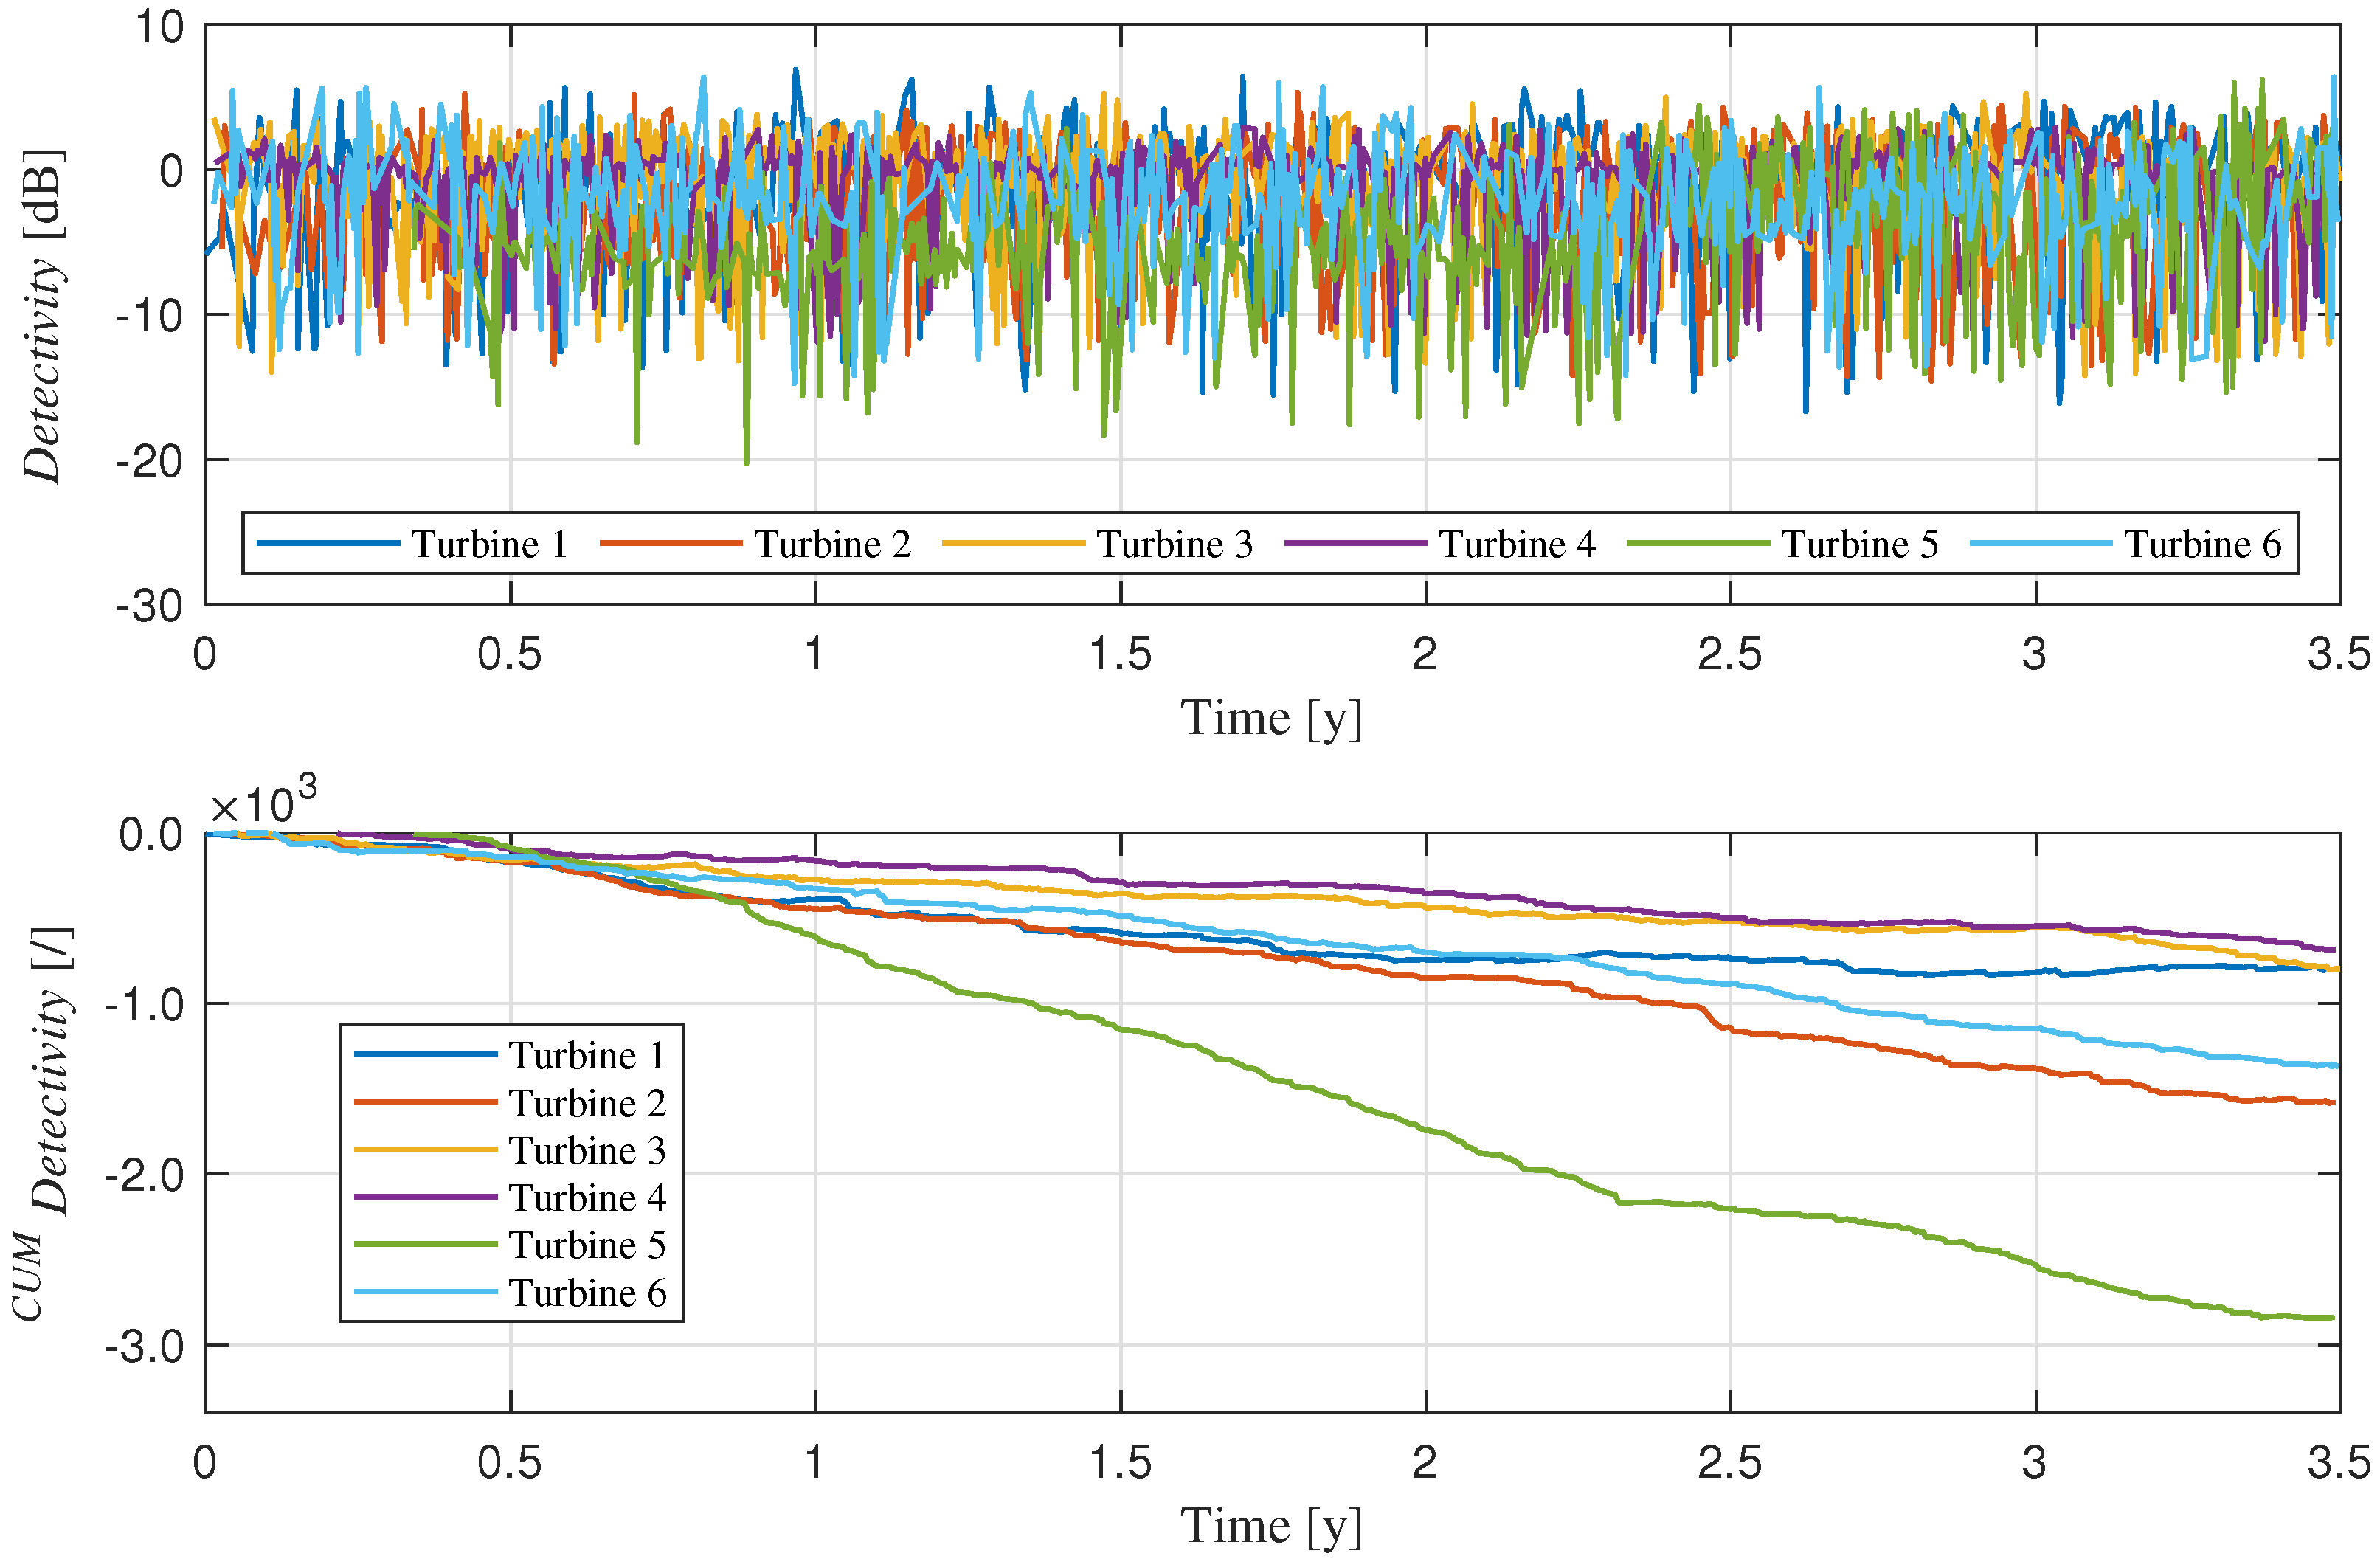
The results are presented in Figure 4. Although the instantaneous values of Detectivity exhibit fluctuations and overlapping trends across the different turbines, a closer inspection reveals subtle differences. To better highlight these distinctions, also reported is the cumulative Detectivity behavior over the entire duration of the life test for each turbine. This cumulative representation clearly distinguishes Turbine 5, whose trend significantly diverges from the others: an effect attributed to damage in the rolling bearings, as documented in [29].
To assess the impact of the reference turbine selection on the computation of Detectivity, a permutation analysis was conducted across all turbines. For each configuration, the variance in the resulting Detectivity values was used as a performance metric for fault detection. The outcomes are summarized in Table 1, where each column refers to the turbine under analysis, and each row refers to the turbine used to compute the reference values for the dB components (see Equation (10)). In addition, the calculation adopting a simulated Gaussian signal with zero mean and unit variance as reference (see Equation (11)), is reported.
Concerning the upper section of the table, the results clearly indicate that, with a single exception, the highest variance consistently occurs when turbine 5, known to be faulty, is adopted as reference. This confirms that using a damaged turbine as a baseline compromises the effectiveness of the method. In scenarios where the faulty turbine is not known a priori, the analysis in Table 1 can still be informative: if all but one turbine yield consistent results, the outlier is likely to exhibit anomalous behavior; lower section of the table shows two nearly equal values exhibit significantly higher variance, which indicates both correct anomaly detection and, in this specific case, the occurrence of a false positive.
From a comparative perspective, an attempt was made to achieve the same result using a well-established analysis method, as the Spectral Kurtosis. In an analogy with the computational methodology adopted for the Detectivity analysis, the same dataset of acceleration signals was used, selecting only those within the speed range exhibiting the highest concentration of samples, in order to ensure a full degree of comparability. By employing a fast-computation Kurtogram [33], the maximum kurtosis value was extracted for each signal. This resulted in a matrix of values, structured according to the number of machines and the number of data samples (acquisitions) falling within the selected rotational speed interval. In Figure 5, an example of Kurtogram is shown: it is possible to appreciate how, through successive levels of decomposition, the frequency band exhibiting the highest kurtosis value, which is assumed to contain the vibrational signature of a potential fault, is identified. In the present analysis, a decomposition level of 6 was selected (the remaining parameters are derived from this one), as further increasing the level did not yield any refinement in the results. Furthermore, higher decomposition levels are rare to find in the literature since excessive fragmentation can be inconvenient, as well as increasing the computational burden.
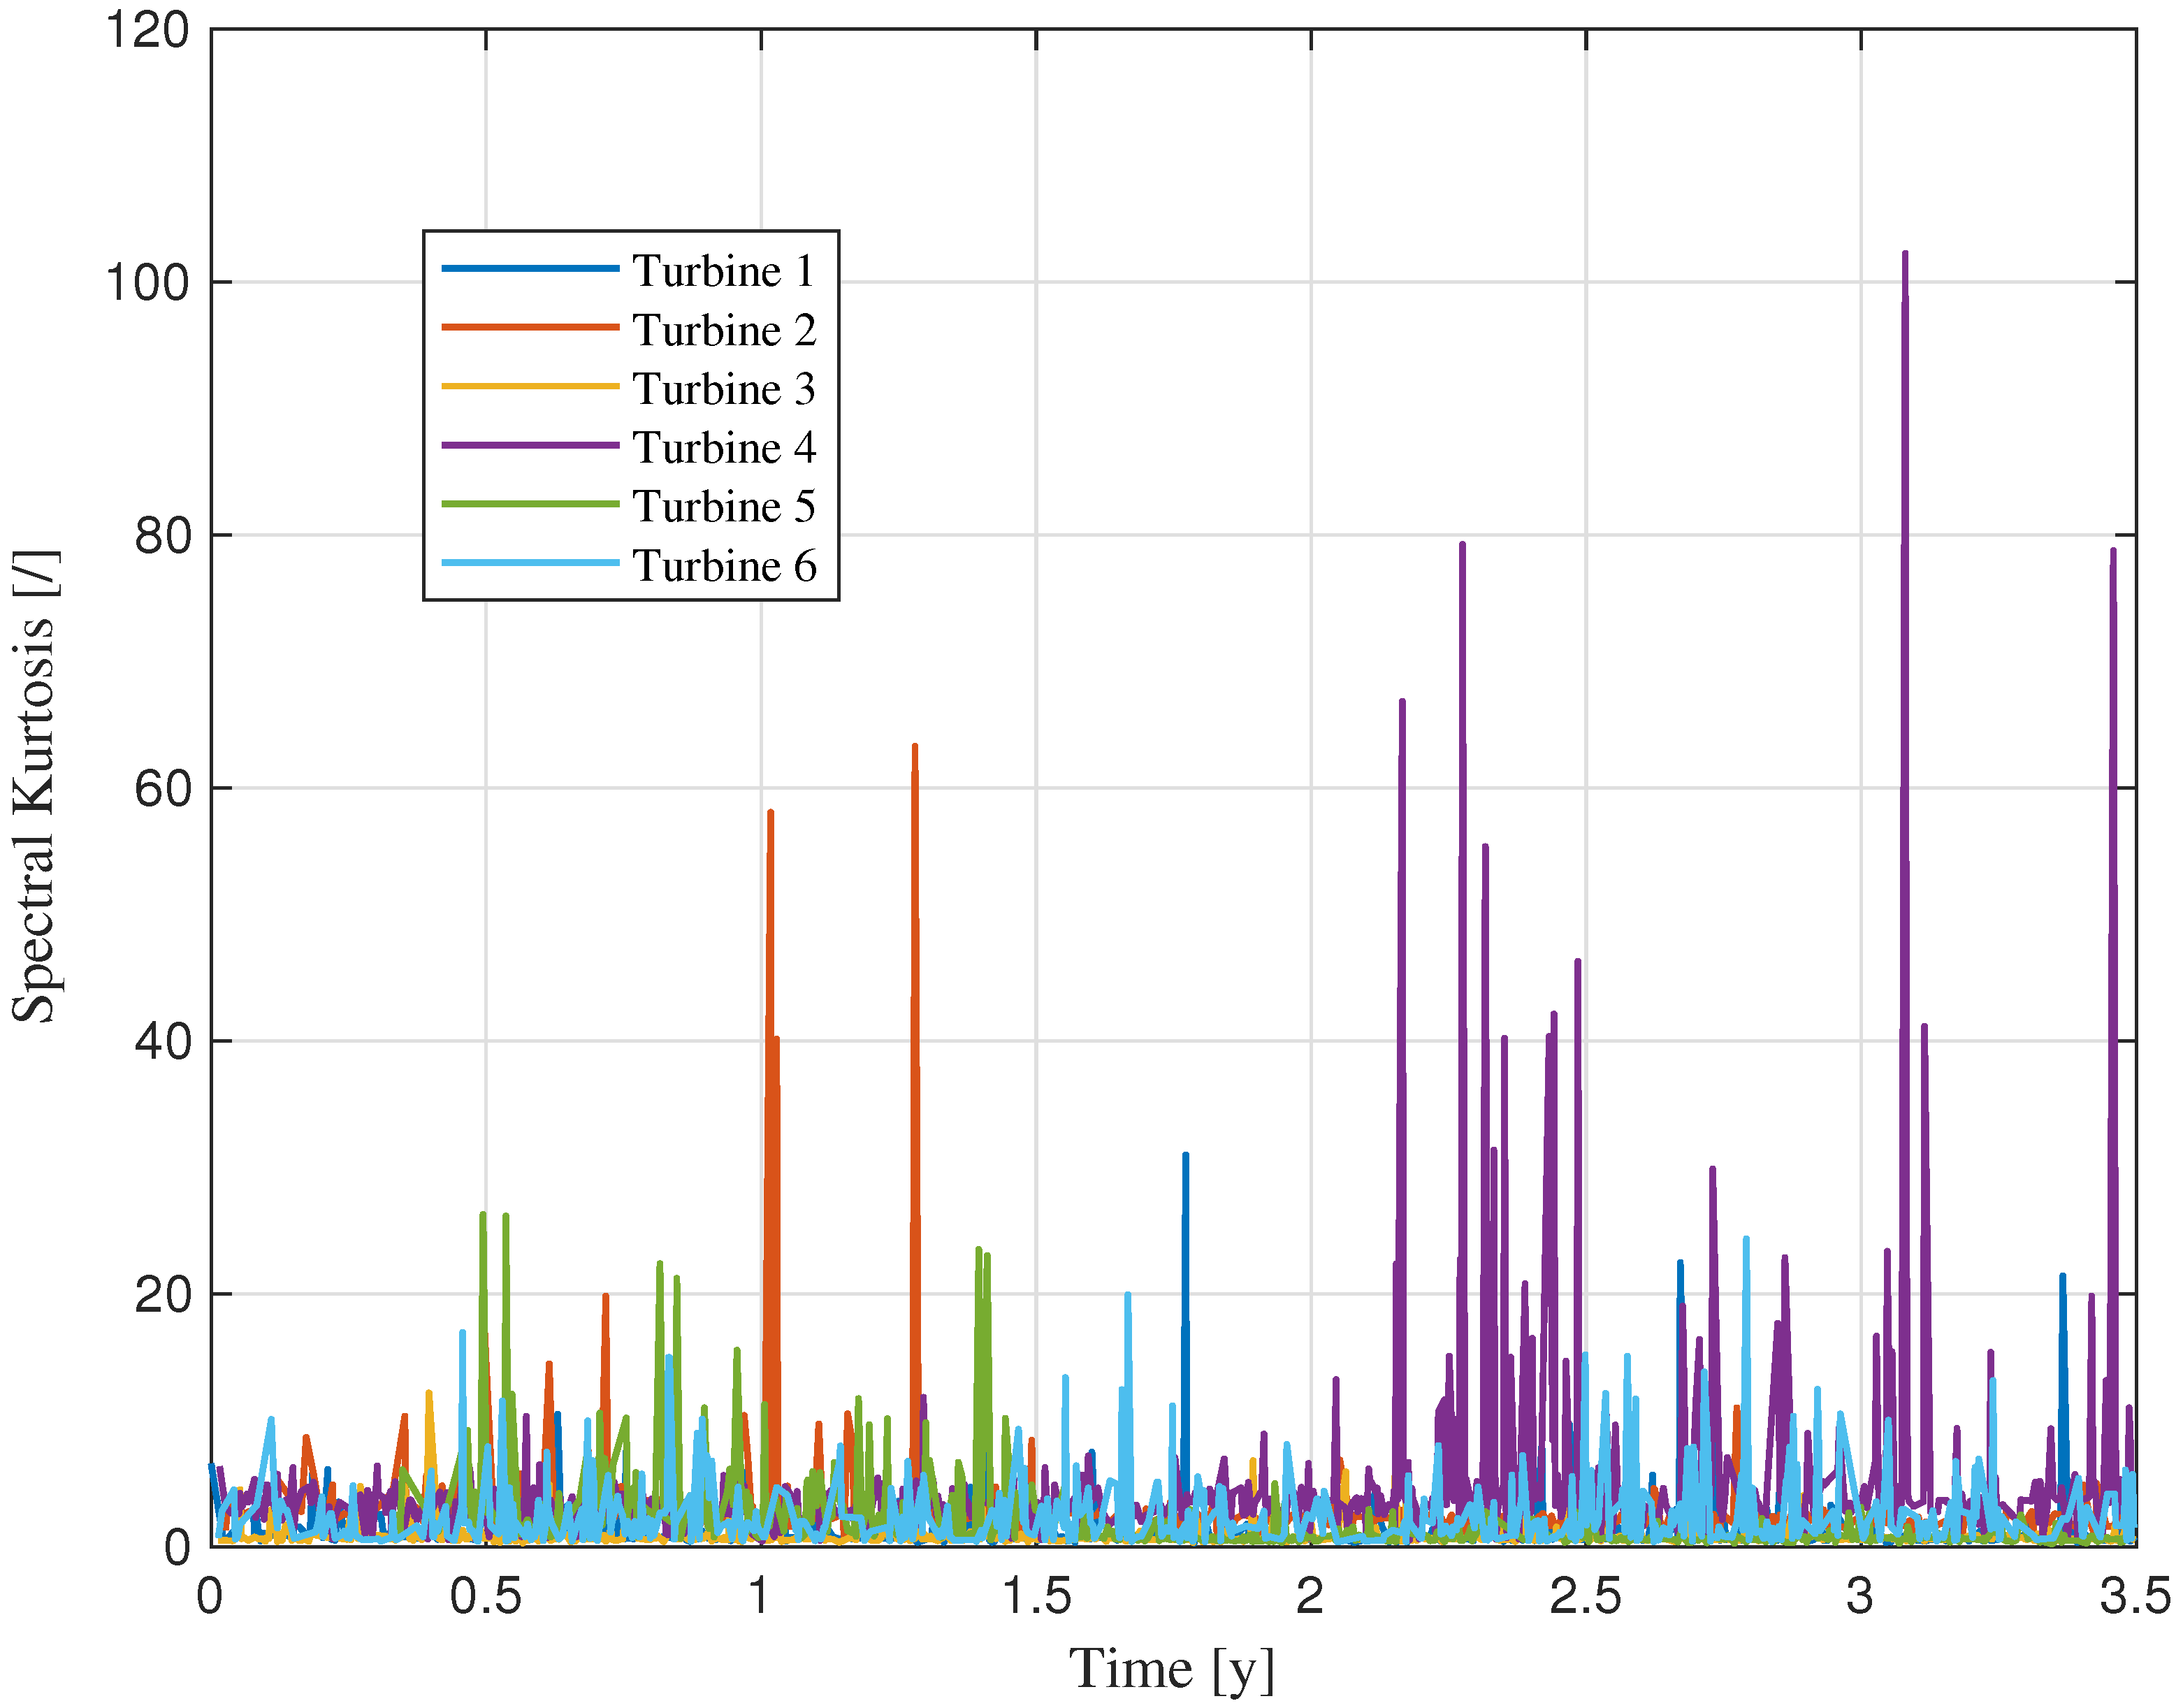
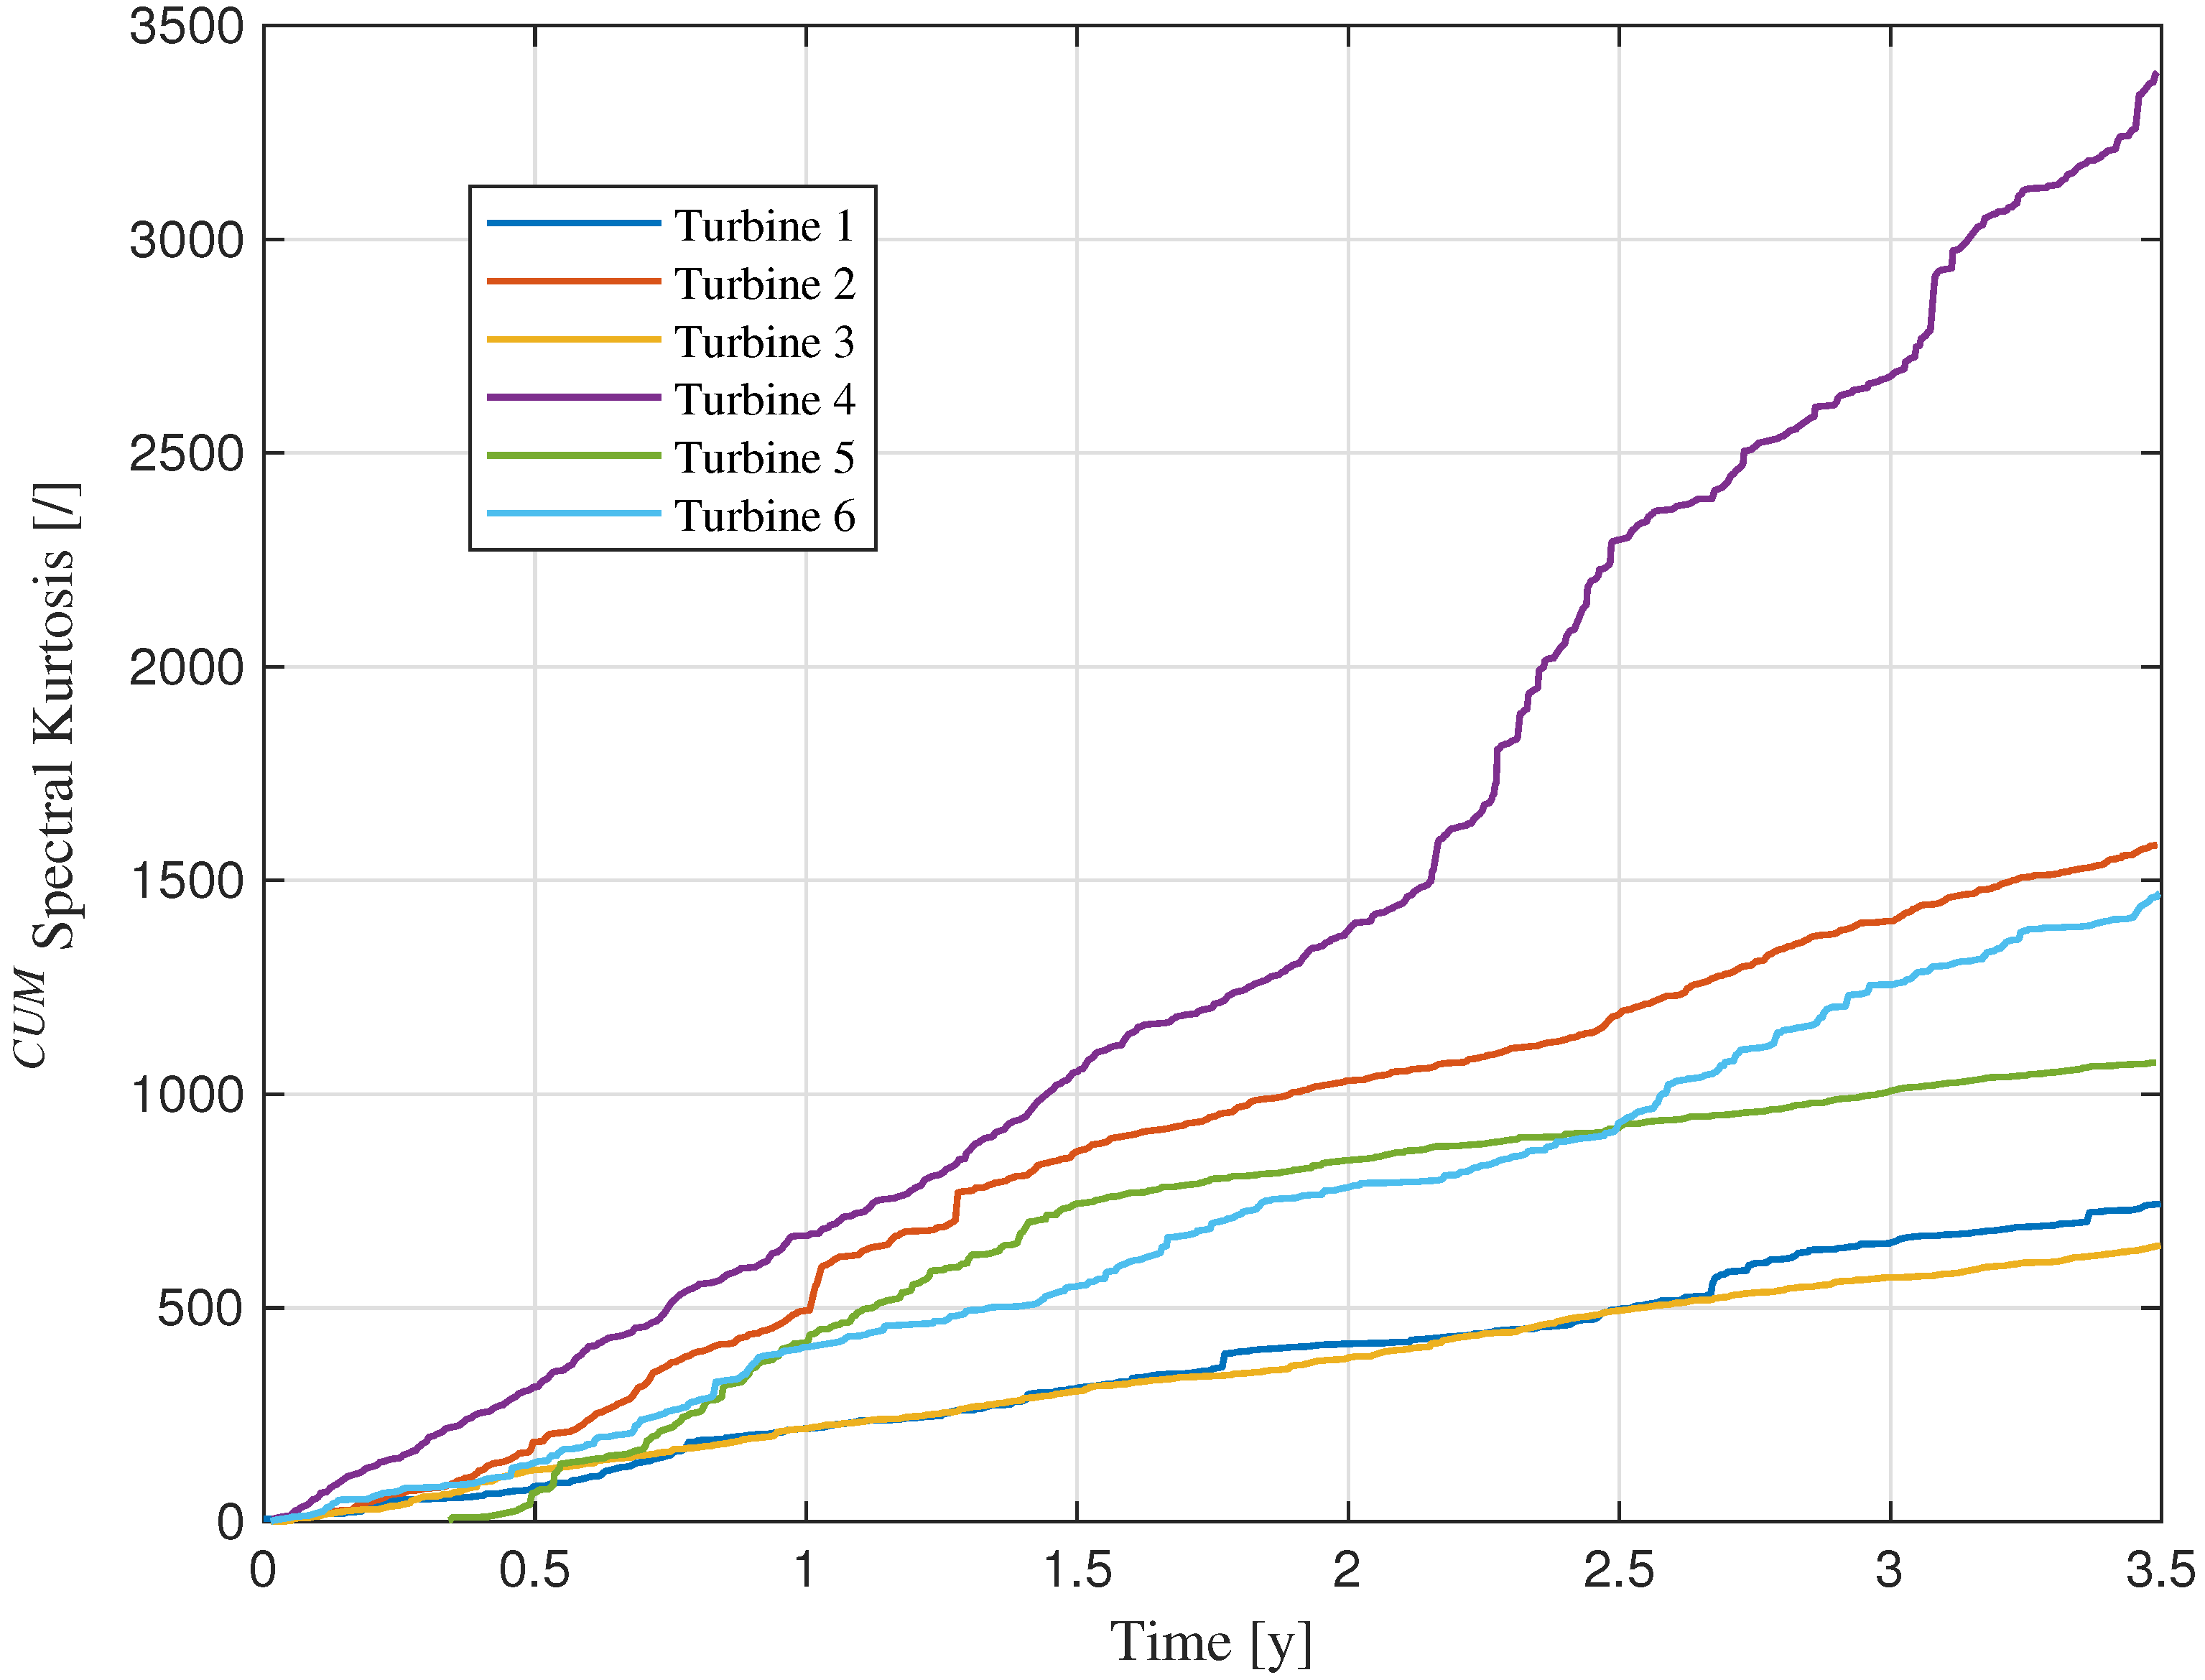
The maximum kurtosis values calculated for each data sample and for each turbine exhibit the behavior shown in Figure 6. Some curves reveal distinct fluctuation patterns with notable peaks and trends that may be indicative of transient vibrational phenomena or evolving fault conditions. In particular, Turbine 2 exhibits elevated Spectral Kurtosis values during the interval between years 1 and 1.5, while Turbine 2 shows a dominant increase in the subsequent period, suggesting a shift in the source of impulsive activity. This result becomes even more evident when plotting the cumulative SK values (see Figure 7), where the trend of Turbine 4 diverges more markedly from the others, followed by Turbine 2.
The outcome highlights a failure of the metric in correctly identifying the faulty turbine in this case, which may be attributed to the sensitivity of Spectral Kurtosis to impulsive phenomena that are not necessarily indicative of actual faults.
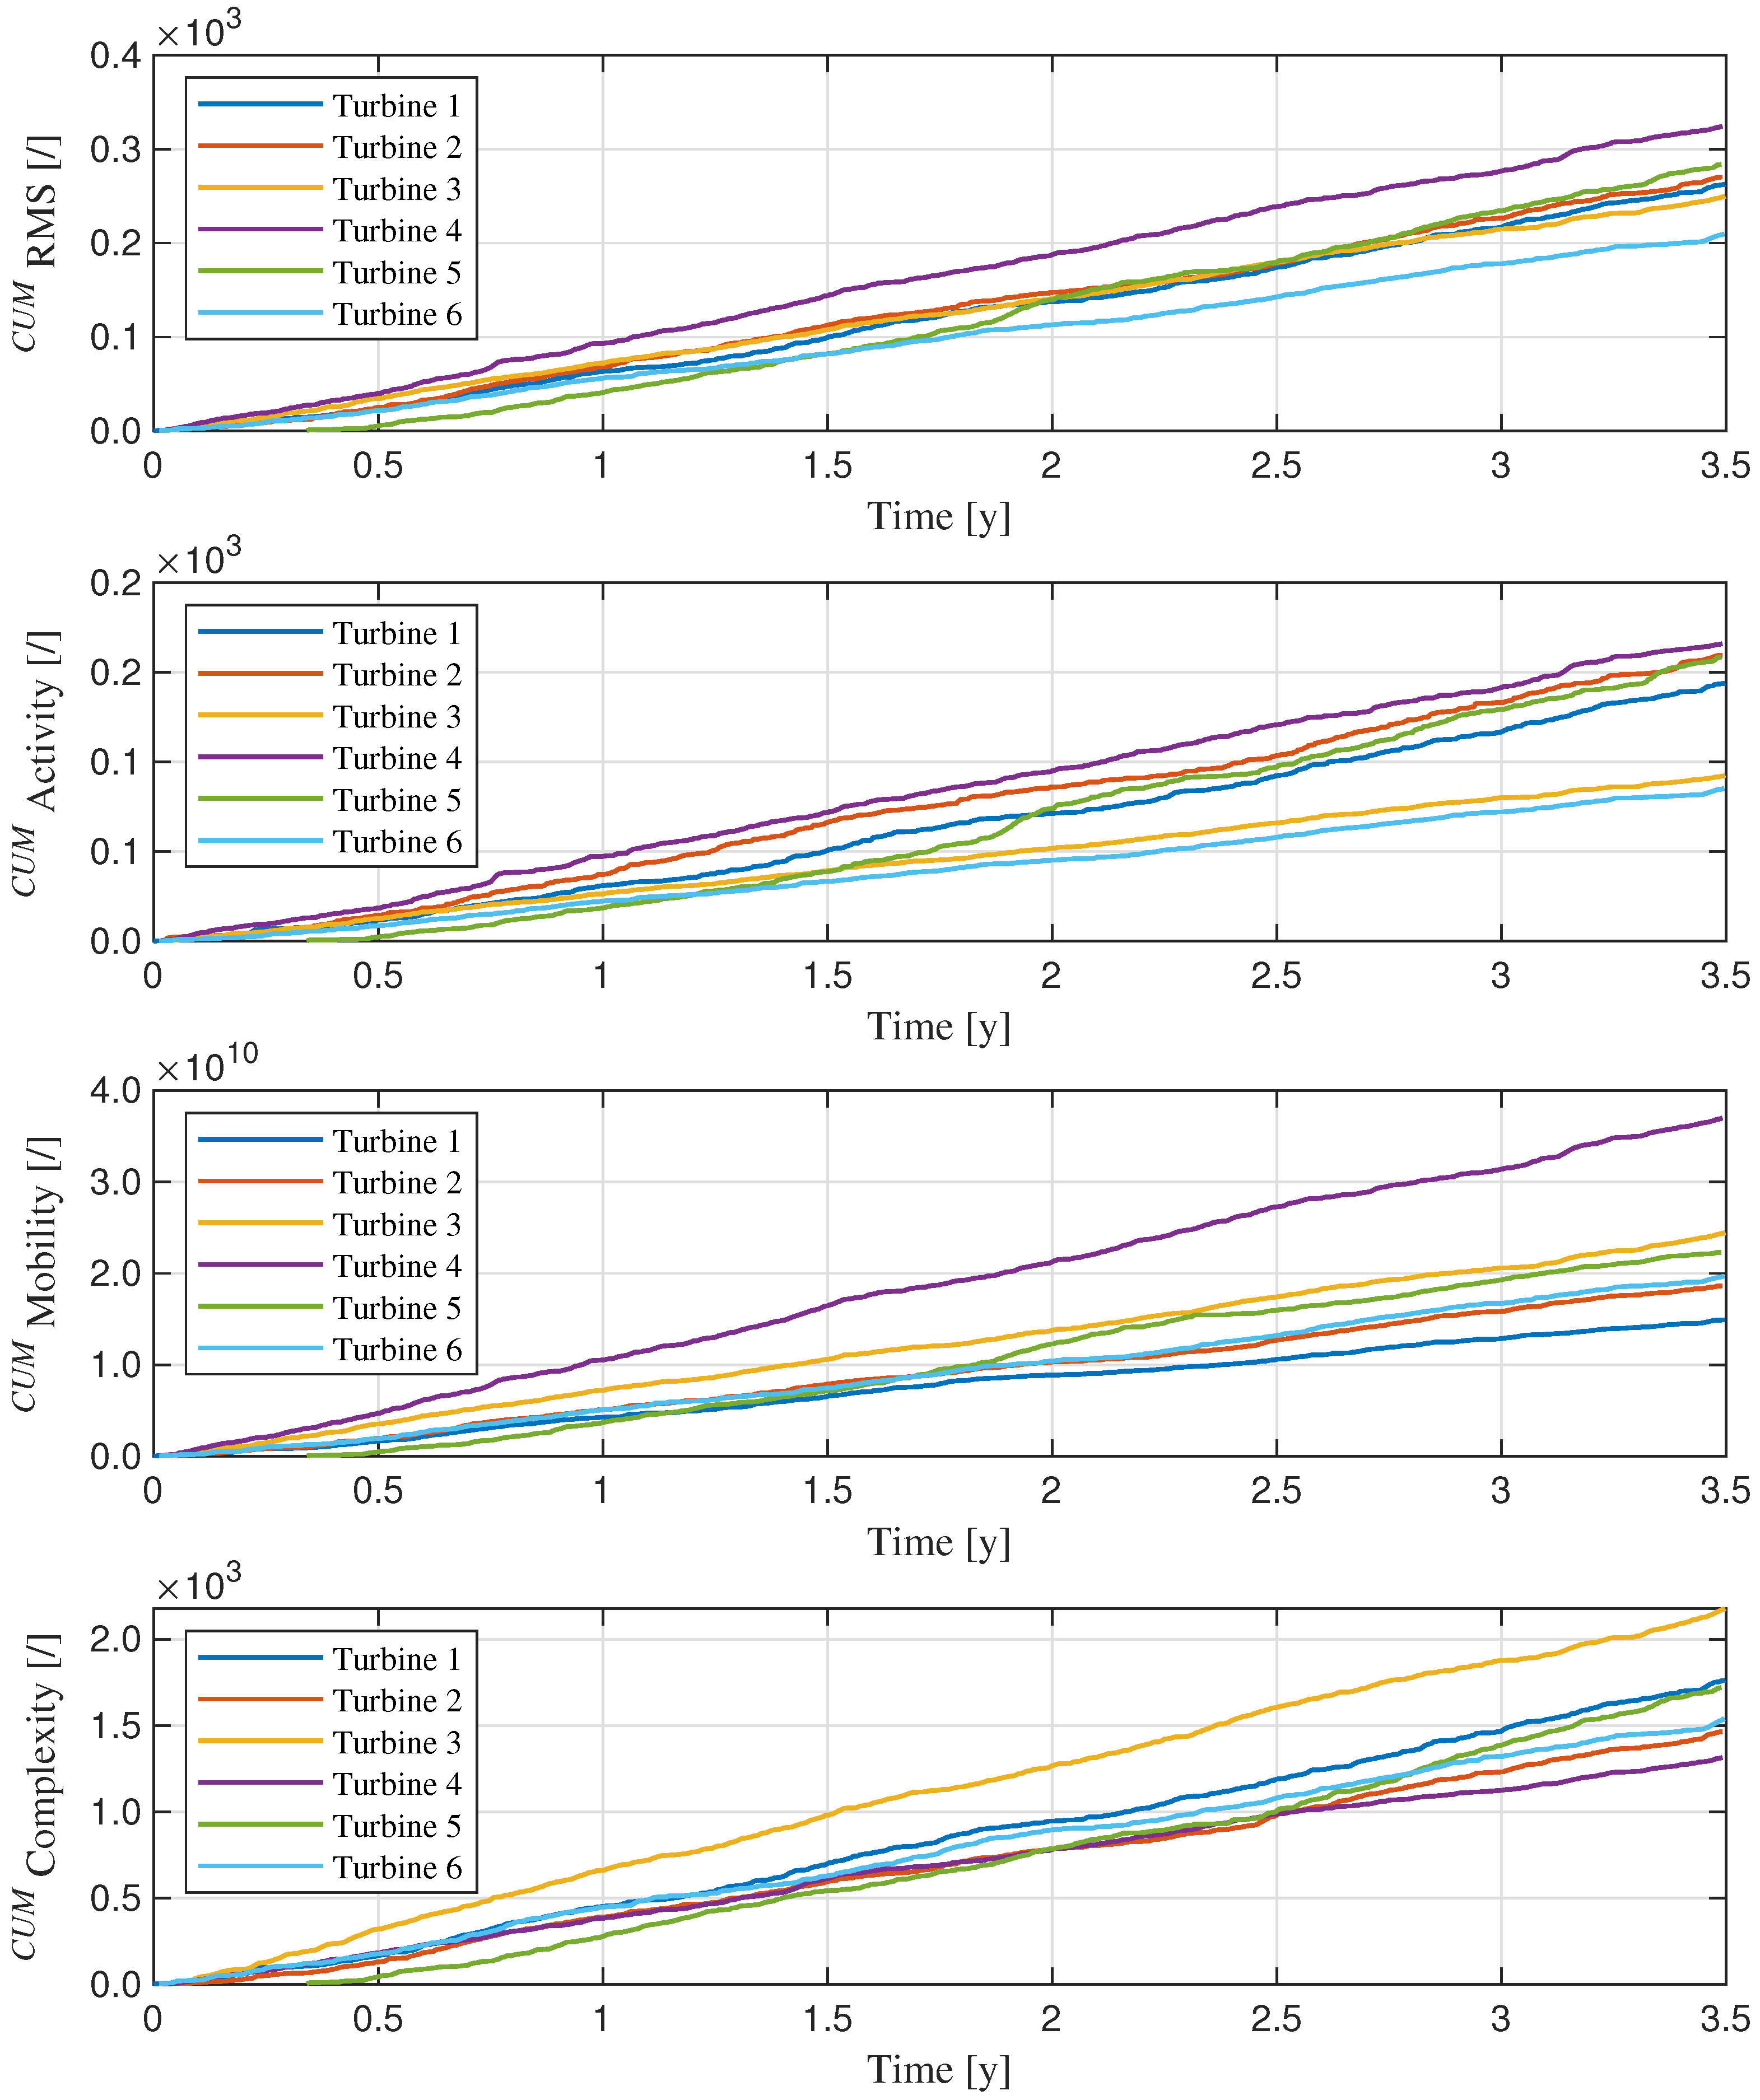
Finally, the behavior of the RMS and Hjorth parameters, according to their cumulative formulations, is presented over the monitoring period (see Figure 8), also in this case based on data selected according to the criterion of highest sample concentration within the previously defined rotational speed range. The analysis reveals that none of the parameters successfully identify the turbine actually affected by damage. With the exception of the Complexity parameter, Turbine 4 is erroneously highlighted as the one exhibiting the highest values. Moreover, a clear deviation from the other curves is observed only in the case of the Mobility parameter. This outcome closely resembles the results obtained through Spectral Kurtosis analysis, further suggesting that these metrics may be sensitive to signal characteristics that do not necessarily correlate with actual fault conditions.

4. Utility-Scale Wind Turbine Dataset

4.1. Dataset Description

A commercial wind turbine dataset has been collected by Bechhoefer et al. [31], from a 2 MW utility-scale turbine equipped with a condition monitoring system. The dataset has been made available upon request and with the explicit consent of its owner, Eric Bechhoefer, through the online platform © 2025 GitHub, Inc. [30]. Access to the dataset is also referenced on a dedicated MathWorks® webpage [34], where it is employed to demonstrate the application of spectral-based prognostic metrics. The dataset includes high-resolution vibration signals acquired from the high-speed shaft bearing, where a progressive inner race fault developed over time. Data were recorded over a 50-day period, where a signal of 6 s was acquired each day for 50 consecutive days (there are 2 measurements on the same day, which are treated as two days in the present analysis). The sampling frequency was 97,656 Hz, resulting in 585,936 samples per record.
The turbine operates at a nominal speed of 1800 rpm and features a high-speed shaft driven by a 20-tooth pinion gear. Vibration data were collected using a radial-mounted accelerometer, while a tachometer channel provided synchronous speed information at a rate of 2 samples per revolution. Although not considered in the present analysis, whose aim is to demonstrate the effectiveness of Detectivity as a fault detection tool operating in the time-domain, the bearing fault frequencies [31] are reported below (as they represent the only available information regarding the bearing, in the absence of detailed design specifications):
  • FTF: 0.42 × (shaft speed)
  • BPFO: 6.72 × (shaft speed)
  • BPFI: 9.47 × (shaft speed)
  • BSF: 1.435 × (shaft speed)
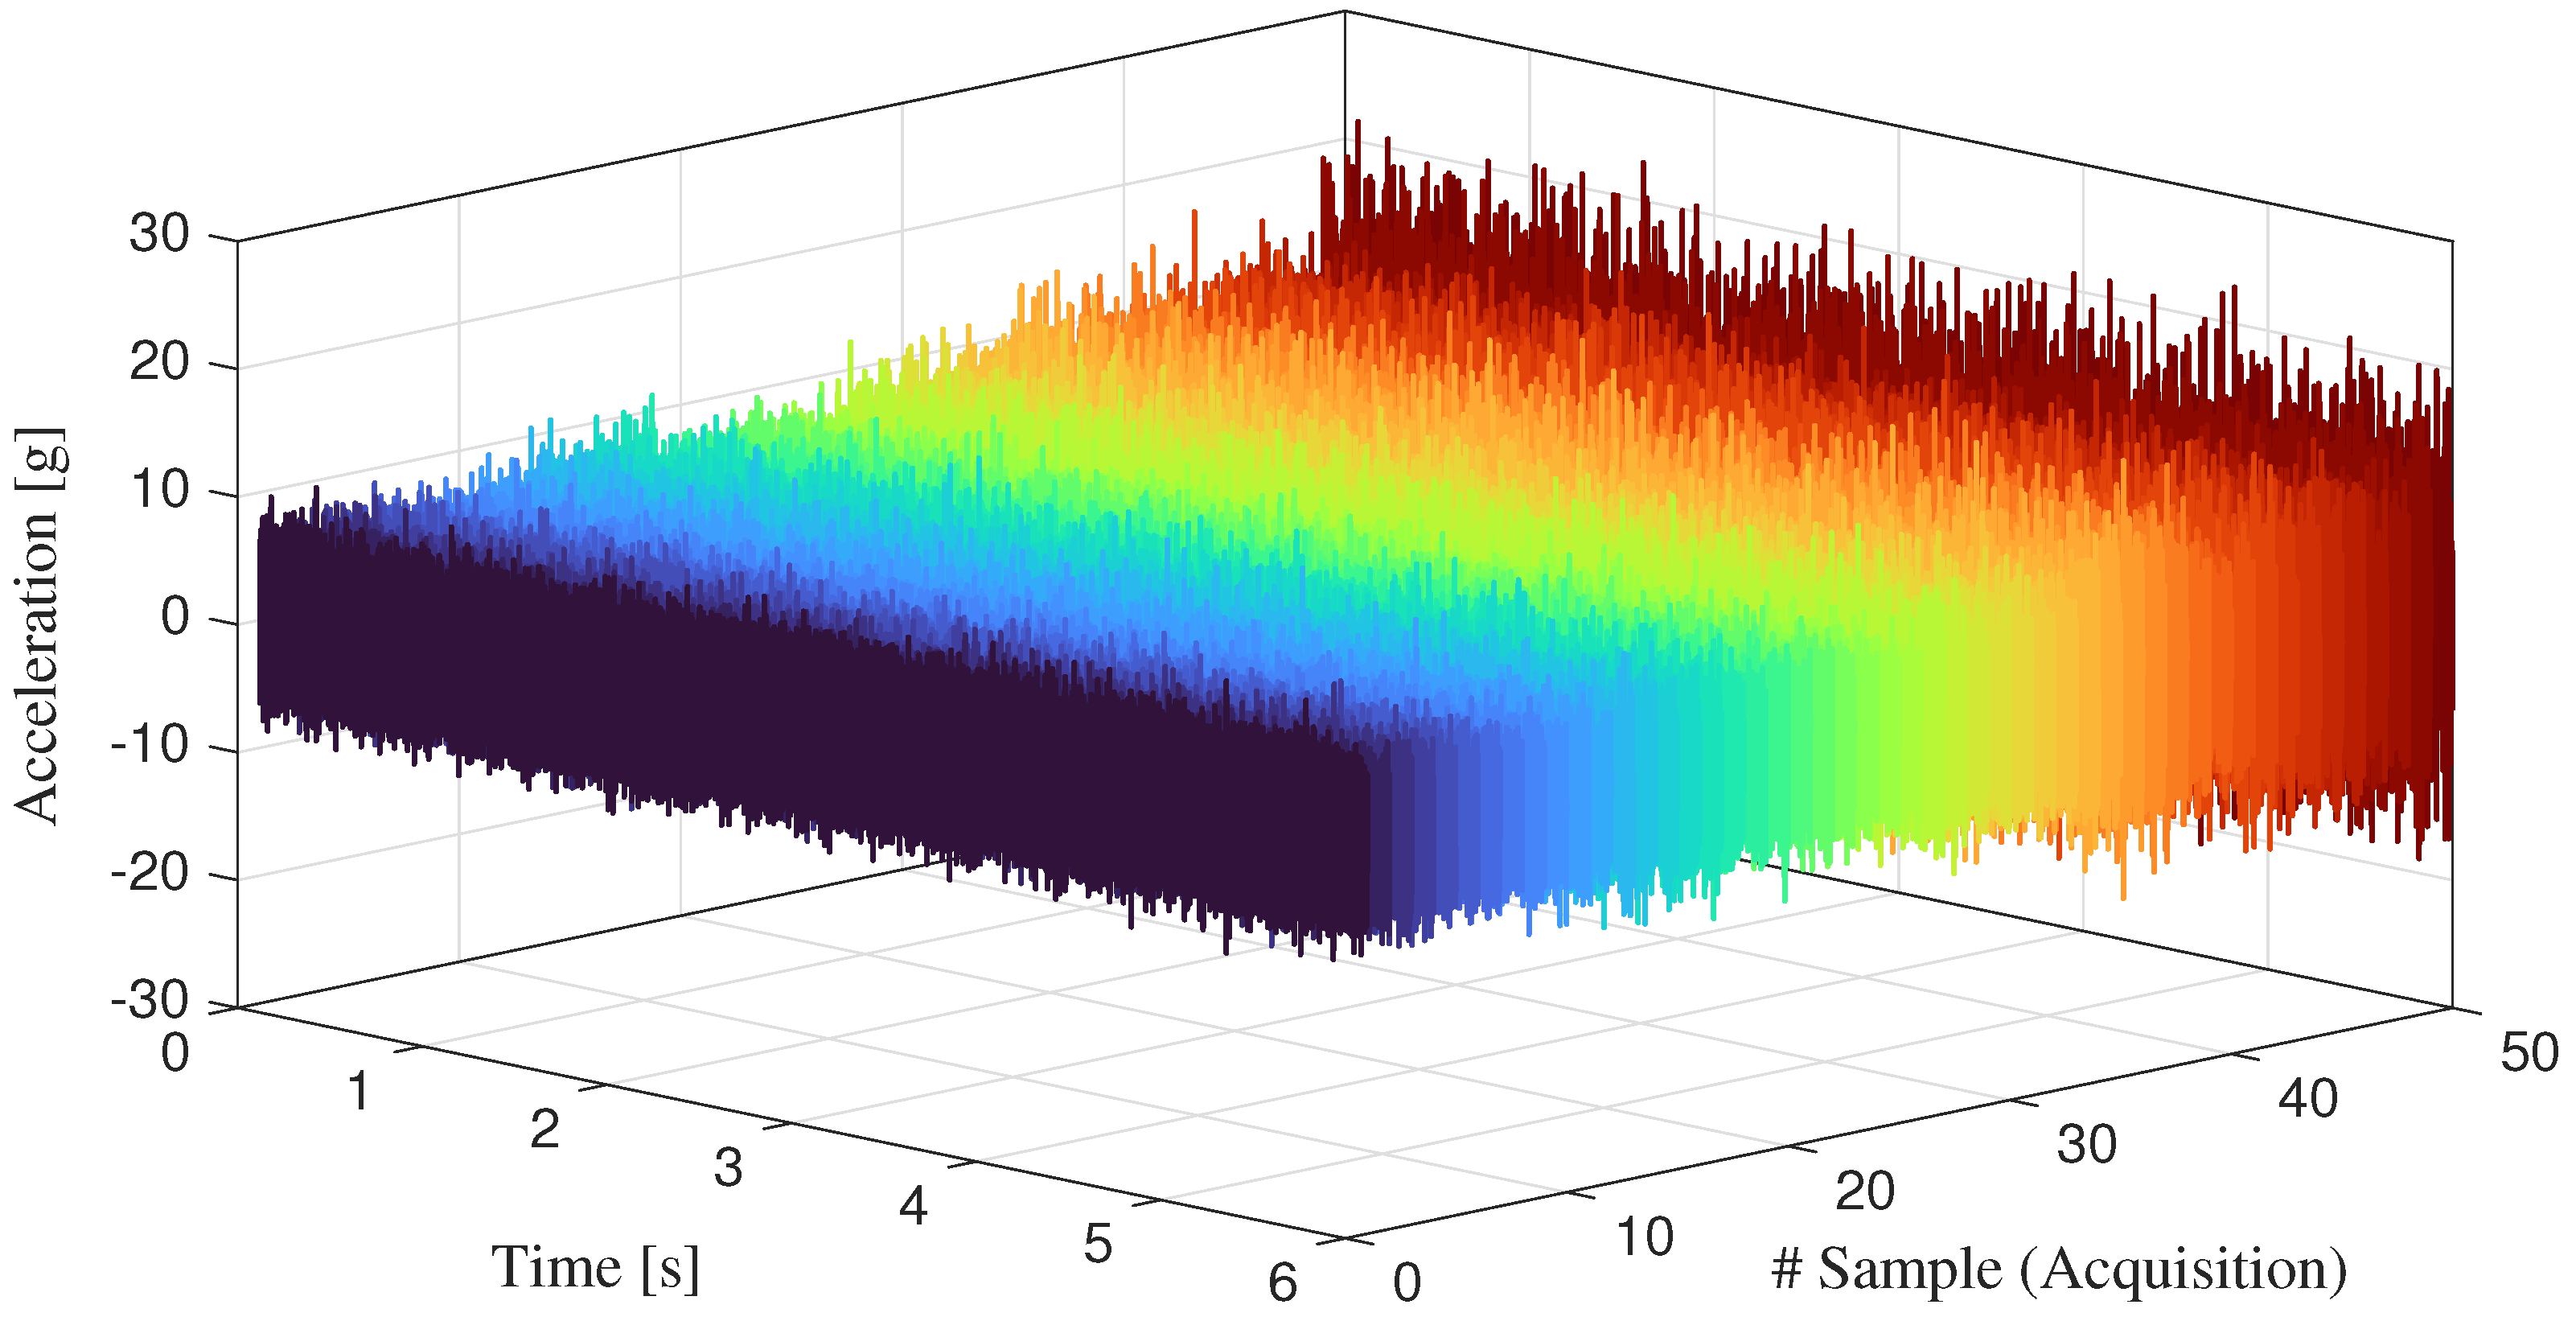
This study focuses on the analysis of the raw radial vibration signals from the high-speed shaft bearing, where an inner race defect was confirmed through inspection. As shown in the time-domain plots of the signals (see Figure 9), the dataset exhibits a progressive increase in amplitude levels as the number of acquisitions (one for each day) grows.

4.2. Results

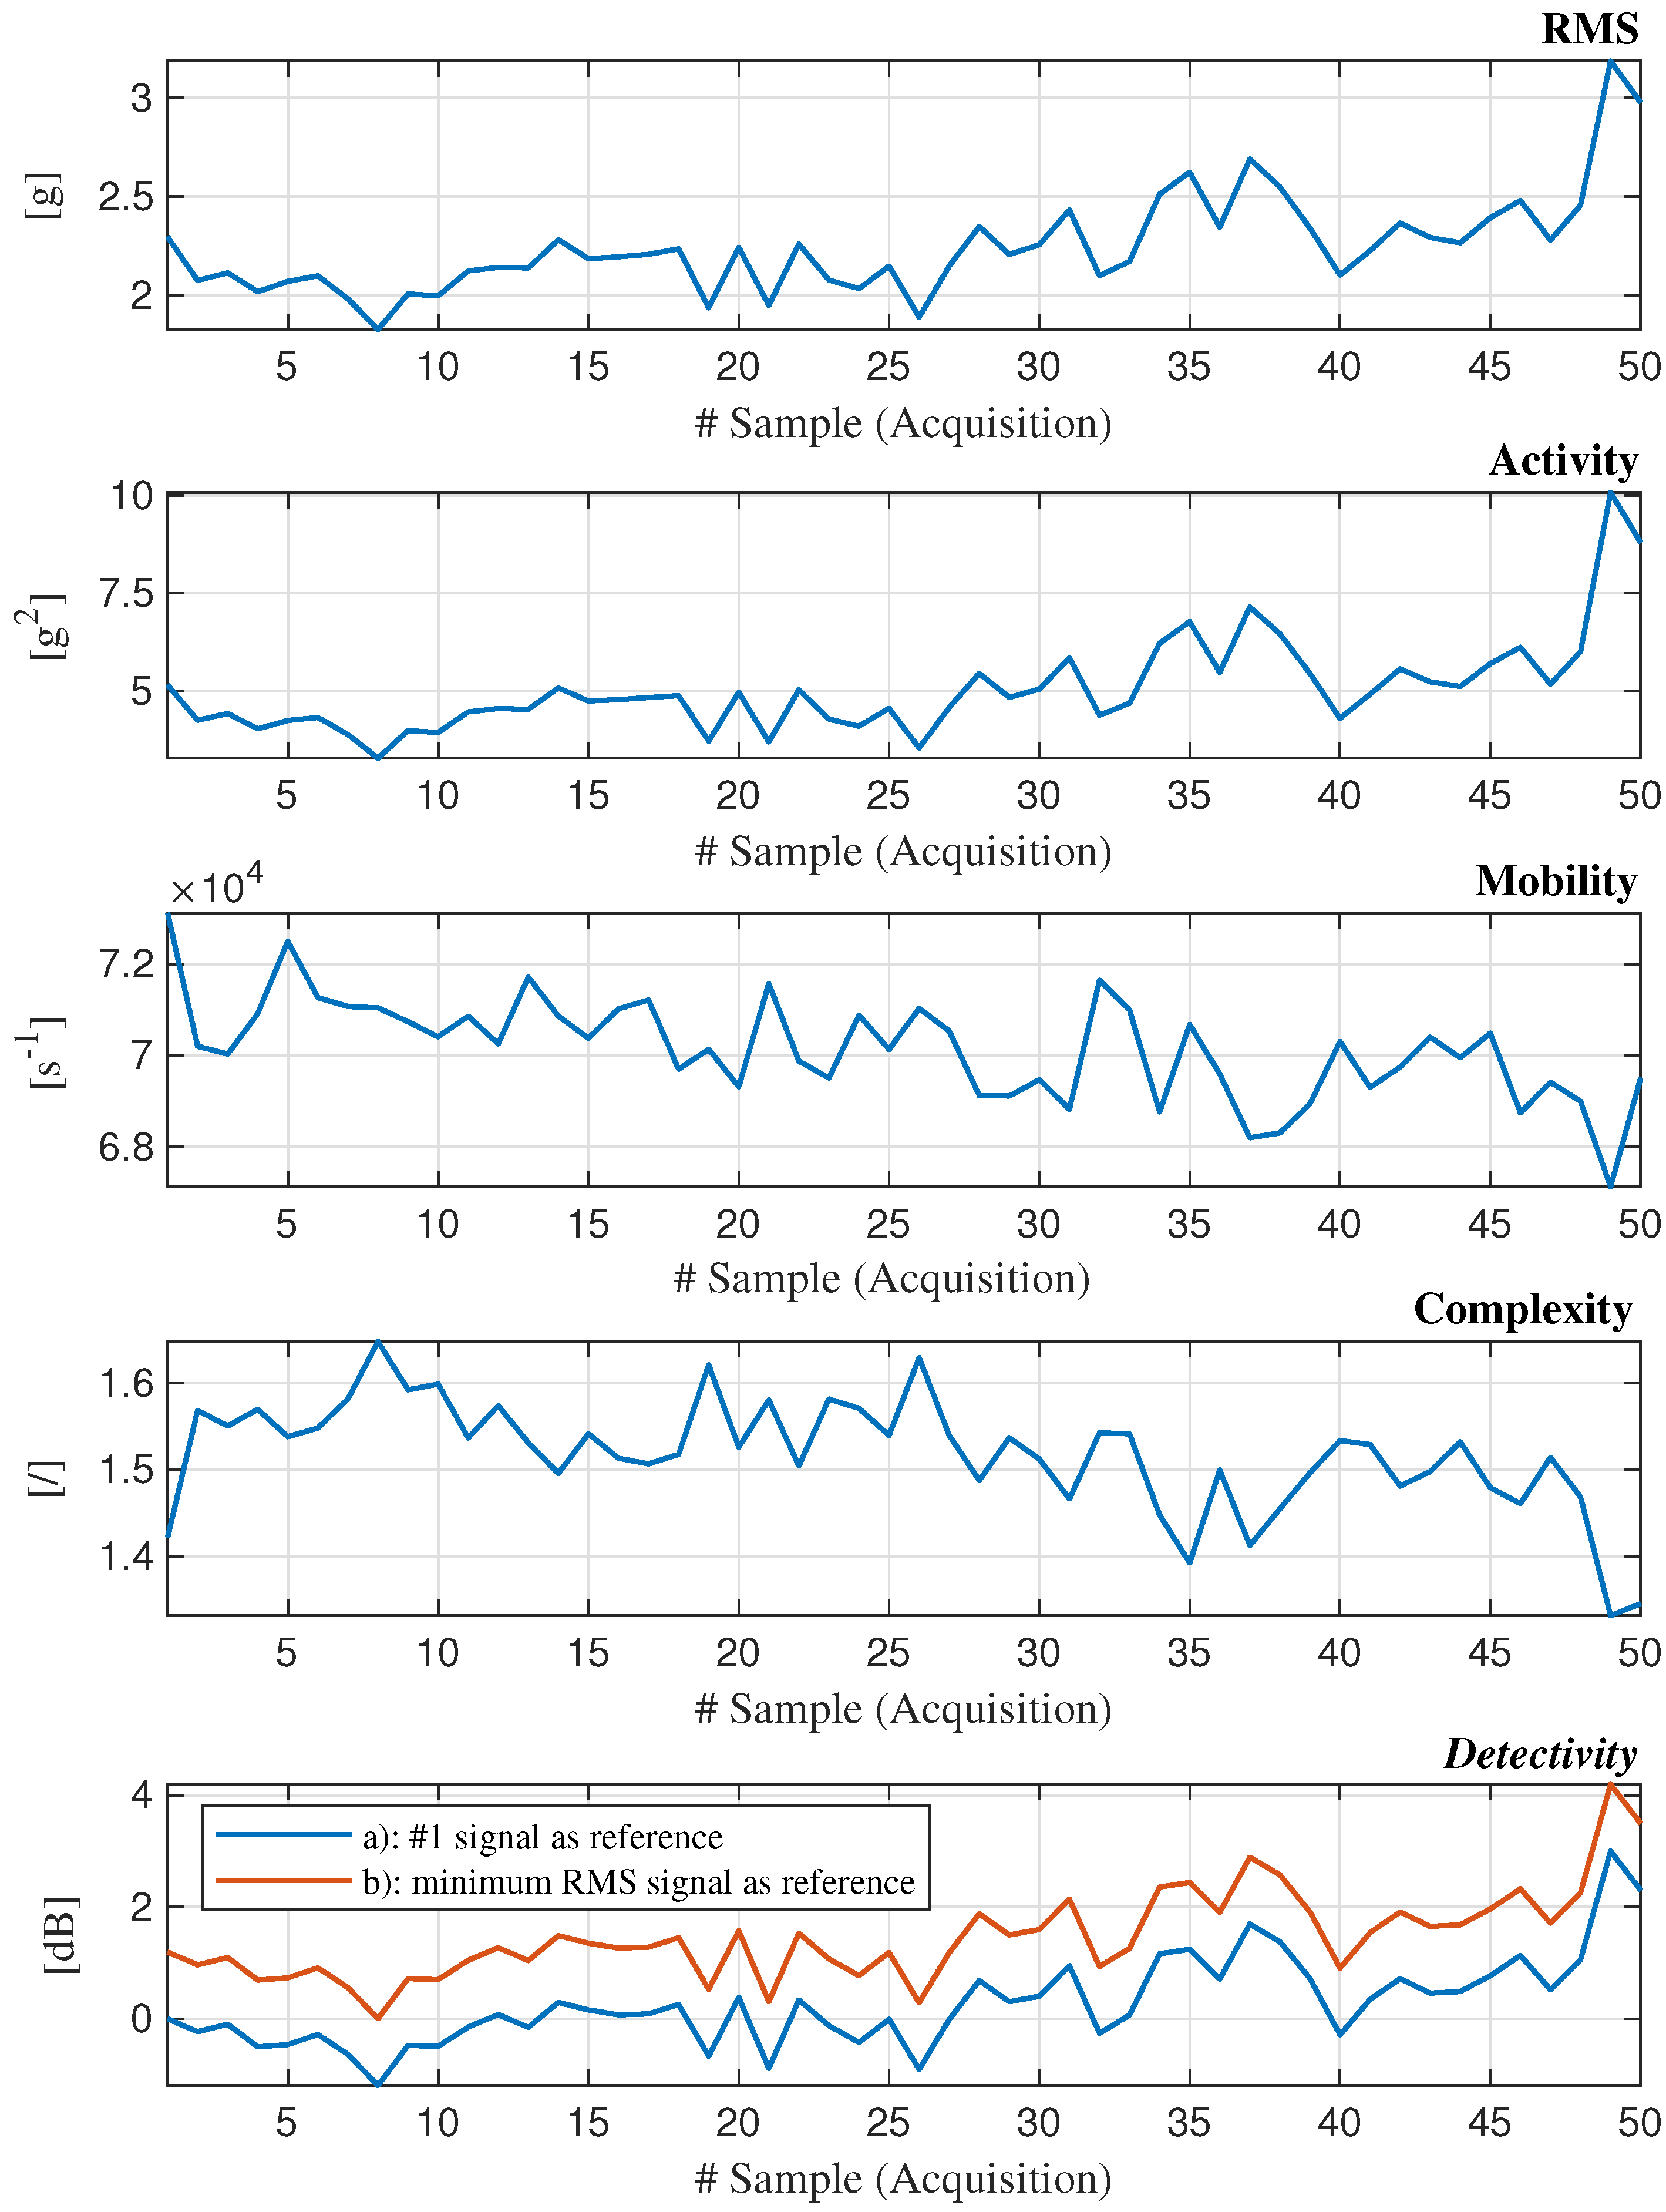
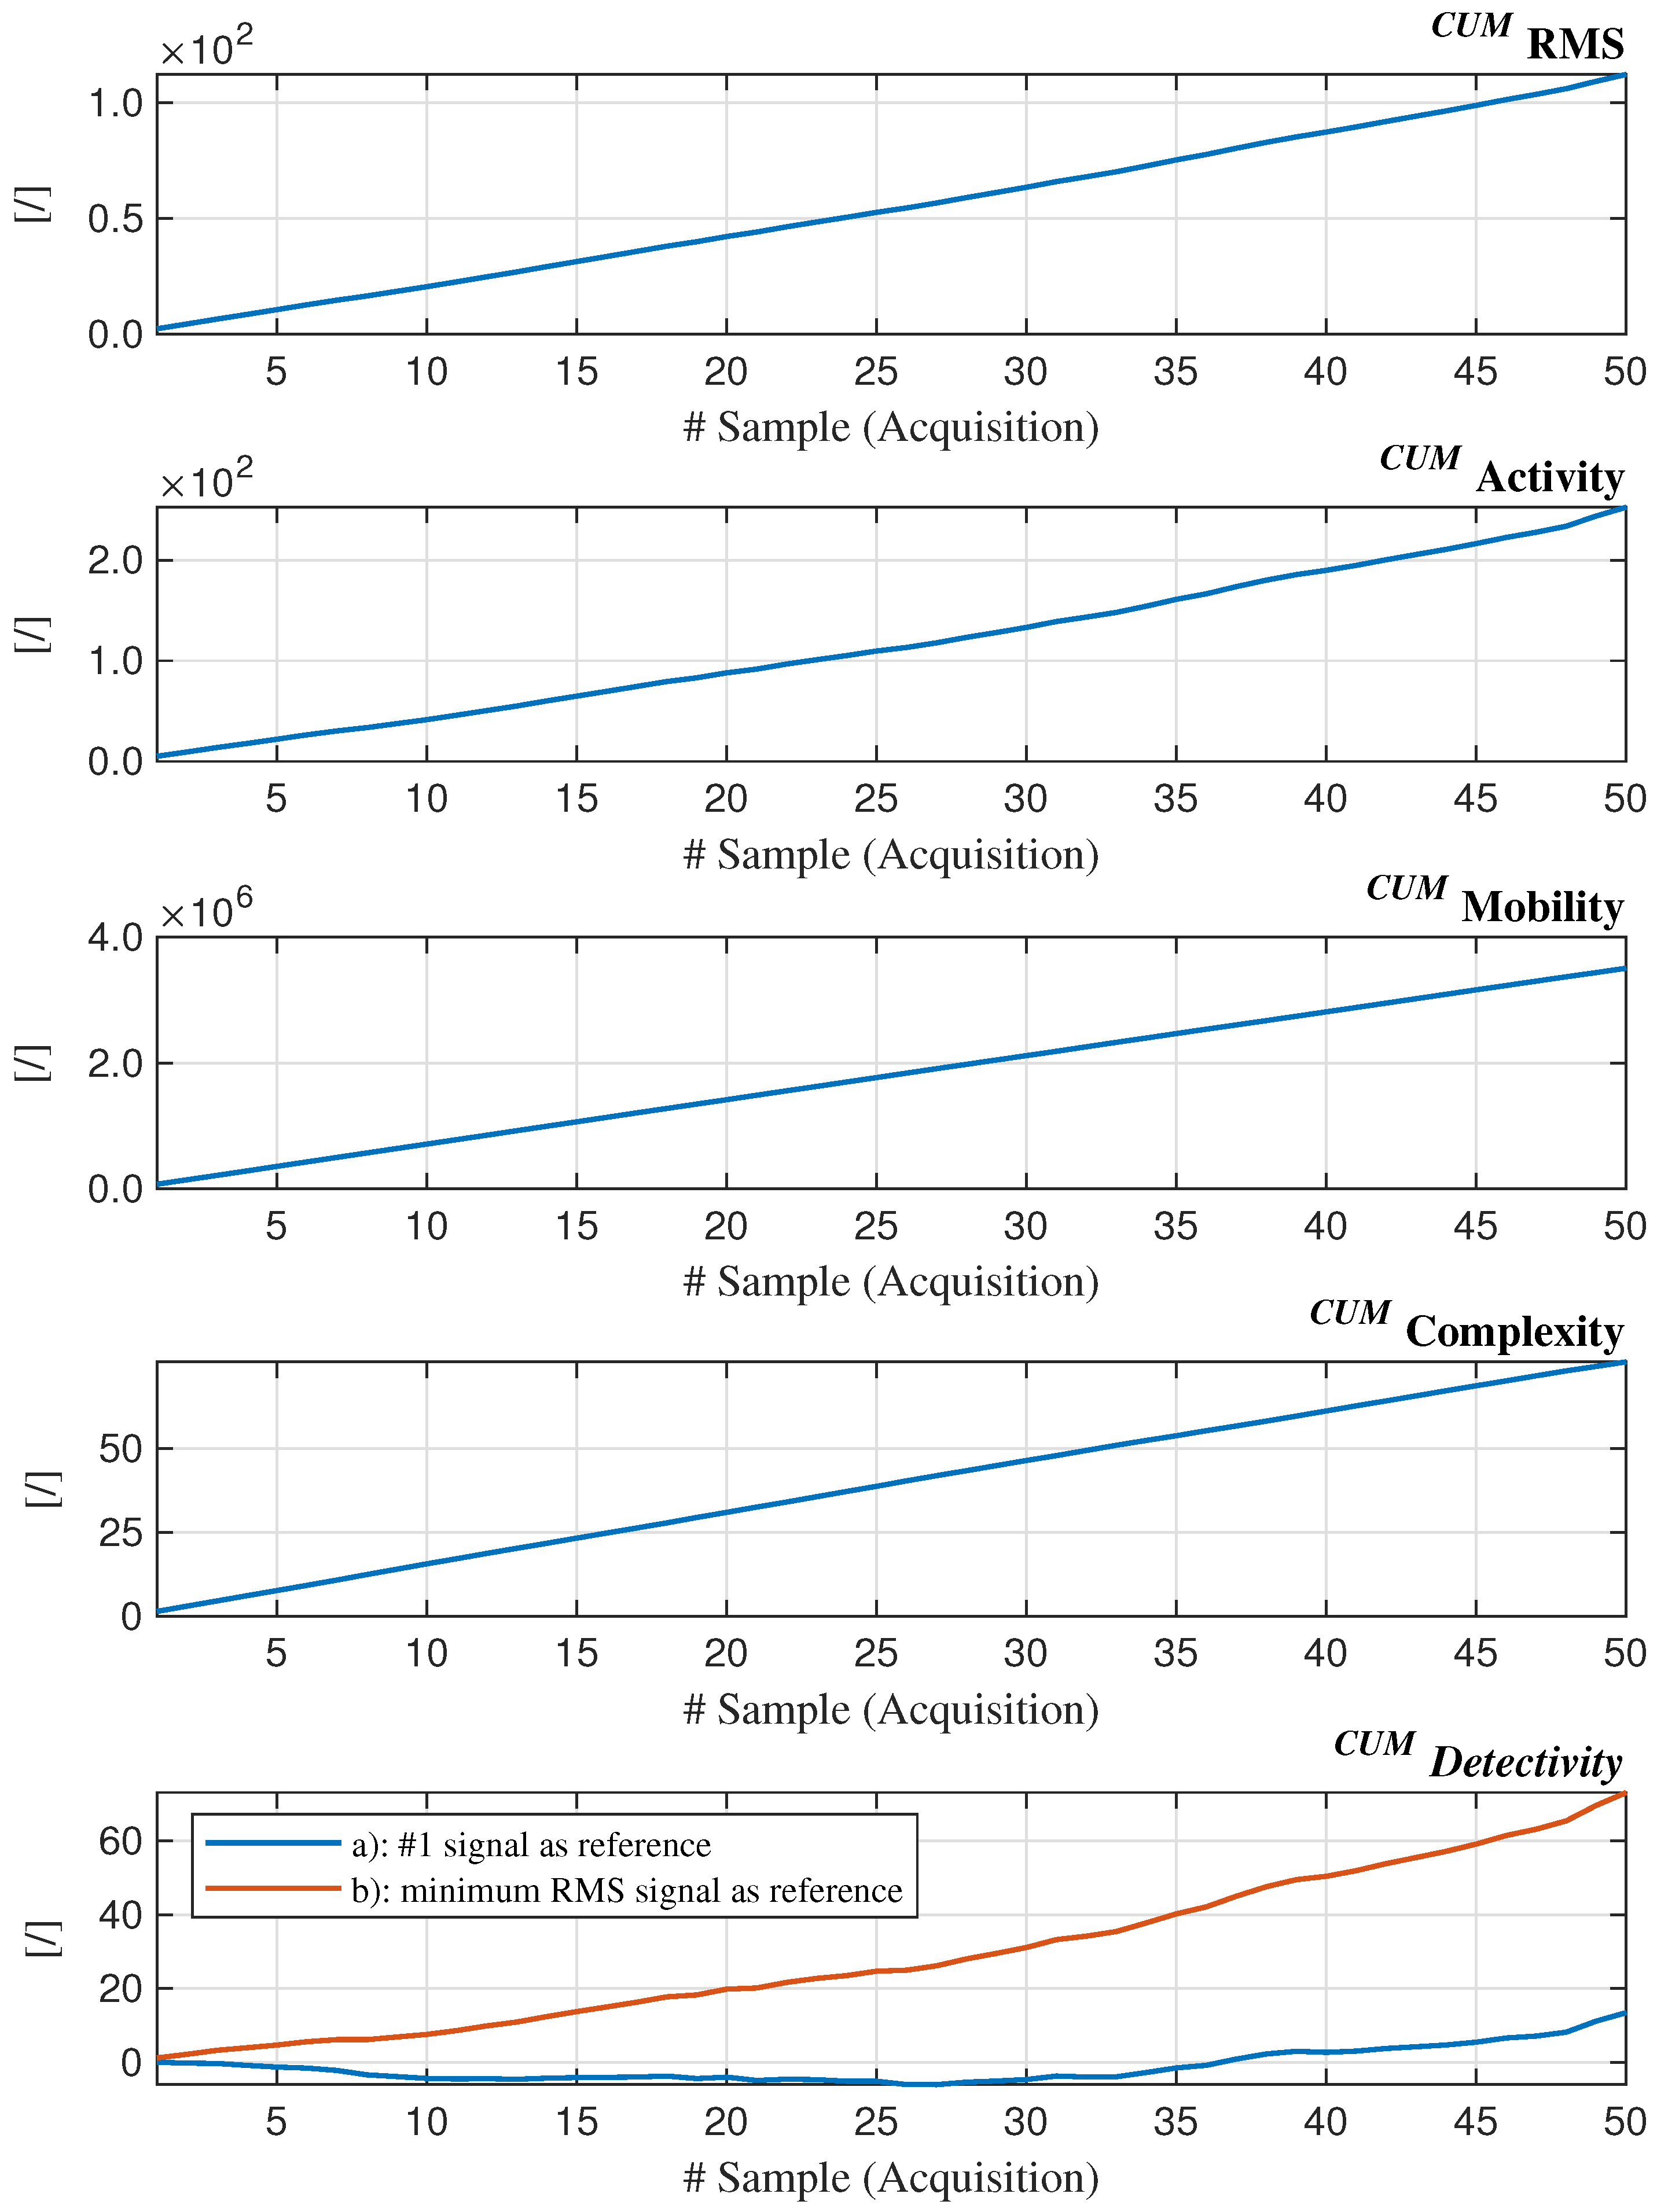
Starting from the raw signals, as previously done for the dataset related to the wind farm operating in Sweden, Hjorth’s parameters were extracted for the purpose of Detectivity analysis. Given that each signal collection consists of 50 signals, the corresponding value for each of Hjorth’s metrics was computed. The trends of these metrics are shown in Figure 10, alongside the plot of the RMS one.
Regarding Detectivity, two cases are presented: (a) The values were computed using the Hjorth parameters of the first signal in the collection as the reference, based on the reasonable assumption that the bearing’s health condition was the best during that acquisition compared to all the others; (b) The values were computed using as reference the signal with the lowest RMS value, which, as expected, occurs chronologically among the earliest in the sequence.
It can be observed that the trends of RMS, Activity, and Detectivity are similar, as are those of Mobility and Complexity. The first group already provides useful information: their approximately increasing trend confirms what is also evident from the time-domain signal plots. However, it is the behavior of the cumulants computed for each of the analyzed metrics (see Figure 11) that reveals additional insights: with the exception of Detectivity computed using the first signal as reference, the remaining parameters exhibit a trend that is well approximated by a linear progression. As is intuitively evident, a purely linear trend implies the absence of significant variations in the behavior of the underlying metric. Upon closer inspection, however, the trends of Mobility and Complexity appear, ictu oculi, indistinguishable from linear segments. As such, they provide no additional information. Likewise, Detectivity in case (a) can be disregarded due to its non-monotonic behavior. Therefore, it is appropriate to focus the analysis on the remaining three plots, e.g., RMS, Activity, and Detectivity (b).
On closer inspection, for zero-mean signals, it is well known that the Activity, i.e., the variance of the signal, is equal to the square of the RMS. Therefore, we can consider only the latter in comparison with the Detectivity. As shown in Figure 12, the trends are plotted alongside reference lines (dashed red), which were constructed by using, as the unit step for the ordinates, the absolute difference between the first two cumulant values. Additionally, boundary lines (solid light gray) are plotted according to the shift of ± ϵ relative to the reference line: the value was selected as sufficient to encompass deviations from linearity that are not indicative of damage (see the Detectivity plot for the period between approximately day 7 and day 15). This allows us to observe, through the vertical lines (dotted black) intersecting the curves at the points where they exit the rails (which can be regarded as the point of incipient anomaly), that in the case of Detectivity, anomaly is detected earlier, on the 30th day of testing, whereas, using the same criterion, the RMS sees the issue five days later.
Furthermore, it can be observed that up to the period between day 25 and day 30, the degree of overlap between the curves and the auxiliary lines is very high; beyond this point, a deviation becomes apparent: it is mild for RMS and most significant for Detectivity. Notably, while RMS exhibits an approximately asymptotic divergence, Detectivity shows a distinct bifurcation around day 27. This provides additional insight, suggesting that the acquisition corresponding to this transition marks the boundary between a healthy bearing and one in which early-stage damage has begun to manifest.
Unlike the previous dataset, where a sensitivity analysis with respect to the reference (intended as the machine) used for Detectivity computation provided further evidence of the effectiveness of the method, in this case, having data from a single turbine, the challenge was to select an appropriate signal to serve as a reference. The choice of signal with the lowest RMS value appears to be the most effective.

5. Conclusions

The present study explored the application of the Detectivity parameter, a composite metric derived from Hjorth’s descriptors, for fault detection in wind turbines. The investigation was conducted on two distinct datasets, each characterized by different operational conditions and fault scenarios.
The first dataset, publicly available from Luleå University, includes vibration signals from six wind turbines acquired during standard operating conditions, sampled at 12.8 kHz. Signal acquisition was performed every 12 h for a period of nearly four years. Among the six turbines, Turbine 5 experienced documented bearing and gearbox failures. Due to the non-stationary nature of turbine speed, a pre-processing strategy was adopted to select data within a restricted speed range, mitigating the influence of rotational speed variability. The analysis revealed that using the instantaneous Detectivity values, in this case, does not allow for reliable damage identification due to the significant fluctuations affecting the trends. To overcome this limitation, the cumulative values were taken into account, enabling the clear identification of the faulted turbine. In a comparative perspective, under identical pre-processing conditions, Spectral Kurtosis was also applied; however, it yielded an incorrect result. Similarly, the use of RMS and Hjorth’s parameters as standalone indicators proved ineffective in detecting the damaged machine.
The second dataset consists of high-resolution vibration signals acquired from a 2 MW utility-scale wind turbine operating at a constant nominal speed over a 50-day period, during which an inner race fault progressively developed. The data are private and available upon request; they consist of one signal acquired per day at 97,656 Hz. In this single-machine scenario, the signal with the lowest RMS value was selected as the reference, under the assumption that it represented the healthiest condition. The cumulant of Detectivity successfully captured the onset of an anomaly with a significant lead time, 5 days in advance over a 50-day test period, compared to RMS, which was the most promising among the metrics used for comparison. In the former case, the plot exhibits a clear bifurcation from linearity, whereas in the latter, the trend follows an asymptotic behavior.
Overall, the findings validate Detectivity as a reliable and sensitive indicator for fault detection in wind turbines. Its ability to condense multiple signal characteristics into a single interpretable metric makes it particularly suitable for long-term condition monitoring, even in the presence of operational variability.
The main limitations, which translate into future challenges, primarily concern the potential use of this tool for diagnostic purposes, rather than just anomaly detection, as in the present case. Furthermore, with reference to the first dataset, the method should be refined to bypass the need for preprocessing. In the current wind turbine application, this work was performed, and the method proved effective, suggesting its potential applicability to other datasets. However, the ambition is to extend the approach to other technical domains, where ad hoc preprocessing might be required to enable data treatment. Additionally, considering the analysis of the second dataset, a noteworthy aspect for further investigation is the criterion for positioning boundary lines in order to determine whether a trend crossing them can be considered symptomatic of real damage.

Author Contributions

Conceptualization, P.G., G.D., M.S., R.R. and M.C.; methodology, P.G., G.D. and M.C.; software, P.G. and G.D.; formal analysis, P.G.; writing—original draft preparation, P.G.; writing—review and editing, M.S. and R.R.; supervision, M.C.; project administration, G.D. and M.C. All authors have read and agreed to the published version of the manuscript.

Funding

This research received no external funding.

Institutional Review Board Statement

Not applicable.

Informed Consent Statement

Not applicable.

Data Availability Statement

The data analyzed in this paper are drawn from two datasets: the first is publicly available online [28], while the second can be accessed upon request to the owner [30].

Conflicts of Interest

The authors declare no conflicts of interest.

Abbreviations

The following abbreviations are used in this manuscript:
ActActivity
MobMobility
ComComplexity
DtcDetectivity
· dB Generic metric expressed in dB
· ref Generic metric obtained by applying the reference signal
GsGaussian signal
SKSpectral Kurtosis
CUM · Cumulant of a generic metric
CUM k · k-th element of the cumulative vector of a generic metric
FTFFundamental train frequency
BPFOBall pass frequency outer race
BPFIBall pass frequency inner race
BSFBall spin frequency

References

  1. Taylor, J.I. The Gear Analysis Handbook; Vibration Consultants: Tampa, FL, USA, 2000. [Google Scholar]
  2. Taylor, J.I.; Kirkland, D.W. The Bearing Analysis Handbook; Vibration Consultants: Tampa, FL, USA, 2004. [Google Scholar]
  3. Taylor, J.I. The Vibration Analysis Handbook; Vibration Consultants: Tampa, FL, USA, 2003. [Google Scholar]
  4. Randall, R.B. Vibration-Based Condition Monitoring; John Wiley & Sons: Chichester, UK, 2003. [Google Scholar]
  5. Randall, R.B.; Antoni, J. Rolling element bearing diagnostics—A tutorial. Mech. Syst. Signal Process. 2011, 25, 485–520. [Google Scholar] [CrossRef]
  6. El-Thalji, I.; Jantunen, E. A summary of fault modelling and predictive health monitoring of rolling element bearings. Mech. Syst. Signal Process. 2015, 60, 252–272. [Google Scholar] [CrossRef]
  7. Moshrefzadeh, A.; Fasana, A. Planetary gearbox with localised bearings and gears faults: Simulation and time/frequency analysis. Meccanica 2017, 52, 3759–3779. [Google Scholar] [CrossRef]
  8. D’Elia, G.; Delvecchio, S.; Cocconcelli, M.; Dalpiaz, G. Application of cyclostationary indicators for the diagnostics of distributed faults in ball bearings. In Proceedings of the ASME Design Engineering Technical Conference, Portland, OR, USA, 4–7 August 2013; Volume 8. [Google Scholar]
  9. D’Elia, G.; Cocconcelli, M.; Mucchi, E. An algorithm for the simulation of faulted bearings in non-stationary conditions. Meccanica 2018, 53, 1147–1166. [Google Scholar] [CrossRef]
  10. Hurley, N.; Rickard, S. Comparing measures of sparsity. IEEE Trans. Inf. Theory 2009, 55, 4723–4741. [Google Scholar] [CrossRef]
  11. Wang, D. Some further thoughts about spectral kurtosis, spectral L2/L1 norm, spectral smoothness index and spectral Gini index for characterizing repetitive transients. Mech. Syst. Signal Process. 2018, 108, 360–368. [Google Scholar] [CrossRef]
  12. Wang, D.; Peng, Z.; Xi, L. The sum of weighted normalized square envelope: A unified framework for kurtosis, negative entropy, Gini index and smoothness index for machine health monitoring. Mech. Syst. Signal Process. 2020, 140, 106725. [Google Scholar] [CrossRef]
  13. Albezzawy, M.N.; Nassef, M.G.; Sawalhi, N. Rolling element bearing fault identification using a novel three-step adaptive and automated filtration scheme based on Gini index. ISA Trans. 2020, 101, 453–460. [Google Scholar] [CrossRef]
  14. Antoni, J. The spectral kurtosis: A useful tool for characterising non-stationary signals. Mech. Syst. Signal Process. 2006, 20, 282–307. [Google Scholar] [CrossRef]
  15. Miao, Y.; Zhao, M.; Hua, J. Research on sparsity indexes for fault diagnosis of rotating machinery. Measurement 2020, 158, 107735. [Google Scholar] [CrossRef]
  16. Stewart, R.M. Some Useful Data Analysis Techniques for Gearbox Diagnostics; Report MHM/R/10/77; Machine Health Monitoring Group, Institute of Sound and Vibration Research, University of Southampton: Southampton, UK, 1977. [Google Scholar]
  17. Sharma, V.; Parey, A. A review of gear fault diagnosis using various condition indicators. Procedia Eng. 2016, 144, 253–263. [Google Scholar] [CrossRef]
  18. Antoni, J.; Borghesani, P. A statistical methodology for the design of condition indicators. Mech. Syst. Signal Process. 2019, 114, 290–327. [Google Scholar] [CrossRef]
  19. Cerrada, M.; Sánchez, R.V.; Li, C.; Pacheco, F.; Cabrera, D.; Valente de Oliveira, J.; Vásquez, R.E. A review on data-driven fault severity assessment in rolling bearings. Mech. Syst. Signal Process. 2018, 99, 169–196. [Google Scholar] [CrossRef]
  20. Cocconcelli, M.; Capelli, L.; Camargo Molano, J.C.; Borghi, D. Development of a methodology for condition-based maintenance in a large-scale application field. Machines 2018, 6, 17. [Google Scholar] [CrossRef]
  21. Li, X.; Yu, T.; Wang, X.; Li, D.; Xie, Z.; Kong, X. Fusing joint distribution and adversarial networks: A new transfer learning method for intelligent fault diagnosis. Appl. Acoust. 2024, 216, 109767. [Google Scholar] [CrossRef]
  22. Zhi, S.; Su, K.; Yu, J.; Li, X.; Shen, H. An unsupervised transfer learning bearing fault diagnosis method based on multi-channel calibrated Transformer with shiftable window. Struct. Health Monit. 2025, 28, 1–18. [Google Scholar] [CrossRef]
  23. Li, X.; Xiao, S.; Li, Q.; Zhu, L.; Wang, T.; Chu, F. The bearing multi-sensor fault diagnosis method based on a multi-branch parallel perception network and feature fusion strategy. Reliab. Eng. Syst. Saf. 2025, 261, 111122. [Google Scholar] [CrossRef]
  24. Zhi, S.; Niu, Y.; Ma, L.; Wu, H.; Shen, H.; Wang, T. Local entropy selection scaling-extracting Chirplet transform for enhanced time-frequency analysis and precise state estimation in reliability-focused fault diagnosis of non-stationary signals. Eksploat. Niezawodn. Maint. Reliab. 2026, 28, 1–18. [Google Scholar] [CrossRef]
  25. Hjorth, B.; Elema-Schönander, A.B. EEG analysis based on time domain properties. Electroencephalogr. Clin. Neurophysiol. 1970, 29, 306–310. [Google Scholar] [CrossRef]
  26. Cocconcelli, M.; Strozzi, M.; Camargo Molano, J.C.; Rubini, R. Detectivity: A combination of Hjorth’s parameters for condition monitoring of ball bearings. Mech. Syst. Signal Process. 2022, 160, 108247. [Google Scholar] [CrossRef]
  27. Cocconcelli, M.; d’Elia, G.; Strozzi, M.; Rubini, R. Diagnostics of Wind Turbine by Detectivity. In Proceedings of the 5th International Conference of the International Federation for the Promotion of Mechanism and Machine Science (IFToMM Italy 2024), Turin, Italy, 11–13 September 2024; pp. 319–326. [Google Scholar]
  28. LTU Wind Dataset Homepage. Available online: https://ltu.diva-portal.org/smash/record.jsf?pid=diva2%3A1244889&dswid=-7062 (accessed on 4 July 2024).
  29. Martin-del-Campo, S.; Sandin, F.; Strömbergsson, D. Dictionary Learning Approach to Monitoring of Wind Turbine Drivetrain Bearings. Int. J. Comput. Intell. Syst. 2021, 14, 1–10. [Google Scholar] [CrossRef]
  30. Github—Wind Turbine High-Speed Bearing Prognosis Data. Available online: https://github.com/mathworks/WindTurbineHighSpeedBearingPrognosis-Data (accessed on 4 July 2025).
  31. Bechhoefer, E.; Van Hecke, B.; He, D. Processing for Improved Spectral Analysis. In Proceedings of the Annual Conference of the Prognostics and Health Management Society, New Orleans, LA, USA, 14–17 October 2013. [Google Scholar]
  32. D’Elia, G.; Cocconcelli, M.; Daga, A.P.; Garibaldi, L.; Rubini, R. Bearing diagnostics based on a Spectral combination of Hjorth’s parameters. In Proceedings of the SURVISHNO 2023—International Conference on Surveillance, Vibration and Signal Processing for Fault Detection, Trondheim, Norway, 20–22 June 2023. [Google Scholar]
  33. Antoni, J. Fast computation of the kurtogram for the detection of transient faults. Mech. Syst. Signal Process. 2007, 21, 108–124. [Google Scholar] [CrossRef]
  34. MathWorks—Wind Turbine High-Speed Bearing Prognosis. Available online: https://it.mathworks.com/help/predmaint/ug/wind-turbine-high-speed-bearing-prognosis.html (accessed on 4 July 2025).
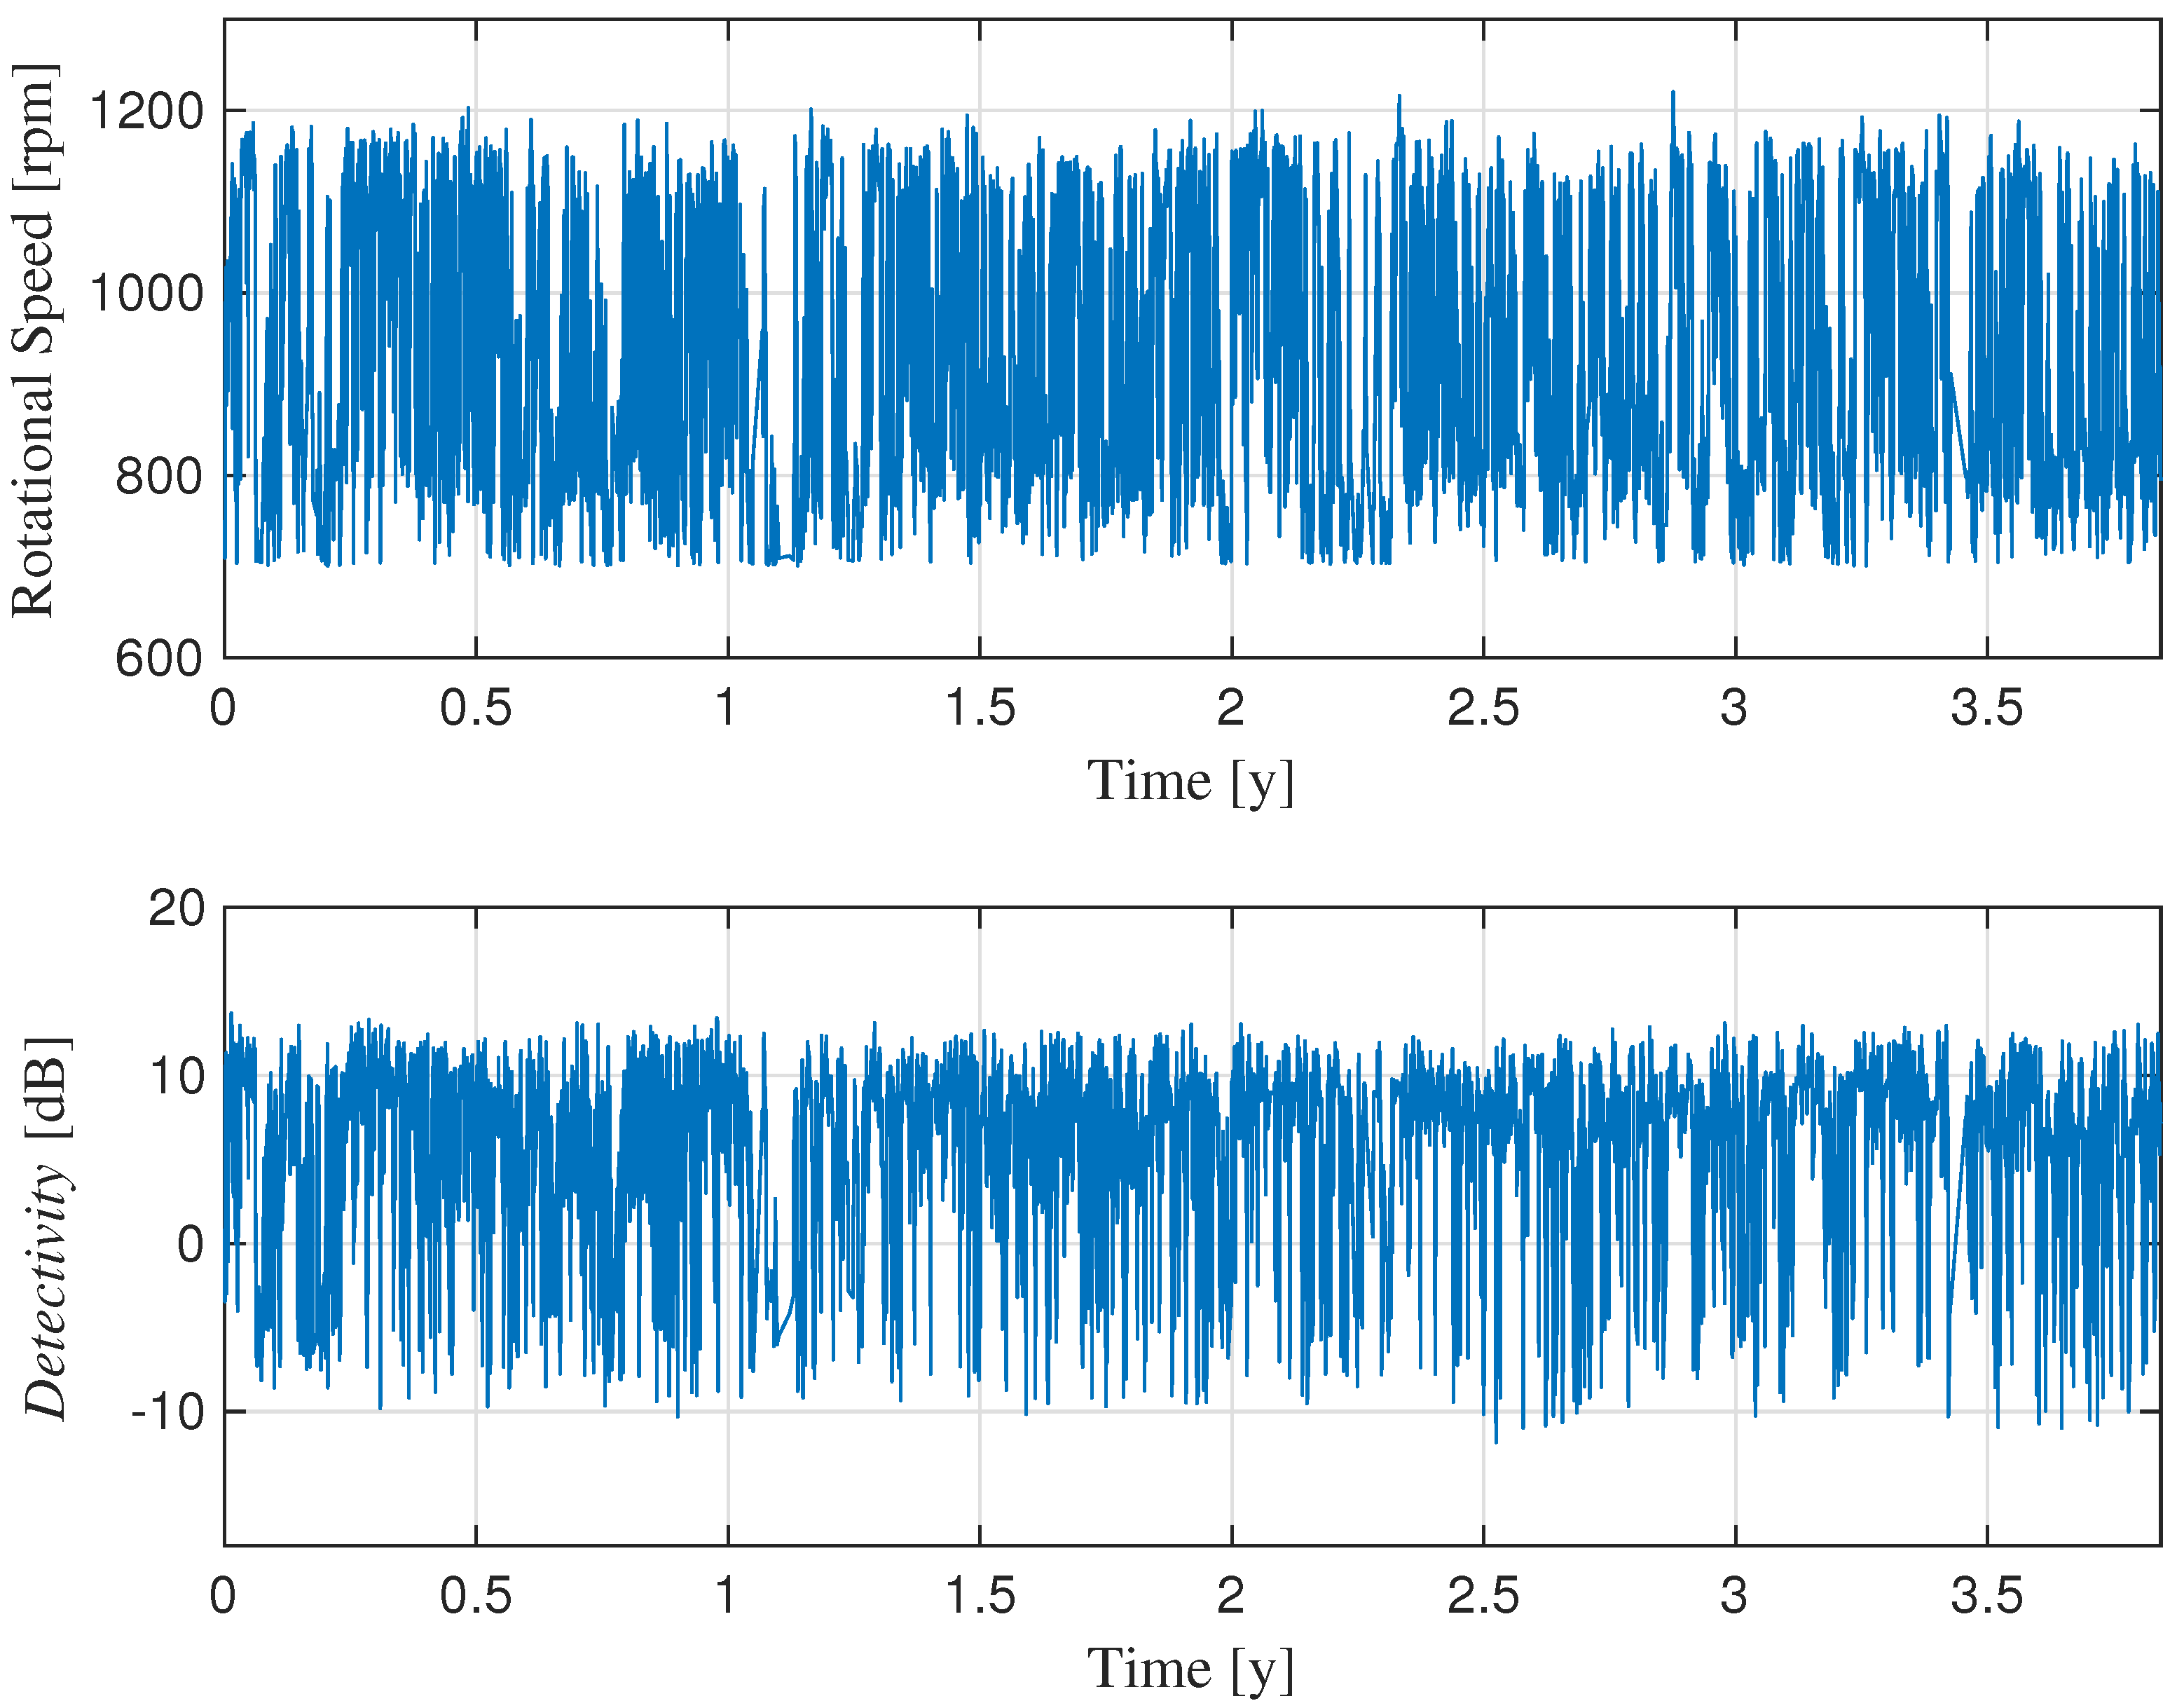
Figure 1. Speed variation of Turbine 1 during the life test and the corresponding values of Detectivity.
Machines 13 00980 g001
Figure 2. Sorted speed for the six turbines.
Machines 13 00980 g002
Figure 3. Histogram of the speed values for the six turbines.
Machines 13 00980 g003
Figure 4. Detectivity values and their results during the test and computed for each turbine.
Machines 13 00980 g004
Figure 5. Fast Kurtogram of the first data sample related to the selected speed range, Turbine 1.
Machines 13 00980 g005
Figure 6. Behavior of Spectral Kurtosis over the monitoring period for each turbine.
Machines 13 00980 g006
Figure 7. Behavior of cumulative Spectral Kurtosis over the monitoring period for each turbine.
Machines 13 00980 g007
Figure 8. Cumulative values of the parameters over the monitoring period for each turbine.
Machines 13 00980 g008
Figure 9. Sequence of time-domain acceleration signals.
Machines 13 00980 g009
Figure 10. Behavior of parameters under investigation across the signal sequence.
Machines 13 00980 g010
Figure 11. Cumulants of the parameters under investigation, across the signal sequence.
Machines 13 00980 g011
Figure 12. Detailed view of the behaviour of cumulative RMS and Detectivity values plotted alongside the reference lines.
Machines 13 00980 g012
Table 1. Variance of Detectivity for each turbine under test, assuming different ones and a simulated Gaussian signal with zero mean and unit variance as reference. In the upper section of the table, the highest value for each column is highlighted in green if it corresponds to the faulty turbine (no. 5) chosen as reference or in red elsewhere; in the lower section, two similar values are significantly higher, revealing actual anomaly (green), and a false positive (red).
Tested Turbine
123456
Turbine
taken as
reference
1049.260.963.469.659.9
249.2054.856.663.553.6
360.954.8020.763.154.5
463.456.620.7066.955.8
569.663.563.166.9063.3
659.953.654.555.863.30
Zero-mean Gs
as reference
6.152.321.171.096.131.47
Disclaimer/Publisher’s Note: The statements, opinions and data contained in all publications are solely those of the individual author(s) and contributor(s) and not of MDPI and/or the editor(s). MDPI and/or the editor(s) disclaim responsibility for any injury to people or property resulting from any ideas, methods, instructions or products referred to in the content.