1. Introduction
Economic growth heavily relies on oil and gas production, particularly in resource-rich countries. Consequently, there is no room for compromise in monitoring these vital assets. They are typically transported from production sites to end users via pipelines, mobile tankers, and ships. Among these options, pipelines are the safest and most secure method for transporting oil and natural gas. Countries have installed pipeline transmission systems ranging from a few meters to several thousand kilometers. Almost all natural gas, crude oil, and refined petroleum products produced and consumed in the United States move through the country’s extensive pipeline network, which accounts for two-thirds of the world’s pipeline capacity. Pipeline transportation has increased by 44% in the past five years [
1]. However, transmission pipeline networks face various issues, including illegal connections, pipeline explosions, leaks, sabotage, and corrosion or erosion of the pipeline. These problems can lead to serious accidents that affect human health, property, and the environment. As mentioned in reference [
2], TransCanada halted the oil flow of the Keystone pipeline network in Amherst, South Dakota, following an unexpected pressure drop detected on 16 November 2017. This event caused around 5000 barrels of oil to be lost. According to [
3], 267,000 gallons of oil spilled in the tundra of Alaska, caused by corrosion in a pipe section that created a two-thirds centimeter hole. In a similar case, a Midwest oil company experienced a comparable situation [
4], where they noticed a significant drop in pressure in their pipeline system. During inspection, a small leak was identified, causing about 360 m
3 of crude oil to be lost. Additionally, a gas loss worth
$285,000 was documented in a Columbia gas incident [
5]. In another instance, an American gas distribution firm reported a leak that led to the loss of 69 billion cubic feet of natural gas [
6].
A monitoring and predictive maintenance system is essential for preventing incidents and ensuring the safe operation of oil and gas pipeline networks. Various strategies have been employed for the condition monitoring of pipelines [
7], including acoustic signal-based systems, fiber-optic cable-based systems, smart pigging methods, sensor hose-based systems, soap bubble screening techniques, pressure point analysis methods, and video monitoring systems. These monitoring methods mainly suffer from high costs, complex design demands, and limited access points. Pipeline operators face a major challenge in real-time pipeline monitoring, as it is not limited to control rooms at designated sites.
Advancements in wireless sensor technology, digitization, and Industry 4.0 principles have enabled a revolutionary approach to the management of the pipeline network. The performance and reliability of modern distribution pipeline monitoring systems depend largely on the implementation of advanced digital solutions and Internet of Things (IoT) technologies [
8]. These IoT-enabled systems facilitate data collection from any location with Internet connectivity, thus revolutionizing pipeline management networks. By digitizing pipeline networks, modern systems can analyze large volumes of sensor data throughout the network and utilize AI algorithms to evaluate the digitized flow data. This enables proactive maintenance, optimized flow efficiency, real-time anomaly detection, and remote monitoring for rapid emergency response. Combining AI with digitized pipeline flow data enhances operational efficiency, reduces downtime, lowers costs, and improves resource management.
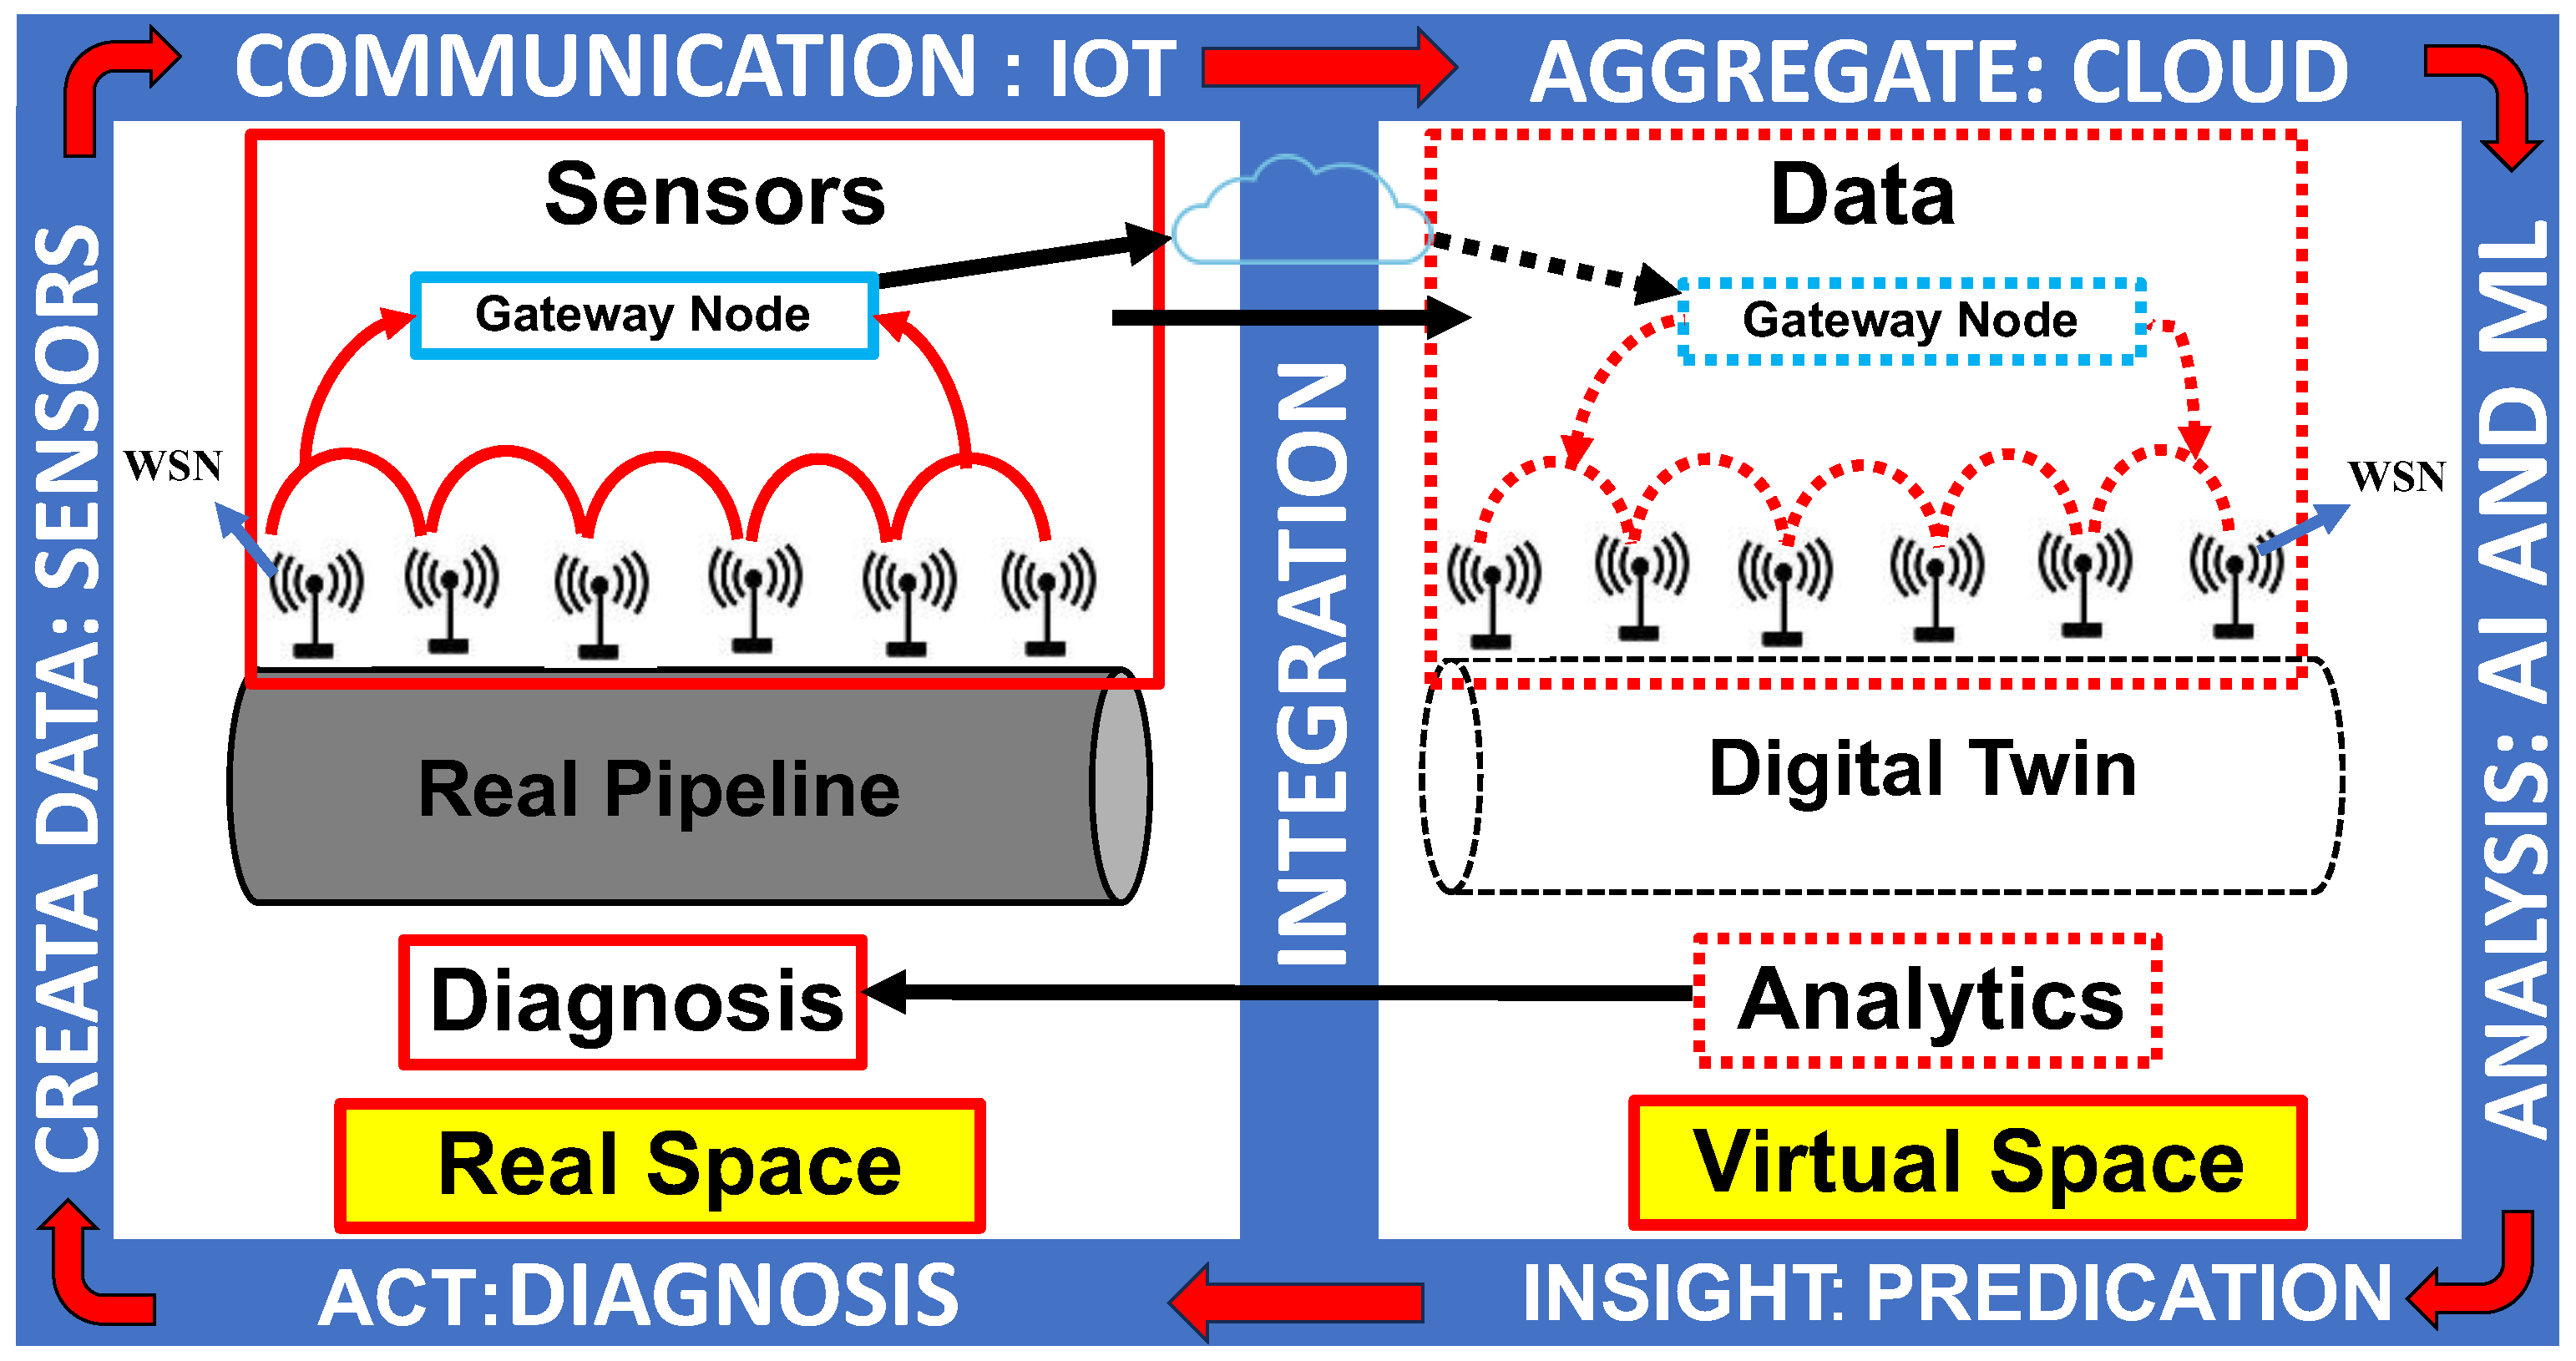
Digital twin technology has gained significant attention because it offers a cost-effective, reliable, and intelligent maintenance strategy that leverages machine learning (ML) algorithms and evaluates extended life initiatives. The digital twin concept consists of three main elements: a physical tangible asset, a virtual representation of the asset, and a connection linking these two components. This connection allows information to flow from the physical asset to the digital twin and vice versa. In the pipeline digital twin system (
Figure 1), a network of multiple wireless sensor nodes (WSNs) is strategically placed along the length of the pipeline. These WSNs gather real-time data on various physical parameters, including pressure, flow rate, temperature, and vibration. The data are sent wirelessly to a gateway sensor node, where the information from all the WSNs is aggregated and analyzed. Using different AI algorithms, the gateway sensor analyzes the incoming data to extract valuable insights and make intelligent decisions regarding the pipeline flow. These algorithms may include machine learning techniques such as anomaly detection, pattern recognition, and predictive modeling. By continuously monitoring the data stream, the system can detect potential issues or failures in the pipeline network. It can dynamically adjust the valve positions, flow rates, and operational parameters to address emerging problems and proactively optimize system performance. In addition, the digital pipeline system is not limited to a specific area. Its global accessibility enables stakeholders, including decision-makers, maintenance personnel, and pipeline operators, to coordinate maintenance activities more efficiently and monitor the condition of pipelines remotely.
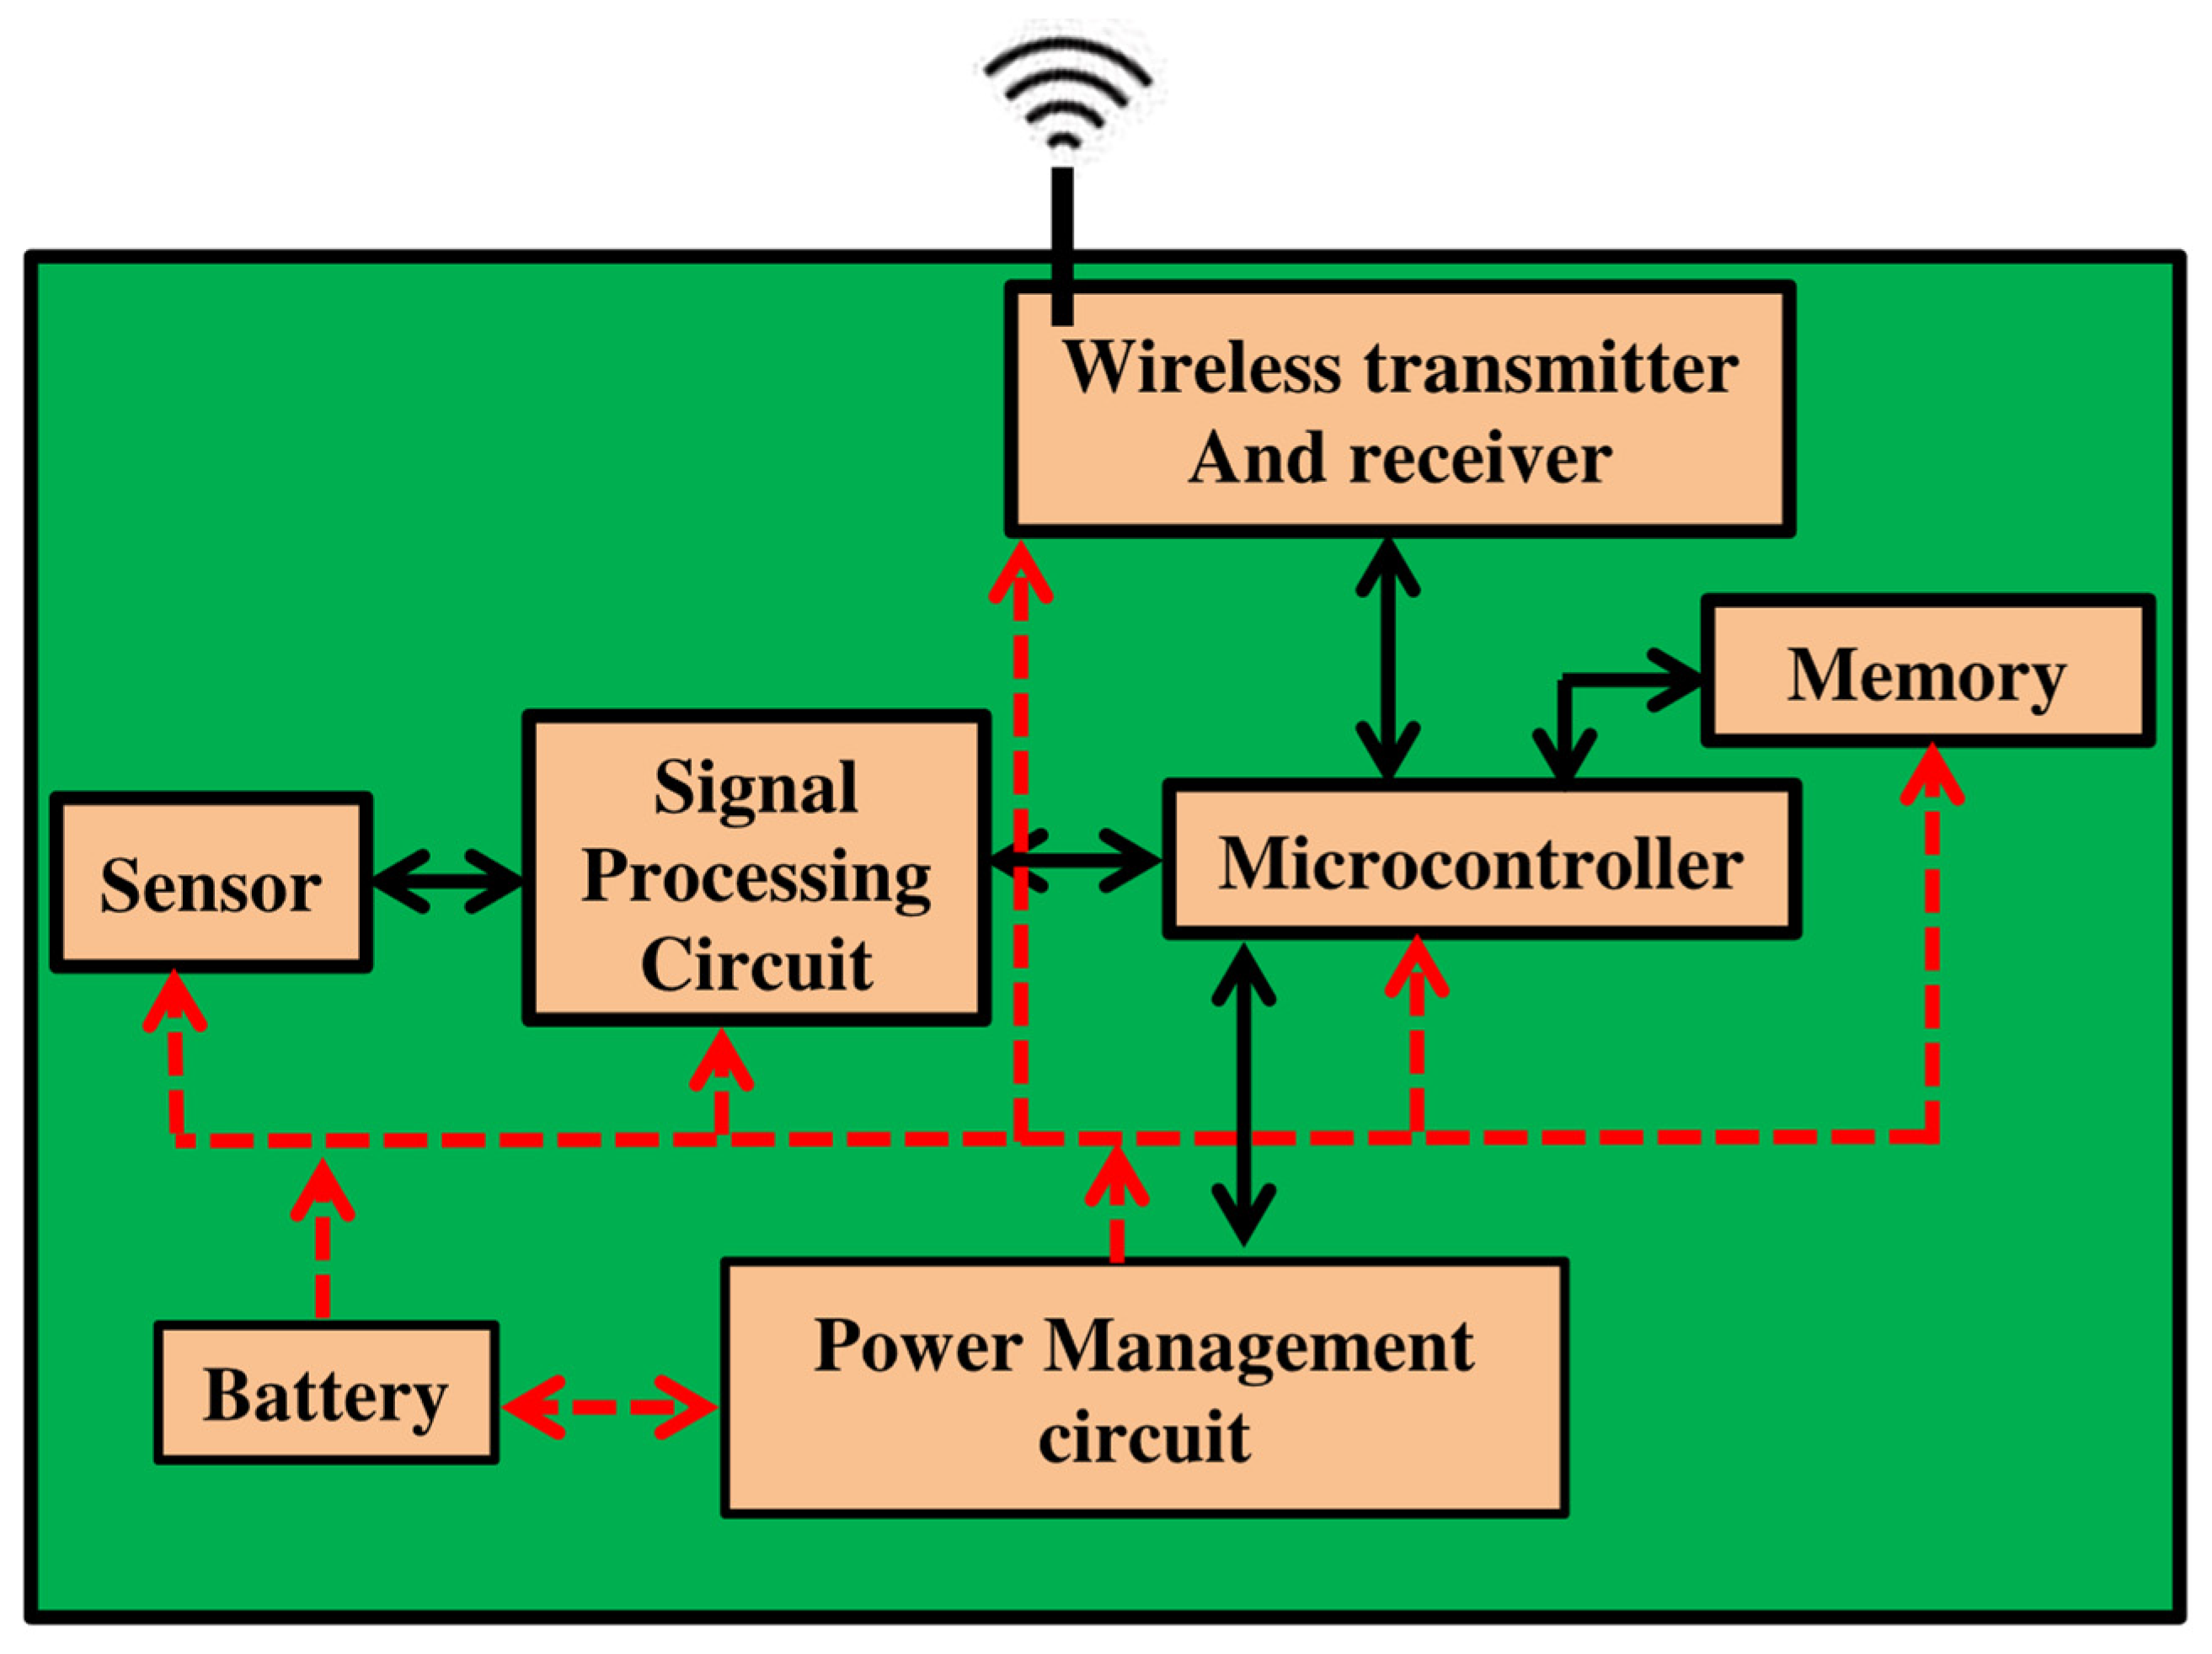
A wireless sensor node (WSN) is an essential part of the digital twin system of a pipeline network. The architecture of the WSN used for the digitization of the pipeline flow is shown in
Figure 2. Wireless sensor networks (WSNs) are composed of several key elements, including sensors, memory, signal conditioning and processing units, microcontrollers, power management systems, and a transceiver unit. The sensing component detects various physical aspects of the pipeline, such as flow rate, vibration, humidity, temperature, and pressure. These sensor readings are converted into electrical signals and processed by the processing unit. The data are subsequently sent to a transceiver module for further analysis and stored in the onboard memory. A microcontroller manages all onboard operations and functions, including alert systems, sleep modes, and transmission activities. Additionally, the battery provides power to all the system components.
Contemporary digital pipeline monitoring systems employ low-power, commercially accessible wireless sensor networks (WSNs).
Table 1 shows their power use. Operating voltage varies from 3 V to 5 V, while current ranges from 12 μA to 23 mA. Power consumption spans 80 µW to 100 mW. This variation in power demand highlights the importance of carefully selecting and integrating sensor nodes in energy-constrained environments, particularly when powered by hybrid energy harvesters. Efficient power management, including duty cycling, low-power communication protocols, and energy-aware firmware design, is essential to ensure sustained operation in remote or hard-to-reach pipeline infrastructure, where battery replacement is impractical and energy autonomy is critical.
The digital transformation of pipeline networks encounters a significant obstacle in powering a large number of WSNs, especially in remote and inaccessible locations. These systems predominantly depend on batteries, which come with inherent drawbacks such as frequent replacement and short lifetime. Such limitations can interrupt data transmission and potentially compromise decision-making processes supported by AI algorithms. These disruptions can impede real-time monitoring of the pipeline network. To overcome these challenges and maintain continuous operation, WSNs need a durable alternative power source to ensure an unbroken data flow and support accurate, dependable pipeline digitization. In the vicinity of the pipeline network, there is an abundance of energy available in various forms, such as vibration [
10,
11], RF [
12], airflow [
13], thermal [
14], temperature fluctuations [
12], and solar energy (both indoor and outdoor) [
15]. However, these sources of energy have limitations; for instance, solar energy is plentiful on clear, sunny days but drops considerably during overcast or rainy weather. Likewise, wind energy is not a viable option for energy harvesting because of its heavy reliance on environmental and locational factors. Additionally, RF energy is highly location-dependent and lower power density. In monitoring pipeline systems that utilize WSNs, the energy generated by the flow inside the pipeline serves as a steady and dependable power source. This energy can be harvested through various methods, including a small turbine, EM energy harvesters, PE energy harvesters, or a combination of PE and EM based energy harvesters.
2. Literature Review
Recent research has increasingly focused on pipeline system digitization, with the goal of revolutionizing how infrastructure is monitored and managed. Significant advancements have been made in integrating cutting-edge sensor technologies and data analytics, which facilitate predictive maintenance and proactive strategies. Li et al. [
16] created a digitization system for a subsea pipeline network using a data-driven model to predict corrosion. Three data-driven techniques were integrated into the model: support vector regression, artificial bee colony algorithm, and principal component analysis. The created model was examined using corrosion rate forecasting for crude oil subsea pipelines. Ayeni et al. [
17] investigated the integration of the Internet of Things (IoT) into pipeline monitoring systems by designing sensor networks to collect various metrics for pipeline condition monitoring. Moreover, a real-time IoT framework for localizing leaks in petroleum pipelines was presented in [
18]. Numerous researchers have investigated the potential of harnessing energy from pipeline kinetic energy to a wireless sensor network involved in the digital transformation of pipeline systems. They have suggested solutions such as mini turbines and energy harvesters based on electromagnetic and piezoelectric transduction. Howey et al. [
19] presented a 2 cm rotor shrouded wind EH operated at 3 m/s of flow speed. The harvester produced 2.5 mW maximum power at an airspeed of 7 m/s. Krahenbuhl [
20] introduced a small turbine-type flow-based energy harvester (FEH). The gas passes through a turbine that drives a generator to produce electricity. The turbine and generator had a combined volume of 36.8 cm
3. The experimental results indicate that the system achieves its highest efficiency of 52%, generating 170 mW of output power. An EH based on airflow was presented in [
21], which has a miniature wind turbine that converts the kinetic energy of the airflow in the AC duct into electrical energy. The device incorporates a brushless DC motor and a small turbine having a 10.2 cm rotor diameter and 10.1 cm blade size. An air-flow-based wind turbine [
22] powers the WSN by converting air flow energy in the AC duct. The device comprises a brushless DC motor, a three-phase bridge circuit, and a mini turbine with a 10.2 cm rotor diameter. At a flow speed of 5.1 m/s, the system produced an output power of 28 mW. A miniature turbine with a 4.2 cm rotor diameter that converts pneumatic flow into usable energy was described in [
23]. The device produced a maximum output power of 2.4 mW at a flow velocity of 5.5 m/s. Carli et al. [
24] introduced a 300 cm
3 wind-flow energy harvester. A 6.3 cm wind turbine was the main component of the proposed device. Under a 4.4 m/s wind speed, the designed energy harvester generated 10 mW of output power. A small wind turbine of centimeter scale [
25] with a rotor of 2 cm and 12 blades converts the kinetic energy in the AC duct to electrical energy. The prototype achieved a peak power output of 4.3 mW at a flow velocity of 10 m/s. A windmill presented by Myers et al. [
26] produced 5 mW power at a flow velocity of 5 m/s. Chan et al. [
27] harnessed the water flow energy by developing a vertical-axis hydraulic turbine. At 1.5 m/s of flow speed, the system generated 80 mW, as indicated by both the modeling and experimental results.
The turbine-type flow energy harvesting method is often unsuitable because of its placement within pipelines or channels and its larger size. To address the issues associated with turbines, researchers have developed electromagnetic and piezoelectric types of FEHs. The EM-based FEH includes a permanent magnet and a wound coil mounted with a beam or membrane. The EM induction principle underpins the energy conversion process in EM-based FEHs. As the flow causes vibrations in the structure, the relative motion between the magnet and coil changes the magnetic flux, producing an electromotive force that generates an electrical current. Compared to piezoelectric transducers, EM-FEHs offer benefits such as a more scalable and durable design, higher power output at lower frequencies, and better resistance to harsh environmental conditions. Although piezoelectric harvesters are more effective at high frequencies, they are less suitable for low-frequency flow vibrations and are more sensitive to environmental factors such as humidity and temperature. Conversely, EM harvesters are cost-effective, durable, and capable of operating over a broad frequency range, making them ideal for long-term use in dynamic environments. An EM flow-induced vibration energy harvester was introduced in [
28]. The experimental findings showed that at a flow velocity of 2.5 m/s, an output voltage of 2 Vrms was produced. Wang [
29] presented an EM-based flow energy harvester designed to capture the KE of the flowing fluid. They provided a comprehensive analytical model and physical prototype with a volume of 37.9 cm
3. The device produced an output voltage of 20 mV and a power output of 1.77 µW, with a flow pressure of 0.3 kPa and a frequency of 62 Hz. Khan et al. [
30] also introduced an EM-based FEH. This energy harvester includes a central spherical magnet that rotates within a plastic tube with a wound coil encircling the pipeline’s bypass section. The prototype reached a maximum load voltage of 1 V and generated a power output of 1456 µW when connected to a load resistance of 290 Ω, operating at a flow rate of 1.03 L/s and a flow frequency of 540 Hz. Incorporating a rectifying circuit resulted in 1190.7 µW of DC power under similar flow conditions. Bakhtiar et al. [
31] presented an EM-based FEH that generated a load voltage of 2.47 V and a load power of 188,151.2 µW at an optimal resistance of 4.3 Ω under a fluid pressure of 625 Pa. A gas flow-based spherical magnet-type EMEH [
32] was designed, consisting of a tube containing a wound coil. Overall, the harvester had a volume of 15.89 cm
3. A spherical magnet floating freely was inserted into a rotating tube driven by gas flow. At 290 Ω load resistance, 1.035 L/s flow rate, and 540 Hz frequency, the harvester produced 650 mV output voltage and 1456 mW output power. A flow-type electromagnetic energy harvester was designed to generate electricity from flowing fluids in pipelines [
33]. The energy harvester features a cylindrical magnet housed within it and a wound coil on a flexible membrane that vibrates owing to fluid flow. The designed harvester volume was 24.37 mm
3. At a flow pressure of 625 Pa and optimal resistance of 4.3 Ω, the harvester delivered 1.2 V output voltage and 18.6 mW output power. An EMEH is designed to generate power from flow-induced vibrations in pipelines [
34]. The developed prototype had an overall volume of 216 mm
3. The maximum load voltage and load power were reported to be 10.2 mVpp and 0.4 µW, respectively, at a flow pressure of 254 Pa. Sudhwiyankul and Israrkorm [
35] introduced an EMEH capable of supplying power to WSNs utilized for the health monitoring of machines. The harvester produced a maximum power density of 110 μW/cm
3 at a flow speed of 175 mm/s. Hoffmann et al. [
36] developed an energy harvester based on the EM transduction mechanism. The EH consists of a ring-shaped magnet with three coils arranged in a star configuration. The system employs a three-phase power-generating concept that harnesses energy from water flow in household pipes to generate electricity for an innovative metering network. The harvester produced an output power of 2 mW at a flow rate of 3 L/min.
PE-based flow-induced vibration EHs have gained significant attention as a renewable energy solution because they can harness energy from fluid flows, such as air or water, and convert it into electricity using the unique properties of piezoelectric materials. PE-FIVEHs rely on the interaction between a moving fluid and a specially designed mechanical structure embedded with piezoelectric elements to generate electricity. As the liquid flows, it exerts forces on the structure, causing vibration or oscillation. The device then converts these mechanical vibrations into electrical energy. To efficiently transfer the generated charge, PE-FIVEHs typically use electrodes to direct electrical energy to the load. Several key factors, including density, dielectric constant, Curie temperature, and modulus of elasticity, are essential considerations when selecting a piezoelectric material for PE-FIVEH applications [
37]. Earturk et al. [
38] developed an FEH using a piezoelectric beam-type design. The PE beam within the blower tunnel vibrates due to airflow, producing a peak power of 10.72 mW at 9.4 m/s flow speed. A piezoelectric beam-based FEH [
39] generated an output voltage of 2.2 V and power of 0.2 µW under a flow pressure of 1.196 kPa and a frequency of 26 Hz. A PE-FEH was developed in [
40] to effectively harness electricity from airflow in AC ducts, aimed at powering autonomous sensors. When tested at 4 m/s, the EH prototype achieved 100 µW output power and a peak output voltage of 14.14 V. In [
41], a double-bluff body energy harvester was created. Electrical energy is generated when the piezoelectric membrane vibrates due to oscillations induced by the bluff bodies When connected to a 332 kΩ load resistance, the prototype produced 114 mV of voltage and 0.59 nW of power at 872 Hz frequency and 70 kPa flow pressure. Song et al. [
42] developed a 113.68 cm
3 FEH that generated an output voltage of 500 mV and power of 21.86 µW at a flow velocity of 0.31 m/s with a 179.5 kΩ load resistance. A piezoelectric FEH [
43] achieved an output voltage of 120 mV and power of 0.7 nW at a flow pressure of 0.3 kPa and frequency of 52 Hz, whereas another design [
44] generated an output voltage of 72 mV and power of 0.45 nW under a flow pressure of 20.8 kPa and frequency of 45 Hz. Cunefare et al. [
45] introduced a piezoelectric FEH based on vortex-induced vibration. At a load resistance of 115.5 kΩ, a resonance frequency of 450 Hz, and a flow pressure of 400 kPa, the harvester generated an output power of 1200 µW. An energy harvester utilizing a piezoelectric mechanism driven by water flow was developed in [
46]. This harvester has a total volume of 136.65 cm
3. At a flow speed of 6.8 m/s, it generated a load voltage of 6.6 mV and an output power of 44 µW with a 10 MΩ load resistance.
FEH discussed earlier in this study consists of either small turbine types or single devices utilizing piezoelectric or electromagnetic transduction mechanisms. Additionally, most electromagnetic-type developed EHs feature a single coil. To the authors’ knowledge, until now, there has been no development of a pipeline flow-based single-unit hybrid energy harvester with a circular piezoelectric plate and two wound coils. This gap highlights the need for an advanced compact-size energy harvester that combines multiple energy transduction mechanisms to improve energy output and system efficiency. In this paper, a hybrid energy harvester was designed to include two coils in the EM section and to combine piezoelectric and electromagnetic transduction mechanisms. Its single-unit architecture reduces the overall size of the harvester and facilitates its installation in open and buried pipeline systems. Additionally, small holes were drilled in the lower portion of the harvester housing, which significantly improves magnetic flux density across the fixed coil. The reduced overall size and optimized coil configuration lead to a lower internal impedance in both the piezoelectric and electromagnetic sections, ensuring improved power transfer and stability. This design converts the pulsating flow energy at pipeline junctions and elbows into electrical energy. This study examined how flow frequency, flow pressure, flow rate, and external resistance influenced the performance of the hybrid FEH. This innovative approach overcomes the shortcomings of current systems and guarantees an uninterrupted power source for IoT-enabled digital pipeline monitoring solutions.
4. Modeling and Simulation
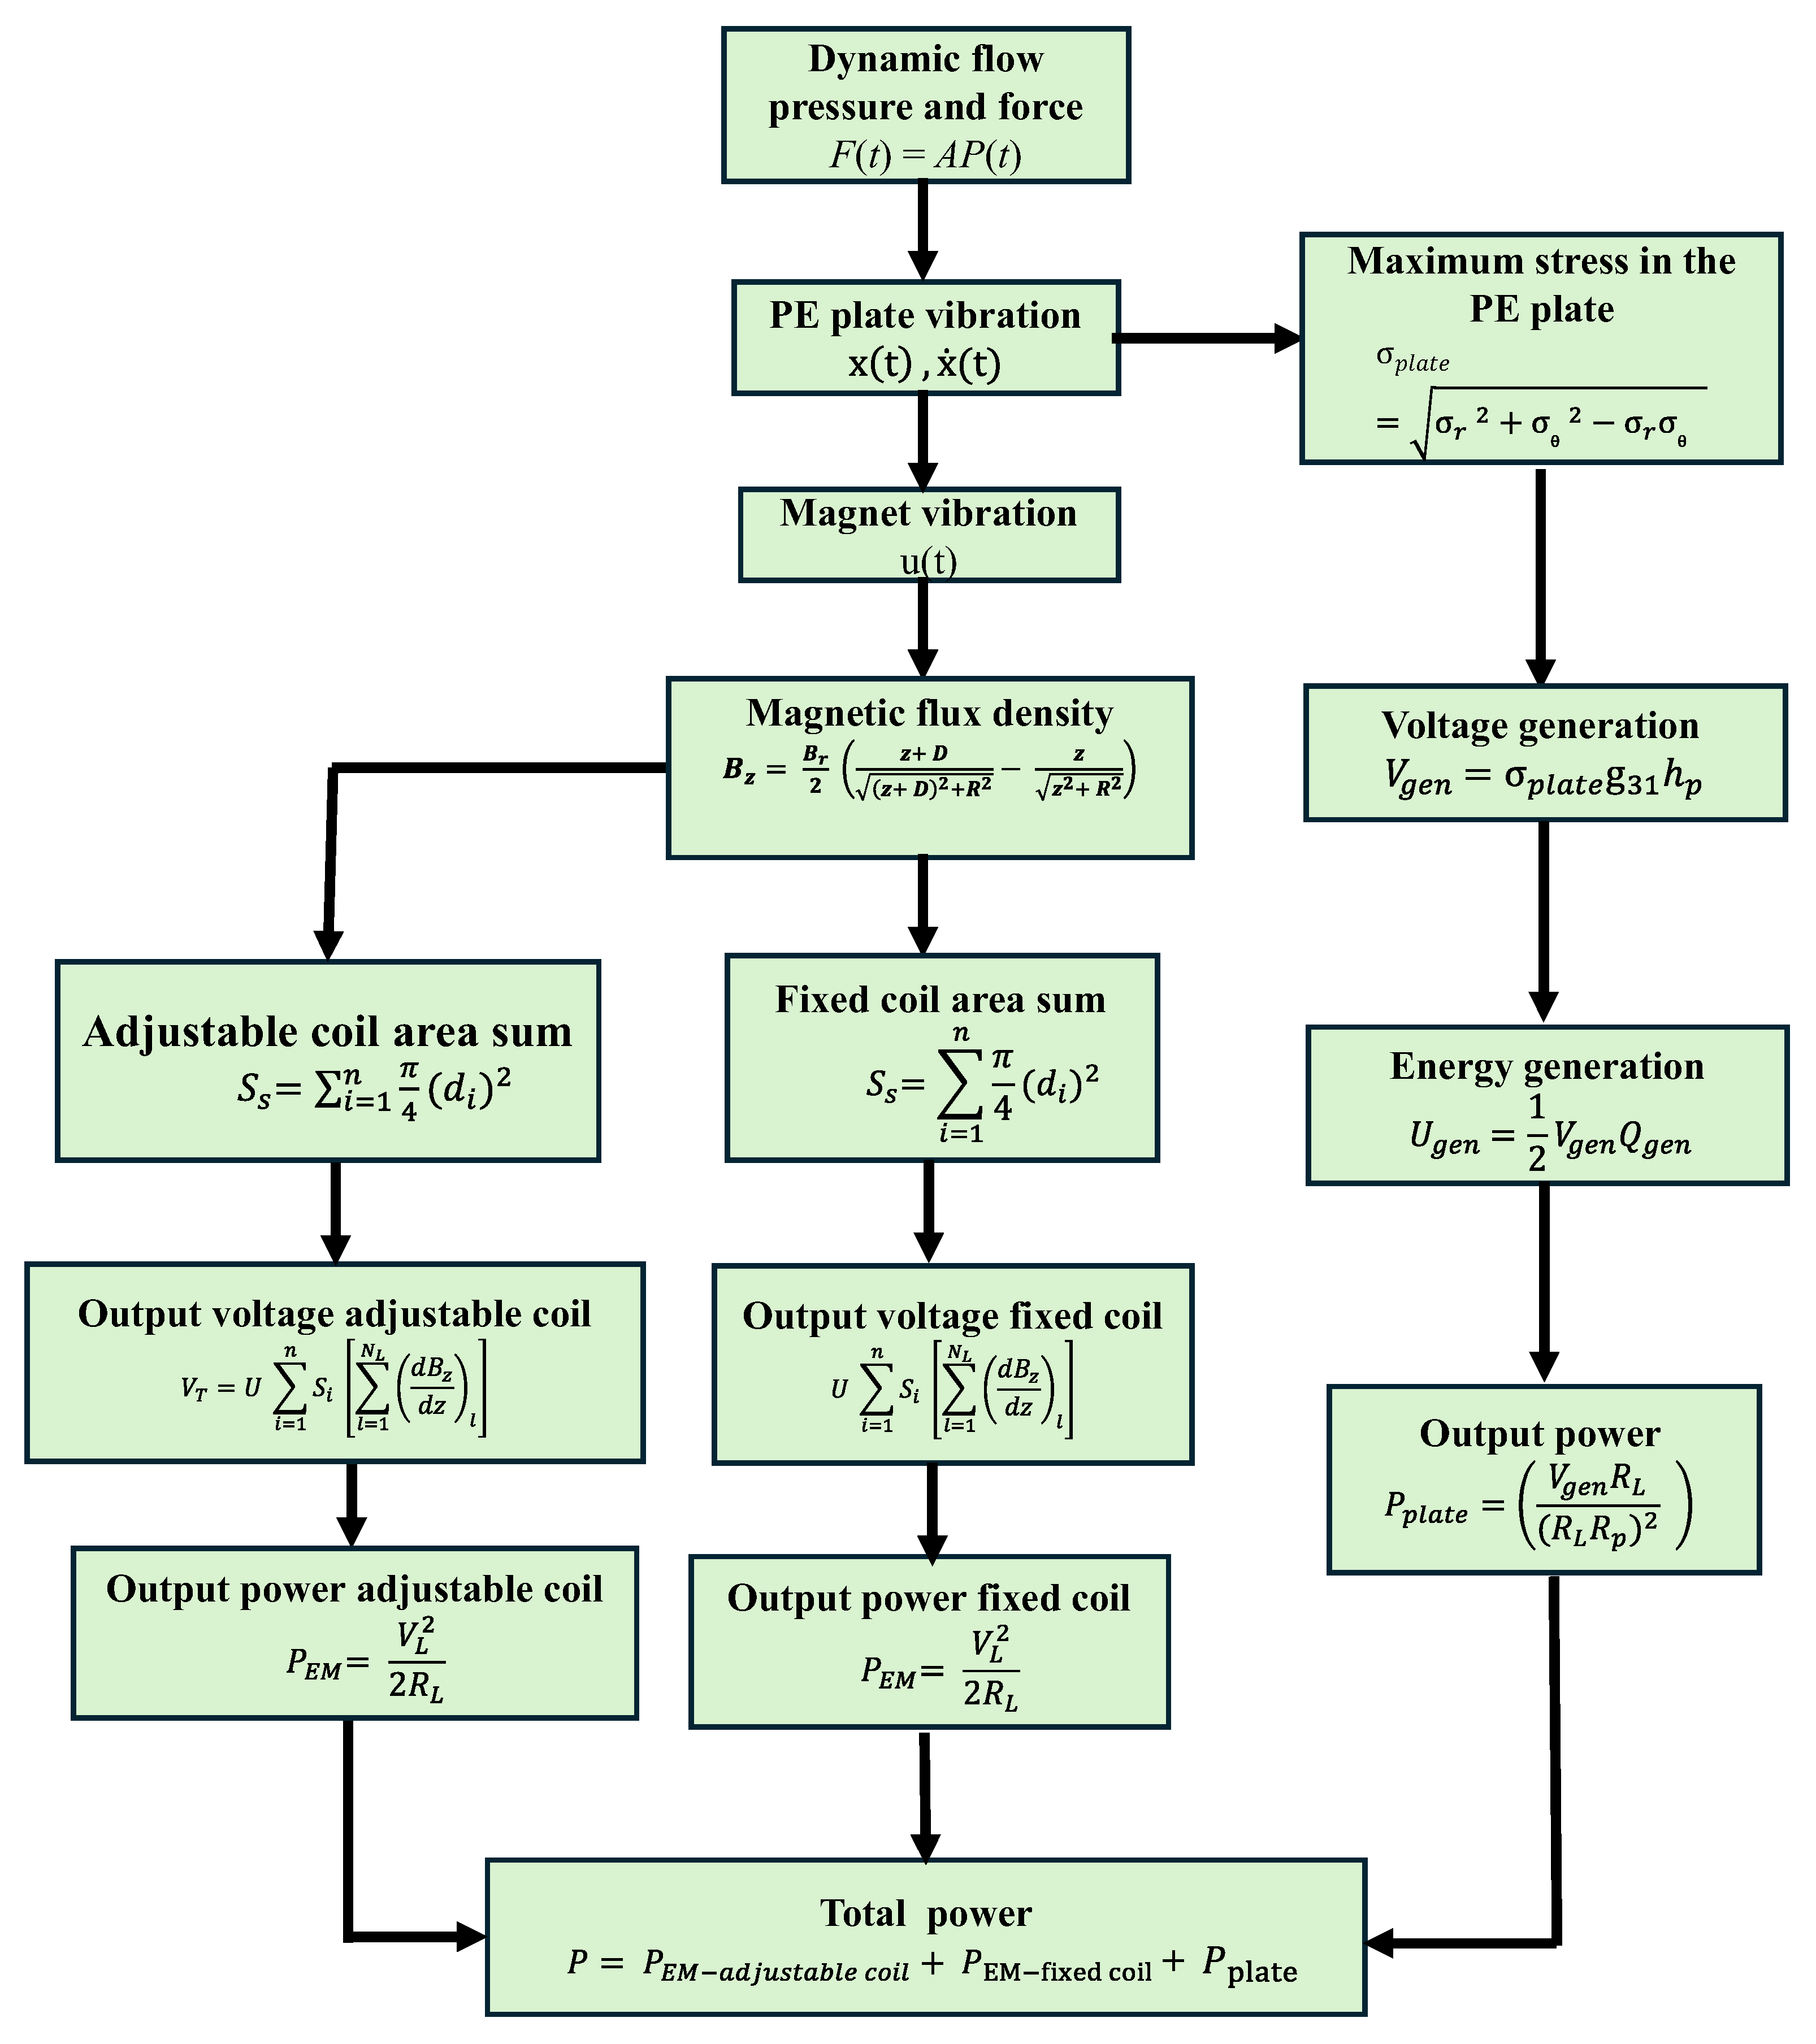
An analytical model was developed for the PE and EM components to investigate the elements influencing EH efficiency.
Figure 4 provides an overview of this analytical model [
9].
The piezoelectric plate is securely mounted within the housing, with a proof mass (magnet) at the center to reduce its natural frequency. Variable flow pressure is applied at one side of the PE plate
causing it to bend dynamically. This deformation induces tensile and compressive stresses within the PE layers, leading to charge generation at the electrodes via the piezoelectric effect [
47].
The bending differential equation of the piezoelectric circular plate is [
48]
where
w is the deflection, and the flexural rigidity is represented by G of the PE circular plate. Substituting the shear stress
in Equation (1), we obtain
Solving Equation (2) for the maximum deflection of the circular plate
, we obtain
The variable r represents the distance from the center of the plate to the point of deflection, P
0 signifies the flow pressure applied, and a stands for the radius of the plate. The flexural rigidity is defined by [
49].
The von Mises stresses on the entire surface integrate all stress components to assess their combined impact on the plate, as described in [
50].
Here,
is the radial stress, and
is the flexural stress in the plate. The voltage that appears on the electrode of the PE plate is
Here,
is the voltage constant that relates the electric field generated in direction 3 (thickness direction) due to a mechanical stress applied in direction 1, and
is the thickness of the PE layer. The power delivered by the PE plate
depends on external load
and internal load
.
In the harvester, the magnet undergoes a relative displacement with both wound coils, resulting in a changing magnetic flux Φ and inducing voltage at the coil’s terminals according to Faraday’s law [
51].
For a single-layered coil, Equation (9) can be simplified as
In a single coil layer, the voltage V
L is generated based on the relative speed U between the piezoelectric membrane (magnet attached) and the coil, the gradient of the magnetic flux density
, and the total area
of the coil. For a coil with a single layer that has n turns and an internal diameter d
p, the total area is calculated as
Here,
is the area of the ith circular turn and is given by
where
so
The amplitude of the piezoelectric plate [
31]
is influenced by the plate’s circular natural frequency
, the excitation frequency ω of the applied flow pressure, and its deflection
of the piezoelectric plate and the total damping
Here,
is the mechanical damping, and
. From the basic dynamics of the circular plate theory, the plate velocity magnitude will be
Putting the value of maximum amplitude from Equation (15), the plate velocity will be
As the plate is subjected to oscillating pressure p(t) over an area A. So, substituting F
0=P(t)A, the amplitude of plate velocity will be modified as
The normal component of the magnetic flux density
is assessed along a line that traverses the center of the magnet from its surface to its center. The magnetic flux density is influenced by several factors, including magnet height D, remnant flux density B
r, gap between coil and magnet, and magnet radius R.
The magnetic flux density gradient
for a single magnet can be determined by taking the derivative of
Bz. The magnetic flux density gradient.
It has to be computed for the number of layers N
L of the wound coil. The number of layers for the wound coil having a wire diameter
and height
h can be modeled as
For multiple layers, total voltage [
51]
can be derived by substituting Equations (14), (19), and (22) in Equation (10). When a resistive load
RL is attached to the energy harvester, the load voltage
at the load and load power
can be determined.
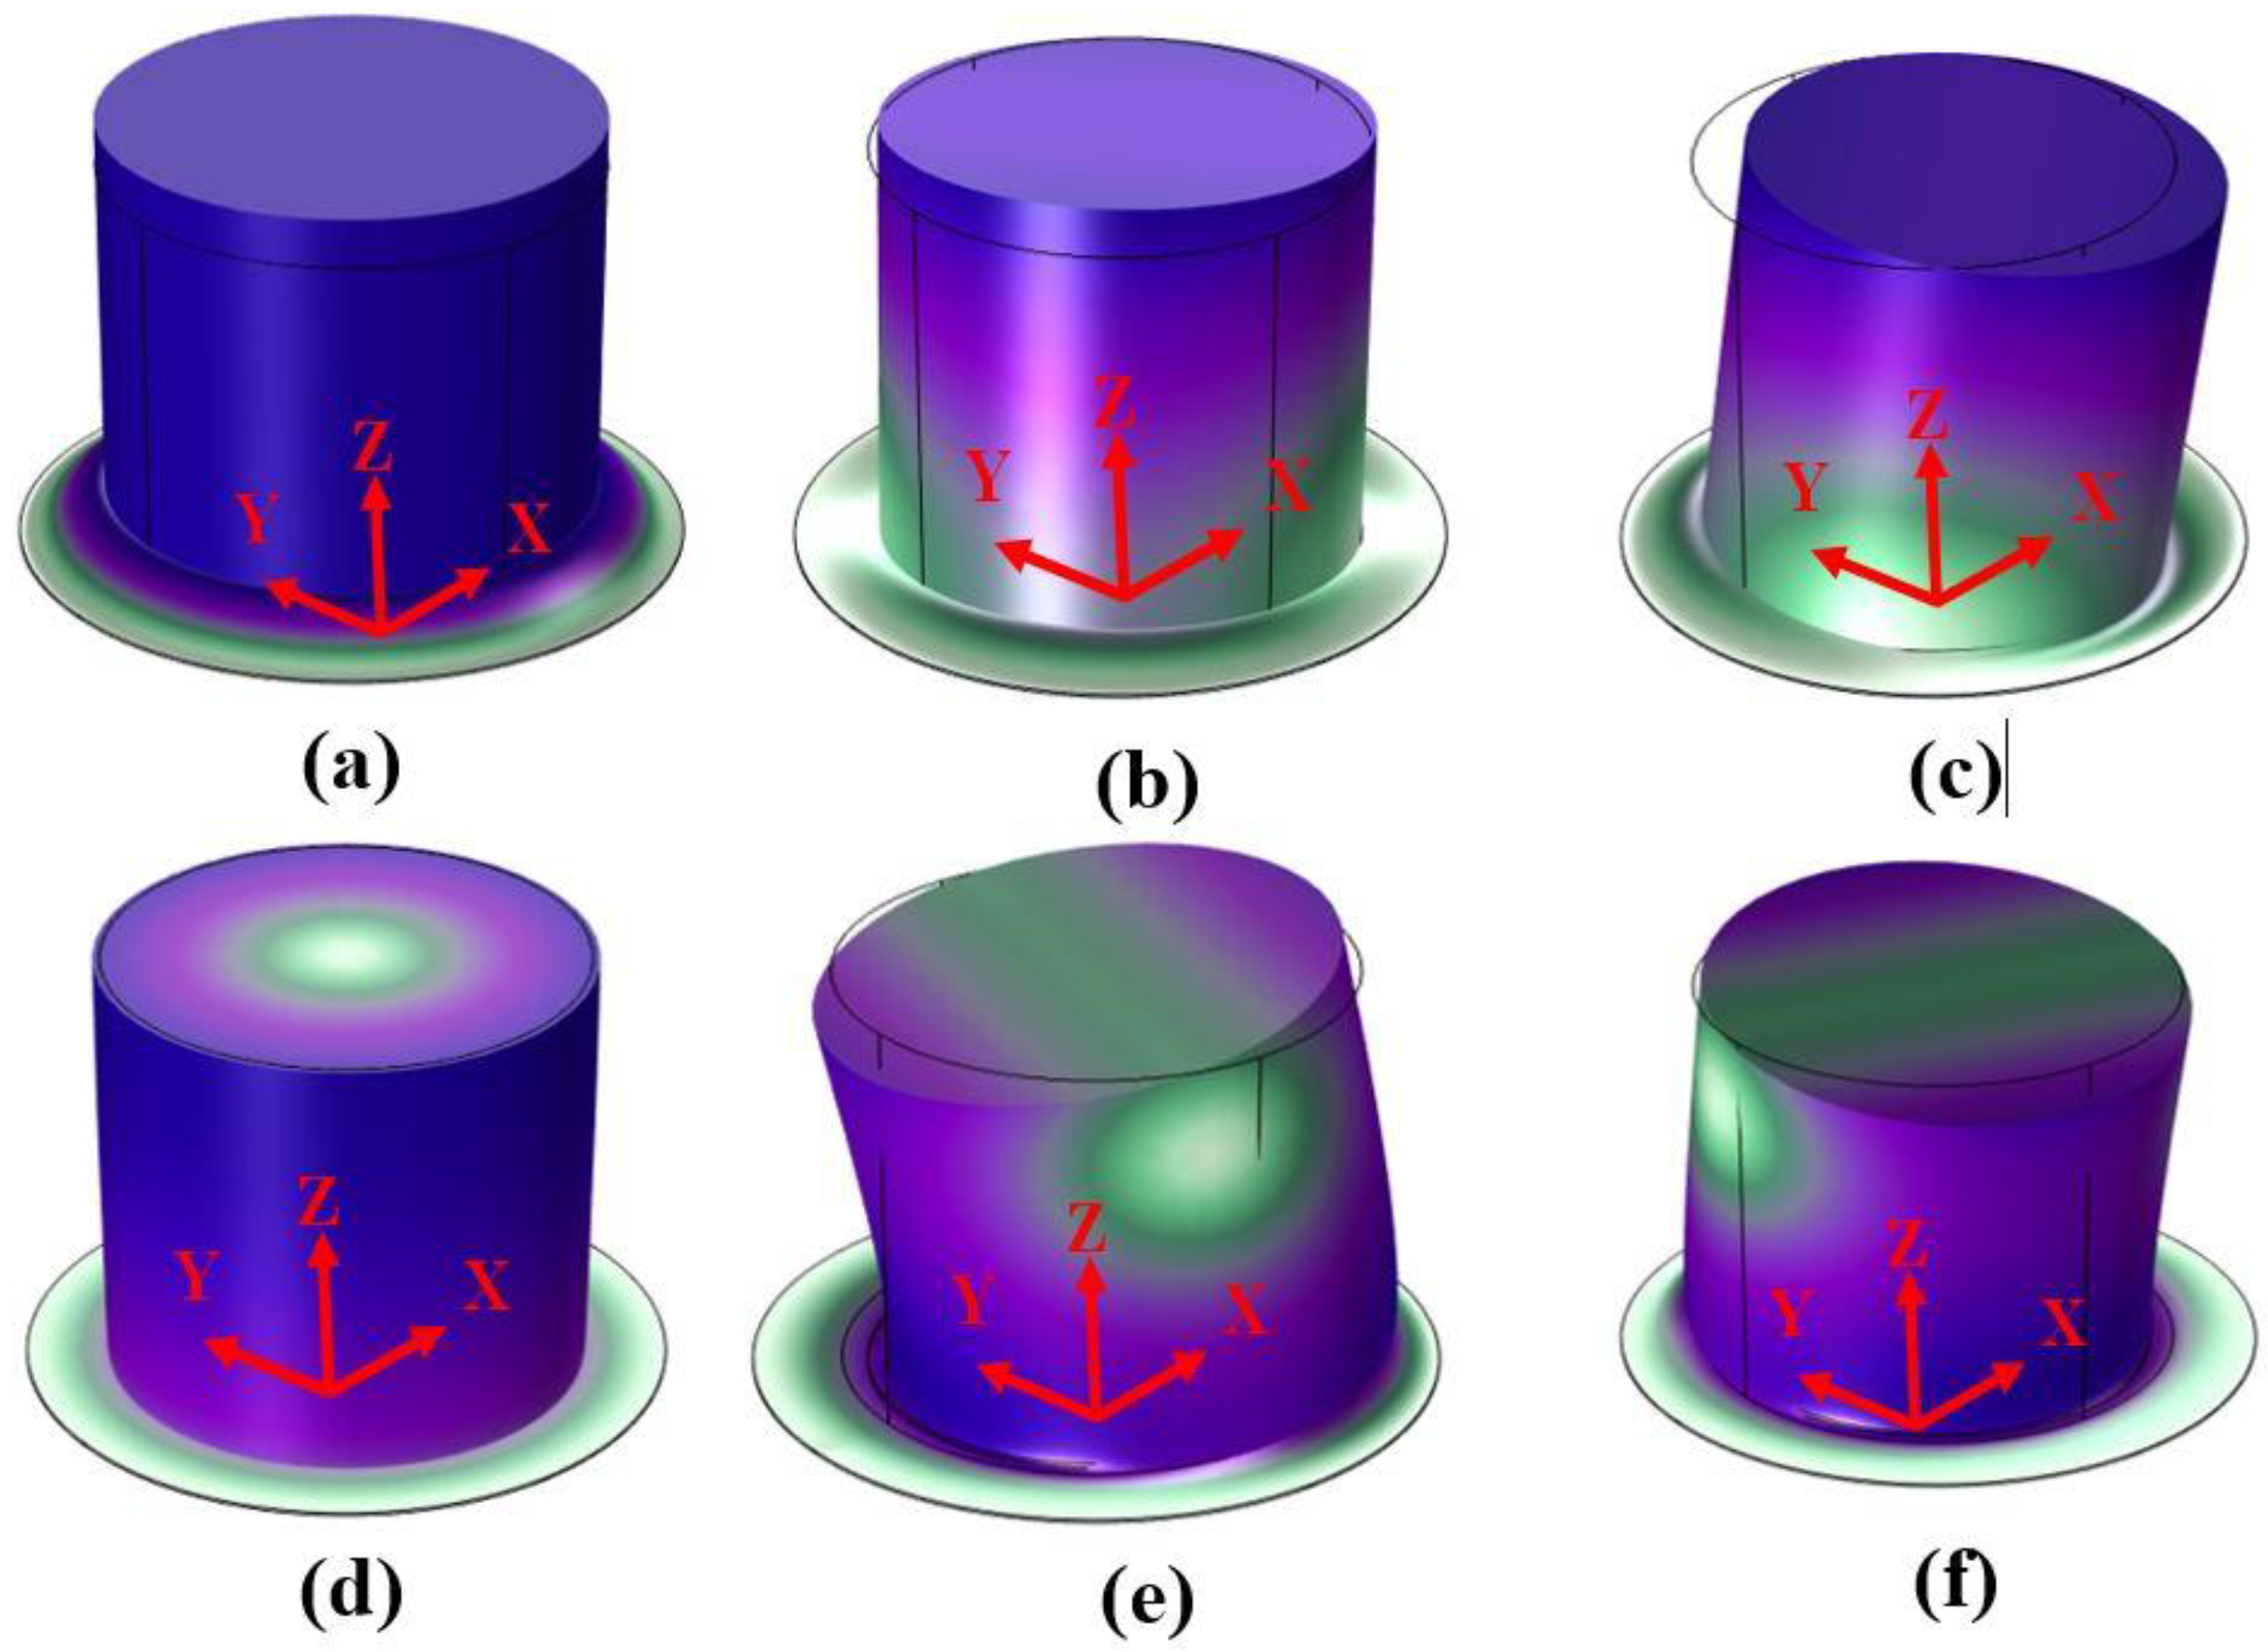
Figure 5 depicts the analysis performed in COMSOL Multiphysics 6.2 to determine the first six natural frequencies and associated vibration modes of the PE plate equipped with a magnet serving as the proof mass. At the initial eigenfrequency, the piezoelectric plate and the magnet ascend together vertically along the z-axis. The proof mass remains stationary while the plate oscillates near the periphery on the opposite side at the second eigenfrequency. At the third eigenfrequency, the piezoelectric plate oscillates vertically on opposite sides along the z-axis. At the fourth mode, the magnet rotates around the z-axis with the piezoelectric plate remaining fixed, whereas in the fifth and sixth modes, the proof mass experiences combined rotations about the z- and y-axes along with vertical motion of the piezoelectric plate along the z-axis.
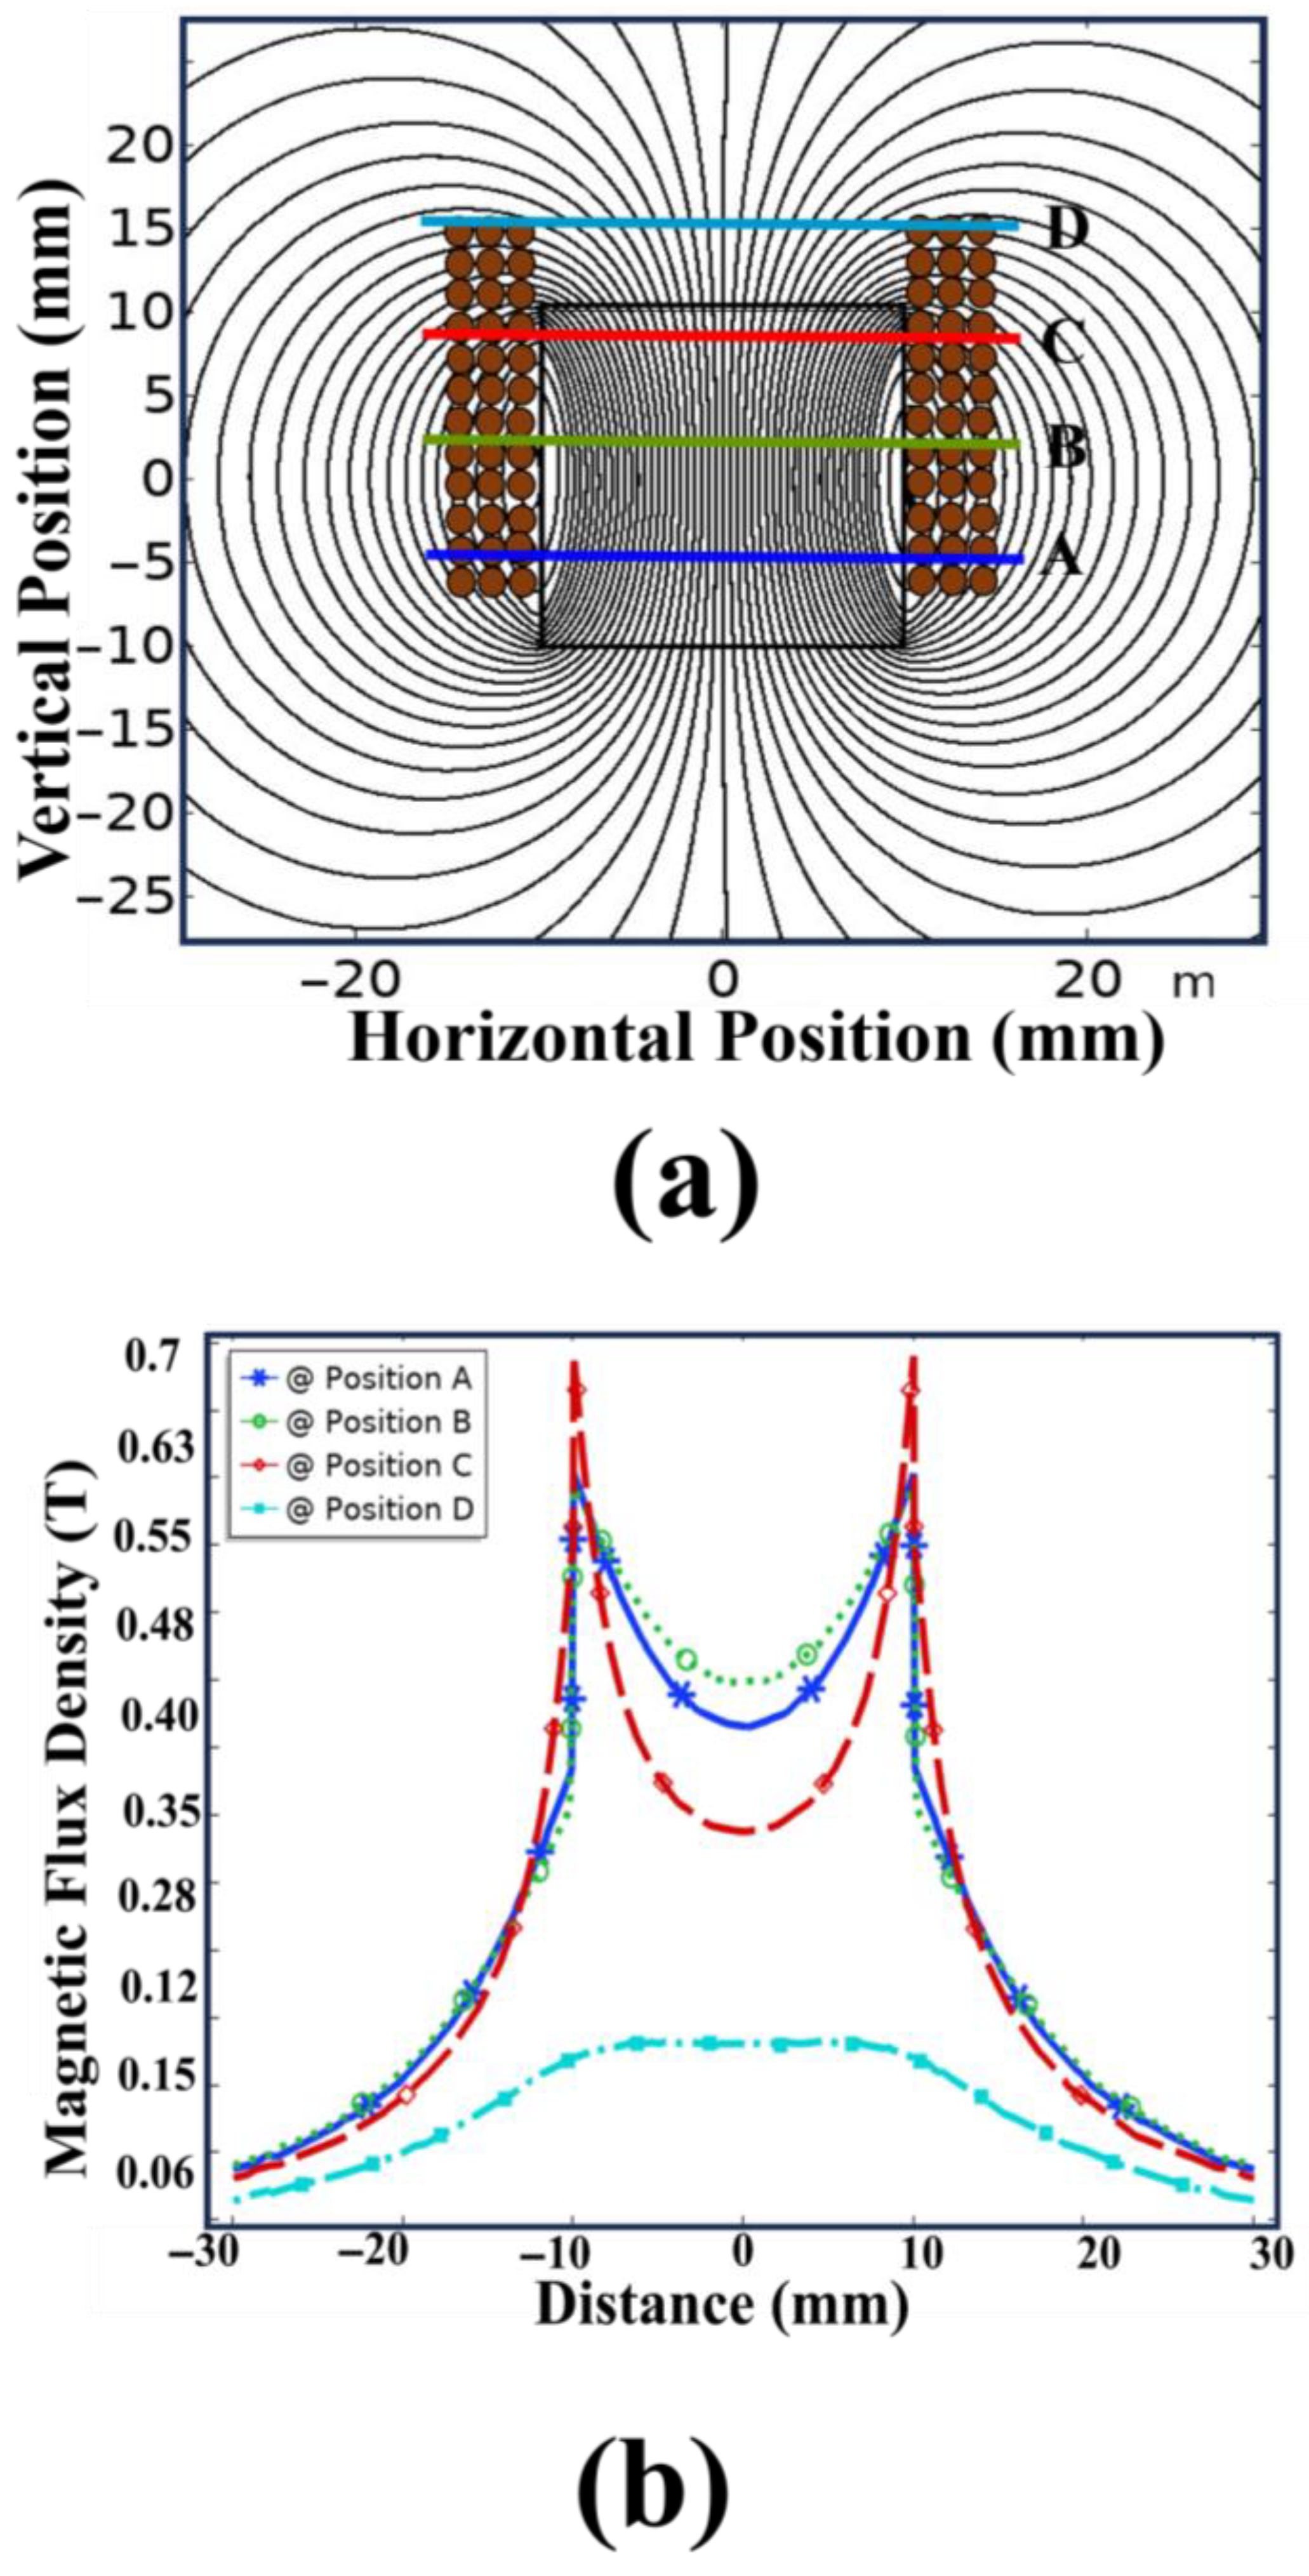
The influence of the flux density of the magnet on the electromagnetic performance of the harvester was evaluated using a 2D magnetostatics analysis of the magnet.
Figure 6 displays the distribution of flux density of the magnet employed in this device. A simulation was performed on a cylindrical magnet with dimensions of (10 mm in diameter, 20 mm in height) and 1.4 T remanent flux density. As depicted in
Figure 6a, the magnetic flux is concentrated along the magnet’s axis, demonstrating strong field confinement within the coil area.
Figure 6b shows the variation in magnetic flux density at various points along the coil’s surface. It is evident that the flux density diminishes as the distance from the magnet’s center increases. The findings indicate that reducing the distance between the coil and magnet increases the magnetic flux density inside the coil, which in turn boosts the harvester’s output voltage.
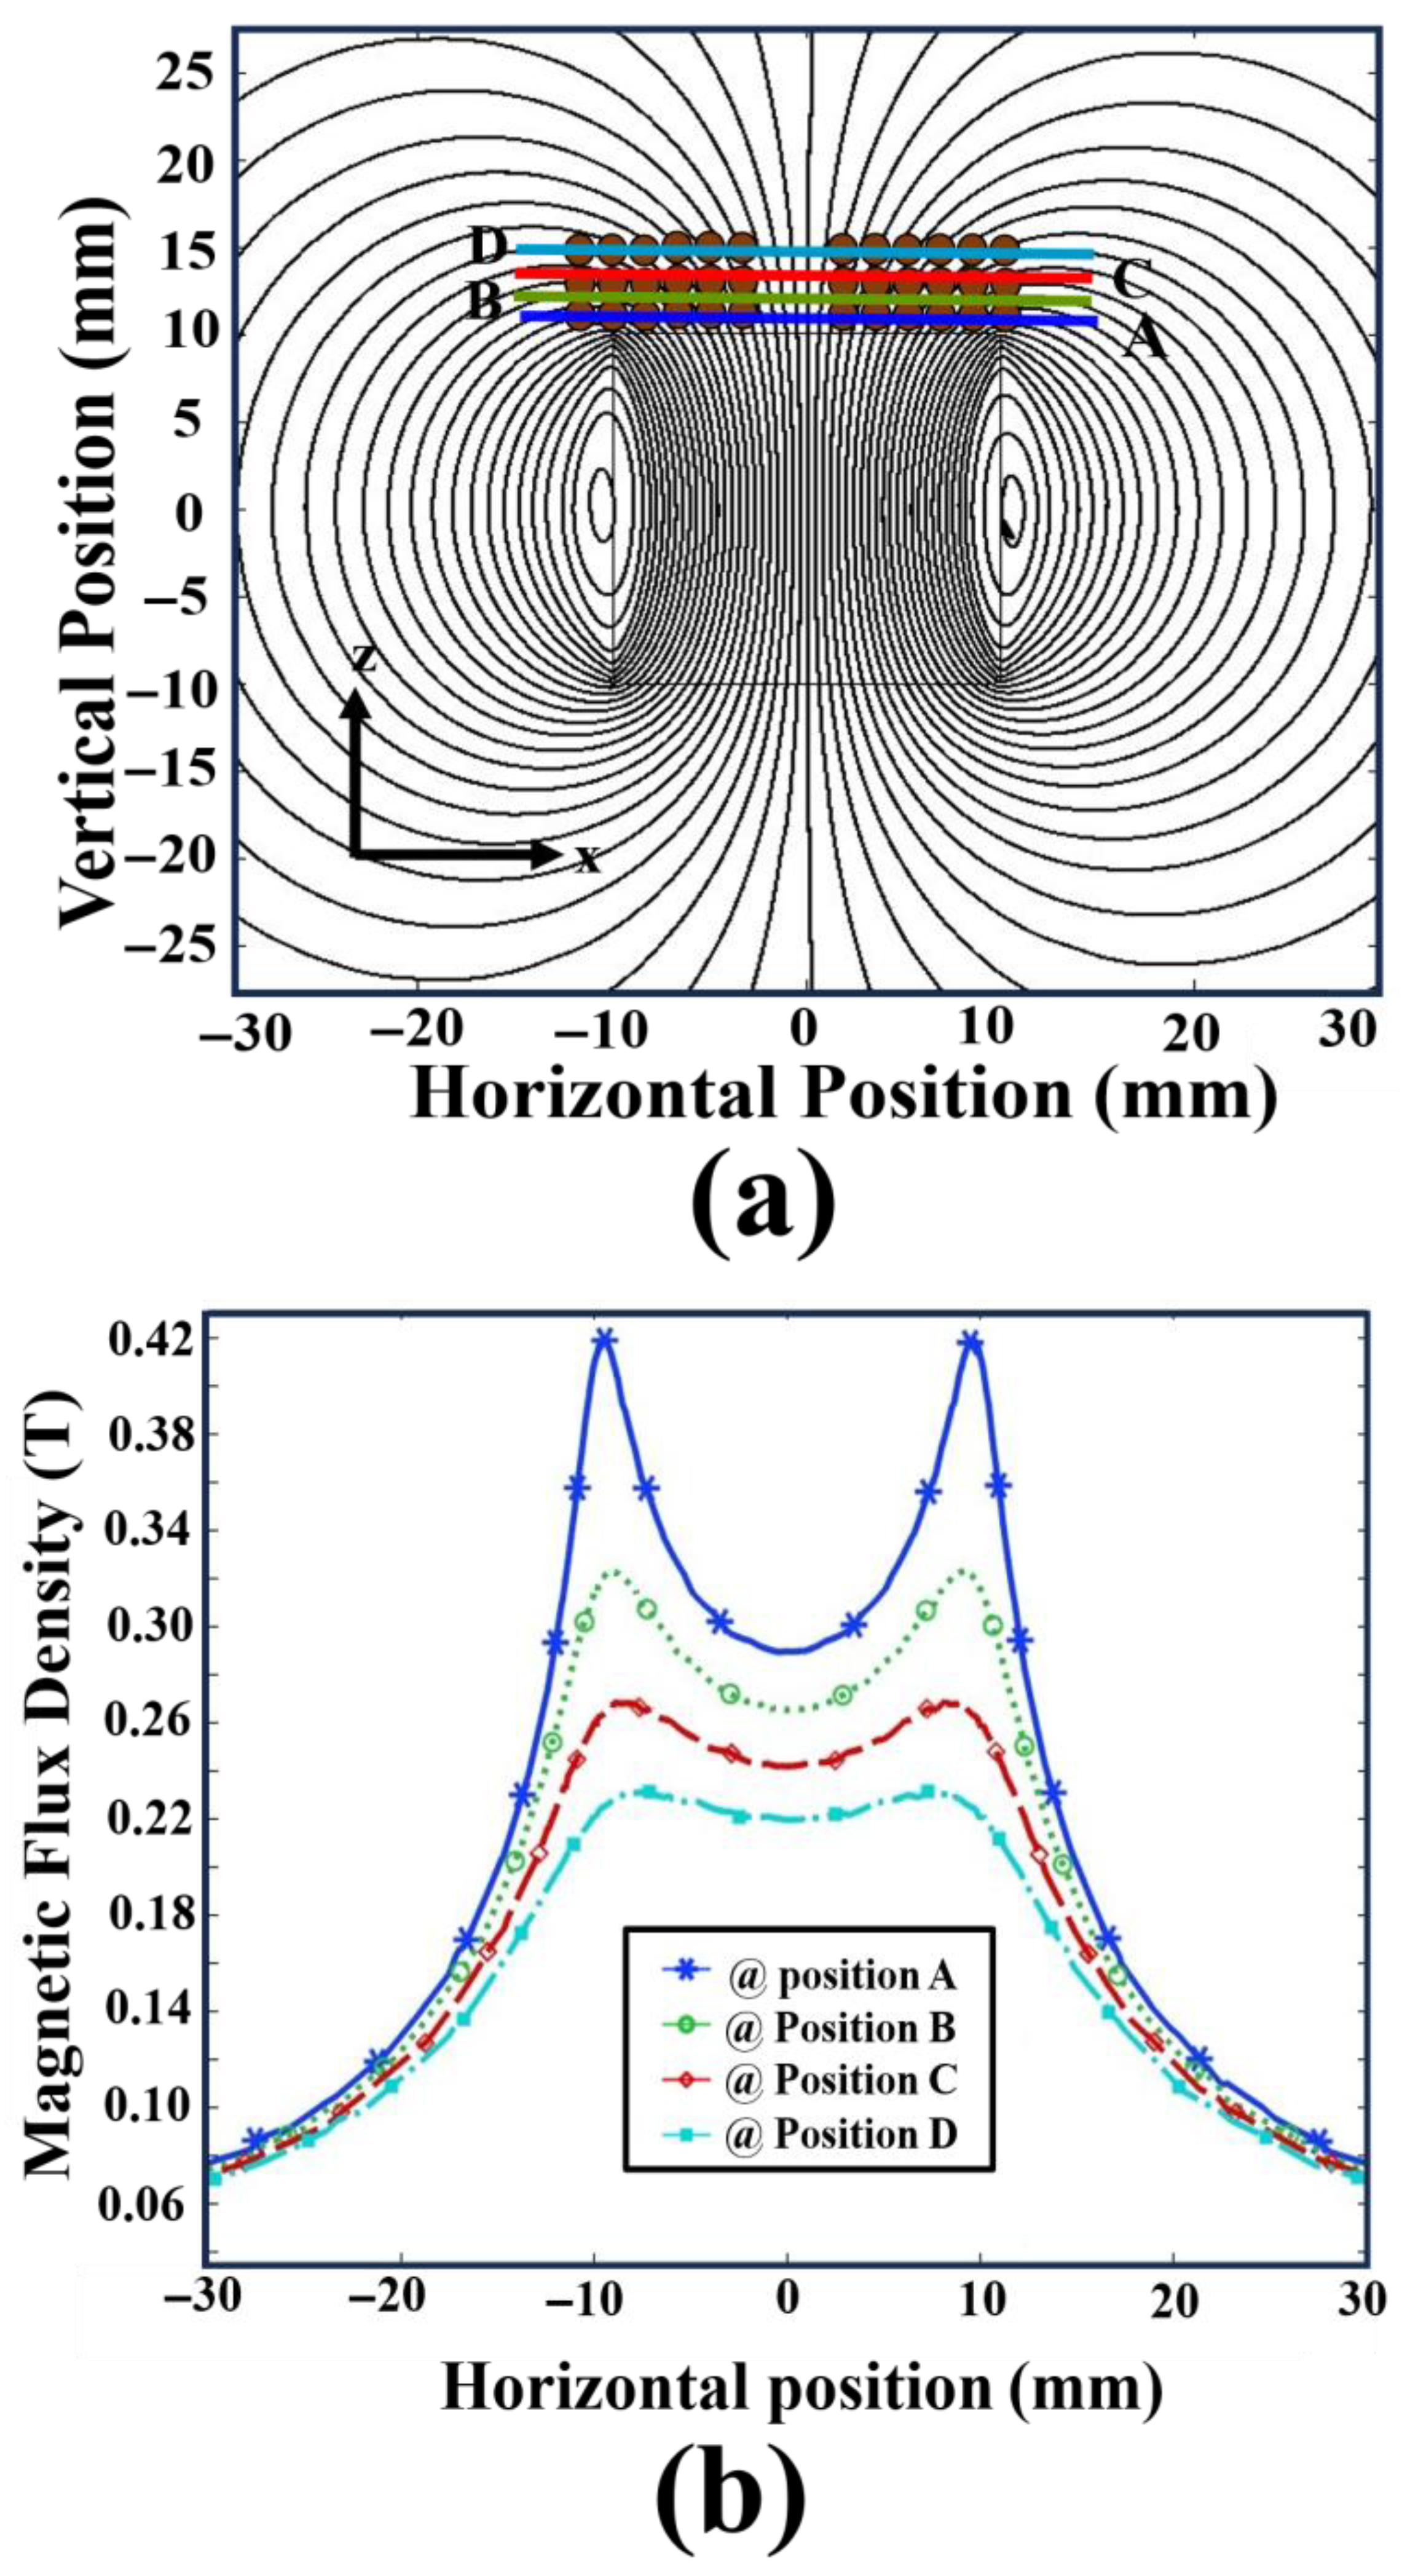
Figure 7 represents the second configuration, in which the coil is placed above the magnet. The same cylindrical magnet dimensions and material properties are used for consistency. In
Figure 7a, the magnetic field distribution demonstrates that the flux lines extend outward and upward from the magnet’s surface, showing relatively weaker confinement compared to the arrangement in
Figure 6.
Figure 7b shows the magnetic flux density along different locations above the magnet. The flux density decreases more rapidly with vertical distance, confirming a weaker magnetic interaction at larger gaps.
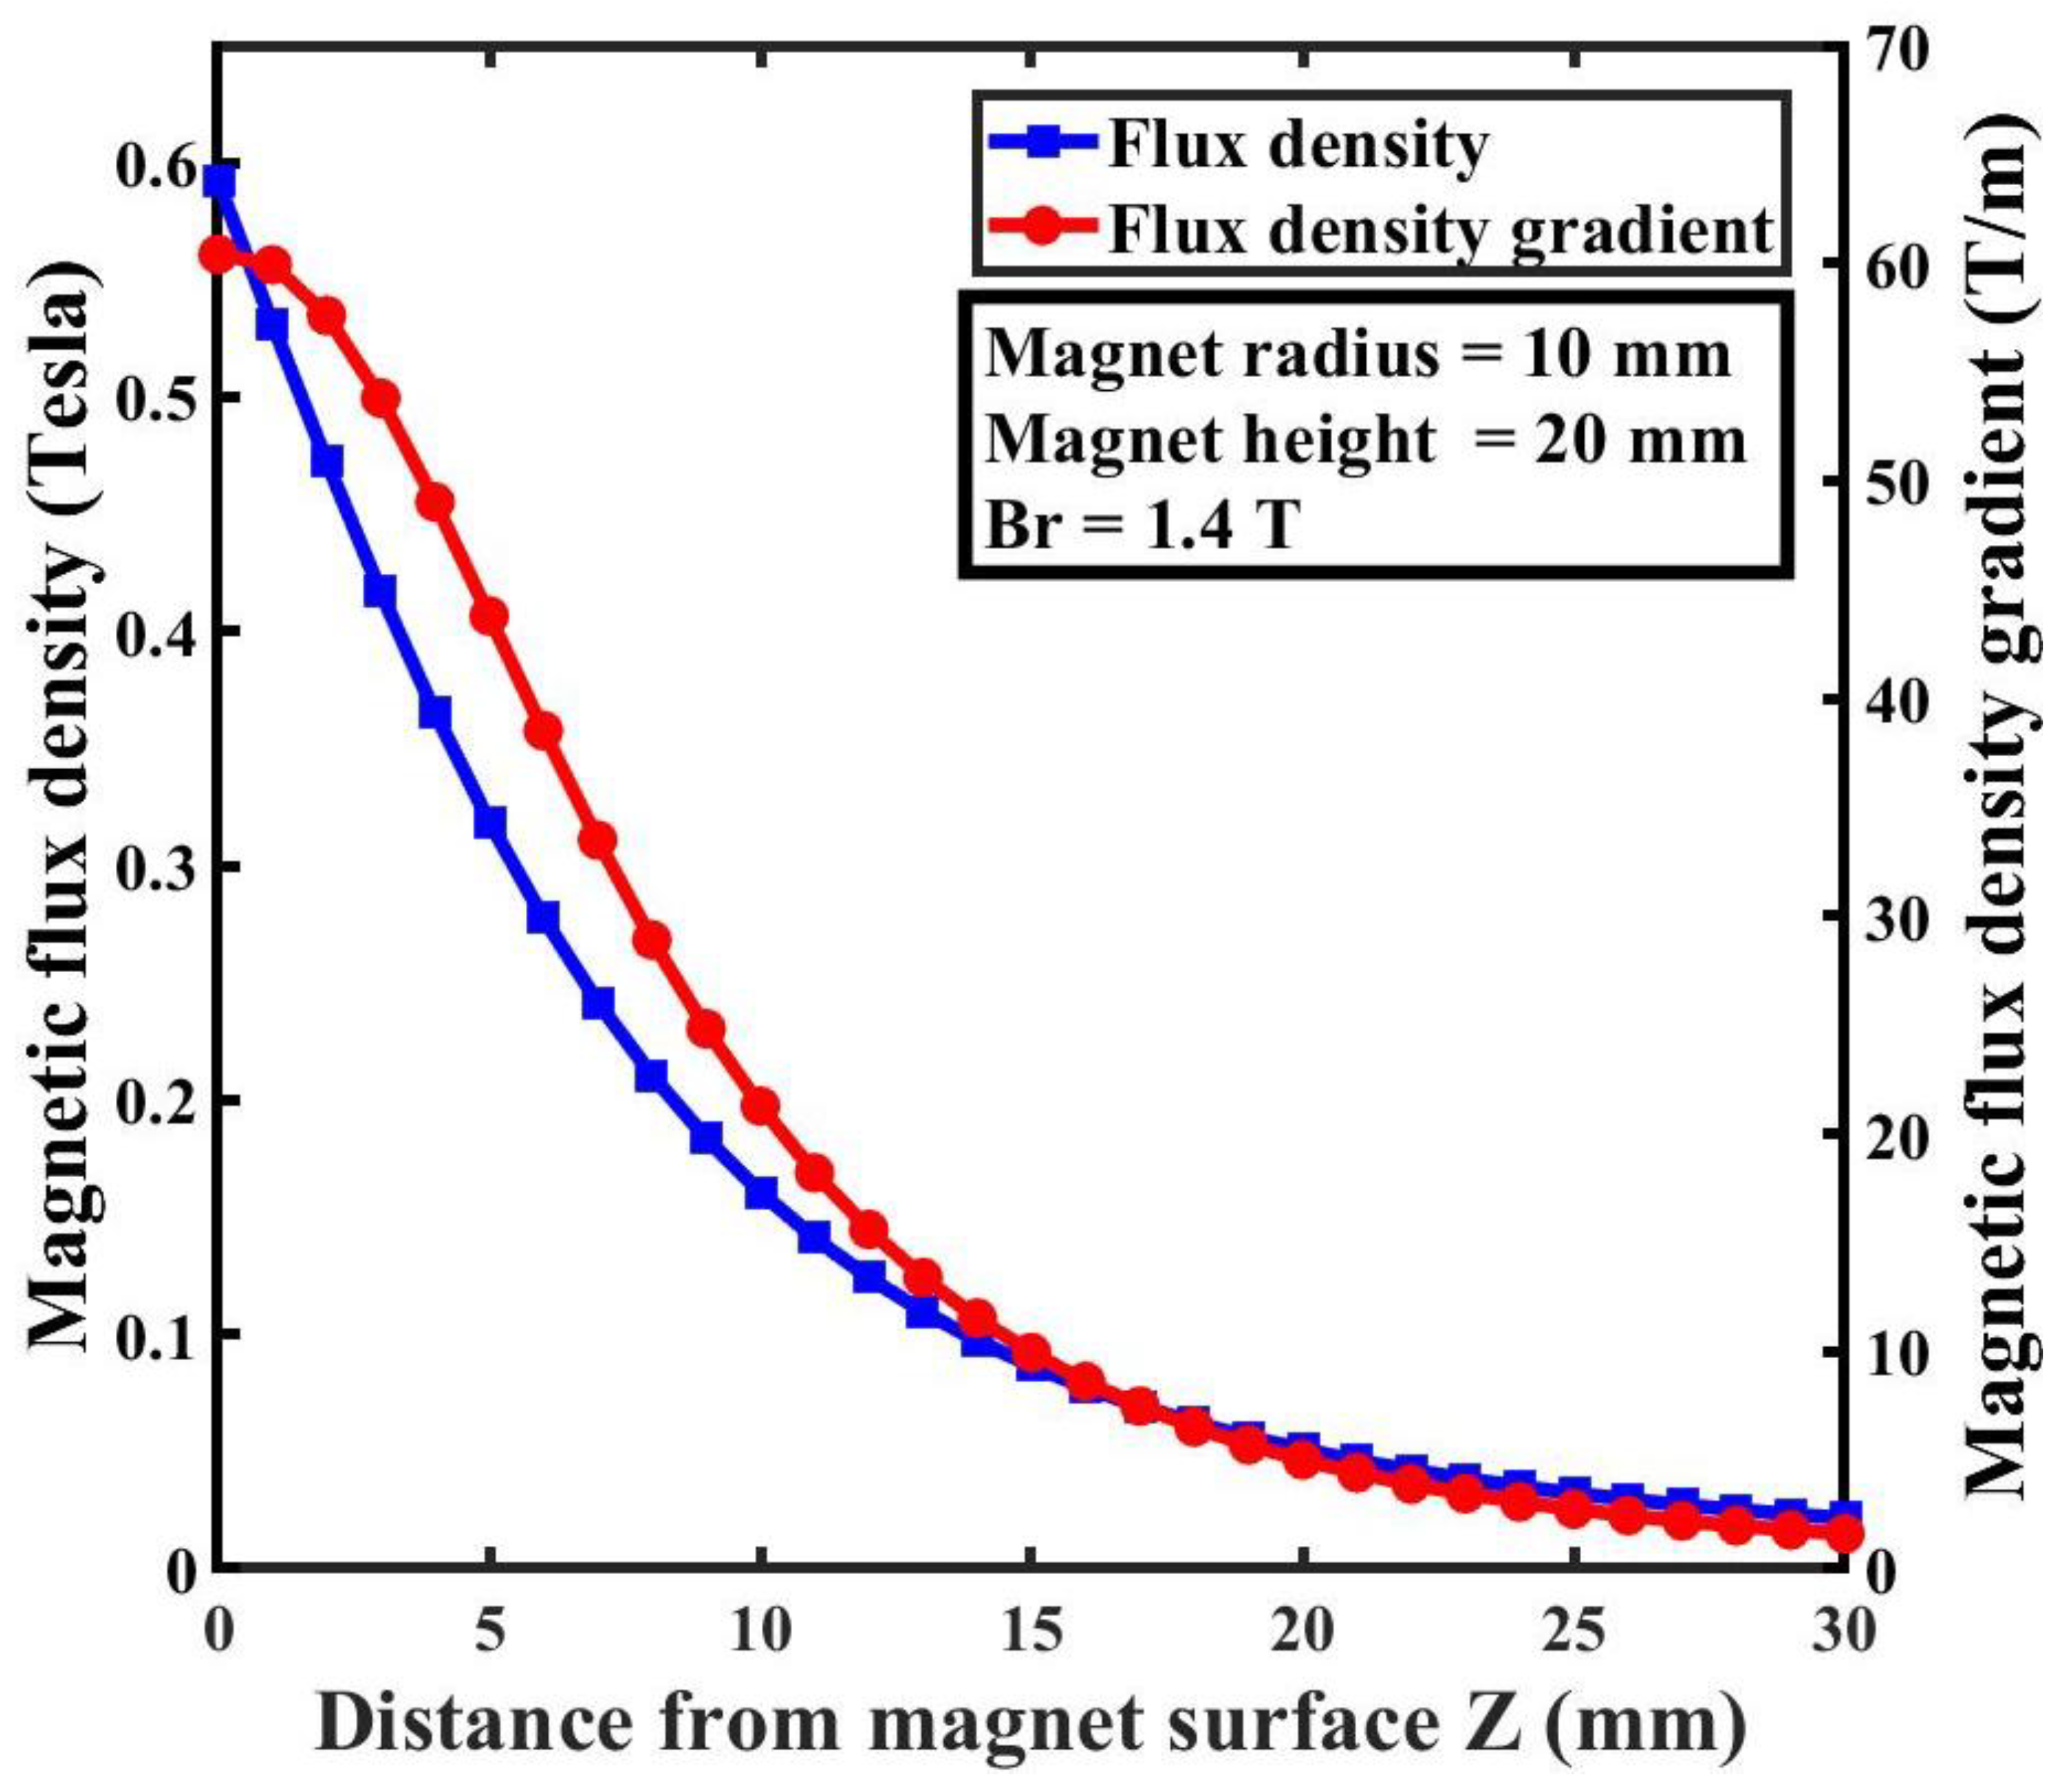
Figure 8 illustrates the magnet’s magnetic flux density (B
z) and magnetic flux density gradient (
) distribution at varying distances between the magnet surface and the coil. The simulations were conducted using the analytical model described in Equations (20) and (21). At the magnet’s surface, the magnetic flux density is determined to be 0.59 T. The plot clearly shows a declining trend in magnetic flux density with increasing separation between the magnet and coil, highlighting the inverse relationship between flux density and distance. Moreover, the calculated magnetic flux density gradient at the surface is 60.39 T/m, decreasing as the coil moves farther from the magnet. These analyses emphasize the critical role of coil positioning in magnetic coupling efficiency, providing valuable insights for optimizing the magnet-coil configuration in energy harvesting systems.
5. Device Fabrication
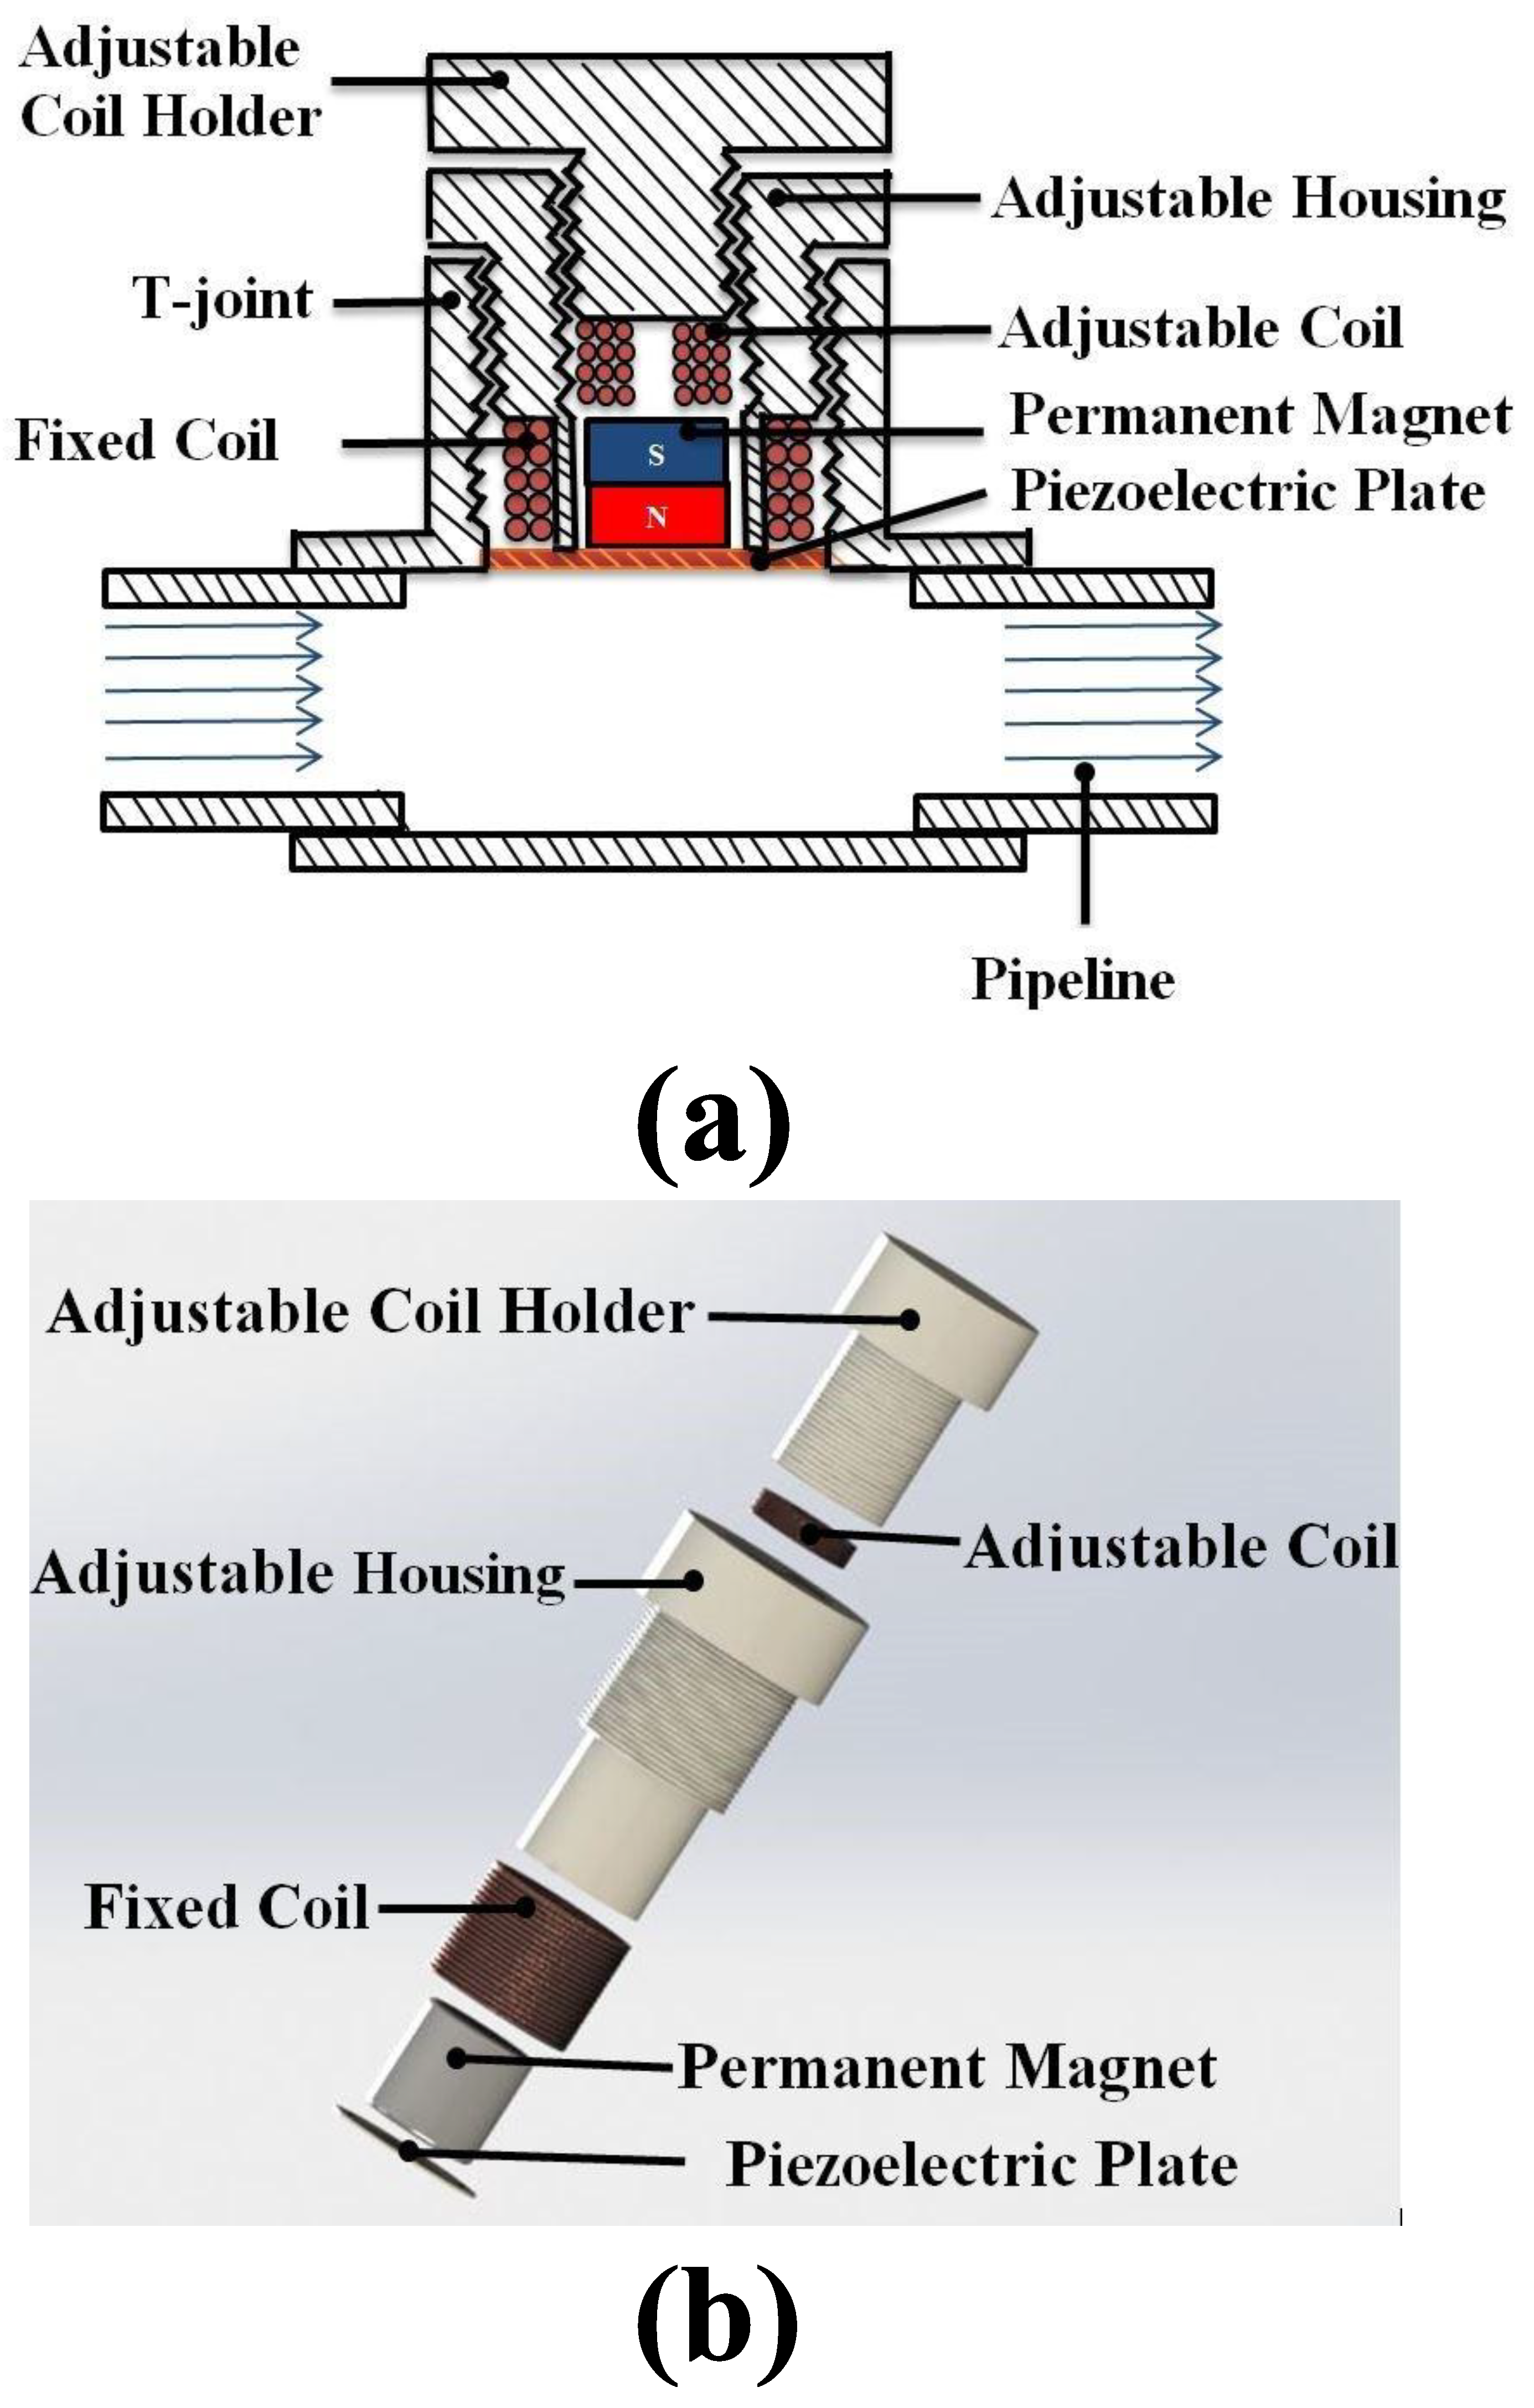
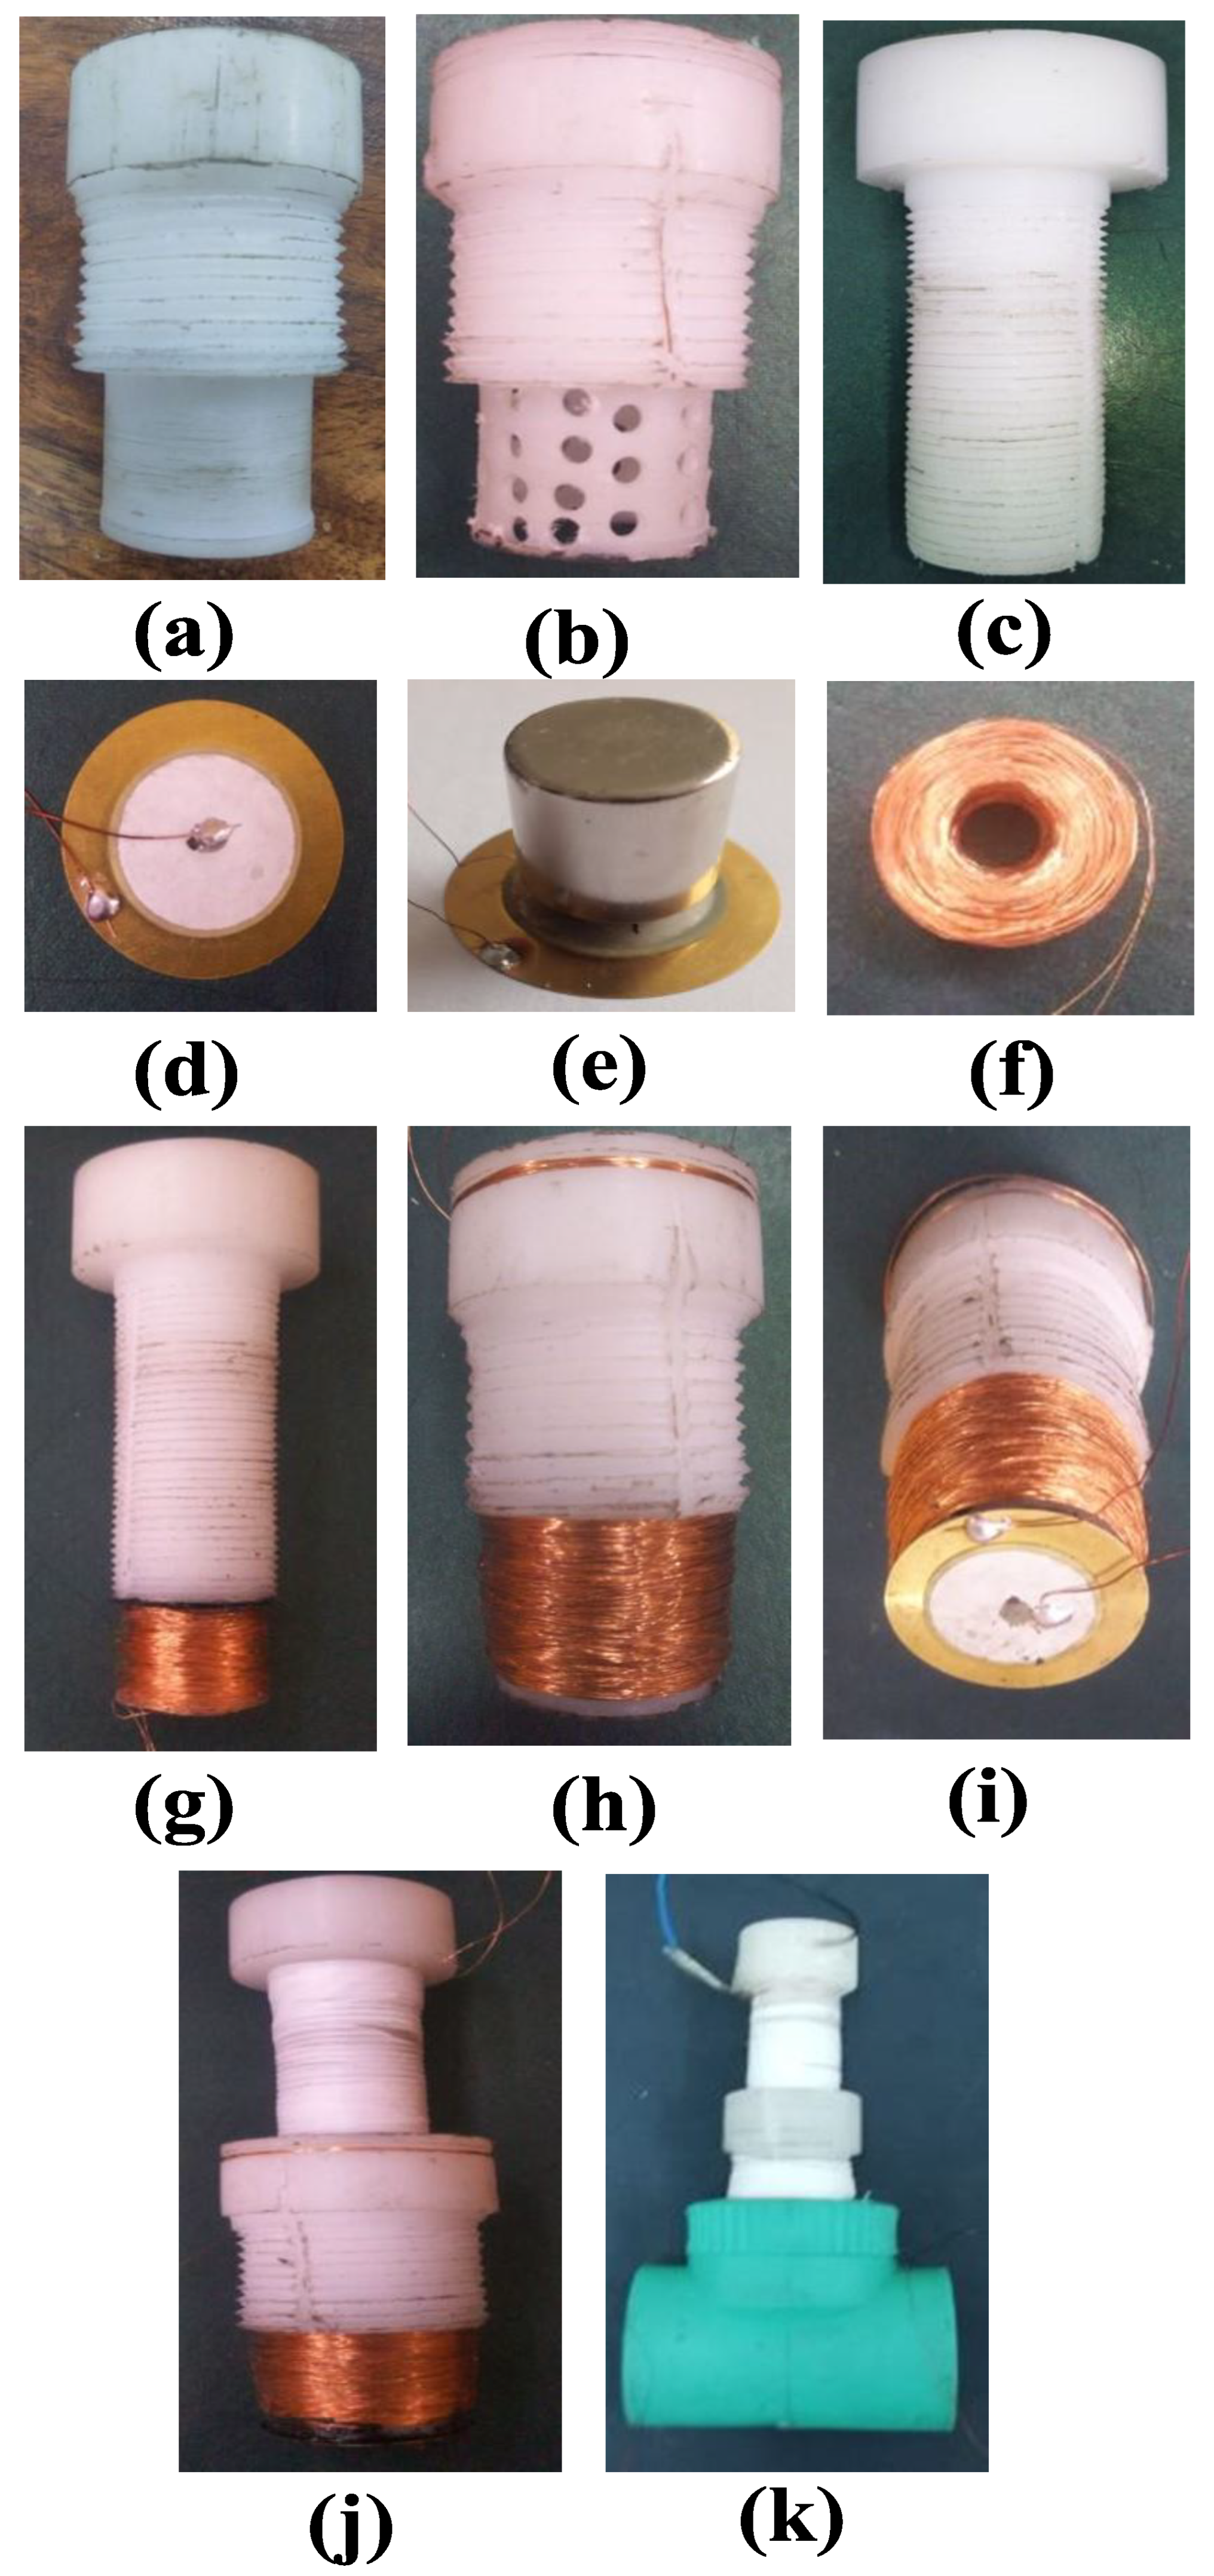
Figure 9 presents the step-by-step fabrication process of the developed flow-induced hybrid energy harvester. The device assembly utilized a standard 32 mm T-joint to facilitate easy integration into pipeline systems. As depicted in
Figure 9a, the main casing was precision-machined from a Teflon rod with an external diameter of 35 mm. Teflon was selected due to its excellent corrosion resistance, mechanical stability, and smooth surface properties that minimize fluid friction. External threading was incorporated along the housing body to enable adjustable positioning and secure fitting within the T-joint assembly. Furthermore, a retaining collar was formed at the lower section of the casing to rigidly hold the stationary coil in place, ensuring proper alignment and reliable electromagnetic performance during operation. Additionally, the bottom part of the housing had small perforations, as shown in
Figure 9b, to enhance the interaction between the fixed coil and a magnetic flux of higher intensity. The coil holder consisted of a standard Teflon rod with a 30 mm diameter, as illustrated in
Figure 9c. The coil holder’s wall was externally threaded, enabling the adjustment of the magnet and coil gap. Both the coil holder and the harvester’s casing had slots designed for the output power wires of the piezoelectric and electromagnetic components. These components were fabricated through standard machining processes, including cutting and turning, and the device incorporated a commercially available unimorph circular piezoelectric plate, as illustrated in
Figure 9d. To strengthen the magnetic field, three cylindrical NdFeB magnets, each measuring 18 × 6 mm, were stacked together.
Figure 9e depicts the magnet assembly placed at the center of the piezoelectric plate. Additionally, two coils were wound manually with copper wire, as shown in
Figure 9f,g.
Figure 9h illustrates the first step in assembling the harvester, which consists of attaching the wound coil to the coil holder with epoxy glue. Subsequently, as shown in
Figure 9i, the piezoelectric (PE) plate and magnet subassembly were mounted onto the base of the housing with epoxy, providing a stable foundation for vibration and magnetic interaction. In
Figure 9j, the coil holder unit is shown being inserted into the housing.
Figure 9k illustrates the fully assembled device positioned within the T-joints.
Table 2 provides detailed specifications and dimensions of the HFEH prototype along with its various components.
6. Prototype Experimentation
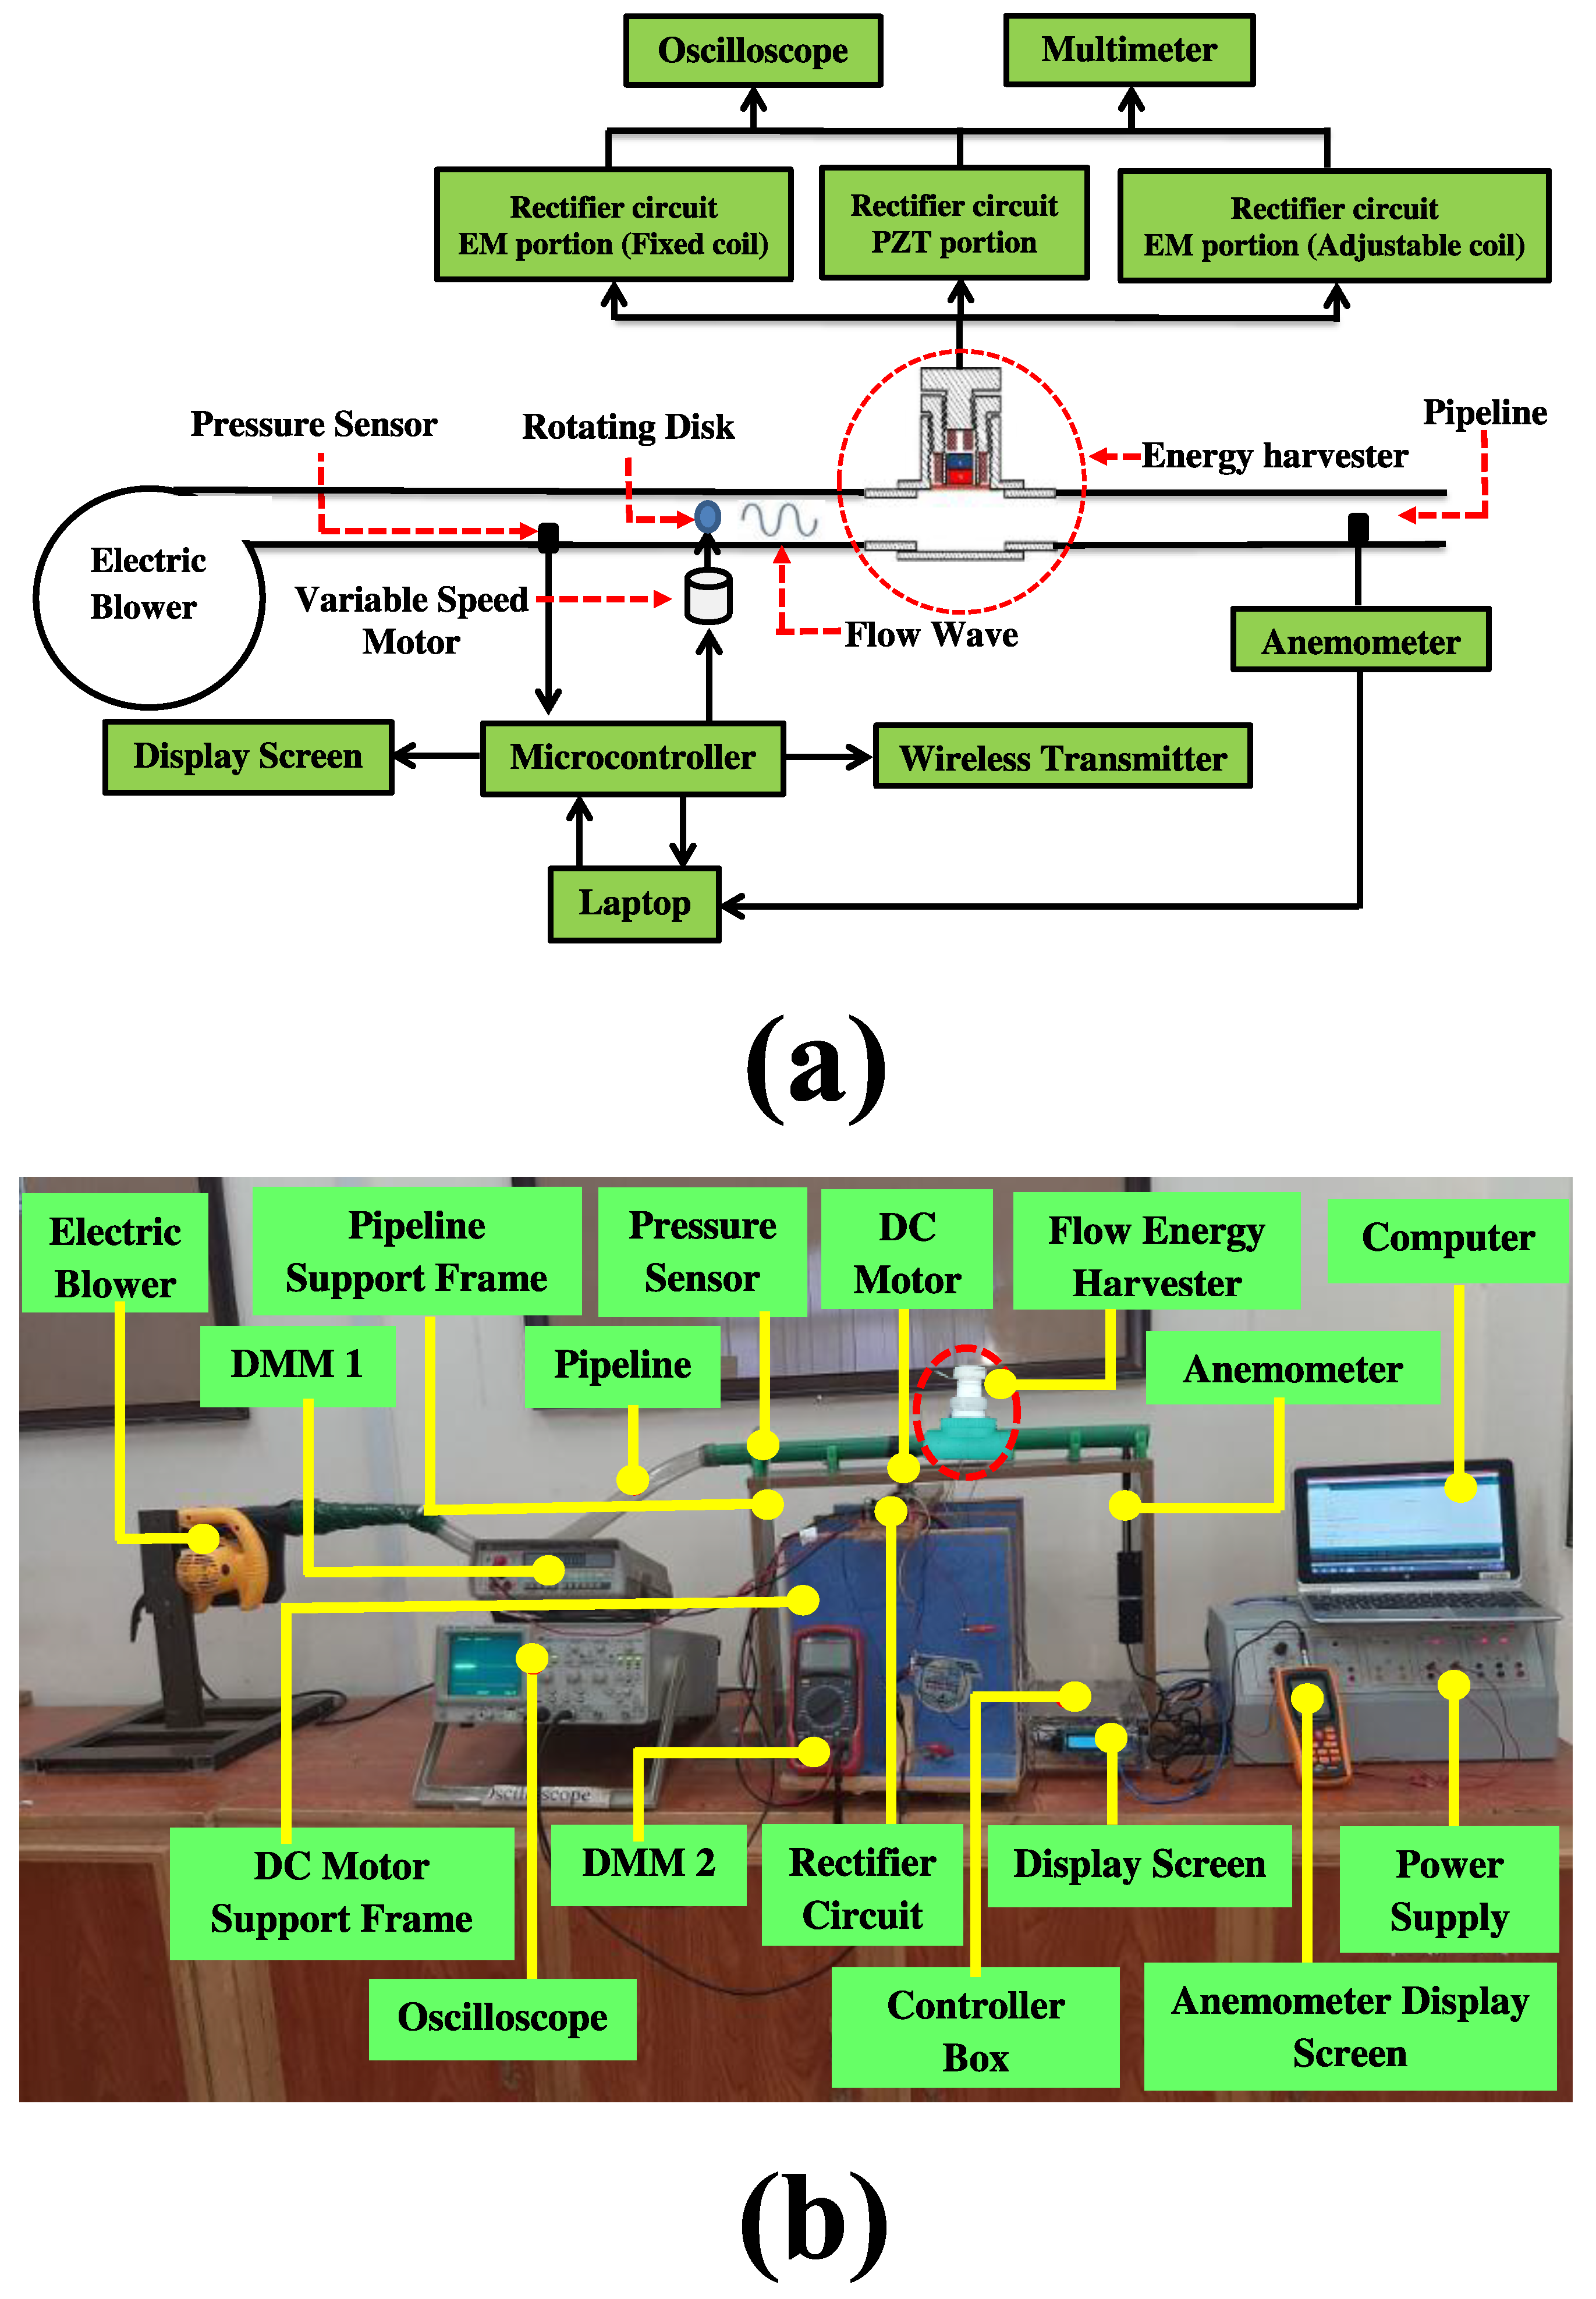
Figure 10 shows the block layout along with the actual experimental setup used for HFEH characterization. In this setup, an air blower (document number 1, BOSITENG, China) generates airflow as a substitute for gas flow. To mitigate vibrations generated by the blower during its operation, a vibration isolation rubber coupling was installed between the blower outlet and the connected PVC pipeline. The airflow was regulated by adjusting the discharge control knob of the blower. A small rotational disc is inserted into the pipeline to alter the fluid’s frequency. The disc rotation is controlled by a pulse-width modulation signal, using an Arduino Uno board and an H-bridge module. To keep track of flow pressure, a pressure sensor (MPX5010DP) is placed within the pipeline. An anemometer (GM8903) measures the flow velocity within the pipeline. Data from the pressure sensors is collected by the Arduino Uno microcontroller and displayed on a small LCD screen and a laptop. To ensure the prototype was properly aligned with the air blower, it was affixed to a PVC pipe with a diameter of 32 mm, which was positioned on a wooden pedestal. The electrical output generated by the hybrid flow energy harvester (HFEH) was interfaced with a rectifier circuit to convert the AC signal into DC form. The output voltage signals were continuously monitored and analyzed using a digital multimeter for steady-state measurements and an oscilloscope for real-time signal observation and waveform assessment.
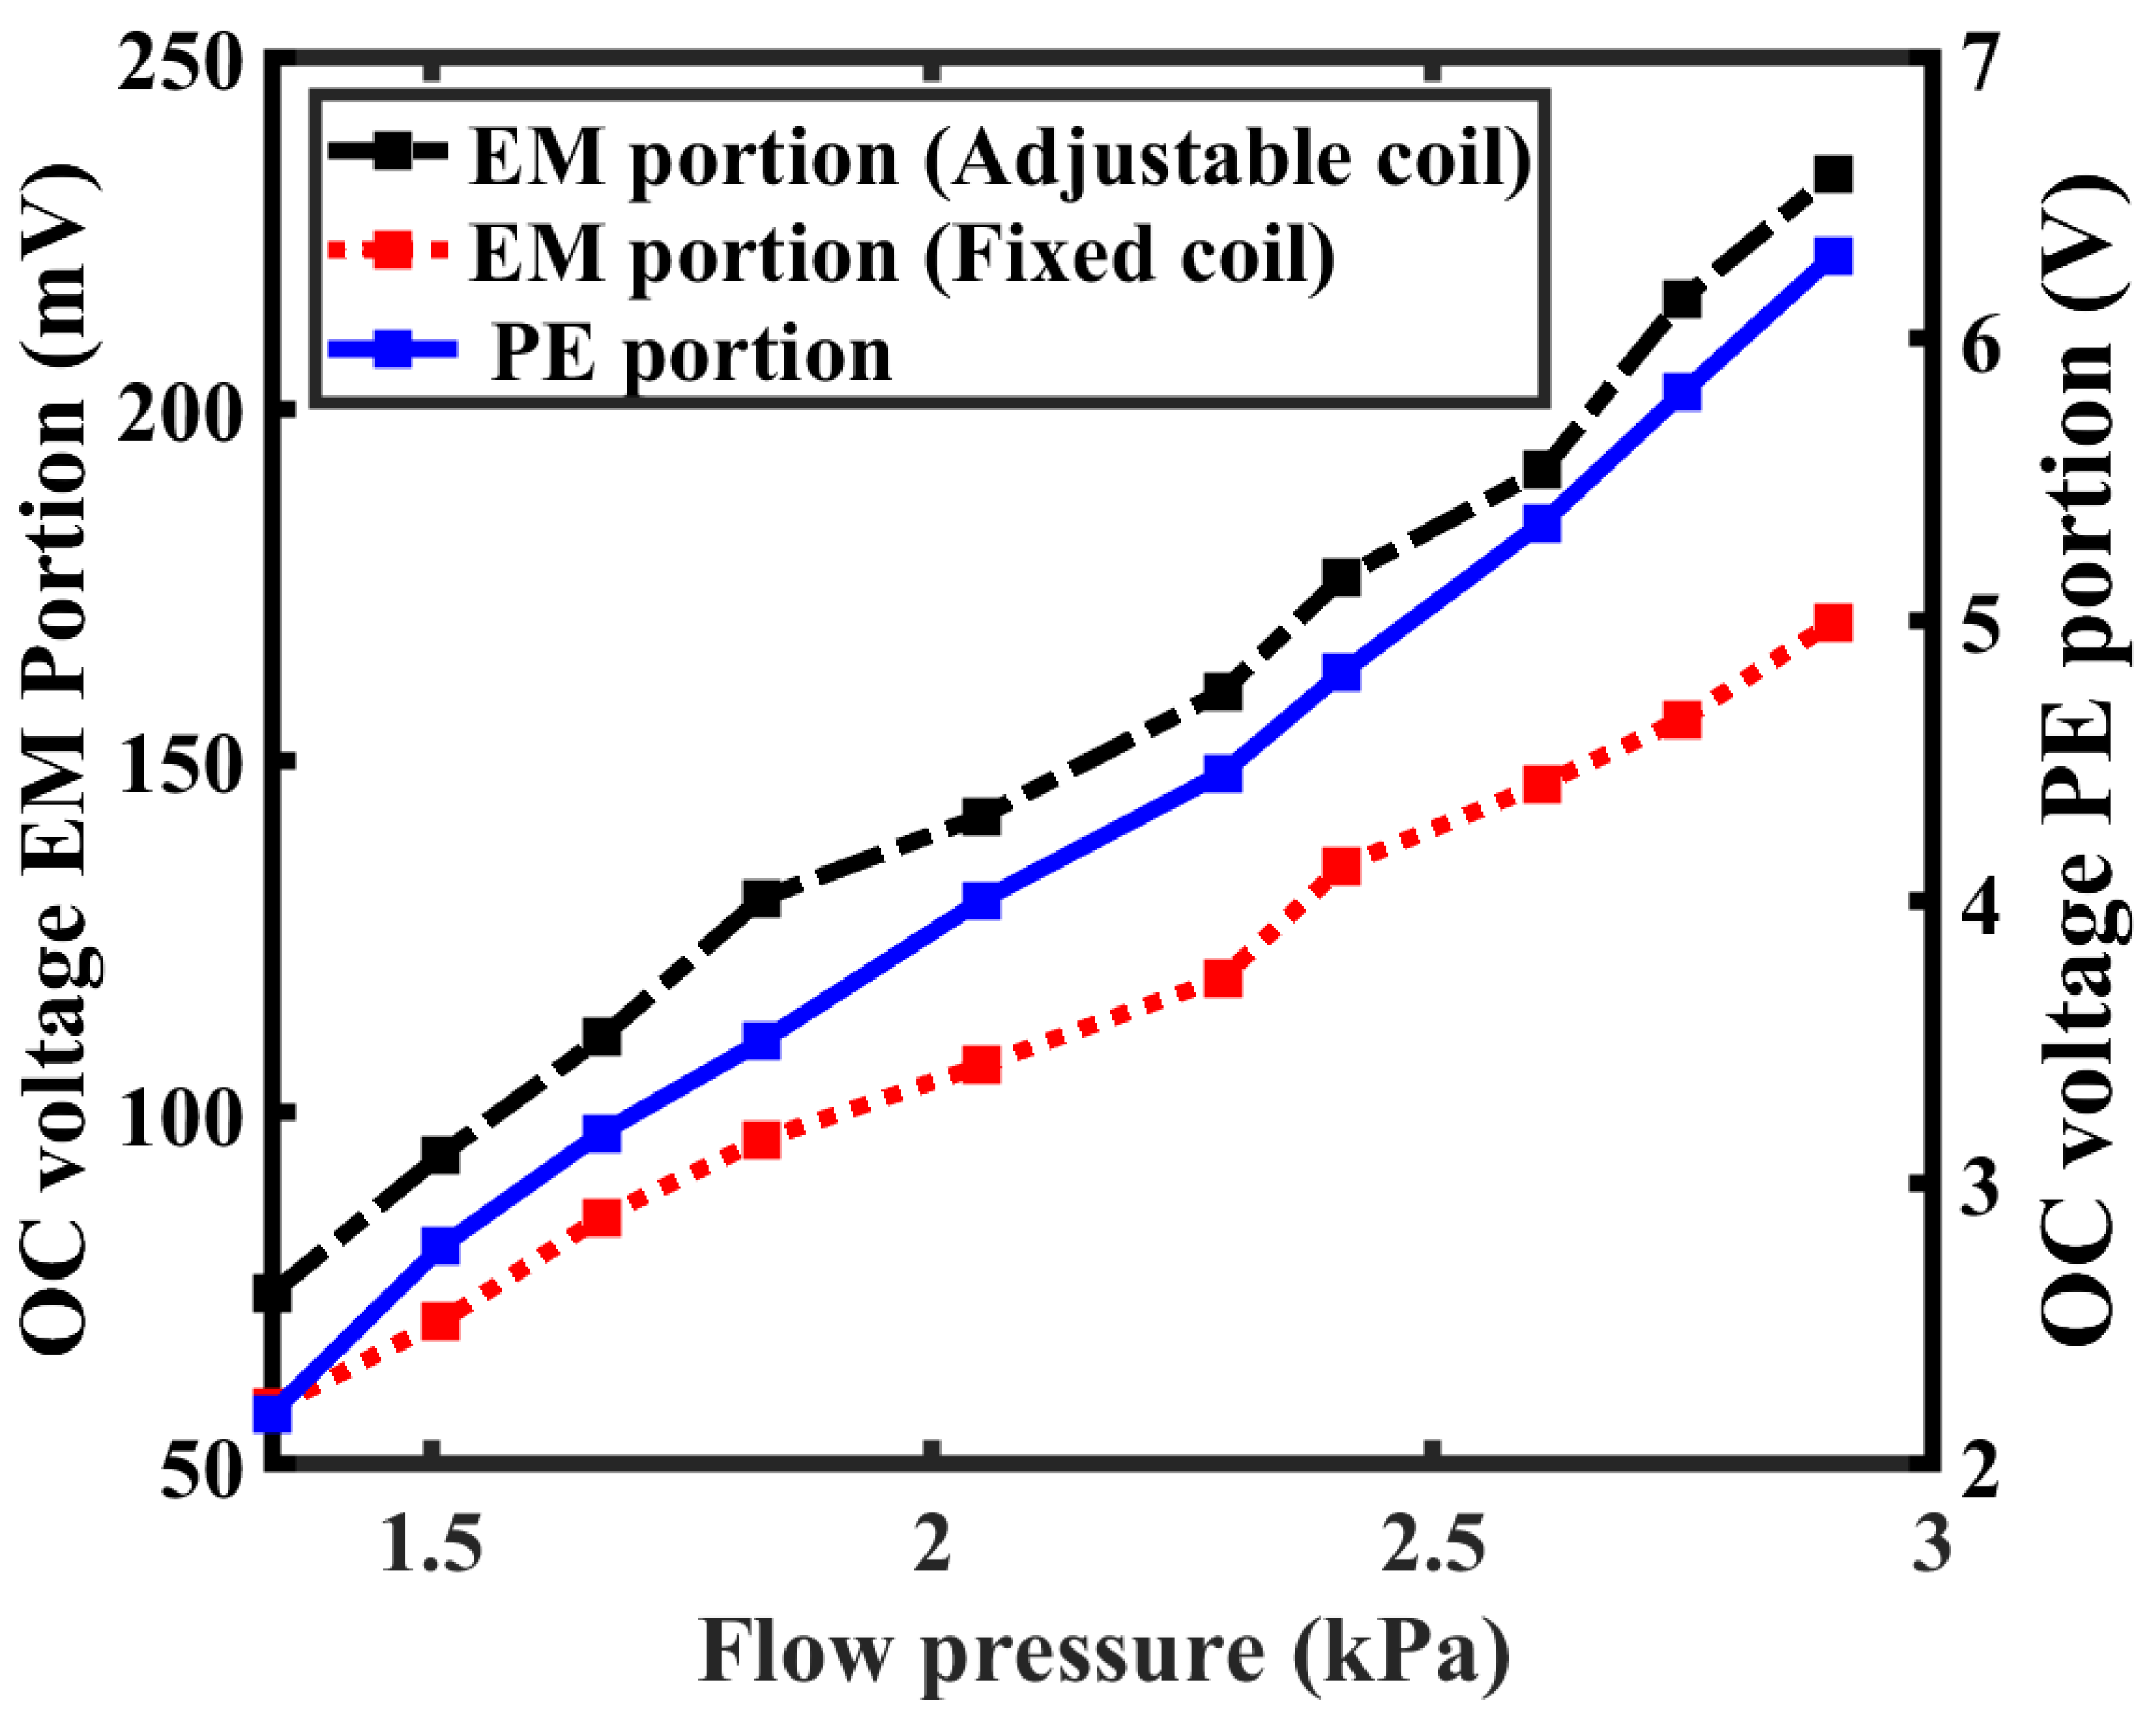
To evaluate the electrical performance of the fabricated HFEH, the RMS voltage was measured under varying flow pressures and flow rates, and the resulting relationship between open circuit (OC) RMS voltage and applied flow pressure is illustrated in
Figure 11. The experimental results indicate a clear positive correlation between the generated voltage and the magnitude of the fluid pressure, confirming that higher flow-induced excitation enhances the device’s energy conversion efficiency. At a flow pressure of 2.90 kPa and a flow rate of 11.08 L/s, the piezoelectric transducer produced an OC voltage of 6.3 V, while under identical conditions, the electromagnetic section generated 233 mV from the adjustable coil and 170 mV from the fixed coil.
Figure 12 presents the voltage and power output from the EH as the load resistance changes under different flow conditions. In this study, the piezoelectric section was tested with external loads ranging from 1.2 kΩ to 500 kΩ, while the electromagnetic section was evaluated with resistances between 1 Ω and 1000 Ω. As shown in
Figure 12a, the piezoelectric unit produced a peak voltage of 4.42 V and a maximum power of 725 µW at an optimal load of 27 kΩ under a flow rate of 11.08 L/s and a flow pressure amplitude of 2.90 kPa. For the electromagnetic section, the adjustable coil (
Figure 12b) generated a peak voltage of 114 mV and a load power of 54 µW at 240 Ω, whereas the fixed coil (
Figure 12c) produced 108 mV and 52.7 µW at an optimal load resistance of 222 Ω.
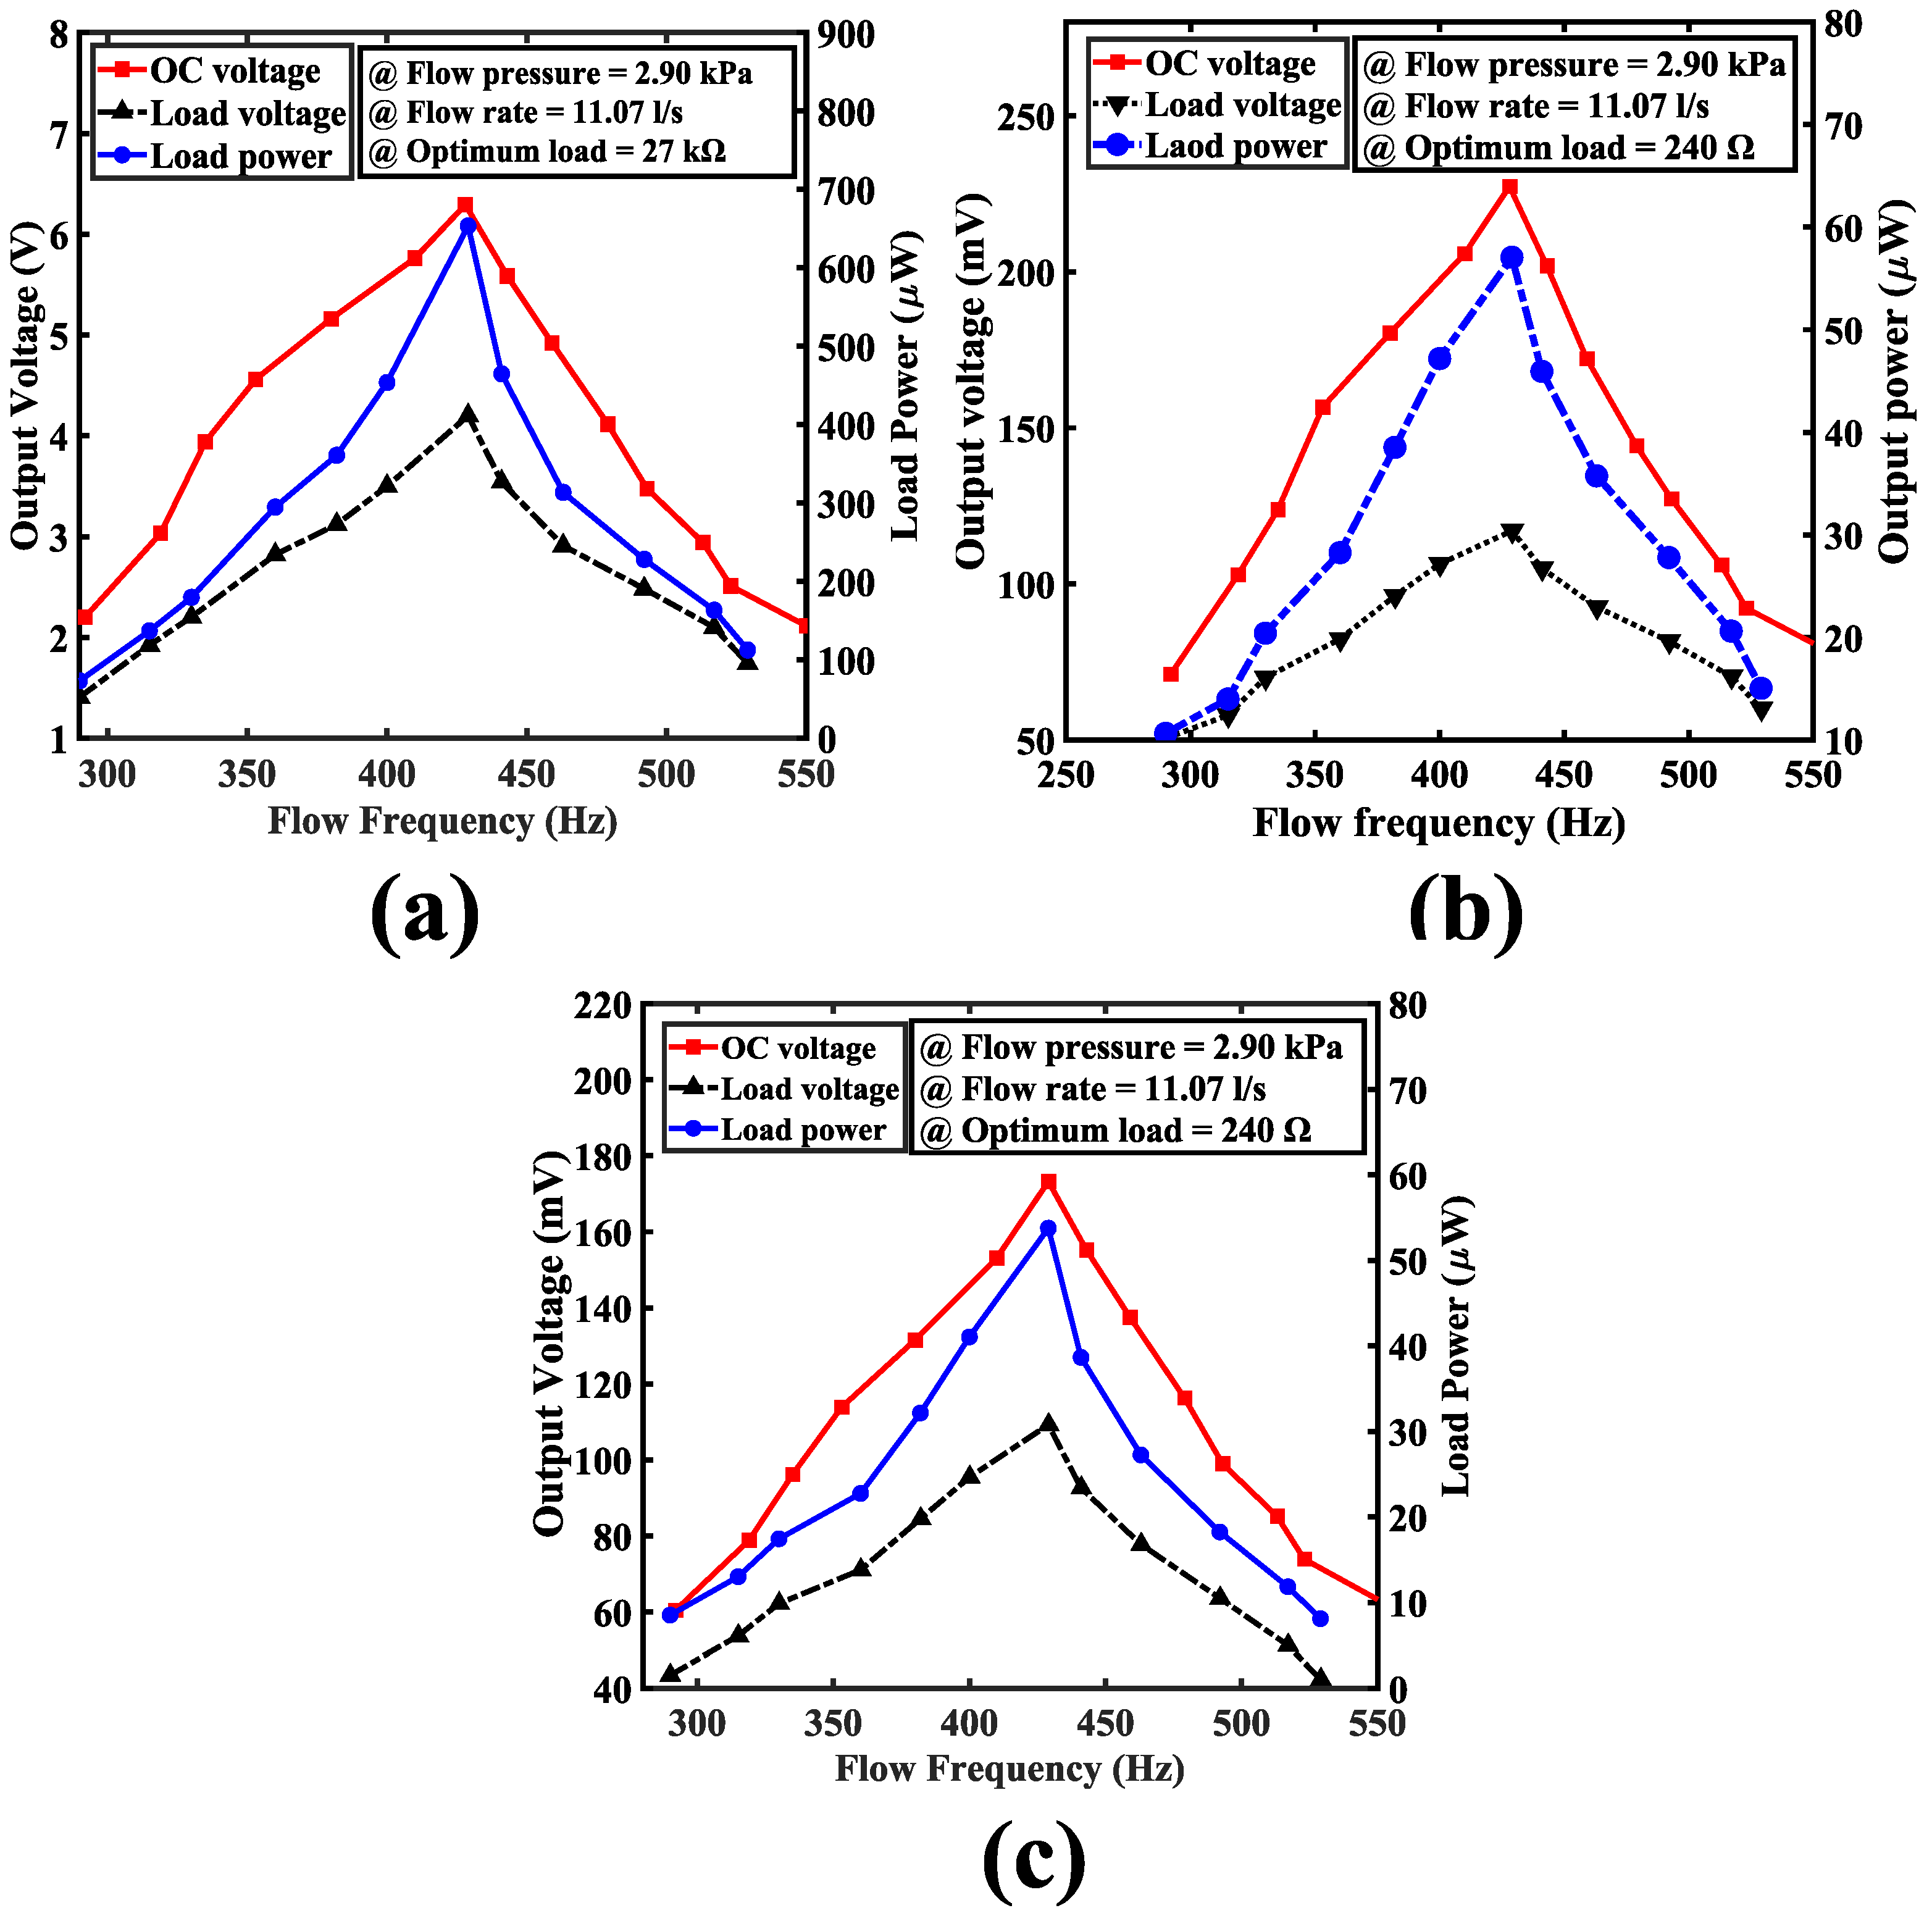
This experiment investigated how changes in pulsing flow frequency affect the harvester’s efficiency.
Figure 13 presents the relationship between fluid flow frequency and the open-circuit voltage, load voltage, and power output of the energy harvester. The spinning disc inside the pipeline changed the pulsating flow frequency, thereby influencing the device’s electrical response. The disc’s rotation was precisely controlled by an Arduino board integrated with an H-bridge module, which utilized PWM signals to regulate its speed and direction. In this experiment, the fluid frequency was varied while the flow pressure was held constant. At a flow rate of 11.08 L/s, a flow pressure of 2.90 kPa, and a resonance frequency of 428 Hz, the piezoelectric segment of the harvester produced an OC voltage of 6.3 V, a corresponding load voltage of 4.3 V, and a peak output power of 725 µW, as illustrated in
Figure 13a. Under the same flow parameters, the electromagnetic section’s adjustable coil (
Figure 13b) recorded a maximum OC voltage of 227 mV, a load voltage of 114 mV, and an output power of 54.7 µW. Similarly, the fixed coil (
Figure 13c) exhibited an OC voltage of 173 mV, a load voltage of 108 mV, and a resulting load power of 53 µW.
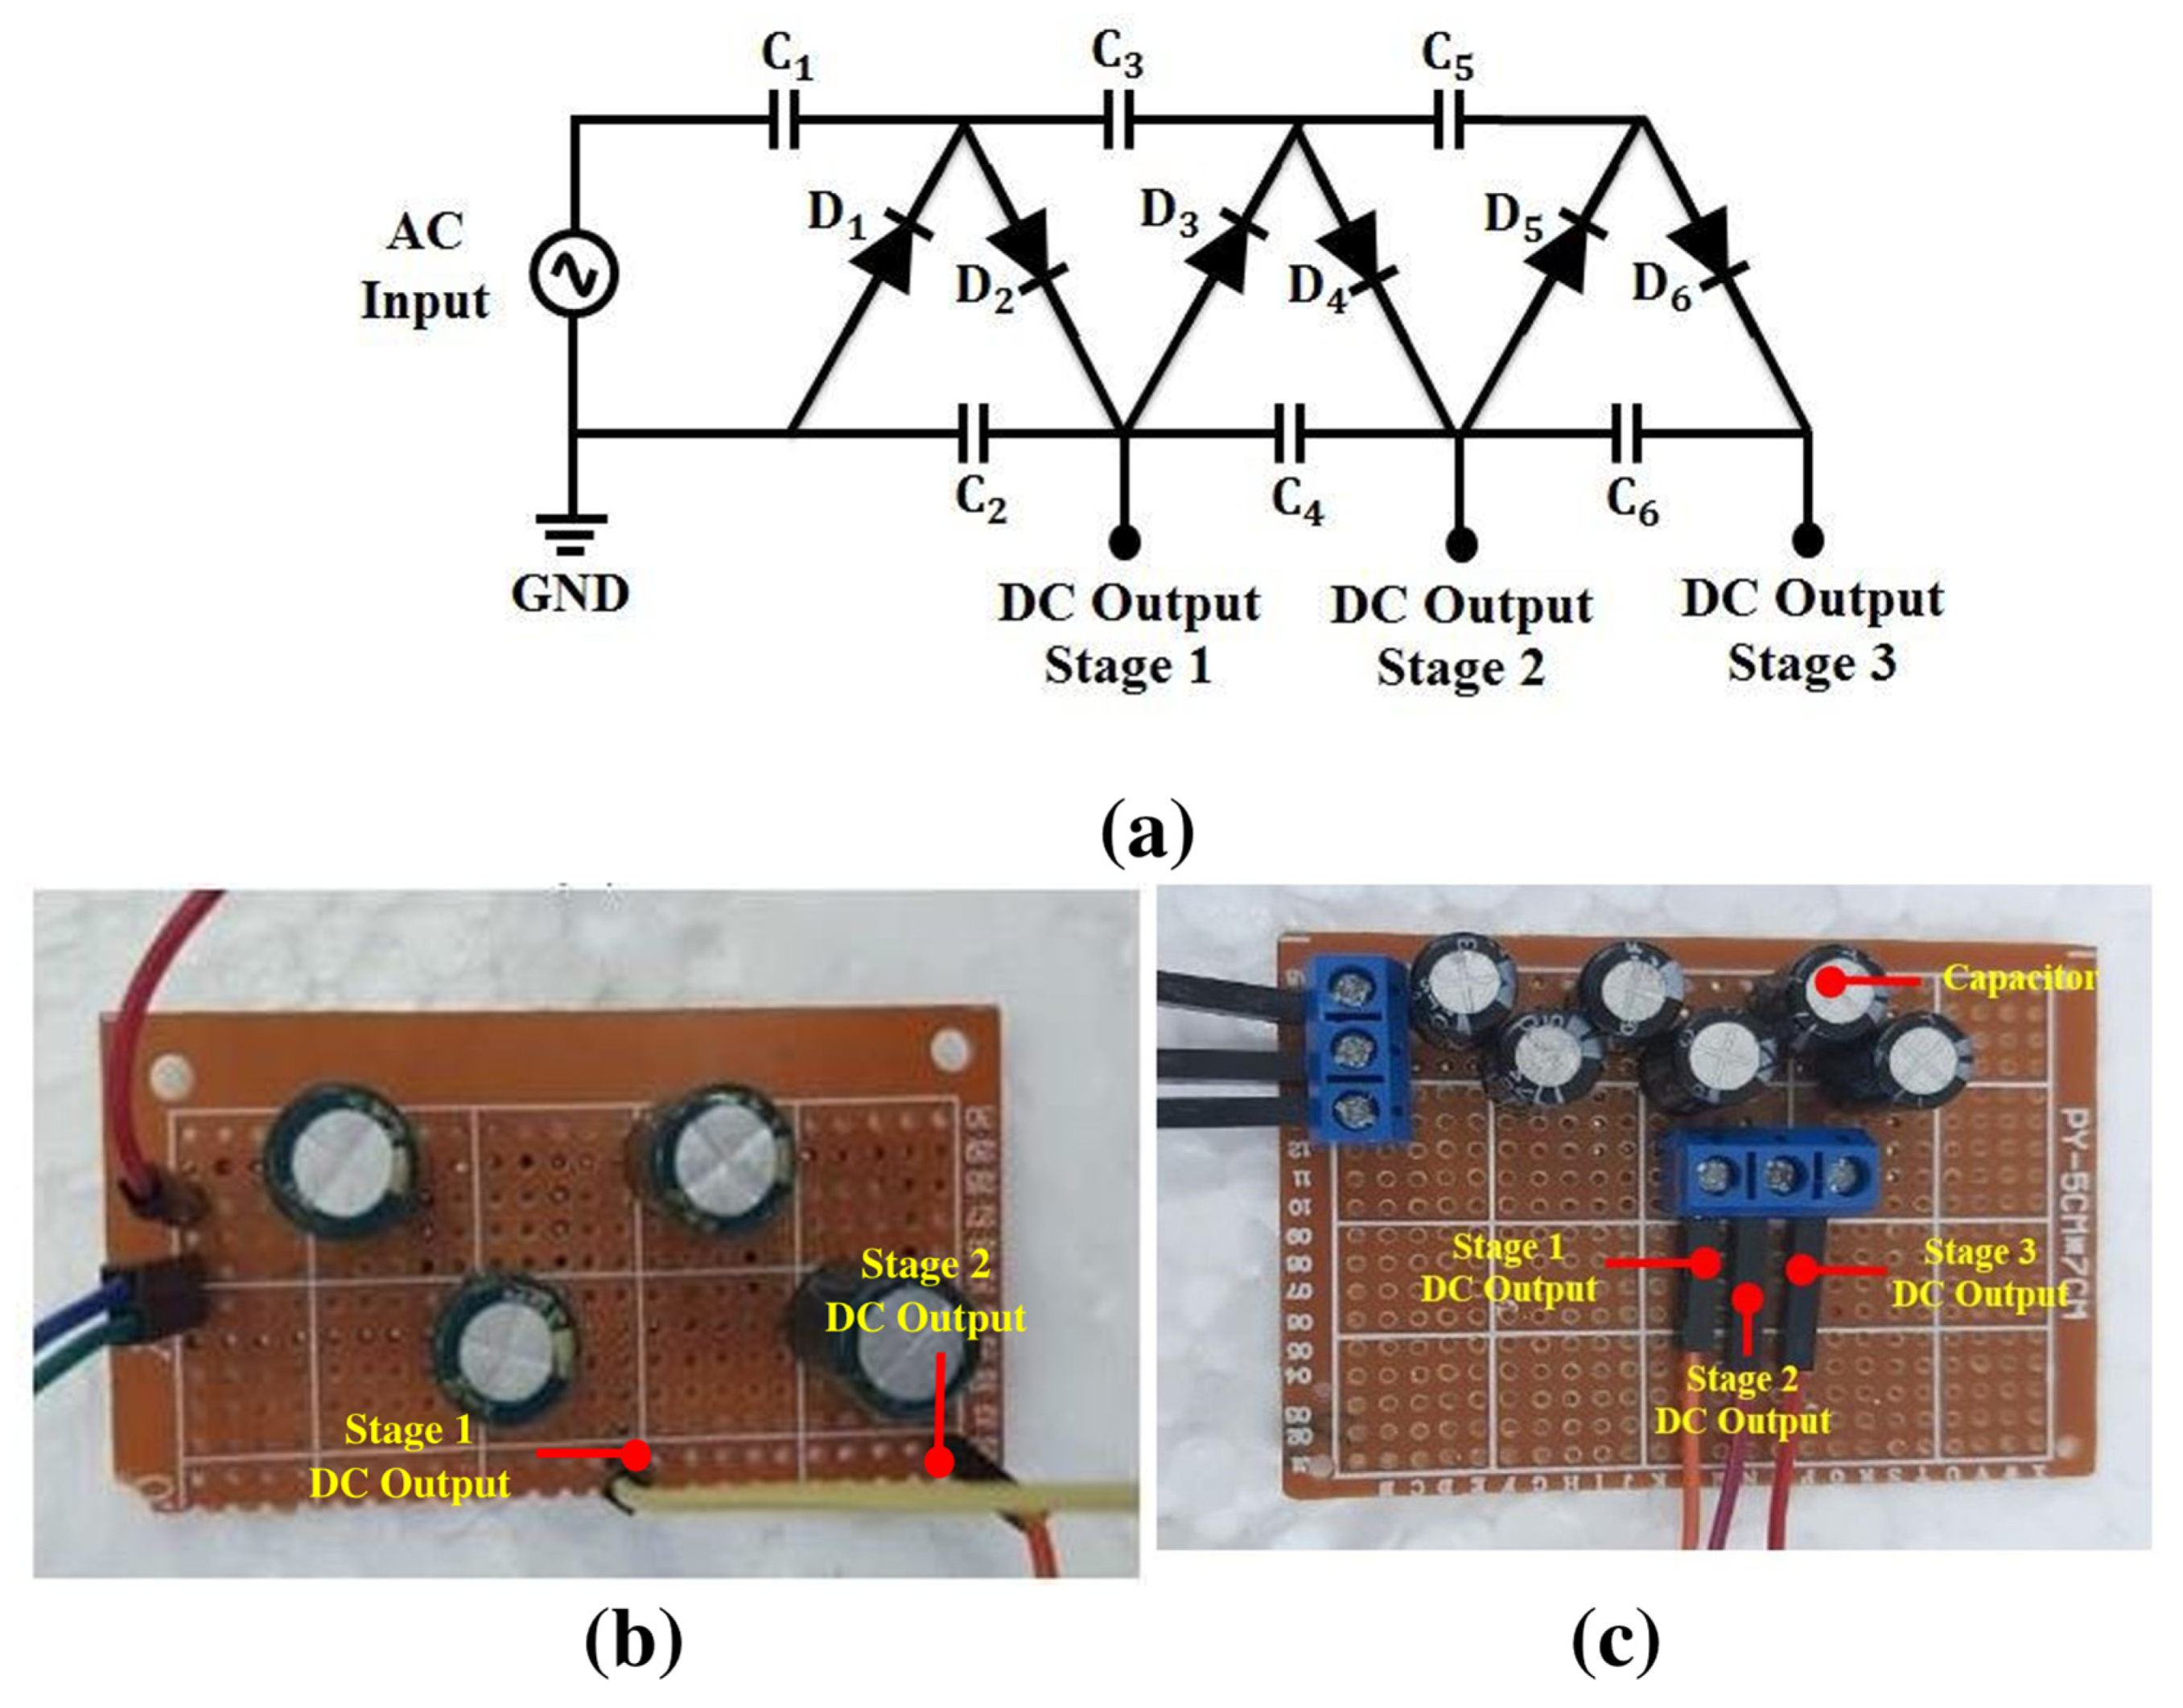
Since the majority of WSNs function on DC power, the AC output generated by the harvester can be changed into DC form. This conversion was carried out using a multi-stage AC–DC rectification circuit, configured in the Cockcroft–Walton arrangement, as illustrated in
Figure 14a. These rectifying circuits, with a multi-stage design, convert the AC output of the energy harvester into DC while also increasing the voltage. A three-stage rectifying circuit was implemented to address the low output voltage from the electromagnetic section, as shown in
Figure 14c. A surface-mount Schottky diode (SS34IN588) and capacitors (330 µF, 25 V) were used in this design. A dedicated two-stage voltage rectifier circuit (
Figure 14b) was specifically designed and developed for the piezoelectric component of the harvester due to its relatively high AC output. This rectifying circuit used the same diode and 1000 µF, 25 V capacitors.
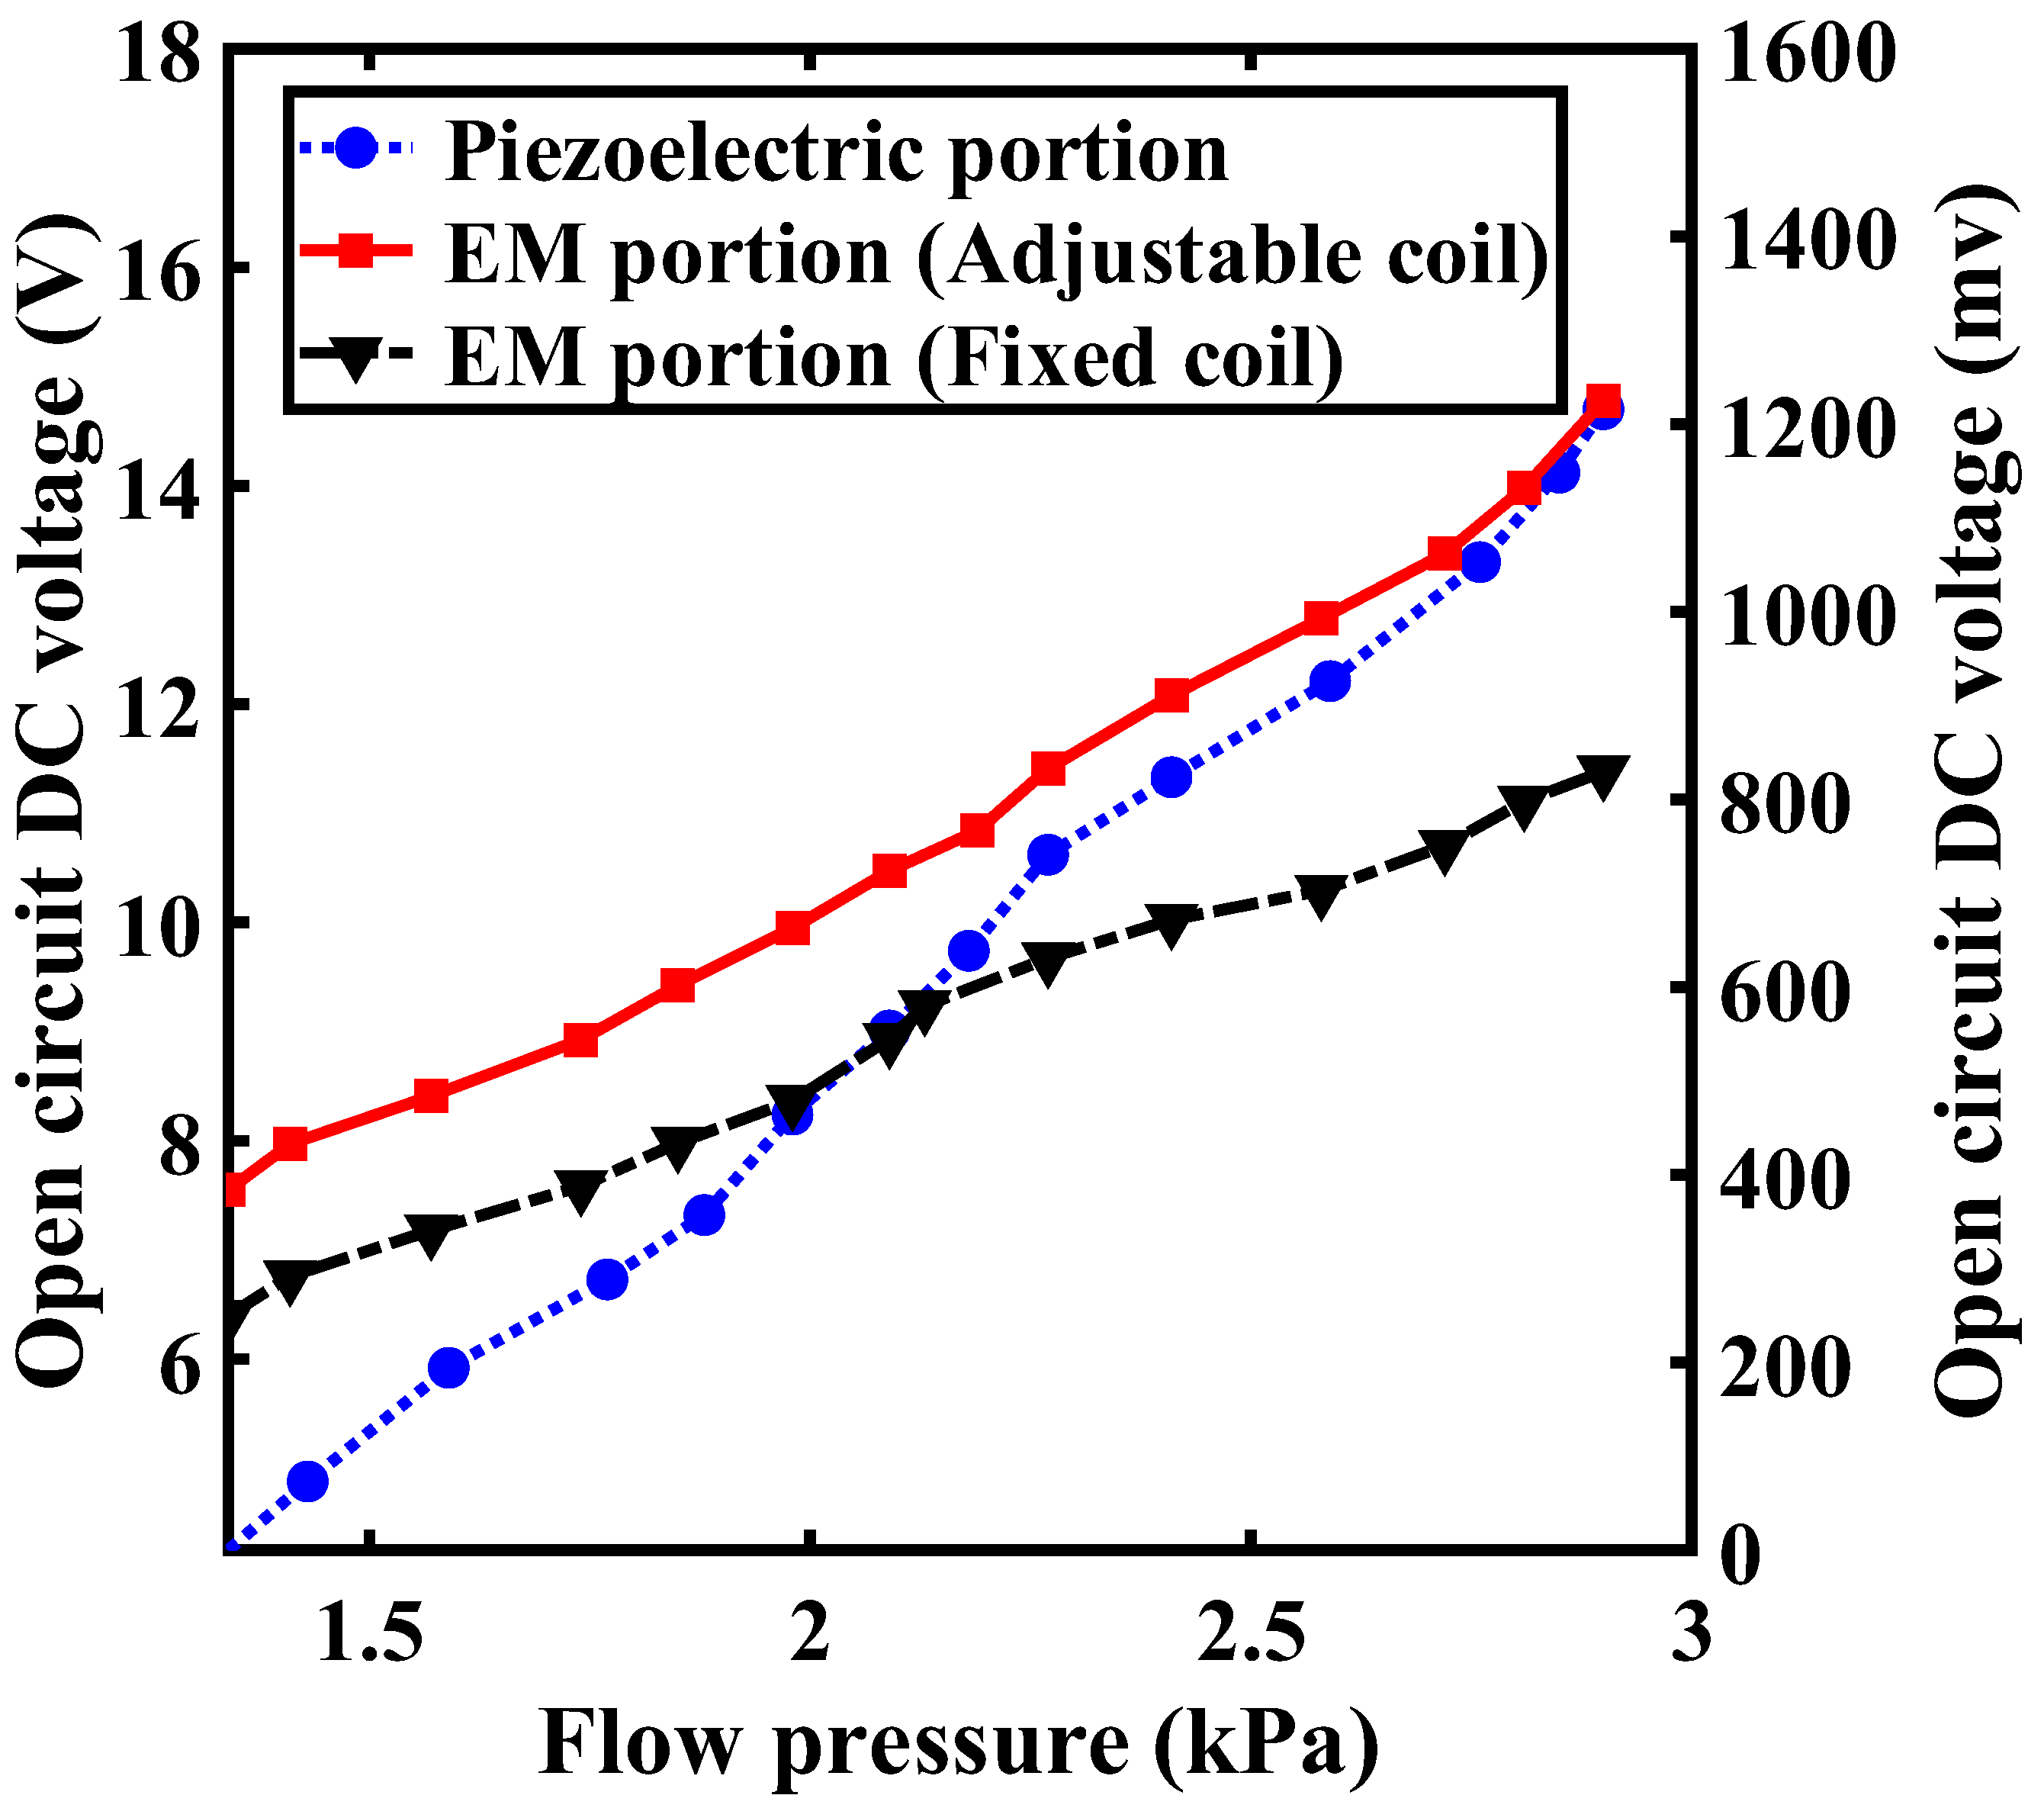
Figure 15 shows the correlation between the open circuit DC voltage and pulsating flow pressure amplitude. During the experiment, the flow rate and pressure amplitude measured 11.08 L/s and 2.9 kPa, respectively. The peak DC voltage recorded by the harvester was 14.7 V at the peak component, while it measured 860 mV at the adjustable coil and 830 mV at the EM fixed coil section.
In this analysis, both the EM and PE sections of the EH were connected to the rectifier circuit illustrated in
Figure 14, and their output terminals were linked to a variable resistive load.
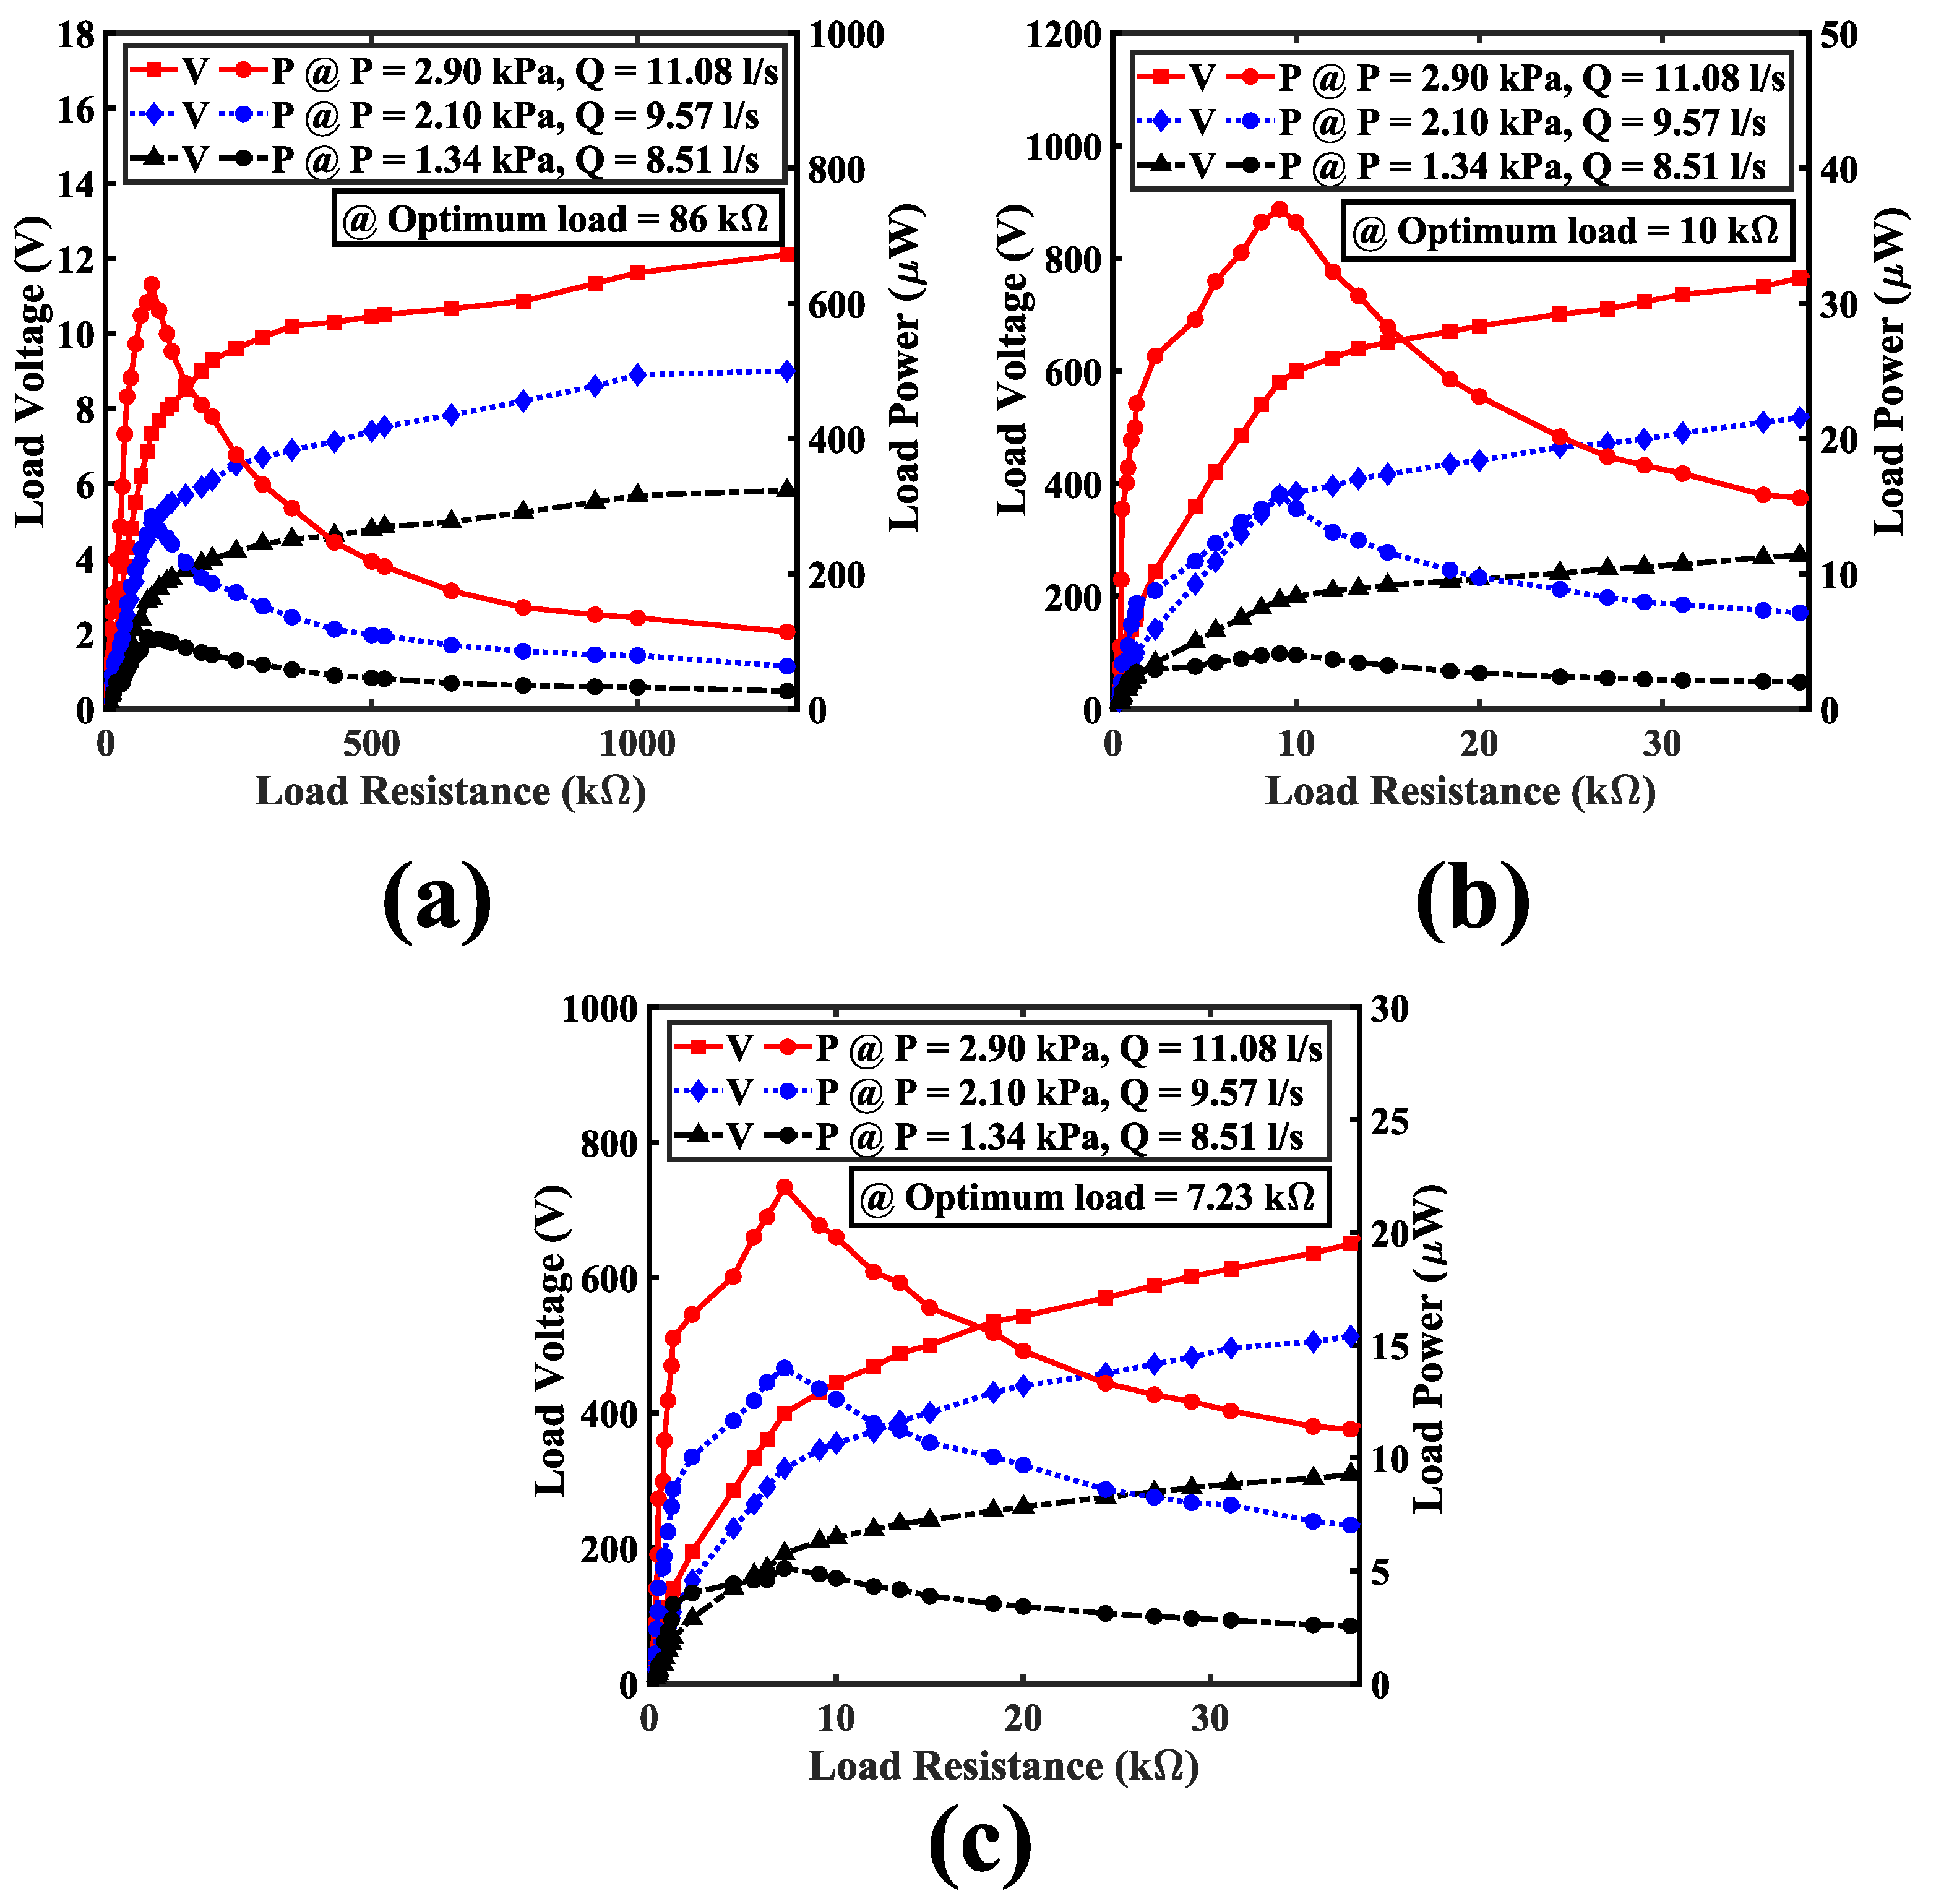
Figure 16 presents the variation in the DC output of the EH with respect to load resistance. The harvester’s performance was evaluated using flow pressures of 1.34 kPa, 2.10 kPa, and 2.9 kPa. As shown in
Figure 16a, the piezoelectric component achieved peak DC output voltages of 2.96 V, 4.96 V, and 7.35 V, along with power outputs of 101 µW, 285 µW, and 628 µW at an optimum load of 86 kΩ. Incorporating the rectification circuits increased the optimal load resistance for the piezoelectric section of the energy harvester, from 27 kΩ to 86 kΩ. Additionally, due to the power consumption within the rectifier, the maximum output power dropped from 725 µW to 628 µW. The electromagnetic unit of the harvester was likewise connected to the rectification circuit, and its performance was evaluated for both the adjustable and fixed coils. The rectifier was tested across a range of load resistances (335 Ω to 38 kΩ) under varying flow conditions. As illustrated in
Figure 16b,c, the adjustable coil delivered a peak DC power output of 36 µW, while the fixed coil generated 22 µW at their respective optimal load resistances of 10 kΩ and 7.23 kΩ under the same flow conditions.
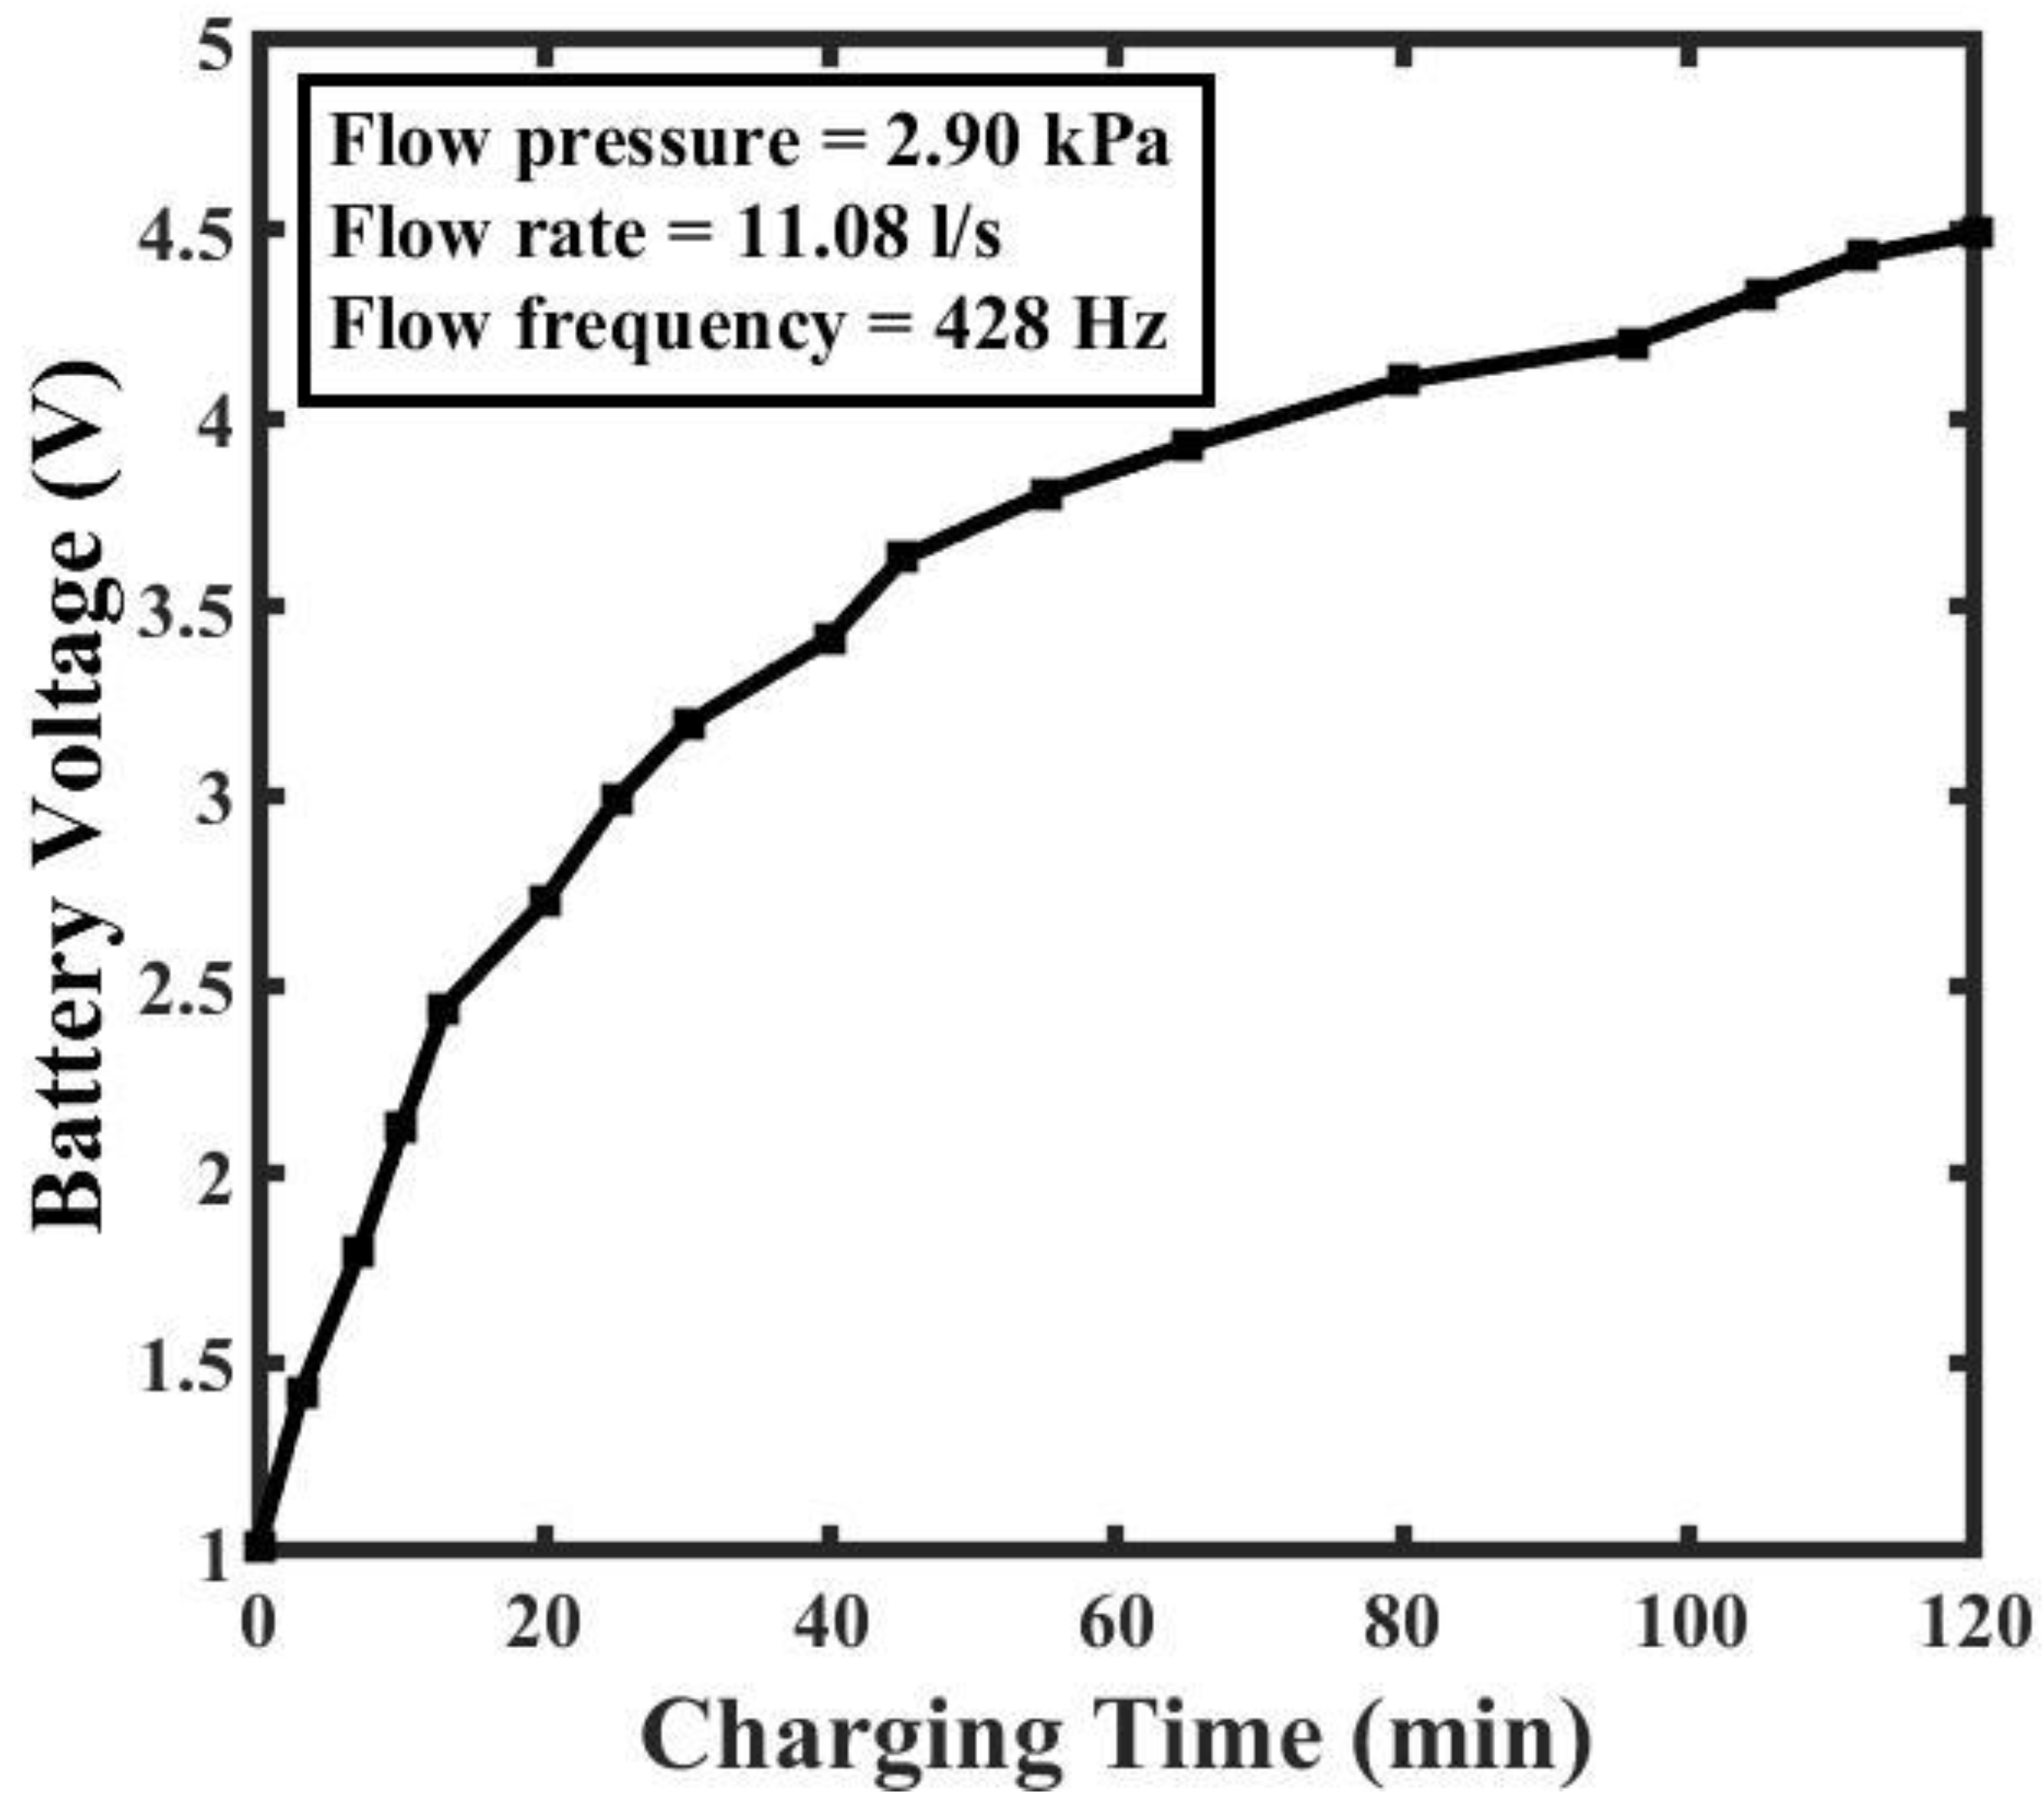
Figure 17 depicts the procedure for charging a battery using the harvester’s DC output. In this setup, a pressure of 2.90 kPa and a discharge rate of 11.08 L/s are applied. A rechargeable battery rated at 4.8 V started from a depleted voltage of 1.01 V. Then, the DC outputs from the piezoelectric and electromagnetic components were connected in series, and this combined DC output was linked to the battery. The voltage across the battery’s terminals increased over time as the battery gained energy and was periodically monitored. The battery voltage increased to 2.12 V in the first ten minutes and 3.42 V in the following thirty minutes. Furthermore, over a duration of 120 min, the battery voltage reached 4.49 V.
A WSN used to digitize the pipeline network was developed and integrated with the HFEH prototype, as shown in
Figure 18. An Arduino Uno microcontroller (ATmega168), a wireless transmitter and receiver unit (nRF24L01), and a pressure sensor (MPX5010DP) comprised the WSN developed for pipeline monitoring. The pressure sensor measures pipeline pressure, while the wireless transmitter facilitates communication with a central system. The Arduino microcontroller manages data processing and overall node functionality. The rechargeable battery ensures continuous operation, making the system self-sufficient and capable of wireless data transmission for effective pipeline monitoring.
7. Comparison and Discussion
The developed HFEH performance is assessed by comparing it with the previously developed FEH, as detailed in
Table 3. The comparison covers device size, internal impedance, frequency, voltage, power, and power density. Notably, the size of the developed harvester is larger than most standalone electromagnetic and piezoelectric energy harvesters. This size difference is because of integrating two transduction mechanisms into a single device. Specifically, the electromagnetic component’s internal impedance is higher than that of other electromagnetic FEHs, due to the larger number of turns in the coils. Conversely, the piezoelectric component shows lower impedance compared to other piezoelectric harvesters documented in existing literature. The prototype’s voltage output surpasses that of the harvesters previously documented. Regarding power, the harvester developed in this study excels beyond most of the previously developed EHs, with the exception of those mentioned in [
29,
30,
31,
32,
37], which are based on simulations rather than actual experiments. The developed prototype demonstrates a power density higher than that of the majority of existing electromagnetic and piezoelectric harvesters, with the exception of the devices reported in [
29,
32,
44], indicating that this FEH achieves superior output voltage, power, and overall power density compared to most previously documented designs.
The HFEH developed in this study is highly scalable and can be adapted to fit in different pipeline setups. While it was originally designed for a 32 mm T-joint, it can be effortlessly incorporated into pipelines of various sizes by using standard reducer or enlarger fittings. Scaling up the harvester for larger pipelines boosts its efficiency by accommodating larger piezoelectric and electromagnetic components, which enhances fluid interaction and increases vibration amplitudes, leading to higher output voltage and power. This scalability renders the proposed design versatile for a wide range of industrial applications in which the pipeline sizes and flow characteristics differ significantly.
In practical implementation, several engineering challenges must be addressed to ensure the long-term durability and stability of these devices. For example, in water pipelines, direct contact between the piezoelectric plate and the working fluid can lead to corrosion and erosion over time. Therefore, waterproof coatings and effective sealing methods are essential for maintaining the structural integrity of piezoelectric elements. Similarly, because the design includes permanent magnets, additional magnetic shielding or non-magnetic housings are necessary to prevent interference when the harvester is installed in steel pipelines. Addressing these challenges will improve the system’s reliability and lifespan in real-world operating environments.
In this study, an air blower was used as a safe and controllable alternative to gas flow during experimental testing. This method is widely accepted for the laboratory evaluation of flow energy harvesters because it allows for precise control of the flow rate and pressure, ensuring consistent data collection. Although real gas pipelines may encounter more complex behaviors, such as turbulence, multiphase flow, and varying diameters, the current setup was designed to maintain dynamic similarity under controlled conditions. Future research will focus on large-scale field trials to verify the performance in actual pipeline environments, along with detailed comparisons between analytical and experimental results to improve the theoretical model. Additionally, professional winding of electromagnetic coils will be developed to increase the winding accuracy, reduce resistive losses, and boost the overall energy conversion efficiency. These improvements will enhance the durability, scalability, and performance of harvesters for sustainable, self-powered industrial monitoring systems.
