Article

Graded Evaluation and Optimal Scheme Selection of Mine Rock Diggability Based on the Multidimensional Cloud Model

1
School of Resources and Safety Engineering, Central South University, Changsha 410083, China
2
Institute of Innovation, Science and Sustainability, Federation University Australia, Ballarat 3350, Australia
3
Laboratory of Sustainable Development in Natural Resources and Environment, Institute for Advanced Study in Technology, Ton Duc Thang University, Ho Chi Minh City 700000, Vietnam
4
Faculty of Environment and Labour Safety, Ton Duc Thang University, Ho Chi Minh City 700000, Vietnam
*
Authors to whom correspondence should be addressed.
Machines 2025, 13(11), 1019; https://doi.org/10.3390/machines13111019
Submission received: 30 September 2025 / Revised: 31 October 2025 / Accepted: 31 October 2025 / Published: 3 November 2025

Abstract

With the advancement of mining technologies, the evaluation of rock diggability has become a critical research topic for ensuring both safety and efficiency in mining operations. This study establishes a comprehensive evaluation system for mine rock diggability and proposes corresponding grading criteria. For the determination of indicator weights, a combination of subjective and objective methods is employed, integrating expert knowledge and data characteristics to identify optimal weights, thereby providing a reliable basis for comprehensive evaluation. The single-indicator cloud model effectively mitigates the difficulties associated with defining transitional values between adjacent intervals. The multidimensional cloud model, by considering the interactions among indicators, enables the optimization of indicator interactions and enhances the interpretability of diggability grades. Comparison with the Diggability Index (DI) method shows a high consistency between the two approaches (R2 = 0.991). The absolute accuracy of diggability levels reaches 74%, while the accuracy based on cloud model fuzzy evaluation reaches 100%, demonstrating the effectiveness of the cloud model in handling transitional intervals and capturing uncertainty. This study provides a novel methodology and theoretical foundation for the scientific evaluation of mine rock diggability, offering practical guidance for reasonable grading, optimization of mining parameters, and interpretation of diggability levels in engineering practice.

1. Introduction

In mining operations and geotechnical engineering, the selection of appropriate excavation methods is of critical importance; therefore, research on rock diggability holds significant theoretical and engineering value. From a construction design perspective, diggability grading provides guidance for the selection of excavation methods and the optimization of process workflows, helping to avoid schedule delays and cost overruns caused by unreasonable designs. From an equipment allocation standpoint, different diggability grades correspond to varying requirements for crushing, loading, and transportation equipment. A scientifically sound diggability assessment facilitates rational equipment selection and efficient utilization. In terms of construction safety, diggability evaluation enables the identification of potential adverse geological conditions prior to excavation, thereby reducing operational risks. Accordingly, the study of rock diggability is a crucial measure to ensure the overall economic efficiency, safety, and design rationality of excavation projects [1].
Depending on the application context, terms such as “excavatability,” “drillability,” and “rippability” have been proposed to evaluate excavation methods and optimize equipment selection [2,3,4,5,6]. From the perspective of rock characteristics, diggability is influenced by multiple factors, including lithology, weathering degree, joint development, bedding structure, porosity, and water content [7,8]. The heterogeneity and discontinuity of rock masses lead to significant variations in rock behavior under different mining conditions, thereby increasing the complexity of diggability prediction [9,10,11].
In the study of diggability grading, various traditional empirical methods based on rock mechanical parameters and rock mass structural characteristics have been employed to evaluate diggability and provide intuitive engineering guidance. Scoble and Muftuoglu [6] proposed a diggability index based on weathering degree, uniaxial compressive strength, joint spacing, and bedding spacing, classifying excavation difficulty into seven categories and recommending corresponding equipment types. The effectiveness of this approach was validated using ten sandstone bench cases from open-pit coal mines. Rotimi et al. and Ismail et al. suggested that seismic wave measurements could also be used to characterize rock tearability (Rippability) [12,13]. Given the numerous factors influencing rock diggability, which cannot be comprehensively covered, and the incomplete understanding of their mechanisms, incorporating the fuzziness of unknown factors has emerged as a promising approach for diggability grading. Iphar and Goktan [14] addressed the issues of sharp boundaries between adjacent categories and subjective uncertainty of boundary data in traditional diggability rating methods by integrating fuzzy set theory with the Mamdani algorithm, thereby overcoming the limitations of conventional grading methods. Zhou et al. [15] proposed a hybrid model based on uncertainty measures and information entropy, employing multiple membership functions to compute single-indicator values, determining weights through information entropy, and introducing the reliability coefficient (Rec) to adjust the evaluation results. This approach provides a practical method for assessing rock diggability, suitable for guiding equipment selection and cost optimization in excavation projects.
With the increase in computational power, accurate simulation and in-depth analysis of geotechnical conditions have become feasible. By reflecting actual geological conditions based on geological surveys and laboratory tests, combined with numerical simulations of blasting and mechanical rock-breaking processes, researchers can investigate geological diggability and optimize excavation procedures accordingly [16,17,18,19]. Meanwhile, artificial intelligence methods have been widely applied in the study of rock diggability. Artificial neural networks (ANNs) have been employed to predict the cuttability of rocks [20]. Huang and Zhou [21] utilized an expanded database to predict rock diggability by optimizing multilayer perceptrons (GA-MLP) with genetic algorithms and standards based on gene expression programming (GEP).
Despite the progress achieved using traditional empirical methods, mechanical parameter-based evaluations, and artificial intelligence in the study of rock diggability, several limitations remain [22,23,24]. First, empirical and mechanical parameter-based approaches largely rely on manually defined evaluation rules and indicator weights, which cannot fully capture the heterogeneity and complex structure of rock masses, resulting in evaluations that are highly subjective. Second, although numerical simulations and AI methods can model or predict rock failure processes, they typically require large amounts of high-quality data, and their outputs are often singular, providing insufficient handling of data uncertainty and fuzziness. Consequently, their reliability may be compromised under unclear boundary conditions or ambiguous indicators [25,26,27].
The cloud model, as a mathematical tool capable of characterizing both randomness and fuzziness, organically integrates qualitative language with quantitative data. It has been widely applied in geotechnical and related engineering evaluations to address issues such as ambiguous indicators, unclear boundaries, and complex data distributions, thereby enhancing the scientific rigor and reliability of evaluation results [28,29,30].
In summary, this study establishes a systematic evaluation framework for rock diggability. Following the principle of “comprehensive accessibility,” weathering degree (WD), uniaxial compressive strength (UCS), joint spacing (JS), and bedding spacing (BS) were selected as core evaluation indicators. A five-level grading standard was constructed and mapped to established diggability evaluation results to verify its rationality. To determine indicator weights, a combination of subjective and objective approaches was employed. Subjective weights were obtained by consulting five experts who constructed judgment matrices, while objective weights were calculated and optimized using the Entropy Weight Method (EW), Correlation-based Criteria Importance (CRITIC), Coefficient of Variation (CV), Principal Component Analysis (PCA), and Factor Analysis (FA). The final comprehensive indicator weights were subsequently derived.

2. Data Sources and Evaluation Framework

2.1. Data Description

This study collected and compiled rock diggability-related data from the literature in the United Kingdom and Türkiye (Figure 1), comprising a total of 56 open-pit coal mine records—46 from Türkiye and 10 from the United Kingdom [6,14]. Figure 1 illustrates the geographical distribution of these sites, highlighting the spatial coverage and representativeness of the dataset. The dataset consists of four core indicators (WD, UCS, JS, and BS) sourced from field geological surveys and laboratory rock mechanics tests. These data provide a comprehensive representation of the physical and mechanical characteristics of rock masses under different geological conditions and are highly accessible for engineering applications. The qualitative indicator WD was defined according to the International Society for Rock Mechanics and Rock Engineering (ISRM, 1978) standard [31]. In addition, diggability indices (DI) calculated based on existing evaluation methods were collected as an important reference for validating the reliability of subsequent assessment results. The calculation of DI used in this study follows the method described in [6].

2.2. Data Analysis

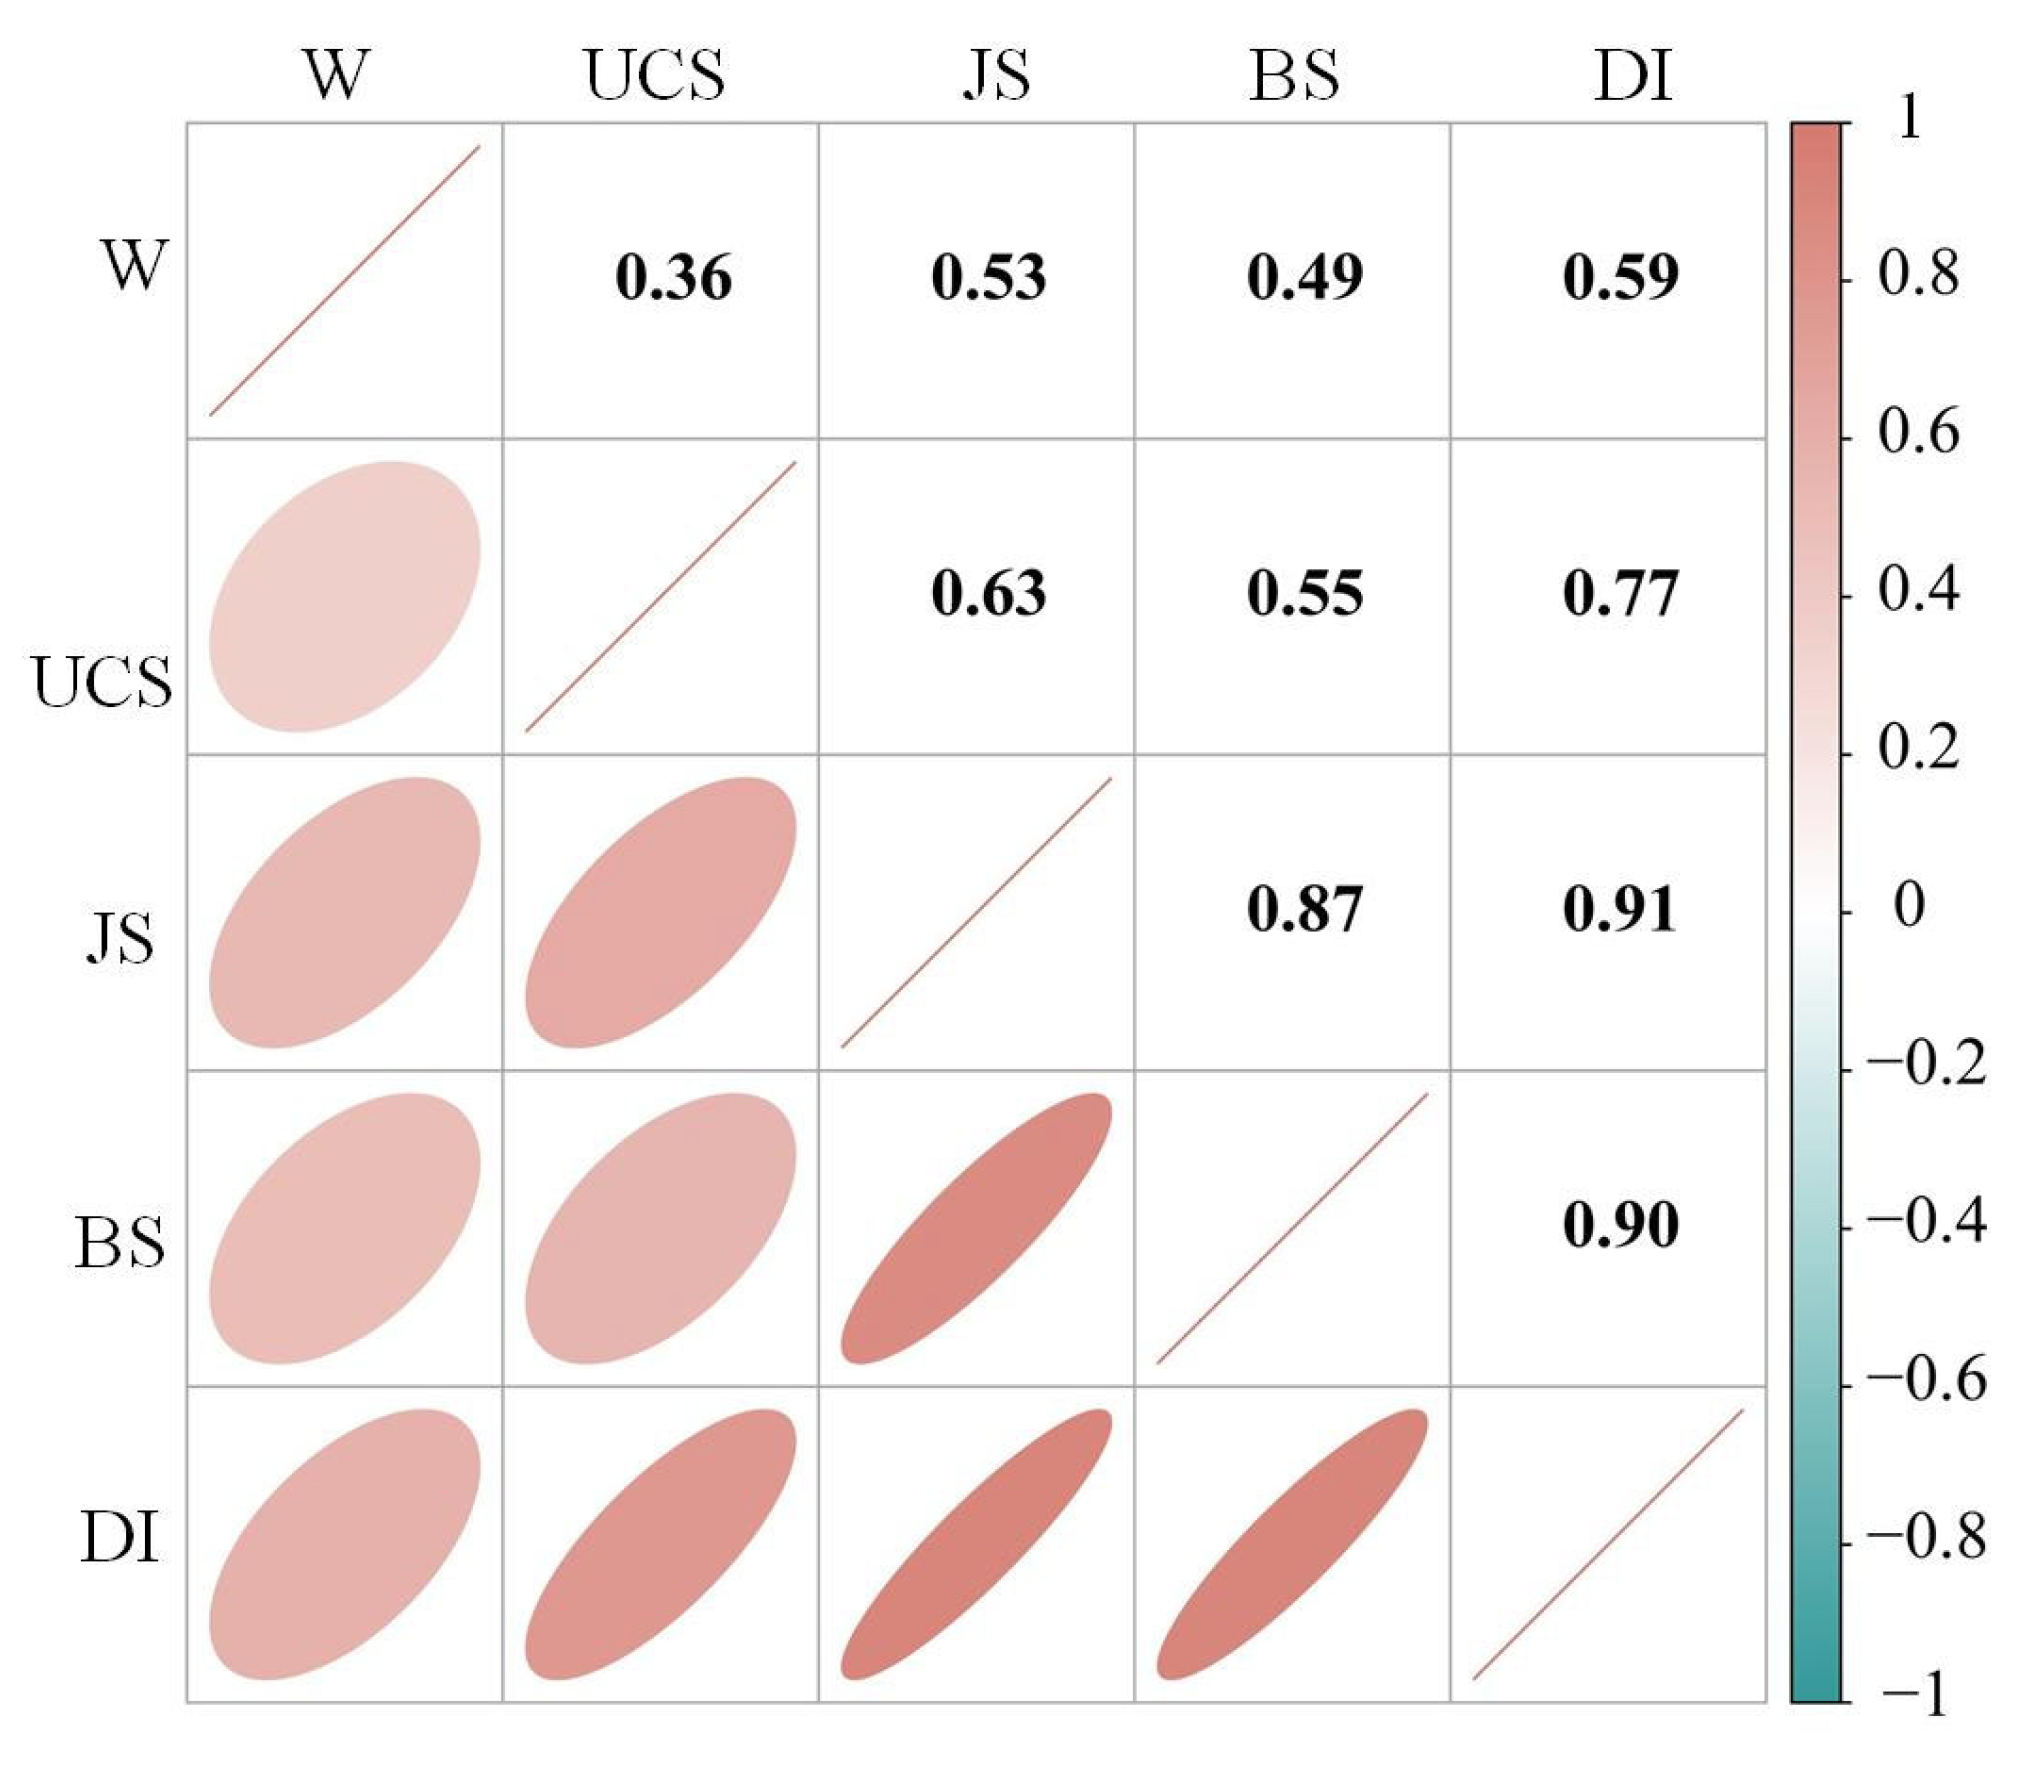
DI was treated as the output indicator, while the other four indicators (WD, UCS, JS, and BS) were used as input indicators for correlation analysis (Figure 2). As illustrated in Figure 2, since DI serves as the output, its correlation with each input indicator reflects the explanatory power of the indicator system on the evaluation results. The analysis shows that JS and BS exhibit the highest correlation with DI (r > 0.90), indicating that geometric parameters have a significant impact on the output. UCS also demonstrates a strong correlation with DI (r = 0.77), suggesting that rock strength is closely related to overall performance. In contrast, WD shows a lower correlation with DI (r = 0.59), but still provides complementary information for the assessment.
On the other hand, strong correlations exist among the input indicators themselves, such as between JS and BS (r = 0.87), which may indicate potential redundancy and the need to avoid duplicate measurements. However, existing studies have shown that joints influence rock mass stability by reducing rock strength and altering permeability, whereas bedding affects rock anisotropy and weathering patterns. Therefore, both JS and BS should be considered simultaneously to comprehensively account for the influence of joint and bedding distributions.

2.3. Rock Diggability Evaluation Framework

Building upon the original evaluation system, this study developed an adjusted framework for rock diggability assessment, which mainly comprises two components: indicator fuzzification and diggability grading. First, using interval scoring, a fuzzy conversion table for the indicators was established (Table 1) based on the four key diggability control factors (WD, UCS, JS, and BS). This table maps qualitative descriptions of each indicator to corresponding quantitative ranges, enabling the quantitative expression of qualitative features under different conditions as well as the standardized representation of all rock mass characteristics. Subsequently, by relating the fuzzy scoring results to the comprehensive indicators, rock diggability levels were further classified. Typical excavation methods corresponding to each level were incorporated to form a complete evaluation framework. This system not only reflects the relative ease or difficulty of rock excavation but also provides a scientific basis for the rational selection of excavation methods.
Building upon the existing evaluation system [6], this study further optimized and adjusted the framework to develop a rock diggability assessment system, which mainly comprises two components: indicator fuzzification and diggability grading. In the indicator fuzzification stage, interval scoring was applied to the four key diggability control factors (WD, UCS, JS, and BS) to construct the fuzzy conversion table for the indicators (Table 1). This process maps qualitative descriptions of each indicator to corresponding quantitative ranges, enabling the quantitative expression of qualitative features under different conditions and ensuring standardized representation of rock mass characteristics on a unified scale.
In the diggability grading stage, a grading standard was established based on the comprehensive scores obtained from the fuzzy conversion and their correspondence with the diggability index (Table 2). On this basis, the original seven-level grading system from previous studies was merged and optimized to form a five-level system, ranging from Level I to Level V, corresponding to excavation difficulty from “Very Easy” to “Marginal Without Blasting.” This grading system not only ensures effective linkage between the fuzzy conversion results and diggability classification but also clearly reflects the diggability characteristics of rock masses under engineering conditions. Furthermore, each diggability level is associated with typical excavation methods, providing a practical reference for method selection and construction planning.

3. Methodology

3.1. Multidimensional Cloud Model

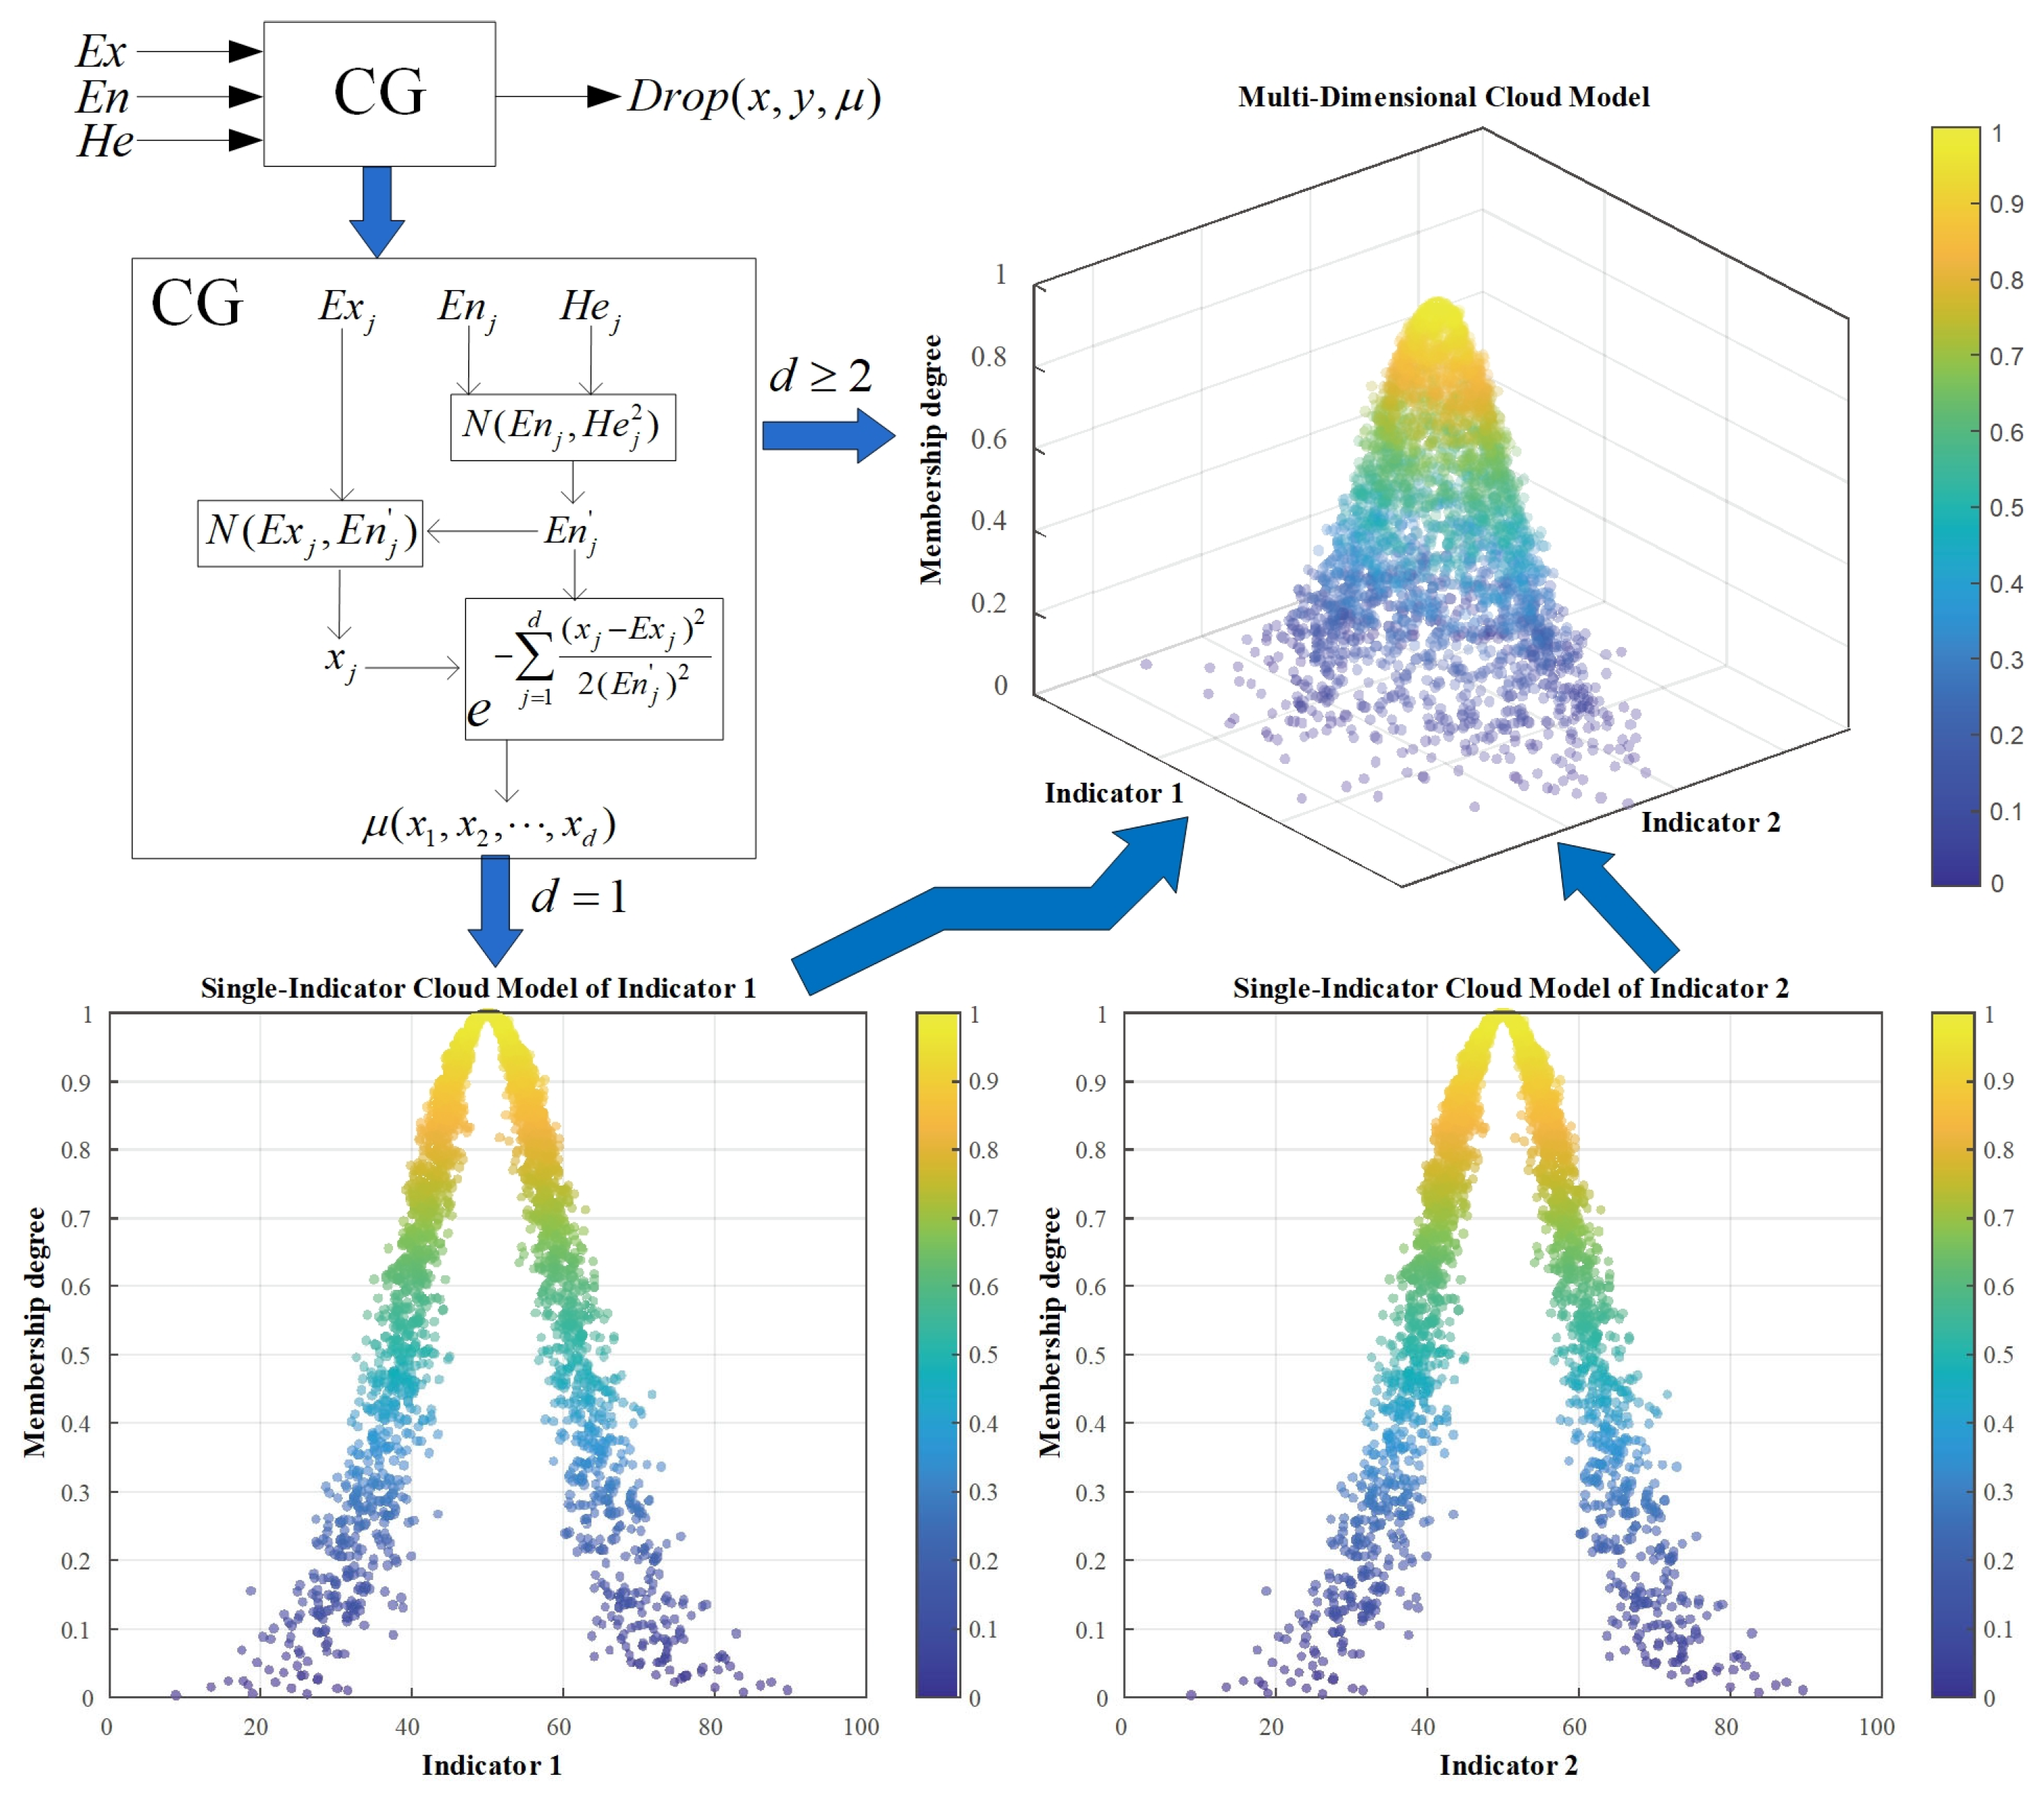
The cloud model is a cognitive tool that characterizes the uncertain mapping between qualitative concepts and quantitative data. It consists of expectation ( E x ), entropy ( E n ), and hyper-entropy ( H e ), where E x denotes the central tendency of the cloud drops, E n characterizes uncertainty and fuzziness, and H e describes the volatility, reflecting the stability of uncertainty, as illustrated in Figure 3 [32,33,34,35]. When multiple indicators are considered simultaneously, the cloud model can be extended to a d-dimensional form (multidimensional cloud model) [36,37,38]. As shown in Figure 3, given the expectation, entropy, and hyper-entropy as E x j , E n j , H e j , respectively, the generation process of cloud drops in a d-dimensional cloud model is as follows:
(1)
Generate perturbed entropy
E n j ~ N ( E n j , H e j 2 ) ,   j = 1 , 2 , , d
where E n j denotes the perturbed entropy.
(2)
Determine the positions of cloud drops
x j ~ N ( E x j , E n j ) ,   = 1 , 2 , , d
where E x j denotes the expectation of the j-th indicator.
(3)
Membership calculation
μ ( x 1 , x 2 , , x d ) = e j = 1 d ( x j E x j ) 2 2 ( E n j ) 2
where μ ( 0 , 1 ] is the membership degree. When d = 1 , it corresponds to the cloud drop generation process of a one-dimensional (single-indicator) cloud model; when d 1 , it corresponds to the cloud drop generation process of a multidimensional (multi-indicator) cloud model (Figure 3).

3.2. Subjective Weights (Expert Evaluation)

The subjective weights of the indicators are determined by experts through pairwise comparisons of the relative importance between different indicators, as outlined below:
(1)
Expert evaluation
As shown in Figure 4, invited experts evaluate the relative importance of indicators A and B to be weighted, using a 1–9 scale, where 1 denotes equal importance and 2–9 represent increasing levels of importance. By conducting pairwise comparisons of all indicators, the evaluation of the importance of all indicators is completed [39,40].
(2)
Construction of the judgment matrix
Referring to the principle shown in Figure 4, the experts’ evaluation results are transformed into a normalized judgment matrix: M = [ m p q ] n × n . In this matrix, m p q denotes the relative importance of indicator p compared to indicator q as judged by the experts.
(3)
Weight calculation
w p = ( q = 1 n m p q ) 1 / n r = 1 n ( q = 1 n m p q ) 1 / n
where p = 1 , 2 , , n ; w p denotes the weight of the p-th indicator.
(4)
Consistency test
To ensure the consistency of expert evaluations, the consistency ratio (CR) can be used as an indicator [41].
C I = λ max n n 1
C R = C I R I
where n is the number of indicators, and RI denotes the random consistency index. When CR < 0.1, the judgment matrix is considered consistent.

3.3. Objective Weight

Compared with subjective weighting methods that rely on expert judgment, objective weighting methods determine weights based on the intrinsic data characteristics of the indicators, reducing the influence of subjective factors and offering strong objectivity and reproducibility. The objective weighting methods applied in the study area include the entropy weight method, coefficient of variation method, CRITIC method, principal component analysis, and factor analysis, with the specific procedure as follows.

3.3.1. Entropy Weight Method (EW)

Based on the concept of information entropy, the greater the variability of an indicator, the more information it provides, and accordingly, the higher its assigned weight. Let there be m sets of data and n indicators; the steps for calculating weights using the entropy weight method are as follows [42,43,44]:
(1)
Standardization
a = x i j = a i j min i a i j max i a i j max i a i j , j = 1 , , n     1 ,
where a i j denotes the original value of the j-th indicator in the i-th dataset, and x i j denotes the corresponding value after standardization.
(2)
Calculation of proportions
a = p i j = x i j i = 1 m x i j , i = 1 m p i j = 1   1 ,
where p i j denotes the proportion of the j-th indicator in the i-th dataset.
(3)
Calculation of entropy
a = e j = k i = 1 m p i j ln ( p i j )     1 ,
where k = 1 ln ( m ) ; e j denotes the information entropy of the j-th indicator.
(4)
Calculation of the difference coefficient
d j = 1 e j     1 ,
where d j denotes the information utility value of the j-th indicator.
(5)
Weight calculation
w j = d j j = 1 n d j
where j = 1 n w j = 1 ; w j denotes the final weight of the j-th indicator.

3.3.2. Coefficient of Variation Method (CV)

The coefficient of variation method allocates weights based on the degree of variability of the indicators [45].
(1)
Calculation of standard deviation
σ j = 1 m i = 1 m ( x i j x ¯ j ) 2
where σ j denotes the standard deviation (dispersion) of the j-th indicator, and x ¯ j denotes the mean value of the j-th indicator.
(2)
Calculation of the coefficient of variation
V j = σ j x ¯ j
where V j denotes the coefficient of variation of the j-th indicator.
(3)
Weight calculation
w j = V j j = 1 n V j

3.3.3. CRITIC Method

The CRITIC method determines weights by comprehensively considering both the variability of indicators and their conflicts with other indicators [46].
(1)
Calculation of correlation
ρ j k = i = 1 m ( x i j x ¯ j ) ( x i k x ¯ k ) i = 1 m ( x i j x ¯ j ) 2 · i = 1 m ( x i k x ¯ k ) 2
where ρ j k denotes the correlation coefficient between indicator j and indicator k (degree of conflict).
(2)
Calculation of information quantity
C j = σ j · k = 1 n ( 1 ρ j k )
where C j denotes the comprehensive information quantity of indicator j.
(3)
Weight calculation
w j = C j j = 1 n C j

3.3.4. Principal Component Analysis (PCA)

By extracting principal components through dimensionality reduction, indicator weights are transformed into principal component contribution functions [47].
(1)
Construction of the covariance matrix
S = 1 m X T X
where X denotes the standardized indicator matrix, and S denotes the covariance matrix.
(2)
Solve for eigenvalues and eigenvectors
S a k = λ k a k
(3)
Calculation of contribution rate and cumulative contribution rate
η k = λ k k = 1 n λ k
η = k = 1 p η k
where η k denotes the variance contribution rate of the k-th principal component, and p is the number of selected principal components.
(4)
Calculation of indicator weights
w j = k = 1 p η k a j k j = 1 n C j k = 1 p η k a j k
where a j k denotes the coefficient of indicator j in the k-th principal component vector.

3.3.5. Factor Analysis Method (FA)

Factor analysis determines indicator weights by extracting common factors to reveal shared information among indicators [48].
(1)
Establishment of the factor model
x j = μ j + k = 1 p l j k f k + ε j
where x j denotes the j-th indicator; μ j denotes the constant term, which is 0 since the data are standardized; l j k denotes the factor loading coefficient; f k denotes the common factor; ε j denotes the unique factor.
(2)
Extraction of factors and loading matrix
L = ( l j k ) n × p
(3)
Calculation of weights
w j = k = 1 p η k l j k j = 1 n k = 1 p η k l j k

3.4. Comprehensive Weights (Combination of Subjective and Objective Weights)

To comprehensively consider both expert judgment and data characteristics, the final indicator weights are calculated using a linear combination of subjective weights and the optimized objective weights. Let W j S and W j O denote the subjective and optimized objective weights of the j-th indicator, respectively. The comprehensive weight W j C is calculated as:
W j C = α · W j S + ( 1 α ) · W j O , j = 1 , 2 , , n
where α [ 0 , 1 ] is the coefficient reflecting the relative importance of subjective versus objective weighting. In this study, α = 0.5 is used, indicating equal consideration of expert judgment and data characteristics.

4. Rock Excavatability Modeling and Evaluation

In rock diggability modeling, determining the weights of indicators is a crucial step in constructing a comprehensive evaluation model. The weights identified here are divided into objective and subjective weights to ensure that the model both accurately reflects the characteristics of the existing data and incorporates expert macro-level judgment.

4.1. Comprehensive Weights

4.1.1. Subjective Wights (Expert Evaluation)

First, the four identified indicators (WD, UCS, JS, BS) and their relevant research backgrounds were provided to five invited experts from different professional fields with extensive mining experience, who independently evaluated the importance of each indicator. Specifically, Experts 1 and 2 specialize in mining equipment development, Experts 3 and 4 specialize in mining and extraction research, and Expert 5 specializes in mining systems engineering research, ensuring that different professional perspectives on the diggability indicators are adequately represented. The experts’ pairwise comparison matrices are constructed using Saaty’s 1–9 scale method, resulting in an independent judgment matrix for each expert:
Expert   1 : 1 1 1 / 3 1 / 5 1 1 1 / 3 1 / 3 3 3 1 2 5 3 1 / 2 1
Expert   2 :   1 1 / 2 1 / 3 1 / 5 2 1 1 / 3 1 / 3 3 3 1 1 5 3 1 1
Expert   3 : 1 2 1 1 / 4 1 / 2 1 1 / 2 1 / 2 1 2 1 1 / 2 4 2 2 1
Expert   4 :   1 1 2 1 1 1 1 1 / 2 1 / 2 1 1 1 / 2 1 2 2 1
Expert   5   1 2 1 1 / 7 1 / 2 1 1 / 2 1 / 7 1 2 1 1 / 4 7 7 4 1
As shown in Table 3, based on the independent judgment matrices of the five experts (26–30), the indicator weights for each expert are calculated using Equation (4) (Figure 5). Subsequently, Equations (5) and (6) are used to perform a consistency check on each expert’s judgment results to ensure the rationality of the evaluation matrices and weight assignments (Table 3).
As shown in Figure 5, the five experts exhibit certain tendencies in their allocation of indicator weights: overall, JS and BS are generally regarded as the most important indicators with relatively higher weights, reflecting that the experts focus more on the influence of rock structure features on diggability. Conversely, WD and UCS have relatively lower weights, indicating that experts consider their influence comparatively minor. Specifically, Expert 1 and Expert 2 emphasize JS more, whereas Expert 4 gives greater weight to WD; Expert 5 assigns significantly higher weight to BS, indicating a stronger focus on bedding structures. Overall, experts tend to concentrate the core weights of diggability evaluation on the geometric structural features of the rock (BS, JS), while the rock mechanical properties (UCS) and weathering degree (WD) are of secondary importance. It is considered that the invited experts exhibit no obvious professional bias, and each contributes reasonably to the allocation of weights.
The final subjective weights were obtained by averaging the independent indicator weights provided by the five experts (Table 3), resulting in WD (0.18), UCS (0.16), JS (0.27), and BS (0.39). Although the expert evaluation method is straightforward, it is combined with objective weighting and the multi-dimensional cloud model to ensure a balanced, reliable, and scientifically grounded assessment of rock diggability.

4.1.2. Objective Weights

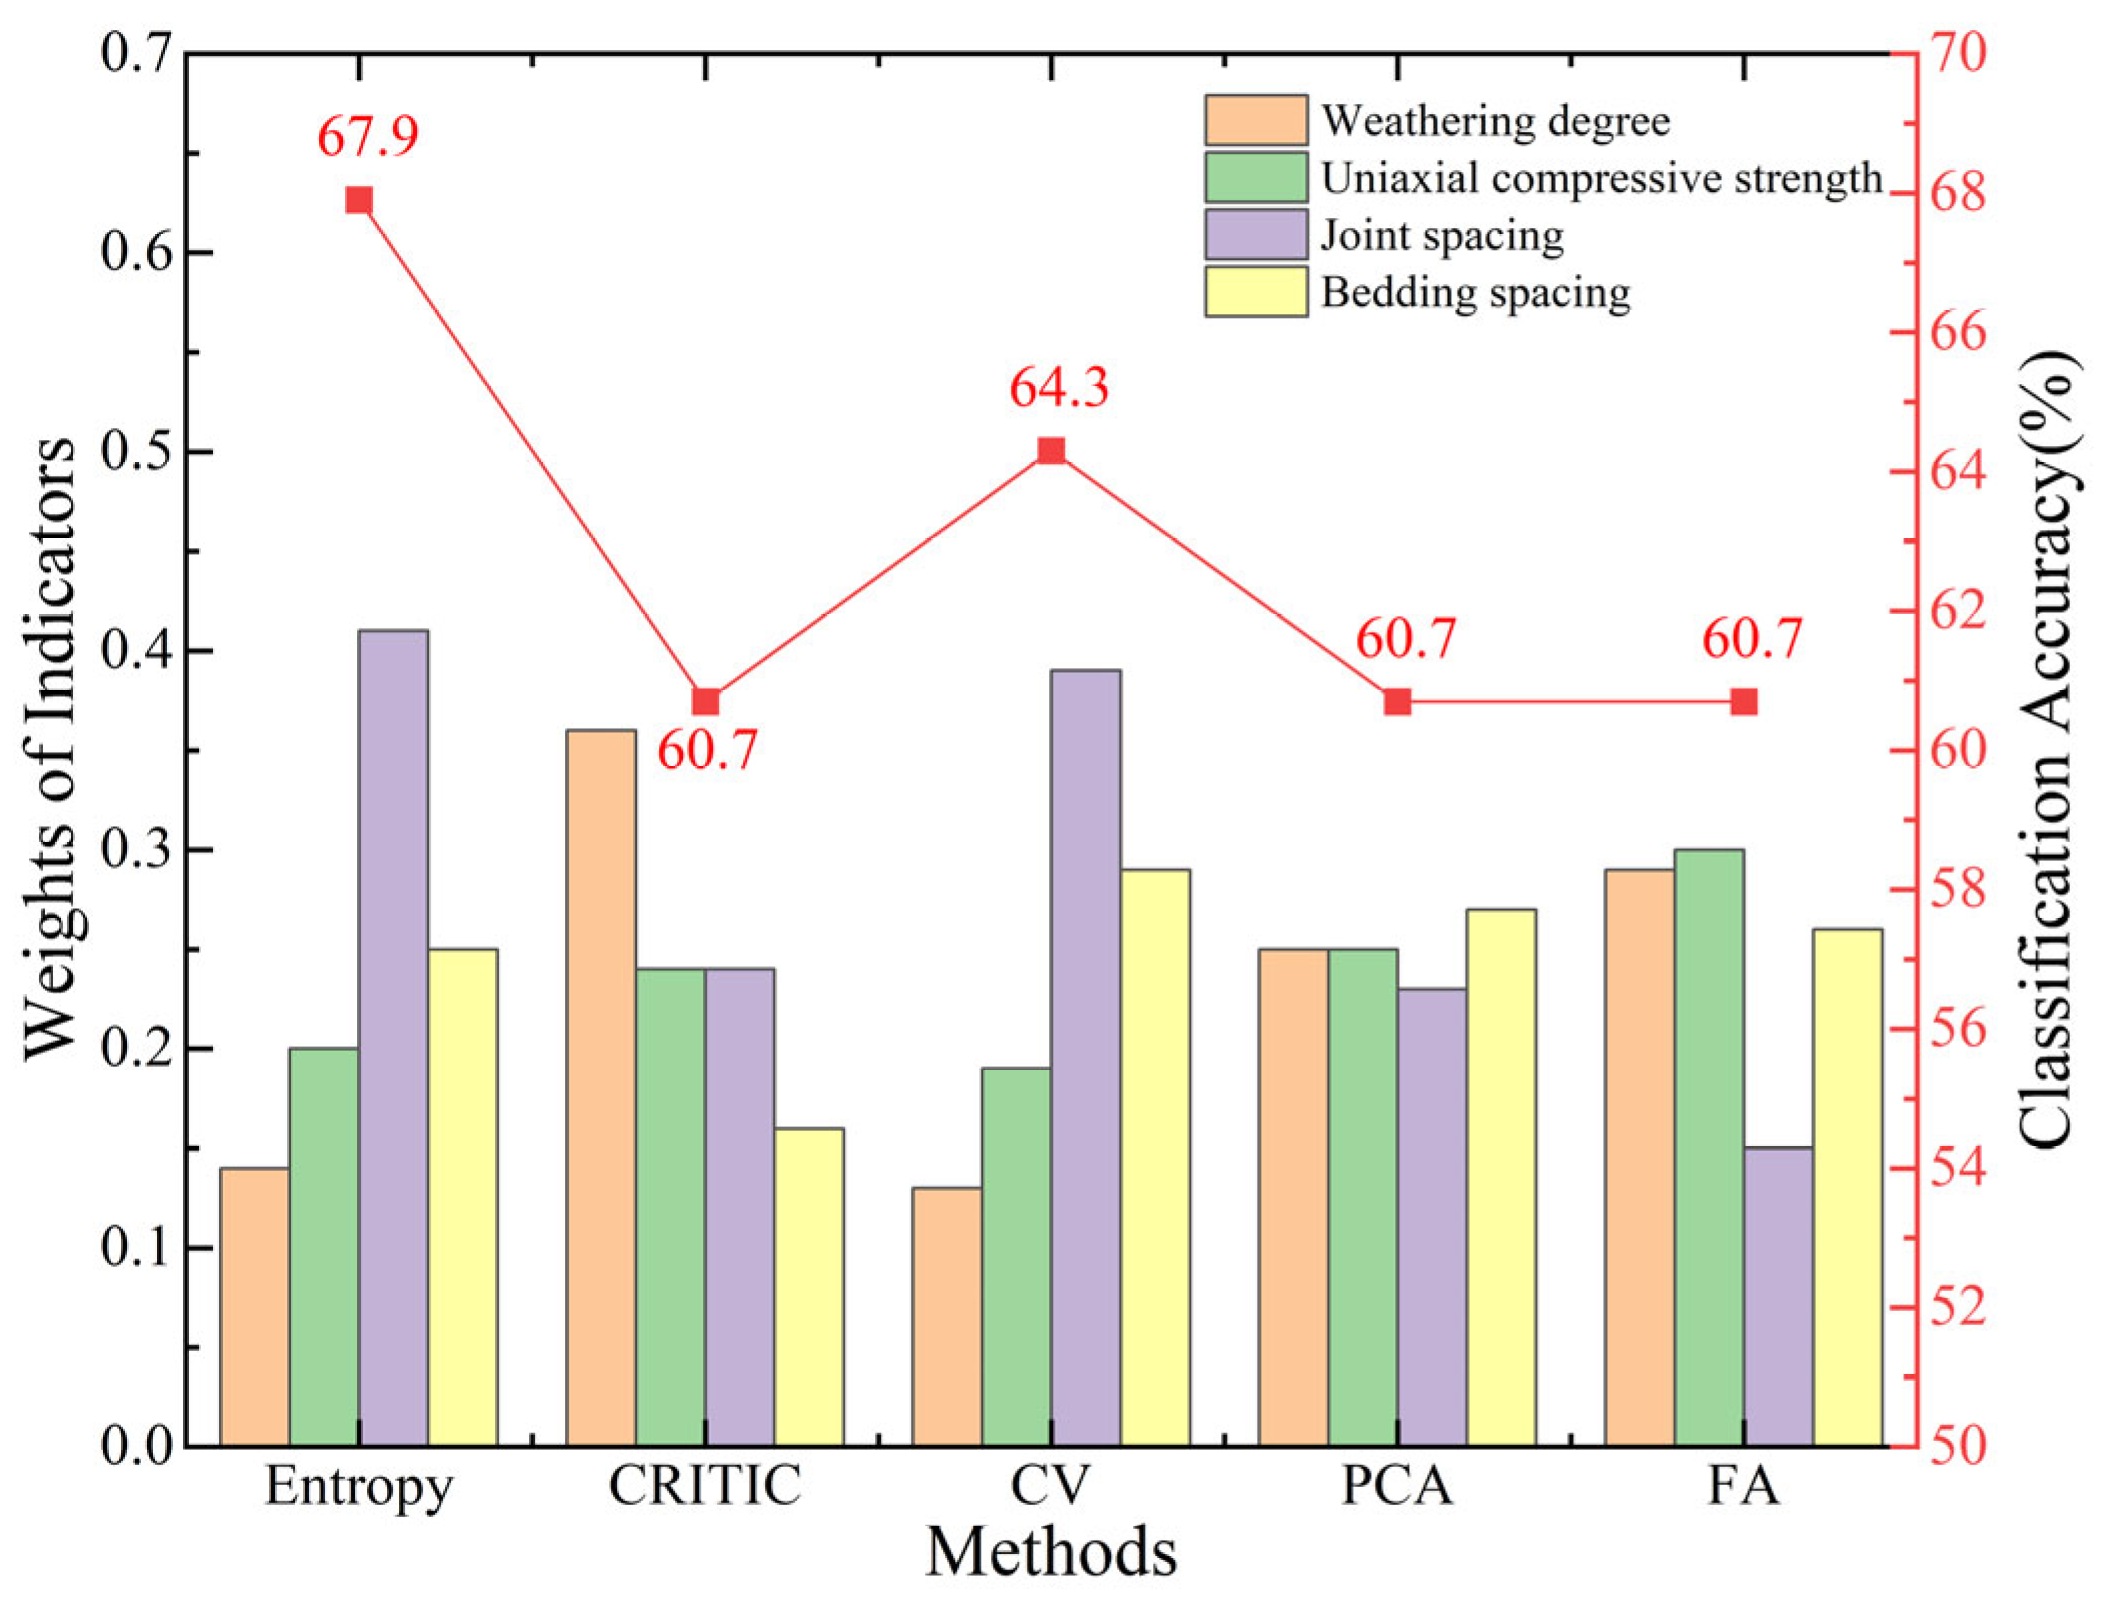
Based on objective data characteristics, this study calculates indicator weights using Equations (7)–(11) for EWM, Equations (12)–(14) for CV, Equations (15)–(17) for CRITIC, Equations (18)–(22) for PCA, and Equations (23)–(25) for FA. The indicator weights obtained by each method and their corresponding classification accuracies are presented in Table 4 and visualized in Figure 6. The indicator weights corresponding to the method with the highest classification accuracy are selected as the optimal weights under the objective weighting approach.
Accordingly, the optimal weights under the objective methods are: WD (0.14); UCS (0.20); JS (0.41); BS (0.25). It can be seen that, based on data characteristics, the indicators’ importance ranking from high to low is JS > BS > UCS > WD. Compared with subjective weights, there is some consistency in the ranking of core indicators, but differences exist in the emphasis on secondary indicators (UCS and WD), providing a multi-perspective reference for comprehensive evaluation.

4.1.3. Optimal Weights

Based on the integration of subjective and objective weights, this study determined the optimal weight of each indicator using the linear combination method (Equation (26)). The resulting optimal weights are WD (0.16), UCS (0.18), JS (0.34), and BS (0.32), ensuring that the data characteristics reflect objective patterns while also incorporating expert judgment, thus providing a reliable basis for subsequent diggability assessment.

4.2. Cloud Model

4.2.1. Single-Indicator Benchmark Cloud Model

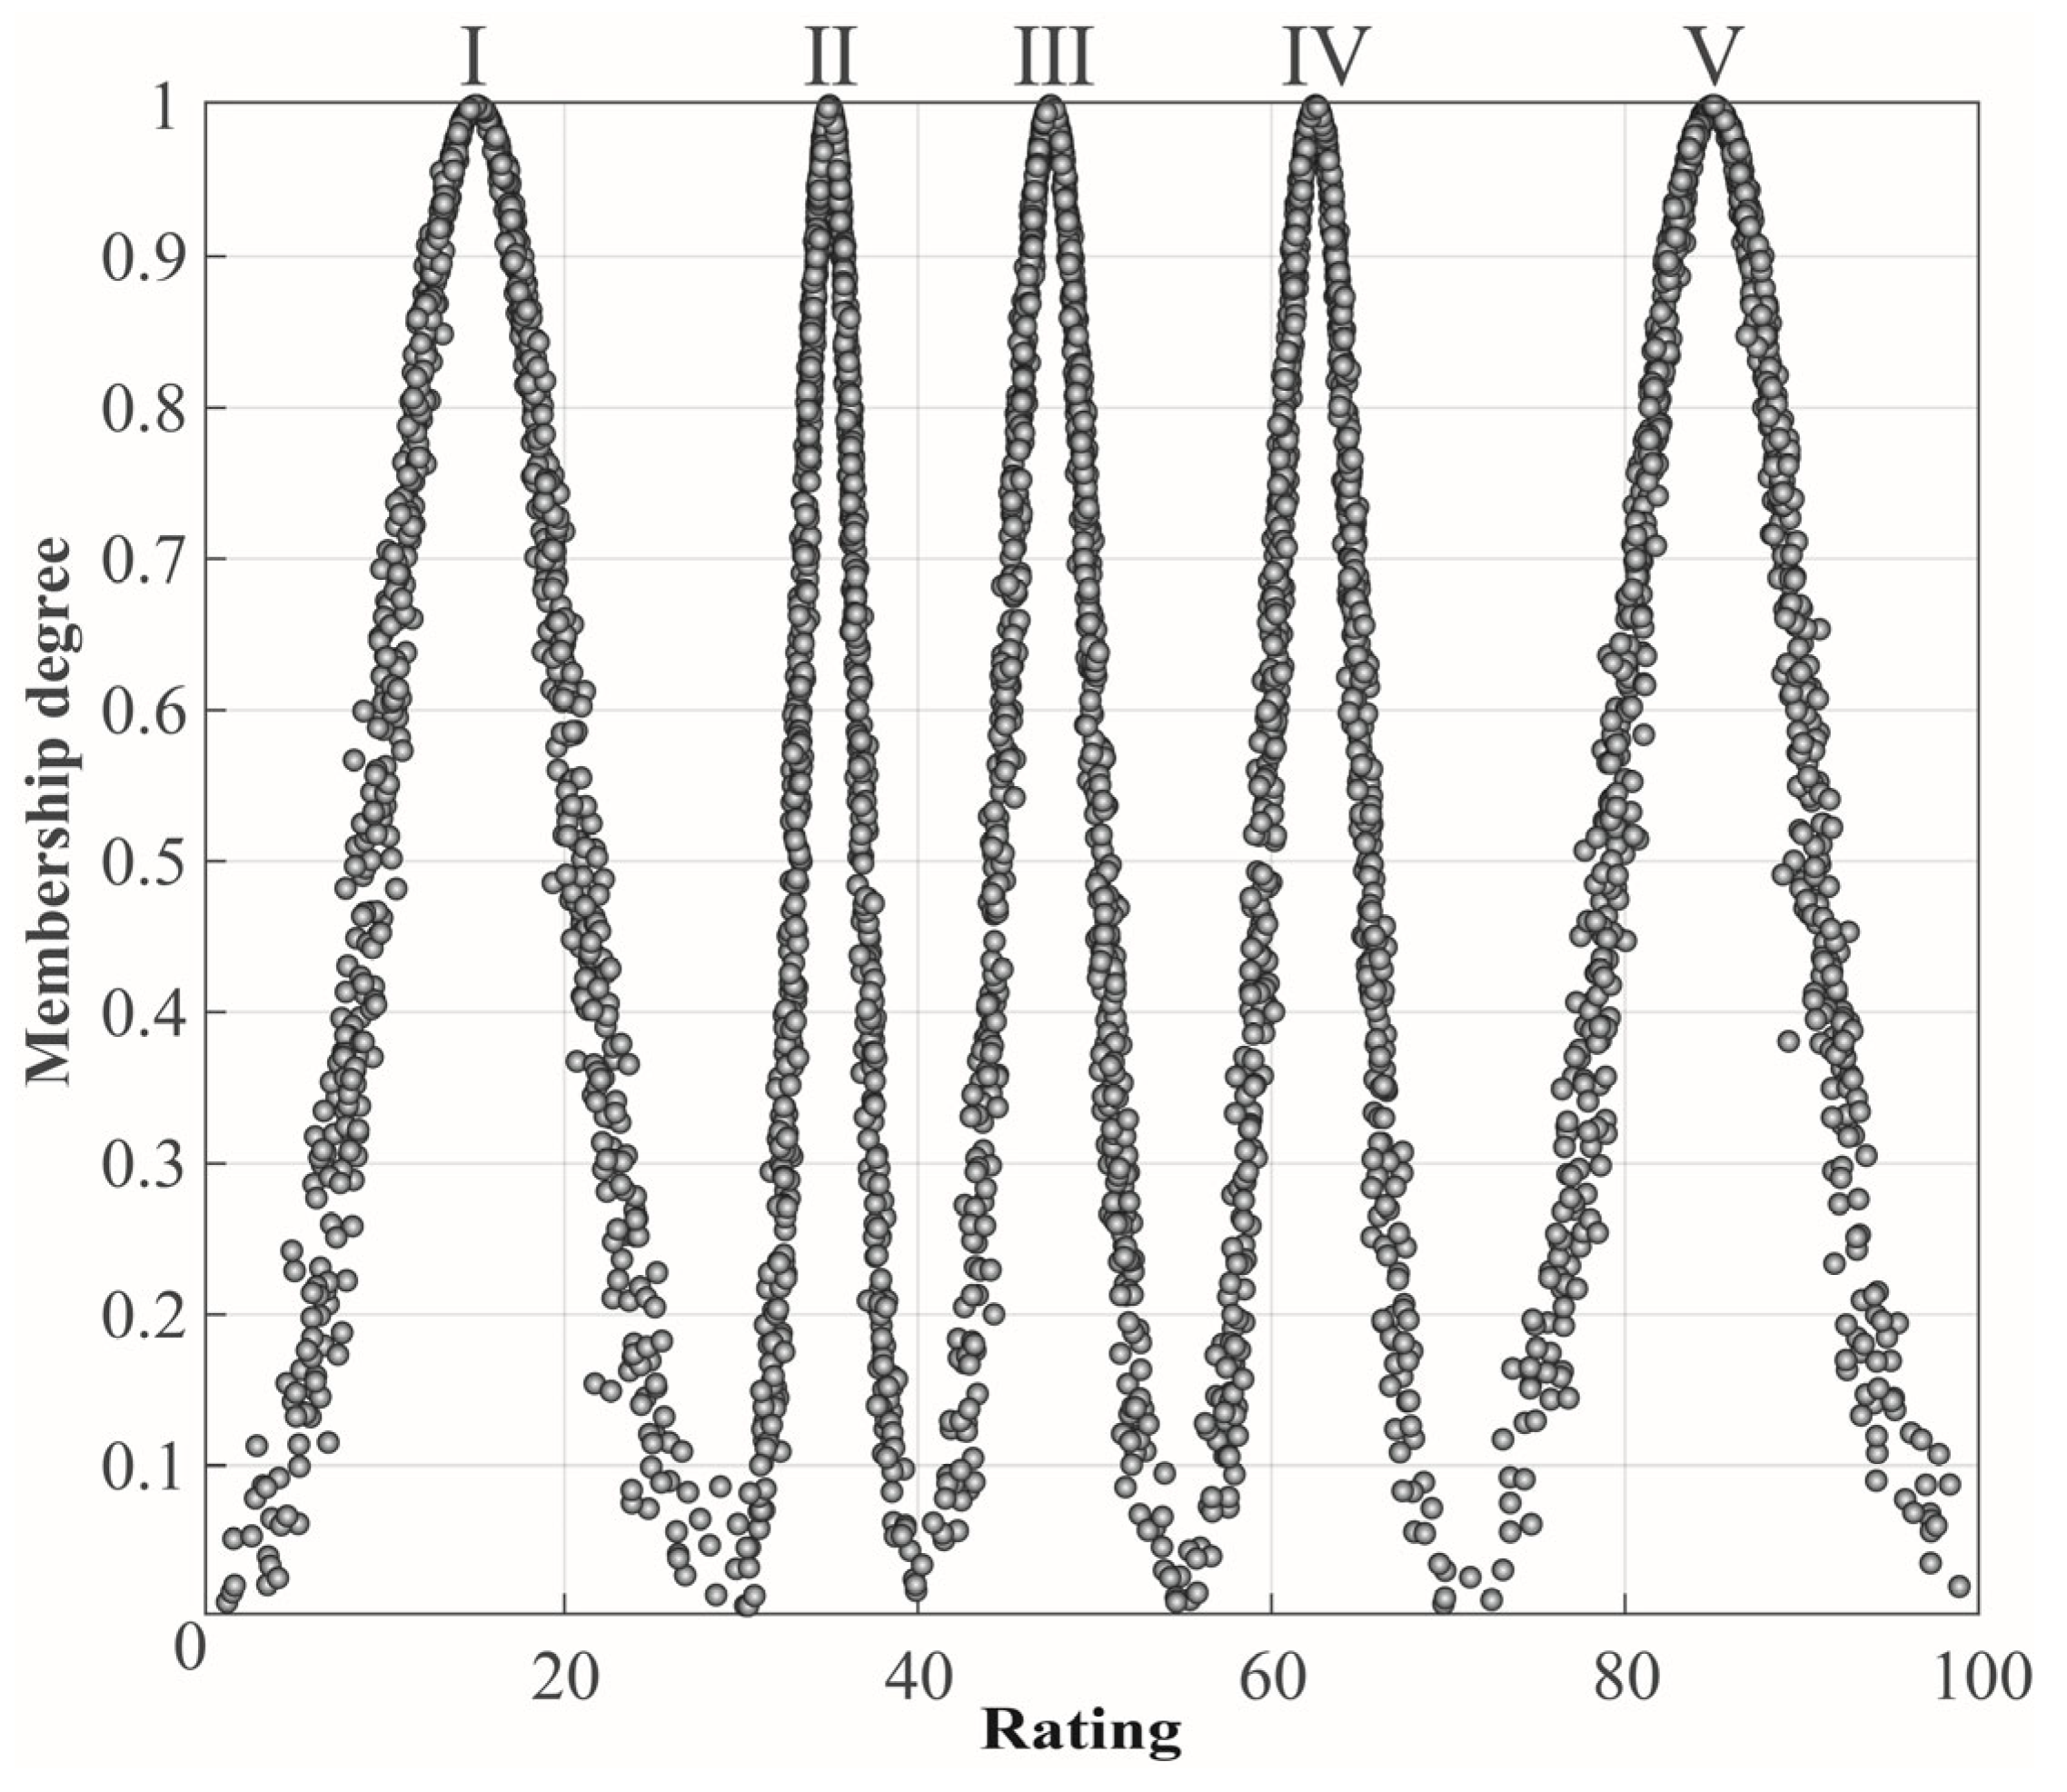
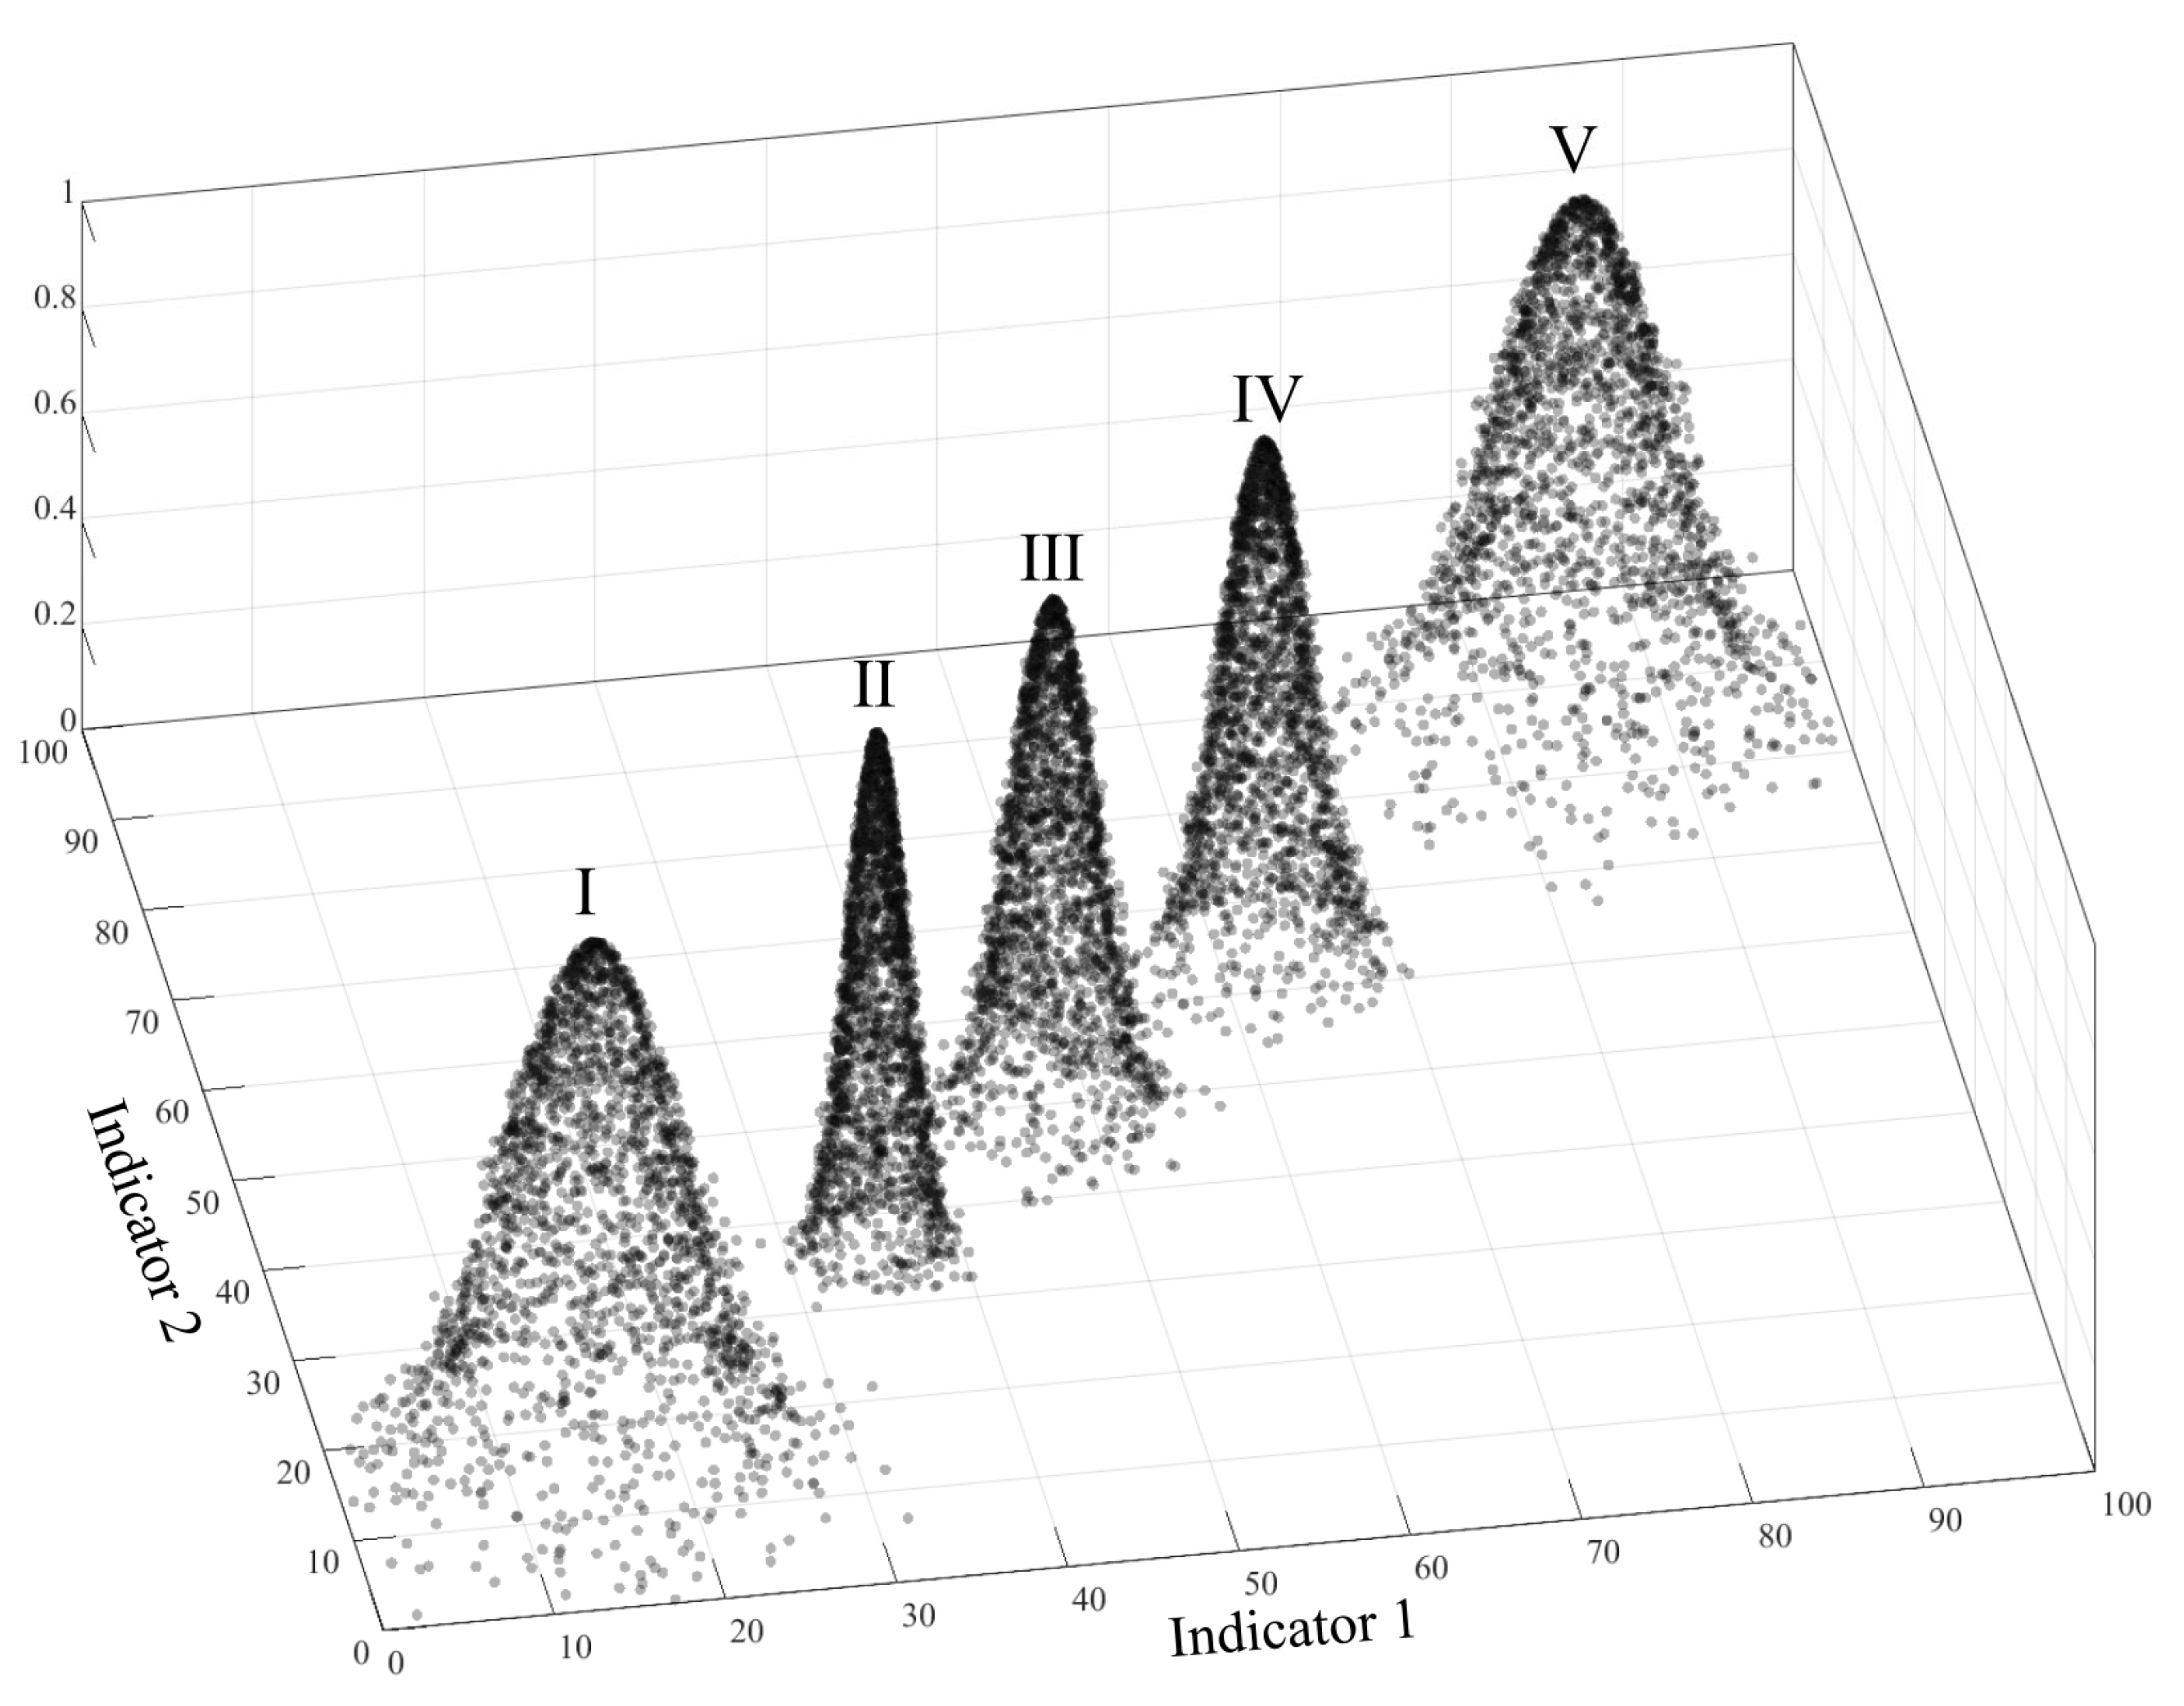
Based on the fuzzy scores corresponding to different diggability levels in Table 2, the cloud model parameters for the five levels are obtained, as shown in Table 5. Further, using these cloud model parameters and Equations (1)–(3) under the condition d = 1, cloud droplets are generated iteratively to ultimately construct the single-indicator benchmark cloud model (Figure 7). This cloud model serves as a reference for comparison in single-indicator evaluation of specific cases, and is used for assessing the diggability of actual cases.

4.2.2. Multi-Dimensional Benchmark Cloud Model

In the multi-indicator case, the parameters of the single-indicator benchmark cloud model are still used as the basis. Cloud droplets are iteratively generated using Equations (1)–(3) under the condition d = 2, following the generation principles of the multi-dimensional cloud model (Figure 3), ultimately producing the multi-dimensional benchmark cloud model (Figure 8). This cloud model serves as a reference for multi-indicator interaction evaluation.

4.3. Diggability Evaluation Based on Multi-Dimensional Cloud Model

4.3.1. Diggability Evaluation Results Based on Multi-Dimensional Cloud Model

The 56 collected sets of qualitative and quantitative data were first defuzzified and normalized according to Table 1 to obtain diggability scores. Using the optimally determined weights combining subjective and objective methods (WD: 0.16, UCS: 0.18, JS: 0.34, BS: 0.32), weighted calculations were applied to derive the multi-dimensional cloud model evaluation score for each case. Furthermore, the diggability classification for each case was obtained by dividing levels according to the interval of the symmetry axis of the corresponding generated cloud model (Table 6).
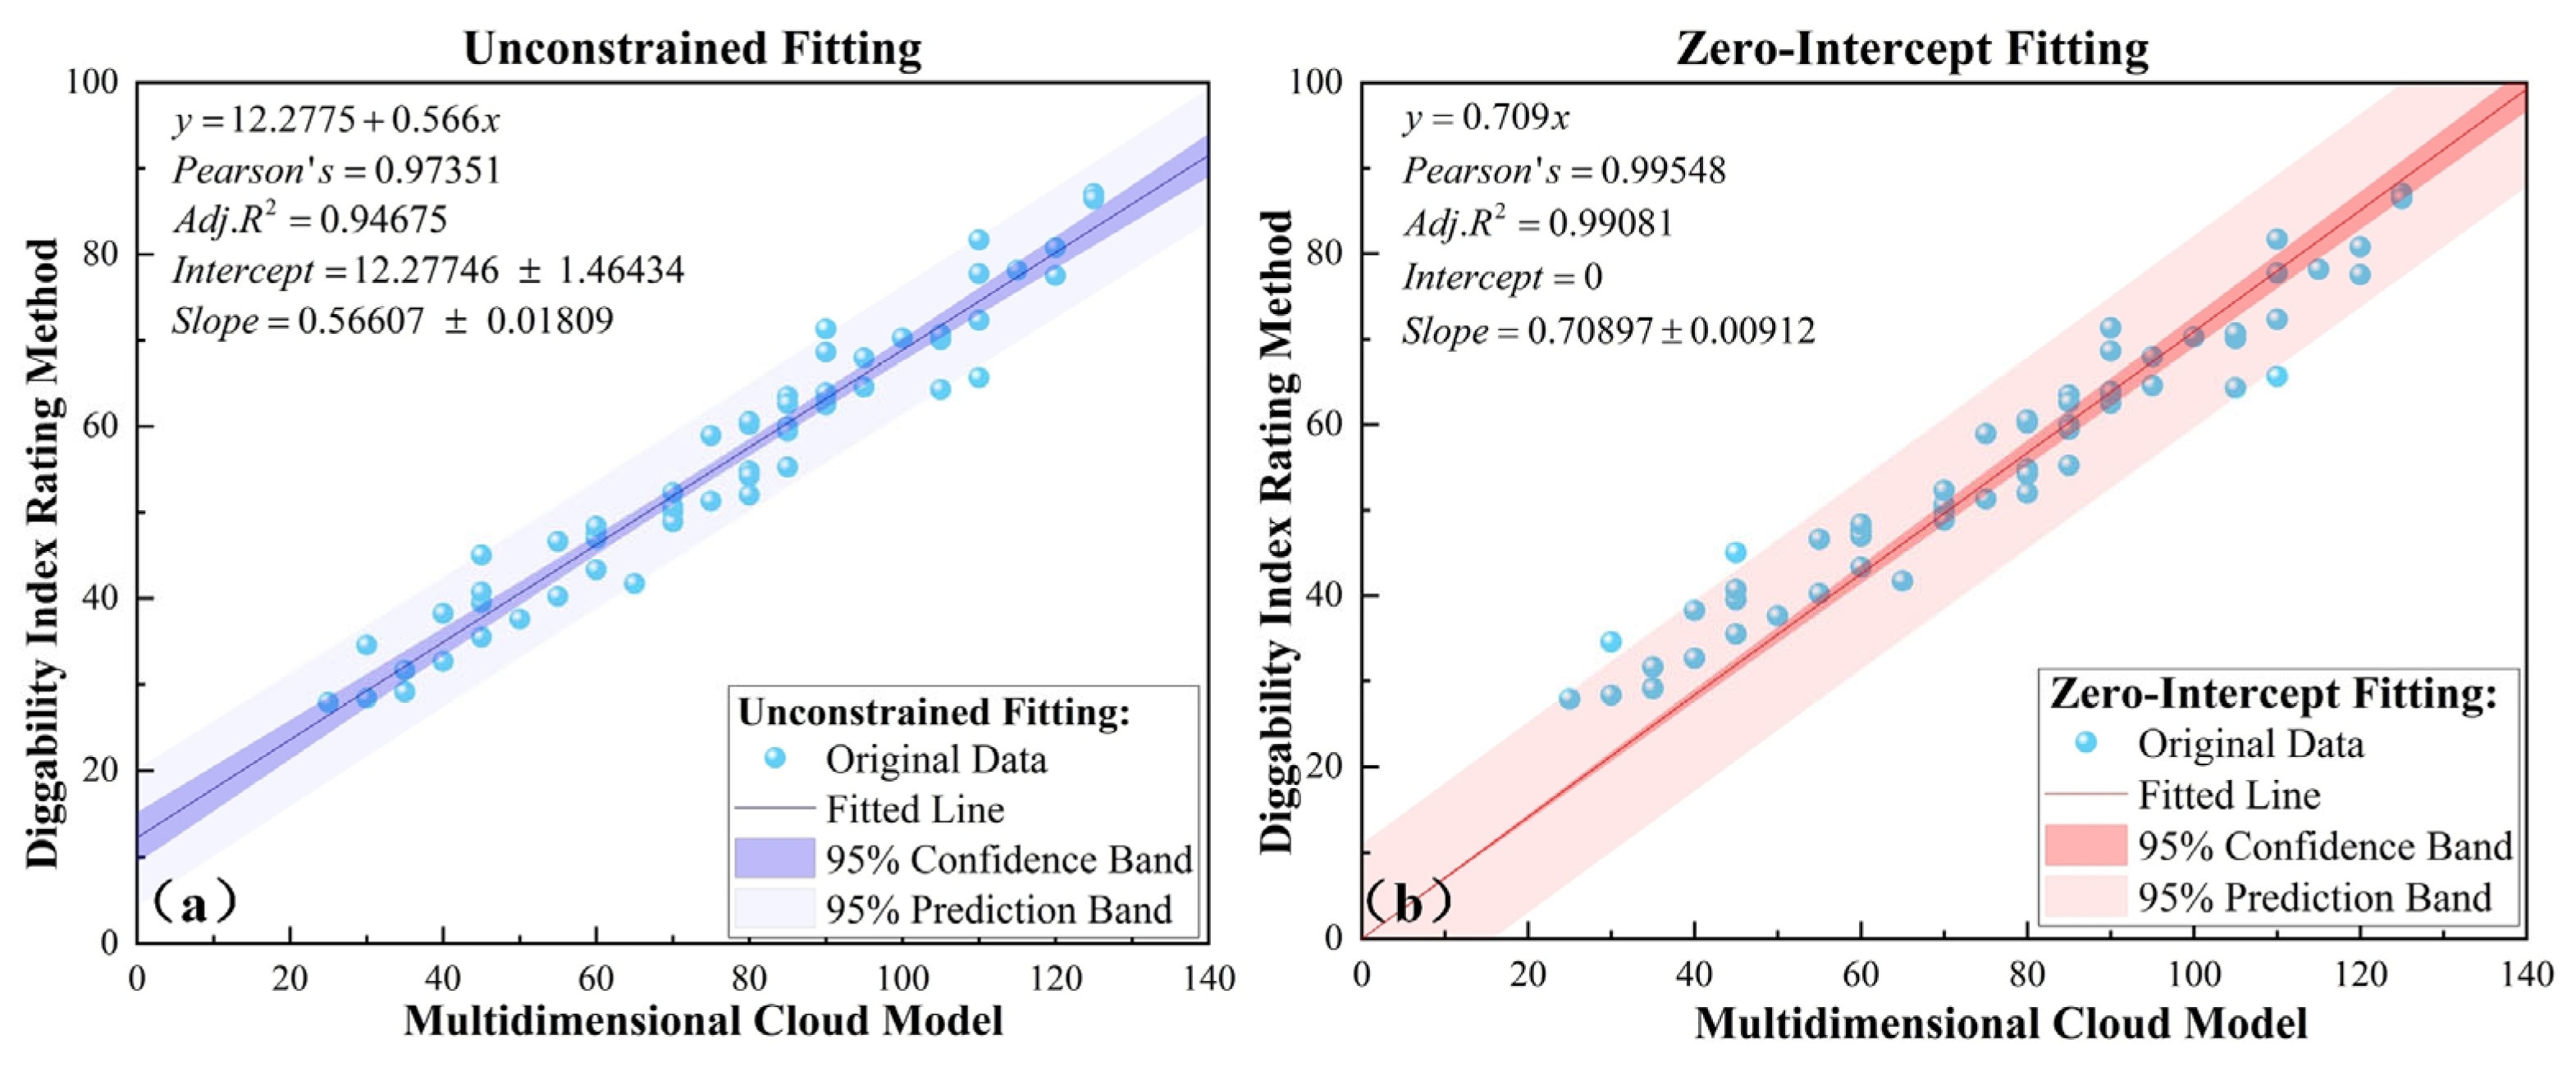
To verify the rationality and effectiveness of the proposed method, the evaluation results of the multi-dimensional cloud model were compared with the diggability grades and ratings obtained from the validated and reliable Diggability Index Rating Method. As shown in Table 6, the evaluation results of the two methods are consistent in most cases, indicating that the multi-dimensional cloud model can effectively reflect the diggability characteristics of rock masses. Furthermore, the diggability scores obtained by both methods were fitted against the Diggability Index, as illustrated in Figure 9, where Figure 9a presents the unrestricted linear fitting and Figure 9b shows the fitting constrained to pass through the origin.
The coefficient of determination R2 is calculated as:
R 2 = 1 i = 1 n ( y i y ^ i ) 2 i = 1 n ( y i y ¯ i ) 2
where y i is the observed value, y ^ i is the corresponding fitted value, y ¯ i is the mean of the observed values, and n is the number of data points. Here, the numerator represents the residual sum of squares (RSS) and the denominator represents the total sum of squares (TSS). An R2 value closer to 1 indicates a better fit.
The zero-intercept fitting exhibited higher quantitative performance (R2 = 0.991), demonstrating that this origin-constrained approach provides a more reasonable and accurate evaluation relationship. Accordingly, a refined conversion formula between the diggability scores obtained by this method and the Diggability Index was established. To clearly present this correlation, the zero-intercept fitting is also expressed as a separate equation:
D I = 0.709 × S
where DI is the Diggability Index, S is the diggability score obtained by the proposed method, and 0.709 is the fitting coefficient.

4.3.2. Diggability Evaluation Analysis Based on Single-Indicator Cloud Model

For cases where the multi-dimensional cloud model grading results differ from the diggability index grading (site5, site17, site23, and site41), single-indicator cloud models were plotted for interpretive analysis (Figure 10).
According to Table 6, Sites 5, 17, 23, and 41 were classified as misclassified under the absolute Diggability Index (DI) grading. However, the cloud model analysis in Figure 10 indicates that fuzzy evaluation of diggability is not a simple “correct/incorrect” issue. Taking Site 5 as an example, it is classified as “Marginal Without Blasting” in Table 6, yet its probability distribution in Figure 10 clearly also includes the “Very Difficult” grade, which corresponds to the actual DI classification. Therefore, while the traditional absolute classification appears incorrect, the cloud model-based fuzzy evaluation accurately reflects the site’s diggability and can be considered basically correct. The same applies to Sites 17, 23, and 41.
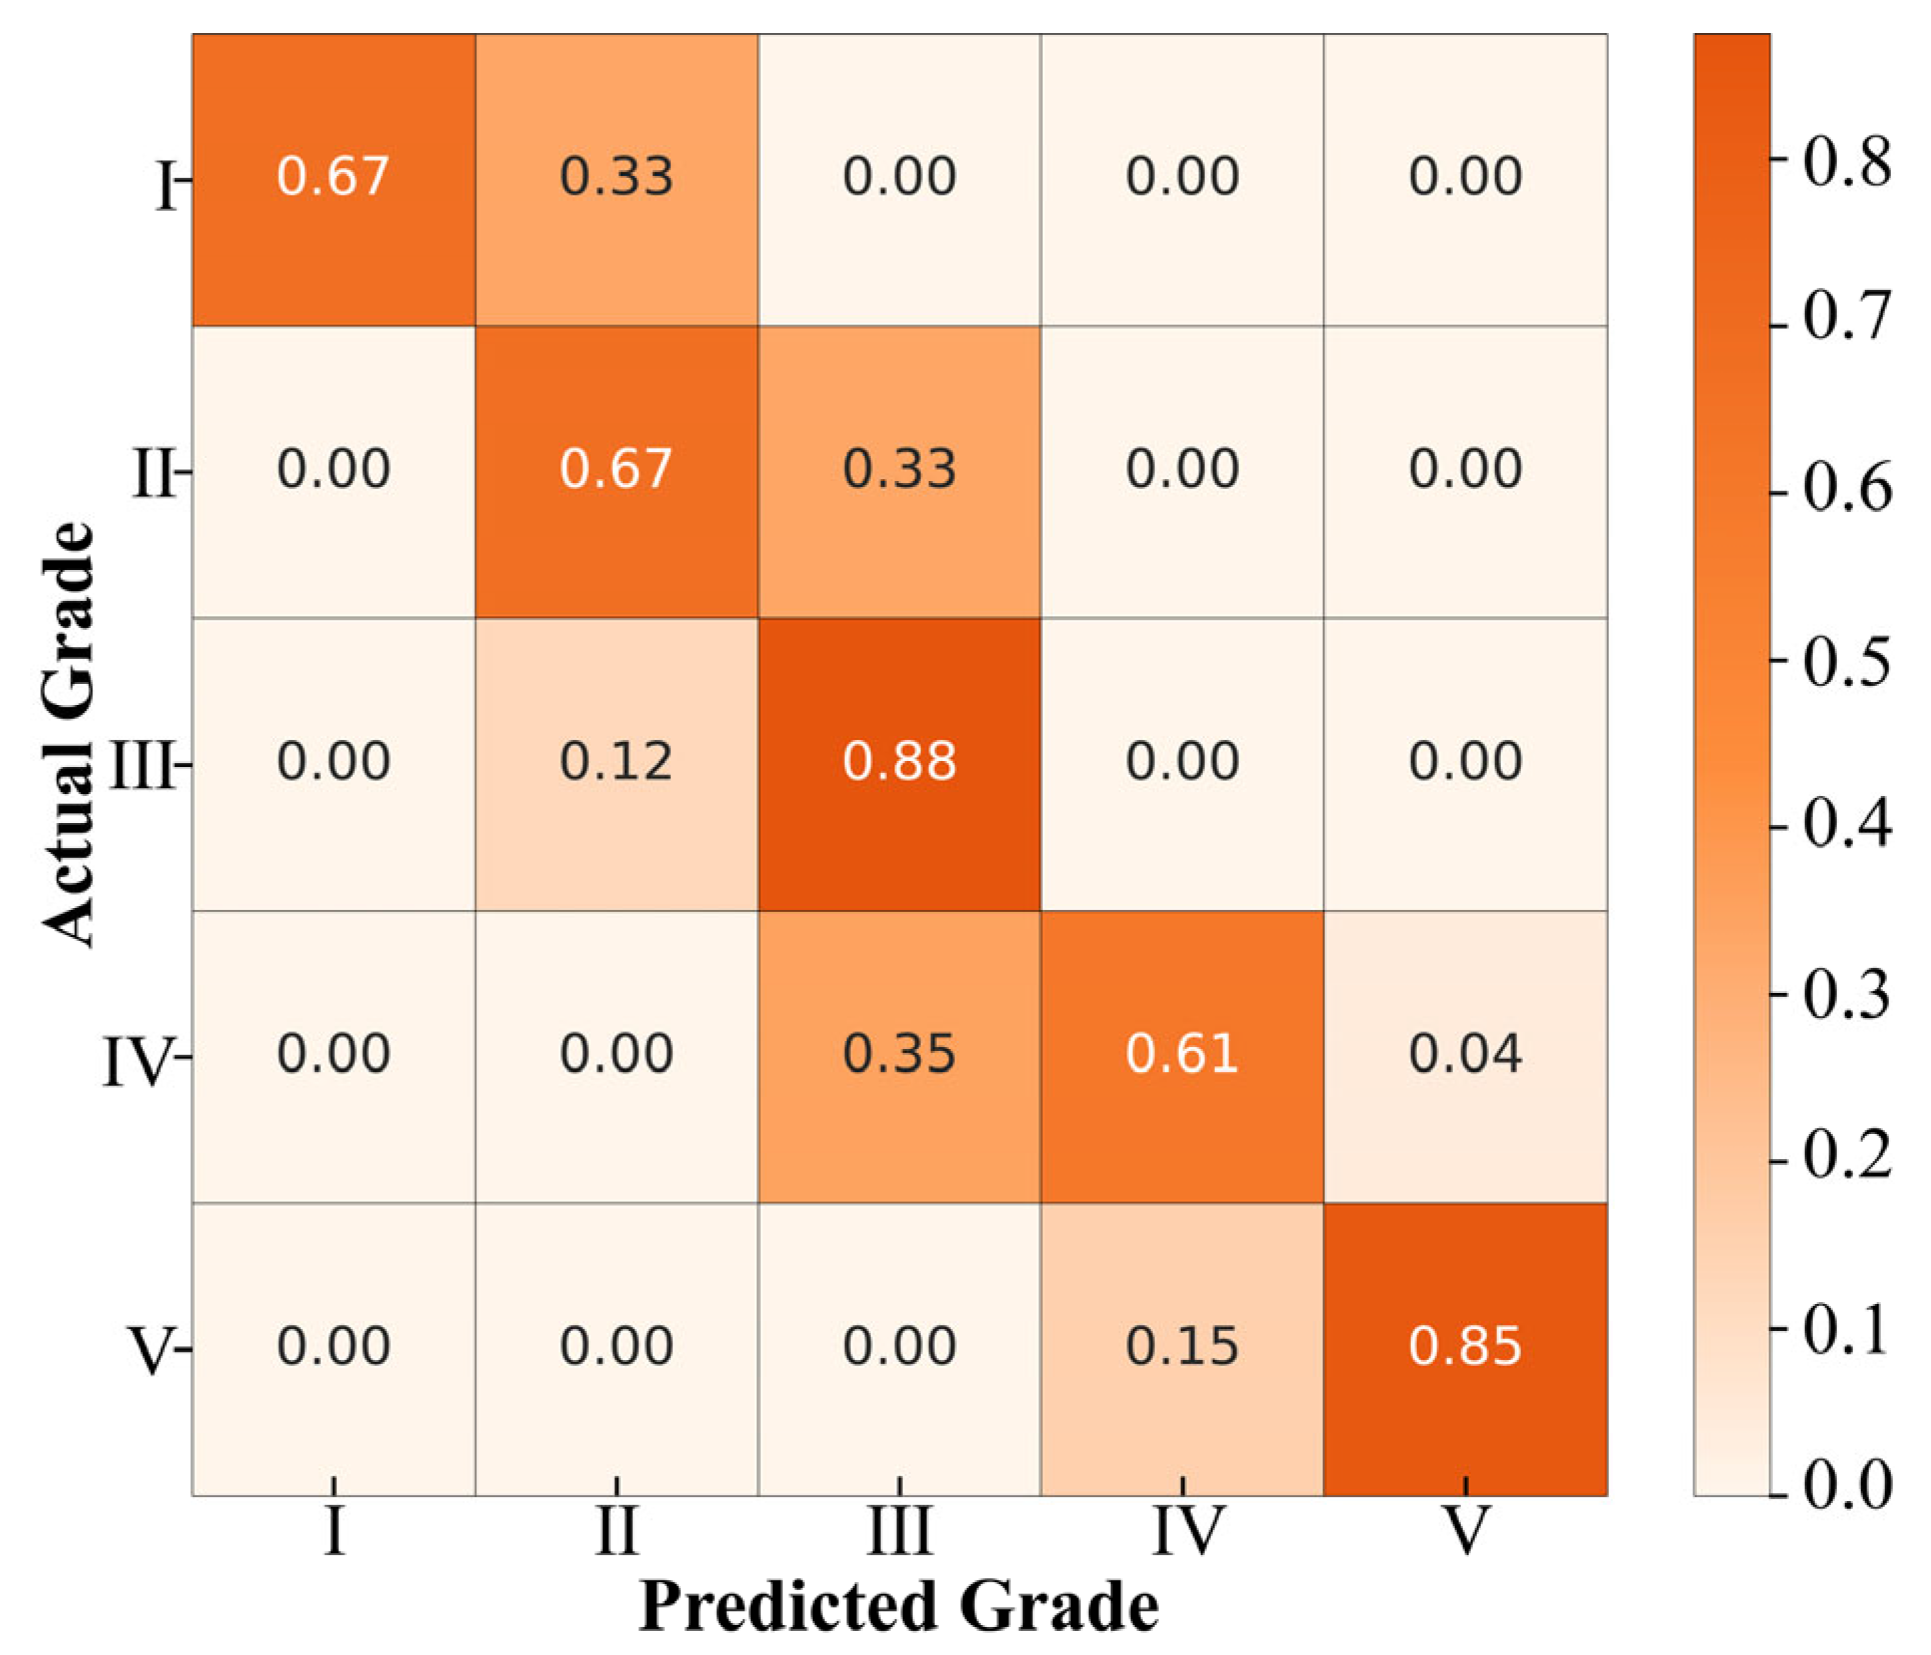
A confusion matrix heatmap of diggability levels was plotted for all evaluation cases in Table 6 (Figure 11). For the absolute accuracy of individual levels, level III (Difficult) achieved the highest accuracy at 0.88, while level IV (Very Difficult) had the lowest accuracy at 0.61, with errors primarily distributed in adjacent intervals: 0.35 in level III (Difficult) and 0.04 in level III (Marginal Without Blasting). The accuracy of other levels falls between these two values.
It was observed that all classification errors occurred only in level intervals adjacent to the actual levels, with no severe deviations spanning multiple levels. Accordingly, the cloud model method can reasonably reflect the uncertainty and fuzziness of samples during evaluation, offering stronger rationality and interpretability compared with traditional interval division methods.
Regarding overall evaluation accuracy, when measured by absolute level accuracy (Table 6), the overall accuracy was 71.4%. However, when assessed using the cloud model-based fuzzy evaluation (distribution shown in Figure 10), the comprehensive accuracy reached 100%, meaning that all cases classified as failures in absolute evaluation still had cloud model distributions that included the correct diggability levels (Table 7). This further highlights the potential value of adjacent-level classification errors observed in Figure 11 and demonstrates the superiority of the cloud model in handling transitional issues between adjacent levels and providing richer evaluation information.

4.3.3. Analysis of Diggability Evaluation Based on Multi-Dimensional Cloud Model

In the further analysis stage, the evaluation results of the corresponding case (site 5) were introduced into the multi-dimensional cloud model to construct pairwise interactions among the four main indicators (WD, UCS, JS, and BS), forming the diggability multi-dimensional cloud model for the case (Figure 12).
The black point cloud corresponds to the multi-dimensional cloud model reference cloud (Figure 8), while the red point cloud represents the two-indicator interaction cloud used to reveal specific characteristics of the evaluation results.
Taking the WD-UCS interaction cloud model as an example, it can be observed that the cloud droplets are distributed noticeably higher along the UCS dimension, indicating that the case has relatively higher diggability scores in this indicator dimension. Under the combined effect in this region, although both WD and UCS affect the diggability level, the WD indicator demonstrates greater sensitivity in this interaction, thus requiring particular attention in practical evaluation and decision-making. Similarly, in this case, the BS-JS interaction indicates that the BS indicator plays a more critical role than JS in increasing diggability difficulty. Other indicator combinations can similarly be interpreted through such interaction analyses, thereby providing strong support for comprehensively understanding the synergistic mechanisms among different indicators and optimizing evaluation indicators.

5. Conclusions

This study established a scientific evaluation system for the diggability of mining rock masses and provided corresponding quantitative parameters. A new method for comprehensive diggability evaluation and grading of mining rock masses was proposed. For indicator weighting, a combination of subjective and objective methods was used, taking into account both expert judgment and data characteristics, providing a reliable basis for comprehensive evaluation. Single-indicator cloud models were used to alleviate difficulties in grading diggability at transitional values between adjacent intervals, while multi-dimensional cloud models considered interactions among indicators, achieving optimized indicator interactions and enhancing the interpretability of diggability grades. Comparison with the Diggability Index method indicates that the proposed approach has high reliability and validity. The main conclusions are as follows:
(1)
A diggability evaluation system for rock masses was established, and diggability grade criteria under different conditions were defined.
(2)
Indicator weights were determined using a combination of subjective and objective methods, with the final optimal weights being WD (0.16), UCS (0.18), JS (0.34), and BS (0.32), balancing expert experience and data characteristics.
(3)
Visualization using single-indicator cloud models effectively mitigated the issue of transitional intervals, addressing the difficulty of grading transitional values.
(4)
Multi-dimensional cloud models considered interactions among indicators, optimizing indicator interactions and enhancing the interpretability of diggability grades.
(5)
Evaluation results from multi-dimensional cloud models were highly consistent with the Diggability Index method (R2 = 0.991), with an absolute level accuracy of 74% and a cloud-model-based accuracy of 100%, validating the reliability and applicability of the proposed method.
Although the proposed method demonstrates good reliability and applicability in evaluating the diggability of rock masses, certain limitations should be acknowledged. The dataset used in this study is primarily derived from 56 open-pit mines in Türkiye and the United Kingdom, which may constrain the model’s applicability under other geological conditions, mineral types, and underground mining scenarios. Moreover, the combined subjective–objective weighting and cloud model approaches, while effective in addressing indicator uncertainty, may still be affected by expert subjectivity and parameter sensitivity. Future research will focus on expanding data sources and optimizing the model to further enhance its robustness and generalization.

Author Contributions

Conceptualization, S.Y. and X.L.; methodology, S.Y. and X.L.; software, S.Y.; validation, X.L. and M.K.; formal analysis, X.L. and M.K.; data curation, X.L.; writing—original draft preparation, S.Y.; writing—review and editing, J.Z. and M.K.; visualization, S.Y. and X.L.; supervision, J.Z. and M.K.; funding acquisition, J.Z. All authors have read and agreed to the published version of the manuscript.

Funding

This research was partially supported by the Deep Earth Probe and Mineral Resources Exploration—National Science and Technology Major Project (2025ZD1010703) and the National Natural Science Foundation Project of China (52474121 and 42177164).

Data Availability Statement

The data used in this study were obtained from previously published sources [6,14], which are openly available and properly cited within the manuscript.

Conflicts of Interest

The authors declare no conflicts of interest.

References

  1. Stille, H.; Palmström, A. Practical Use of the Concept of Geotechnical Categories in Rock Engineering. Tunn. Undergr. Space Technol. 2018, 79, 1–11. [Google Scholar] [CrossRef]
  2. Goktan, R.M.; Eskikaya, S. Prediction of Ripping Machine Performance in Terms of Rockmass Properties: Technical Paper. Civ. Eng. S. Afr. 1991, 1991, 13–14. [Google Scholar]
  3. Karpuz, C. A Classification System for Excavation of Surface Coal Measures. Min. Sci. Technol. 1990, 11, 157–163. [Google Scholar] [CrossRef]
  4. Howarth, D.F. Mechanical Rock Excavation—Assessment of Cuttability and Borability. Int. J. Rock Mech. Min. Sci. Geomech. Abstr. 1989, 26, A197. [Google Scholar] [CrossRef]
  5. Bilim, N. Determination of Drillability of Some Natural Stones and Their Association with Rock Properties. Sci. Res. Essays 2011, 6, 382–387. [Google Scholar]
  6. Scoble, M.J.; Muftuoglu, Y.V. Derivation of a Diggability Index for Surface Mine Equipment Selection. Min. Sci. Technol. 1984, 1, 305–322. [Google Scholar] [CrossRef]
  7. Santos, V.; Da Silva, P.F.; Brito, M.G. Estimating RMR Values for Underground Excavations in a Rock Mass. Minerals 2018, 8, 78. [Google Scholar] [CrossRef]
  8. Rusydy, I.; Al-Huda, N. New Rock Mass Classifications for Limestone of the Woyla Group and Its Empirical Relationship in Aceh Province, Indonesia. Carbonates Evaporites 2021, 36, 15. [Google Scholar] [CrossRef]
  9. Xu, J.; Luo, S.; Xiao, X. Review of the Experimental Studies of the Cracking Behaviors of Fractured Rocks under Compression. Geohazard Mech. 2024, 2, 59–82. [Google Scholar] [CrossRef]
  10. Hekmatnejad, A.; Rojas, E.; Saavedra, C.; Crespin, B. Presentation of the Universal Discontinuity Index (UDi) System and Its Application to Predict the Geometry of over-Excavation along a Tunnel at New El Teniente Mine. Eng. Geol. 2022, 311, 106901. [Google Scholar] [CrossRef]
  11. Meng, Y.; Jing, H.; Liu, X.; Yin, Q.; Zhang, L.; Liu, H. Experimental and Numerical Investigation on the Effect of Bedding Plane Properties on Fracture Behaviour of Sandy Mudstone. Theor. Appl. Fract. Mech. 2021, 114, 102989. [Google Scholar] [CrossRef]
  12. Rotimi, O.J.; Atunbi, J.F.; Enaworu, E.; Ameliko, A.A. Rippability Potential of the Near Surface Deposits of Jubilee Homes Parkland, Southwest, Nigeria. J. Environ. Earth Sci. 2015, 5, 85. [Google Scholar]
  13. Ismail, M.A.M.; Kumar, N.S.; Abidin, M.H.Z.; Madun, A. Rippability Assessment of Weathered Sedimentary Rock Mass Using Seismic Refraction Methods. J. Phys. Conf. Ser. 2018, 995, 012105. [Google Scholar] [CrossRef]
  14. Iphar, M.; Goktan, R.M. An Application of Fuzzy Sets to the Diggability Index Rating Method for Surface Mine Equipment Selection. Int. J. Rock Mech. Min. Sci. 2006, 43, 253–266. [Google Scholar] [CrossRef]
  15. Zhou, J.; Chen, C.; Armaghani, D.J.; Ma, S. Developing a Hybrid Model of Information Entropy and Unascertained Measurement Theory for Evaluation of the Excavatability in Rock Mass. Eng. Comput. 2022, 38, 247–270. [Google Scholar] [CrossRef]
  16. Bendezu, M.; Romanel, C.; Roehl, D. Finite Element Analysis of Blast-Induced Fracture Propagation in Hard Rocks. Comput. Struct. 2017, 182, 1–13. [Google Scholar] [CrossRef]
  17. Pinheiro, M.; Emery, X.; Miranda, T.; Lamas, L.; Espada, M. Modelling Geotechnical Heterogeneities Using Geostatistical Simulation and Finite Differences Analysis. Minerals 2018, 8, 52. [Google Scholar] [CrossRef]
  18. Zhang, X.; Xia, X.; Li, H.; Fu, S. Damage Mechanism and Parameter Optimization of Rock Mass Blasting Under High In-Situ Stress. In Proceedings of the 58th U.S. Rock Mechanics/Geomechanics Symposium, Golden, CO, USA, 23–26 June 2024; OnePetro: Richardson, TX, USA, 2024. [Google Scholar]
  19. Yaghoubi, E.; Yaghoubi, E.; Khamees, A.; Vakili, A.H. A Systematic Review and Meta-Analysis of Artificial Neural Network, Machine Learning, Deep Learning, and Ensemble Learning Approaches in Field of Geotechnical Engineering. Neural Comput. Appl. 2024, 36, 12655–12699. [Google Scholar] [CrossRef]
  20. Tiryaki, B. Application of Artificial Neural Networks for Predicting the Cuttability of Rocks by Drag Tools. Tunn. Undergr. Space Technol. 2008, 23, 273–280. [Google Scholar] [CrossRef]
  21. Huang, S.; Zhou, J. Cutting—Edge Soft Computing Technologies for Rock Mass Excavatability: Transforming Prediction with Hybrid GA—MLP and GEP—Based Criteria. Rock Mech. Rock Eng. 2025. [Google Scholar] [CrossRef]
  22. Kuznetsova, N.; Zhgun, D.; Golovanevskiy, V. Plasma Blasting of Rocks and Rocks-like Materials: An Analytical Model. Int. J. Rock Mech. Min. Sci. 2022, 150, 104986. [Google Scholar] [CrossRef]
  23. Niu, G.; He, X.; Xu, H.; Dai, S. Development of Rock Classification Systems: A Comprehensive Review with Emphasis on Artificial Intelligence Techniques. Eng 2024, 5, 217–245. [Google Scholar] [CrossRef]
  24. Hartlieb, P.; Bock, S. Theoretical Investigations on the Influence of Artificially Altered Rock Mass Properties on Mechanical Excavation. Rock Mech. Rock Eng. 2018, 51, 801–809. [Google Scholar] [CrossRef]
  25. Zhao, H.; Chen, B.; Li, S.; Li, Z.; Zhu, C. Updating the Models and Uncertainty of Mechanical Parameters for Rock Tunnels Using Bayesian Inference. Geosci. Front. 2021, 12, 101198. [Google Scholar] [CrossRef]
  26. Liu, G.; Zhou, C.; Feng, K.; Jiang, Q.; Li, S.; Bao, H.; Li, A. Probabilistic Evaluation Method for the Stability of Large Underground Cavern Considering the Uncertainty of Rock Mass Mechanical Parameters: A Case Study of Baihetan Underground Powerhouse Project. Eng. Geol. 2024, 340, 107660. [Google Scholar] [CrossRef]
  27. Alipenhani, B.; Bakhshandeh Amnieh, H.; Majdi, A. Evaluation of Effective Geomechanical Parameters in Rock Mass Cavability Using Different Intelligent Techniques. Int. J. Min. Geo-Eng. 2024, 58, 307–313. [Google Scholar] [CrossRef]
  28. Yao, S.; Zhou, J.; Khandelwal, M.; Lawal, A.I.; Li, C.; Onifade, M.; Kwon, S. Intelligent Decision Framework for Booster Fan Optimization in Underground Coal Mines: Hybrid Spherical Fuzzy-Cloud Model Approach Enhancing Ventilation Safety and Operational Efficiency. Machines 2025, 13, 367. [Google Scholar] [CrossRef]
  29. Zhou, J.; Chen, C.; Wei, C.; Du, K. An Improved Connection Cloud Model of an Updated Database: A Multicriteria Uncertainty Model for Coal Burst Liability Evaluation. Nat. Resour. Res. 2022, 31, 1687–1704. [Google Scholar] [CrossRef]
  30. Guo, D.-S.; Meng, F.-Y.; Wu, H.-N.; Yang, X.-X.; Liu, Z. Risk Assessment of Shield Tunneling Crossing Building Based on Variable Weight Theory and Cloud Model. Tunn. Undergr. Space Technol. 2024, 145, 105593. [Google Scholar] [CrossRef]
  31. Barton, N. Suggested Methods for the Quantitative Description of Discontinuities in Rock Masses: International Society for Rock Mechanics. Int. J. Rock Mech. Min. Sci. Geomech. Abstr. 1978, 16, 22. [Google Scholar]
  32. Li, D.; Liu, C.; Gan, W. A New Cognitive Model: Cloud Model. Int. J. Intell. Syst. 2009, 24, 357–375. [Google Scholar] [CrossRef]
  33. Li, S.; Wang, G.; Yang, J. Survey on Cloud Model Based Similarity Measure of Uncertain Concepts. CAAI Trans. Intell. Technol. 2019, 4, 223–230. [Google Scholar] [CrossRef]
  34. Gong, S.; Yao, S.; Xi, F.; Liu, J.; Ren, X.; Niu, D.; Ding, J.; Zhang, H.; Wang, J.; Wang, S. A Comparison of Research Methods to Determine the Sustainability of Mineral Resources in Henan Province Based on Cloud Analysis. Sustainability 2022, 14, 15834. [Google Scholar] [CrossRef]
  35. Yang, J.; Han, J.; Wan, Q.; Xing, S.; Chen, F. A Novel Similarity Measurement for Triangular Cloud Models Based on Dual Consideration of Shape and Distance. PeerJ Comput. Sci. 2023, 9, e1506. [Google Scholar] [CrossRef]
  36. Deng, Y.; Liu, S.; Zhang, W.; Wang, L.; Wang, J. General Multidimensional Cloud Model and Its Application on Spatial Clustering in Zhanjiang, Guangdong. J. Geogr. Sci. 2010, 20, 787–798. [Google Scholar] [CrossRef]
  37. Wang, M.; Wang, X.; Liu, Q.; Shen, F.; Jin, J. A Novel Multi-Dimensional Cloud Model Coupled with Connection Numbers Theory for Evaluation of Slope Stability. Appl. Math. Model. 2020, 77, 426–438. [Google Scholar] [CrossRef]
  38. Zheng, Y.; Shi, Z.; Peng, X.; Li, J.; Feng, X. Multidimensional Generalized Normal Cloud Model for Uncertainty Propagation. Comp. Appl. Math. 2025, 44, 272. [Google Scholar] [CrossRef]
  39. Vidal, L.-A.; Marle, F.; Bocquet, J.-C. Using a Delphi Process and the Analytic Hierarchy Process (AHP) to Evaluate the Complexity of Projects. Expert. Syst. Appl. 2011, 38, 5388–5405. [Google Scholar] [CrossRef]
  40. Saaty, T.L. The Analytic Hierarchy Process: Planning, Priority Setting, Resource Allocation; McGraw-Hill: New York, NY, USA, 1980; ISBN 978-0-07-054371-3. [Google Scholar]
  41. Pant, S.; Kumar, A.; Ram, M.; Klochkov, Y.; Sharma, H.K. Consistency Indices in Analytic Hierarchy Process: A Review. Mathematics 2022, 10, 1206. [Google Scholar] [CrossRef]
  42. Zhou, K.; Lin, Y.; Deng, H.; Li, J.; Liu, C. Prediction of Rock Burst Classification Using Cloud Model with Entropy Weight. Trans. Nonferrous Met. Soc. China 2016, 26, 1995–2002. [Google Scholar] [CrossRef]
  43. Qiao, C.; Wang, Y.; Li, C.; Yan, B. Application of Extension Theory Based on Improved Entropy Weight Method to Rock Slope Analysis in Cold Regions. Geotech. Geol. Eng. 2021, 39, 4315–4327. [Google Scholar] [CrossRef]
  44. Wang, N.; Zhang, Y. Research on Evaluation of Wuhan Air Pollution Emission Level Based on Entropy Weight Method. Sci. Rep. 2024, 14, 5012. [Google Scholar] [CrossRef]
  45. Ghorbani, S. A Hybrid Quantitative Approach for Assessment of Geotechnical Hazards in Rock Tunnels Using Finite Element and Variation Coefficient Methods. Sci. Rep. 2025, 15, 28802. [Google Scholar] [CrossRef]
  46. Ecer, F.; Haseli, G.; Krishankumar, R.; Hajiaghaei-Keshteli, M. Evaluation of Sustainable Cold Chain Suppliers Using a Combined Multi-Criteria Group Decision-Making Framework under Fuzzy ZE-Numbers. Expert Syst. Appl. 2024, 245, 123063. [Google Scholar] [CrossRef]
  47. Jolliffe, I.T.; Cadima, J. Principal Component Analysis: A Review and Recent Developments. Philos. Trans. R. Soc. A Math. Phys. Eng. Sci. 2016, 374, 2065. [Google Scholar] [CrossRef]
  48. Tripathi, M.; Singal, S.K. Allocation of Weights Using Factor Analysis for Development of a Novel Water Quality Index. Ecotoxicol. Environ. Saf. 2019, 183, 109510. [Google Scholar] [CrossRef]
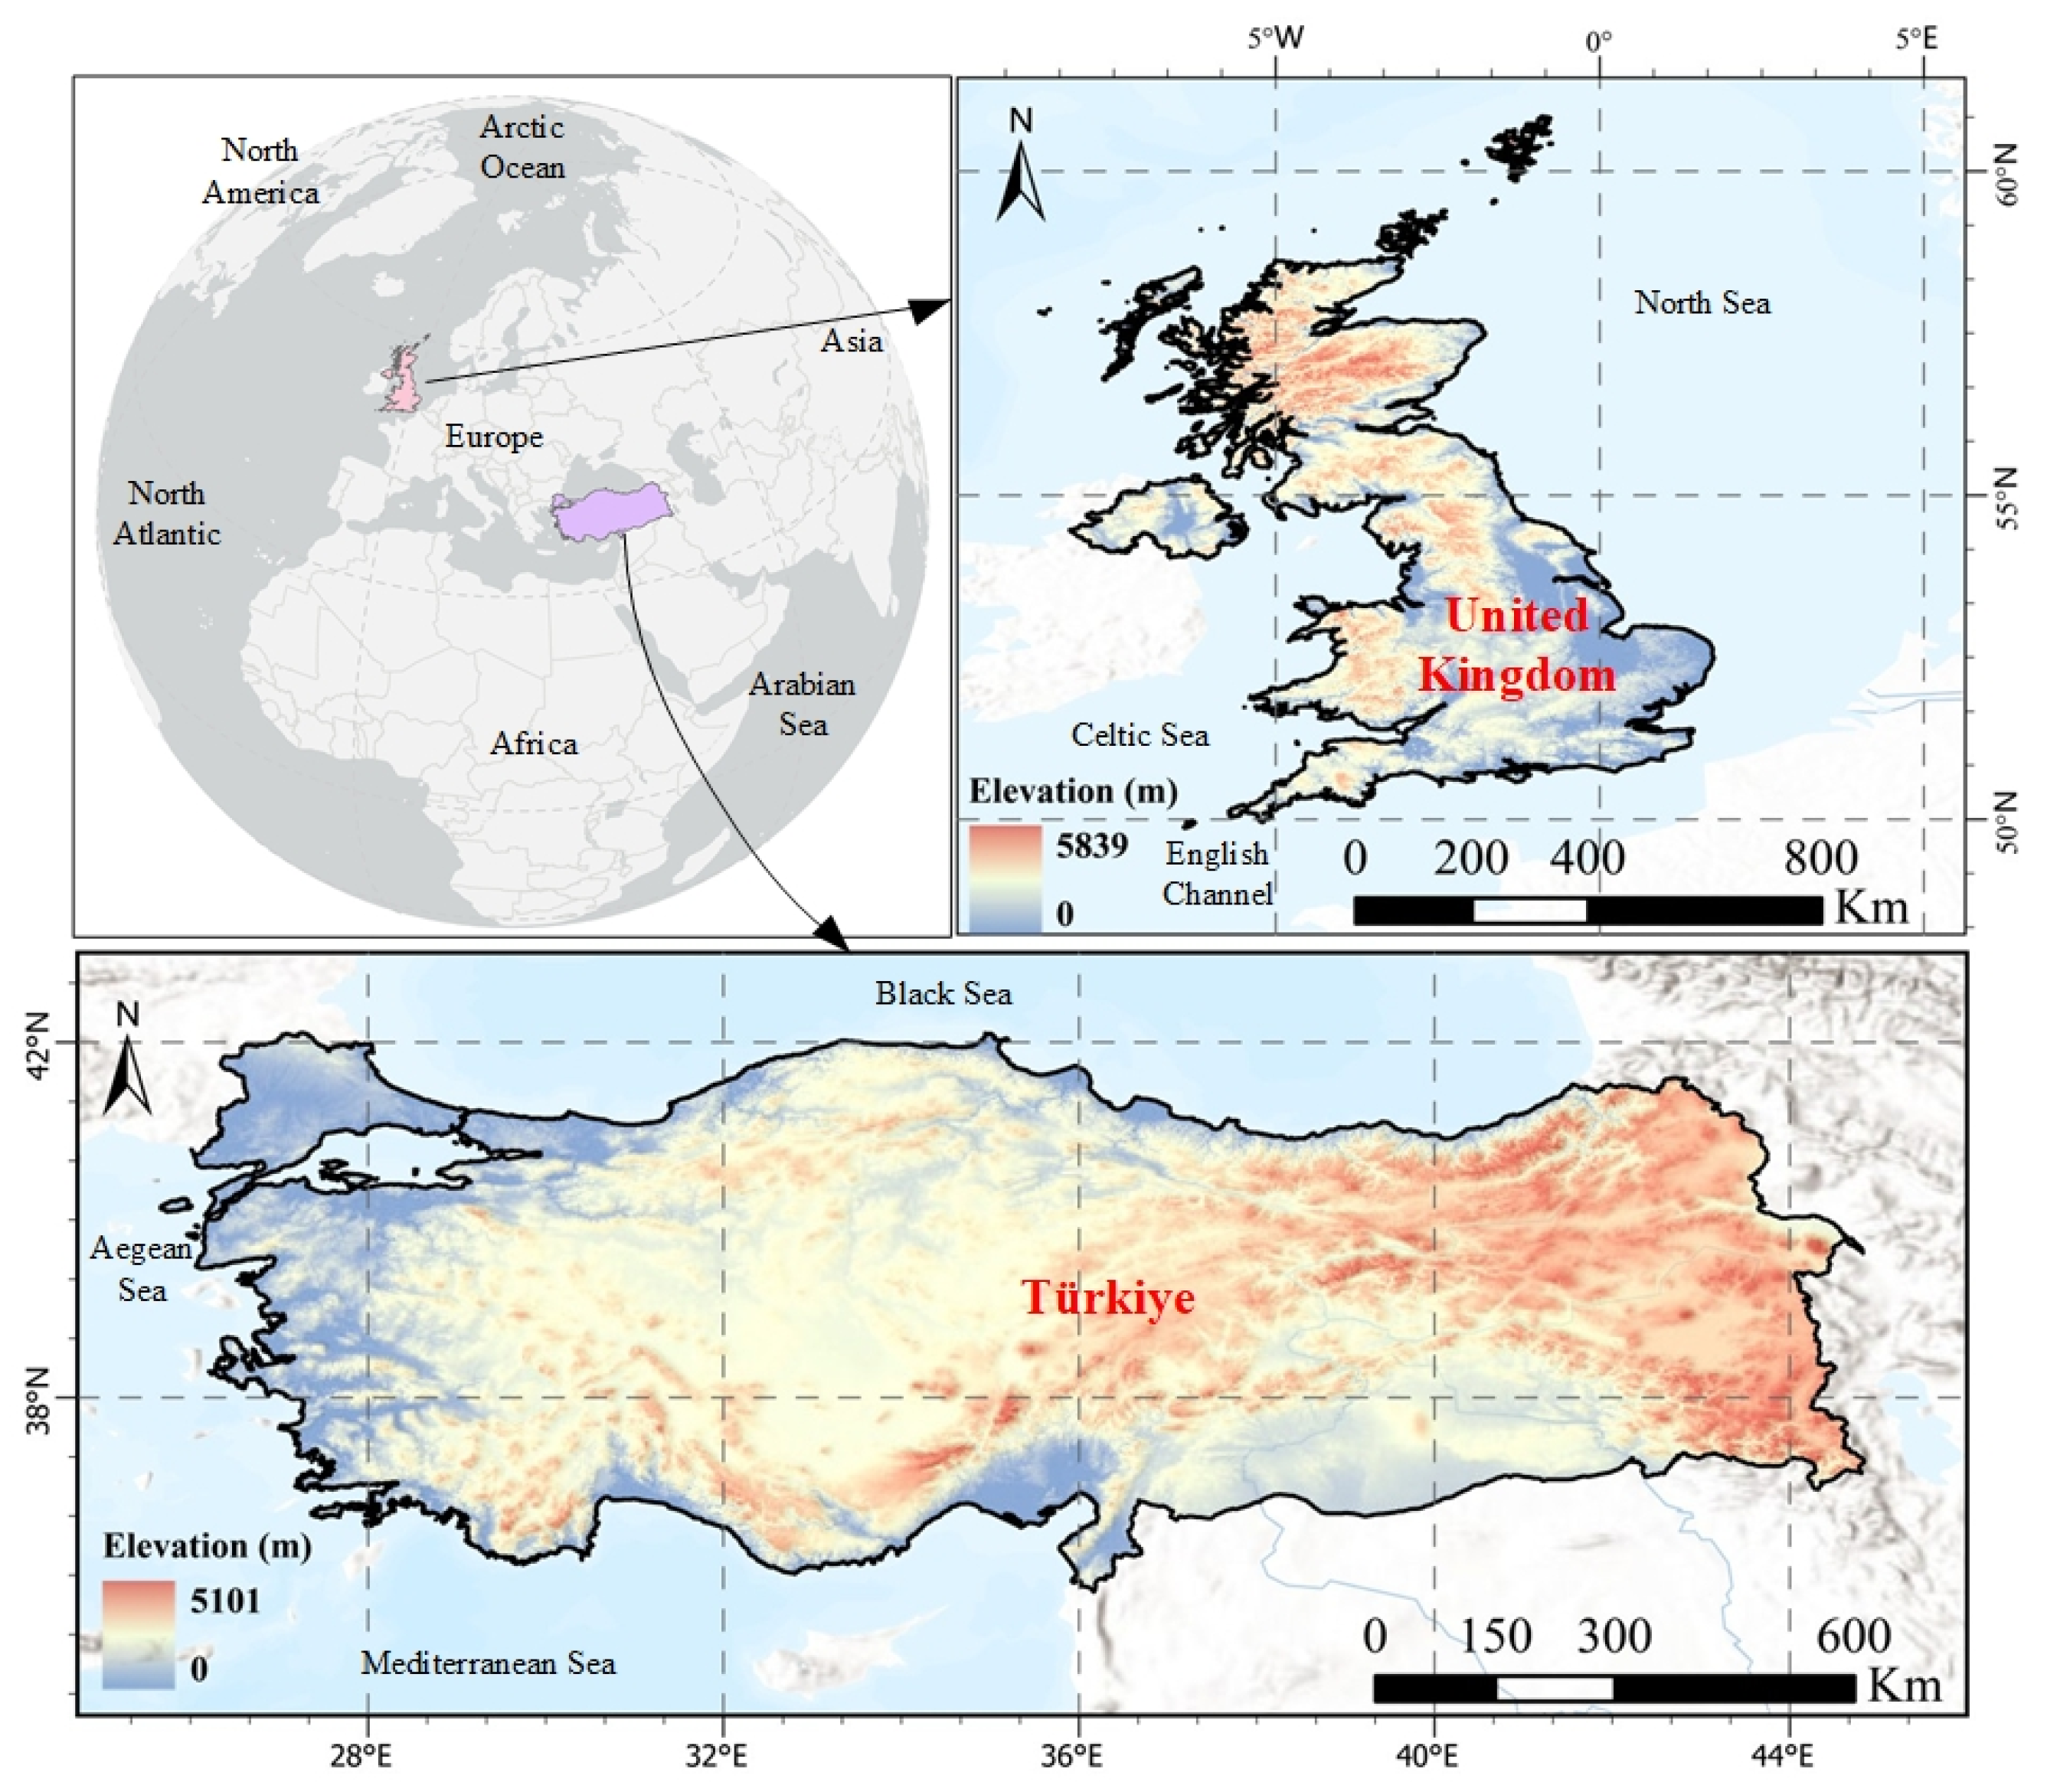
Figure 1. Geographic distribution of data sources.
Machines 13 01019 g001
Figure 2. Correlation analysis of indicators.
Machines 13 01019 g002
Figure 3. Introduction to the principles of the multidimensional cloud model.
Machines 13 01019 g003
Figure 4. Evaluation of the interaction matrix and its importance relationships.
Machines 13 01019 g004
Figure 5. Summary of subjective weights.
Machines 13 01019 g005
Figure 6. Summary of objective weights.
Machines 13 01019 g006
Figure 7. Single-indicator benchmark cloud model.
Machines 13 01019 g007
Figure 8. Multi-dimensional benchmark cloud model.
Machines 13 01019 g008
Figure 9. Validation of the reliability of Multi-dimensional cloud model evaluation: (a) Unconstrained fitting, (b) Zero-intercept Fitting.
Machines 13 01019 g009
Figure 10. Diggability grading cloud models for site 5, 17, 23, and 41.
Machines 13 01019 g010
Figure 11. Confusion matrix heatmap of diggability grades.
Machines 13 01019 g011
Figure 12. Multi-dimensional cloud model evaluation of site 5.
Machines 13 01019 g012
Table 1. Fuzzy conversion of diggability indicators.
Transformed
Score
0–2020–4040–6060–8080–100
Indicators
Weathering degreeCompletelyHighlyModeratelySlightlyUnweathered
1030507090
Uniaxial compressive
strength (MPa)
0–2020–4040–6060–100>100
Joint spacing (m)0–0.30.3–0.60.6–1.51.5–2>2
Bedding spacing (m)0–0.10.1–0.30.3–0.60.6–1.5>1.5
Table 2. Diggability levels and corresponding excavation methods.
Diggability LevelIIIIIIIVV
Fuzzy score0–3030–4040–5555–7070–100
Index0–4040–5050–7070–100>100
Ease of diggingVery EasyEasyDifficultVery DifficultMarginal Without Blasting
Excavation method1. Ripping
2. Dragline
3. Shovel digging
1. Ripping
2. Dragline
3. Shovel digging
1. Ripping
2. Shovel digging
Shovel diggingShovel digging
Table 3. Summary of subjective weights.
IndicatorsExpert 1Expert 2Expert 3Expert 4Expert 5
Weathering degree0.1350.1200.2020.2790.158
Uniaxial compressive strength0.1510.1660.1630.2160.111
Joint spacing0.3980.3440.2370.1880.180
Bedding spacing0.3160.3700.3980.3170.552
Consistency testCI0.0460.0160.0610.020.017
RI0.9000.9000.9000.9000.900
CR0.0510.0180.0680.0220.019
Table 4. Summary of objective weights.
IndicatorsEWMCRITICCVPCAFA
Weathering degree0.140.360.130.250.29
Uniaxial compressive strength0.200.240.190.250.30
Joint spacing0.410.240.390.230.15
Bedding spacing0.250.160.290.270.26
Classification accuracy (%)67.9060.7064.3060.7060.70
Table 5. Single-indicator benchmark cloud model parameters.
LevelIIIIIIIVV
E x 153547.562.585
E n 51.672.52.55
H e 0.50.1670.250.250.5
Table 6. Diggability classification evaluation results.
SiteDiggability Index Rating MethodMultidimensional Cloud Model
RatingEase of Digging ClassificationRatingEase of Digging Classification
190Very Difficult62.49Very Difficult
285Very Difficult63.48Very Difficult
395Very Difficult64.57Very Difficult
490Very Difficult63.63Very Difficult
590Very Difficult71.34Marginal Without Blasting
670Very Difficult50.01Difficult
785Very Difficult59.98Very Difficult
860Difficult43.33Difficult
990Very Difficult68.63Very Difficult
1050Difficult37.59Easy
11110Marginal Without Blasting65.67Very Difficult
1280Very Difficult60.21Very Difficult
1370Very Difficult48.87Difficult
1485Very Difficult55.24Very Difficult
15105Marginal Without Blasting70.08Marginal Without Blasting
1630Very Easy34.57Easy
1780Very Difficult54.82Difficult
1885Very Difficult59.42Very Difficult
1980Very Difficult60.54Very Difficult
20125Marginal Without Blasting87.07Marginal Without Blasting
2145Easy45.04Difficult
2245Easy39.48Easy
2345Easy40.73Difficult
2470Very Difficult50.66Difficult
2570Very Difficult52.32Difficult
2660Difficult47.62Difficult
2780Very Difficult52.01Difficult
28100Marginal Without Blasting70.27Marginal Without Blasting
29110Marginal Without Blasting72.31Marginal Without Blasting
3075Very Difficult58.93Very Difficult
3160Difficult46.94Difficult
3290Very Difficult63.87Very Difficult
3375Very Difficult51.31Difficult
3480Very Difficult54.23Difficult
35120Marginal Without Blasting80.79Marginal Without Blasting
3660Difficult48.36Difficult
3740Easy38.25Easy
3835Very Easy29.18Very Easy
3945Easy35.49Easy
4065Difficult41.71Difficult
4135Very Easy31.65Easy
4240Easy32.65Easy
4355Difficult46.62Difficult
4435Very Easy29.11Very Easy
4530Very Easy28.35Very Easy
4625Very Easy27.87Very Easy
47110Marginal Without Blasting77.74Marginal Without Blasting
48105Marginal Without Blasting64.29Very Difficult
49115Marginal Without Blasting78.16Marginal Without Blasting
50120Marginal Without Blasting77.53Marginal Without Blasting
5155Difficult40.21Difficult
52110Marginal Without Blasting81.70Marginal Without Blasting
53105Marginal Without Blasting70.69Marginal Without Blasting
5485Very Difficult62.63Very Difficult
5595Very Difficult67.97Very Difficult
56125Marginal Without Blasting86.43Marginal Without Blasting
Table 7. Grading error analysis based on the cloud model.
SiteDiggability Index Rating MethodMultidimensional Cloud Model Distribution
RatingEase of Digging ClassificationRatingEase of Digging Classification
590Very Difficult71.34Marginal Without Blasting *—Marginal Without Blasting
670Very Difficult50.01Difficult *—Very Difficult
1050Difficult37.59Easy *—Difficult
11110Marginal Without Blasting65.67Very Difficult *—Marginal Without Blasting
1370Very Difficult48.87Difficult *—Very Difficult
1630Very Easy34.57Very Easy—Easy *
1780Very Difficult54.82Difficult *—Very Difficult
2145Easy45.04Easy—Difficult *
2345Easy40.73Easy—Difficult *
2470Very Difficult50.66Difficult *—Very Difficult
2570Very Difficult52.32Difficult *—Very Difficult
2780Very Difficult52.01Difficult *—Very Difficult
3375Very Difficult51.31Difficult *—Very Difficult
3480Very Difficult54.23Difficult *—Very Difficult
4135Very Easy31.65Very Easy —Easy *
48105Marginal Without Blasting64.29Very Difficult *—Marginal Without Blasting
* In the Multidimensional Cloud Model Distribution column, expressions such as Difficult—Very Difficult indicate the range of the diggability level covered by the cloud model distribution. The value marked with an asterisk (e.g., Difficult *) represents the grade corresponding to the absolute classification of the sample.
Disclaimer/Publisher’s Note: The statements, opinions and data contained in all publications are solely those of the individual author(s) and contributor(s) and not of MDPI and/or the editor(s). MDPI and/or the editor(s) disclaim responsibility for any injury to people or property resulting from any ideas, methods, instructions or products referred to in the content.