Article

Mixed Eccentricity Fault Detection of Induction Motors Based on Variational Mode Decomposition of Current Signal

by
Ramin Alimardani
1,
Akbar Rahideh
1 and
Shahin Hedayati Kia
2,*
1
Department of Electrical Engineering, Shiraz University of Technology, Shiraz 13876-71557, Iran
2
MIS Lab UR4290, Université de Picardie Jules Verne, 80039 Amiens, France
*
Author to whom correspondence should be addressed.
Machines 2025, 13(10), 968; https://doi.org/10.3390/machines13100968
Submission received: 14 September 2025 / Revised: 12 October 2025 / Accepted: 14 October 2025 / Published: 20 October 2025
(This article belongs to the Special Issue Reliable Testing and Monitoring of Motor-Pump Drives)

Abstract

Mixed eccentricity faults in squirrel cage induction motors (SCIMs) are challenging to diagnose due to their subtle influence on the stator-current signal. Several research gaps remain in this field, including the limited investigation of fault severity levels and the scarcity of studies addressing fault detection under full-load conditions. Motivated by these gaps, this study proposes a diagnostic approach based on the variational mode decomposition (VMD) of the stator current. This paper proposes a diagnostic approach based on VMD of the stator current. The current signal is decomposed into intrinsic mode components, which are further separated into approximated and detailed signals. By focusing on the detailed signals and removing the fundamental frequency, the proposed algorithm highlights the spectral components associated with the mixed eccentricity. Experimental validation was carried out on a 1.5 kW SCIM connected directly to the power grid and tested under three loading levels (12.5%, 50%, and 100% of the rated load). In all nine experimental scenarios, the method successfully distinguished the healthy motor from faulty conditions with 20% and 30% mixed eccentricity severities. These results demonstrate that the proposed VMD-based method provides a reliable and quantitative tool for rotor fault diagnosis under varying load conditions.

1. Introduction

Induction machines have been widely utilized in various sectors including factories, household appliances, robots and electric vehicles due to their efficiency and reliability [1]. The condition monitoring and fault detection of electric machines is crucial to ensure their efficient operation and minimization of downtime. Condition monitoring can be defined as the continuous and periodic assessment of the well-being of a system, here an electric machine, throughout its operational lifespan. The crucial aspect is to identify faults at the early stages of development, which is referred to as incipient failure detection. In electrical machines, the occurrence of both mechanical and electrical faults is probable. One of the most common faults is eccentricity, where the rotor and stator lose their concentricity during rotation [2].
Rotor faults can affect motor performance and cause damage, leading to shutdowns of industrial processes. Eccentricity increases the risk of stator–rotor contact and results in potential motor failures. In order to ensure electric-motor and process reliability, detecting motor and load defects at an early stage is essential [3]. Diagnosing faults in induction motors (IMs) is a complex task in industrial applications, and the difficulty increases when information regarding their operating conditions is limited. Several methods have been investigated that utilize different sensing modalities, such as acoustic emission, vibration analysis, and current monitoring [4].
Fault detection in induction machines is critical for ensuring operational reliability, minimizing downtime, and optimizing maintenance costs in industrial applications. The evolution of diagnostic techniques has led to the adoption of machine learning (ML) and model-based and signal-based methods, each offering distinct advantages and limitations across key evaluation criteria, such as accuracy, detection speed, cost-effectiveness, and interpretability [5,6,7,8,9,10].
Model-based fault detection involves developing a mathematical model of an electric machine and comparing the actual behavior of the electric machine with the expected behavior predicted by the model. If there is a meaningful difference between the two outputs, it indicates the presence of a fault in the system. Several papers have been published on this topic, e.g., [11]. Model-based fault detection has several limitations. One of the limitations is the requirement of an accurate model of the machine, which can be difficult to develop in practice [12]. A key limitation of model-based approaches is their inability to detect faults outside the developed model, which complicates development in areas such as intelligent automation and machine learning [13]. Additionally, model-based fault detection methods may not be robust against changes in operating conditions or load variations [14]. Finally, model-based methods are not suitable for online fault detection, as they require significant computational resources [15]. Therefore, it is important to consider the abovementioned limitations when selecting a fault detection method. Model-based methods provide robust and interpretable fault detection, especially in systems with well-defined physical models. However, they require substantial initial investment in modeling and parameter identification [6,9].
Machine learning techniques generally require comprehensive databases that include both healthy and faulty conditions of induction machines. These databases should cover different fault types, such as eccentricity, broken rotor bars, bearing faults, stator faults, and healthy states under various load levels and fault severities. Such datasets are essential for training and validating intelligent models to ensure robust and generalizable performance in industrial environments. Recent studies have applied intelligent approaches, including machine learning, deep learning, and graph- or higher-order-based models, to bear fault diagnosis [16,17]. ML techniques deliver superior accuracy (up to 100%), early fault detection (up to 3 h before failure), and significant cost reductions in maintenance and downtime. However, they often lack interpretability, which can be mitigated using hybrid approaches [5,18,19,20,21]. ML techniques have demonstrated significant advantages in the fault diagnosis of induction machines. They offer high detection accuracy, particularly when ensemble or hybrid models are employed [5,9,18]. In addition, ML-based approaches enable real-time and early fault detection, facilitating proactive maintenance strategies [19]. These techniques also contribute to cost reduction by minimizing downtime and maintenance expenses [18,20]. Moreover, their scalability allows for effective application to complex and multi-fault scenarios. Despite these strengths, ML methods present certain limitations. They often lack interpretability, as most models function as black-box systems [21]. Furthermore, their performance heavily depends on the availability of large, high-quality datasets for training and validation. In addition, retraining may be required when new fault types or varying operating conditions are introduced, which limits adaptability in dynamic industrial environments. However, most of these works primarily address mechanical faults, with limited attention to mixed eccentricity problems. In this research, the main objective is to detect eccentricity faults using current signal-based techniques. By analyzing the frequency components of the stator-current spectrum, the proposed signal-based approach enables the reliable identification of fault types, offering a non-intrusive and efficient diagnostic framework for induction machines.
Signal-based methods can be categorized according to the nature of the signal to be used (e.g., current, vibration, flux, and sound) or the domain in which they are analyzed (e.g., time, frequency, and time–frequency) [22]. Signal-based fault detection methods facilitate fault diagnosis even without having extensive knowledge or experience in the electric machine theory [23]. However, these methods are inherently sensitive to environmental noise and variations in operating conditions, which can compromise the reliability and accuracy of fault detection [24]. Signal-based methods offer fast and interpretable detection of specific faults but may struggle with complex or overlapping fault scenarios [7,25]. Table 1 provides a comparative summary of model-based, signal-based, and ML-based fault detection methods.
Vibration analysis and motor current signature analysis (MCSA) are well-established signal-based techniques for detecting eccentricity faults in induction motors. These techniques help determine the operating conditions of induction motors and detect various types of faults, including unbalance/misalignment, defective bearings, rotor bar damage, load issues, and eccentricity [26]. Fault detection of electric motors using MCSA is important from an industrial perspective because it usually allows fault detection without the need for additional sensor installation [27]. Current signal-based methods for mixed eccentricity fault detection have several limitations. A notable challenge is that fault-induced current components are often subtle and significantly smaller in amplitude than the dominant supply frequency components, making it difficult to detect and quantify fault severity with precision [28]. Recent advancements have demonstrated that combining discrete wavelet transform (DWT), the Teager–Kaiser energy operator (TKEO), and power spectral density (PSD) can significantly improve the detection of broken rotor bars and mixed eccentricity faults in induction motors. This integrated approach enhances fault detection accuracy by extracting and isolating critical features from the stator-current signal [29]. The TKEO method involves removing the frequency range from 0 to the power supply frequency component from the current signal spectrum. This range encompasses the low-frequency components associated with mixed eccentricity faults. To preserve the integrity of the remaining frequency spectrum, it is essential to employ signal processing techniques that minimize spectral distortion [30].
The research on fault detection based on the Variational Mode Decomposition (VMD) has gained significant attention in recent years [31]. The VMD is a powerful adaptive signal processing algorithm that has been applied in various fields, such as fault detection and signal decomposition. VMD decomposes input signals into a discrete number of sub-signals called modes, each with a limited bandwidth and center pulsation. The number of modes can be selected, allowing for flexibility in determining the center of the pulsation. This adaptability makes the VMD a valuable tool for specific applications, including fault detection in induction machines [32,33]. The performance of VMD heavily depends on the selection of parameters, such as the number of modes and the bandwidth constraint. Incorrect parameter settings can lead to suboptimal decomposition results, requiring careful tuning or optimization techniques [34]. The Pearson correlation coefficient serves as a metric for optimal mode selection, computed by comparing the sampled current signal with each extracted mode in this research.
Table 2 summarizes the research studies conducted on eccentricity fault detection. Several challenges remain in this field, including the following:
  • The severity levels of eccentricity faults have not been comprehensively analyzed in some reported works.
  • In many studies, eccentricity faults have been identified only under no-load or light-load conditions; however, fault detection under full-load operation remains considerably more challenging.
To overcome these limitations, the present laboratory setup was specifically designed to evaluate fault diagnosis methods across a wide range of loading conditions and fault severities, thereby addressing this critical research gap.
In the context of electric motors, the need for fault detection methods is evident. The utilization of the VMD in combination with advanced signal processing techniques presents a promising approach to address the challenges associated with fault detection based on current signals. Therefore, the literature presents a comprehensive overview of the state of the art in the field of fault detection based on current signals and the VMD, showcasing the potential of the VMD in addressing the challenges associated with eccentricity fault detection in electric motors. Overall, the literature review suggests that the utilization of the VMD in combination with advanced signal processing techniques holds great promise for the detection of faults based on current signals in electric motors, with potential applications in various industrial domains.

2. Methodology: Variational Mode Decomposition and Mixed Eccentricity Fault Detection Approach

2.1. Variational Mode Decomposition

Variational Mode Decomposition (VMD) is an advanced signal decomposition approach that separates a signal into a predefined number of modes with limited bandwidth through a non-recursive optimization process. Each mode is constrained to remain highly localized around its central frequency, thereby ensuring a compact spectral representation. The VMD algorithm involves two steps: (1) mapping each mode to its complex analytic form using the Hilbert transform and (2) shifting the analytic signals of each mode to the baseband by frequency shifting. The VMD method is widely used in time–frequency analysis and signal processing to decompose non-stationary signals into a set of modes that capture the different frequency components of the signal [44,45,46].
In signal processing, the VMD serves a powerful role. It decomposes a signal, denoted by x(t), into a finite number of modes, i.e., K, which is characterized by narrow bandwidths.
x t = k = 1 K u k ( t )
The modes have the following characteristics:
  • Each mode u k corresponds to an amplitude- and frequency-modulated component, which can be mathematically expressed as
    u k t = A k t cos ( k ( t ) )
    where k ( t ) is the phase of the mode and A k t is its envelope.
  • The modes have positive and slowly varying envelopes.
  • The frequency of each mode ( ω k ( t ) = d ( t ) / d t ) changes smoothly over time and tends to stay close to a particular value ω k .
VMD simultaneously calculates all component frequencies (central frequencies) and their corresponding waveforms (mode waveforms). This is achieved by solving a mathematical optimization problem, where a specific function (constrained variational problem) is minimized and represented by the following equation [47]:
m i n u k , ω k k = 1 K d d t δ t + j π t u k ( t ) e j ω k t 2 2   subject   to   k = 1 K u k = x
where u k is the k-th mode, ω k is a center frequency around which u k is mostly compact. The bandwidth of each mode is quantified by the squared H1-norm of its Hilbert-transformed analytic signal, shifted to baseband and restricted to positive frequencies. To reformulate Equation (3) as an unconstrained optimization problem, a quadratic penalty term along with Lagrangian multipliers is incorporated. The augmented Lagrangian is set using the following equation:
L u k , ω k , λ = α k = 1 K d d t δ t + j π t u k t e j ω k t 2 2 + x k = 1 K u k 2 2 + λ , x k = 1 K u k
where α is the balancing parameter of the data-fidelity constraint and the inner product p t , q ( t ) = p * t   q t d t   and the 2-norm p ( t ) 2 2 =   p t , p ( t ) .
α k = 1 K d d t δ t + j π t u k ( t ) e j ω k t 2 2
x k = 1 K u k 2 2
λ , x k = 1 K u k
The regularization term (5) consists of the following steps:
  • The analytic signal corresponding to each mode is obtained through the Hilbert transform, where * denotes the convolution. This ensures that each mode possesses a spectrum confined to positive frequencies.
  • The analytic signal is demodulated to its baseband representation by multiplying it with an appropriate complex exponential.
  • The bandwidth is estimated by computing the squared 2-norm of the gradient of the demodulated analytic signal.
Terms (6) and (7) enforce the constraint x t =   k = 1 K u k t by imposing a quadratic penalty and incorporating a Lagrange multiplier. The Penalty Factor α measures the relative importance of (5) compared to (6) and (7). The optimization problem is solved using the alternating direction method of multipliers described in [48].
The alternating direction method of multipliers tackles the variational problem presented in (4). This approach iteratively solves the problem, revealing the individual decomposed modes (separated components) and their corresponding center frequencies for each iteration. These extracted modes, obtained from the solutions in the spectral domain (frequency domain), can be expressed as
u ^ k ω = x ^ ω i k u ^ i ω + λ ^ ω / 2 1 + 2 α ω ω k 2
The VMD mainly includes the following steps:
(1)
Modes update: the modes u ^ k n + 1 (ω) are updated as represented in (9). Wiener filtering is embedded to update the mode directly in the frequency domain with a filter tuned to the current center frequency ω k n .
u ^ k n + 1 ω = 1 1 + 2 α ω ω k 2 x ^ ω
i < k u ^ i n + 1 ω i > k u ^ i n ω + λ ^ ω / 2
(2)
The central frequency update: the center frequencies ω k n + 1 are updated as the center of gravity of the corresponding mode’s power spectrum as follows.
ω k n + 1 = 0 ω u ^ k n + 1 ω 2 d ω 0 u ^ k n + 1 ω 2 d ω
(3)
Dual ascent update: for all ω ≥ 0, the Lagrangian multiplier λ ^ n + 1 is updated by (11) as dual ascent to enforce exact signal reconstruction until k   (   u ^ k n + 1 u ^ k n 2 2   )   /   (   u ^ k n 2 2   ) < ε .
λ ^ n + 1 = λ ^ n + τ ( x ^ k u ^ k n + 1 )
where τ is the update rate of the Lagrange multiplier and usually set to 0.01. A higher update rate accelerates the convergence of the algorithm; however, it also increases the risk of the optimization process being trapped in a local optimum. λ ^ n + 1 , λ ^ n , u ^ k n + 1 , u ^ k n and x ^ correspond to the Fourier transform of λ n + 1 ( t ) , λ n ( t ) , u k n + 1 ( t ) , u k n ( t ) and x ( t ) . The detailed algorithm of the VMD can be found in [49]. The parameters used in the VMD method are defined as follows:
x t —Input signal to be decomposed.
u k ( t ) —k-th decomposed mode of the signal. Each mode is amplitude and frequency modulated.
u k t = A k t cos ( k ( t ) )
A k t is the amplitude envelope of the mode.
k ( t ) is the instantaneous phase of the mode.
ω k ( t ) —Center frequency of mode u k ( t ) , around which the mode is mostly compact.
K—Total number of decomposition modes.
α —Penalty factor controlling the balance between data fidelity and mode smoothness (bandwidth constraint).
λ —Lagrange multiplier used to enforce the reconstruction constraint:
τ—Step size (update rate) for the dual ascent of the Lagrange multiplier. Typical value: 0.01.
ε —Convergence tolerance for iterative updates.
* —Convolution operation.
p t , q ( t ) —Inner product of two signals, used in Lagrangian formulation.
The VMD has several advantages and disadvantages. One advantage is that the VMD is a widely used method for signal decomposition, particularly for non-stationary signals. It can effectively decompose a signal into a set of independent subcomponents with specific sparsity properties, allowing for the accurate reconstruction of the input variable [44]. Additionally, the VMD has the ability to adaptively determine the center frequency and bandwidth of each subcomponent, making it suitable for analyzing signals with varying frequency content [45]. However, the VMD has some limitations. One disadvantage is that it requires the determination of several parameters, such as the number of decomposition modes, which can be challenging and time-consuming [46]. Despite these limitations, the VMD remains a valuable tool for signal analysis and decomposition.

2.2. Mixed Eccentricity Fault

Eccentricity can be classified into three types: static, dynamic, and mixed. Among these, mixed eccentricity is the most commonly observed fault on an industrial scale. To examine eccentricity faults, various signals such as current, vibration, and flux can be utilized. However, in certain industrial applications, it is not possible to place vibration and flux sensors on the motor body and only the power cable of the electric motor is accessible. In this research, the focus is on detecting the mixed eccentricity fault using the current signal.
The frequency components related to the eccentric fault in the current signal depend on the type of eccentricity fault. In general, low-frequency components exist in the stator current due to the presence of both dynamic and static eccentricity. Air gap eccentricity faults induce the formation of two sideband harmonic components around the fundamental frequency in the supply current spectrum. These characteristic frequencies serve as a valuable eccentricity fault index for detection. Equation (12) is used to calculate the frequency components associated with the mixed eccentricity (ME) fault in the current signal. ME creates low-frequency sidebands around the supply frequency.
f M E = f e c c . L F = | f s   ±   k   f r |   where   f r = ( ( 1 s ) / p )   f s
where fs, fr, k, p and s are, respectively, the stator fundamental frequency, the rotor running frequency, an integer value, the number of pole-pairs and the slip.
In MCSA, signatures of eccentricity faults appear in the frequency spectrum of the stator current. However, these signatures are typically much weaker than the dominant fundamental component of the supply frequency. This significant difference in magnitude makes many machine learning models, which are effective for vibration signal analysis, unsuitable for MCSA. These models often struggle to differentiate the subtle variations between healthy and faulty current signals [50]. Therefore, it is essential to first review the methods that enable the analysis of the current signal and the identification of signatures associated with eccentricity faults. Subsequently, a detailed spectral analysis is required to extract these features for reliable fault detection.

2.3. Proposed Fault Detection Algorithm

Figure 1 depicts the mixed eccentricity fault detection algorithm with the following three steps:
Step 1: Initially, the current signal sampled from one phase of the stator winding is decomposed into its modes using the VMD approach. The number of modes required for accurate eccentricity fault detection is determined experimentally. When the correlation between over half of the modes and the original signal is approximately 3%, a sufficient number of modes for fault detection can be established. Given that the frequency range relevant to eccentricity faults, as defined by (12), is predominantly low, ten modes were utilized for signal processing and subsequent fault diagnosis.
Step 2: the detailed signal, x d ( t ) , is calculated based on the obtained modes of the current signal using one of the following two methods. The detailed signal is generated by removing the power supply main frequency component. The frequency component related to the mixed eccentricity in the detailed signal is more visible due to the removal of the main frequency component. Also, the limitation of the eccentricity fault signatures in the frequency spectrum of stator current is really handled by examining the detailed signal.
  • First method: to obtain the detailed signal, i.e., x d ( t ) , the approximated signal, M a , which is the sum of the modes whose correlation with the main signal is larger than 0.5, is computed based on (13). The Pearson correlation function measures the degree of similarity between two signals and identifies dominant modes in a signal by looking for modes with a similarity score exceeding 50% to the original signal. M a is an approximate of the original signal consisting of the main frequency component of x(t). The mixed eccentricity frequency component is distinguished in the detailed signal by removing M a from the original signal as represented in (14).
    M a = k = 1 K u k t   |     c o r r e l a t i o n   u k t , x t > 0.5
    x d ( t ) = x t M a
    where K is the total number of modes.
  • Second method: the correlations between every two modes are computed and M b is obtained according to (15) in which every mode where its correlations with all other modes are less than or equal to 0.01 is included in M b . Based on (16), the detailed signal, x d ( t ) , is computed. In essence, M b considers a group of modes “weakly interacting” if their correlation is less than or equal to a threshold (here, 0.01). This threshold depends on update rate of the Lagrange multiplier, τ.
    M b = k = 1 K u k t   |     c o r r e l a t i o n   u k t , u j t     0.01         f o r     j = 1     K             j k  
    x d ( t ) = M b
Step 3: The frequency component associated with the mixed eccentricity is finally analyzed using the FFT of the detailed signal.
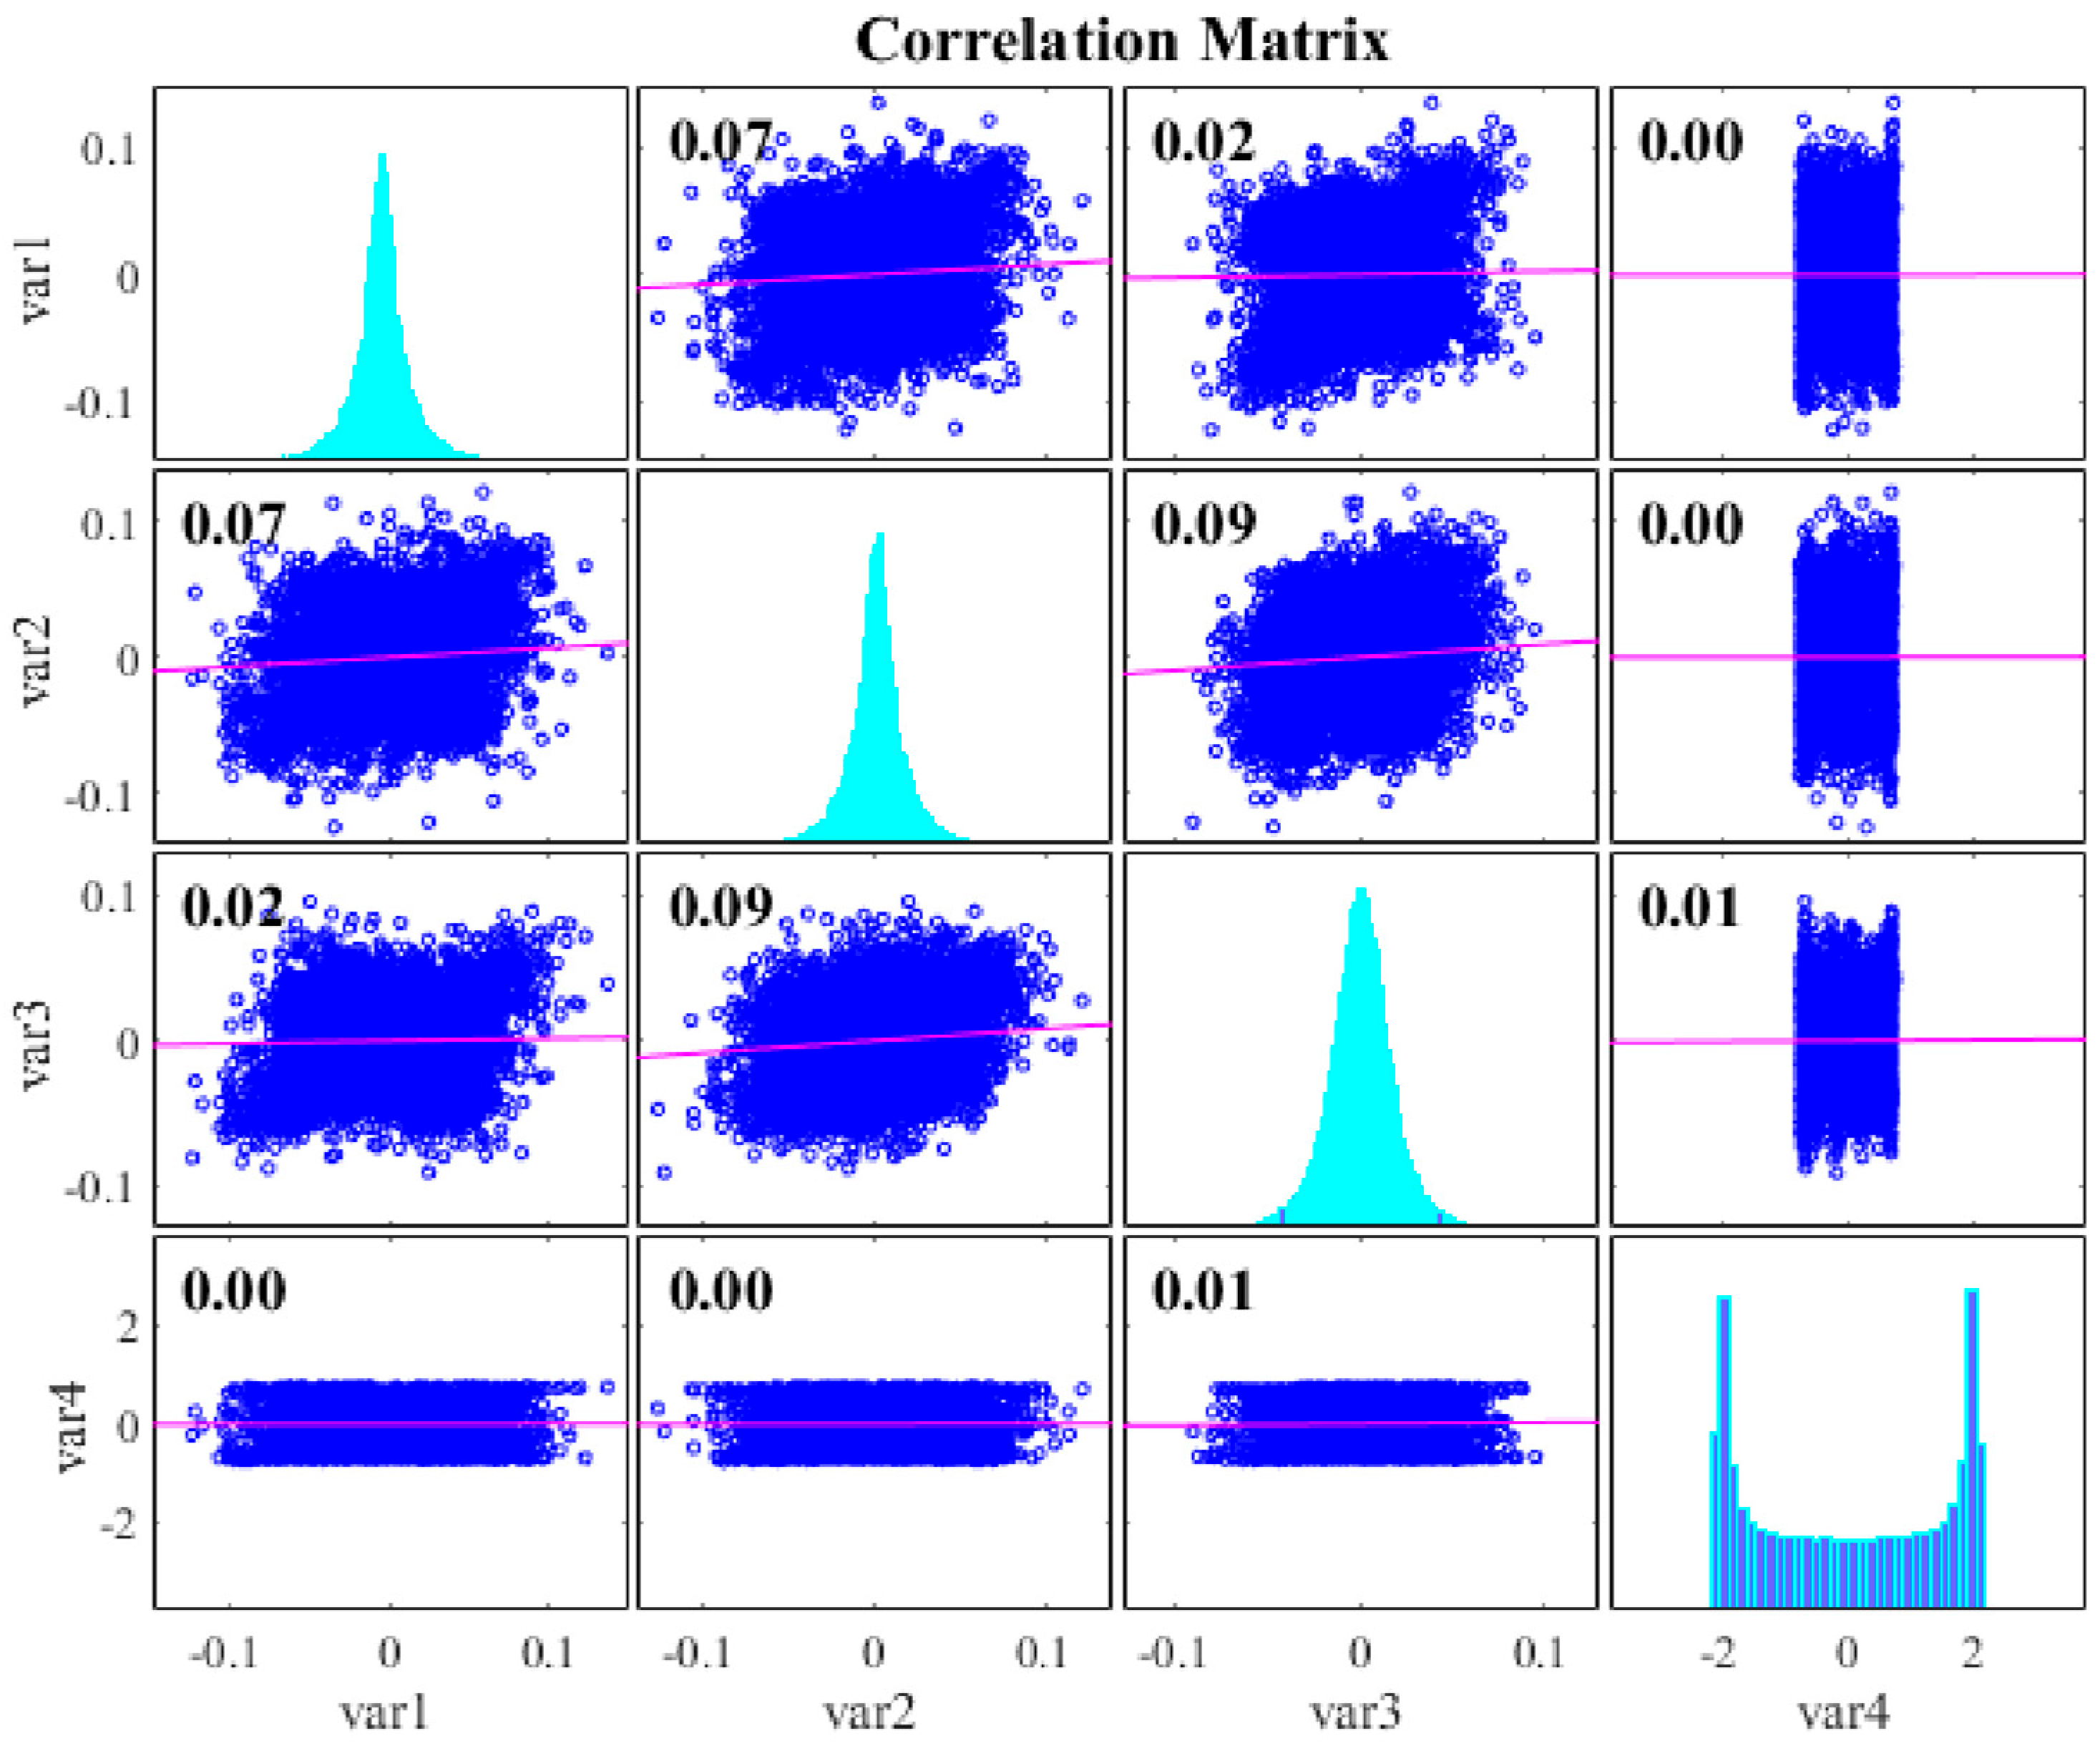
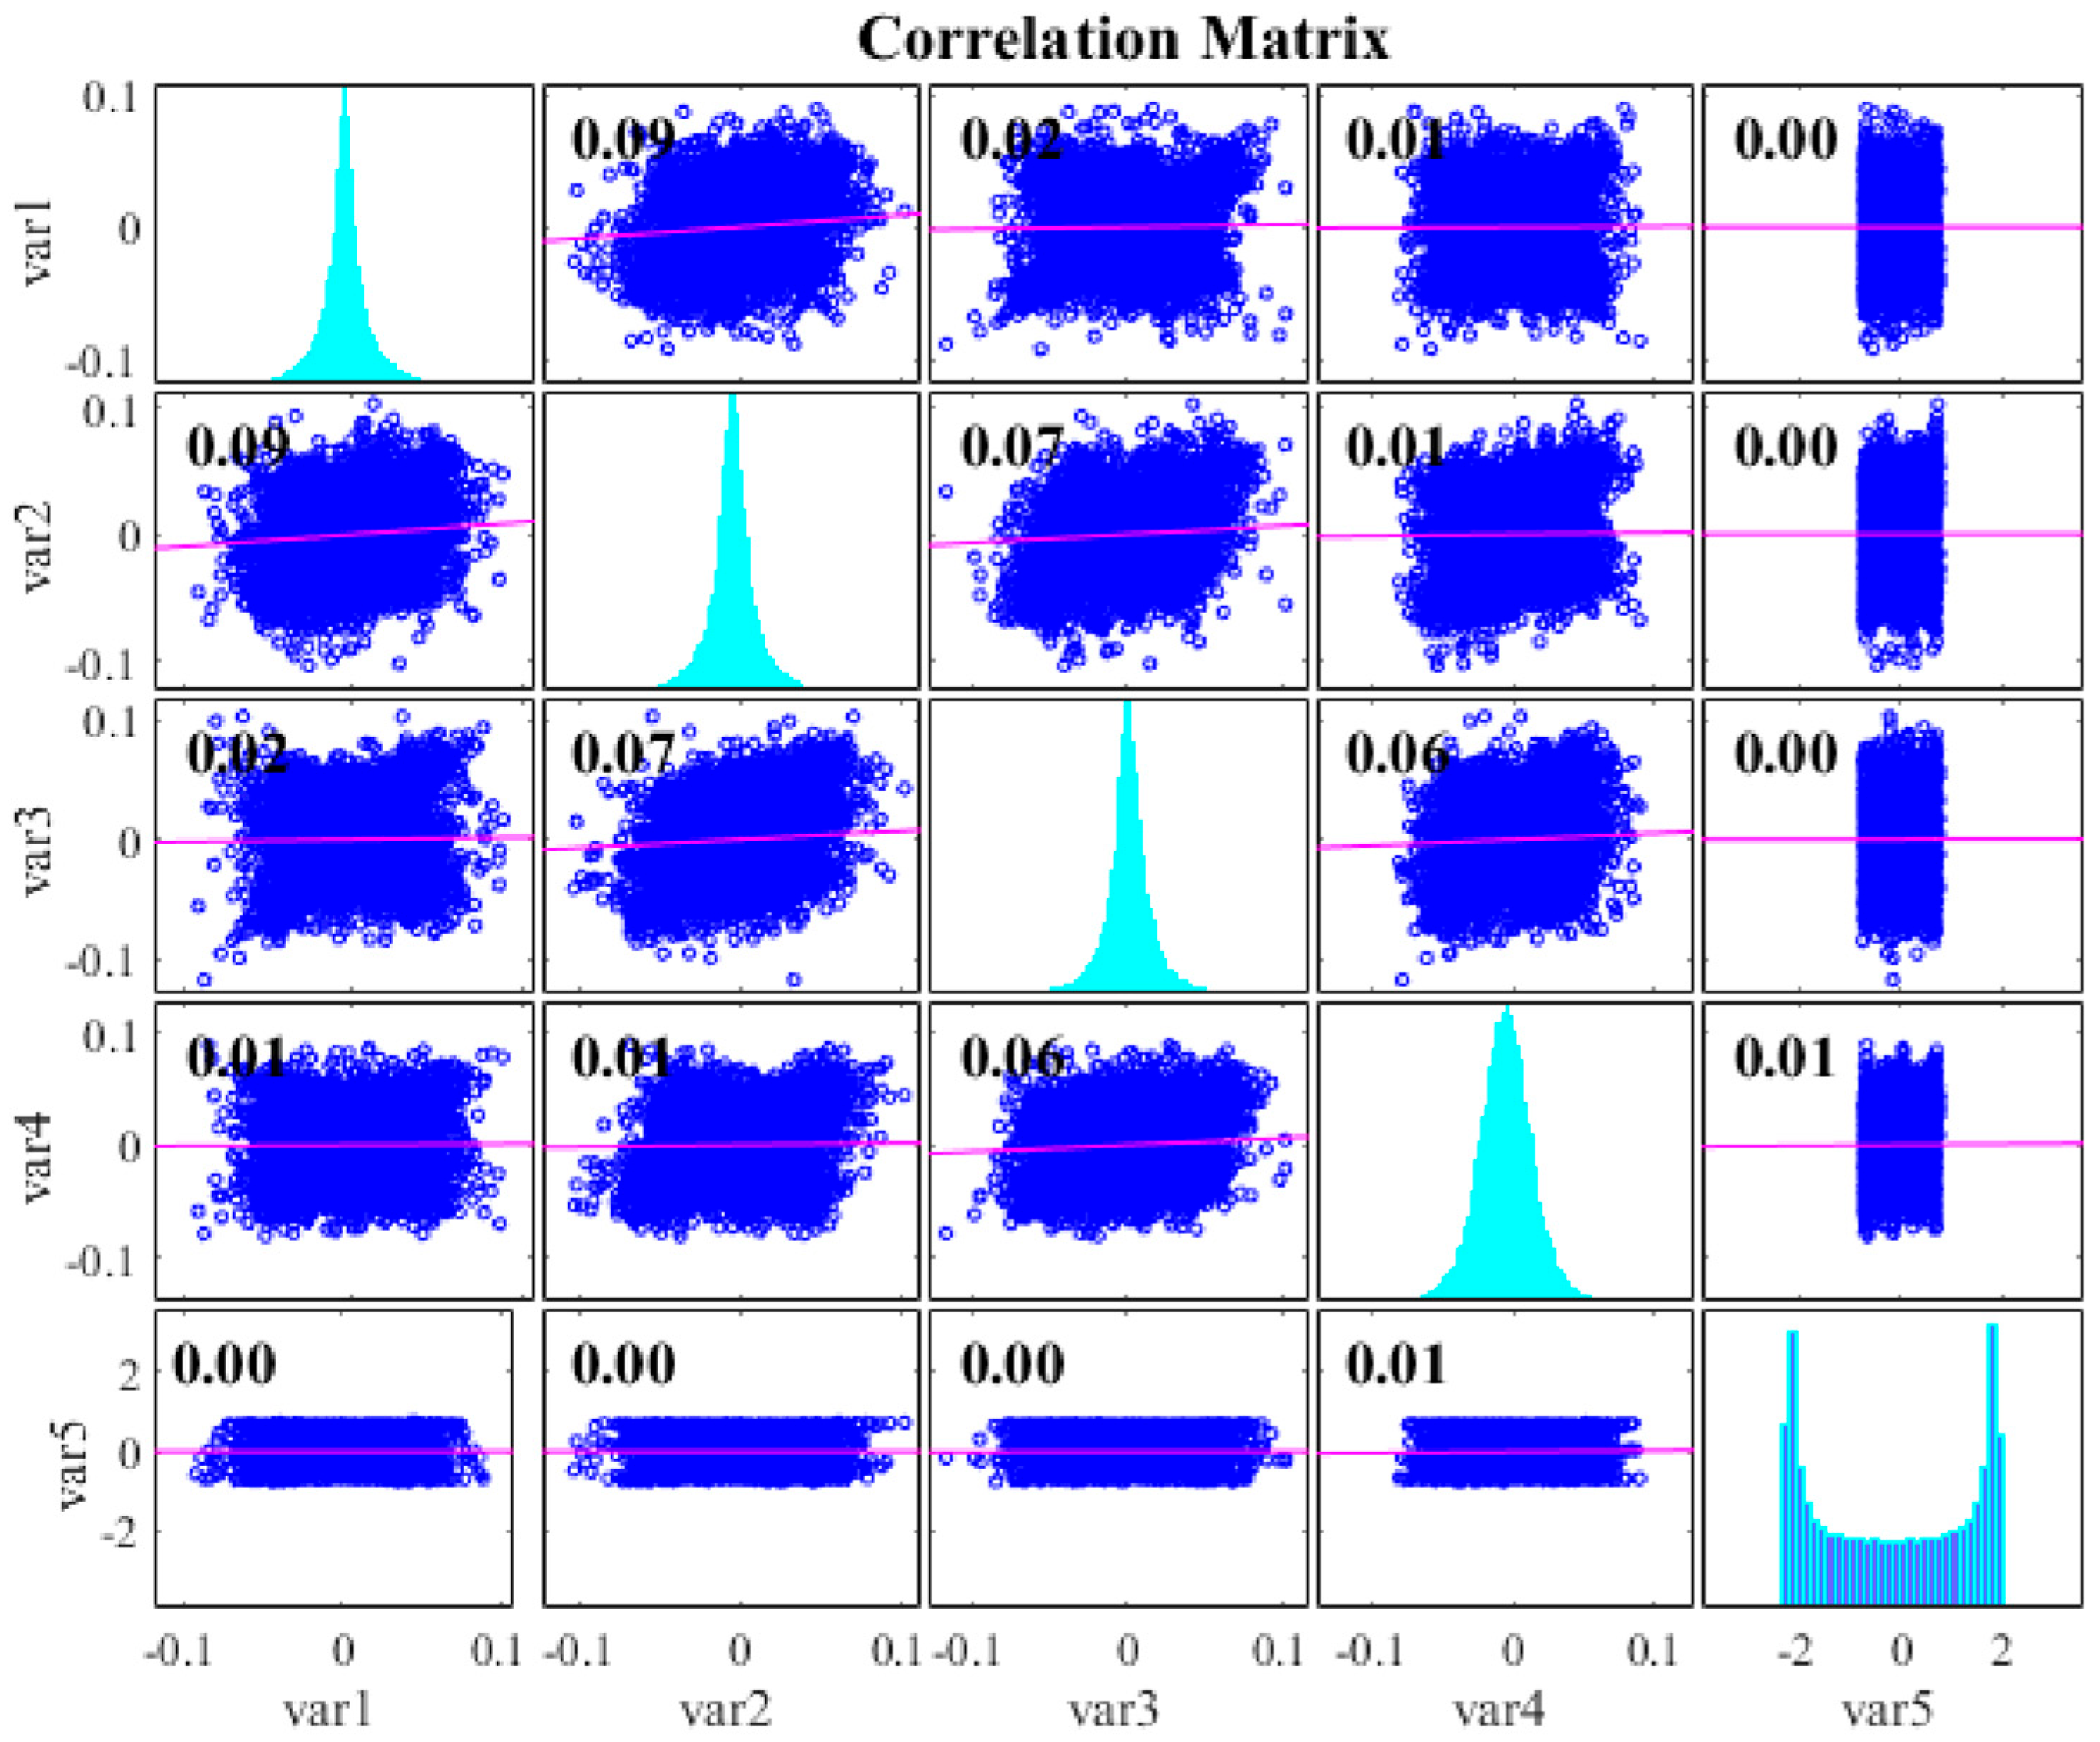
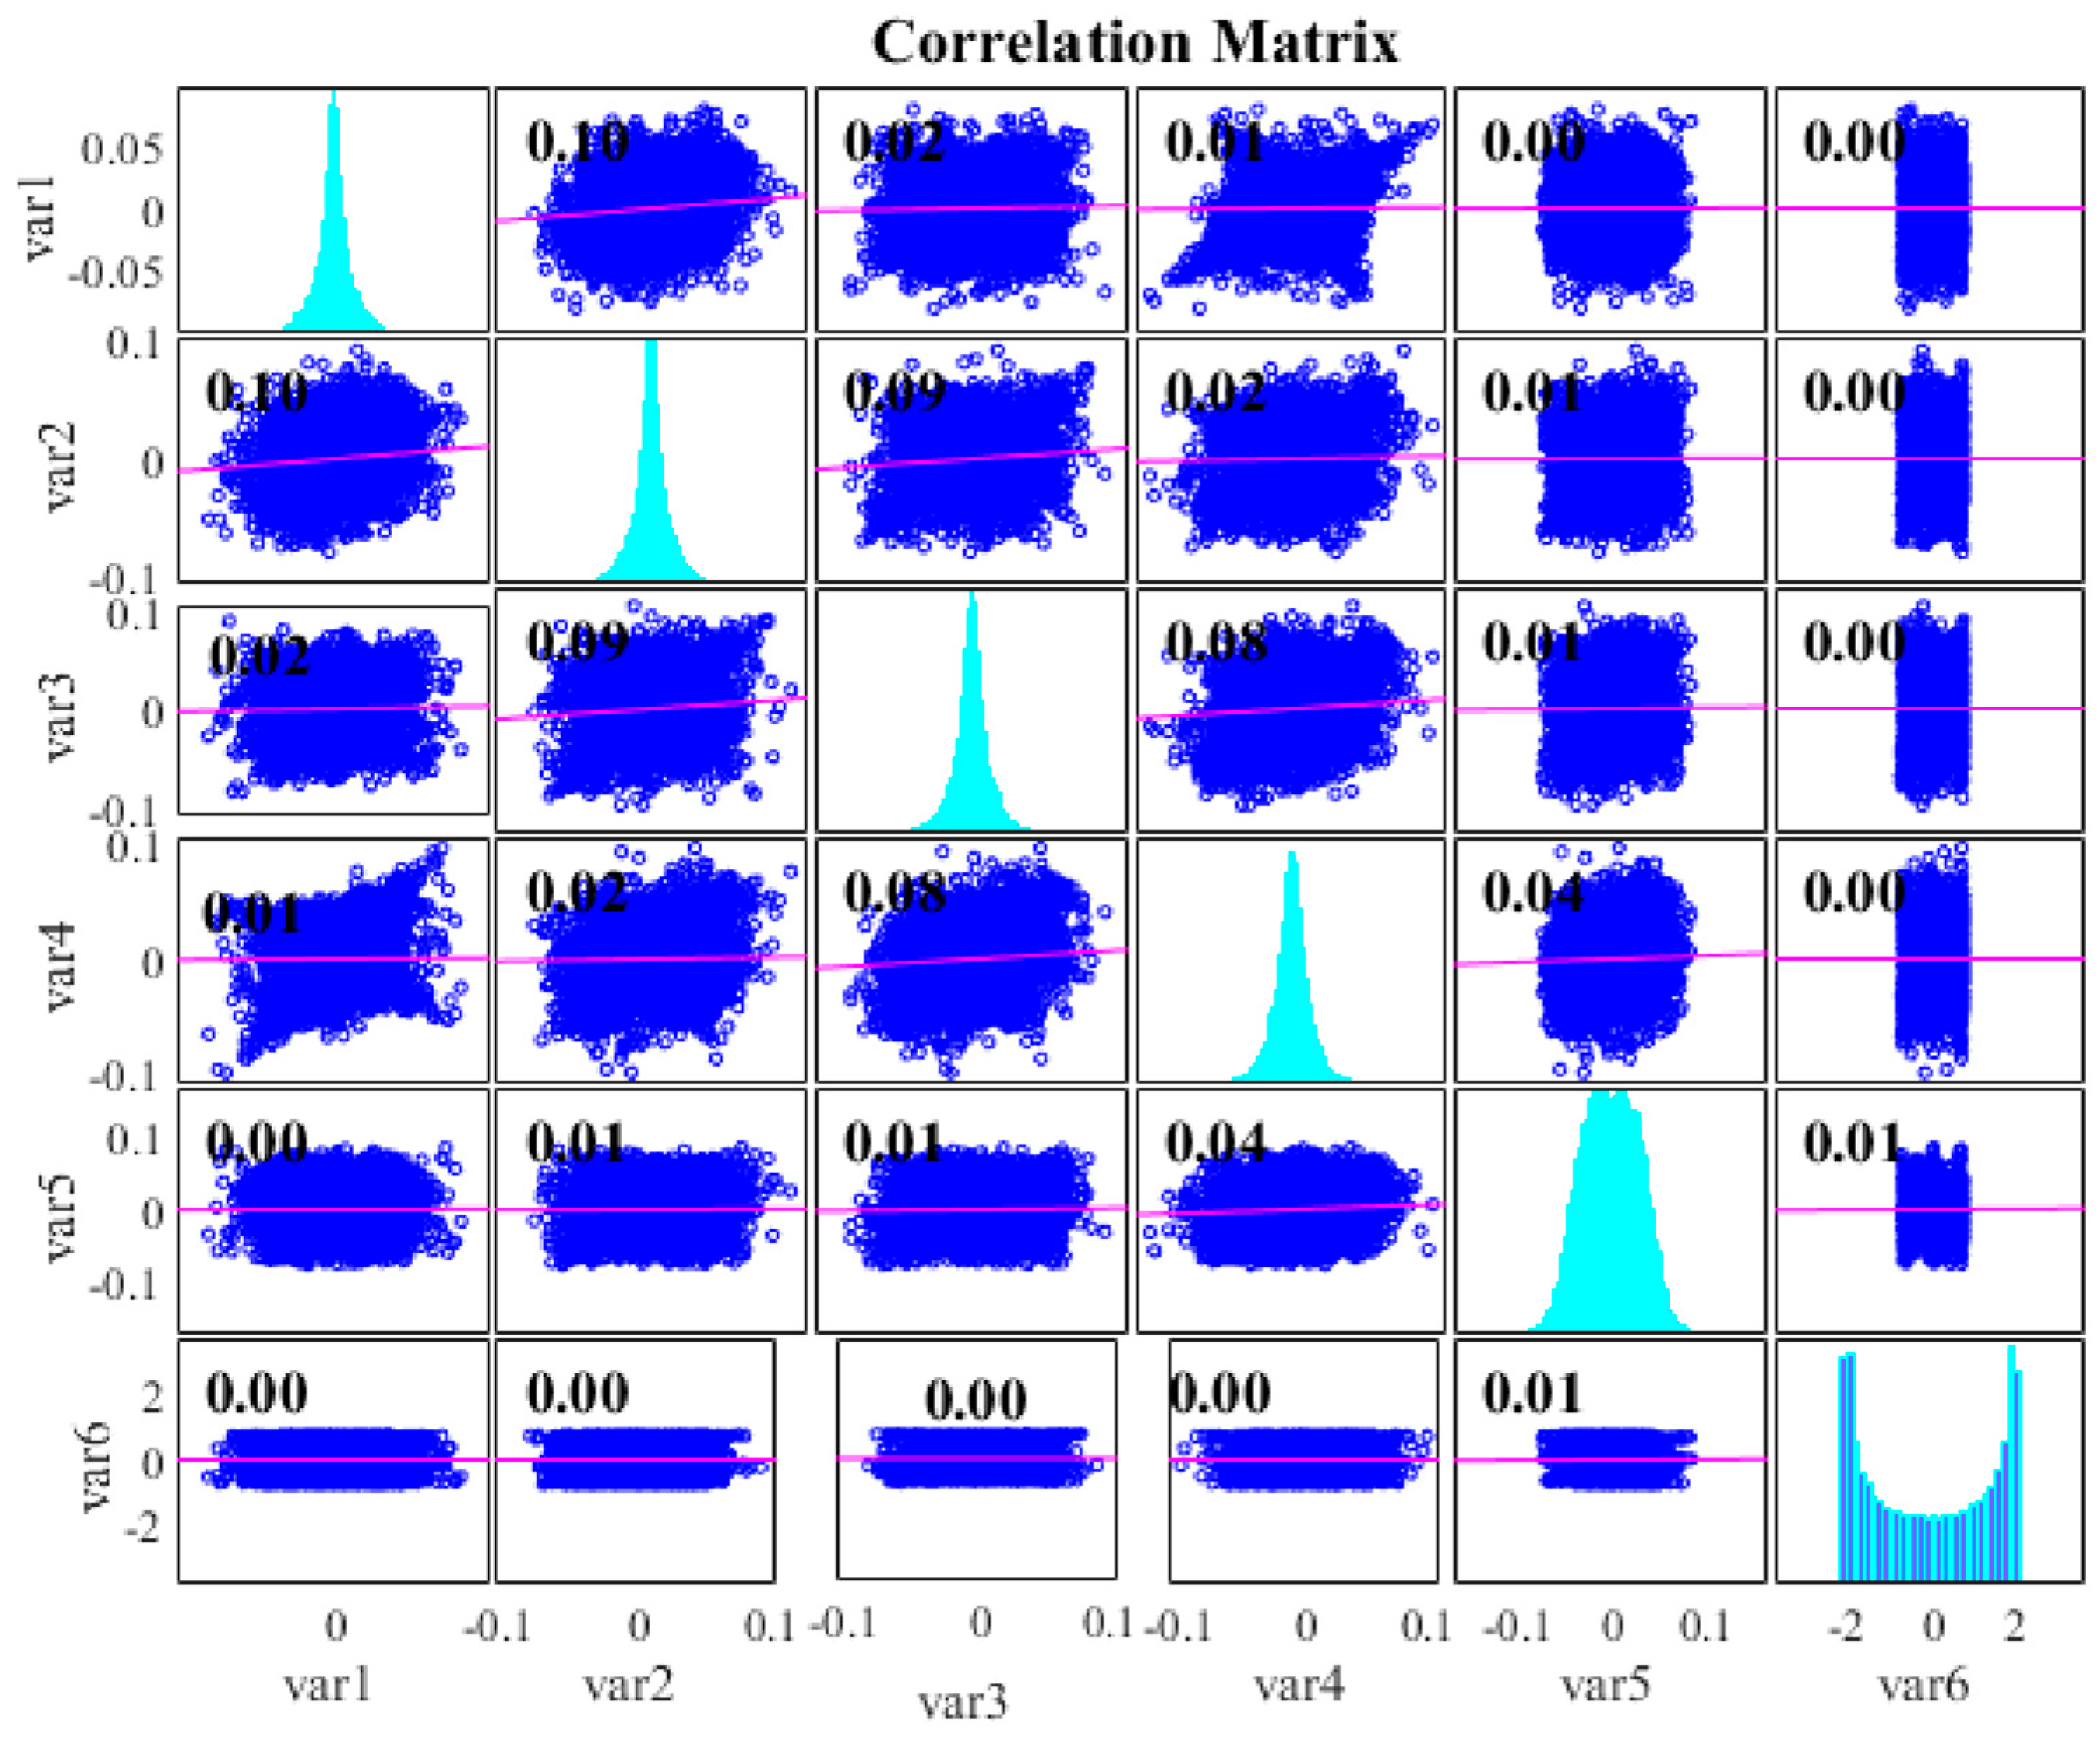
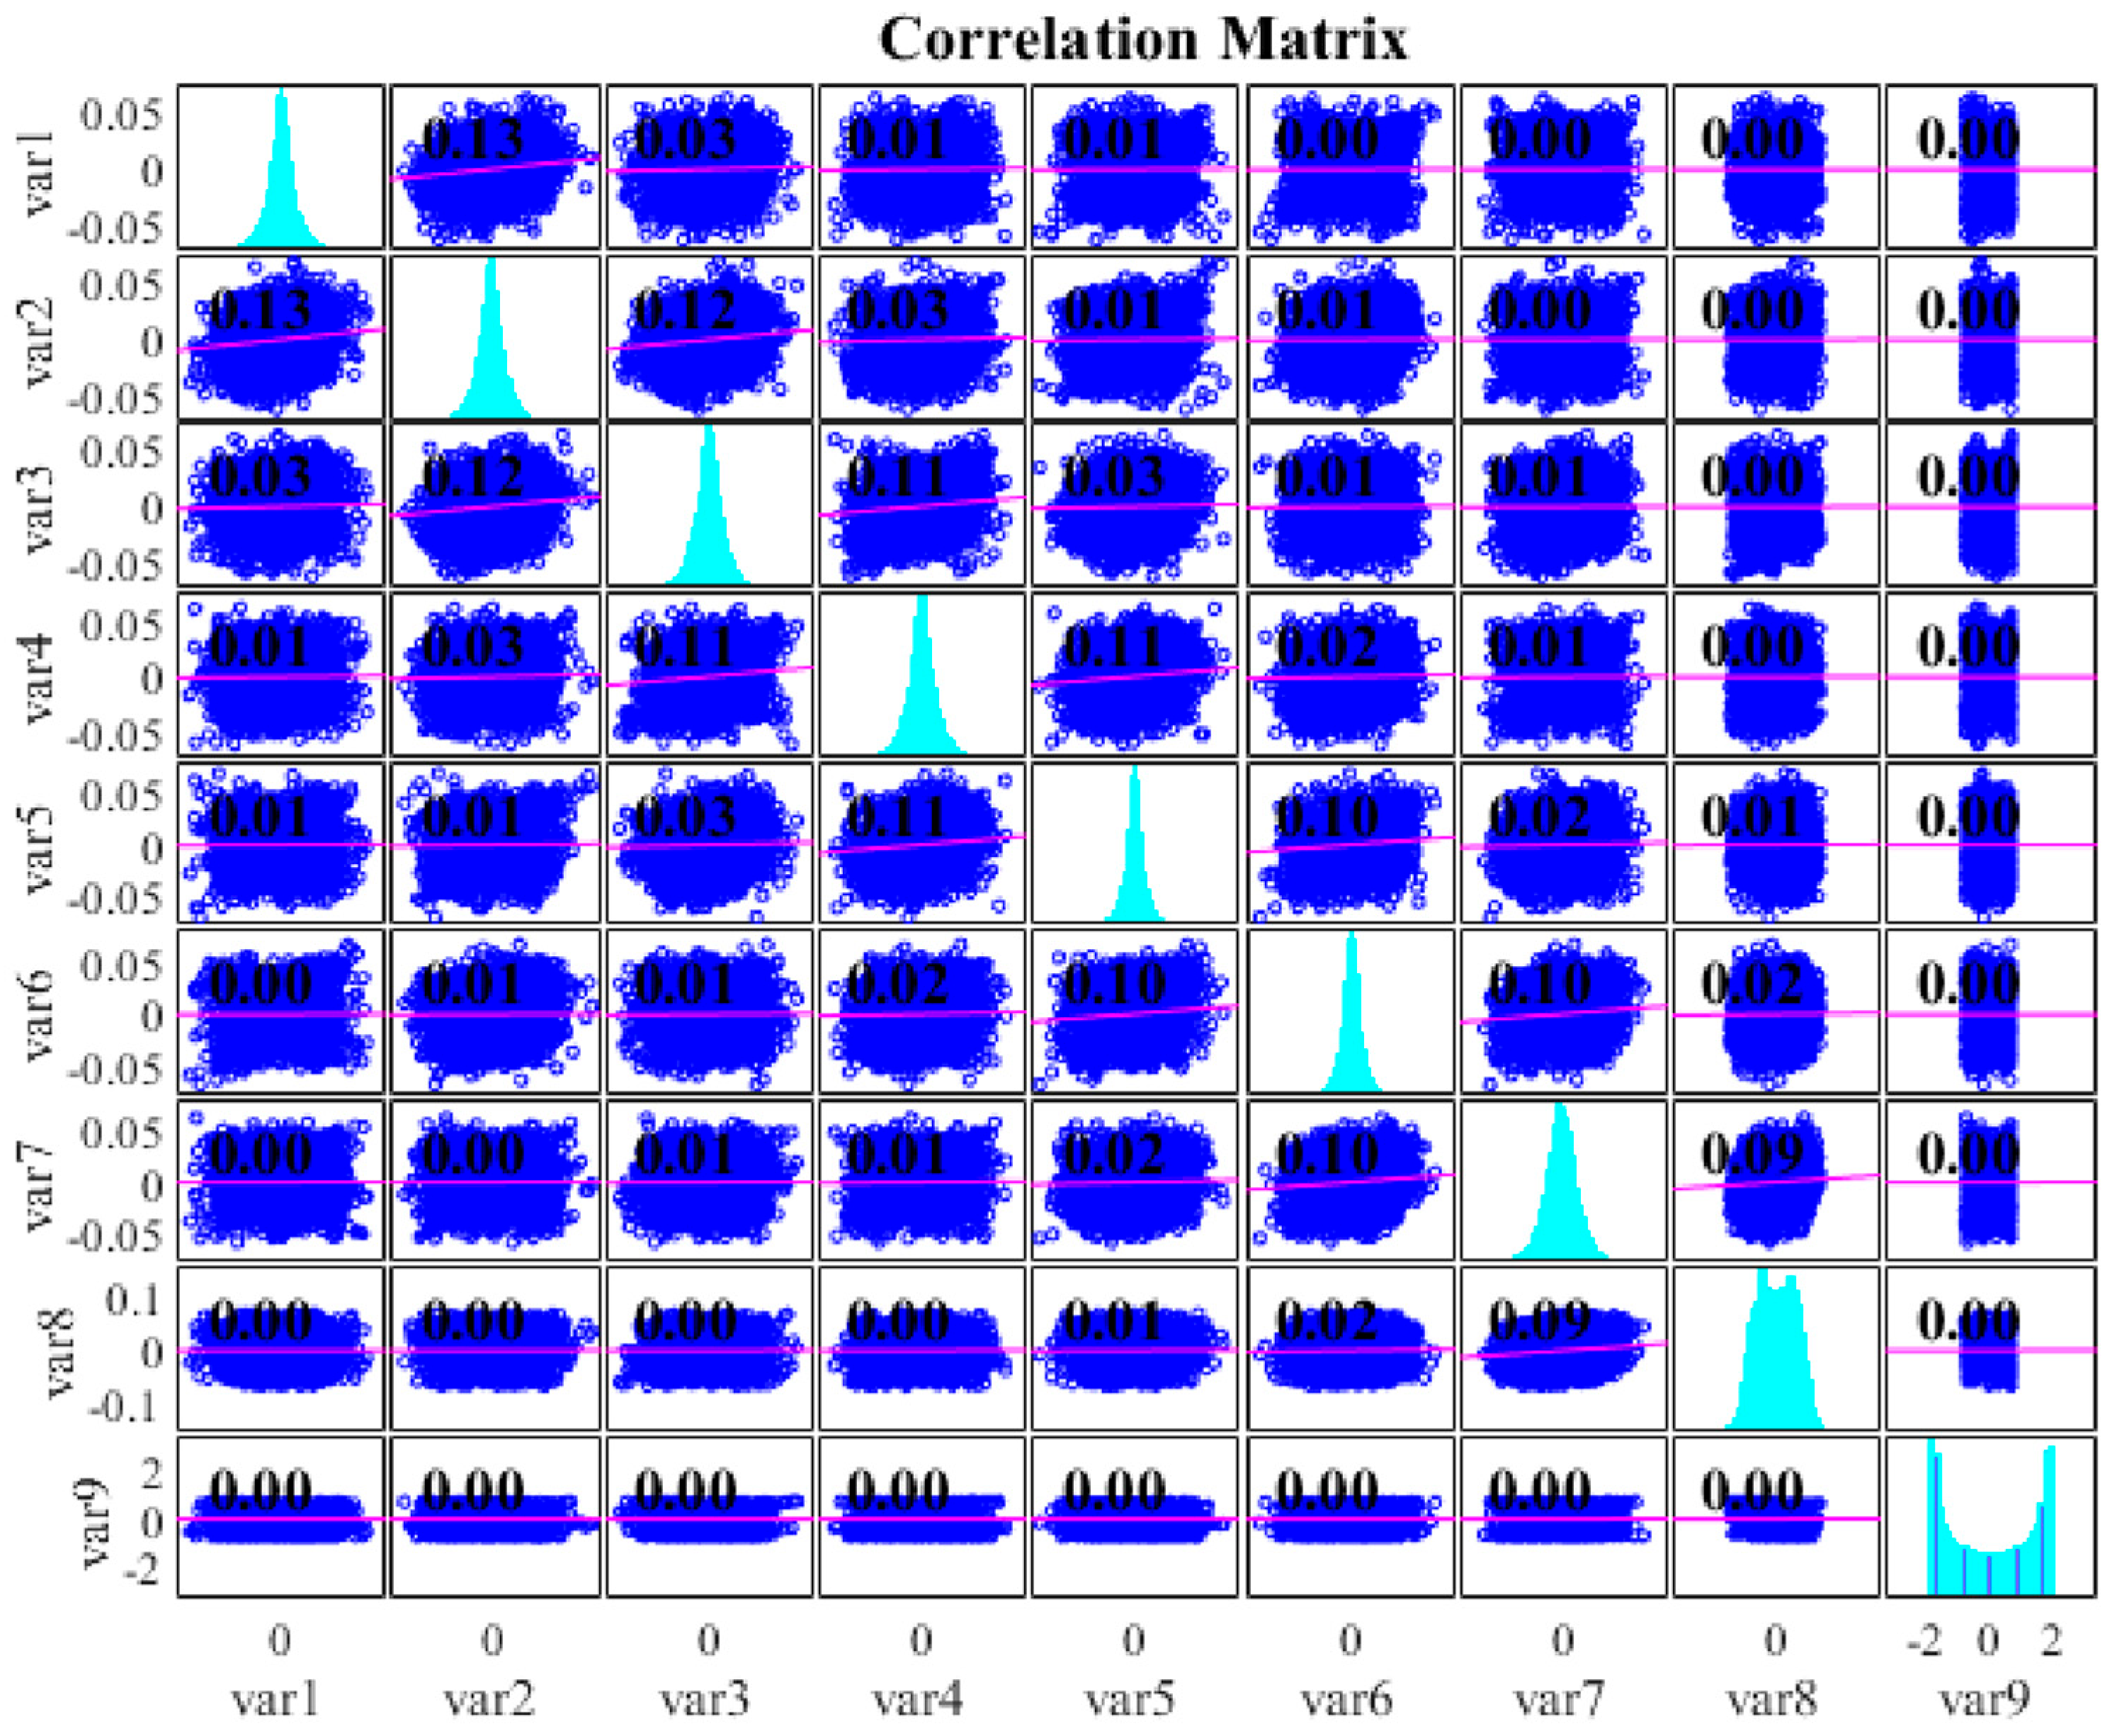
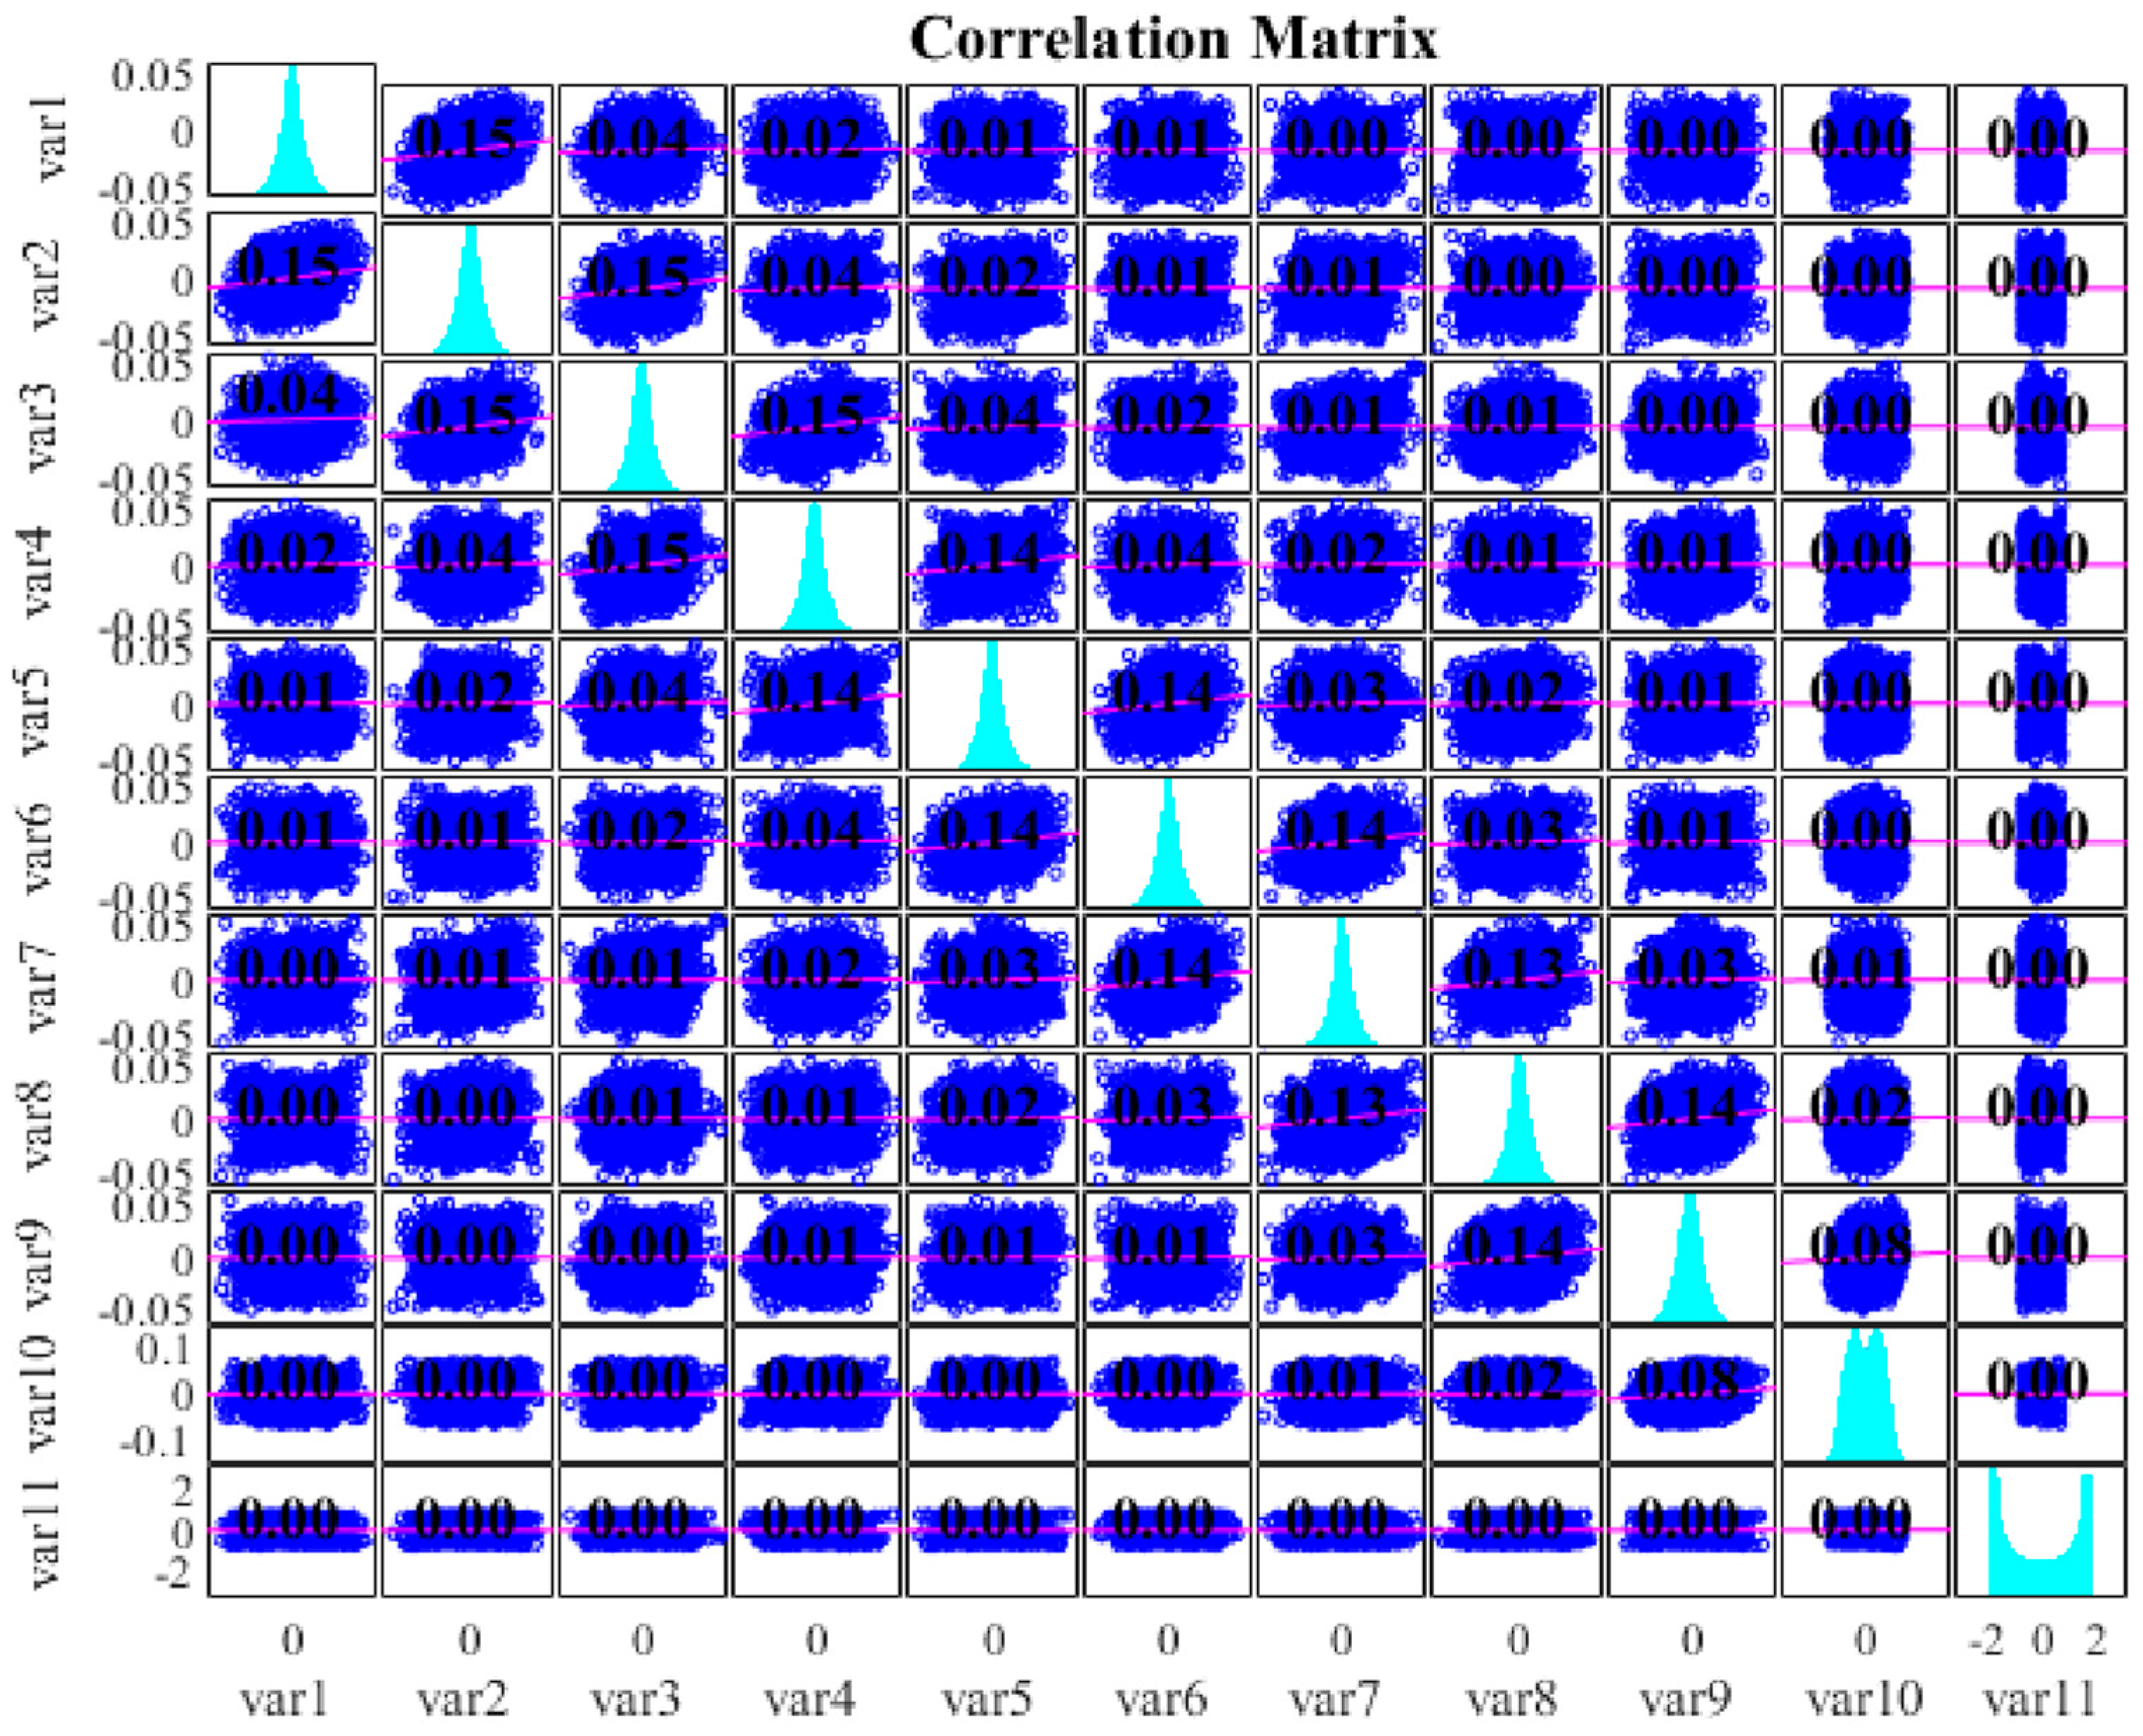
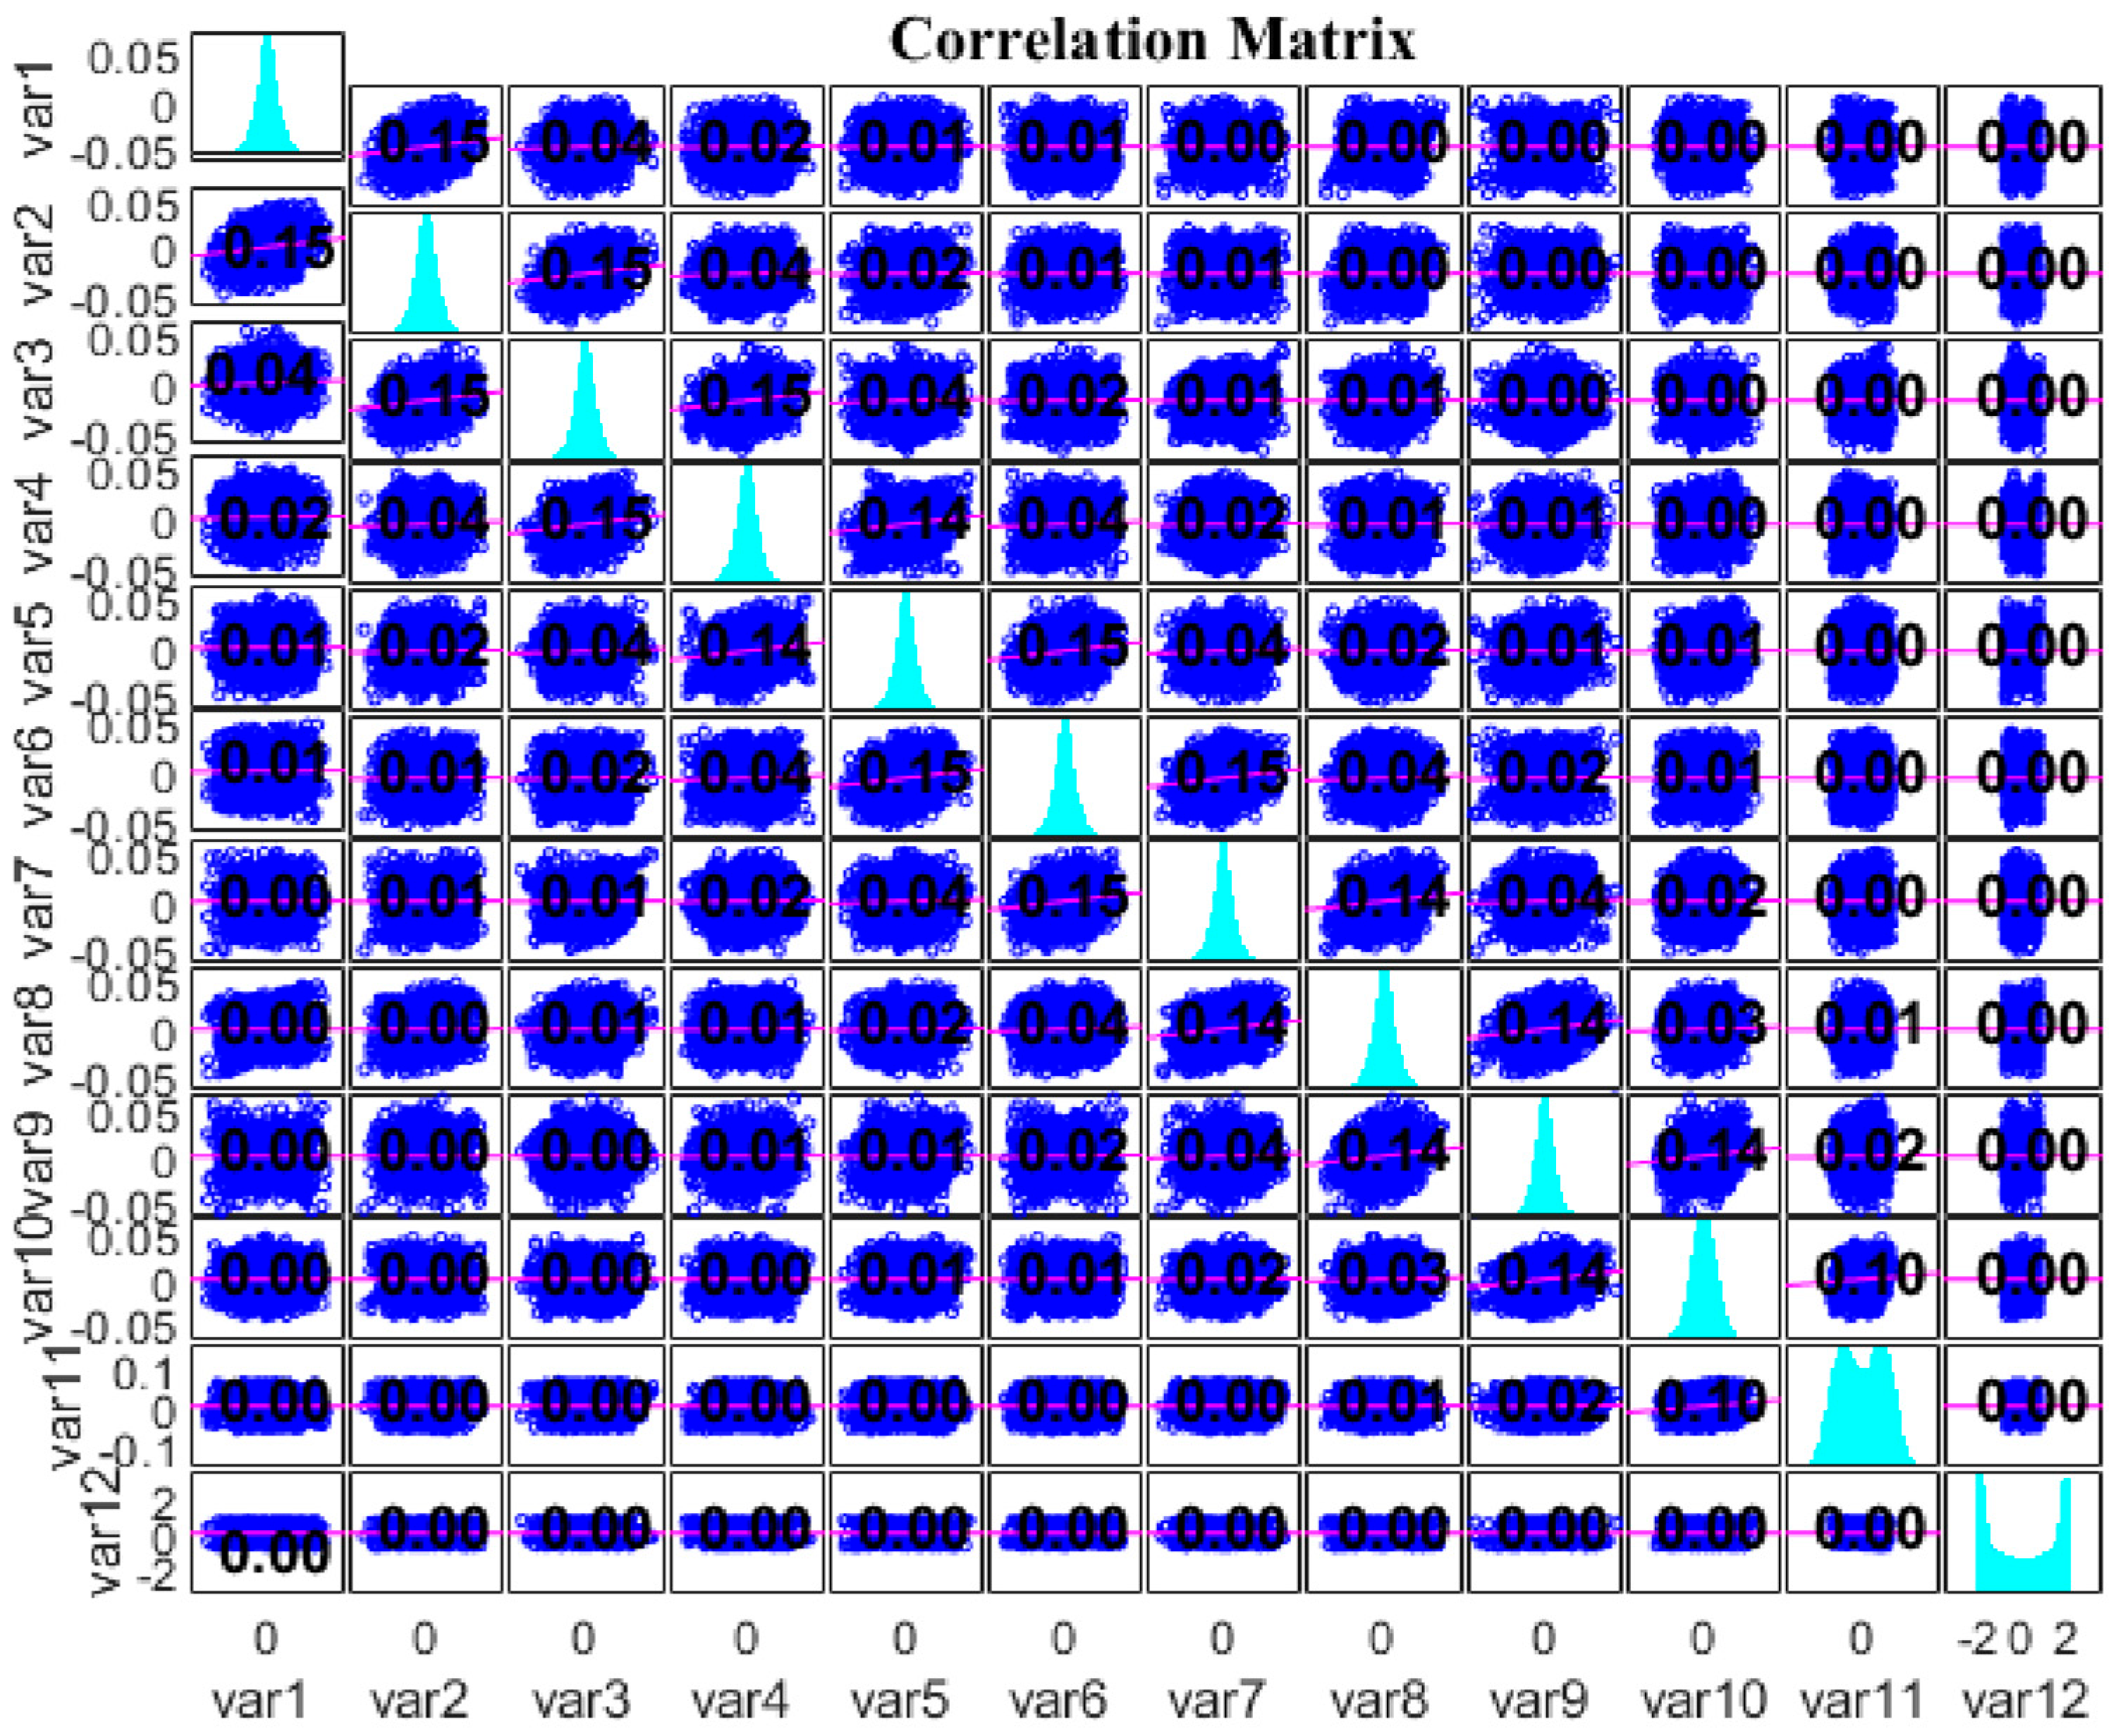
In the sampled current spectrum, the amplitude of the eccentricity-related component is much smaller than that of the supply-related component; thus, the penalty factor (α) was set to 1000 to preserve signal details. As summarized in Table 3, most studies recommend selecting K values within the range of 3 to 8 for healthy operating conditions (e.g., [51]). However, considering that the analyzed motor in this study may operate under faulty conditions, and the objective is to detect mixed eccentricity faults, it is recommended that the number of modes (K) be selected within the range of 5 to 10. This adjustment provides a more accurate decomposition and better representation of the fault-related components. The correlation analysis among the decomposed modes (illustrated in Figures 3–9) further supports this selection. Additionally, since the tested motor is directly connected to the grid without any filter in the supply path, the higher range of K (i.e., 5–10) was found to yield more stable and physically meaningful intrinsic mode components.
Figure 2, Figure 3, Figure 4, Figure 5, Figure 6, Figure 7 and Figure 8 show the correlation among the modes obtained from the sampled current signal for decomposition levels ranging from K = 4 to K = 6 and K = 9 to K = 12 . The correlation between the current signal modes, starting from Figure 7 (corresponding to K = 10 ), remains constant with further increases in the decomposition level. In other words, increasing the decomposition level does not affect the correlation values.

3. Experimental Validation of the Proposed VMD-Based Mixed Eccentricity Fault Detection Method
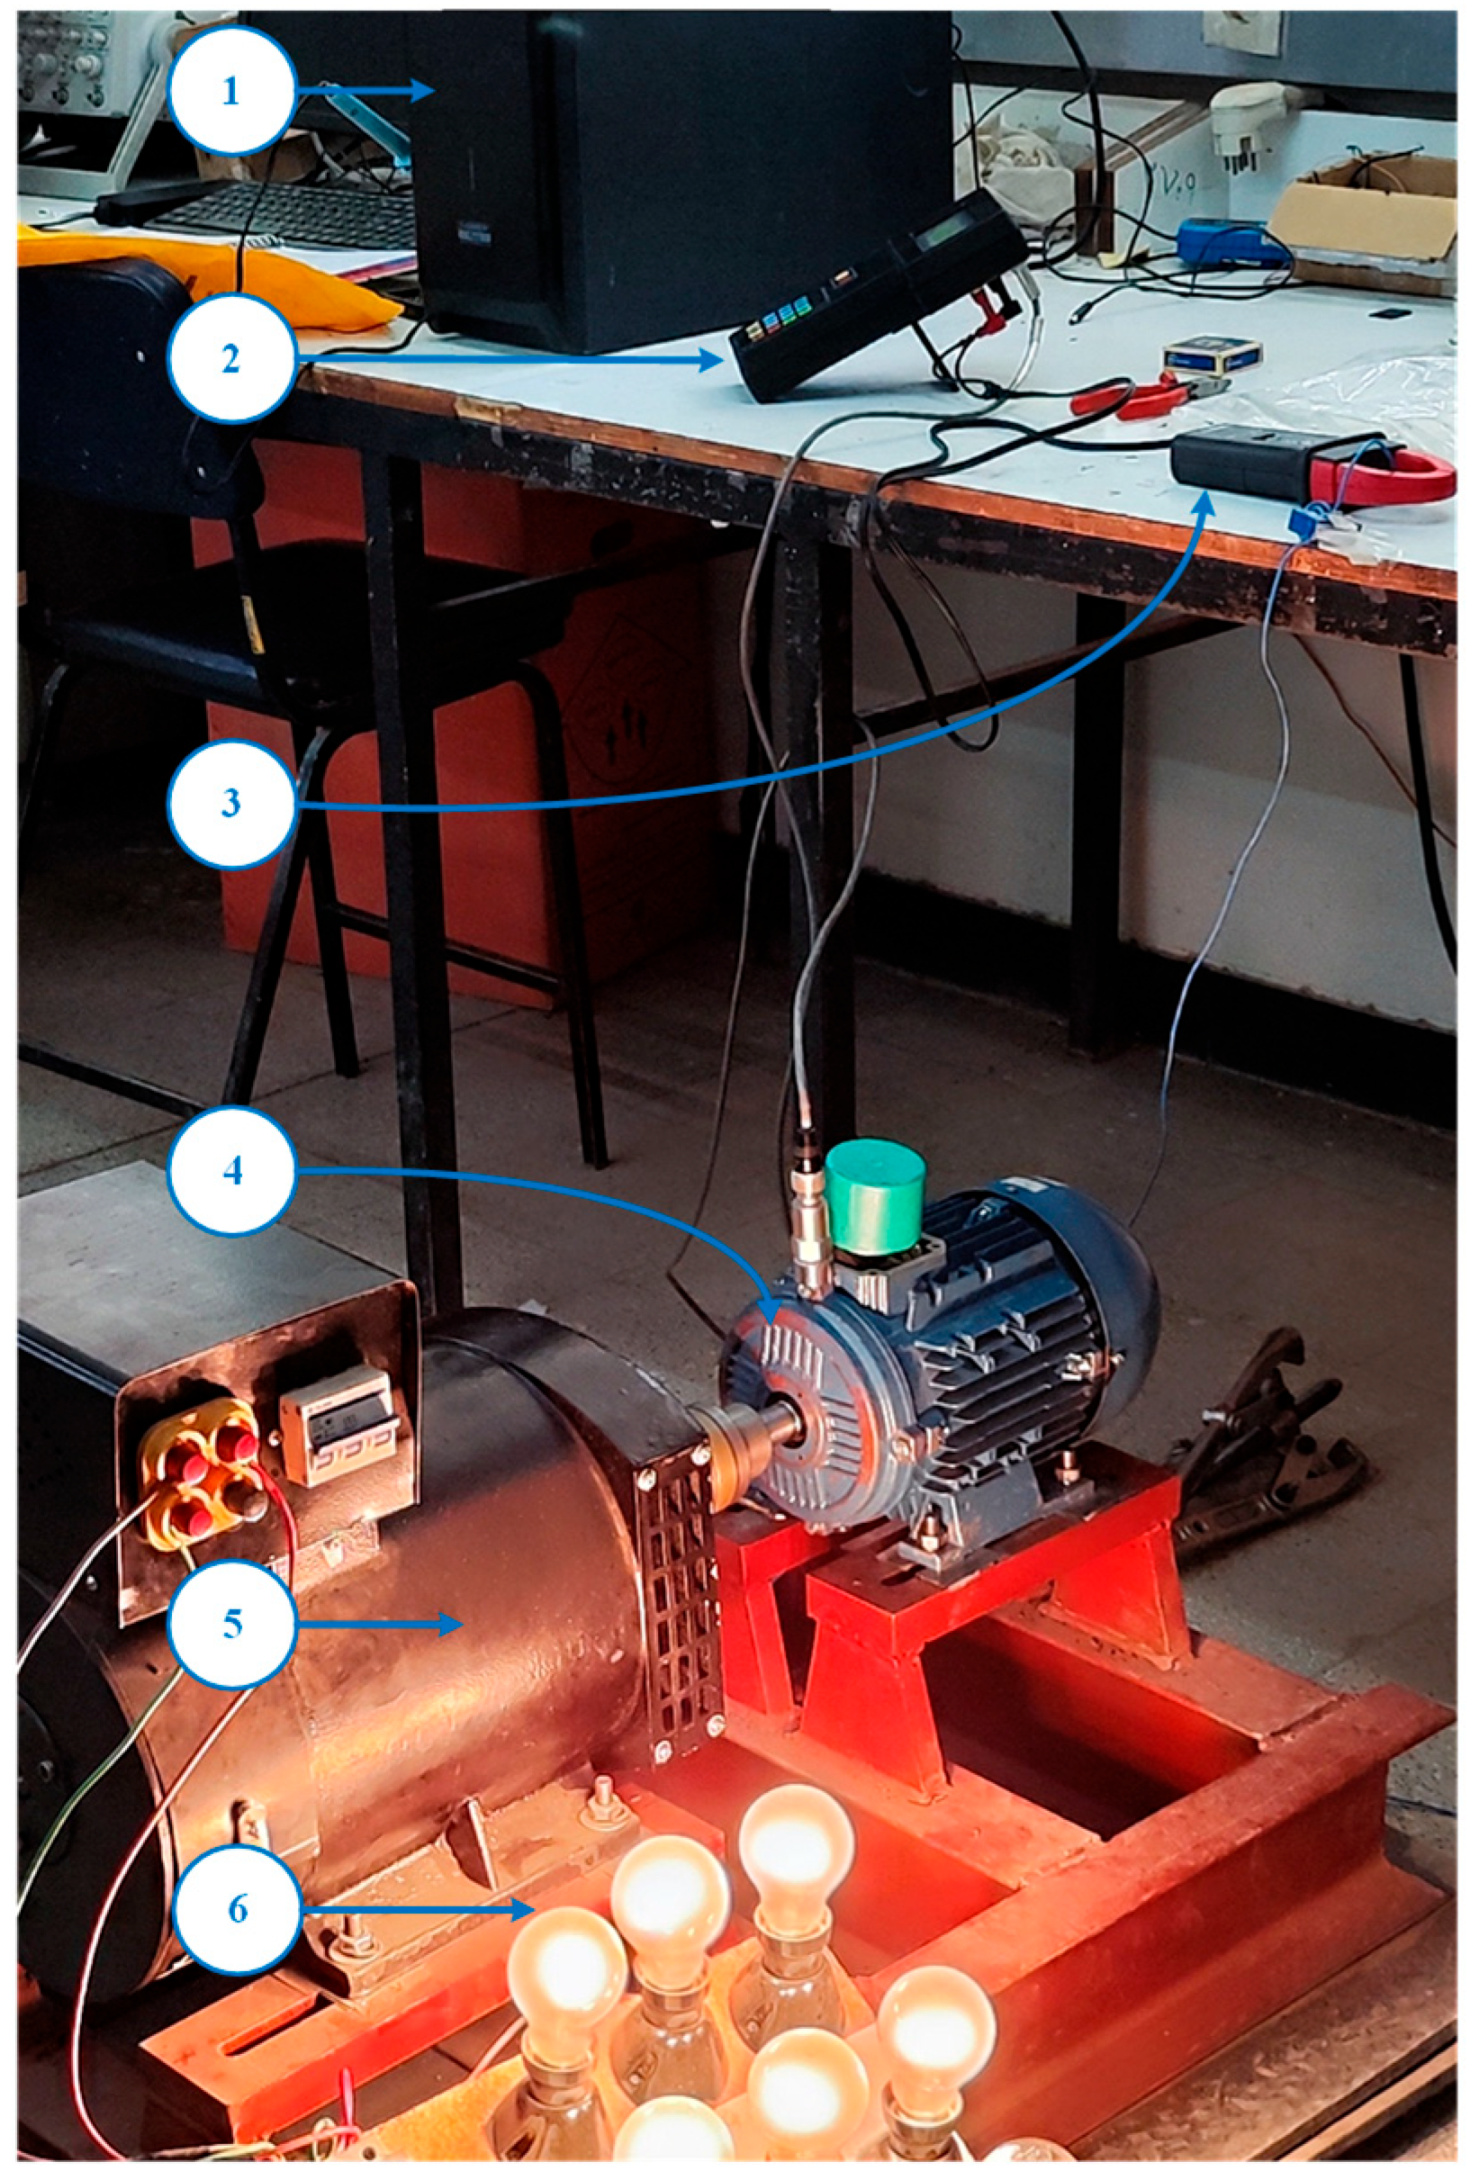
The proposed method is experimentally validated on a SCIM under both healthy and eccentric fault conditions. The experimental setup is depicted in Figure 9 and consists of a 1.5 kW induction motor mechanically coupled to a 3 kW self-excited synchronous generator, which serves as a controllable load. A 3 kW self-excited synchronous generator connected to a lamp load was employed to provide different loading percentages for the induction motor under test. A current clamp sensor (Chauvin Arnoux PAC11), with a bandwidth specified as DC up to 10 kHz at −3 dB, is used to capture the motor current, while a TMS320F28379D digital signal processor (DSP) performs data acquisition and preliminary processing. The specifications of the SCIM are provided in Table 4 for reference.
The DSP employs a 12-bit analog-to-digital converter (ADC), ensuring accurate conversion of the analog current signals into digital form. The current signals are transferred to a personal computer (PC) for further analysis using the proposed algorithm. Measurements were carried out under three different load conditions—12.5%, 50%, and 100% of the rated load—to assess the method’s robustness across operating ranges. For each test condition, the single-phase stator current was recorded continuously for 10 s at a sampling frequency of 10 kHz, providing sufficient temporal resolution to capture fault-related frequency components.
Figure 9. Experimental setup for mixed eccentricity fault detection: (1) PC, (2) DSP, (3) current clamp sensor, (4) SCIM under test, (5) generator, (6) electric load.
Machines 13 00968 g009
To mimic the rotor eccentricity, a new set of bearings are ordered for both the driving and non-driving ends, as shown in Figure 10. Three sets of four precisely manufactured rings are fabricated. The first set features four concentric rings, representing a healthy state with the new bearings. The remaining two sets also contain four rings each, but these rings are eccentric to simulate varying levels of Mixed Eccentricity (ME). One set has a 20% ME level (split between 10% Static Eccentricity (SE) and 10% Dynamic Eccentricity (DE)), while the other has a 30% ME level (divided into 15% SE and 15% DE).
Direct grid-connected induction motors, in both healthy conditions and with mixed eccentricity faults, are used under different load conditions to evaluate the effectiveness of the proposed fault detection method.
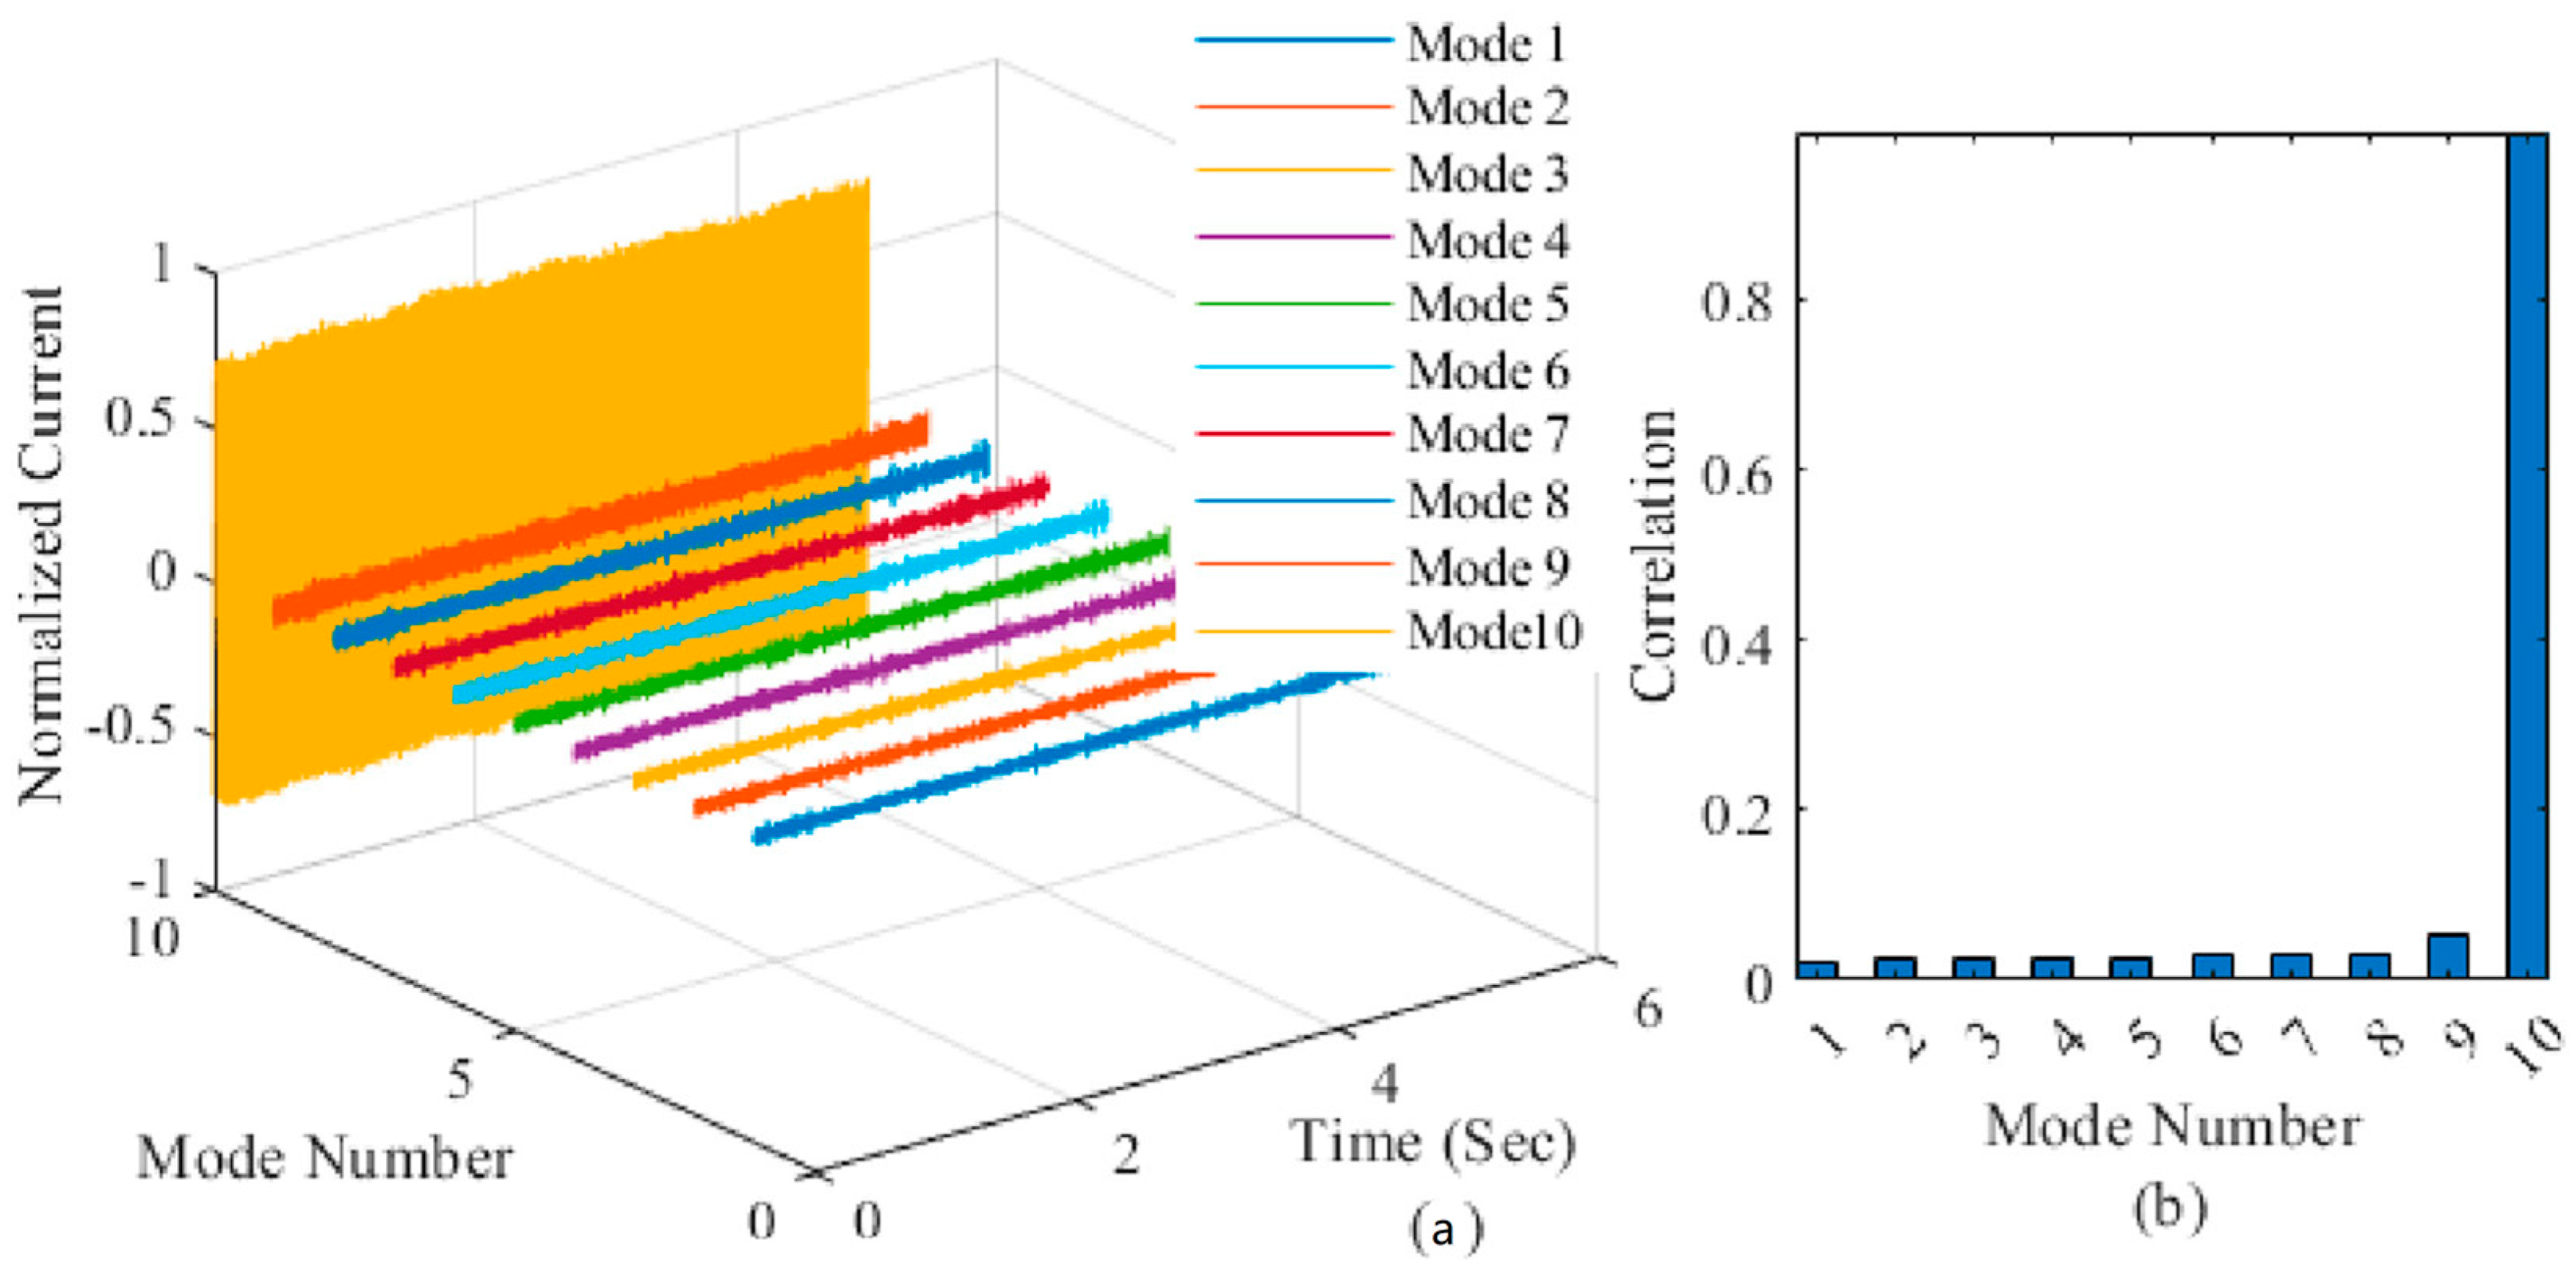
Figure 4 shows the VMD results on the normalized current signal of the eccentric motor and the correlation between the obtained modes and the main signal. For a given current signal, x t , the following expression is used to normalize the signal in the range of [−1, 1]:
x N ( t ) 1 , 1 = 2 x t x m i n x m a x x m i n 1
where x m a x and x m i n respectively represent the signal’s maximum and minimum values.
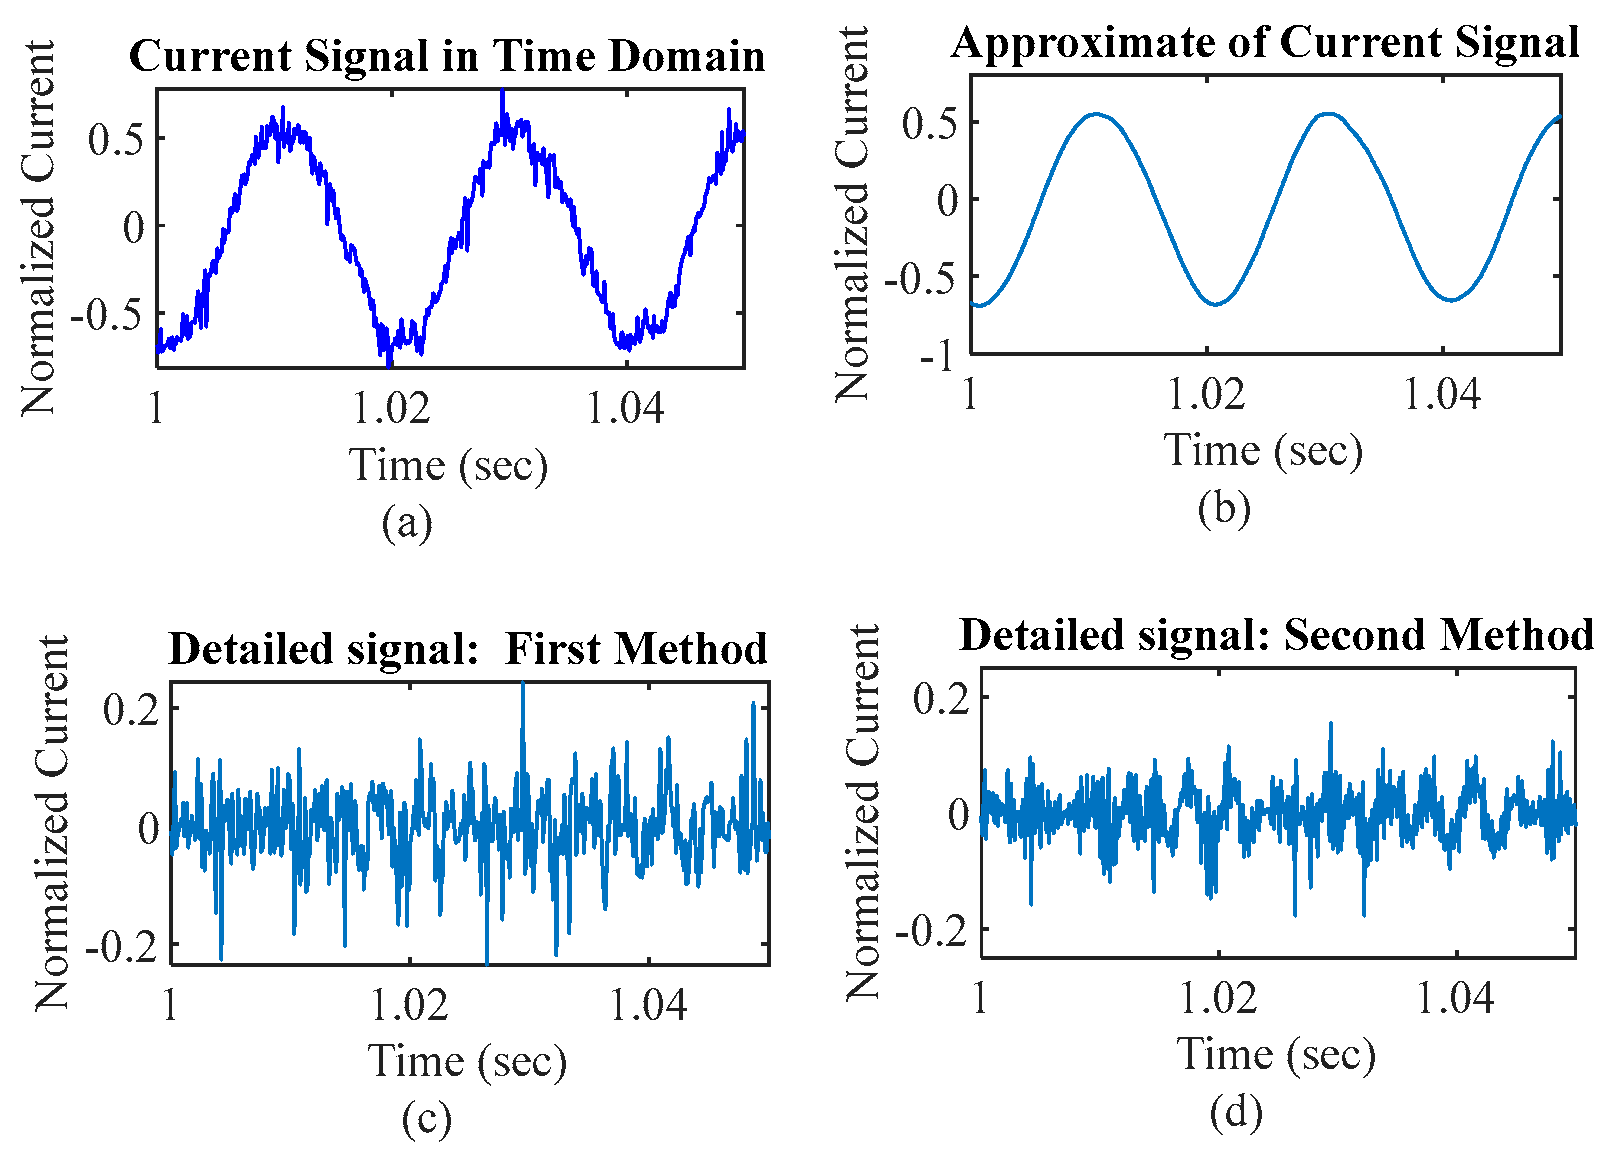
It is evident from Figure 11 that mode 10 is M a as represented in (13), i.e., the main frequency component of the current signal and can be inferred the approximate of the current signal. Figure 12 illustrates the normalized current, its approximated signal and its detailed signals based on the first and second methods in the time domain for the IM under 30% eccentricity and 12.5% of the rated load conditions.
Figure 13a,b show, respectively, the frequency spectra of the current signal and its approximate. As evident the amplitude of the eccentric fault characteristic frequencies, i.e., 24.996 and 74.588 Hz, are significantly smaller than the amplitude of the power supply frequency, i.e., 50 Hz. Figure 13c,d show the detailed signals obtained from the first and second methods for the IM under 30% eccentricity and 12.5% of the rated load conditions. In the detailed signals, the effect of the power supply frequency is excluded that helps to diagnose eccentric fault effectively. The proposed signal processing algorithm effectively preserves the amplitude of the sampled current signal, as evidenced by the equivalence between the combined amplitude of frequency components in the approximate and detailed signals (see Figure 13). This minimal distortion of the original signal is a key advantage of the proposed method.
To demonstrate the effectiveness of the proposed fault detection approach, its results are compared with those obtained using Fast Fourier Transform (FFT), Empirical Mode Decomposition (EMD), and Ensemble Empirical Mode Decomposition (EEMD).

4. Discussion and Analysis of Experimental Results Using Current Signal Decomposition Methods (EMD, EEMD, and VMD)

The results of the fault detection method using FFT analysis of current signal amplitude at f s     f r are shown in Figure 14. As evident, FFT alone could not diagnose the eccentric fault and may lead to false positive. In Figure 14, Figure 15, Figure 16, Figure 17 and Figure 18, the labels 12.5%, 50%, and 100% refer to the motor load levels. Specifically, 12.5% indicates 12.5% of the full load, while 100% represents the motor operating at full load.
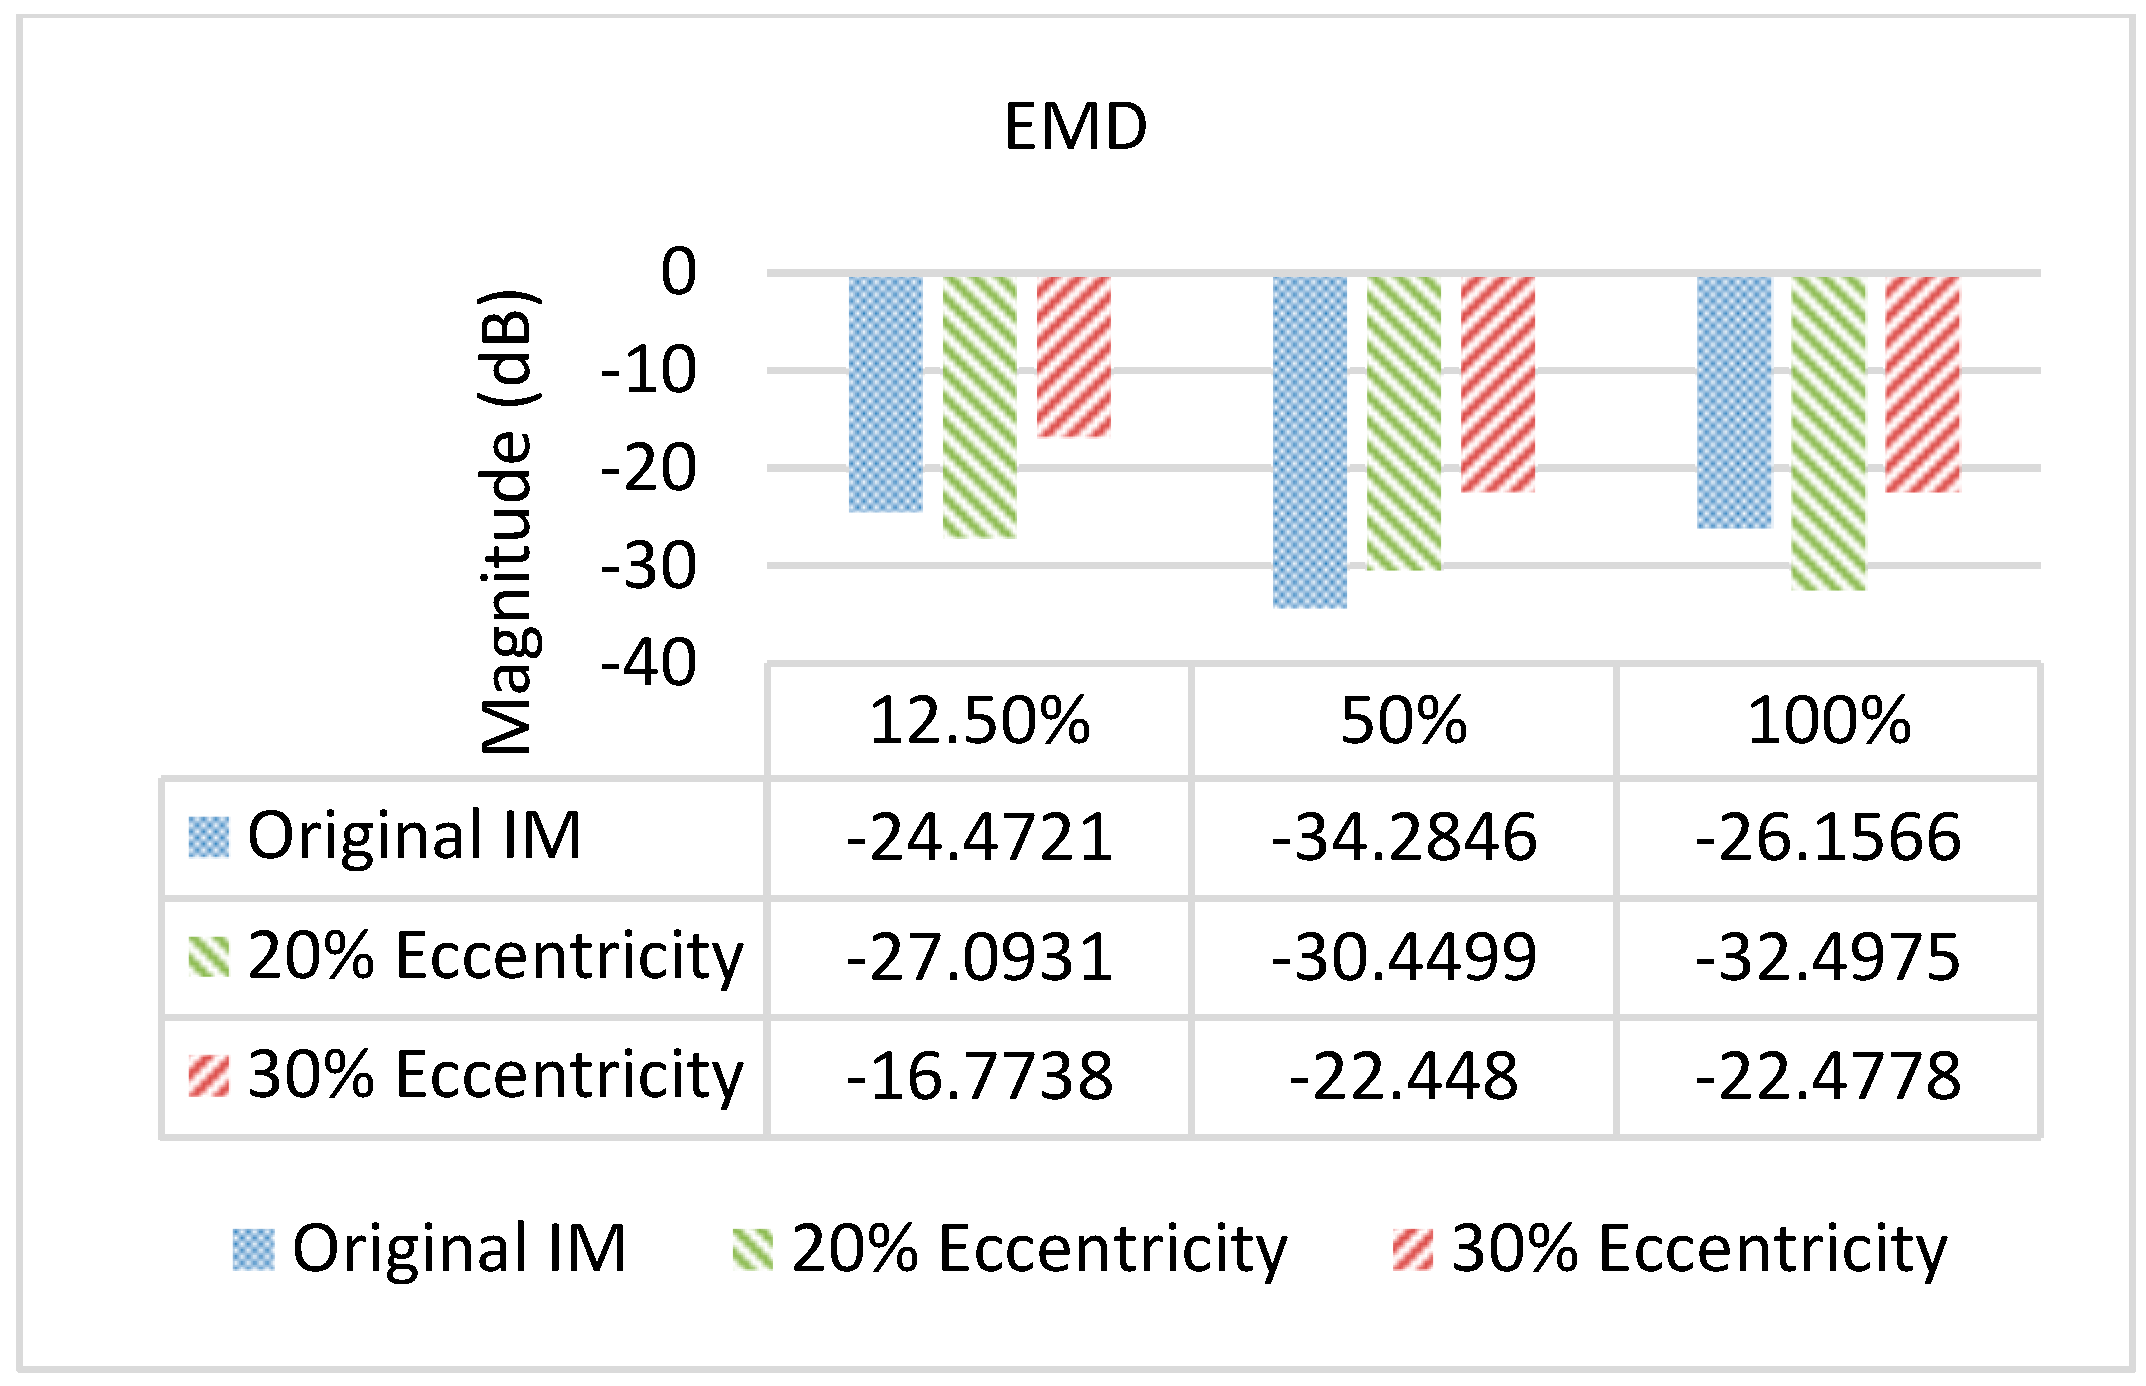
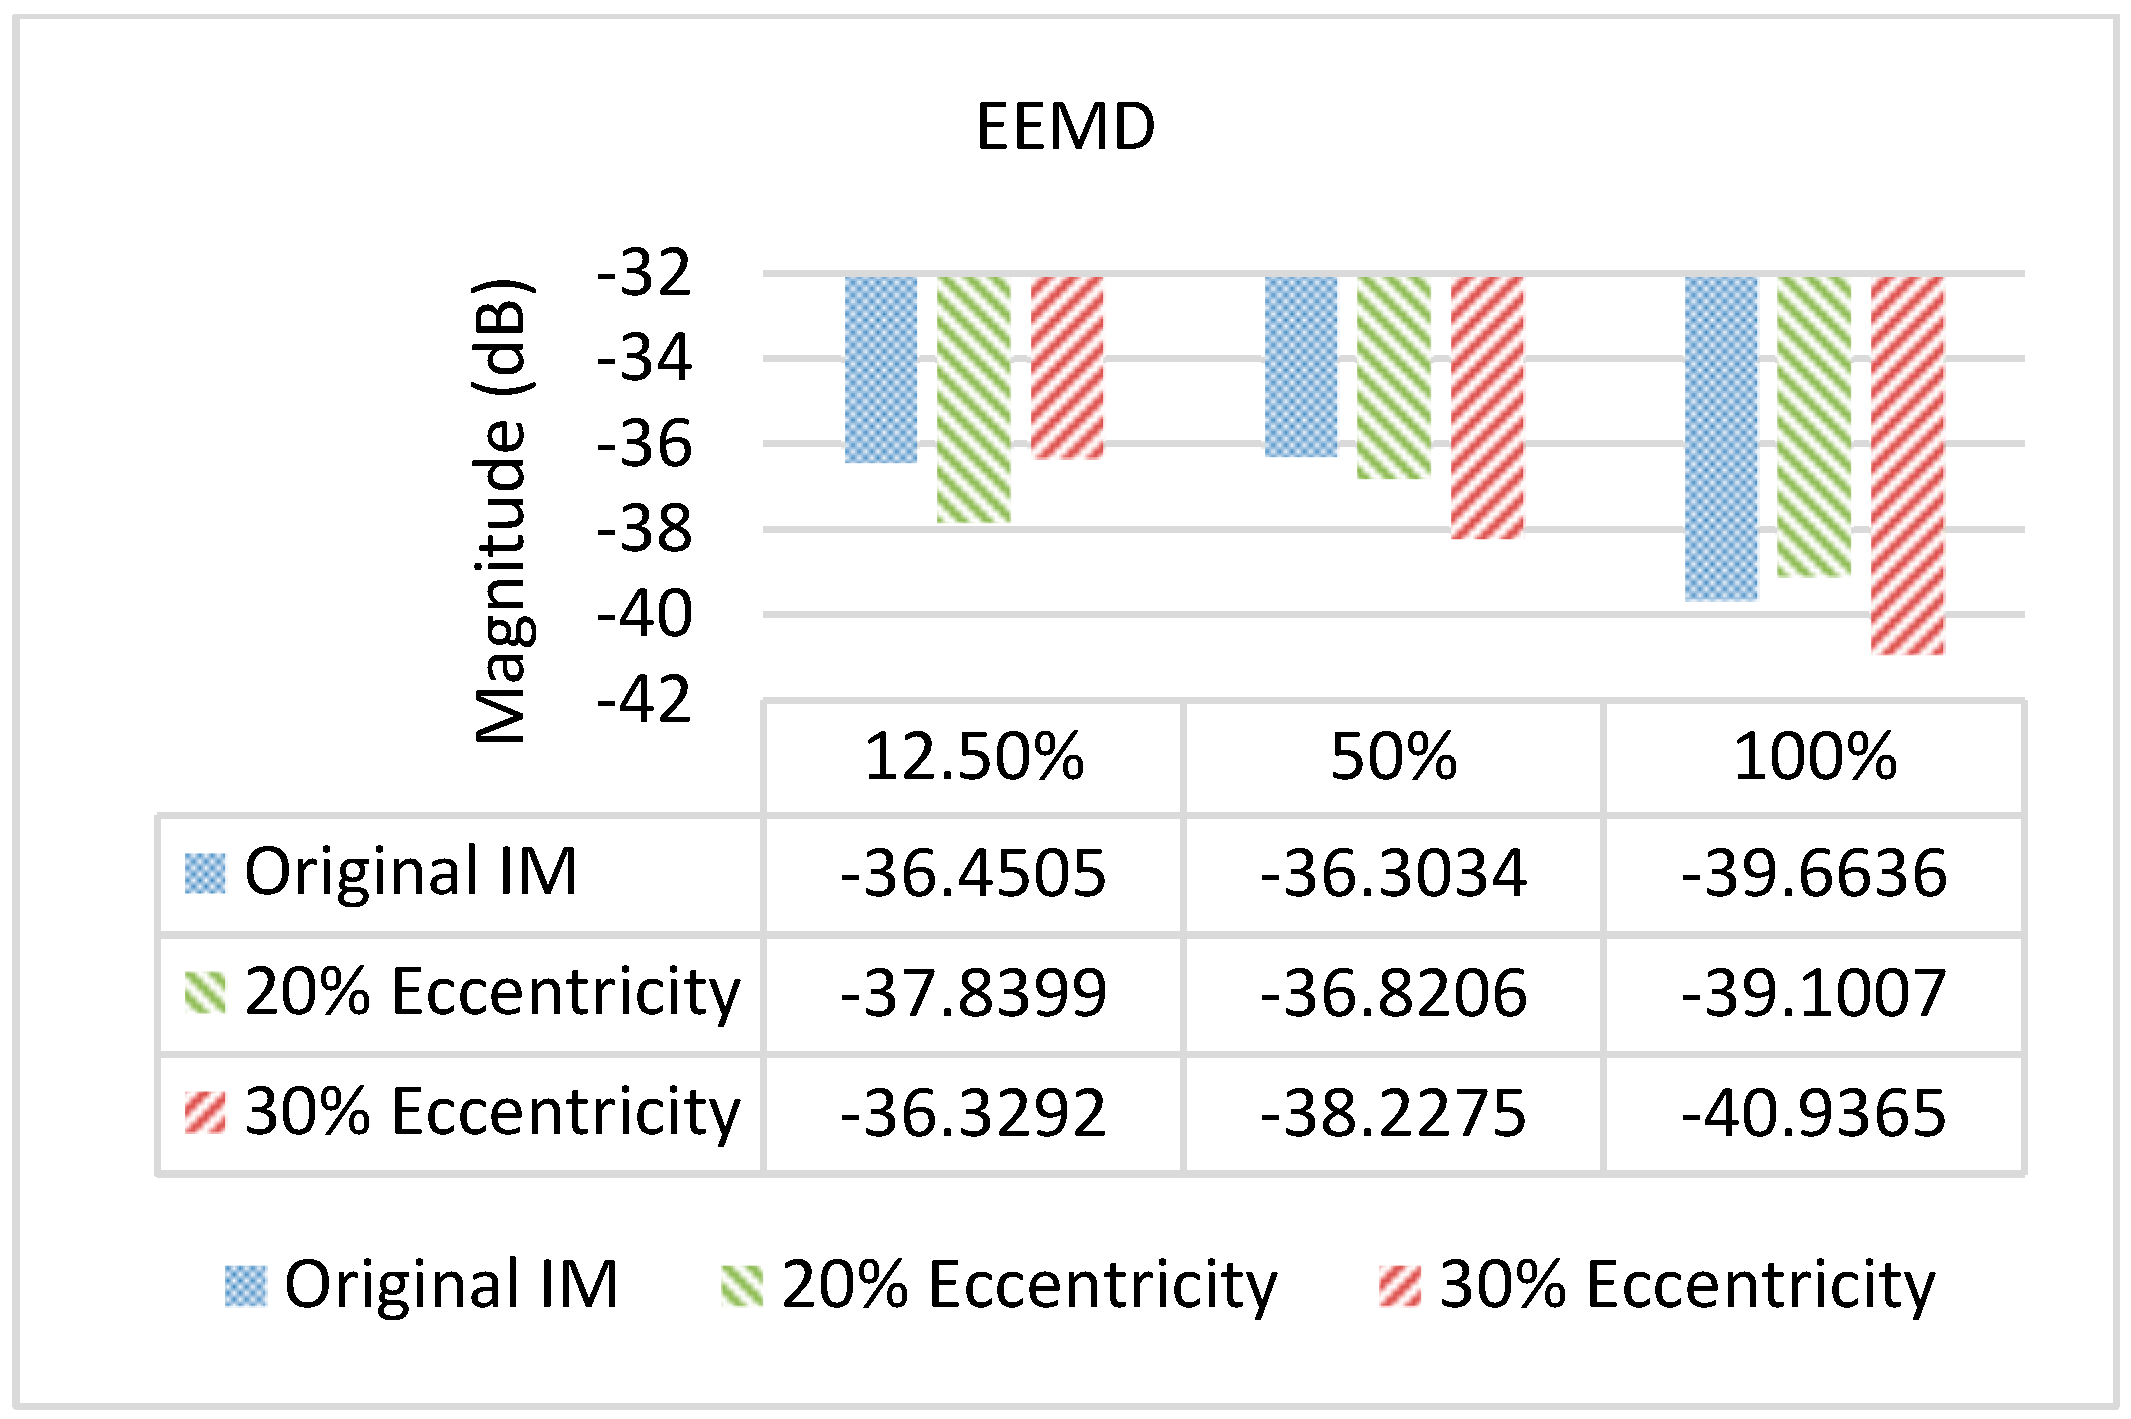
Figure 15 and Figure 16 depict the results of the fault detection method based on the EMD and EEMD methods of the current signal. More information on EEMD can be found in [54]. Similarly, these two methods, which rely on analyzing the amplitude of the mixed eccentricity frequency in the detailed signal ( f s     f r ), are ineffective in eccentric fault detection.
Under the 20% mixed eccentricity fault at 12.5% motor load, the FFT method produced one misdetection, whereas the EMD and EEMD methods yielded two and four misdetections, respectively. EMD and EEMD each have unique characteristics and are used for different aspects of signal processing and fault analysis. EMD is a method used to decompose a signal into a set of intrinsic mode functions (IMFs) based on local characteristics of the signal. It is particularly useful for analyzing non-stationary and non-linear signals. However, EMD can suffer from mode mixing, where a single IMF may consist of signals of widely different scales, or similar signals may be present in different IMFs. EEMD is an improvement over EMD, designed to alleviate the mode mixing problem by adding white noise to the signal being analyzed. The added noise helps to separate the scales naturally, reducing the occurrence of mode mixing. In EEMD, the true intrinsic mode function (IMF) components are obtained as the ensemble average of multiple trials, each formed by adding white noise to the original signal. EMD and EEMD methods suffer from two limitations. First, they lack a strong mathematical foundation. Second, they can potentially produce different results for the same data depending on the analysis parameters [55].
Signal decomposition methods like VMD, EEMD, and EMD have advantages in fault detection because they can break down a complicated signal into simpler, yet similar, components, which can be analyzed more efficiently. VMD, on the other hand, is a non-recursive signal decomposition method that decomposes a signal into a predetermined number of band-limited modes through an iterative process. VMD aims to minimize the bandwidth of each mode by solving a constrained variational problem, which makes it less sensitive to noise compared to EMD and EEMD. In the context of fault detection in induction machines, these methods are used to process signals to extract fault features. EMD and EEMD are often used to identify the characteristic frequencies associated with different types of faults, while VMD, with its adaptive signal analysis capability, can provide better performance in signal decomposition and feature extraction, especially when dealing with weak fault influence components. A fault detection method analyzes the detail of the current signal based on the first and second methods for a specific frequency component ( f s     f r ) linked to the mixed eccentricity. The performance of signal decomposition methods based on EMD, EEMD, and the proposed VMD was evaluated specifically for current signal decomposition and the detection of mixed eccentricity faults under different fault severities and loading conditions. It should be noted that the performance of EMD, EEMD, and VMD for detecting other types of machine faults has not been investigated in this study.
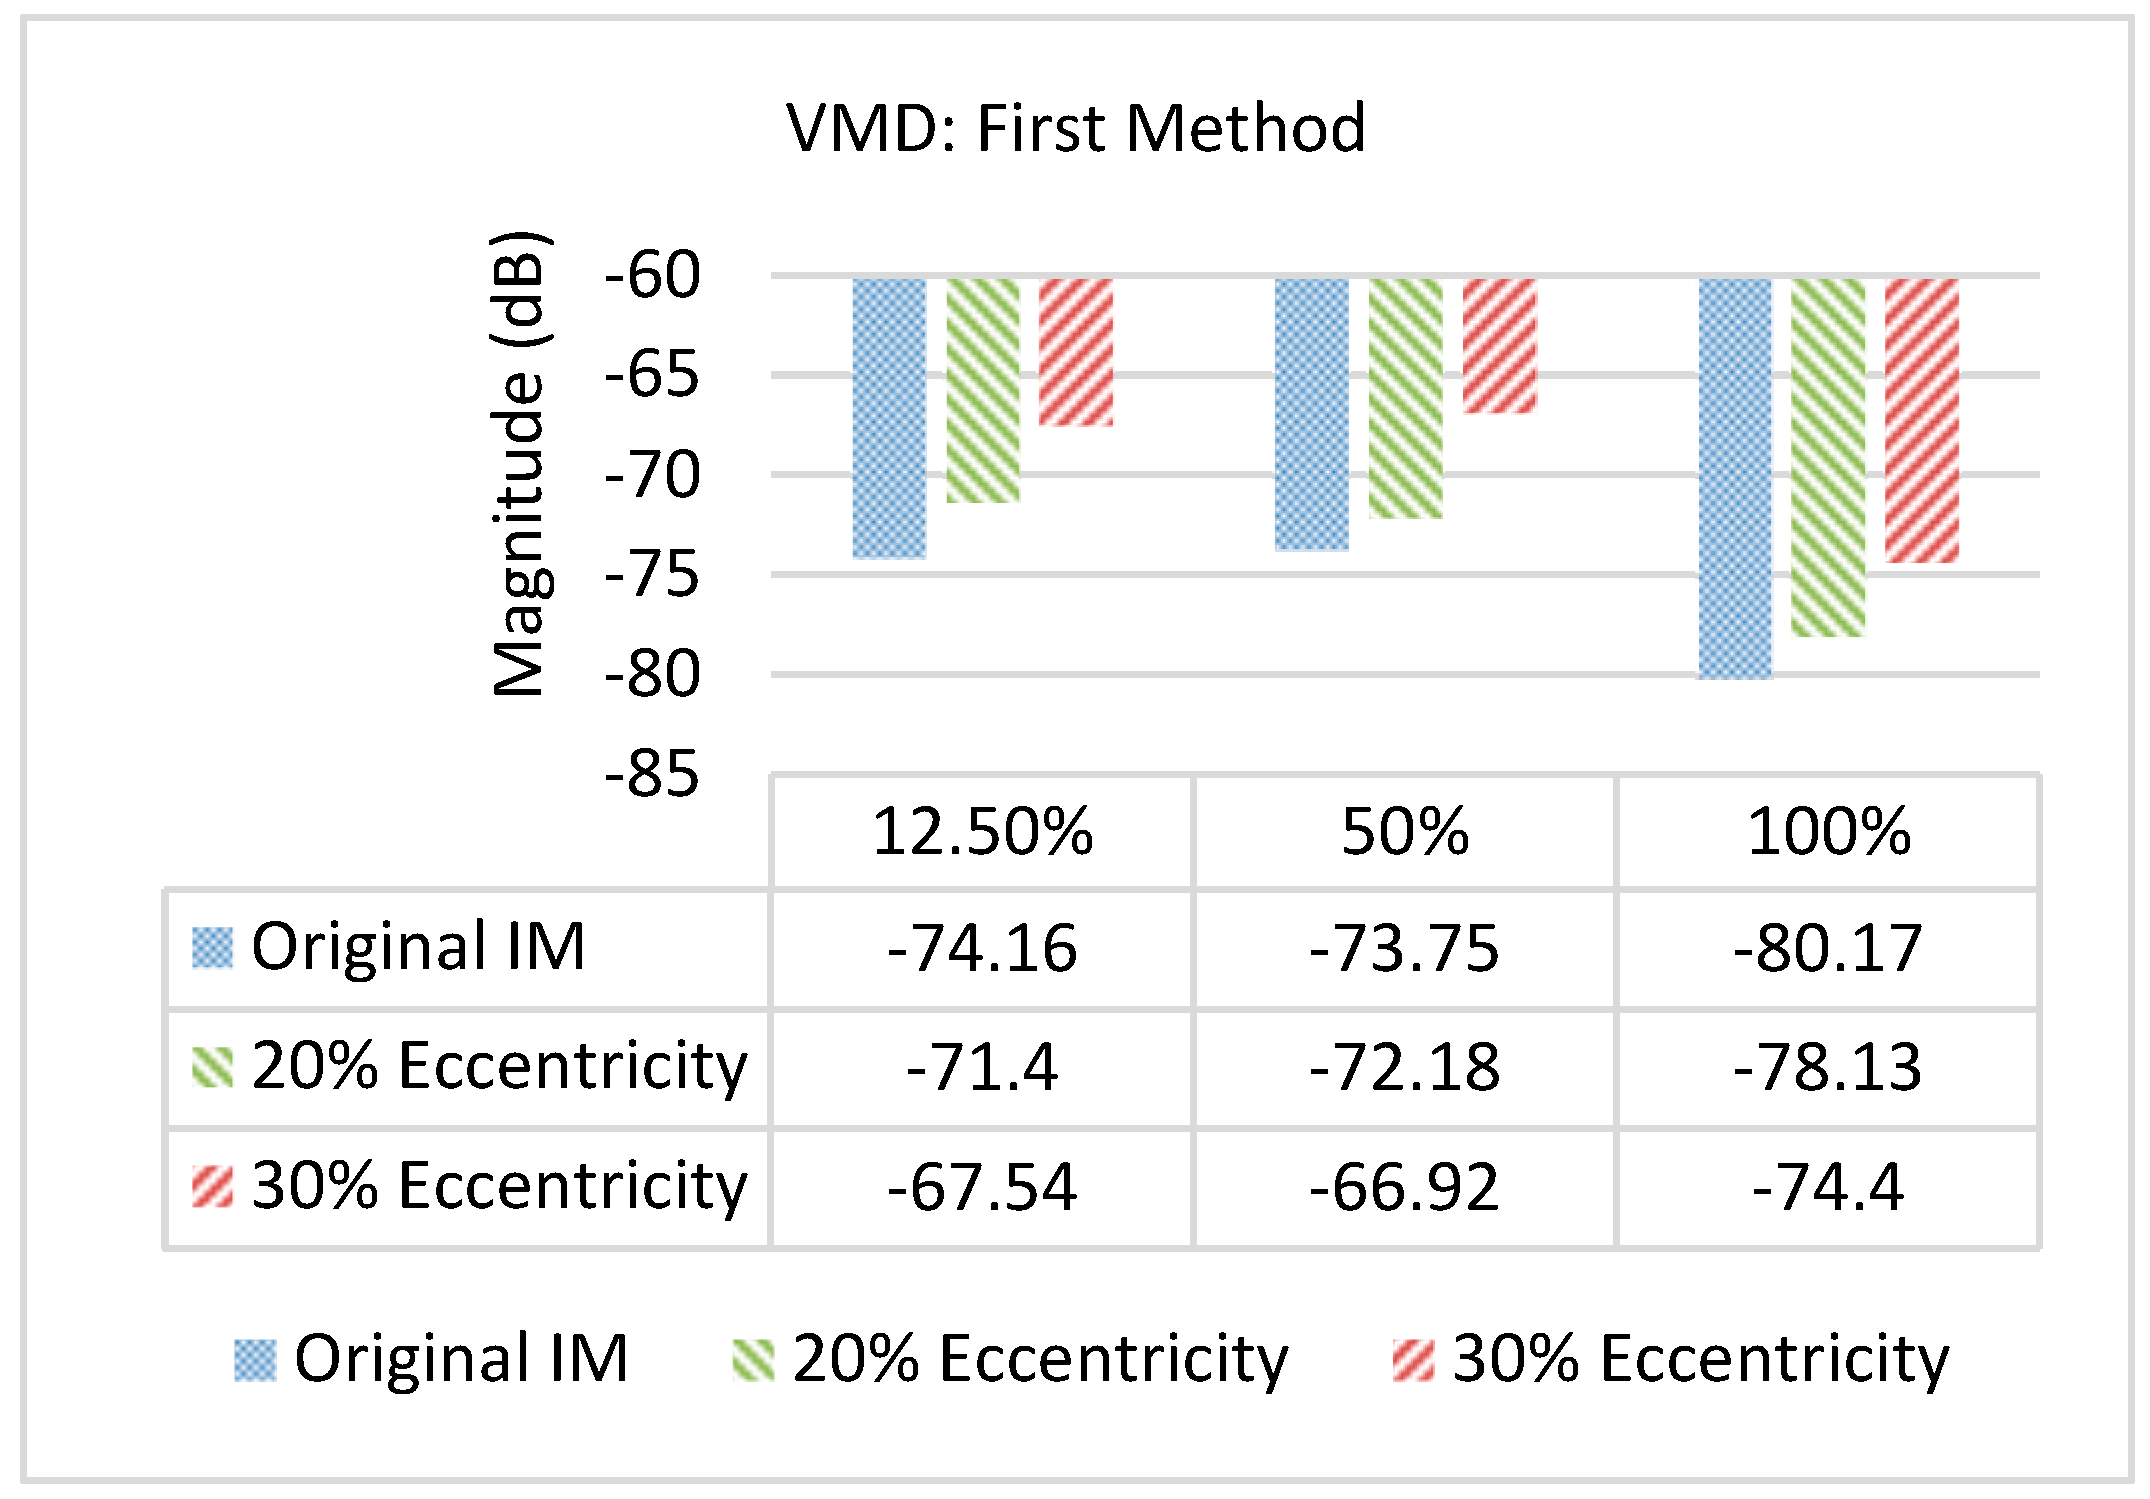
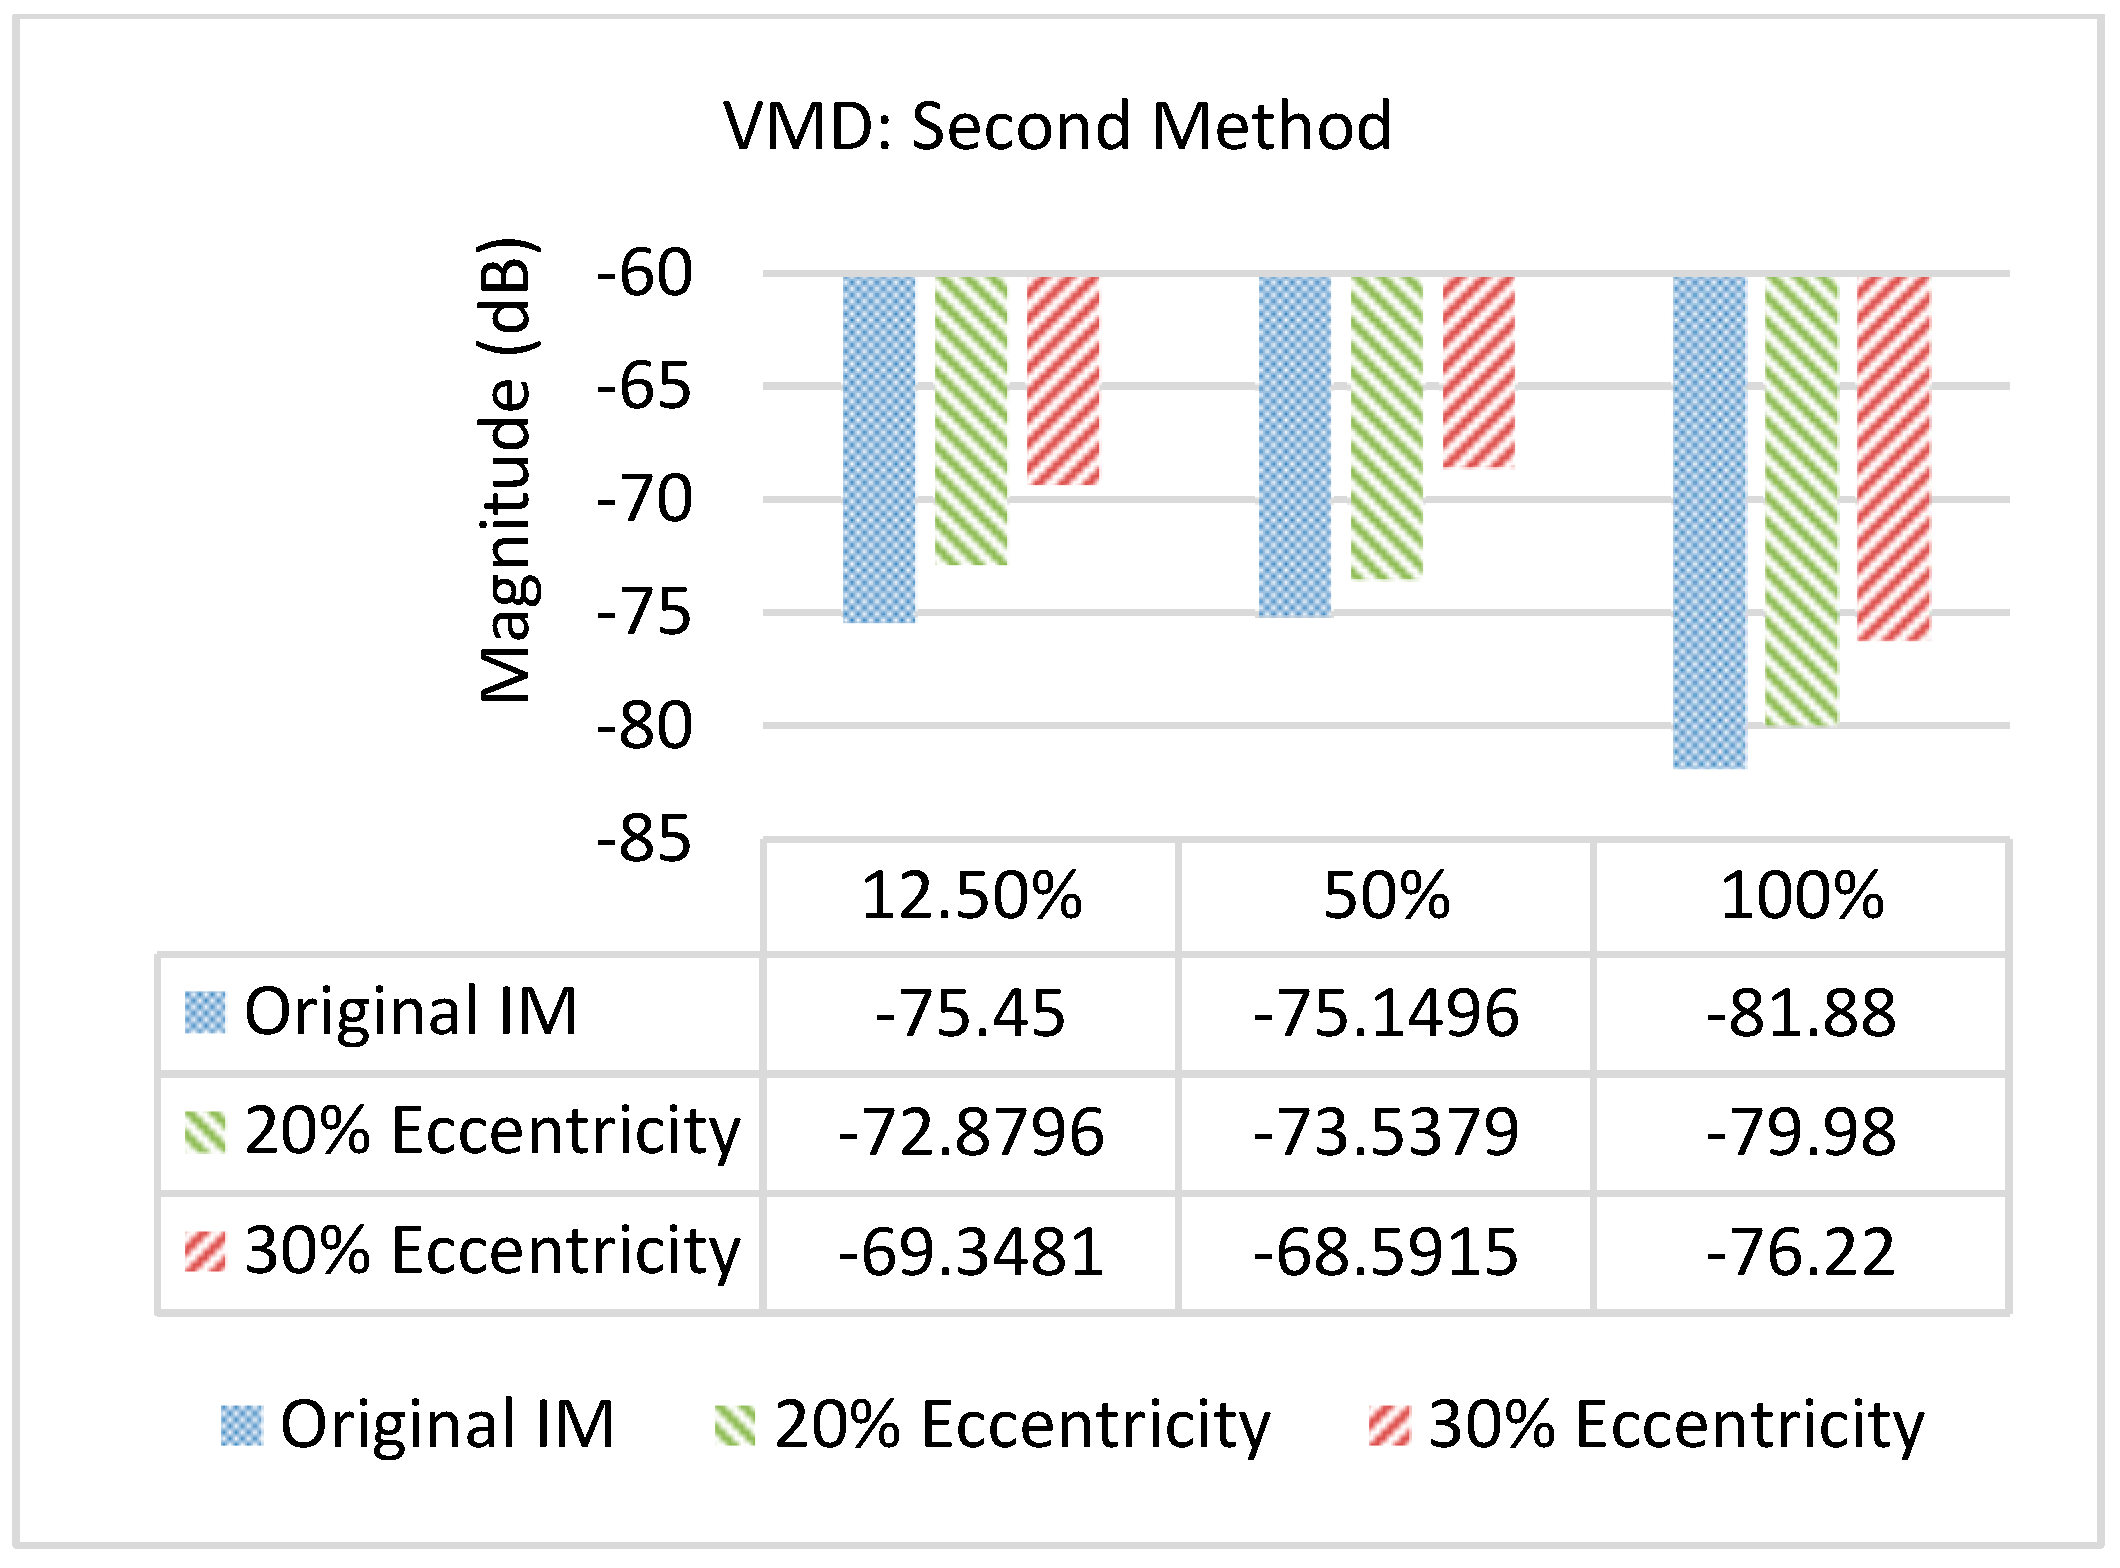
Figure 17 and Figure 18 show the outcomes of the proposed methods for grid-connected IMs, under various load conditions. However, the study acknowledges a challenge. The small air gap size (0.25 mm) in the test motor likely causes a high level of inherent eccentricity to begin with. As a result, the difference between a healthy motor and a faulty one with a 20% eccentricity may be very small, making it more difficult to show the severity of the fault.
The difference between calculating the detailed signal using the first and second methods is that in the first method, the detailed signal is calculated recursively using an approximate mode that includes the dominant frequency component. This is simpler than the second method and requires less computation. In the second method, the detailed signal is calculated only using the constituent modes of the original signal.
The dominant frequency component in the current signal is due to the power supply frequency. All other frequency components presented within the signal are insignificant in comparison. Fault detection methodologies aim to isolate and remove this dominant component to facilitate the analysis of remaining spectral content for the purpose of fault identification. The selection of an appropriate fault detection method hinges on minimizing the power supply frequency impact on the remaining spectral components.
The average results obtained from the repeated current signal sampling experiments using the first method are presented in Figure 19. Furthermore, the outcomes indicate an average standard deviation of 1.297 and an average coefficient of variation (CV) of 1.75%, which demonstrates the consistency and reliability of the experiments. Notably, a CV of less than 5% reflects that the data are very close to the mean, exhibiting minimal variability. Such a low CV highlights the robustness of the proposed approach and ensures high reproducibility and statistical confidence in the experimental results.

5. Conclusions

In conclusion, fault detection can be achieved by calculating the detailed signal using either first or second method, considering the load range of the electric motor, and examining the amplitude of the mixed eccentricity fault frequency component ( f s     f r ). A noteworthy advantage of the proposed fault detection method is the consistent presence of an approximately 6 dB amplitude differential between the healthy state and the 30% eccentricity fault state, regardless of the load condition. Furthermore, it is crucial to acknowledge that the amplitude of the supply frequency component exhibits a greater dependence on the percentage load. Eccentricity fault detection should be performed using the current signal primarily within the low-load range of up to 50% full load, as full load acts as a damper, preventing further motor vibrations. Method 1 is shown to be more effective in scenarios where simplicity and lower computational cost are prioritized, while Method 2 demonstrates superior accuracy and robustness in detecting eccentricity faults under grid-connected conditions with higher harmonic content. In addition, Method 2 provides the capability, if necessary, to directly eliminate noise and supply harmonics.
The detailed and approximated signals, computed using the VMD method, are similar to the detailed and approximated of the wavelet transform. Our results reveal that the detailed signal derived from the current signal is superior for detecting mixed eccentricity faults, particularly in the early stages. Furthermore, the influence of varying load conditions is evaluated on the proposed fault detection method, demonstrating its effectiveness across different operating scenarios. These findings highlight the following advantages of this method:
  • Superior performance of the VMD method compared to EMD and EEMD methods in noisy environments
  • Consistency of fault detection variation between the healthy state and the 30% mixed eccentricity state by approximately 6 dB across various load conditions
  • Fault detection based on current signal is a noninvasive method
  • Only a single current sensor is required for fault detection.
  • The average standard deviation was calculated as 1.297, indicating low dispersion of the data.
  • The average coefficient of variation (CV) was 1.75%, reflecting minimal variability and high stability of the results.

Author Contributions

Conceptualization, R.A. and A.R.; Methodology, R.A. and A.R.; Software, R.A. and A.R.; Validation, R.A. and A.R.; Formal analysis, R.A., A.R. and S.H.K.; Investigation, R.A., A.R. and S.H.K.; Resources, R.A. and A.R.; Data curation, R.A. and A.R.; Writing—original draft, R.A.; Writing—review & editing, R.A., A.R. and S.H.K.; Visualization, R.A., A.R. and S.H.K.; Supervision, A.R. and S.H.K.; Project administration, A.R. and S.H.K.; Funding acquisition, A.R. and S.H.K. All authors have read and agreed to the published version of the manuscript.

Funding

This research was supported by Region 2 of the Gas Transmission Operation Company under contract number 730547.

Data Availability Statement

The original contributions presented in this study are included in the article. Further inquiries can be directed to the corresponding author.

Conflicts of Interest

The authors declare no conflict of interest.

References

  1. Sun, M.; Wang, H.; Liu, P.; Long, Z.; Yang, J.; Huang, S. A Novel Data-Driven Mechanical Fault Diagnosis Method for Induction Motors Using Stator Current Signals. IEEE Trans. Transp. Electrif. 2023, 9, 347–358. [Google Scholar] [CrossRef]
  2. Choi, S.; Haque, M.S.; Bin Tarek, T.; Mulpuri, V.; Duan, Y.; Das, S.; Garg, V.; Ionel, D.M.; Masrur, M.A.; Mirafzal, B.; et al. Fault Diagnosis Techniques for Permanent Magnet AC Machine and Drives—A Review of Current State of the Art. IEEE Trans. Transp. Electrif. 2018, 4, 444–463. [Google Scholar] [CrossRef]
  3. Shin, J.; Park, Y.; Lee, S.B. Flux-Based Detection and Classification of Induction Motor Eccentricity, Rotor Cage, and Load Defects. IEEE Trans. Ind. Appl. 2021, 57, 2471–2480. [Google Scholar] [CrossRef]
  4. Gonzalez-Jimenez, D.; Del-Olmo, J.; Poza, J.; Garramiola, F.; Madina, P. Data-Driven Fault Diagnosis for Electric Drives: A Review. Sensors 2021, 21, 4024. [Google Scholar] [CrossRef]
  5. Ali, M.Z.; Shabbir, N.S.K.; Liang, X.; Zhang, Y.; Hu, T. Machine Learning-Based Fault Diagnosis for Single- and Multi-Faults in Induction Motors Using Measured Stator Currents and Vibration Signals. IEEE Trans. Ind. Appl. 2019, 55, 2378–2391. [Google Scholar] [CrossRef]
  6. Gadsden, S.A.; Song, Y.; Habibi, S. Novel Model-Based Estimators for the Purposes of Fault Detection and Diagnosis. IEEE-ASME Trans. Mechatron. 2013, 18, 1237–1249. [Google Scholar] [CrossRef]
  7. Trachi, Y.; Elbouchikhi, E.; Choqueuse, V.; El, M.; Wang, T. A Novel Induction Machine Fault Detector Based on Hypothesis Testing. IEEE Trans. Ind. Appl. 2016, 53, 3039–3048. [Google Scholar] [CrossRef]
  8. Martin-Diaz, I.; Morinigo-Sotelo, D.; Duque-Perez, O.; Romero-Troncoso, R.d.J. An Experimental Comparative Evaluation of Machine Learning Techniques for Motor Fault Diagnosis Under Various Operating Conditions. IEEE Trans. Ind. Appl. 2018, 54, 2215–2224. [Google Scholar] [CrossRef]
  9. Benninger, M.; Liebschner, M.; Kreischer, C. Fault Detection of Induction Motors with Combined Modeling- and Machine-Learning-Based Framework. Energies 2023, 16, 3429. [Google Scholar] [CrossRef]
  10. Kumar, R.R.; Andriollo, M.; Cirrincione, G.; Cirrincione, M.; Tortella, A. A Comprehensive Review of Conventional and Intelligence-Based Approaches for the Fault Diagnosis and Condition Monitoring of Induction Motors. Energies 2022, 15, 8938. [Google Scholar] [CrossRef]
  11. Pal, R.S.C.; Mohanty, A.R. A simplified dynamical model of mixed eccentricity fault in a three-phase induction motor. IEEE Trans. Ind. Electron. 2020, 68, 4341–4350. [Google Scholar] [CrossRef]
  12. Zare, F.; Nasiri-Gheidari, Z. Winding Function Model for Predicting Performance of 2-DOF Wound Rotor Resolver. IEEE Trans. Transp. Electrif. 2021, 8, 2062–2069. [Google Scholar] [CrossRef]
  13. Erős, E.; Bengtsson, K.; Åkesson, K. Fault localization for intelligent automation systems. In Proceedings of the 2022 IEEE 27th International Conference on Emerging Technologies and Factory Automation (ETFA), Stuttgart, Germany, 6–9 September 2022; pp. 1–8. [Google Scholar]
  14. Misra, S.; Kumar, S.; Sayyad, S.; Bongale, A.; Jadhav, P.; Kotecha, K.; Abraham, A.; Gabralla, L.A. Fault Detection in Induction Motor Using Time Domain and Spectral Imaging-Based Transfer Learning Approach on Vibration Data. Sensors 2022, 22, 8210. [Google Scholar] [CrossRef]
  15. Hammo, R. Faults Identification in Three-Phase Induction Motors Using Support Vector Machines. Master’s Thesis, Bowling Green State University, Bowling Green, OH, USA, January 2014. [Google Scholar]
  16. Bao, P.; Yi, W.; Zhu, Y.; Shen, Y.; Chai, B.X. STHFD: Spatial–Temporal Hypergraph-Based Model for Aero-Engine Bearing Fault Diagnosis. Aerospace 2025, 12, 612. [Google Scholar] [CrossRef]
  17. Bao, P.; Yi, W.; Zhu, Y.; Shen, Y.; Peng, H. A Spectral Interpretable Bearing Fault Diagnosis Framework Powered by Large Language Models. Sensors 2025, 25, 3822. [Google Scholar] [CrossRef]
  18. Sharma, N.R.; Bhalja, B.R.; Malik, O.P. Machine Learning-Based Severity Assessment and Incipient Turn-to-Turn Fault Detection in Induction Motors. IEEE Trans. Energy Convers. 2024, 40, 557–567. [Google Scholar] [CrossRef]
  19. Chiu, M.-C.; Tsai, C.-D.; Li, T.-L. An Integrative Machine Learning Method to Improve Fault Detection and Productivity Performance in a Cyber-Physical System. J. Comput. Inf. Sci. Eng. 2020, 20, 021009. [Google Scholar] [CrossRef]
  20. Okokpujie, K.; Nwokolo, I.O.; Adenugba, A.V.; Awomoyi, M.E. Development of a Machine Learning Based Fault Detection Model for Received Signal Level in Telecommunication Enterprise Infrastructure. Int. J. Saf. Secur. Eng. 2024, 14, 679–690. [Google Scholar] [CrossRef]
  21. Dov, D.; Assaad, S.; Syedibrahim, A.; Bell, J.; Huang, J.; Madden, J.; Bentley, R.; McCall, S.; Henao, R.; Carin, L.; et al. A Hybrid Human–Machine Learning Approach for Screening Prostate Biopsies Can Improve Clinical Efficiency Without Compromising Diagnostic Accuracy. Arch. Pathol. Lab. Med. 2021, 146, 727–734. [Google Scholar] [CrossRef]
  22. Alimardani, R.; Rahideh, A.; Kia, S.H. Mixed Eccentricity Fault Detection for Induction Motors Based on Time Synchronous Averaging of Vibration Signals. IEEE Trans. Ind. Electron. 2024, 71, 3173–3181. [Google Scholar] [CrossRef]
  23. Aggarwal, A.; Allafi, I.M.; Strangas, E.G.; Agapiou, J.S. Off-Line Detection of Static Eccentricity of PMSM Robust to Machine Operating Temperature and Rotor Position Misalignment Using Incremental Inductance Approach. IEEE Trans. Transp. Electrif. 2020, 7, 161–169. [Google Scholar] [CrossRef]
  24. Bazghandi, R.; Marzebali, M.H.; Abolghasemi, V.; Kia, S.H. A Novel Mode Un-Mixing Approach in Variational Mode Decomposition for Fault Detection in Wound Rotor Induction Machines. Energies 2023, 16, 5551. [Google Scholar] [CrossRef]
  25. Abramovich, Y.I.; Johnson, B.A. GLRT-Based Detection-Estimation for Undersampled Training Conditions. IEEE Trans. Signal Process. 2008, 56, 3600–3612. [Google Scholar] [CrossRef]
  26. Wang, B.; Lin, C.; Inoue, H.; Kanemaru, M. Topological Data Analysis for Electric Motor Eccentricity Fault Detection. In Proceedings of the IECON 2022—48th Annual Conference of the IEEE Industrial Electronics Society, Brussels, Belgium, 17–20 October 2022. [Google Scholar]
  27. Arifin, M.S.; Wang, W.; Uddin, M.N. A Modified EMD Technique for Broken Rotor Bar Fault Detection in Induction Machines. Sensors 2024, 24, 5186. [Google Scholar] [CrossRef]
  28. Wang, B.; Inoue, H.; Kanemaru, M. Motor Eccentricity Fault Detection: Physics-Based and Data-Driven Approaches. In Proceedings of the IEEE 14th International Symposium on Diagnostics for Electrical Machines, Power Electronics and Drives (SDEMPED), Chania, Greece, 28–31 August 2023. [Google Scholar]
  29. Agah, G.R.; Rahideh, A.; Khodadadzadeh, H.; Khoshnazar, S.M.; Kia, S.H. Broken rotor bar and rotor eccentricity fault detection in induction motors using a combination of discrete wavelet transform and Teager Kaiser energy operator. IEEE Trans. Energy Convers. 2022, 37, 2199–2206. [Google Scholar] [CrossRef]
  30. Pineda-Sanchez, M.; Puche-Panadero, R.; Riera-Guasp, M.; Perez-Cruz, J.; Roger-Folch, J.; Pons-Llinares, J.; Climente-Alarcon, V.; Antonino-Daviu, J.A. Application of the Teager–Kaiser Energy Operator to the Fault Diagnosis of Induction Motors. IEEE Trans. Energy Convers. 2013, 28, 1036–1044. [Google Scholar] [CrossRef]
  31. Isham, M.F.; Leong, M.S.; Lim, M.H.; Zakaria, M.K. A Review on Variational Mode Decomposition for Rotating Machinery Diagnosis. MATEC Web Conf. 2019, 255, 02017. [Google Scholar] [CrossRef]
  32. Wang, Y.; Wei, Z.; Yang, J. Feature Trend Extraction and Adaptive Density Peaks Search for Intelligent Fault Diagnosis of Machines. IEEE Trans. Ind. Inform. 2019, 15, 105–115. [Google Scholar] [CrossRef]
  33. Li, H.; Liu, T.; Wu, X.; Chen, Q. An optimized VMD method and its applications in bearing fault diagnosis. Measurement 2020, 166, 108185. [Google Scholar] [CrossRef]
  34. Zhang, X.; Sun, T.; Wang, Y.; Wang, K.; Shen, Y. A parameter optimized variational mode decomposition method for rail crack detection based on acoustic emission technique. Nondestruct. Test. Eval. 2020, 36, 411–439. [Google Scholar] [CrossRef]
  35. Mirzaeva, G.; Saad, K.I. Advanced Diagnosis of Stator Turn-to-Turn Faults and Static Eccentricity in Induction Motors Based on Internal Flux Measurement. IEEE Trans. Ind. Appl. 2018, 54, 3961–3970. [Google Scholar] [CrossRef]
  36. Bessous, N.; Zouzou, S.E.; Sbaa, S.; Bentrah, W.; Becer, Z.; Ajgou, R. Static eccentricity fault detection of induction motors using MVSA, MCSA and discrete wavelet transform (DWT). In Proceedings of the 2017 5th International Conference on Electrical Engineering-Boumerdes (ICEE-B), Boumerdes, Algeria, 29–31 October 2017; pp. 1–10. [Google Scholar]
  37. Elbouchikhi, E.; Choqueuse, V.; Auger, F.; Benbouzid, M.E.H. Motor Current Signal Analysis Based on a Matched Subspace Detector. IEEE Trans. Instrum. Meas. 2017, 66, 3260–3270. [Google Scholar] [CrossRef]
  38. IGeorgakopoulos, I.P.; Mitronikas, E.D.; Safacas, A.N. Detection of Induction Motor Faults in Inverter Drives Using Inverter Input Current Analysis. IEEE Trans. Ind. Electron. 2011, 58, 4365–4373. [Google Scholar] [CrossRef]
  39. Gyftakis, K.N.; Kappatou, J.C. A Novel and Effective Method of Static Eccentricity Diagnosis in Three-Phase PSH Induction Motors. IEEE Trans. Energy Convers. 2013, 28, 405–412. [Google Scholar] [CrossRef]
  40. Hong, J.; Hyun, D.; Lee, S.B.; Kral, C. Offline Monitoring of Airgap Eccentricity for Inverter-Fed Induction Motors Based on the Differential Inductance. IEEE Trans. Ind. Appl. 2013, 49, 2533–2542. [Google Scholar] [CrossRef]
  41. Hyun, D.; Lee, S.; Hong, J.; Bin Lee, S.; Nandi, S. Detection of Airgap Eccentricity for Induction Motors Using the Single-Phase Rotation Test. IEEE Trans. Energy Convers. 2012, 27, 689–696. [Google Scholar] [CrossRef]
  42. Liu, Z.; Yin, X.; Zhang, Z.; Chen, D.; Chen, W. Online rotor mixed fault diagnosis way based on spectrum analysis of instantaneous power in squirrel cage induction motors. IEEE Trans. Energy Convers. 2004, 19, 485–490. [Google Scholar] [CrossRef]
  43. Mirzaeva, G.; Saad, K.I. Advanced Diagnosis of Rotor Faults and Eccentricity in Induction Motors Based on Internal Flux Measurement. IEEE Trans. Ind. Appl. 2018, 54, 2981–2991. [Google Scholar] [CrossRef]
  44. Xu, Z.; Qin, C.; Tang, G. A Novel Deconvolution Cascaded Variational Mode Decomposition for Weak Bearing Fault Detection with Unknown Signal Transmission Path. IEEE Sens. J. 2020, 21, 1746–1755. [Google Scholar] [CrossRef]
  45. Pan, H.; Jiang, W.; Liu, Q.; Zheng, J. Multivariate Nonlinear Sparse Mode Decomposition and Its Application in Gear Fault Diagnosis. IEEE Access 2021, 9, 154265–154274. [Google Scholar] [CrossRef]
  46. Liu, H.; Xiang, J. A Strategy Using Variational Mode Decomposition, L-Kurtosis and Minimum Entropy Deconvolution to Detect Mechanical Faults. IEEE Access 2019, 7, 70564–70573. [Google Scholar] [CrossRef]
  47. Li, H.; Zhang, Q.; Qin, X.; Yuantao, S. Raw vibration signal pattern recognition with automatic hyper-parameter-optimized convolutional neural network for bearing fault diagnosis. Proc. Inst. Mech. Eng. Part C J. Mech. Eng. Sci. 2019, 234, 343–360. [Google Scholar] [CrossRef]
  48. Boyd, S. Distributed Optimization and Statistical Learning via the Alternating Direction Method of Multipliers; Foundations and Trends® in Machine Learning; Now Foundations and Trends: Norwell, MA, USA, 2011; pp. 1–122. [Google Scholar]
  49. Dragomiretskiy, K.; Zosso, D. Variational Mode Decomposition. IEEE Trans. Signal Process. 2014, 62, 531–544. [Google Scholar] [CrossRef]
  50. Surucu, O.; Gadsden, S.A.; Yawney, J. Condition Monitoring using Machine Learning: A Review of Theory, Applications, and Recent Advances. Expert Syst. Appl. 2023, 221, 119738. [Google Scholar] [CrossRef]
  51. Tian, S.; Zhen, D.; Liang, X.; Feng, G.; Cui, L.; Gu, F. Early fault feature extraction for rolling bearings using adaptive variational mode decomposition with noise suppression and fast spectral correlation. Meas. Sci. Technol. 2023, 34, 065112. [Google Scholar] [CrossRef]
  52. Li, Y.; Huang, D.; Qin, Z. A Classification Algorithm of Fault Modes-Integrated LSSVM and PSO with Parameters’ Optimization of VMD. Math. Probl. Eng. 2021, 2021, 6627367. [Google Scholar] [CrossRef]
  53. Yan, X.; Yan, W.; Yuen, K.-V.; Yang, Z.; Wang, X. An adaptive variational mode extraction method based on multi-domain and multi-objective optimization for bearing fault diagnosis. Struct. Heal. Monit. 2022, 22, 2708–2733. [Google Scholar] [CrossRef]
  54. Wu, Z.; Huang, N.E. Ensemble Empirical Mode Decomposition: A Noise-Assisted Data Analysis Method. Adv. Adapt. Data Anal. 2009, 1, 1–41. [Google Scholar] [CrossRef]
  55. Feng, Z.; Zhang, D.; Zuo, M.J. Adaptive Mode Decomposition Methods and Their Applications in Signal Analysis for Machinery Fault Diagnosis: A Review with Examples. IEEE Access 2017, 5, 24301–24331. [Google Scholar] [CrossRef]
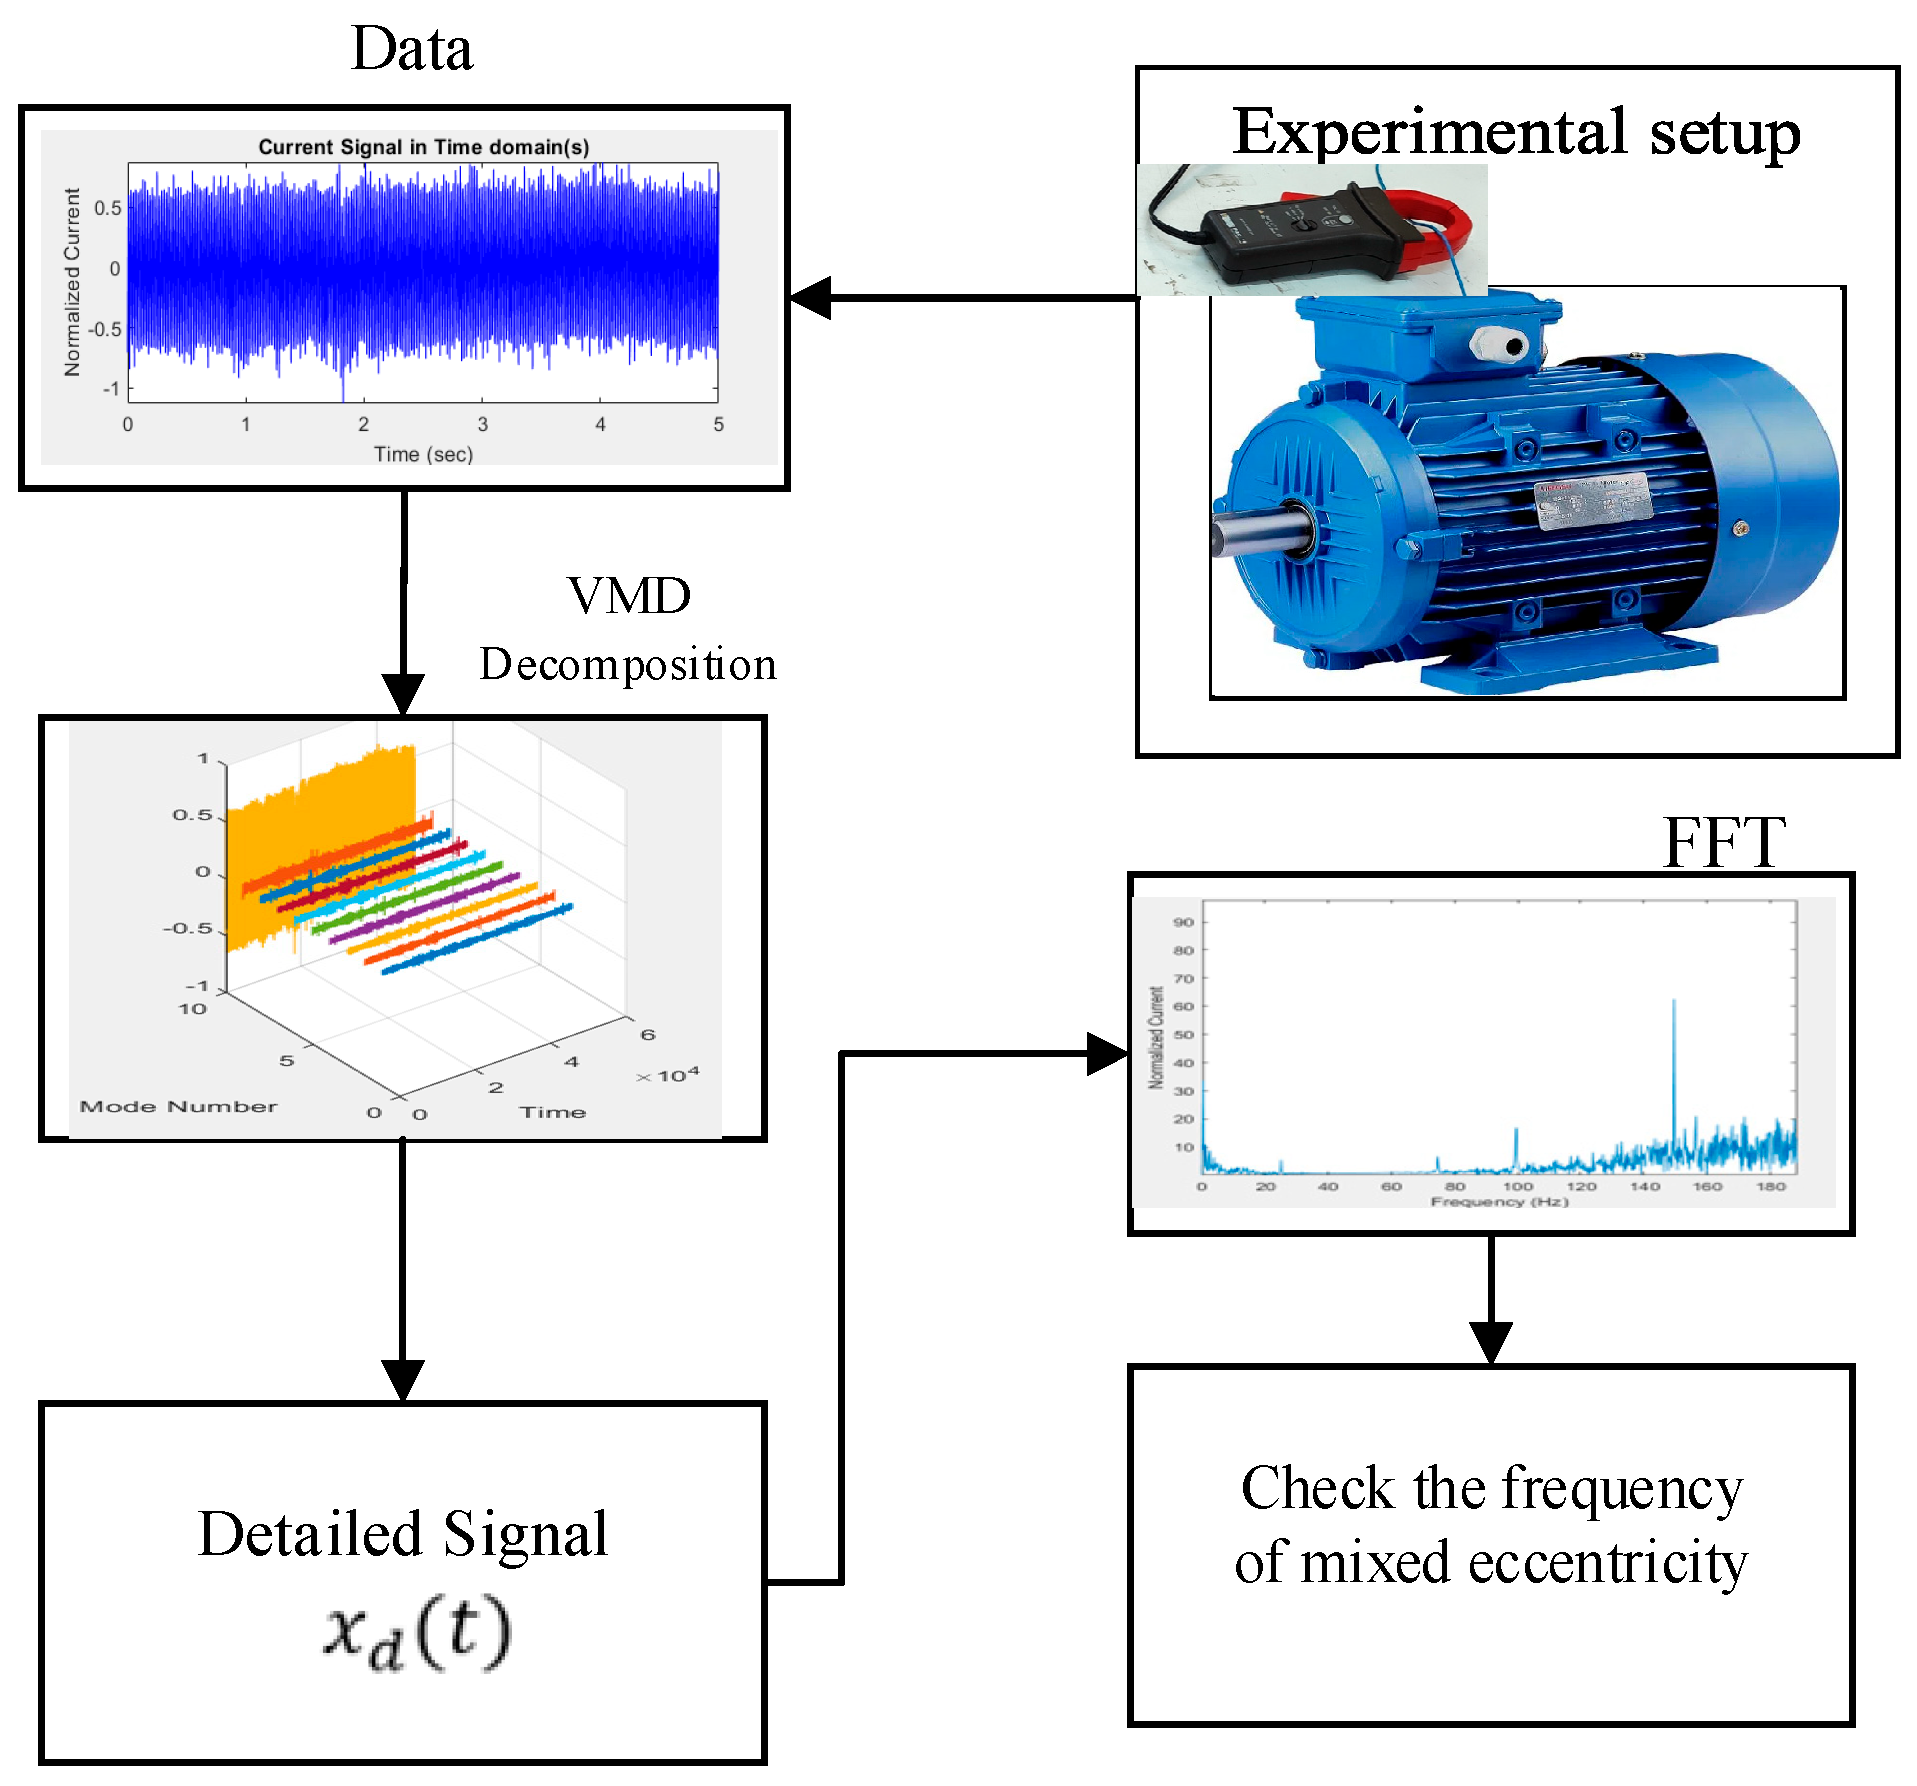
Figure 1. Mixed eccentricity fault detection algorithm.
Machines 13 00968 g001
Figure 2. The correlation between the decomposed modes with K = 4 .
Machines 13 00968 g002
Figure 3. The correlation between the decomposed modes with K = 5 .
Machines 13 00968 g003
Figure 4. The correlation between the decomposed modes with K = 6 .
Machines 13 00968 g004
Figure 5. The correlation between the decomposed modes with K = 9 .
Machines 13 00968 g005
Figure 6. The correlation between the decomposed modes with K = 10 .
Machines 13 00968 g006
Figure 7. The correlation between the decomposed modes with K = 11 .
Machines 13 00968 g007
Figure 8. The correlation between the decomposed modes with K = 12 .
Machines 13 00968 g008
Figure 10. From left to right: inner ring, new ball bearing, outer ring, original ball bearing.
Machines 13 00968 g010
Figure 11. VMD results on the normalized current signal: (a) Modes; (b) Correlation between each mode and the normalized current signal.
Machines 13 00968 g011
Figure 12. Normalized current decomposition: (a) normalized current; (b) approximate of the current signal; (c,d) detailed signals based on the first and second methods.
Machines 13 00968 g012
Figure 13. Spectrum of the current signal for a 30% mixed eccentricity motor at 12.5% load: (a) current spectrum (b) spectrum of the current signal approximate; (c,d) spectrum of the detailed signals based on the first and second methods.
Machines 13 00968 g013
Figure 14. FFT results of the current signal which failed to detect IM eccentricity faults.
Machines 13 00968 g014
Figure 15. The results of the eccentricity fault detection method using EMD. As evident, the detection failed.
Machines 13 00968 g015
Figure 16. The results of the eccentricity fault detection method using EEMD. As evident, the detection failed.
Machines 13 00968 g016
Figure 17. The results of the eccentricity fault detection method using VMD (first method).
Machines 13 00968 g017
Figure 18. The results of the eccentricity fault detection method using VMD (second method).
Machines 13 00968 g018
Figure 19. Mean Results of experimental obtained using the VMD method.
Machines 13 00968 g019
Table 1. Comparative Summary of Fault Detection Methods.
Method TypeAccuracyDetection SpeedCost-EffectivenessInterpretabilityReferences
Machine LearningNear 100%Real-time; up to 3h before failureReduces downtime & maintenance costs; scalableOften low (black box); improved with hybrid approaches[5,9,18,19,20,21]
Model-BasedHighFast;
depends on model complexity
Initial modeling cost; robust once establishedHigh (physical models, parameter estimation)[6,9]
Signal-BasedHighFast (direct signal analysis)Low (minimal modeling); limited for complex faultsHigh (direct feature-fault link)[7,25]
Table 2. Summarizes the research studies conducted on eccentricity fault detection.
ReferencesSignal TypeFault SeverityLoading
Level
[35]FluxNot CheckedNot Checked
[36]VibrationNot CheckedNo load and 75% full load
[36]CurrentNot CheckedNo load and 75% full load
[37]CurrentNot CheckedChecked
[3]FluxCheckedNot Checked
[38]CurrentNot CheckedUp to 60%
[39]CurrentCheckedNot Checked
[40]CurrentCheckedNot Checked
[41]CurrentCheckedNot Checked
[42]PowerNot CheckedNot Checked
[42]CurrentNot CheckedNot Checked
[43]FluxNot CheckedChecked
Table 3. Reported K Values and Their Impact on Fault Feature Extraction.
ReferenceK Value(s) TestedValues
[51]3–8 (adaptive)adaptive selection recommended
[52]3–10 (empirical & adaptive)adaptive principle validated
[53]not specifiedfocus on vme parameters
Table 4. Specification of the SCIM Under Test.
ParametersSymbolsValuesUnits
Nominal powerPn1.5kW
Nominal frequencyfn50Hz
Nominal voltageVn220/380V
Nominal currentIn5.7/3.3A
Nominal speed ω n 1440RPM
Nominal Power factorPF0.81-
Nominal Efficiencyη85.3%
Number of pole-pairsp2-
Disclaimer/Publisher’s Note: The statements, opinions and data contained in all publications are solely those of the individual author(s) and contributor(s) and not of MDPI and/or the editor(s). MDPI and/or the editor(s) disclaim responsibility for any injury to people or property resulting from any ideas, methods, instructions or products referred to in the content.