Abstract
As the intelligent transformation of manufacturing accelerates, Unmanned Aerial Vehicles are increasingly being deployed for workshop operations, making efficient obstacle avoidance path planning a critical requirement. This paper introduces a parameter-optimized path planning method for the Unmanned Aerial Vehicle, termed the Artificial Potential Field A* algorithm, which enhances the standard A* approach through the integration of an artificial potential field and a variable step size strategy. The variable step size mechanism allows dynamic adjustment of the search step size, while potential field values from the artificial potential field are embedded into the cost function to improve planning accuracy. Key parameters of the hybrid algorithm are subsequently optimized using response surface methodology, with a regression model built to analyze parameter interactions and determine the optimal configuration. Simulation results across multiple performance indicators confirm that the proposed Artificial Potential Field A* algorithm delivers superior outcomes in path length, attitude angle variation, and flight altitude stability. This approach provides an effective solution for enhancing Unmanned Aerial Vehicle operational efficiency in production workshops.
1. Introduction
Unmanned aerial vehicles (UAVs), recognized for their robust interoperability, superb maneuverability, and high degree of autonomy, play a pivotal role in the new industrial revolution [1,2]. To build intelligent workshops, reduce labor costs, and optimize management models, many enterprises are gradually adopting the new mode of safety inspection and emergency response using UAVs. The primary objective of the UAV path planning in workshop environments is to identify the most efficient route to a target destination, whilst guaranteeing flight safety and successful obstacle avoidance [3]. However, the dense and cluttered nature of factory floors presents significant challenges, as many existing path planning algorithms struggle to balance computational efficiency, path quality, and robustness against local minima. This gap motivates the development of more sophisticated and optimized hybrid solutions.
To address these challenges, this paper proposes a parameter-optimized path planning method termed the Artificial Potential Field A* (APFA*) algorithm. Our approach enhances the standard A* algorithm through a novel hybrid strategy that integrates the obstacle-repelling capability of the artificial potential field (APF) method into the A* cost function and employs a dynamic variable step size (VSS) strategy to improve search efficiency. Moving beyond conventional empirical tuning, we systematically optimize the key parameters of this hybrid algorithm using response surface methodology (RSM), thereby ensuring its performance is maximized in a principled manner.
The main contributions of this work are threefold. First, we develop the novel APFA* algorithm, which effectively combines the global pathfinding strength of A* with the local smoothness and obstacle avoidance features of the artificial potential field. Second, we pioneer the application of response surface methodology to scientifically optimize the hybrid algorithm’s parameters, analyzing their interactions to identify a superior configuration. Third, we provide comprehensive validation through simulations that demonstrate the algorithm’s superiority across multiple performance indicators, including path length, attitude angle variation, and flight altitude stability. This study operates under the assumptions of a known static environment map and the absence of dynamic obstacles or strong aerodynamic disturbances. A recognized limitation is the potential decrease in computational efficiency within exceptionally dense obstacle fields, which highlights a direction for future work on algorithmic lightweighting.
The remainder of the paper is structured as follows: Following this introduction, a dedicated literature review and analysis of related research is provided in Section 2. Section 3 formulates the problem and specifies the constraints. Section 4 introduces the improved APFA* algorithm. Section 5 discusses parameter optimization for the proposed algorithm, including analysis of variance and interaction effects. Section 6 presents simulation and experimental results. Finally, Section 7 concludes the paper and highlights the main contributions.
2. Related Research
Path planning for UAVs has been approached with a variety of methods, each with distinct strengths and weaknesses. Commonly employed methods for UAV path planning include genetic algorithms (GA) [4,5], the artificial potential field (APF) approach [6,7], particle swarm optimization (PSO) [8,9], the A* algorithm [10], and rapidly exploring random trees (RRT) [11]. The APF algorithm offers high flexibility and the ability to generate smooth paths [12]. The A* algorithm is characterized by its high search efficiency and strong environmental adaptability [13]. However, the APF algorithm is susceptible to convergence in local minima. Meanwhile, the A* algorithm is computationally intensive and may exhibit significant resource consumption, particularly when the target point is unreachable [14,15].
In response to these limitations, researchers have developed numerous enhanced methods. To address challenges in threatening and complex terrains, Liu et al. [16] proposed a hybrid A*-artificial potential field method with spatio-temporal grid optimization, which effectively enhances threat avoidance efficiency and global path adaptability. Dong et al. [17] tackled the computationally intensive obstacle density calculations in complex terrain by proposing a Voronoi-A* fusion algorithm. This algorithm integrates rapid trajectory generation based on Voronoi vertices with A* supplementary expansion for enhanced performance. For navigation in intricate three-dimensional spaces, Jayarajan et al. [18] combined a robust artificial bee colony (ABC) algorithm with a flexible rapidly exploring random tree star (RRT*), enabling optimal trajectory planning for UAVs. Similarly, aiming to enhance safety and smoothness in cluttered urban environments with multiple obstacles, Wang et al. [19] developed a composite improved algorithm that integrates the advantages of jellyfish search and particle swarm optimization.
Beyond these environmental challenges, significant advances have been made in specific complex missions: Krishnan [20] proposed a collision avoidance algorithm based on particle swarm optimization (PSO-CA), which identifies new waypoints for modifying the dynamic trajectory of UAVs. Zeng et al. [21] introduced a parallel vectorized differential evolution-based multi-objective jellyfish search (PVDE-MOJS), which enhances the path planning performance of multi-UAV coordination in forest firefighting missions through a comprehensive cost function considering path length, threat avoidance, altitude constraints, path smoothness, and wind effects. Liu et al. [22] proposed an enhanced global dynamic evolutionary snowmelt optimizer (GDSAO) to address global optimization and UAV path planning in three-dimensional spaces.
Beyond algorithmic innovation, a critical and growing research focus lies in the practical deployment of UAV path planning in real-world industrial operations. The transition from a theoretically sound path to a reliably executable mission in a cost-effective manner involves challenges such as seamless integration with existing factory management systems, operational safety under resource constraints, and total cost of ownership [23]. Recent review articles highlight that the reliability of hybrid algorithms is often the decisive factor for their managerial adoption, moving beyond pure technical metrics to encompass stability in daily operations [24]. This perspective underscores that the value of a path planning algorithm is ultimately judged by its robustness and operational efficiency in a production environment.
Despite these advancements, a significant methodological gap persists, particularly for complex factory floors. While hybrid methods that combine techniques like A* and APF show great promise, their performance is highly sensitive to parameter settings. Many studies still rely on empirical tuning, which limits robustness and generalizability across diverse scenarios [25]. Therefore, the core research challenge lies not merely in creating another hybrid structure but in establishing a principled optimization framework that ensures these algorithms achieve reliable, high-performance, and managerially viable path planning in demanding industrial settings. This gap defines the focus of the present work.
3. Problem Statement
UAV path planning constitutes a highly constrained, multi-objective optimization problem aiming to identify the optimal obstacle-avoidance path among all feasible trajectories. In practice, outdoor UAV flights are affected by environmental conditions such as terrain, wind, and weather [26]. This study focuses on path optimization for the UAV flying at constant speed within enclosed factory environments, where aerodynamic effects are considered negligible. The following constraints are considered during flight:
- (1)
- Path length constraint
Path length significantly impacts maneuverability and directly determines running time. The total path length is calculated as follows:
where I and J represent the number of waypoints, be the binary decision variable indicating whether the UAV flies from point i to point j, and denote the straight-line distance between point i and point j. The coordinates of each point are defined as and for point and point , respectively.
- (2)
- Obstacle safety distance constraint
To ensure safe navigation, the UAV must maintain a minimum distance from obstacles during flight. The concept of risk points is introduced to evaluate proximity threats. The obstacle safety distance D(x) is defined as follows:
where represents the Euclidean distance from waypoint i to obstacle o, computed as follows:
Here, O denotes the total number of obstacles, refers to the number of path points entering the danger zone around any obstacle, and indicates the spatial coordinates of obstacle o.
- (3)
- Energy consumption constraint
This constraint ensures that the UAV operates with minimal energy expenditure throughout the mission. Energy consumption is primarily influenced by turning angles and the total flight path length. The corresponding expressions are provided below:
where represents the steering angle required for the UAV to maneuver from point i to point j.
- (4)
- Maximum turning angle constraint
To prevent circuitous routing and frequent sharp turns, the heading change in the UAV at each node is constrained. Assume the maximum allowable turning angle (change in heading) at node i is , which is typically set to less than 90° to ensure kinematically feasible and smooth transitions. This constraint is expressed using the direction vectors of the incoming and outgoing path segments:
where is the vector direction of the path segment entering node , is the vector direction of the path segment exiting node , and are the magnitudes of these vectors.
- (5)
- Flight height constraints
To ensure both flight safety and operational effectiveness, the UAV’s flight altitude must be constrained within a specific range. Flying at too low an altitude increases the risk of collision with ground obstacles or machinery, while flying too high can reduce the accuracy of onboard sensors for inspection tasks.
Let denote the planned flight altitude at position X = (x,y). The altitude constraint is as follows:
where and are the minimum and maximum allowable altitudes, respectively.
Furthermore, to avoid collisions, the flight altitude must always be above the safe height of any underlying equipment. Let M be the total number of devices in the workshop. For a given device m (m = 1, 2, …, M), first define the required safe clearance at position X as:
where is the safe height for device m, is the vertical projection area of device m on the flight plane.
The overall collision avoidance constraint for the UAV at position X is then formulated by taking the maximum required clearance across all devices:
This guarantees that the UAV preserves a safe vertical distance from all equipment it passes over.
- (6)
- Maximum pitch angle constraint
To ensure flight stability, the maximum pitch angle must not be exceeded during climbs or descents. This constraint is as follows:
If , raise the height of point such that
If , raise the height of point such that
The optimization of UAV flight paths involves inherent trade-offs among different performance constraints. To synthesize a balanced overall solution, a weighted sum approach is adopted using the following coefficients for each of the six constraints:
where and are the weighting coefficients for path length, obstacle safety distance, energy consumption, maximum turn angle, flight height, and maximum pitch angle, respectively.
In this study, appropriate weight coefficients are determined through analysis of weight sensitivity across the six single-objective functions. The resulting coefficients are: Consequently, the UAV path planning challenge can be expressed as the following constrained multi-objective optimization problem:
4. Algorithm Design
The objective of UAV path planning is to generate a smooth and collision-free route of the shortest possible length from the start point to the target within complex environments. The selection of the algorithm critically influences the timeliness and safety of the planned trajectory. To overcome the limitations of both the artificial potential field method and the A* algorithm in three-dimensional path planning, this study proposes a novel hybrid approach, designated the APFA* algorithm.
4.1. Artificial Potential Field Method
The APF algorithm is a common algorithm for path planning and navigation. Its basic idea is to construct a repulsive potential field around obstacles and an attractive potential field around the target point [27]. This potential energy difference consequently guides the UAV to move in the direction of the potential field’s negative gradient.
The strength of the attractive potential field in the APF algorithm is primarily a function of the distance from the UAV to the target. The potential energy affecting the UAV increases as this distance grows larger and decreases as it becomes smaller [28]. The attractive potential field function is defined as follows:
where is the attractive potential field coefficient, and represent the coordinates of the UAV and the target point, respectively. The Euclidean distance separating them is represented by . The resulting attractive force is derived as the negative gradient of this potential field with respect to the UAV’s position:
The repulsive potential field is mainly related to the distance between the UAV and the obstacle, and its mathematical expression is as follows:
where is the repulsive potential field coefficient, is the position of the obstacle, is the distance between the UAV and the obstacle, and is the maximum influence distance of the obstacle. When the UAV enters the influence range of the obstacle, the closer distance between them, the greater the effect of the repulsive potential field. The repulsive value is the negative gradient of the repulsive potential field:
The attractive and repulsive potential fields are superimposed to form the total artificial potential field +. The resultant force acting on the UAV is the negative gradient of this total potential field:
4.2. A* Algorithm
The A* algorithm operates by progressively examining nodes in the state space, starting from the initial node and moving to its neighbors. Each expanded node is evaluated using a cost function, and the node with the minimum total cost is selected for further expansion. This process repeats iteratively until the goal node is reached, upon which the search concludes [29].
The cost function in the A* algorithm is expressed as follows:
where f(n) denotes the total estimated cost of the path passing through node n, g(n) represents the actual cost from the start node to n, and h(n) is the estimated cost from n to the goal. The effectiveness of the heuristic function h(n) significantly affects the search efficiency of the algorithm.
In this study, the Euclidean distance is adopted to compute the heuristic function h(n), owing to its computational simplicity and its capability to generate paths with smoother turns in typical path planning scenarios. It is defined as follows:
where is the coordinate of the current node, is the coordinate of the target point.
The A* algorithm performs UAV path search through the following key steps:
Step 1: Initialization. Create Open and Closed lists. Place the start node into the Open list with its initial cost value, and initialize the Closed list as empty.
Step 2: Termination Check. If the Open list is empty, the algorithm terminates without a solution. Otherwise, proceed.
Step 3: Node Expansion. Select the node with the smallest f-value from the Open list and move it to the Closed list. For each traversable neighbor of this node:
- (1)
- If it is already in the Closed list, skip further processing.
- (2)
- Otherwise, compute its tentative g-value.
- (3)
- If the neighbor is not in the Open list, or the new g-value is lower than the existing one, update its g-, h-, and f-values, set the current node as its parent, and add or update it in the Open list.
Step 4: Goal Check. Repeat Step 3 until the target node is moved into the Closed list, indicating a successful pathfinding process.
Step 5: Path Reconstruction. Trace backward from the target node to the start node using parent pointers, and reverse the obtained sequence to form the final optimal path.
The A* algorithm flowchart for UAV path search is shown in Figure 1.
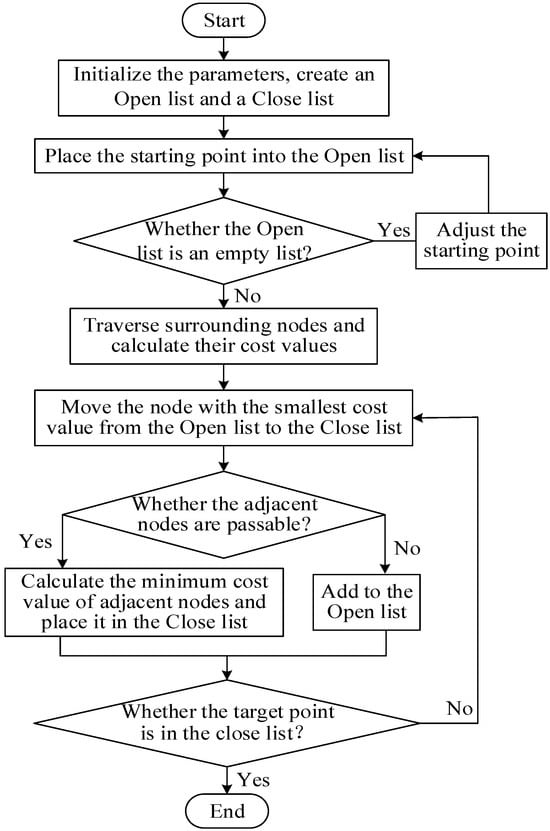
Figure 1.
Flow chart of the A* algorithm.
4.3. APFA* Algorithm
Both the APF and A* algorithms demonstrate effective performance in solving path optimization problems, yet they exhibit inherent limitations. For instance, the APF algorithm is prone to local minima, potentially rendering the target unreachable. The A* algorithm generates paths with curvature discontinuities, excessive redundant points, and insufficient smoothness.
Addressing these challenges, the proposed APFA* algorithm incorporates two primary enhancements: an adaptive search step size and the integration of the APF-based potential field gradient into the A* cost function. The synthesized method enables planning of smooth, collision-free paths in complex workshop environments.
4.3.1. Dynamic Adjustment of the Search Step Size
When expanding search paths using a fixed step size, the traditional A* algorithm often fails to accurately identify tangent points, which are critical waypoints that allow the path to smoothly skirt obstacles within its perceptual range. This shortcoming can result in suboptimal, jagged, or unnecessarily long trajectories. To overcome this limitation, we introduce a dynamic step size adjustment mechanism. This approach enhances spatial adaptability by allowing the search process to respond in real-time to environmental complexity, significantly improving node placement accuracy near obstacles while maintaining high computational efficiency.
As illustrated in Figure 2, the Variable Step Size (VSS) strategy is built upon three core operational mechanisms:
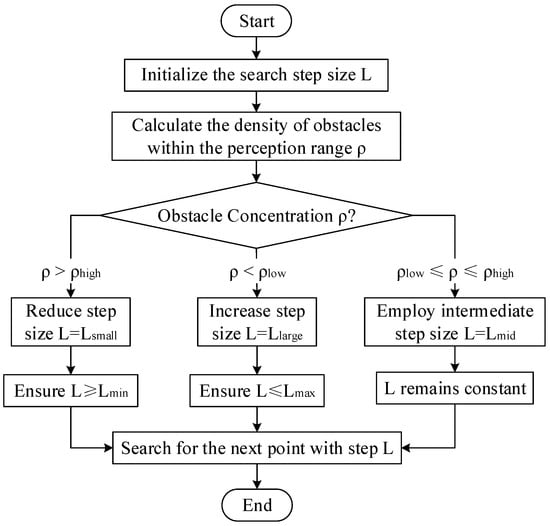
Figure 2.
Flowchart of the Variable Step Size (VSS) model.
- (1)
- Step Initialization:
An initial baseline step size is established based on the map resolution and the operational requirements of the UAV. This value is chosen to offer a balance between exploration speed and path precision at the start of the planning process.
- (2)
- Environmental Adaptation:
The algorithm continuously assesses the local surroundings of the current node by evaluating the concentration of obstacles within a predefined sensing radius.
In open areas with few obstacles, the algorithm applies an enlarged step size to accelerate exploration and reduce the number of expanded nodes, thereby improving planning speed. In confined or cluttered spaces with many obstacles, it switches to a reduced step size. This allows for finer maneuvering and more precise navigation around obstacles, increasing the likelihood of detecting optimal tangent points.
- (3)
- Dynamic Reconfiguration:
The step size is not just switched between two values but is continuously adjusted based on the local obstacle concentration. In areas with a moderate number of obstacles, the step size is set to an intermediate value that balances exploration efficiency with navigation precision. This smooth transition ensures stable and adaptive behavior in varied environments.
This methodology simultaneously optimizes trajectory accuracy and planning speed. By behaving like a cautious pilot who slows down in complex areas and speeds up in open spaces, the algorithm generates paths that are both shorter and smoother. This capability, while respecting real-time computational constraints, makes it particularly suitable for mission-critical UAV operations in complex and dynamic environments.
4.3.2. Potential Field-Enhanced Cost Function Optimization
Following dynamic step size adjustment, the A* algorithm is integrated with the Artificial Potential Field framework. The core fusion strategy comprises three sequential operations:
- (1)
- Path Cost Calculation: Compute the movement cost g(n) from start to current node n.
- (2)
- Potential Field Integration: Embed APF’s gradient vector into the cost function.
- (3)
- Heuristic Balancing: Weighted synthesis of travel cost and Euclidean heuristic.
The potential field values are incorporated into the cost function with the expression:
This integration is formally expressed as follows:
where denotes the weight coefficient for the actual path cost , and represents the weight coefficient for the heuristic cost . By modulating and , the algorithm balances collision avoidance robustness and pathfinding efficiency.
To quantitatively determine the optimal weights for ω1 and ω2, several distinct strategy sets are selected for experimental evaluation. By systematically assessing the influence of varying weight values on both path length and runtime, suitable combinations of weight coefficients are identified, with key results summarized as follows.
As illustrated in Figure 3, the configuration ω1 = 0.4 and ω2 = 0.6 consistently achieves the optimal trade-off between path quality and computational efficiency. This combination produces paths that deviate only minimally from the theoretical optimum while simultaneously requiring the shortest computation time.
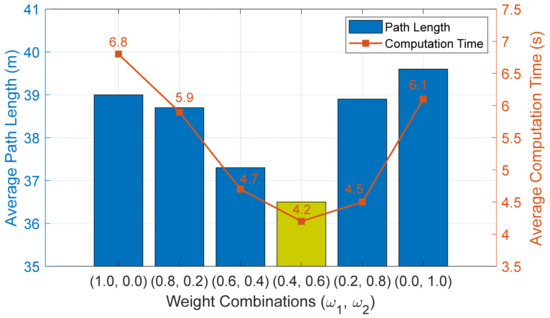
Figure 3.
Performance Comparison of Different Weight Combinations.
The potential field-enhanced cost function addresses two critical limitations: The APF algorithm’s target unreachability due to local minima and the A algorithm’s trajectory discontinuity from non-smooth curvature, which enhances the efficiency and success rate of path optimization.
4.3.3. The Pseudo-Code of the APFA* Algorithm
The pseudo-code for UAV path planning based on the APFA* algorithm is shown in Table 1.

Table 1.
Pseudo-code of the APFA* algorithm.
5. Optimization of Key Parameters of the APFA* Algorithm
Analyzing the parameters of the APFA* algorithm, it is found that the attractive gain coefficient plays a pivotal role in determining the smoothness of the UAV’s path. As it increases, the path becomes smoother, facilitating quicker arrival at the target point. However, an excessively large gravitational coefficient can lead to the UAV navigating too closely to obstacles, posing a risk of collision. The repulsion coefficient , on the other hand, governs the UAV’s oscillation during flight. A smaller repulsion coefficient results in milder oscillations and a smoother path, but a coefficient that is too small can cause the UAV to become trapped in local minima, hindering its ability to find the optimal path. Simultaneously, the repulsion coefficient is affected by the effective range of obstacles . An increase in the value of leads to a corresponding enhancement in the impact of the repulsion field. Additionally, the search step size that changes dynamically with the environment can improve the accuracy of path search and the speed of planning.
5.1. Optimizing Parameters by the Response Surface Method
The Response Surface Method (RSM) is a statistical technique. Its core principle is to build a simple empirical model (e.g., a low-order polynomial) that approximates the relationship between multiple input variables and one or more output responses. This model is then used to navigate the factor space efficiently to find optimal parameter settings [30,31]. RSM offers the advantages of requiring fewer experimental runs, shorter experimental cycles, and high accuracy of regression prediction models. It is commonly used to optimize process parameters and analyze factor interactions in engineering and scientific research.
A second-order model is essential for optimization as it can capture the curvature in the true response surface [32], including interaction effects between factors, which is necessary for locating a maximum, minimum, or saddle point. The general form of the second-order response surface model is as follows:
where is the a-th component of the -dimensional independent variable , are the parameters that constitute the column vector , and is the error.
This study adopts a Central Composite Design (CCD) to structure the experimental scheme, as it efficiently fits quadratic models with a minimal number of experimental runs. The rotatability of this design ensures a uniform distribution of prediction variance throughout the experimental domain, thus enhancing the reliability of coefficient estimation.
The parameter optimization of the APFA* algorithm using Response Surface Methodology (RSM) involves five key steps:
Step 1: Select four critical parameters as optimization factors and three performance metrics as response variables. A four-factor, three-level coded matrix is constructed using Central Composite Design (CCD) to generate the experimental protocol.
Step 2: Conduct experiments based on the design, perform nonlinear fitting, and establish a multivariate quadratic regression model for variance analysis.
Step 3: Using the regression model, visually analyze the influence of factor interactions on response indicators to identify significant combinations [33].
Step 4: Apply numerical optimization to determine the improved algorithm’s key parameters and compute system response values.
Step 5: Check whether accuracy meets requirements. If satisfied, output the optimal parameter combination; otherwise, reselect experimental factors and levels.
The response surface methodology optimizes APFA* algorithm parameters for UAV path planning, as illustrated in Figure 4.
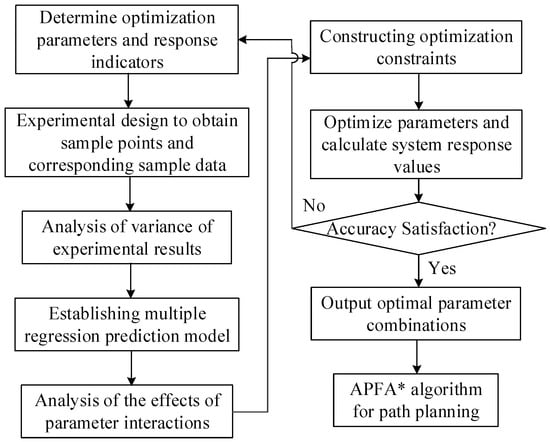
Figure 4.
Workflow for RSM-based parameter optimization [33].
5.2. Experimental Protocol Design
In this section, the gravitational coefficient , repulsive coefficient , search step length , and obstacle effective distance are chosen as optimization variables, while path length L and running time T serve as responses for building the regression prediction model. Table 2 and Table 3 present the experimental factors with their corresponding levels and the detailed design matrix, respectively.

Table 2.
Factors and the levels of experiment of APFA* algorithm parameters.

Table 3.
Levels of experimental design.
5.3. Analysis of Variance and Regression Model
An analysis of variance (ANOVA) is performed to evaluate the statistical significance of the response surface regression models, with key outcomes summarized in Table 4 [34]. The results show that the overall models are highly significant, with F-values of 18.59 and 7.66 for the two responses, and p-values below 0.0001. The lack-of-fit F-values are 3.57 and 3.50, indicating that the lack-of-fit is not statistically significant compared to pure error. The corresponding p-values for lack-of-fit are 0.0863 and 0.087 (p > 0.05), suggesting that the observed lack-of-fit can be attributed to random noise, and the models exhibit a satisfactory fit with no evidence of misfitting.

Table 4.
ANOVA for the response surface quadratic model.
In Table 4, the boldfaced values in the ‘p-value’ columns highlight the terms that are statistically significant, facilitating the identification of key factors influencing the response models. For the path length model, main factors A, B, and C are highly significant (p < 0.0001), while factor D and the interaction terms AC and BC are also significant (p < 0.05). In the running time model, factor C is highly significant, and the interaction terms AC and AD reached significance.
Using Design-Expert software (version 13.0, Stat-Ease Inc., Minneapolis, MN, USA; https://www.statease.com/ (accessed on 25 August 2025)) [35], multivariate quadratic regression models for the two response indicators are developed through regression analysis. Non-significant model terms (p > 0.05) are excluded via stepwise elimination, yielding the following final equations:
Further analysis of the indicators for the two regression models is presented in Table 5. The Predicted R-squared () for path length is relatively consistent with the Adjusted R-squared (), indicating high prediction accuracy of its regression model. However, the Predicted R-squared for runtime (0.1537) shows limited predictive capability for new data and is not as close to the Adjusted R-squared as expected, which may be due to stochastic computational noise, unmodeled system variability, or the presence of outliers. Despite this, the runtime model retains value for identifying significant factors and trends within the experimental design space. Additionally, Adequate Precision measures the signal-to-noise ratio, with values of 18.777 and 10.077 for the two models (both above 4), indicating that both models have sufficient signal to navigate the design space. Future work will focus on improving the predictive robustness of the runtime model through increased replication or incorporation of additional factors.

Table 5.
Quality of fit of the response regression models.
Figure 5 presents the normal probability plots of residuals. These plots show that the residuals for both models closely follow a straight line without significant deviation, confirming a normal error distribution. Figure 6 displays the plots of residuals versus actual values. All residuals fall within the acceptable range of [−3, 3], demonstrating the validity of the experimental model.
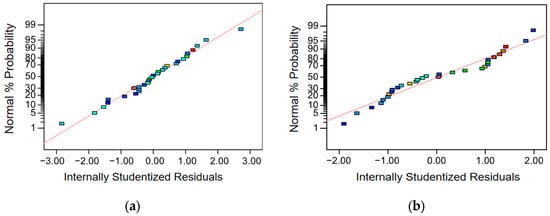
Figure 5.
Normal probability plot of the residuals (a) path residuals and (b) time residuals.
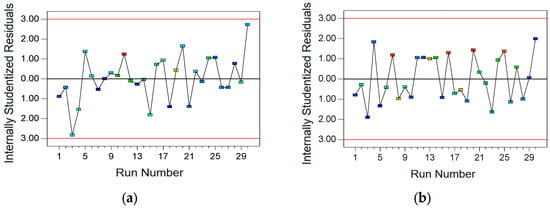
Figure 6.
The residuals and run plots (a) Path residuals vs. Run; (b) Time residuals vs. Run.
5.4. Effect of Parameter Interactions
Based on the prediction model in Table 4, we analyzed the impact of two-factor interactions on response metrics. For path length, interactions AC and BC showed the strongest effects (both with the value of 0.0009). For runtime, AC and AD are most influential ( = 0.0133, = 0.0104). Detailed response surface plots are provided in Figure 7 and Figure 8.
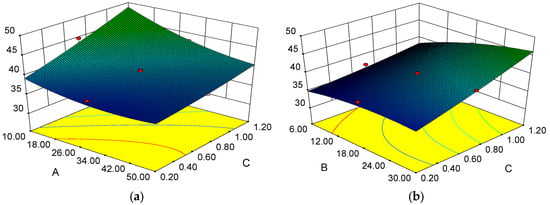
Figure 7.
Response surface diagram of parameter interaction on the path length (a) Correlation between gravitational coefficient and step length; (b) Correlation between repulsion coefficient and step length.
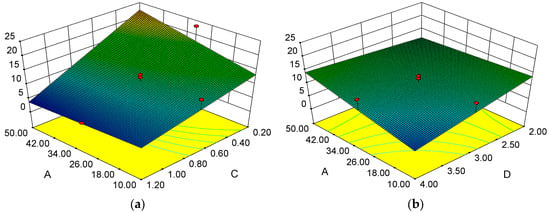
Figure 8.
Response surface diagram of parameter interaction on the running time (a) Correlation between gravitational coefficient and step length; (b) Correlation between gravitational coefficient and Obstacle influence distance.
Figure 7a displays the response surface illustrating the interaction between the gravitational coefficient (A) and step length (C) on path length. At fixed A = 10, increasing C from 0.2 m to 1.2 m increased path length by 23%. At fixed C = 1.2 m, increasing A from 10 to 50 decreased path length by 15%. This suggests that step length has a greater impact on path length than the gravitational coefficient. Path length decreased rapidly then stabilized as A increased and C decreased, with minima at extreme values.
Figure 7b demonstrates the effect of the repulsion coefficient (B) and step length (C) on the path length. At fixed B = 30, increasing C from 0.2 m to 1.2 m increased path length by 9%. At fixed C = 1.2 m, increasing B from 6 to 30 increased path length by 8%. This indicates that both factors have a similar impact on path length. As both step length and repulsion coefficient decrease, the path length gradually diminishes. This is due to the fact that excessively large values for these two factors can render the target unreachable during the path searching process.
Figure 8a displays the response surface of the interaction between the gravitational coefficient (A) and step length (C) on the running time. When A is 50, increasing C from 0.2 m to 1.2 m results in an 84% reduction in runtime. Fixing C at 0.2 m and increasing A from 10 to 50, the runtime increases by 73%. This indicates that step length significantly affects runtime, with longer steps decreasing the runtime. This is attributed to the acceleration of the path search speed with larger steps, which results in less search time.
Figure 8b depicts the impact of the gravitational coefficient (A) and obstacle safety distance (D) on time. When A is 10, increasing D from 2 m to 4 m results in a 62% decrease in running time. When D is fixed at 4 m and A is increased from 10 to 50, the running time increases by 180%. Their effects are asynchronous, with the impact of obstacle safety distance being particularly significant. Obstacle safety distance primarily affects the repulsive force coefficient; larger distances result in larger repulsive fields. Meanwhile, the minimum running time occurs when the gravitational coefficient is at its smallest.
6. Simulation Analysis and Experimental Verification
6.1. Optimal Performance Comparison
The key parameters of the APFA* algorithm are optimized using the numerical module in Design-Expert software (version 13.0). The optimization aimed to minimize both the planned path length and the runtime. Other baseline parameters for the algorithm are set according to the values provided in Table 6.

Table 6.
Description of APFA* algorithm parameters.
This section conducts a comparative simulation of the APF, A*, and APFA* algorithms for obstacle avoidance in a workshop setting. The start and goal points are set at (1, 2, 2) m and (19, 28, 9) m, respectively. Algorithm performance is assessed based on three metrics: path quality, computational time, and number of path nodes. Path quality reflects the planning capability of the algorithm, whereas computational time and node count indicate its search efficiency.
Table 7 summarizes the simulation outcomes of the three algorithms in terms of path length, runtime, and number of nodes. To determine whether the observed differences are statistically significant, a one-way analysis of variance (ANOVA) is performed for each metric, with the results provided in Table 8.

Table 7.
Comparison of Simulation Results.

Table 8.
ANOVA results for algorithm performance comparison.
The results confirm that the differences among the algorithms are statistically significant (p < 0.0001) for all three metrics. Furthermore, post hoc Tukey’s Honestly Significant Difference (HSD) tests revealed that compared to the APF algorithm, the proposed APFA* algorithm achieves a statistically significant reduction in path length (p < 0.01). Additionally, it significantly reduces running time compared to both the APF and A* algorithms (p < 0.01). Although the APFA* algorithm generates more path nodes, this is a deliberate trade-off to obtain smoother and more feasible paths, which ultimately contributes to the reduction in overall running time.
Figure 9 shows 3D path planning outcomes. All algorithms generated collision-free paths, though with distinct route characteristics.
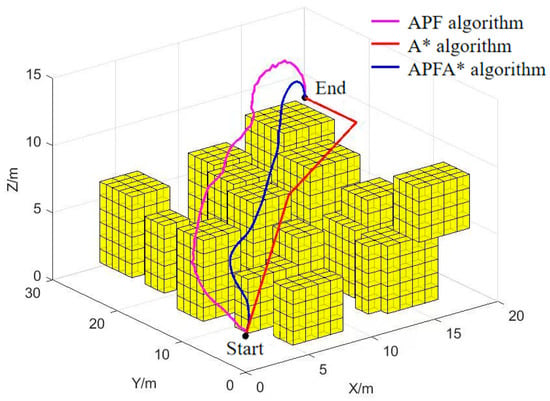
Figure 9.
Simulation results of three algorithms for path planning.
Further analyzing the paths simulated by the APF algorithm, as depicted in Figure 10, the path length generated by the APF algorithm in the workshop is 42.0 m, significantly longer than the results obtained by the other two algorithms. This suggests that the algorithm consumes excessive resources and slows down the search process, (with a runtime of 10.31 s), while the number of path nodes it expands is moderate, (84). Additionally, the planned path becomes excessively long due to the overpowering influence of the obstacles’ repulsive potential field. Furthermore, situations may arise where the attractive and repulsive forces are balanced in magnitude but opposite in direction. This equilibrium can cause the UAV to oscillate locally, resulting in route instability.
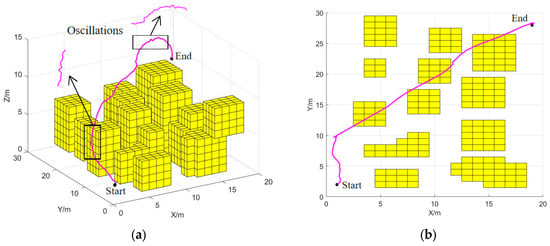
Figure 10.
The artificial potential field path planning (a) Optimal flight path; (b) Overhead path.
Figure 11 displays the path planned by the conventional A* algorithm. As summarized in Table 7, this path has a length of 36.2 m—a result that is competitive with the APFA* algorithm. The planning process is completed in 7.75 s, exploring a relatively low number of 27 nodes. As seen in Figure 11, the path exhibits discontinuous curvature and is composed of three segments connected at two inflection points. Although the path length is relatively short, the path also includes redundant nodes, leading to larger attitude angle changes for the UAV and reduced stability. Additionally, since the A* algorithm does not incorporate restrictions on flight altitude, the planned path sometimes approaches obstacles too closely, thereby violating the safety guidelines for UAV flight in workshop environments.
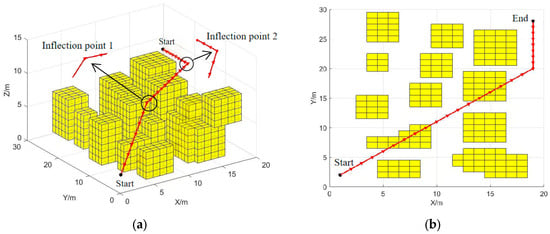
Figure 11.
The A* algorithm path planning (a) Optimal flight path; (b) Overhead path.
The simulation outcomes of the proposed APFA* algorithm are presented in Figure 12. As indicated in Table 7, the algorithm achieves a path length of 35.8 m and a computation time of 5.64 s—representing a 14.8% reduction compared to the APF method and a 1.1% improvement over the A* algorithm. Although the number of expanded nodes amounts to 179, the method maintains high search efficiency within a short execution time. As depicted in Figure 12, the integration of the attractive and repulsive fields of the APF algorithm into the cost function of the A* algorithm not only prevents UAV oscillation but also enables swift expansion of search nodes while efficiently avoiding obstacles. Furthermore, the path planned by the APFA* algorithm meets the performance constraints and eliminates the need for additional smoothing processing. Comparing the simulation results of the three algorithms, the APFA* algorithm demonstrates superior performance in terms of global planning ability and search efficiency, which indicates the feasibility of the algorithm.
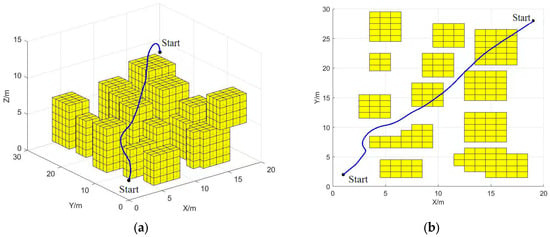
Figure 12.
The APFA* algorithm path planning (a) Optimal flight path; (b) Overhead path.
6.2. Attitude Angle Change Comparison
The attitude angle variation in the UAV during flight greatly affects its stability. Therefore, this paper analyzes and compares the attitude angle variation in the UAV along routes planned by various algorithms. Figure 13 and Figure 14 present the yaw angle and pitch angle variations achieved by the three algorithms.
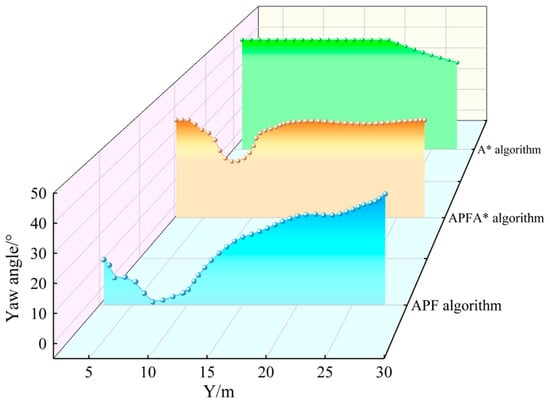
Figure 13.
Comparison of yaw angles.
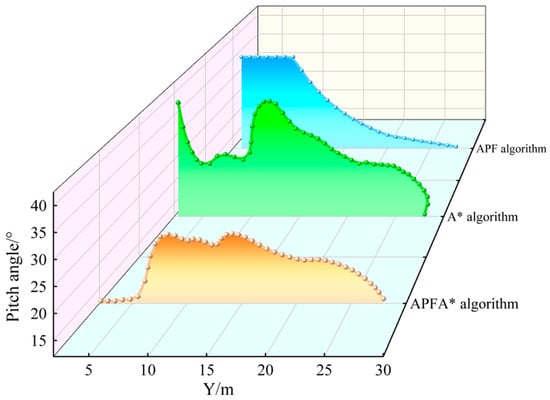
Figure 14.
Comparison of pitch angles.
From the figures, it is evident that the A* algorithm results in abrupt changes in the attitude angle, owing to the lack of smoothness constraints in its path planning. In contrast, the attitude angles obtained using the APF algorithm exhibit some degree of improvement. However, multiple oscillations in its path still lead to significant fluctuations in the attitude angles. By comparison, the path generated by the APFA* algorithm demonstrates significantly higher smoothness and fully satisfies the constraints on yaw and pitch angles. This compliance with the stability requirements of the UAV during flight further underscores the robustness of the APFA* algorithm.
6.3. Flight Altitude Comparison
Figure 15 compares the flight altitudes of routes planned by the three algorithms. It can be seen that the highest point of the route planned by the APF algorithm is 12.984 m (3.75 m from Table 6), approaching the altitude limit and posing risks in actual workshops. The route planned by the A* algorithm peaks at 9 m, effectively avoiding obstacles, but its altitude is lower than the highest point of some obstacles, making it susceptible to collisions during actual flight. In contrast, the route planned by the APFA* algorithm peaks at 11.453 m, effectively avoiding obstacles while adhering to the UAV’s maximum flight constraint, thereby achieving ideal results and further demonstrating the algorithm’s reliability.
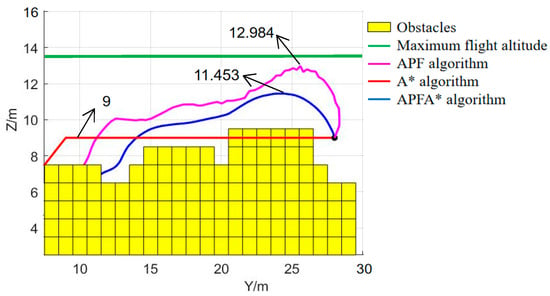
Figure 15.
Comparison of the maximum flight altitude.
6.4. Experimental Verification
To validate the APFA* algorithm, we selected several waypoints based on its planned path. A total of twenty-five flight experiments are conducted, and the results are shown in Table 9. The data indicates that the deviation between the actual flight distance of the UAV and the path length planned by the APFA* algorithm (L = 35.8 m) did not exceed 5% in any experiment, which is within a reasonable range. Additionally, no collisions occurred during any of the flights.

Table 9.
Experimental testing results.
The total energy consumption in Table 9 is calculated based on direct in-flight measurements. An INA219 current/voltage sensor, mounted on the UAV, recorded instantaneous voltage and current at a sampling rate of 10 Hz throughout each flight mission. The total energy consumption E (in Joules) is then computed by integrating the instantaneous power over the total flight time t, as follows:
In practice, this is calculated from the discrete sensor readings as follows:
where and are the voltage and current at sample , and Δt = 0.1 s is the sampling interval. This method provides a direct measurement of the actual electrical energy consumed.
As illustrated in Figure 16, the UAV successfully avoids workshop obstacles and arrives at the target position smoothly and safely across different waypoints from the fourth experiment. These results provide further validation for the practical feasibility of the APFA* algorithm.
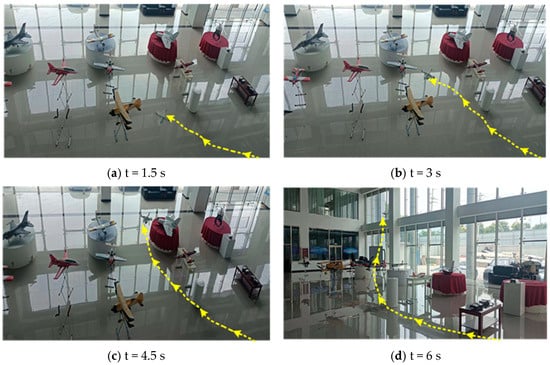
Figure 16.
Trajectory of UAV in the workshop.
7. Discussion
The simulation results demonstrate the superior performance of the proposed APFA* algorithm across multiple metrics. This performance advantage can be attributed to the synergistic design of the hybrid algorithm. The integration of the artificial potential field value into the A* cost function effectively guides the global search, reducing unnecessary expansions and mitigating the oscillation issues typical of pure APF methods. Furthermore, the dynamic VSS strategy enhances search efficiency by adapting to environmental complexity, allowing for rapid advancement in open areas and precise maneuvering in cluttered spaces. This combination successfully addresses the key limitations of the individual A* and APF algorithms.
When contextualized within existing literature, our findings highlight a significant methodological advancement. While recent studies like [16,17] have also explored hybrid A* models, our approach distinctively incorporates a systematic parameter optimization framework using RSM. This moves beyond the empirical tuning common in many hybrid algorithms, ensuring robust and repeatable performance. The ANOVA-validated regression model not only identified the optimal parameter set but also quantified critical parameter interactions, providing deeper insights into the algorithm’s behavior that are often overlooked.
Despite the promising results, this study has limitations that outline clear directions for future research. The current work assumes a known static environment, which does not account for dynamic obstacles such as moving personnel or machinery. Therefore, a primary open research question is the integration of real-time dynamic obstacle prediction and reaction mechanisms into the APFA* framework. Additionally, extending the current single-UAV planner to multi-UAV systems for coordinated tasks presents a critical and challenging research direction. Future work will also focus on further algorithmic lightweighting for extreme obstacle density and the implementation of the planned trajectories on physical UAV platforms.
8. Conclusions
This study has introduced and validated the APFA* algorithm, a parameter-optimized hybrid path planning method for UAV in complex workshop environments. The algorithm’s core innovation lies in its effective fusion of A* and APF methods, augmented by a dynamic step-size strategy and systematically optimized via RSM. Comprehensive simulations confirm that the proposed algorithm achieves a superior balance of path length, computational efficiency, and flight stability compared to conventional methods. This work thus provides a robust and efficient solution for enhancing UAV autonomy and operational safety in industrial applications.
Author Contributions
Conceptualization, X.M.; methodology, Z.Z.; software, X.Z. (Xijing Zhu); validation, J.Z.; data curation, X.W.; writing—original draft preparation, X.M.; writing—review and editing, X.M.; visualization, J.Y.; supervision, X.Z. (Xiaoqiang Zhang). All authors have read and agreed to the published version of the manuscript.
Funding
This research was funded by Taiyuan Institute of Technology Scientific Research Initial Funding, grant number: 2023KJ026, 2023LJ004, 2023KJ024, 2023LJ002, 2022LJ044, 2024KJ038, 2025LJ009. Open Fund of Shanxi Key Laboratory of Advanced Manufacturing Technology, grant number XJZZ202404 and Shanxi Higher Education Institution Science and Technology Innovation Project, grant number 2023L350.
Data Availability Statement
The original contributions presented in this study are included in the article, and further inquiries can be directed to the corresponding author.
Conflicts of Interest
Author Zhikang Zhang was employed by the company China Railway 12th Bureau Group Third Engineering Co., Ltd. The remaining authors declare that the research was conducted in the absence of any commercial or financial relationships that could be construed as a potential conflict of interest.
References
- Zhou, Y.M.; Su, Y.; Xie, A.H.; Kong, L.Y. A newly bio-inspired path planning algorithm for autonomous obstacle avoidance of UAV. Chin. J. Aeronaut. 2021, 34, 199–209. [Google Scholar] [CrossRef]
- Debnath, D.; Vanegas, F.; Boiteau, S.; Gonzalez, F. An Integrated Geometric Obstacle Avoidance and Genetic Algorithm TSP Model for UAV Path Planning. Drones 2024, 8, 302. [Google Scholar] [CrossRef]
- Meng, X.L.; Zhu, X.J. Autonomous Obstacle Avoidance Path Planning for Grasping Manipulator Based on Elite Smoothing Ant Colony Algorithm. Symmetry 2022, 14, 1843. [Google Scholar] [CrossRef]
- Allaire, F.C.J.; Tarbouchi, M.; Labonté, G.; Fusina, G. FPGA implementation of genetic algorithm for UAV real-time path planning. J. Intell. Robot. Syst. 2009, 54, 495–510. [Google Scholar] [CrossRef]
- Pan, Y.W.; Yang, Y.W.; Li, W.Z. A deep learning trained by genetic algorithm to improve the efficiency of path planning for data collection with multi-UAV. IEEE Access 2021, 9, 7994–8005. [Google Scholar] [CrossRef]
- Chen, Y.B.; Luo, G.C.; Mei, Y.S.; Yu, J.Q.; Su, X.L. UAV path planning using artificial potential field method updated by optimal control theory. Int. J. Syst. Sci. 2016, 47, 1407–1420. [Google Scholar] [CrossRef]
- Hao, G.Q.; Lv, Q.; Huang, Z.; Zhao, H.L.; Chen, W. UAV Path Planning Based on Improved Artificial Potential Field Method. Aerospace 2023, 10, 562. [Google Scholar] [CrossRef]
- Fu, Y.; Ding, M.; Zhou, C. Phase angle-encoded and quantum behaved particle swarm optimization applied to three-dimensional route planning for UAV. IEEE Trans. Syst. Man Cybern. A 2012, 42, 511–526. [Google Scholar] [CrossRef]
- Phung, M.D.; Ha, Q.P. Safety-enhanced UAV path planning with spherical vector-based particle swarm optimization. Appl. Soft Comput. 2021, 107, 107376. [Google Scholar] [CrossRef]
- Flores-Caballero, G.; Rodríguez-Molina, A.; Aldape-Pérez, M.; Villarreal-Cervantes, M.G. Optimized path-planning in continuous spaces for unmanned aerial vehicles using meta-heuristics. IEEE Access 2020, 8, 176774–176788. [Google Scholar] [CrossRef]
- Guo, Y.C.; Liu, X.X.; Liu, X.H.; Yang, Y.; Zhang, W.G. FC-RRT*: An Improved Path Planning Algorithm for UAV in 3D Complex Environment. ISPRS Int. J. Geo-Inf. 2022, 11, 112. [Google Scholar] [CrossRef]
- Pan, Z.H.; Zhang, C.X.; Xia, Y.Q.; Xiong, H.; Shao, X.D. An Improved Artificial Potential Field Method for Path Planning and Formation Control of the Multi-UAV Systems. IEEE Trans. Circuit Syst. II Express Briefs 2021, 69, 1129–1133. [Google Scholar] [CrossRef]
- Farid, G.; Cocuzza, S.; Younas, T.; Razzaqi, A.A.; Wattoo, W.A.; Cannella, F.; Mo, H.W. Modified A-Star (A*) Approach to Plan the Motion of a Quadrotor UAV in Three-Dimensional Obstacle-Cluttered Environment. Appl. Sci. 2022, 12, 5791. [Google Scholar] [CrossRef]
- Diao, Q.F.; Zhang, J.F.; Liu, M.; Yang, J.X. A Disaster Relief UAV Path Planning Based on APF-IRRT* Fusion Algorithm. Drones 2023, 7, 323. [Google Scholar] [CrossRef]
- Bai, X.; Jiang, H.K.; Cui, J.J.; Lu, K.; Chen, P.Y.; Zhang, M. UAV Path Planning Based on Improved A and DWA Algorithms. Int. J. Aerosp. Eng. 2021, 2021, 4511252. [Google Scholar] [CrossRef]
- Liu, L.H.; Ru, L.; Wang, W.F.; Xi, H.L.; Zhu, R.; Li, S.L.; Zhang, Z.H. UAV Path Planning in Threat Environment: A*-APF Algorithm for Spatio-Temporal Grid Optimization. Drones 2025, 9, 661. [Google Scholar] [CrossRef]
- Dong, B.Y.; Zhang, G.; Yang, Y.; Yuan, P.Y.; Lu, S.T. A Voronoi–A* Fusion Algorithm with Adaptive Layering for Efficient UAV Path Planning in Complex Terrain. Drones 2025, 9, 542. [Google Scholar] [CrossRef]
- Jayarajan, N.; Ganesan, T.; Naganathan, A. Optimal trajectories for UAV three-dimensional path planning using a hybrid ABC-RRT* algorithm. Proc. Inst. Mech. Eng. C J. Mec. Eng. Sci. 2025, 239, 930–943. [Google Scholar] [CrossRef]
- Wang, Q.; Yi, W.J. Composite Improved Algorithm Based on Jellyfish, Particle Swarm and Genetics for UAV Path Planning in Complex Urban Terrain. Sensors 2024, 24, 7679. [Google Scholar] [CrossRef]
- Krishnan, P.S.; Martinez, K. Implementation of optimized dynamic trajectory modification algorithm to avoid obstacles for secure navigation of UAV. Appl. Soft Comput. 2020, 90, 106168. [Google Scholar] [CrossRef]
- Zeng, R.; Luo, R.T.; Liu, B. UAV Path Planning for Forest Firefighting Using Optimized Multi-Objective Jellyfish Search Algorithm. Mathematics 2025, 13, 2745. [Google Scholar] [CrossRef]
- Liu, C.Y.; Zhang, D.L.; Li, W.K. A global dynamic evolution snow ablation optimizer for unmanned aerial vehicle path planning under space obstacle threat. Sci. Rep. 2024, 14, 29876. [Google Scholar] [CrossRef] [PubMed]
- Gu, T.; Zhang, Y.J.; Wang, L.M.; Zhang, Y.F.; Deveci, M.; Wen, X. A comprehensive analysis of multi-strategic RIME algorithm for UAV path planning in varied terrains. J. Ind. Inf. Integr. 2025, 43, 100742. [Google Scholar] [CrossRef]
- Wang, W.T.; Li, X.L.; Tian, J. UAV formation path planning for mountainous forest terrain utilizing an artificial rabbit optimizer incorporating reinforcement learning and thermal conduction search strategies. Adv. Eng. Inform. 2024, 62, 102947. [Google Scholar] [CrossRef]
- Kong, F.C.; Wang, Q.; Gao, S.; Yu, H.L. B-APFDQN: A UAV Path Planning Algorithm Based on Deep Q-Network and Artificial Potential Field. IEEE Access 2023, 11, 44051–44064. [Google Scholar] [CrossRef]
- Miao, C.W.; Chen, G.Z.; Yan, C.L.; Wu, Y.Y. Path planning optimization of indoor mobile robot based on adaptive ant colony algorithm. Comput. Ind. Eng. 2021, 156, 107230. [Google Scholar] [CrossRef]
- Gao, R.Z.; Wang, Y.B.; Bai, X.F.; Zhu, Z.L. Self-organizing pursuit strategy in an unknown environment. Intell. Serv. Robot. 2025, 18, 21–33. [Google Scholar] [CrossRef]
- Chen, Y.Q.; Yu, Q.Z.; Han, D.; Jiang, H. UAV path planning: Integration of grey wolf algorithm and artificial potential field. Concurr. Comput. Pract. Exp. 2024, 36, e8120. [Google Scholar] [CrossRef]
- Li, Y.C.; Dong, X.Z.; Ding, Q.Q.; Xiong, Y.L.; Liao, H.L.; Wang, T. Improved A-STAR Algorithm for Power Line Inspection UAV Path Planning. Energies 2024, 17, 5364. [Google Scholar] [CrossRef]
- Alrweili, H.; Georgiou, S.; Stylianou, S. A New Class of Second-Order Response Surface Designs. IEEE Access 2020, 8, 115123–115132. [Google Scholar] [CrossRef]
- Zhen, Z.; Yao, J.L.; Pang, Z.B.; Bo, L. Optimization of electrocoagulation process to eliminate CODMn in micro-polluted surface water using response surface method. J. Dispers. Sci. Technol. 2016, 37, 743–751. [Google Scholar] [CrossRef]
- Bhuiyan, T.; Hossain, M.; Ahmed, I. Optimization of Cutting Parameters in Turning Process. SAE Int. J. Mater. Manuf. 2014, 3, 582–590. [Google Scholar] [CrossRef]
- Meng, X.L.; Zhu, X.J.; Zhao, J. Obstacle avoidance path planning using the elite ant colony algorithm for parameter optimization of unmanned aerial vehicles. Arab. J. Sci. Eng. 2023, 48, 2261–2275. [Google Scholar] [CrossRef]
- Bezerra, M.A.; Santelli, R.E.; Oliveira, E.P.; Villar, L.S.; Escaleira, L.A. Response surface methodology (RSM) as a tool for optimization in analytical chemistry. Talanta 2008, 76, 965–977. [Google Scholar] [CrossRef]
- Rao, B.A.; Tak, M.; Rao, R.N.; Bathe, R. Developing Laser-Assisted Machining Process for Nickel Based Superalloy IN625 Using Experimental and Statistical Analysis. Lasers Manuf. Mater. Process. 2023, 10, 681–701. [Google Scholar] [CrossRef]
Disclaimer/Publisher’s Note: The statements, opinions and data contained in all publications are solely those of the individual author(s) and contributor(s) and not of MDPI and/or the editor(s). MDPI and/or the editor(s) disclaim responsibility for any injury to people or property resulting from any ideas, methods, instructions or products referred to in the content. |
© 2025 by the authors. Licensee MDPI, Basel, Switzerland. This article is an open access article distributed under the terms and conditions of the Creative Commons Attribution (CC BY) license (https://creativecommons.org/licenses/by/4.0/).