Article

Machine Learning-Assisted Synergistic Optimization of 3D Printing Parameters for Enhanced Mechanical Properties of PLA/Boron Nitride Nanocomposites

by
Sundarasetty Harishbabu
1,
Nashmi H. Alrasheedi
2,
Borhen Louhichi
3,
P. S. Rama Sreekanth
1 and
Santosh Kumar Sahu
1,*
1
School of Mechanical Engineering, VIT-AP University, Besides A.P. Secretariat, Amaravati 522237, Andhra Pradesh, India
2
Department of Mechanical Engineering, College of Engineering, Imam Mohammad Ibn Saud Islamic University (IMSIU), Riyadh 11432, Saudi Arabia
3
Engineering Sciences Research Center (ESRC), Deanship of Scientific Research, Imam Mohammad Ibn Saud Islamic University (IMSIU), Riyadh 11432, Saudi Arabia
*
Author to whom correspondence should be addressed.
Machines 2025, 13(10), 949; https://doi.org/10.3390/machines13100949
Submission received: 11 September 2025 / Revised: 8 October 2025 / Accepted: 11 October 2025 / Published: 14 October 2025

Abstract

Additive manufacturing via fused deposition modeling (FDM) offers a versatile method for fabricating complex polymer parts; however, enhancing their mechanical properties remains a significant challenge, particularly for biopolymers such as polylactic acid (PLA). PLA is widely used in 3D printing due to its biodegradability and ease of processing, but its relatively low mechanical strength and impact resistance limit its broader applications. This study explores the reinforcement of PLA with boron nitride nanoplatelets (BNNPs) to improve its mechanical properties. This study also aims to optimize key FDM process parameters, such as reinforcement content, nozzle temperature, printing speed, layer thickness, and sample orientation, using a Taguchi L27 design. Results show that the addition of 0.04 wt.% BNNP significantly improves the mechanical properties of PLA, enhancing tensile strength by 44.2%, Young’s modulus by 45.5%, and impact strength by over 500% compared to pure PLA. Statistical analysis (ANOVA) reveals that printing speed and nozzle temperature are the primary factors affecting tensile strength and Young’s modulus, while impact strength is primarily influenced by nozzle temperature and reinforcement content. Machine learning models, such as CatBoost and Gaussian process regression, predict mechanical properties with high accuracy (R2 > 0.98), providing valuable insights for tailoring PLA/BNNP composites and optimizing FDM process parameters. This integrated approach presents a promising path for developing high-performance, sustainable nanocomposites for advanced additive manufacturing applications.

1. Introduction

Polylactic acid (PLA) is one of the most widely used polymers in three-dimensional (3D) printing because it is biodegradable and derived from renewable sources such as cornstarch and sugarcane [1,2]. Its ease of processing, low warping, and good surface finish make it attractive for engineering application [3,4]. However, despite these advantages, the relatively low tensile strength, brittleness, and limited impact resistance of PLA restrict its broader adoption in structural and engineering applications [5,6,7]. Addressing these mechanical limitations has motivated the development of PLA-based composites reinforced with various fillers [8,9,10].
Several reinforcements have been explored to enhance PLA’s strength, stiffness, and durability. Khamvongsa et al. [11] reported that PLA/hydroxyapatite (HA) composites increased brittleness while compromising compressive performance. Arunkumar et al. [12] demonstrated that PLA/Zn composites improved compressive and impact strength under specific infill patterns. Firoz et al. [13] found that magnetite nanoparticles enhanced stiffness but reduced tensile strength. Similarly, Bakhtiari et al. [14] showed that incorporating graphitic carbon nitride (g-C3N4) improved biodegradation and compressive strength, whereas Mohammed et al. [15] revealed that multi-walled carbon nanotube (MWCNT) reinforcement enhanced tensile strength depending on printing angle. Other bio- and particulate fillers such as horse gram [16], sawdust [17], ceramics [18], indium selenide [19], pullulan [20], banana fibers [21], boron nitride nanosheets [22], and CNT nanoparticles [23] have also been tested, with improvements in modulus, toughness, and wear resistance depending on filler type and loading.
These studies collectively confirm that potential fillers, particularly nanofillers, play a significant role in tailoring PLA composites; however, they also reveal limitations. Many fillers improve certain properties but compromise others or introduce challenges such as agglomeration, brittleness, or reduced ductility. Furthermore, most research relies heavily on adjusting FDM processing parameters—such as layer thickness, infill density, printing speed, and nozzle temperature—to improve interlayer bonding and mechanical strength [24]. While optimization of these parameters is valuable, systematic and predictive frameworks that couple material modification with advanced modeling remain scarce. Importantly, to the best of the authors’ knowledge, limited work exists on PLA reinforced with boron nitride nanoplatelets (BNNPs) using FDM processing. BNNPs are two-dimensional nanostructures possessing exceptional mechanical properties, including high intrinsic strength, modulus, and stiffness. Their high aspect ratio enables efficient stress transfer from the polymer matrix to the nanofiller, thereby enhancing tensile and impact properties [25,26,27]. In addition, the rigid platelet-like morphology of BNNPs can restrict polymer chain mobility, leading to improved load-bearing capability and dimensional stability. These characteristics make BNNPs a promising reinforcement for tailoring the mechanical performance of PLA composites, particularly in applications where higher strength, modulus, and durability are required. Another key gap lies in the optimization methodology. Prior works often used Taguchi design or single-factor approaches but rarely integrated statistical validation such as ANOVA. Further, advanced ML methods can provide predictive insights into the influence of process parameters on mechanical performance. To address these gaps, the present study develops and evaluates PLA/BNNP nanocomposites fabricated via FDM and systematically optimized through a hybrid framework combining Taguchi design of experiments, ANOVA, and ML approaches. The objective is to maximize tensile and impact performance while ensuring predictive accuracy and interpretability, thereby advancing both the material and process design of high-performance PLA-based composites.

2. Materials and Methods

2.1. Materials

Polylactic acid (PLA) granules, with a density ranging from 1.20 to 1.30 g/cc and a melt flow index (MFI) expressed in g/10 min, were procured from Banka BioLoo Limited, India. Boron nitride nanoplatelets (BNNPs), which exhibit a platelet-like morphology, a molecular weight of 24.82, and a purity greater than 99%, were supplied by Nano Research Elements. The average particle size (APS) of the BNNPs was below 100 nm. The platelet morphology of the BNNPs was confirmed through transmission electron microscopy (TEM), as shown in Figure 1a. The particle size distribution, presented in Figure 1b, further confirms that the average particle diameter is approximately 100 nm. This size range is significant, as it can substantially impact the mechanical properties of PLA composites, influencing properties such as tensile strength, stiffness, and flexibility [28].

2.2. Experimental Design by Statistical Analysis (DOE)

A statistical design of experiments (DOE) approach was adopted to systematically evaluate the effects of key processing parameters on the mechanical properties of PLA/BNNP composites. The selected parameters were reinforcement content (wt.%), nozzle temperature, printing speed, sample orientation angle, and layer height, each varied at three levels, as summarized in Table 1. A full factorial design for these five factors would require 35 = 243 experimental runs. To achieve a reliable analysis of the main effects and interactions with fewer experiments, a Taguchi orthogonal array was employed, thereby significantly reducing the experimental effort [29,30].

2.3. Sample Fabrication

2.3.1. Filament Extrusion

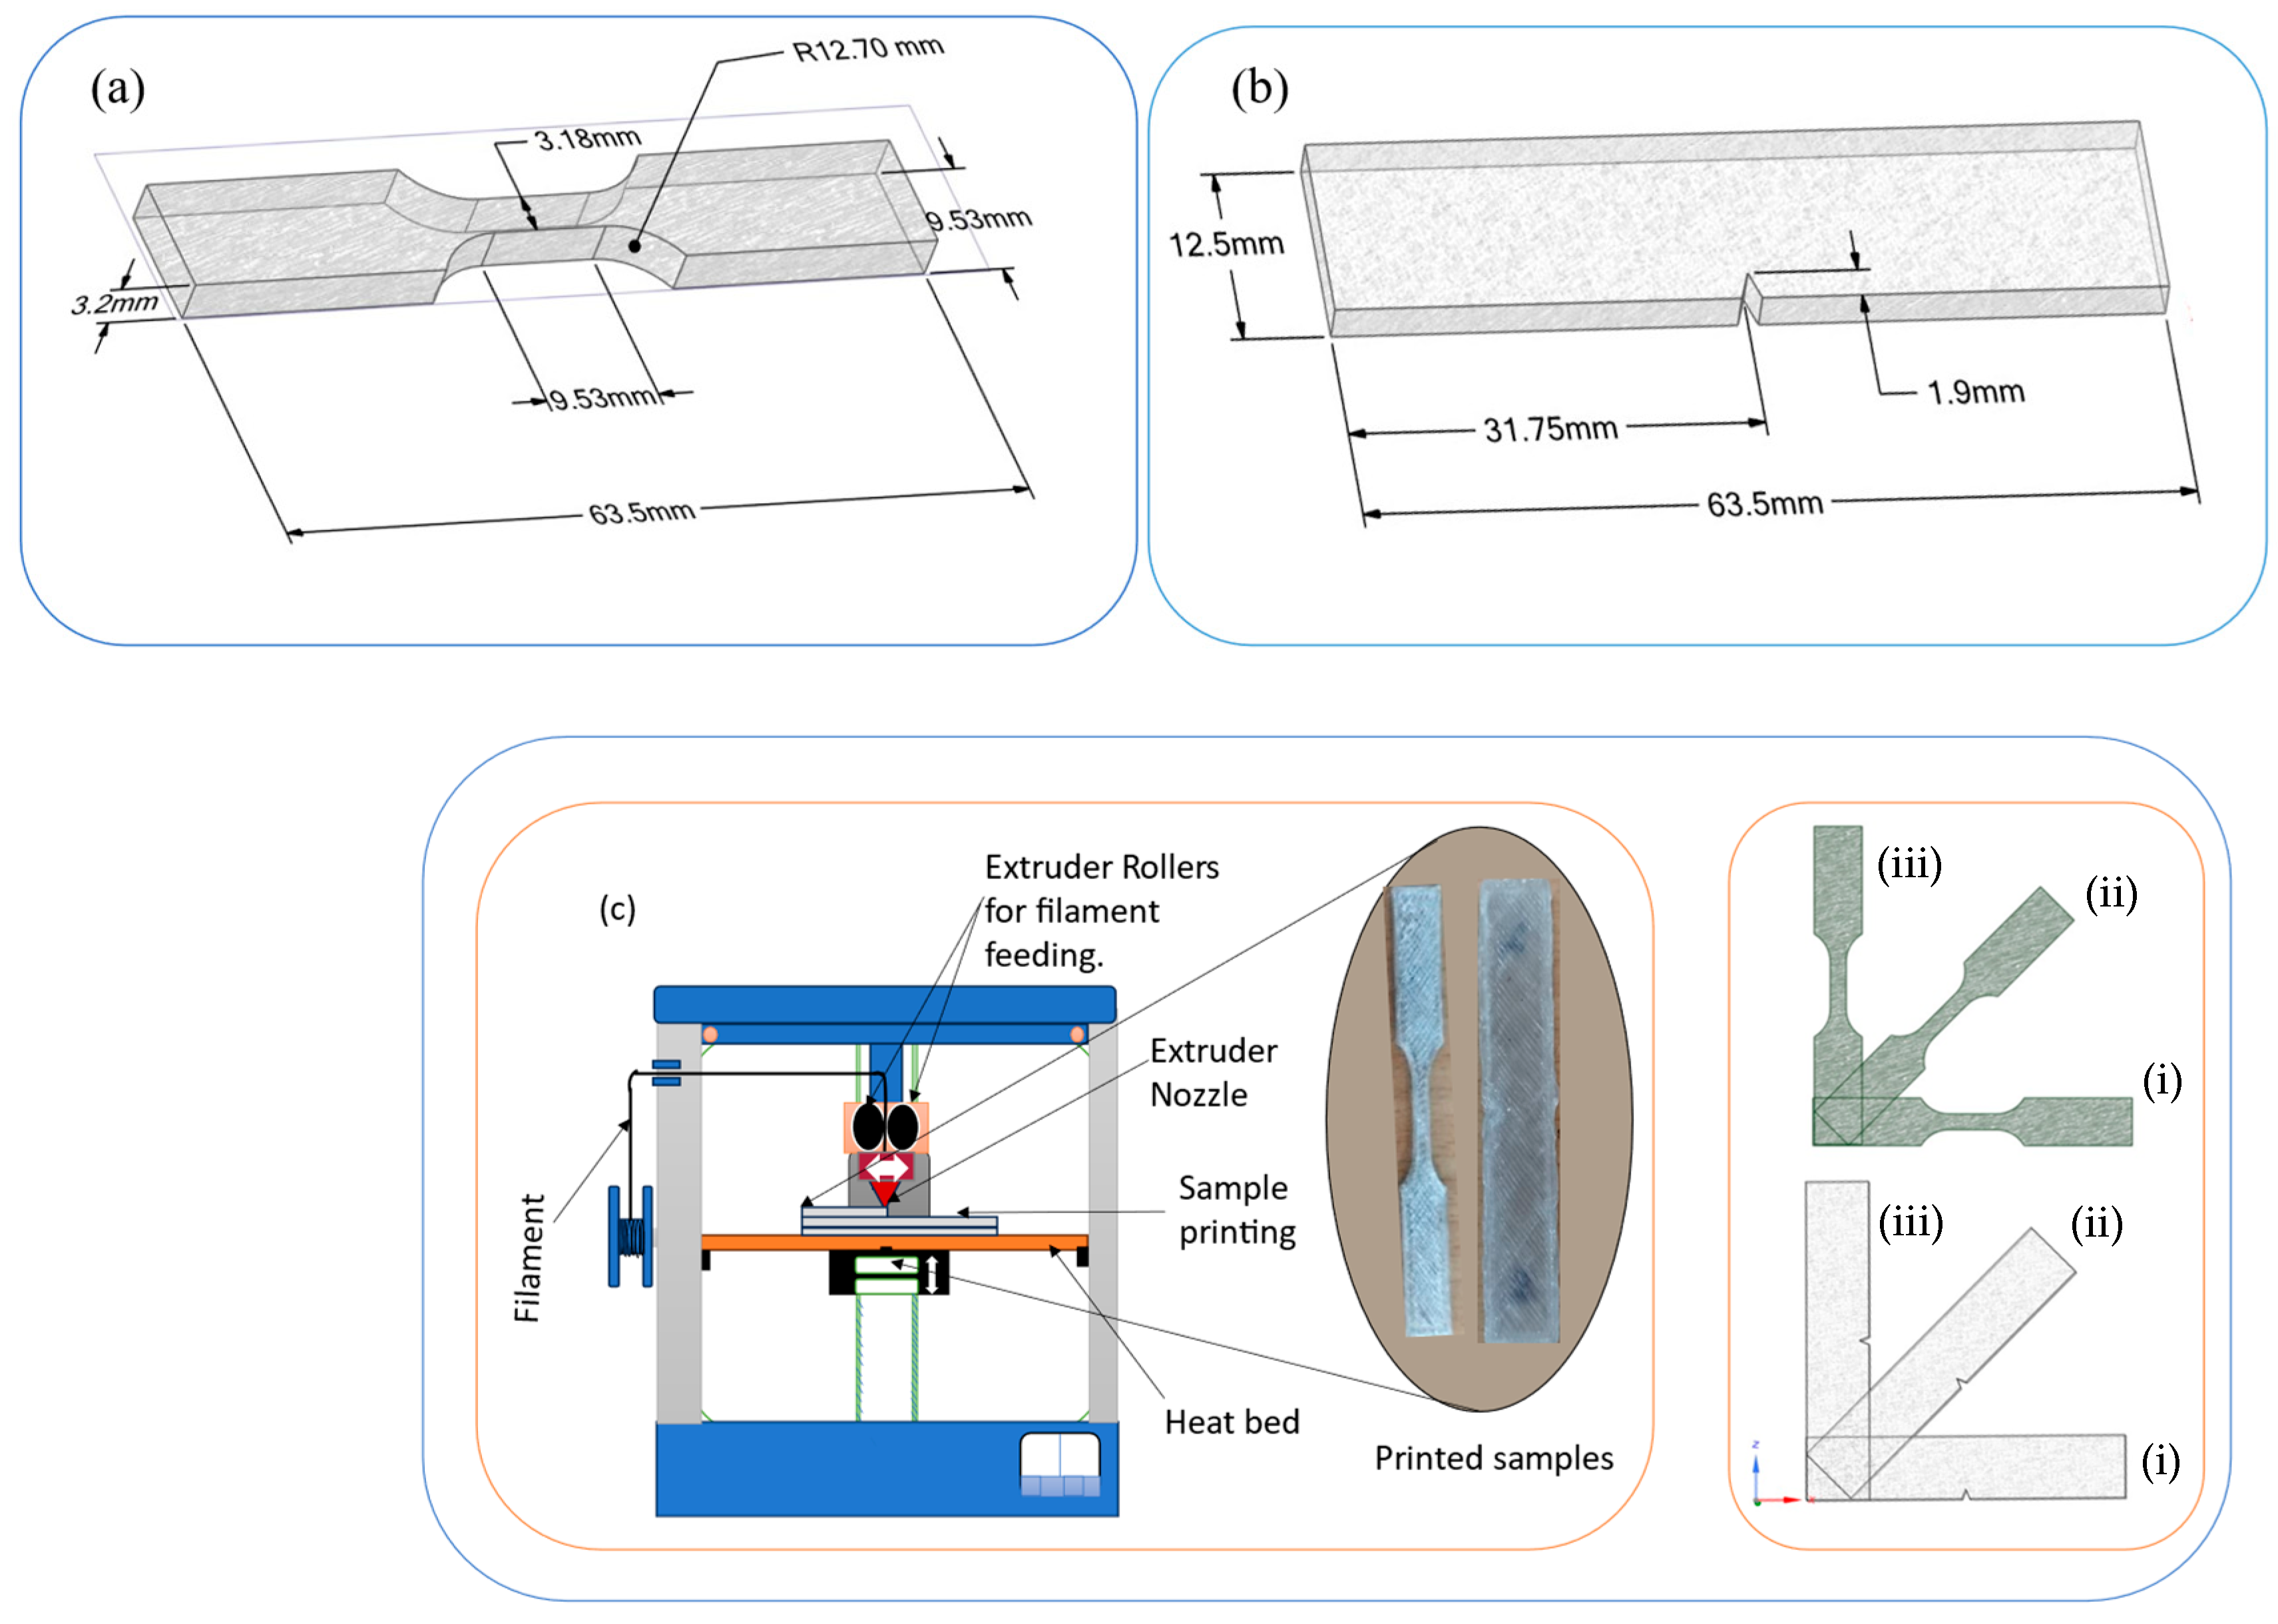
The filament extrusion process consisted of two main stages as shown in Figure 2a,b. In the first stage, PLA was used as the matrix and BNNP as the filler, with the compositions summarized in Table 1: pure PLA (0%), PLA with 0.02 wt.% BNNP, and PLA with 0.04 wt.% BNNP. The required amount of BNNP was weighed using a digital balance, dispersed in ethanol at a 1:20 ratio, and sonicated in a glass beaker at 40 kHz frequency and 200 W power for 30 min to achieve uniform distribution. The nanofluid was heated on a magnetic stirrer while PLA granules were gradually added, allowing complete evaporation of ethanol. The composite mixture was then dried in a vacuum oven at 70 °C for 24 h to remove residual moisture. In the second stage, the dried PLA/BNNP granules were processed in a twin-screw extruder (AASAVI/25TS/CO/300/30, Aasabi Machinery Pvt. Ltd., Mumbai, India) operated at barrel temperatures ranging from 150 °C to 180 °C, with a screw speed of 30 rpm. The extruder used a die diameter of 2 mm to extrude the filament with a diameter of 1.75 mm and a tolerance of ±0.05 mm. The molten composite was extruded, rapidly cooled in a water bath, and drawn through a puller system to maintain the filament diameter. The filaments were then wound onto spools and stored in airtight containers to prevent moisture absorption, making them suitable for subsequent 3D printing [31,32,33,34].

2.3.2. Sample Preparation

Tensile and impact specimens were fabricated using a FlashForge fused deposition modeling (FDM) 3D printer equipped with a 0.4 mm nozzle, which provided precise control over parameters such as layer height, temperature, and print speed. The specimen geometries were created in Ansys SpaceClaim 2019 according to ASTM D638 Type V and ASTM D256 Type A standards [35], as shown in Figure 3a,b. The models were exported in STL format and imported into FlashPrint 5 software for slicing. During slicing, parameters such as perimeter reinforcement, nozzle temperature, printing speed, sample orientation angle in the Z-direction, and layer thickness were varied at three levels, as listed in Table 2, while a wall thickness of 1.6 mm, a line-type infill pattern, and 100% infill density were used to ensure solid internal structures. The printing process was carried out using the 3D printer (FlashForge Dreamer, Reddx Technologies Pvt Ltd., Chennai, India), as shown in Figure 3c. All fabricated specimens were subsequently inspected for defects and measured for dimensional accuracy in compliance with ASTM standards before mechanical testing.

2.4. Mechanical Testing

2.4.1. Tensile Testing

Tension tests were performed in accordance with ASTM D638 guidelines to evaluate the mechanical properties of the specimens. A Universal Testing Machine (UTM) (H10KL, Tinius Olsen India Pvt. Ltd., Noida, India) was employed to ensure precise control and measurement during the tests. The specimens underwent uniaxial tensile loading at a constant strain rate of 2 mm/min, which promoted uniform deformation and allowed for accurate measurements of both tensile strength and Young’s modulus. Tensile strength represents the maximum stress a material can withstand while being stretched, and Young’s modulus measures the material’s stiffness, indicating how much it will elongate under applied stress. The data obtained from these tests provide critical insights into the material’s mechanical performance, which is essential for its application in various engineering fields. This testing method follows recognized standards in materials science, ensuring the reliability and reproducibility of the results.

2.4.2. Impact Testing

Impact testing was carried out on Izod samples to evaluate the impact resistance of the composites. The tests were performed using an Izod impact tester. Specimens were prepared on a 3D printer according to ASTM D256 Type A standards, with standard dimensions featuring a 2.5 mm wide V-notch and a 45° included angle. During testing, each specimen was clamped vertically with the notch facing the striker, and an impact hammer with an energy capacity of 2.71 J was released at a constant velocity to strike the base of the notch and fracture the sample. For each test condition, five specimens were tested, and the average impact strength values were reported to ensure reliability of the results. The absorbed energy during fracture was recorded directly from the machine display, and the Izod impact strength was calculated using Equation (1) [36].
I m p a c t   S t r e n g t h K J m 2 = E a A
Here, E a is absorbed energy in Joules, and A is the area of the specimen.

2.5. Statistical Analysis

2.5.1. Analysis of the Signal-to-Noise (S/N) Ratio

Signal-to-Noise (S/N) ratio analysis was performed to evaluate the influence of processing parameters on the response variables obtained from the design of experiments (DOE) and to identify the most robust factors in the experimental setup. The S/N ratio is a useful metric because it considers both the mean and variability of the measured response, allowing optimization even under fluctuating processing conditions. In this study, the “larger-the-better” criterion was selected, as the objective was to maximize the response values. For the Taguchi design of experiments, the “larger-the-better” S/N ratio was calculated using Equation (2) [37].
S N   R a t i o l a r g e r   t h e   b e t t e r = 10   log 10 1 k j = 1 k 1 V j 2

2.5.2. Analysis of Variance (ANOVA)

Analysis of variance (ANOVA) is a widely used statistical technique for evaluating experimental data, particularly effective in determining the significance and relative impact of different input parameters. In this study, the results obtained from the Taguchi design of experiments were analyzed using ANOVA to identify the statistically significant processing parameters, as summarized in Table 1. The analysis focused on key mechanical properties, including tensile strength, Young’s modulus, and the comparative performance of pure PLA versus PLA/BNNP composites. The choice of whether to perform ANOVA on the L27 media has a direct impact on the statistical validity and interpretation of the results. Clarifying this distinction is crucial, as it influences the assessment of variability and interactions between factors. All ANOVA calculations were performed using Minitab 2021 software at a 95% confidence level [38].

2.6. Machine Learning

Machine learning (ML) provides a robust, data-driven framework for simulating and optimizing the mechanical behavior of 3D-printed PLA and PLA/BNNP composites. Unlike conventional statistical methods such as ANOVA, ML can capture complex, nonlinear relationships between processing parameters and mechanical responses, offering deeper insights into material performance. In this study, various ML models were employed to predict key mechanical properties—tensile strength, Young’s modulus, and impact strength—based on critical 3D printing factors such as reinforcement content, nozzle temperature, printing speed, and orientation angle. Model accuracy was evaluated using performance metrics such as mean squared error (MSE), root mean square error (RMSE), and the coefficient of determination (R2). Additional metrics, such as mean absolute error (MAE) and mean absolute percentage error (MAPE), were applied for comprehensive model evaluation, as defined in Equations (3)–(8) [39,40]. To ensure reliable model evaluation and prevent overfitting, Leave-One-Out (LOO) cross-validation was employed. In LOO, each data point is used as the test set once, while the remaining N−1N-1N−1 points are used for training. This method enables the testing of each data point individually, providing a thorough evaluation of model performance and ensuring that it generalizes well across different datasets.
R 2 = 1 j = 1 k ( V j V ¯ j ) 2 j = 1 k ( V j V ¯ ) 2
M S E = 1 n j = 1 k ( V j V ¯ j ) 2
R M S E = M S E = ( V j V ¯ j ) 2
R R M S E = R M S E V ¯ = ( V j V ¯ j ) 2 v ¯ × 100
M A E = 1 k j = 1 k V j V ¯ j
M A P E = 1 k j = 1 k V j V ¯ j V j × 100
Here, k represents the total number of observations or trials. Vj denotes the actual measured value for the jth trial, while V ¯ refers to the average of all actual values. Similarly, V ¯ j indicates the predicted value corresponding to the jth observation.

2.6.1. Linear Regression (LR)

Linear regression (LR) is a fundamental predictive modeling technique used to determine the relationship between input process parameters—such as reinforcement wt.%, nozzle temperature, printing speed, sample orientation angle, layer thickness (Table 1)—and the resulting mechanical properties. In this study, LR was applied to predict three key characteristics of 3D-printed PLA-based composites: tensile strength, Young’s modulus, and impact strength. As a baseline model, LR is valuable for preliminary prediction and comparison because it assumes a linear relationship between input variables and output responses. To ensure reliable evaluation, the dataset was divided into training and testing subsets. The mathematical representation of the relationship between the dependent and independent variables is provided in Equations (9) and (10) [41].
Linear regression model
V ¯ = 0 + 1 C 1 + 2 C 2 + 3 C 3 + 4 C 4 + 5 C 5
Here, C 1   , C 2 ,   C 3 ,   C 4 ,   a n d   C 5 are the processing parameters of the 3D printer, respectively, and 0 ,   1 ,   2 ,   3 ,   4 ,   a n d   5 are the coefficients of the model.
Coefficients of the model
¯ = C T C 1 C T v
Here, C is the scaled matrix of processing parameters, and V is the scaled responses, such as tensile strength, Young’s modulus, and impact strength.

2.6.2. Random Forest Regression (RFR)

Random Forest Regression (RFR) is a robust machine learning method for predicting continuous outcomes, particularly effective in capturing nonlinear relationships and reducing overfitting. It improves generalization and minimizes prediction variance by combining the outputs of multiple decision trees, each trained on randomly selected subsets of the dataset and input features. In this study, RFR was applied to optimize key 3D printing parameters—reinforcement wt.%, nozzle temperature, printing speed, sample orientation angle, layer thickness—that strongly influence the mechanical performance of printed specimens. The mapping between input and output variables is represented by Equation (11), while the final predictions are obtained by averaging the outputs of all decision trees in the ensemble, as expressed in Equation (12) [42].
D = { ( C j , V j ) } K j = 1
In this case, V-j is tensile strength, Young’s modulus, impact strength, and C-j is reinforcement content, nozzle temperature, printing speed, sample orientation angle, and printing layer thickness.
Regarding the specified input factors f 1 C , f 2 C , f 3 C , … f t C ., the forecast output, V, is the average of the individual tree predictions. P, the Random Forest Regression, is made up of T regression trees.
V ¯ C = 1 T t = 1 T f t C
Here, O ¯ C is the predicted value for the input C, T is the total number of decision trees in the forest, and f t C is the prediction from the T t h tree.
  • Top of form;
  • Bottom of form.

2.6.3. Extreme Gradient Boosting (XGBoost)

An advanced machine learning technique called Extreme Gradient Boosting (XGBoost) sequentially creates several decision trees, with each new tree being trained to rectify the mistakes of the ones that came before it. By varying crucial 3D printing parameters such as reinforcement weight percentage, nozzle temperature, printing speed, sample orientation angle, layer thickness, and XGBoost, this study utilizes the technique to predict critical mechanical properties of composites, including tensile strength, Young’s modulus, and impact strength. To avoid overfitting, the approach optimizes a regularized objective function, as described in Equation (13), which combines the prediction loss with a penalty for model complexity. Equation (14) explains how the predictions of each decision tree are combined to determine the final output. With this approach, XGBoost can retain high predictive performance for unseen data while modeling intricate, nonlinear interactions between process parameters and material attributes [43,44,45].
L n = j = 1 k ( l ( V j , V ¯ j n ) + a = 1 n f a
f = β T + 1 2 ω 2
l is a smooth loss function that quantifies the error between the predicted and actual values. Each fa represents a decision tree added during iteration a. To avoid overfitting, Equation (14) introduces a regularization term f , where T is the number of terminal nodes (leaves), ω is the score assigned to each leaf, and β and δ are constants that penalize excessive model complexity.

2.6.4. CatBoost Regression (CBR)

CatBoost Regression (CBR) is an advanced gradient boosting algorithm that constructs an ensemble of symmetric decision trees, offering high performance on both structured and unstructured datasets. In this study, CBR was applied to predict key mechanical properties—tensile strength, Young’s modulus, and impact strength—using critical 3D printing parameters such as reinforcement wt.%, nozzle temperature, printing speed, sample orientation angle, and layer thickness. The model optimizes a regularized loss function that balances prediction accuracy with model simplicity, as represented in Equation (15). Final predictions are generated by aggregating the contributions of all boosted trees, as defined in Equation (16). This framework enables CBR to efficiently capture complex nonlinear relationships while minimizing overfitting and improving generalization [46].
L n = j = 1 k ( l ( V j , V ¯ j n ) + γ a = 1 n f a 2
V ¯ C = t = 1 n f t ( C ) ¨
Here, L(n) is the total loss after n iterations. V j denotes the actual value of the mechanical property, V ¯ j n   i s the predicted value at iteration n, l is a differentiable loss function (e.g., RMSE), f a denotes the ath decision tree in the model, and γ is the regularization parameter to penalize model complexity. f a denotes the complexity measure of a tree f a ; C represents the input vector [reinforcement, temperature, speed, orientation, layer thickness]; and V ¯ C is the final predicted mechanical property for input C.

2.6.5. Gaussian Process Regression (GPR)

Gaussian process regression (GPR) is a robust non-parametric Bayesian approach well-suited for capturing complex and nonlinear relationships. In this study, GPR was applied with a Radial Basis Function (RBF) kernel to predict mechanical properties—tensile strength, Young’s modulus, and impact strength—based on variations in key 3D printing parameters, including reinforcement wt.%, nozzle temperature, printing speed, sample orientation angle, and layer thickness. The model assumes that the underlying function follows a Gaussian process prior, as described in Equation (17). For new inputs, predictions are obtained by conditioning this prior on the observed data, producing a posterior mean, as expressed in Equation (18). The RBF kernel facilitates smooth interpolation across the input space, while normalization ensures that both input and output features remain on a consistent scale [47,48].
f C ~ G P ( 0 , K C , C
V ¯ C = K ( C , C ) [ K ˙ ( C , C ) + α n 2 I ] 1 V
Here, f(C)—latent function representing the true mapping between inputs and outputs; K(C, C′)—covariance matrix defined by the RBF kernel; C—matrix of input variables (scaled 3D printing parameters); C—new input sample. V ¯ C —predicted output (mechanical property) for C; V: observed output vector (scaled mechanical properties); α n 2 —noise variance; I—identity matrix.

2.6.6. Model Interpretability

SHAP Analysis
Shapley Additive Explanations (SHAP) analysis was employed to gain deeper insights into how input parameters influence the predicted mechanical properties. SHAP is an interpretable, game-theory-based framework that assigns an importance value to each feature based on its contribution to individual predictions. The analysis provides both global and local explanations. The global explanation identifies the most influential processing parameters across the entire dataset, revealing which features have the greatest impact on the model’s predictions. The local explanation highlights the contribution of each parameter to specific predictions, offering insight into how individual features affect the outcome for particular data points. This comprehensive approach helps clarify how processing parameters such as reinforcement content, nozzle temperature, printing speed, and sample orientation angle influence key mechanical properties, including tensile strength, Young’s modulus, and impact strength [49].

3. Results and Discussion

3.1. Statistical Analysis of Experimental Design (DOE)

The primary objective of the statistical analysis was to evaluate the influence of various processing parameters on the mechanical properties of PLA/BNNP composites. A Taguchi L27 orthogonal array was employed to provide a systematic and efficient approach to experimental design. As presented in Table 2, the L27 array allowed the assessment of multiple factors at three distinct levels across 27 experimental runs.

3.2. Experimental Results

3.2.1. Tensile Properties

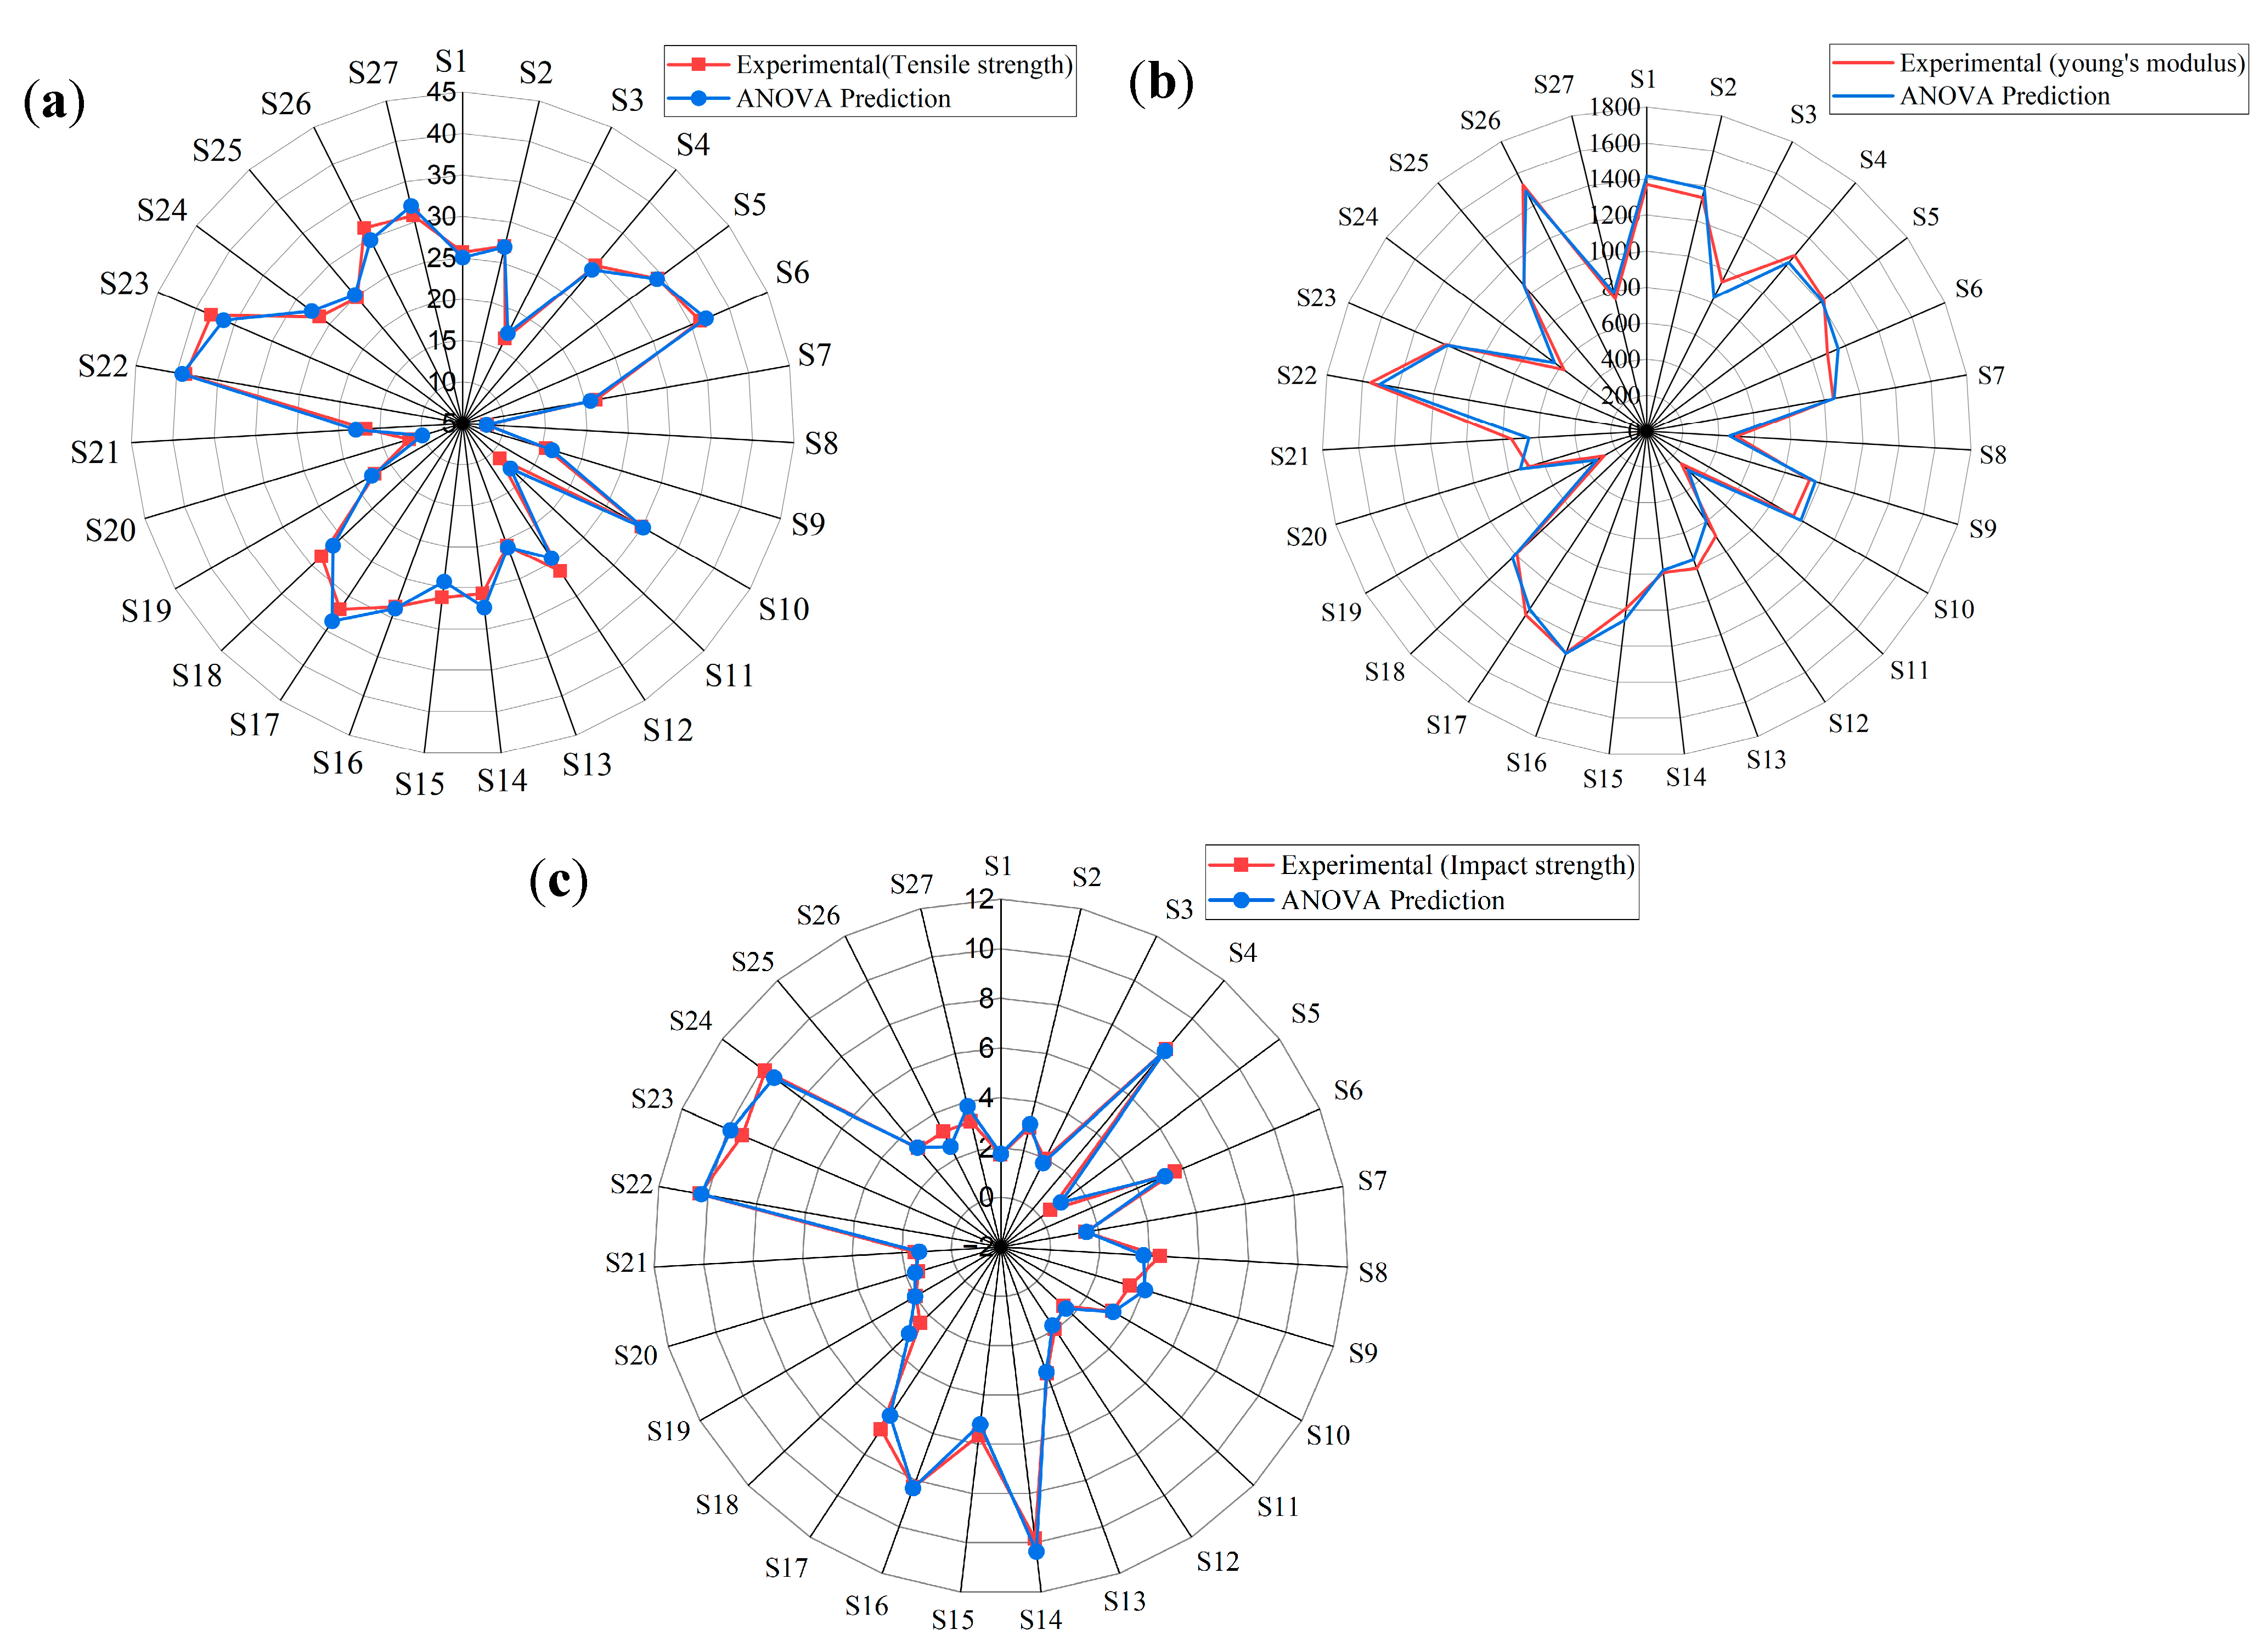
The mechanical performance of 3D-printed PLA/BNNP composites fabricated using a Taguchi L27 orthogonal array is presented in Figure 4a–c. Figure 4a highlights distinct differences in stress response among the 27 samples. Samples S22 and S6 exhibited the highest stress tolerance, indicating superior load-bearing capacity, whereas S8 and S11 showed the lowest stress resistance, failing at relatively low stress levels and displaying brittle behavior. As illustrated in Figure 4b, tensile strength varied considerably, ranging from 7.98 MPa to 38.9 MPa. The highest tensile strengths were observed for S22 and S23, at 38.9 MPa and 38 MPa, respectively, while S8 and S11 recorded the lowest values of 7.98 MPa and 16.4 MPa. Figure 4c shows the variation in Young’s modulus, with S22 and S25 achieving the highest stiffness values of 1554.93 MPa and 1529.91 MPa, and S11 and S19 displaying the lowest values of 263.95 MPa and 272.59 MPa. These observed variations in mechanical behavior demonstrate the effectiveness of the L27 orthogonal array in capturing the combined effects of processing parameters on tensile strength, stiffness, and failure modes in 3D-printed PLA/BNNP composites.

3.2.2. Impact Strength

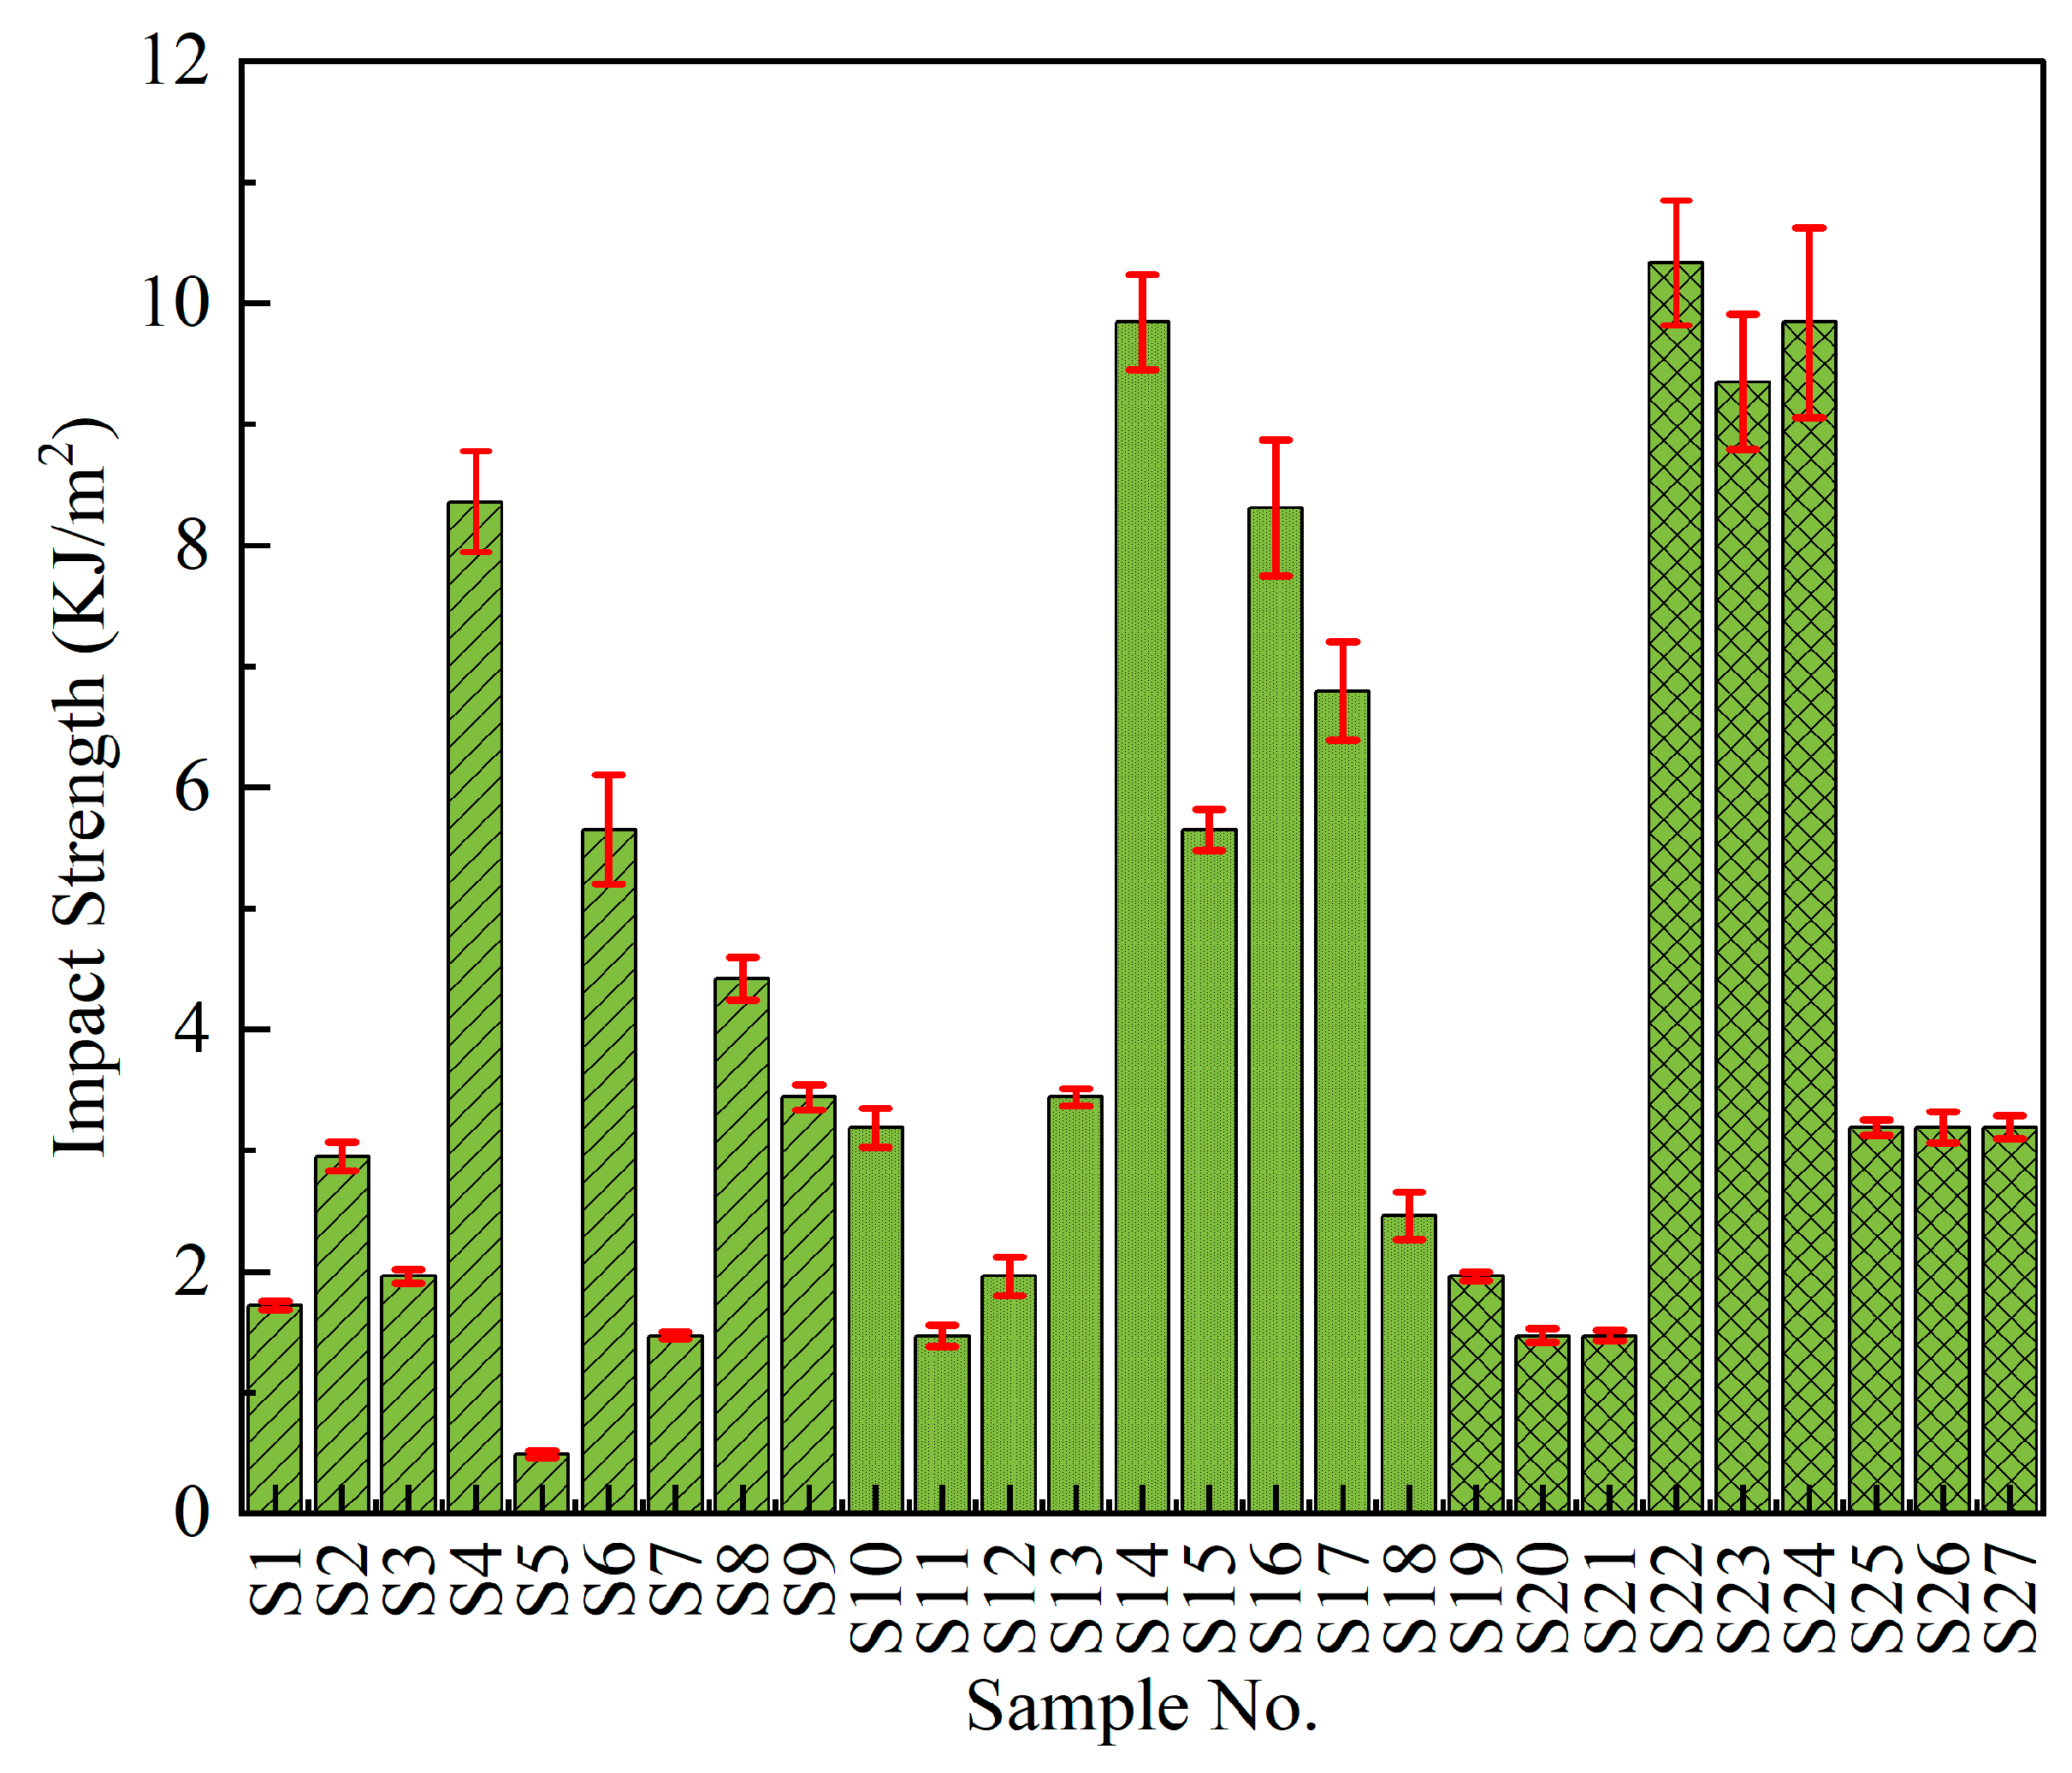
Figure 5 presents the impact strength of the 3D-printed PLA/BNNP composites across all 27 samples, revealing significant variations in fracture resistance. The highest impact strength was observed for sample S22 at 10.33 kJ/m2, followed closely by S14 and S23, both recording 9.84 kJ/m2, indicating excellent energy absorption under sudden loading. In contrast, the lowest impact strengths were measured for S5 at 0.49 kJ/m2 and S7 and S20 at 1.47 kJ/m2, reflecting poor toughness and brittle failure behavior. Overall, the impact strength values ranged from 0.49 kJ/m2 to 10.33 kJ/m2, showing a substantial deviation of nearly 9.84 kJ/m2 across the dataset. These variations highlight the diverse fracture behavior of the composites and demonstrate the effectiveness of the L27 orthogonal array in capturing the combined effects of multiple processing factors on the toughness of 3D-printed PLA-based materials.

3.3. Statistical Analysis

3.3.1. Signal-to-Noise (S/N) Ratio Analysis

Table 3 summarizes the signal-to-noise (S/N) ratios for tensile strength, Young’s modulus, and impact strength obtained from 27 experimental trials, providing important insights into the consistency of mechanical performance in PLA/BNNP composites. The S/N ratios were calculated using the larger-the-better criterion, reflecting the ability of each sample to maintain superior performance under varying processing conditions. Among all samples, S22 exhibited the highest S/N ratios—31.79 for tensile strength, 63.83 for Young’s modulus, and 20.28 for impact strength—demonstrating excellent overall mechanical robustness. Conversely, the lowest S/N ratios were observed in S8 for tensile strength (18.04), S11 for Young’s modulus (48.43), and S5 for impact strength (6.19), indicating comparatively poor structural performance. These results highlight the effectiveness of the Taguchi design in systematically evaluating and optimizing processing parameters to enhance the mechanical behavior of 3D-printed PLA/BNNP composites.

3.3.2. Taguchi Analysis

Taguchi Analysis for Tensile Strength
The tensile strength of PLA/BNNP composites shows significant variation depending on the 3D printing parameters used during fabrication. Supplementary Table S1 presents the signal-to-noise (S/N) ratio analysis for tensile strength, with delta values ranging from 1.02 to 4.38. Among the factors considered, printing speed and nozzle temperature were found to be the most influential, followed by layer thickness, sample orientation angle, and reinforcement content. Supplementary Table S2 summarizes the mean response analysis, where delta values range from 1.98 to 10.94, revealing a similar trend: printing speed and nozzle temperature have the greatest influence, while reinforcement content, sample orientation, and layer thickness exert a moderate influence. Both analyses consistently identify printing speed and nozzle temperature as the most critical 3D printing parameters affecting the tensile strength of PLA/BNNP composites.
Supplementary Figure S1a,b present the main effect plots for the signal-to-noise (S/N) ratio and mean response, respectively, in relation to tensile strength. All five processing parameters have a noticeable impact on the output, with printing speed being the most influential factor. Both plots reveal a strong negative trend as printing speed increases from 10 mm/s to 60 mm/s, resulting in a significant decline in the signal-to-noise ratio (S/N ratio) and mean tensile strength and indicating reduced mechanical performance at higher speeds. Nozzle temperature emerges as the next critical factor, exhibiting a fluctuating pattern with tensile strength peaking at 200 °C, suggesting this as the optimal processing temperature. Reinforcement content exhibits a consistent increasing trend, with the highest tensile strength achieved at 0.04 wt%. BNNP. The effects of sample orientation angle and layer thickness are comparatively less pronounced but still contribute to the overall behavior. Tensile strength slightly decreases as the orientation approaches 90°, while layer thickness exhibits a minimum response at 0.25 mm, with better performance observed at 0.15 mm and moderate values at 0.35 mm.
Taguchi Analysis for Young’s Modulus
The Young’s modulus of PLA/BNNP composites exhibits considerable sensitivity to variations in 3D printing parameters. Among all factors, printing speed and nozzle temperature have the most significant influence. The signal-to-noise (S/N) ratio analysis in Supplementary Table S3 shows that printing speed recorded the highest delta value of 4.05, followed by nozzle temperature at 3.24, sample orientation angle at 2.57, reinforcement content at 2.03, and layer thickness at 1.30. A similar trend is observed in the mean response analysis presented in Supplementary Table S4, where the delta values are 411.9 for printing speed, 254.4 for nozzle temperature, 213.3 for layer thickness, 203.8 for sample orientation angle, and 189.1 for reinforcement content. Although there are slight differences in ranking, both analyses consistently highlight the dominance of printing speed and nozzle temperature. Optimizing these two parameters is therefore crucial for maximizing the Young’s modulus of 3D-printed PLA/BNNP composites.
The main effect plots for Young’s modulus, shown in Supplementary Figure S2a,b, illustrate the signal-to-noise ratio and mean response, respectively. Among all processing parameters, printing speed has the most pronounced effect, with a sharp and consistent decline in modulus as the speed increases from 10 mm/s to 60 mm/s, indicating reduced Young’s modulus at higher speeds. The nozzle temperature exhibits a nonlinear trend, where the modulus increases from 190 °C to 200 °C and then decreases at 210 °C, indicating 200 °C as the optimal setting. The other parameters—reinforcement content, sample orientation angle, and layer thickness—have comparatively lower influence, but each still affects the modulus. Specifically, Young’s modulus decreases as reinforcement content increases from 0 wt.% to 0.04 wt.%, as the orientation angle shifts from 45° to 90°, and as the layer thickness changes from 0.15 mm to 0.35 mm.
Taguchi Analysis for Impact Strength
The impact strength of PLA/BNNP composites is strongly influenced by variations in 3D printing parameters. Supplementary Tables S5 and S6 present the signal-to-noise (S/N) ratio and mean response analyses, respectively, both of which highlight nozzle temperature as the most significant factor, with delta values of 3.725 (S/N ratio) and 4.978 (mean response). Printing speed has the highest influence, with delta values of 2.570 and 2.558, while reinforcement content, sample orientation angle, and layer thickness show lower influence, with delta values of 1.456 and 1.503, 1.321 and 1.149, and 1.102 and 0.706, respectively. This ranking suggests that thermal and motion-related parameters primarily influence the energy absorption behavior of the composites. Although the other parameters exert a lesser effect individually, their combined contribution remains important in achieving balanced toughness. Therefore, optimizing nozzle temperature and printing speed is crucial for enhancing the impact resistance of PLA/BNNP composites.
The main effect plots for impact strength, presented in Supplementary Figure S3a,b, show the signal-to-noise ratio and mean response, respectively. Among all 3D printing parameters, nozzle temperature has the most significant effect, with impact strength increasing from 190 °C to 200 °C and then declining at 210 °C, indicating 200 °C as the optimal temperature. Printing speed is the next most influential factor, showing a decrease in impact strength from 10 mm/s to 30 mm/s, followed by a slight increase at 60 mm/s. Reinforcement content also contributes notably, with the S/N ratio rising from 0.00 to 0.02 wt.% and slightly reducing at 0.04 wt.%, while the mean response steadily increases across the range from 0.00 to 0.04 wt.%. Sample orientation angle and layer thickness show mixed effects, with both the S/N ratio and mean response exhibiting combinations of rising and falling trends, indicating moderate but non-negligible influence on impact strength.

3.3.3. Analysis of Variance (ANOVA)

ANOVA for Tensile Strength
An analysis of variance (ANOVA) was performed to determine the most influential factors affecting tensile strength by varying the 3D printing parameters. As summarized in Table 4, printing speed had the highest contribution at 38.21%, followed by nozzle temperature at 28.29%. The combined effects of sample orientation angle and layer thickness accounted for 11.54%, while the interaction between layer thickness and printing speed contributed 10.99%. The remaining factors had minimal influence, each contributing less than 10%. The model’s predictive performance was evaluated using R-squared (R2) and adjusted R-squared (Adj. R2) values. An R2 value of 97.98% indicates that the input parameters explain a large portion of the variation in tensile strength, while an adjusted R2 of 86.89% confirms the robustness of the model by accounting for the number of predictors used. These high values demonstrate a strong correlation between the experimental and predicted results, as obtained from Equation (19), indicating that the developed model is highly reliable for accurately predicting tensile strength.
Regression Equation
Tensile strength = 25.159 − 1.350 C10.00+0.286 C10.02 + 1.064 C1_0.04 − 4.914 C2190(19)
+ 5.553 C2200 − 0.639 C2210+ 3.886 C310+ 3.164 C330 − 7.050 C360 + 0.253 C40 + 0.941 C445 − 1.194 C490 + 1.1
75 C50.15 − 0.805 C50.25 − 0.370 C50.35 + 2.85 C2190 × C50.15 − 2.81 C2190 × C50.25 − 0.04 C2190 × C50.35 − 2.05 C2200 × C50.15
+ 2.76 C2200 × C50.25 − 0.71 C2200 × C50.35 − 0.79 C2210 × C50.15 + 0.05 C2210 × C50.25 + 0.75 C2210 × C50.35 + 0.85 C310 × C50.15
+ 4.06 C310 × C50.25 − 4.91 C310 × C50.35 − 1.30 C330 × C50.15 − 1.88 C330 × C50.25 + 3.18 C330 × C50.35 + 0.45
C360 × C50.15 − 2.18 C360 × C50.25 + 1.73 C360 × C50.35 − 2.85 C40 × C50.15 + 3.43 C40 × C50.25 − 0.57 C40 × C50.35
2.04 C445 × C50.15 + 0.67 C445 × C50.25 + 1.37 C445×C50.35 + 4.89 C490 × C50.15 − 4.10 C490 × C50.25 − 0.79 C490 × C50.35
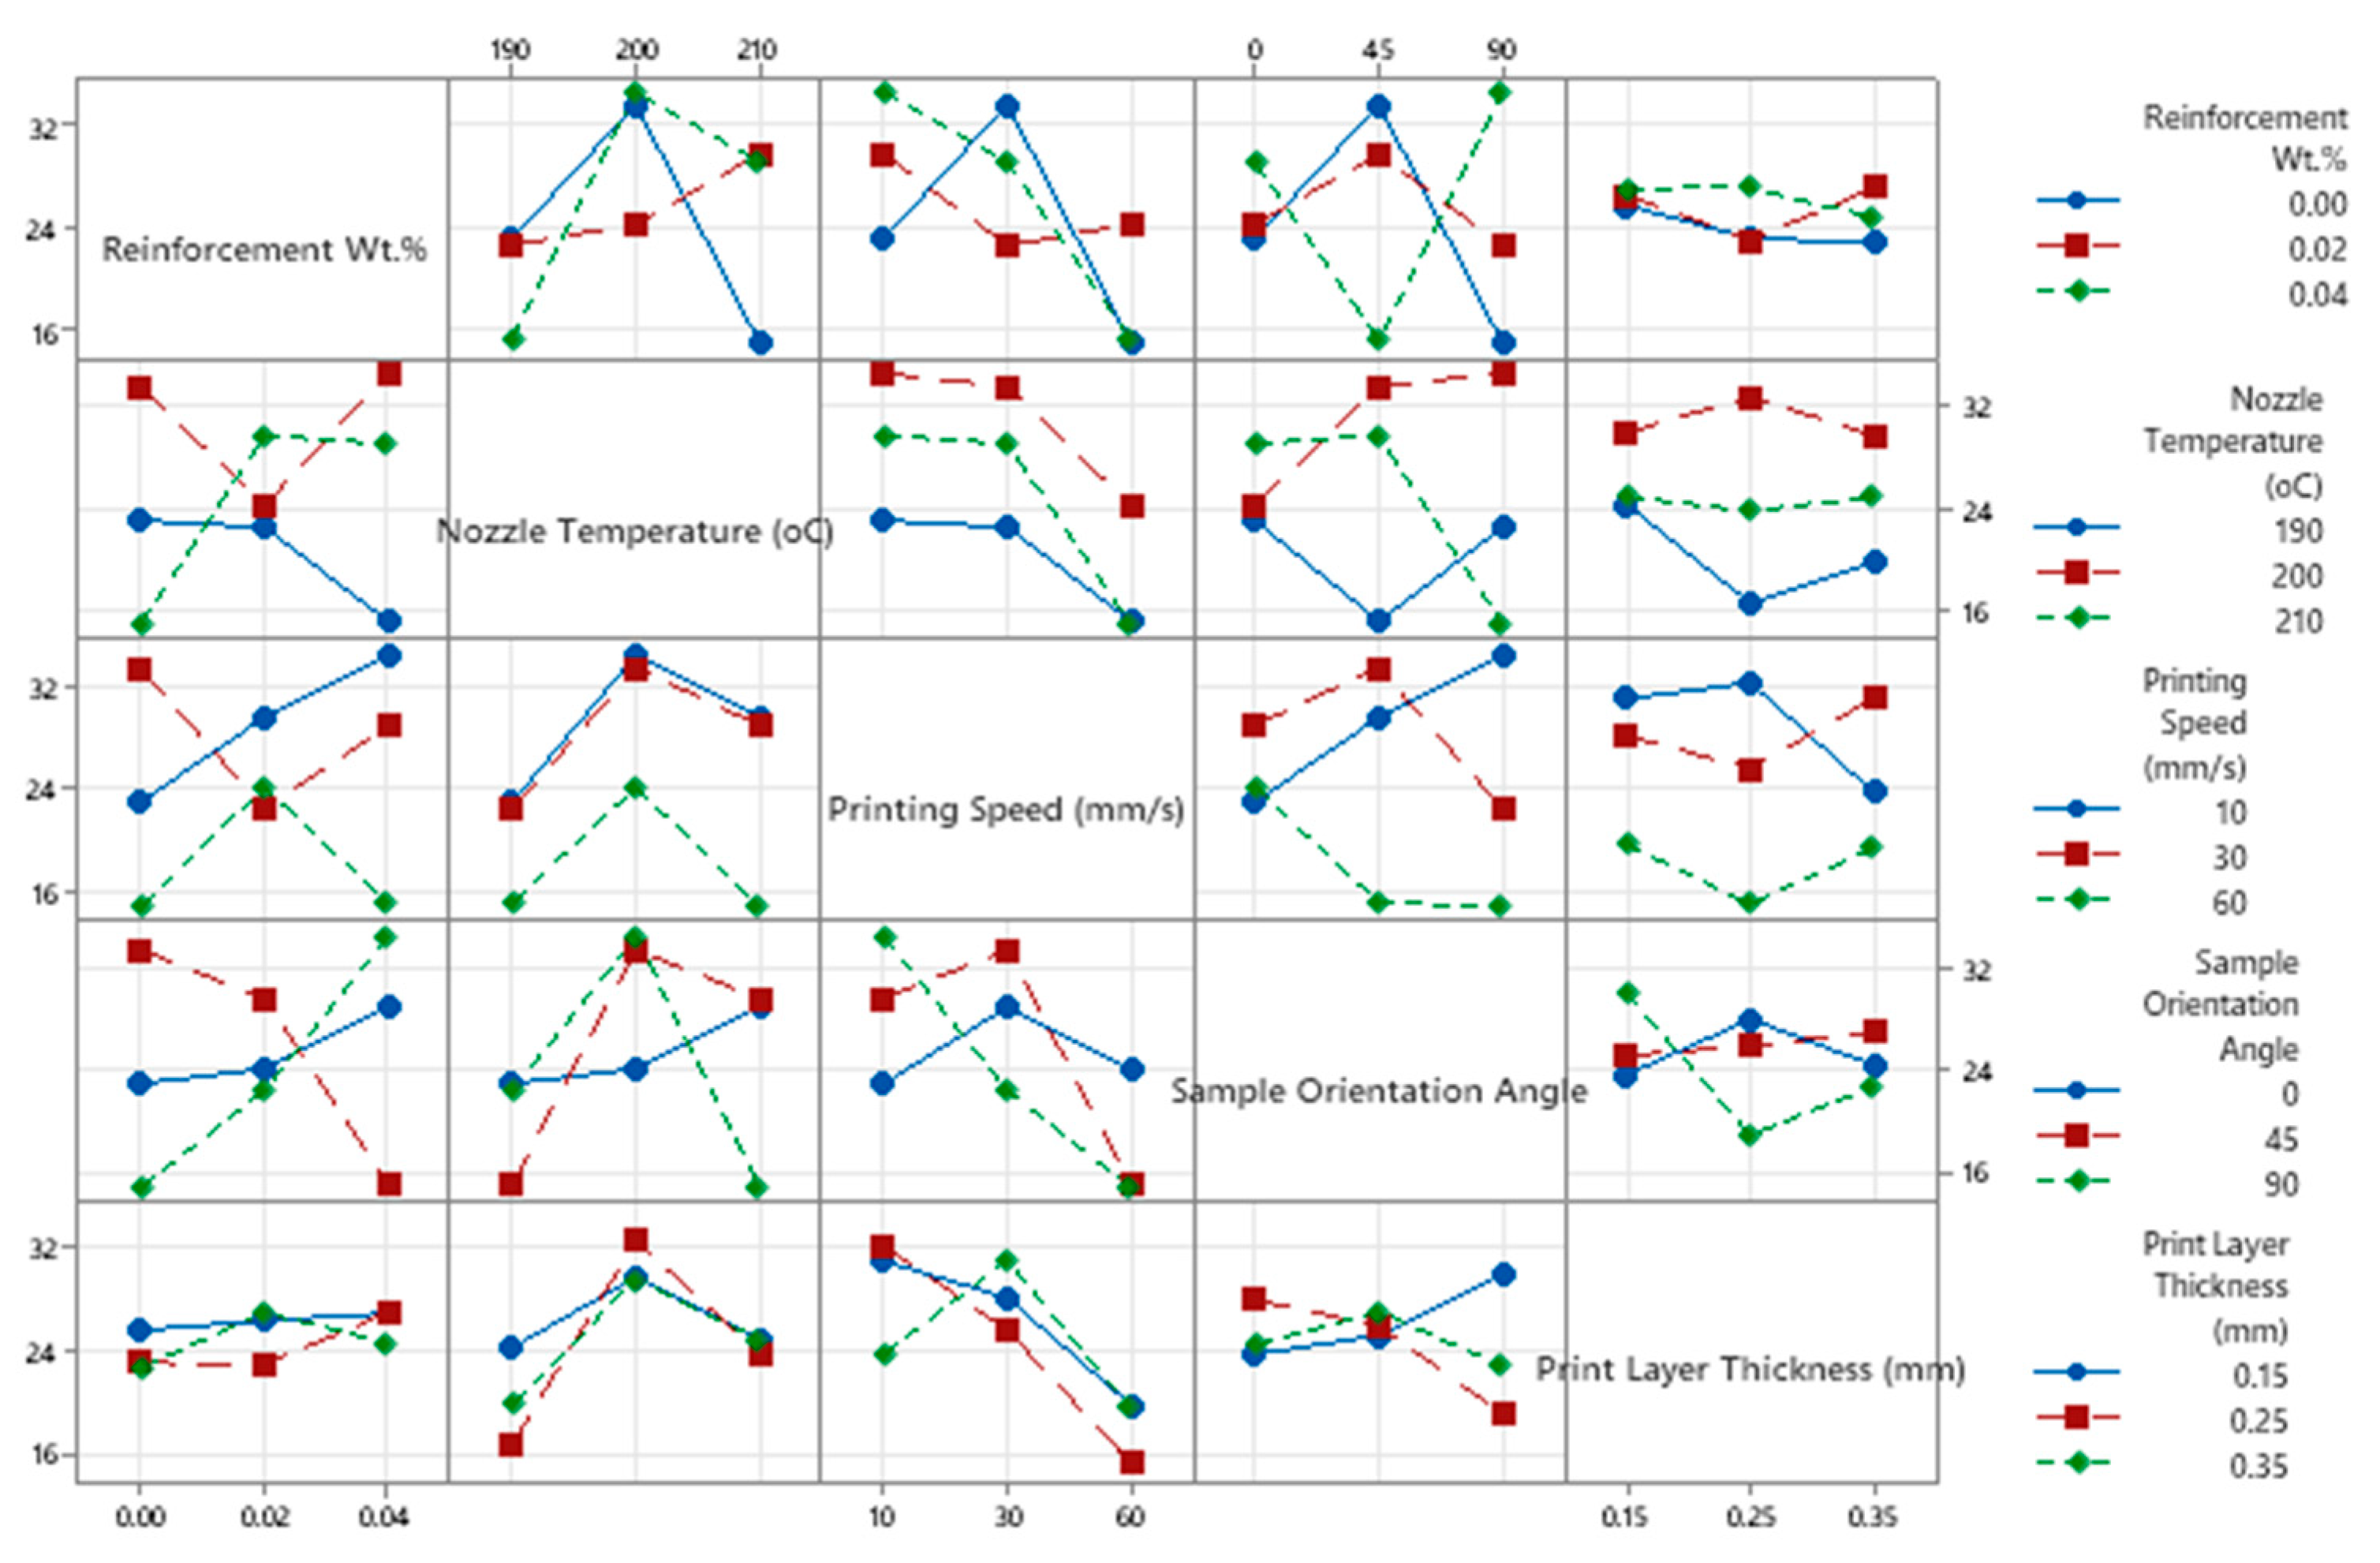
Figure 6 illustrates the interaction plots showing how different process parameters influence the tensile strength of PLA-BNNP composites. With an increase in reinforcement content, tensile strength rises from 20.2 MPa to a peak of 33.5 MPa for pure to 0.04 wt.%, confirming that the addition of boron nitride nanoparticles significantly enhances strength. The nozzle temperature demonstrates a non-linear trend, where tensile strength improves from 21.0 MPa at 190 °C to a maximum of 32.8 MPa at 200 °C before declining to 26.0 MPa at 210 °C, likely due to thermal degradation.
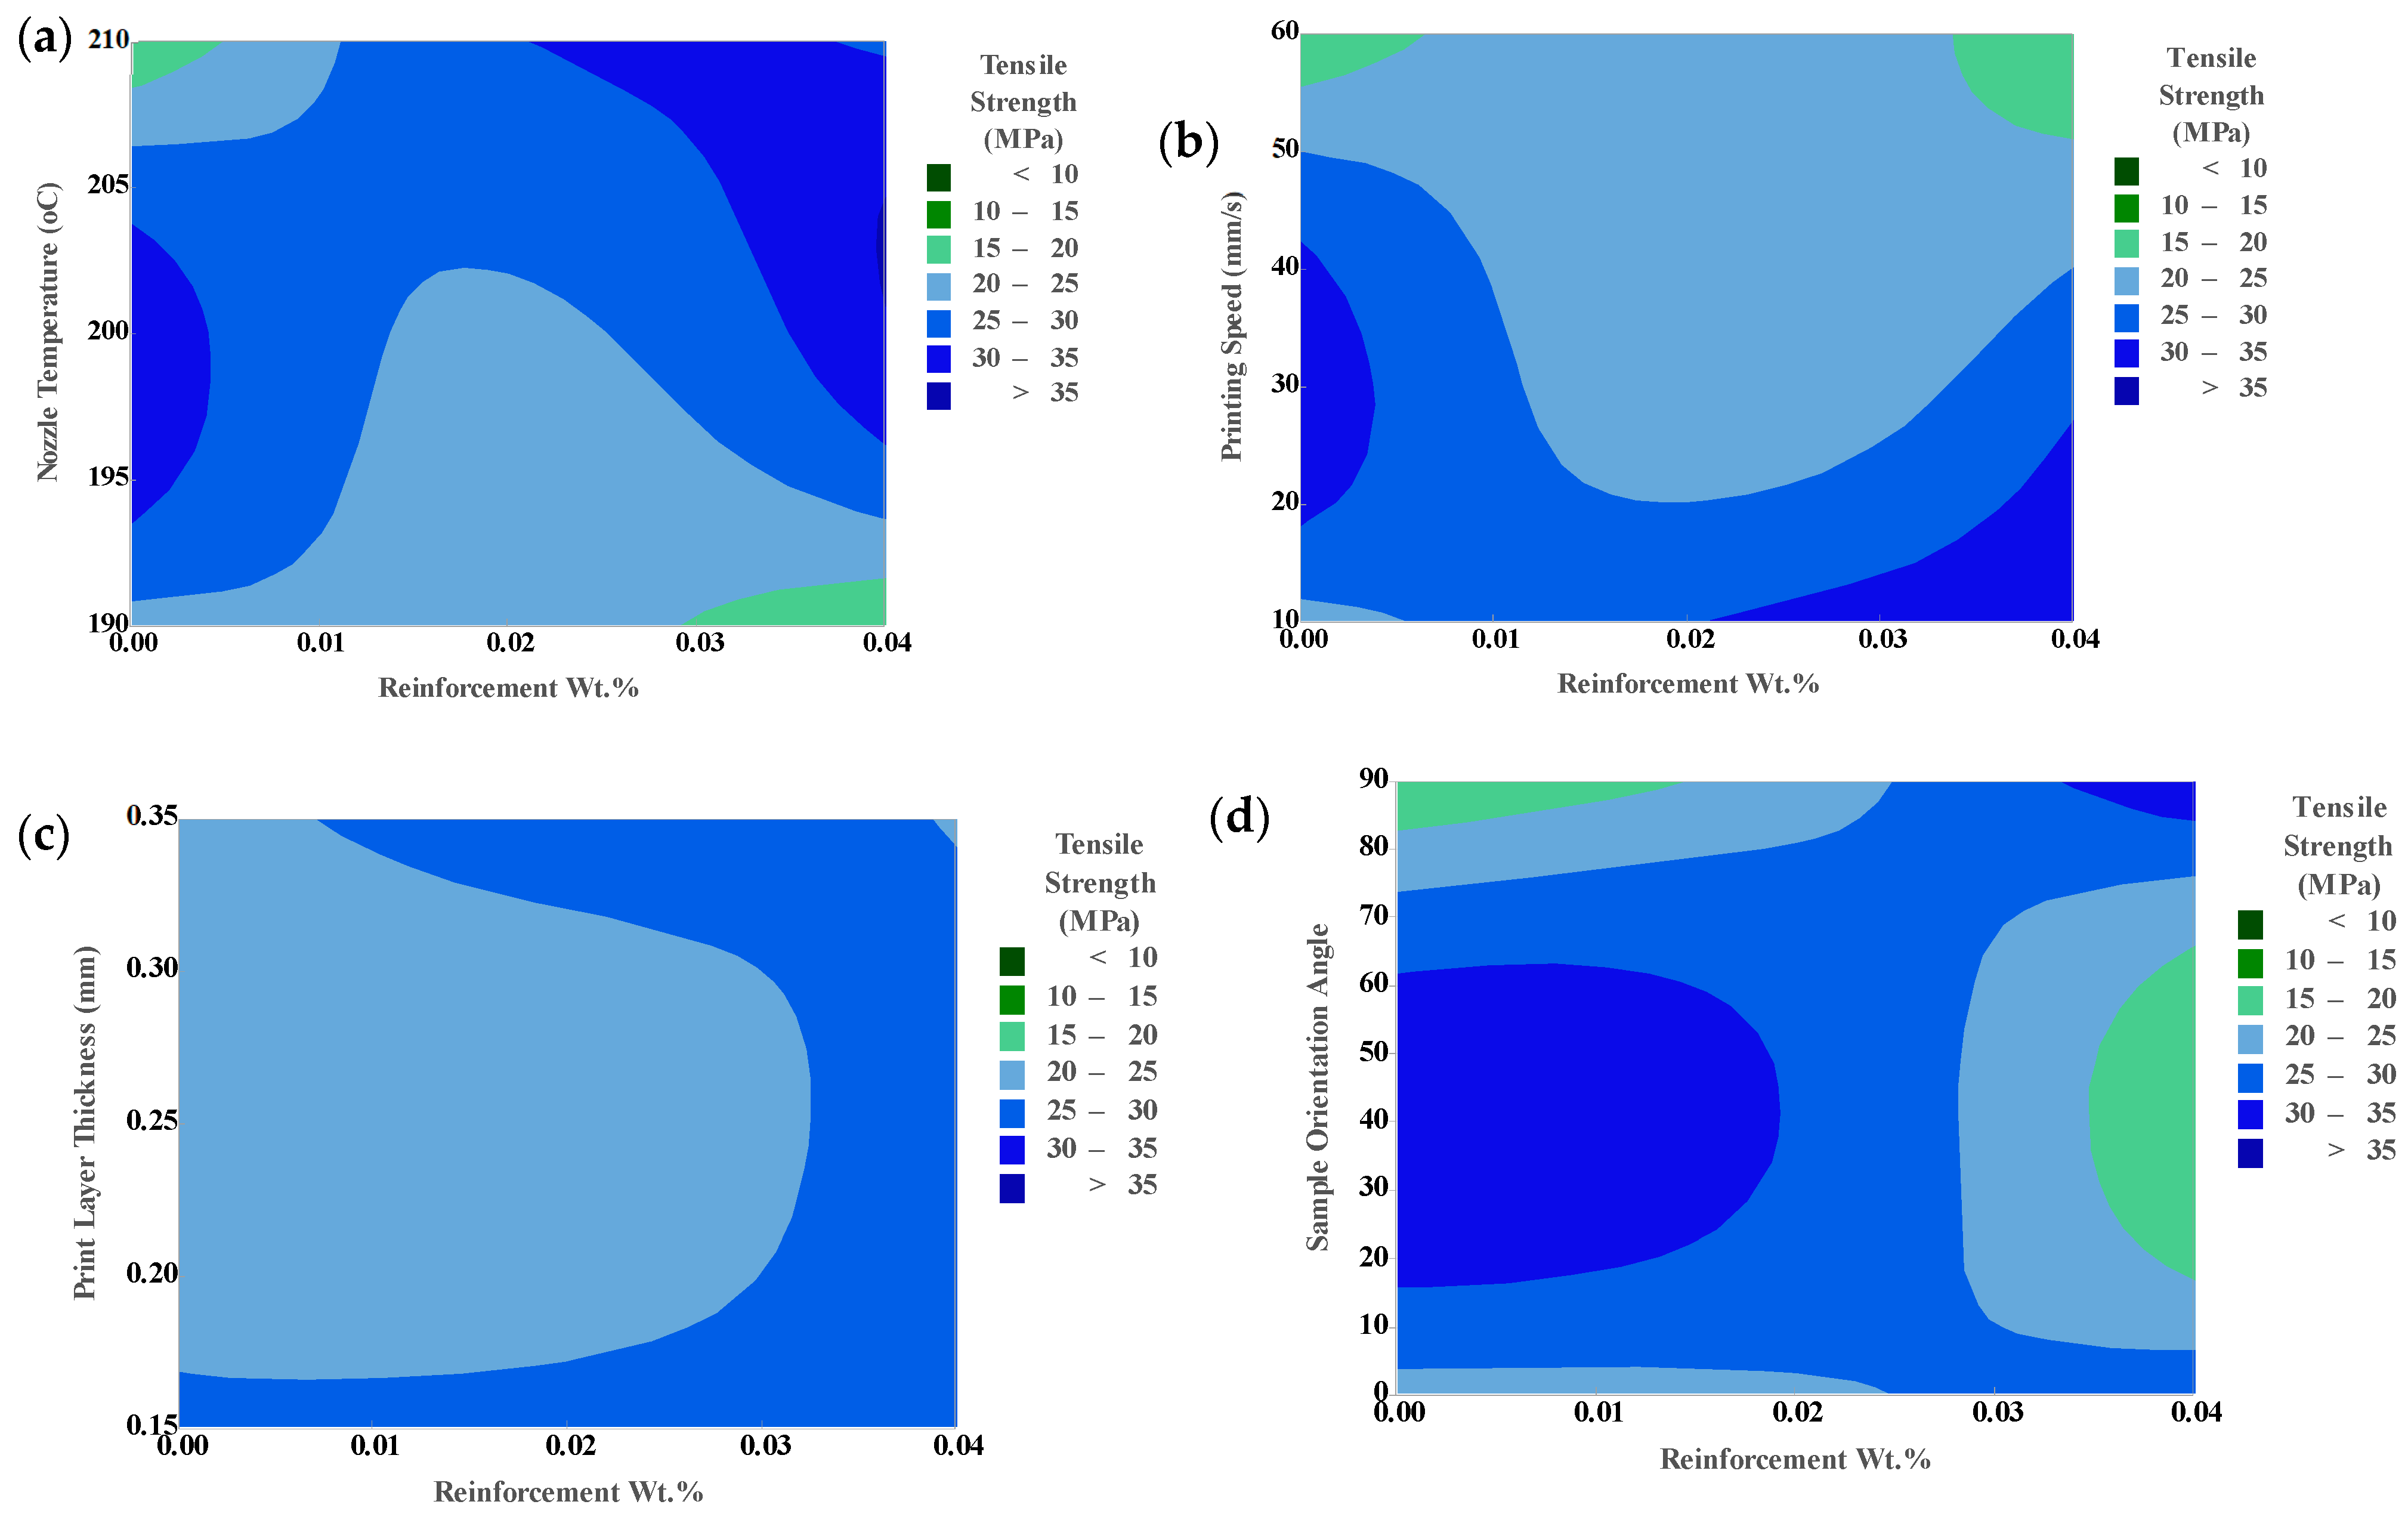
Printing speed strongly affects the outcome, with the best result at 30 mm/s (31.8 MPa), while speeds of 10 mm/s and 60 mm/s yield lower strengths of 24.2 MPa and 22.6 MPa, respectively. The sample orientation angle also plays a significant role, achieving 33.2 MPa at 45°, while 0° and 90° orientations result in 28.4 MPa and 23.1 MPa, respectively. Among layer thicknesses, 0.25 mm performs best at 31.4 MPa, compared to 28.0 MPa at 0.15 mm and 26.3 MPa at 0.35 mm. These findings highlight the importance of parameter optimization for maximizing the tensile strength of PLA-BNNP composites. The contour plots in Figure 7 illustrate the combined effects of reinforcement weight percentage and key 3D printing parameters on the tensile strength of PLA/BNNP composites. In Figure 7a, the highest tensile strength values (above 35 MPa) are observed in the dark blue region, where the reinforcement content is 0.04 wt.%, and the nozzle temperature is approximately 200 °C, indicating an optimal combination. As the reinforcement level or temperature decreases, the tensile strength falls into the sky blue and light blue regions, ranging from 25 to 35 MPa. Figure 7b illustrates the effect of printing speed, with a maximum tensile strength achieved at a 0.04 wt.% reinforcement and speeds ranging from 30 to 40 mm/s. At slower or faster speeds, the tensile strength decreases, as seen in the light blue and aqua regions (20–30 MPa). Figure 7c indicates that printing layer thickness has a smaller but noticeable effect, with peak tensile strength (30–35 MPa) observed at 0.25 mm thickness. Figure 7d illustrates the effect of sample orientation, demonstrating an increase in tensile strength at higher angles. The highest values, above 35 MPa, are observed at a 90° orientation and 0.04 wt.% reinforcement, while lower angles (0° and 45°) correspond to lower tensile strength (below 25 MPa), represented by the green-to-aqua regions.
ANOVA for Young’s Modulus
An analysis of variance (ANOVA) was performed to determine the most influential 3D printing parameters affecting the Young’s modulus of PLA/BNNP composites. As summarized in Table 5, printing speed contributed the most, at 25.12%, followed by nozzle temperature at 11.82%. The combined effect of print layer thickness and printing speed accounted for 17.11%, while the interaction between sample orientation angle and layer thickness contributed 14.72%. Similarly, the combined influence of reinforcement content and print layer thickness was 10.17%. All remaining parameters had a minimal impact, each contributing less than 10%. The predictive capability of the model was evaluated using the R-squared (R2) and adjusted R-squared (Adj. R2) values. An R2 of 97.67% indicates that the selected input parameters explain a substantial portion of the variation in Young’s modulus, while an adjusted R2 of 84.84% confirms the model’s robustness by accounting for the number of predictors. These high values demonstrate a strong correlation between the experimental and predicted results, as described by Equation (20), validating the reliability of the developed model for accurately forecasting Young’s modulus.
Young’s modulus (MPa) =(20)
967.0 + 111.8C10 − 77.3C10.02 − 34.6C10.04 − 163.0C2190 + 91.5C2200 + 71.5C2210 + 198.9C310
+ 14.2C330 − 213.0C360 + 95.8C40 + 12.2C445 − 108.0C490 + 103.7C50.15 + 5.8 C50.25 − 109.6C50.35 + 49.2
C10* × C50.15 − 66.8C10 × C50.25 + 17.6C10 × C50.35 + 25.8C10.02 × C50.15 − 137.6C10.02 × C50.25
+ 111.9 C10.02 × C50.35 − 74.9 C10.04 × C50.15 + 204.4 C10.04 × C50.25 − 129.5 C10.04 × C50.35 + 141.3 C310 × C50.15
+ 84.7 C310 × C50.25 − 226.0 C310 × C50.35 + 5.3 C330 × C50.15 + 18.8 C330 × C50.25 − 24.1 C330 × C50.35 − 146.6
  C360 × C50.15 − 103.5 C360 × C50.25 + 250.1 C360 × C50.35 − 87.5 C40 × C50.15 + 148.8 C40 × C50.25 − 61.3 C40
× C50.35 − 131.0 C445 × C50.15 + 57.0 C445 × C50.25 + 74.0 C445 × C50.35 + 218.5 C490 × C50.15 − 205.8 C490 × C50.25
− 12.7 C490 × C50.35
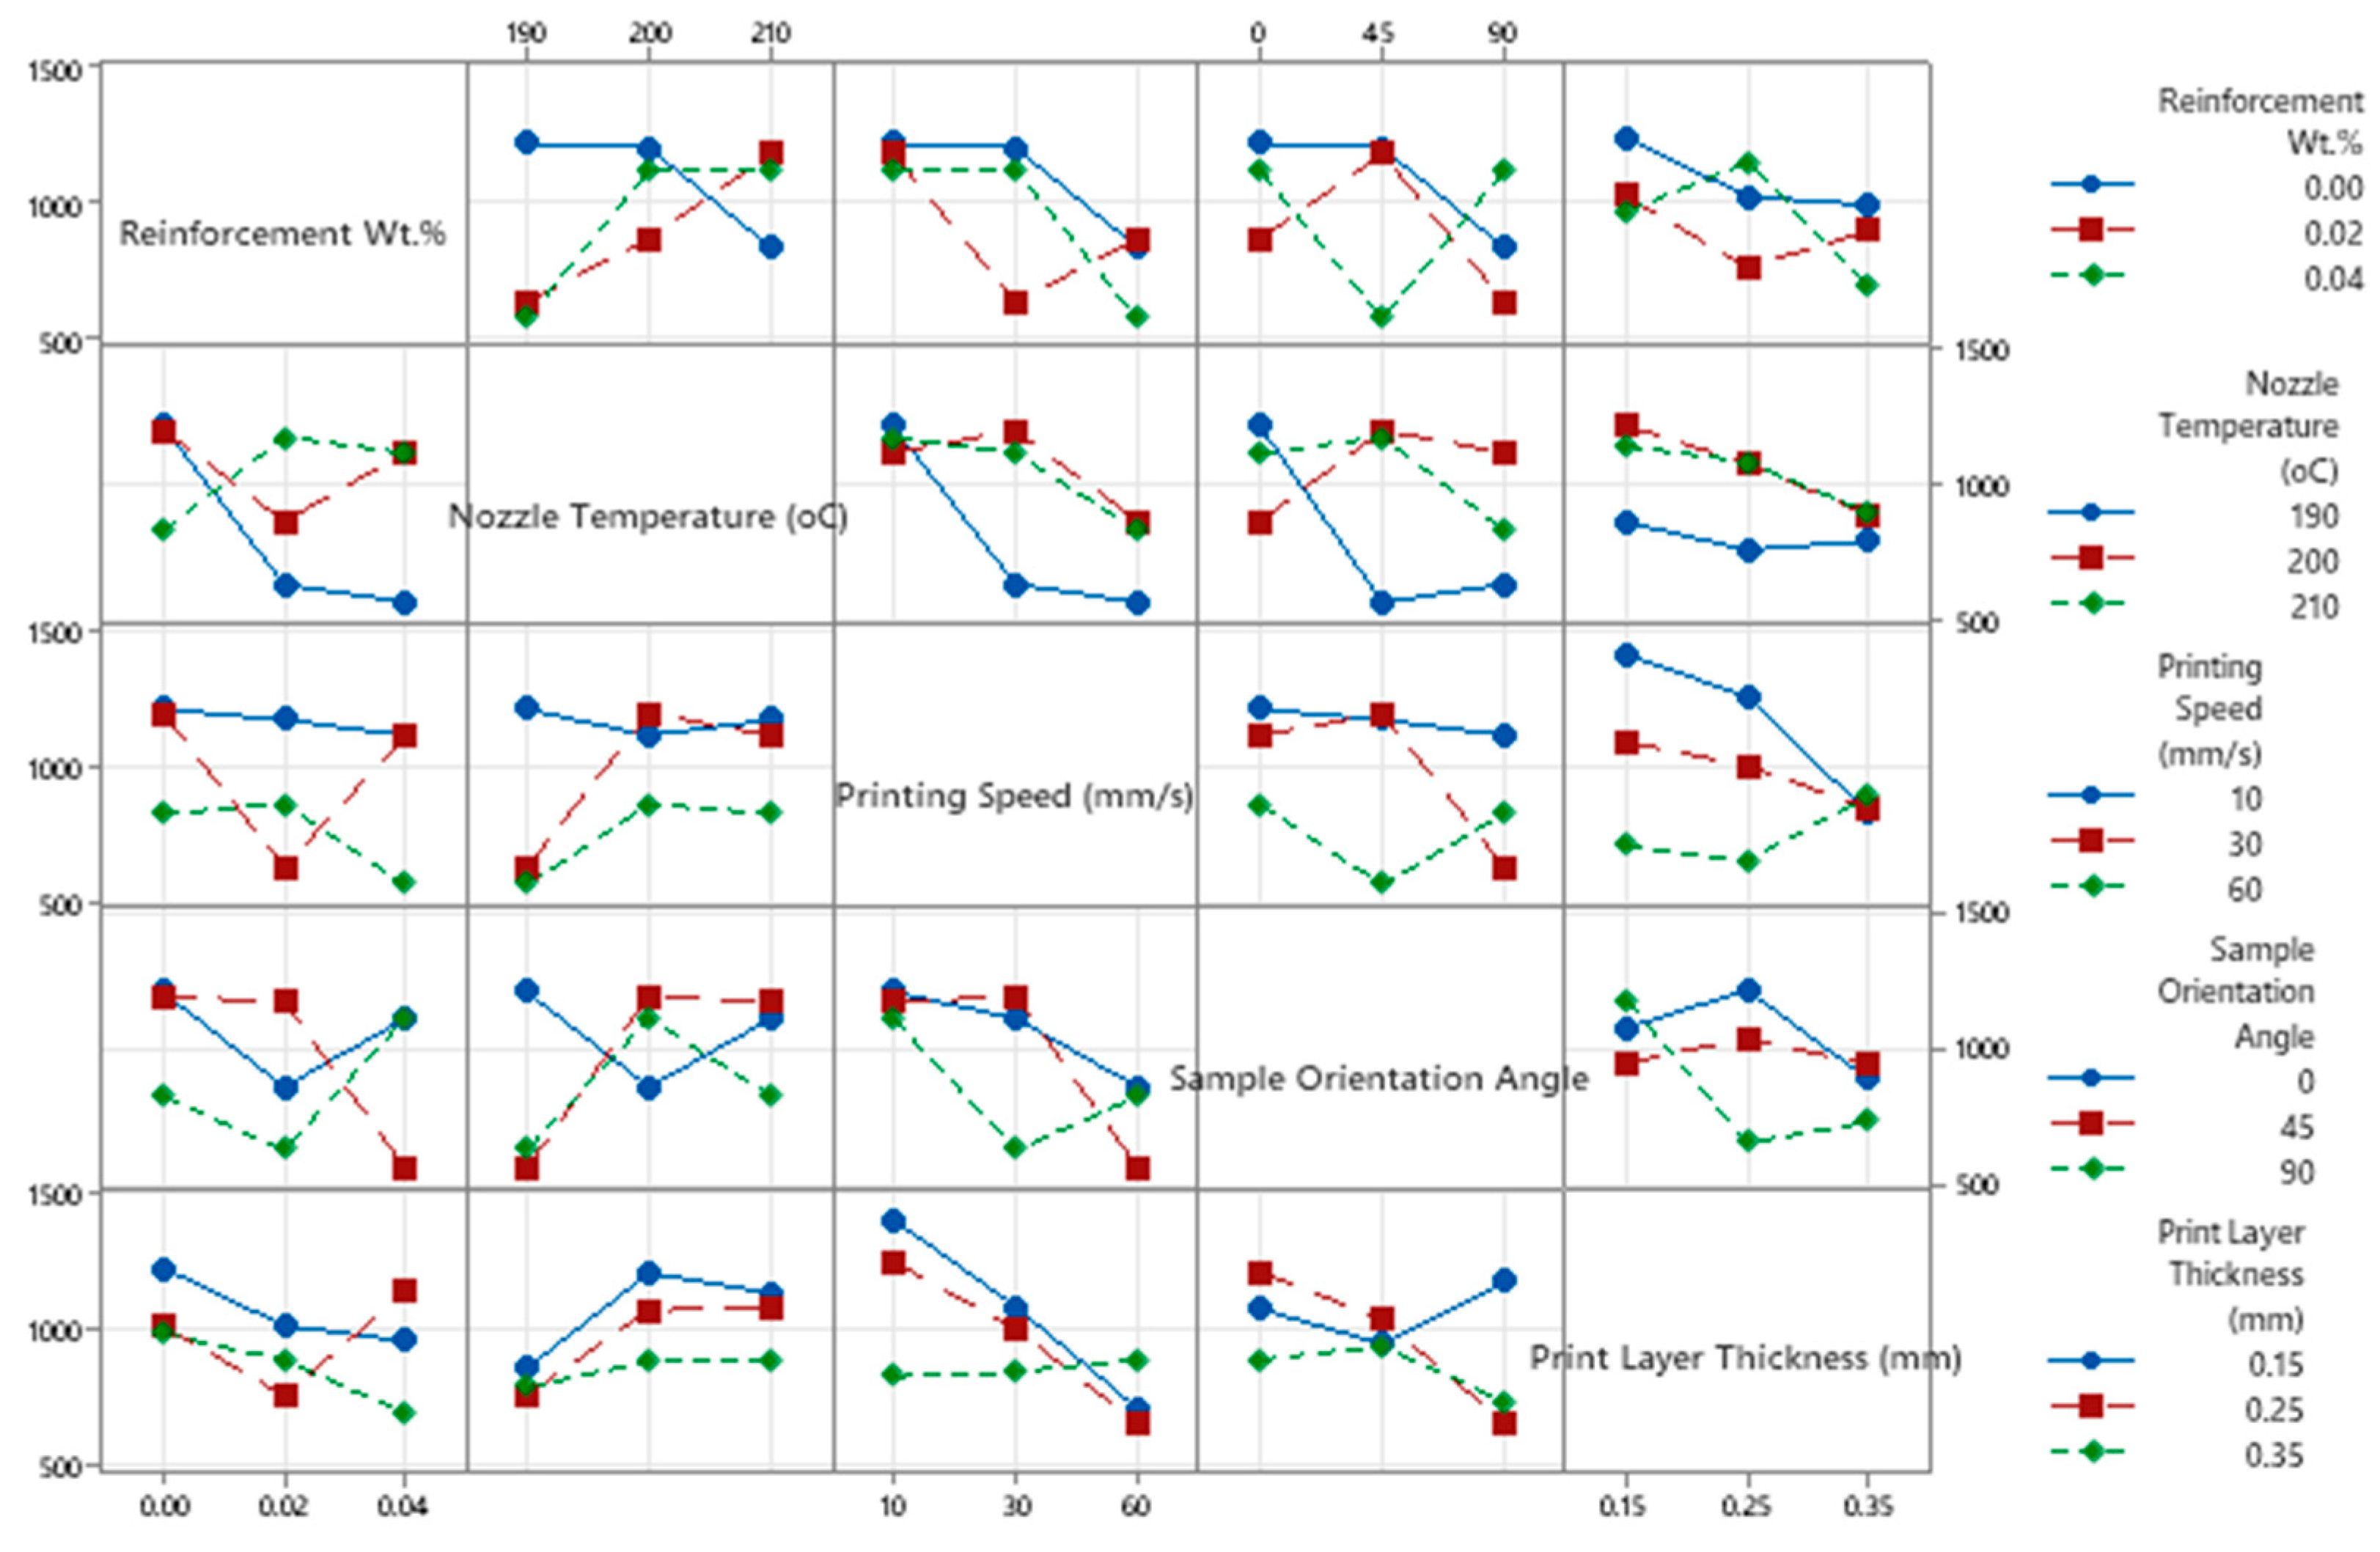
Figure 8 presents the interaction plots illustrating the influence of key 3D printing parameters on the Young’s modulus of PLA/BNNP composites. The modulus increases with reinforcement content, rising from 970 MPa for pure PLA to 1475 MPa at 0.04 wt.%, confirming that boron nitride nanoparticles significantly enhance stiffness. Nozzle temperature shows a non-linear effect, peaking at 1455 MPa at 200 °C and decreasing to 1180 MPa at 210 °C, likely due to thermal degradation of the polymer matrix. Printing speed also plays a crucial role, with the highest modulus of 1475 MPa obtained at 10 mm/s, decreasing to 1050 MPa at 60 mm/s. Sample orientation affects stiffness as well; samples printed at 0° exhibit a modulus of 1440 MPa, whereas those printed at 90° drop to 720 MPa. Among layer thicknesses, 0.25 mm produces the best result at 1380 MPa, surpassing 0.15 mm (1205 MPa) and 0.35 mm (1120 MPa).
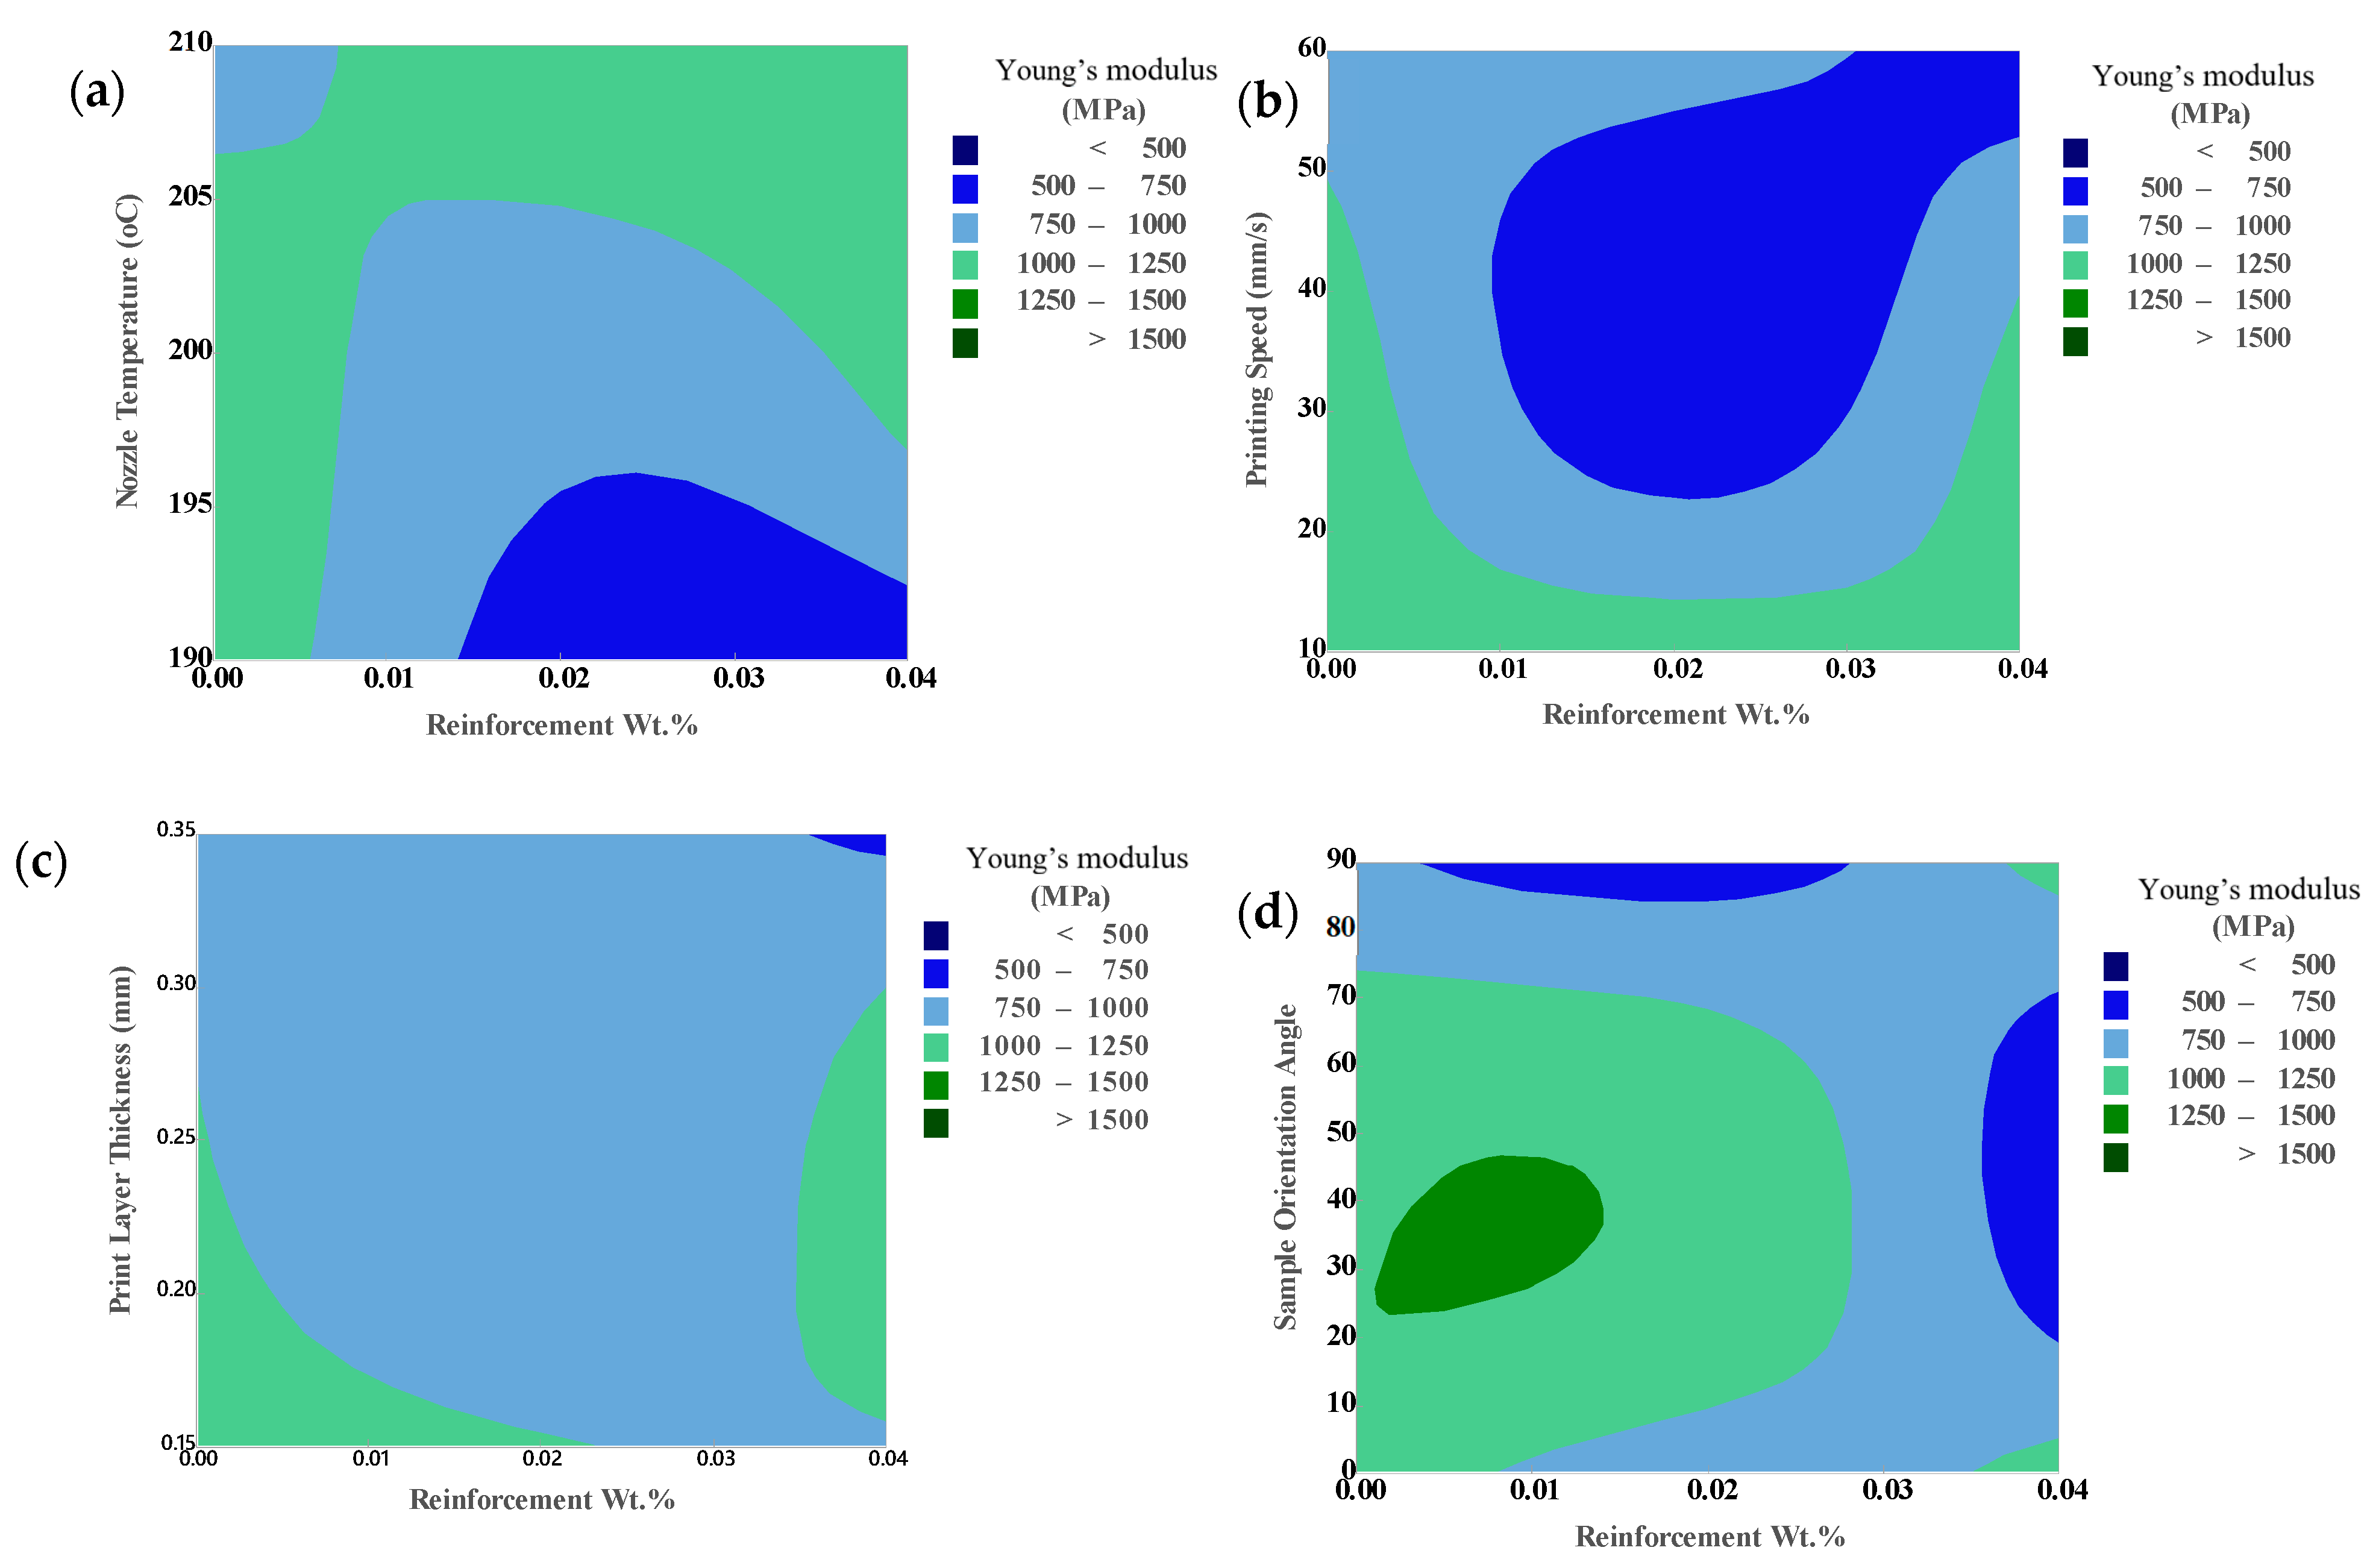
The contour plots in Figure 9 depict the combined effects of reinforcement weight percentage and key 3D printing parameters on the Young’s modulus of PLA/BNNP composites. In Figure 9a, the nozzle temperature has a significant influence on the modulus, with values exceeding 1250 MPa (represented in dark green) observed at a 0.04 wt.% reinforcement and temperatures of 200–205 °C. At lower temperatures and reinforcement levels, the modulus drops below 1000 MPa, indicating weaker interactions between the matrix and the filler. Figure 9b highlights the effect of printing speed, where higher reinforcement content and moderate-to-high printing speeds (40–60 mm/s) lead to an enhanced modulus (above 1500 MPa, shown in red). Slower speeds result in moderate values (750–1250 MPa). Figure 9c shows that layer thickness has a moderate effect, with a peak Young’s modulus (30–35 MPa) observed at 0.25 mm thickness combined with 0.04 wt.% reinforcement. In Figure 9d, the modulus is maximized above 1500 MPa at 0.01 wt.% reinforcement and orientation angles between 30° and 40°, with lower angles yielding lower modulus values. These contour plots highlight that achieving a maximum Young’s modulus requires an optimal combination of high nozzle temperature, increased reinforcement, high printing speed, reduced layer thickness, and favorable sample orientation angles.
ANOVA for Impact Strength
An analysis of variance (ANOVA) was performed to identify the most influential 3D printing parameters affecting the impact strength of PLA/BNNP composites. As summarized in Table 6, nozzle temperature contributed the most, at 45.67%, followed by printing speed, at 14.38%. The combined effect of print layer thickness and printing speed accounted for 13.47%, while the interaction between sample orientation angle and layer thickness contributed 11.26%. The remaining parameters had minimal influence, each contributing less than 10%. The model’s predictive performance was assessed using R-squared (R2) and adjusted R-squared (Adj. R2) values. An R2 of 98.34% indicates that the selected input parameters explain a substantial portion of the variation in impact strength, while an adjusted R2 of 89.24% confirms the model’s robustness by accounting for the number of predictors. These high values demonstrate a strong correlation between the experimental and predicted results, validating the model’s reliability in accurately predicting impact strength Equation (21).
Impact Strength (KJ/m2)=4.354 − 0.970 C10 + 0.436 C10.02 + 0.534 C10.04 − 2.338 C2190 + 2.640 C2200 − 0.303 C2210(21)
+ 1.614 C310 − 0.944 C330 − 0.670 C360 − 0.451 C40 − 0.247 C445 + 0.698 C490 + 0.309 C50.15
+ 0.087 C50.25 − 0.396 C50.35 + 0.156 C10 × C50.15 − 0.852 C10 × C50.25 + 0.695 C10 × C50.35 − 0.120
C10.02 × C50.15 + 1.157 C10.02 × C50.25 − 1.037 C10.02 × C50.35 − 0.037 C10.04 × C50.15 − 0.305 C10.04 × C50.25 + 0.342 C10.04 × C50.35+ 0.509 C310 × C50.15 + 0.309 C310 × C50.25
− 0.819 C310 × C50.35+ 1.194 C330 × C50.15 − 1.781 C330 × C50.25 + 0.586 C330 × C50.35
− 1.704 C360 × C50.15+ 1.471 C360 × C50.25+ 0.232 C360 × C50.35 − 1.429 C40 × C50.15
+ 1.336 C40 × C50.25+ 0.093 C40 × C50.35+ 1.794 C445 × C50.15 − 1.276 C445 × C50.25
− 0.517 C445 × C50.35 − 0.365 C490 × C50.15 − 0.060 C490 × C50.25+ 0.424 C490 × C50.35
− 12.7 C490 × C50.35
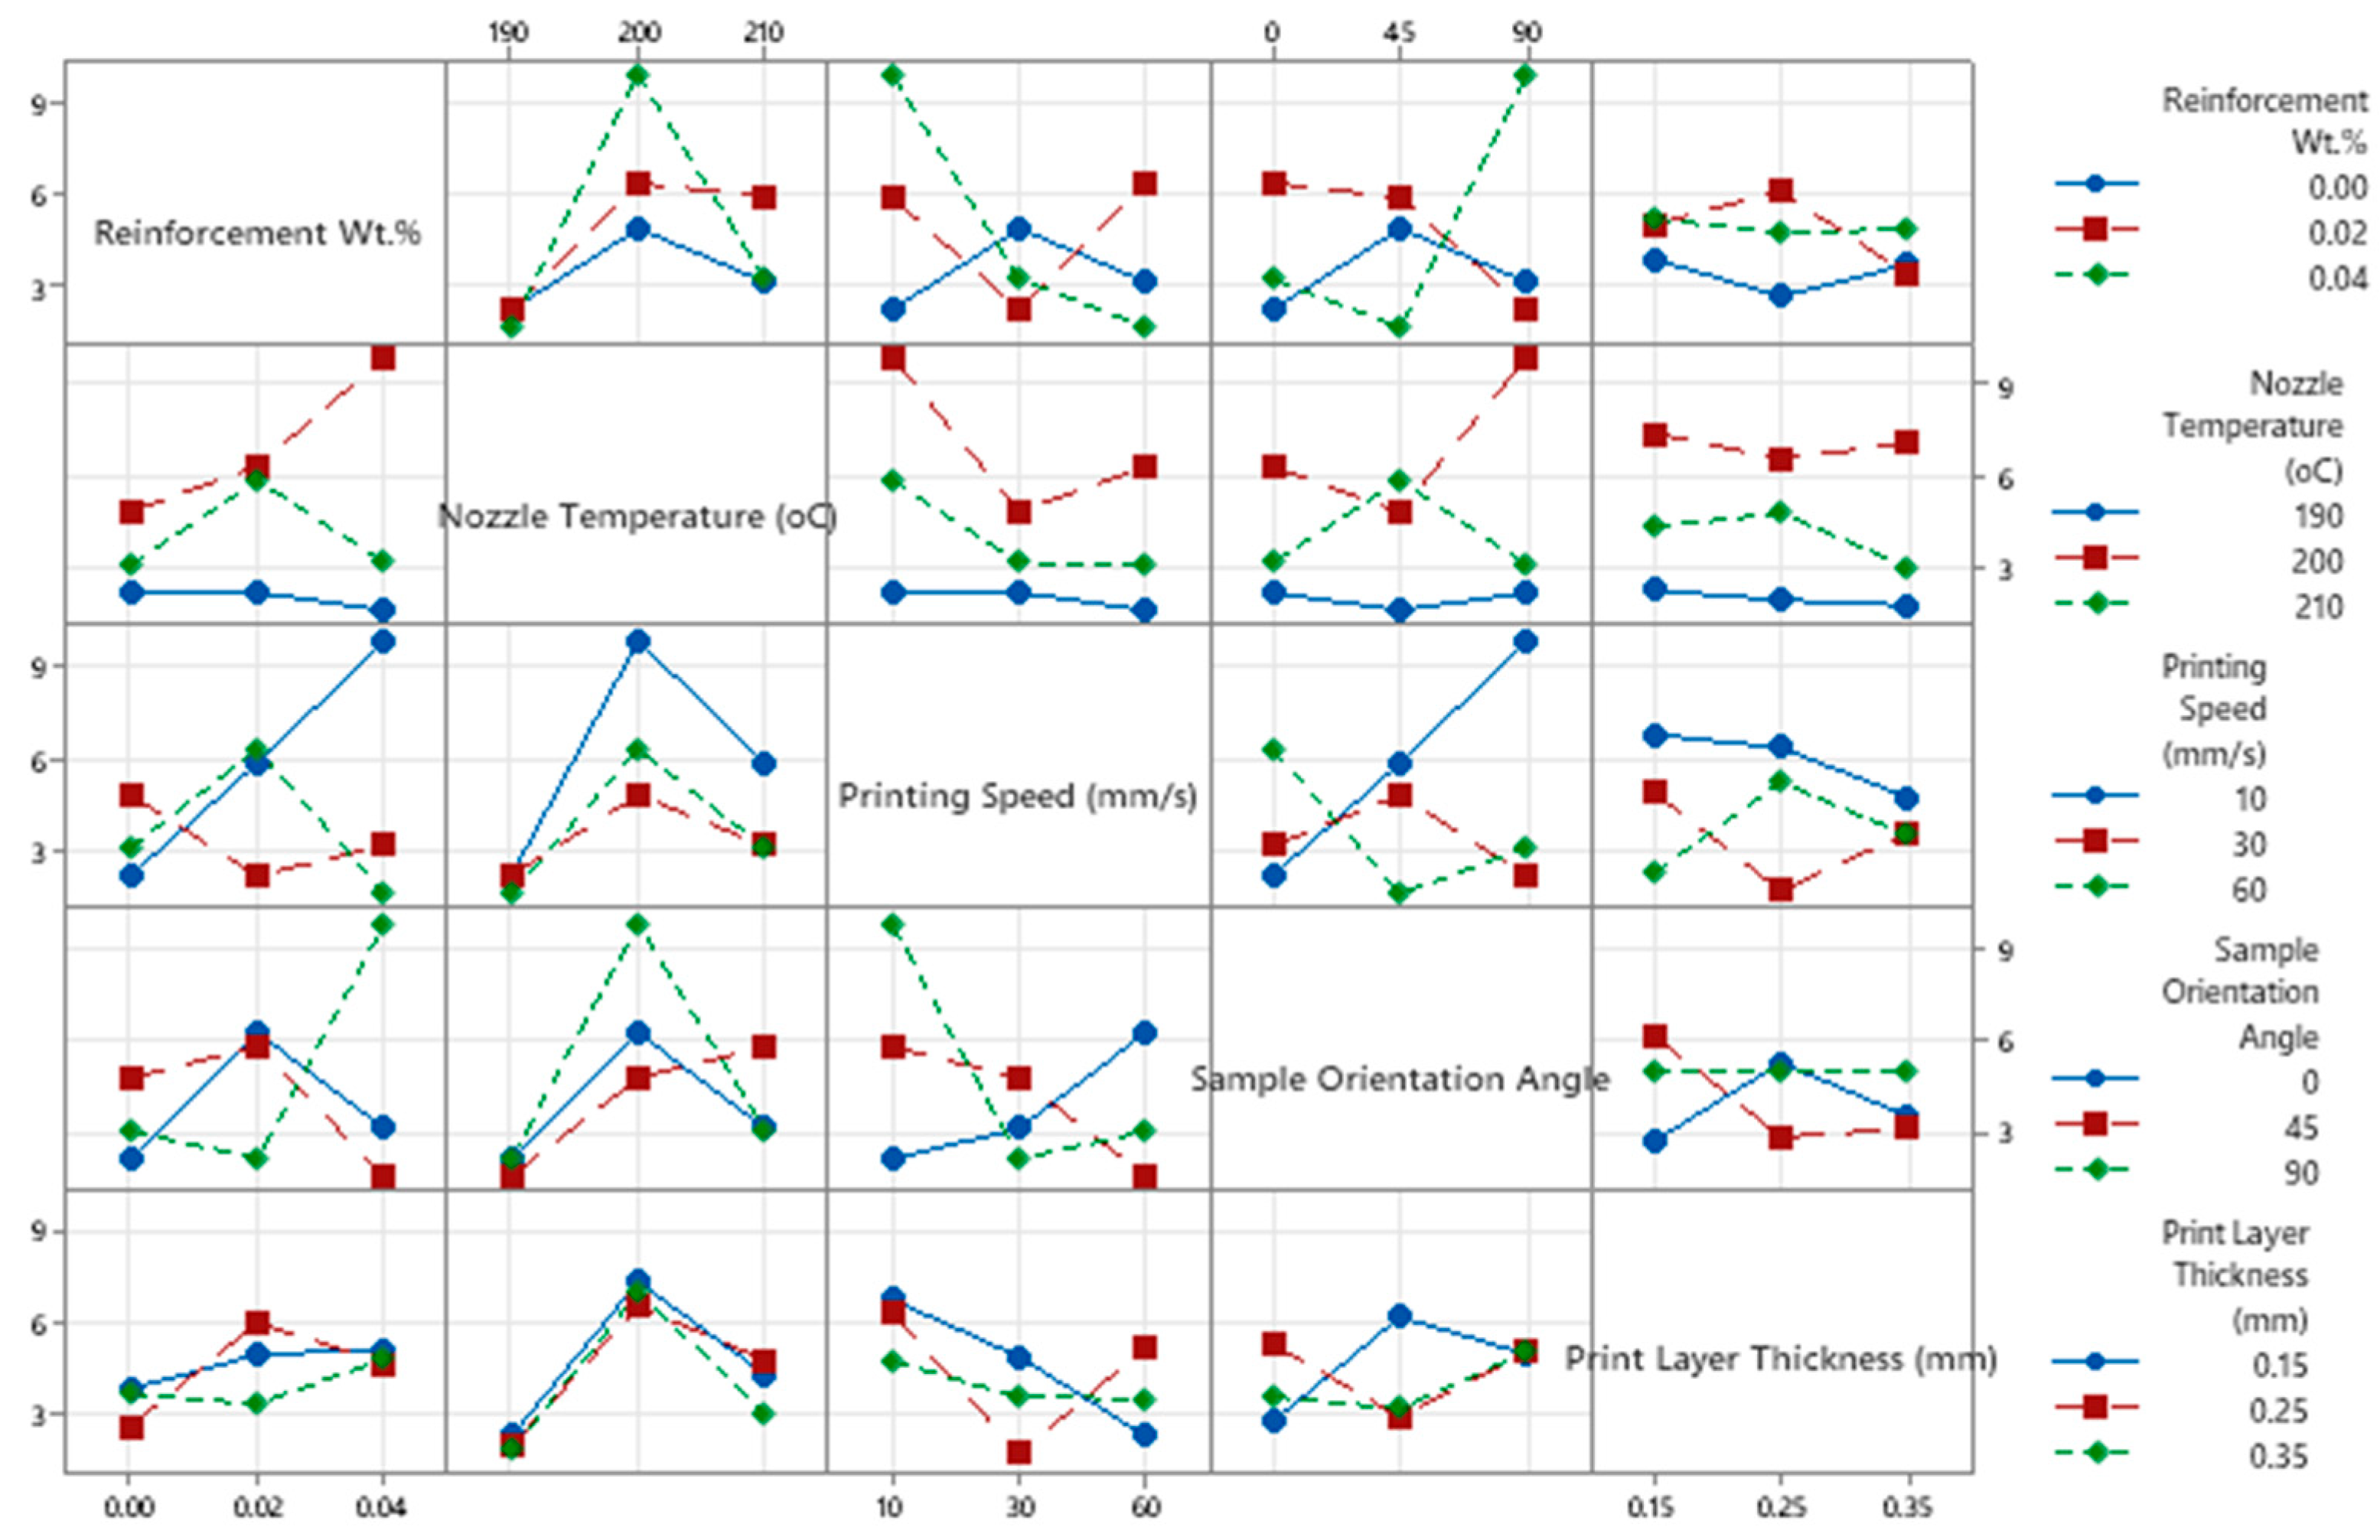
Figure 10 presents the interaction plots illustrating the influence of key 3D printing parameters on the impact strength of PLA-BNNP composites. Impact strength increases with reinforcement content, rising from 3.2 kJ/m2 for pure PLA to a maximum of 8.8 kJ/m2 at 0.04 wt.%, confirming the reinforcing effect of boron nitride nanoparticles. Nozzle temperature exhibits a non-linear effect, with the highest impact strength of 8.8 kJ/m2 observed at 200 °C, decreasing to 4.2 kJ/m2 at 190 °C and 6.0 kJ/m2 at 210 °C. These findings suggest that a moderate nozzle temperature maximizes impact resistance, while both lower and higher temperatures may degrade the material’s performance. Printing speed significantly affects toughness, peaking at 8.0 kJ/m2 at 30 mm/s, while lower and higher speeds (10 mm/s and 60 mm/s) result in reduced strengths of 5.2 kJ/m2 and 4.5 kJ/m2, respectively. This non-monotonic relationship highlights the importance of determining an optimal printing speed to achieve enhanced impact strength. The sample orientation angle also plays a crucial role, with impact strength increasing from 5.1 kJ/m2 at 0° to 8.5 kJ/m2 at 90°. This result highlights the significant effect of print orientation on the material’s ability to resist impact. Among layer thicknesses, 0.25 mm delivers the best performance at 7.6 kJ/m2, compared to 6.0 kJ/m2 at 0.15 mm and 5.4 kJ/m2 at 0.35 mm. These trends indicate that layer thickness influences the mechanical integrity of the print, with a medium thickness yielding optimal results. Overall, these findings highlight that optimal impact resistance is achieved through the careful selection and interaction of multiple processing parameters, with specific attention to nozzle temperature, printing speed, and sample orientation angle.
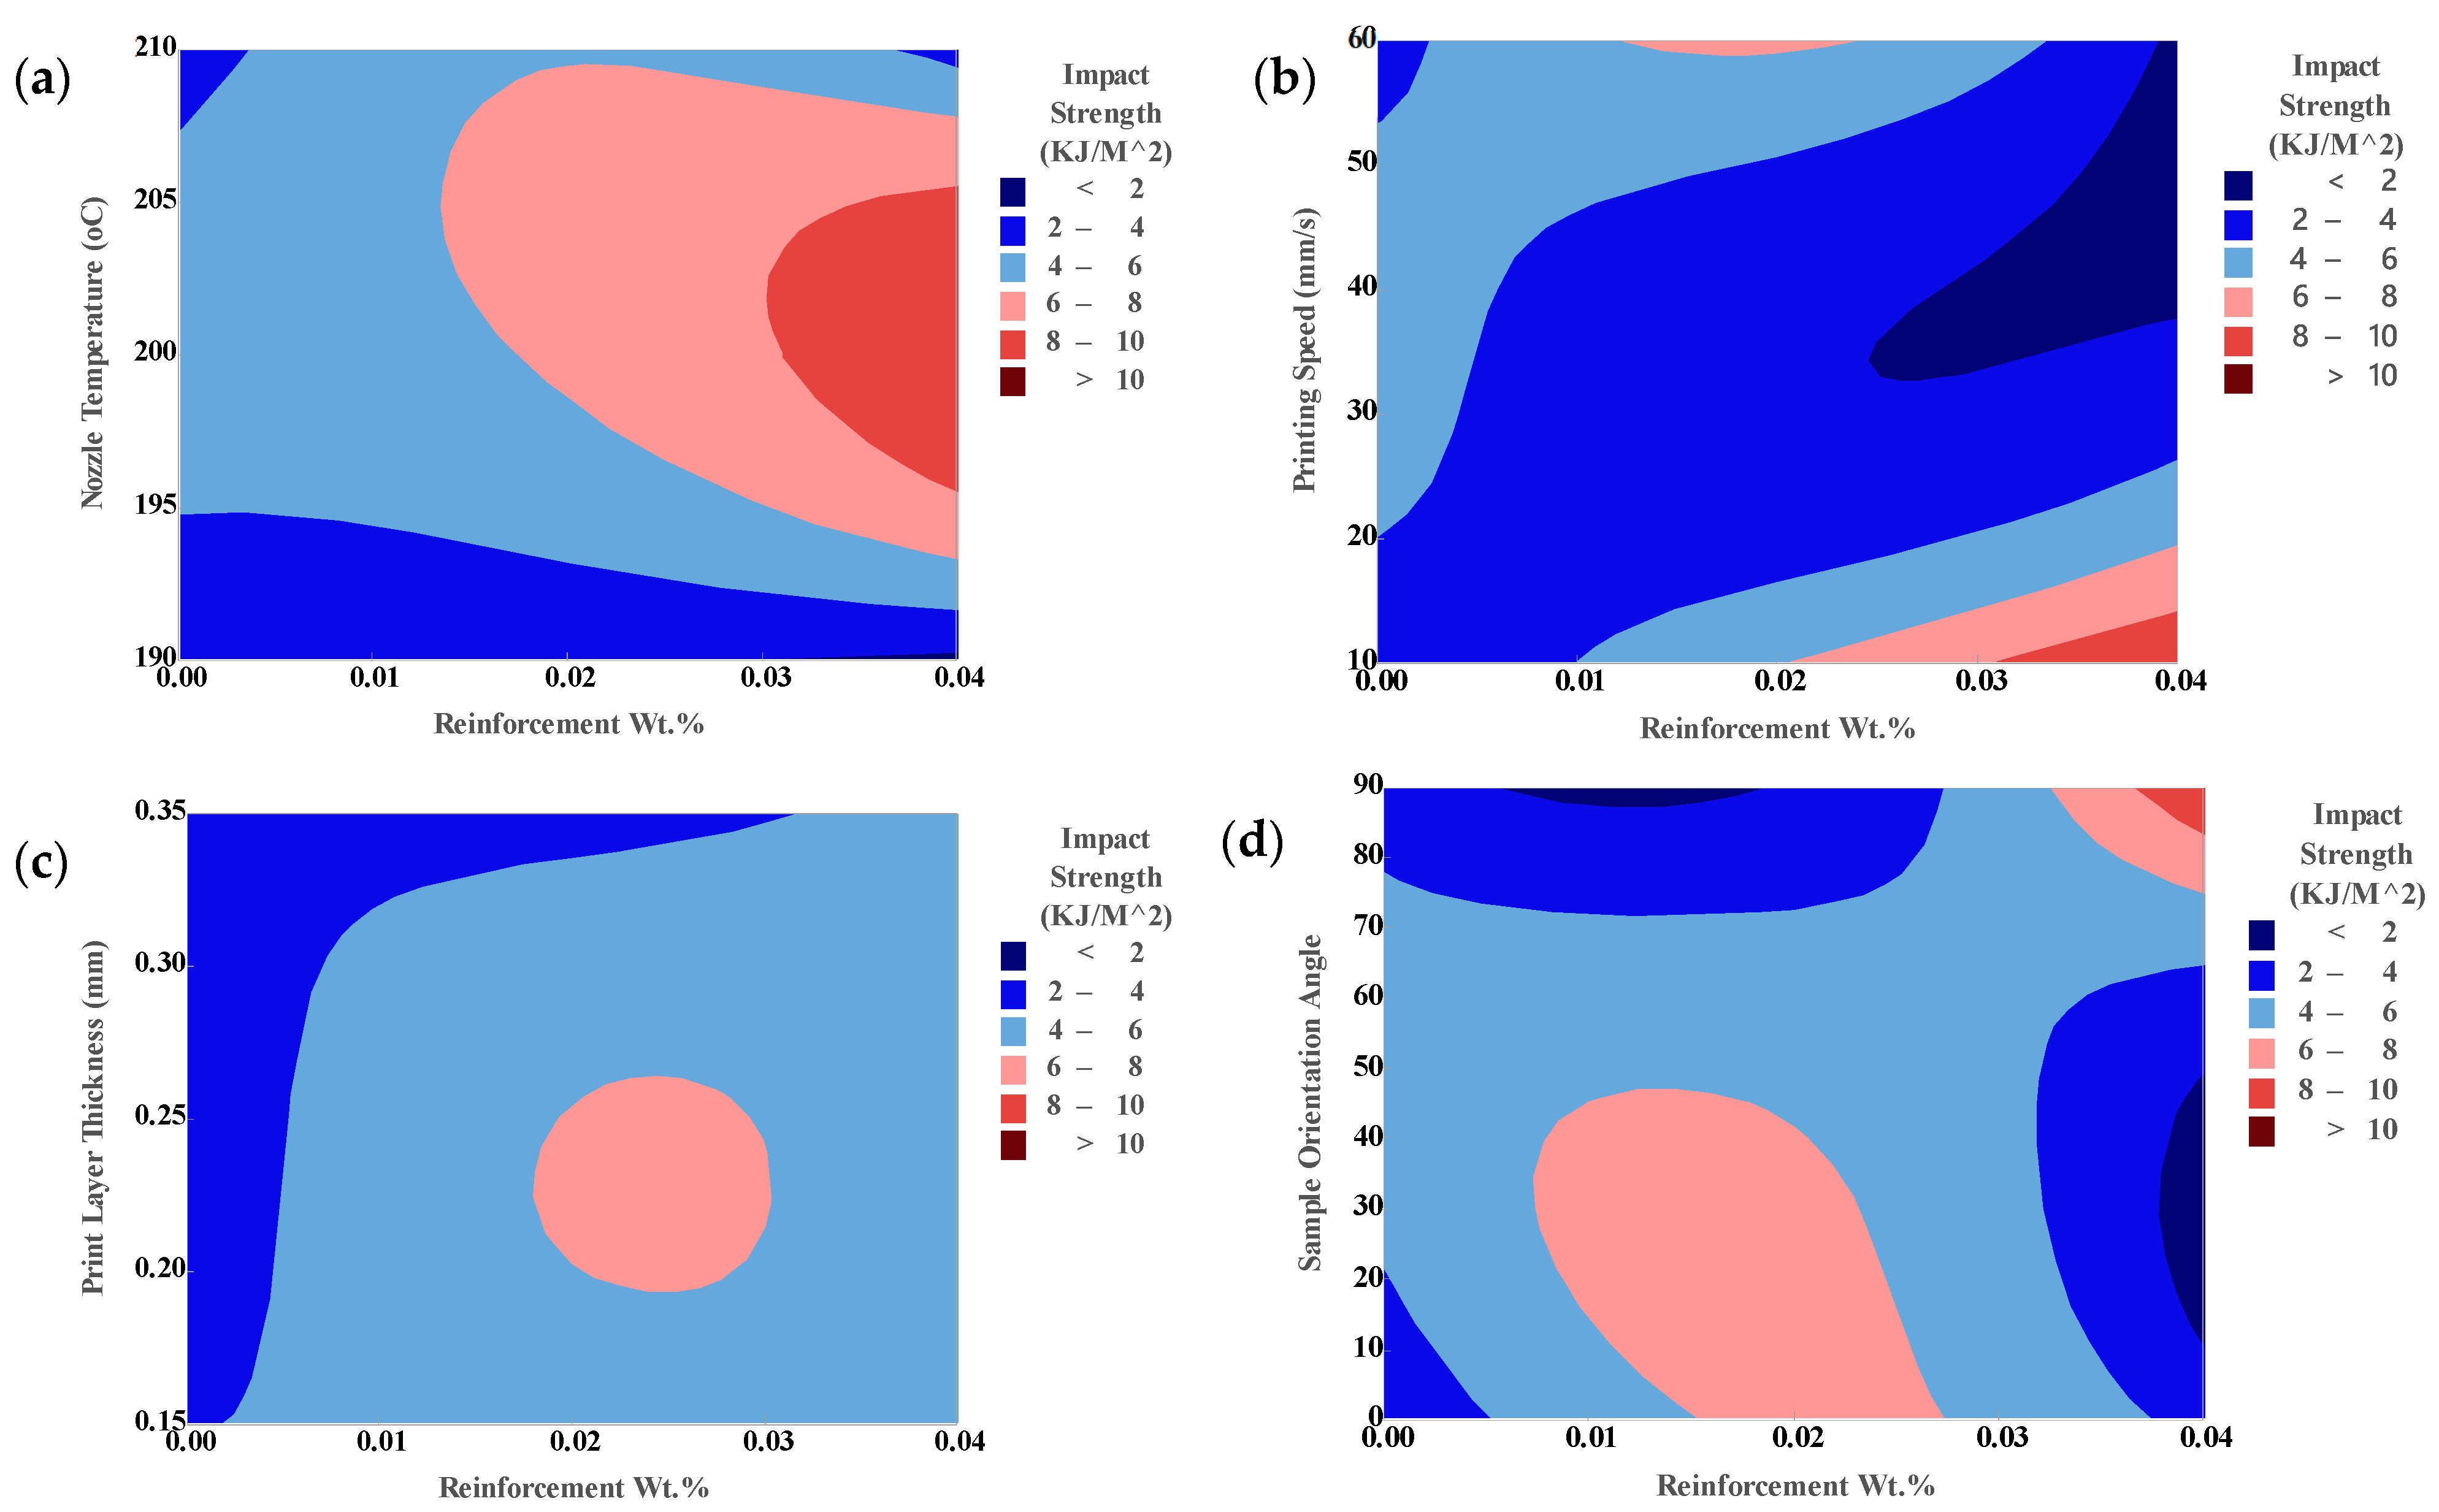
The contour plots in Figure 11 illustrate the combined effects of reinforcement weight percentage and key 3D printing parameters on the impact strength of PLA-BNNP composites. In Figure 11a, nozzle temperature has a strong influence on impact strength, with the highest values, exceeding 10 kJ/m2, observed at 0.04 wt.% reinforcement and temperatures of around 205–210 °C (shown in dark red). This indicates that a higher reinforcement content and moderate-to-high nozzle temperatures enhance impact resistance, while lower temperatures and reinforcement contents correspond to weaker zones, represented in blue, below 4 kJ/m2. Figure 11b shows that printing speed also significantly affects impact strength, where higher reinforcement levels (0.04 wt.%) combined with moderate to high printing speeds of 40–60 mm/s result in enhanced toughness (represented in red to pink regions, 6–10 kJ/m2). Conversely, lower printing speeds and low filler content result in reduced impact strength, underscoring the importance of optimizing both speed and reinforcement content for enhanced performance. In Figure 11c, print layer thickness shows a localized effect on impact strength, with higher strength (6–8 kJ/m2) observed around 0.02 wt.% reinforcement and 0.20 mm thickness, while other areas remain mostly below 4 kJ/m2. This suggests that a moderate layer thickness, coupled with optimal reinforcement, is critical for maximizing impact resistance. Figure 11d illustrates the influence of sample orientation angle, where reinforcement levels of 0.02–0.03 wt.% combined with orientation angles between 30° and 60° significantly enhance impact strength, as seen in the pink regions. These findings emphasize that optimal impact resistance in PLA-BNNP composites is achieved through a careful combination of elevated nozzle temperature, increased reinforcement, moderate to high printing speed, appropriate layer thickness, and favorable sample orientation angles. Additionally, the predictive accuracy and reliability of the developed regression model were evaluated by comparing predicted values with experimentally measured data for tensile strength, Young’s modulus, and impact strength. The model demonstrates effectiveness when the deviations between the predicted and actual values are minimal, indicating a strong correlation and confirming the reliability of the predictions.
For tensile strength, Figure 12a shows percentage deviations for samples S1–S27 ranging from 0.26% to 15.26%, with most values remaining low. Figure 12b presents deviations for Young’s modulus, mostly within 0.31–13.94%, although a few samples exceed 10%. For impact strength, Figure 12c indicates deviations from 0.45% to 106.53%, with most samples below 20%, except a few outliers. Despite these few larger deviations, the majority of data across all three mechanical properties fall within acceptable limits, confirming the strong predictive performance of the model. These results demonstrate that the model effectively captures the relationship between 3D printing parameters and the resulting mechanical properties of PLA-BNNP composites.

3.4. Machine Learning

3.4.1. Machine Learning for Tensile Strength

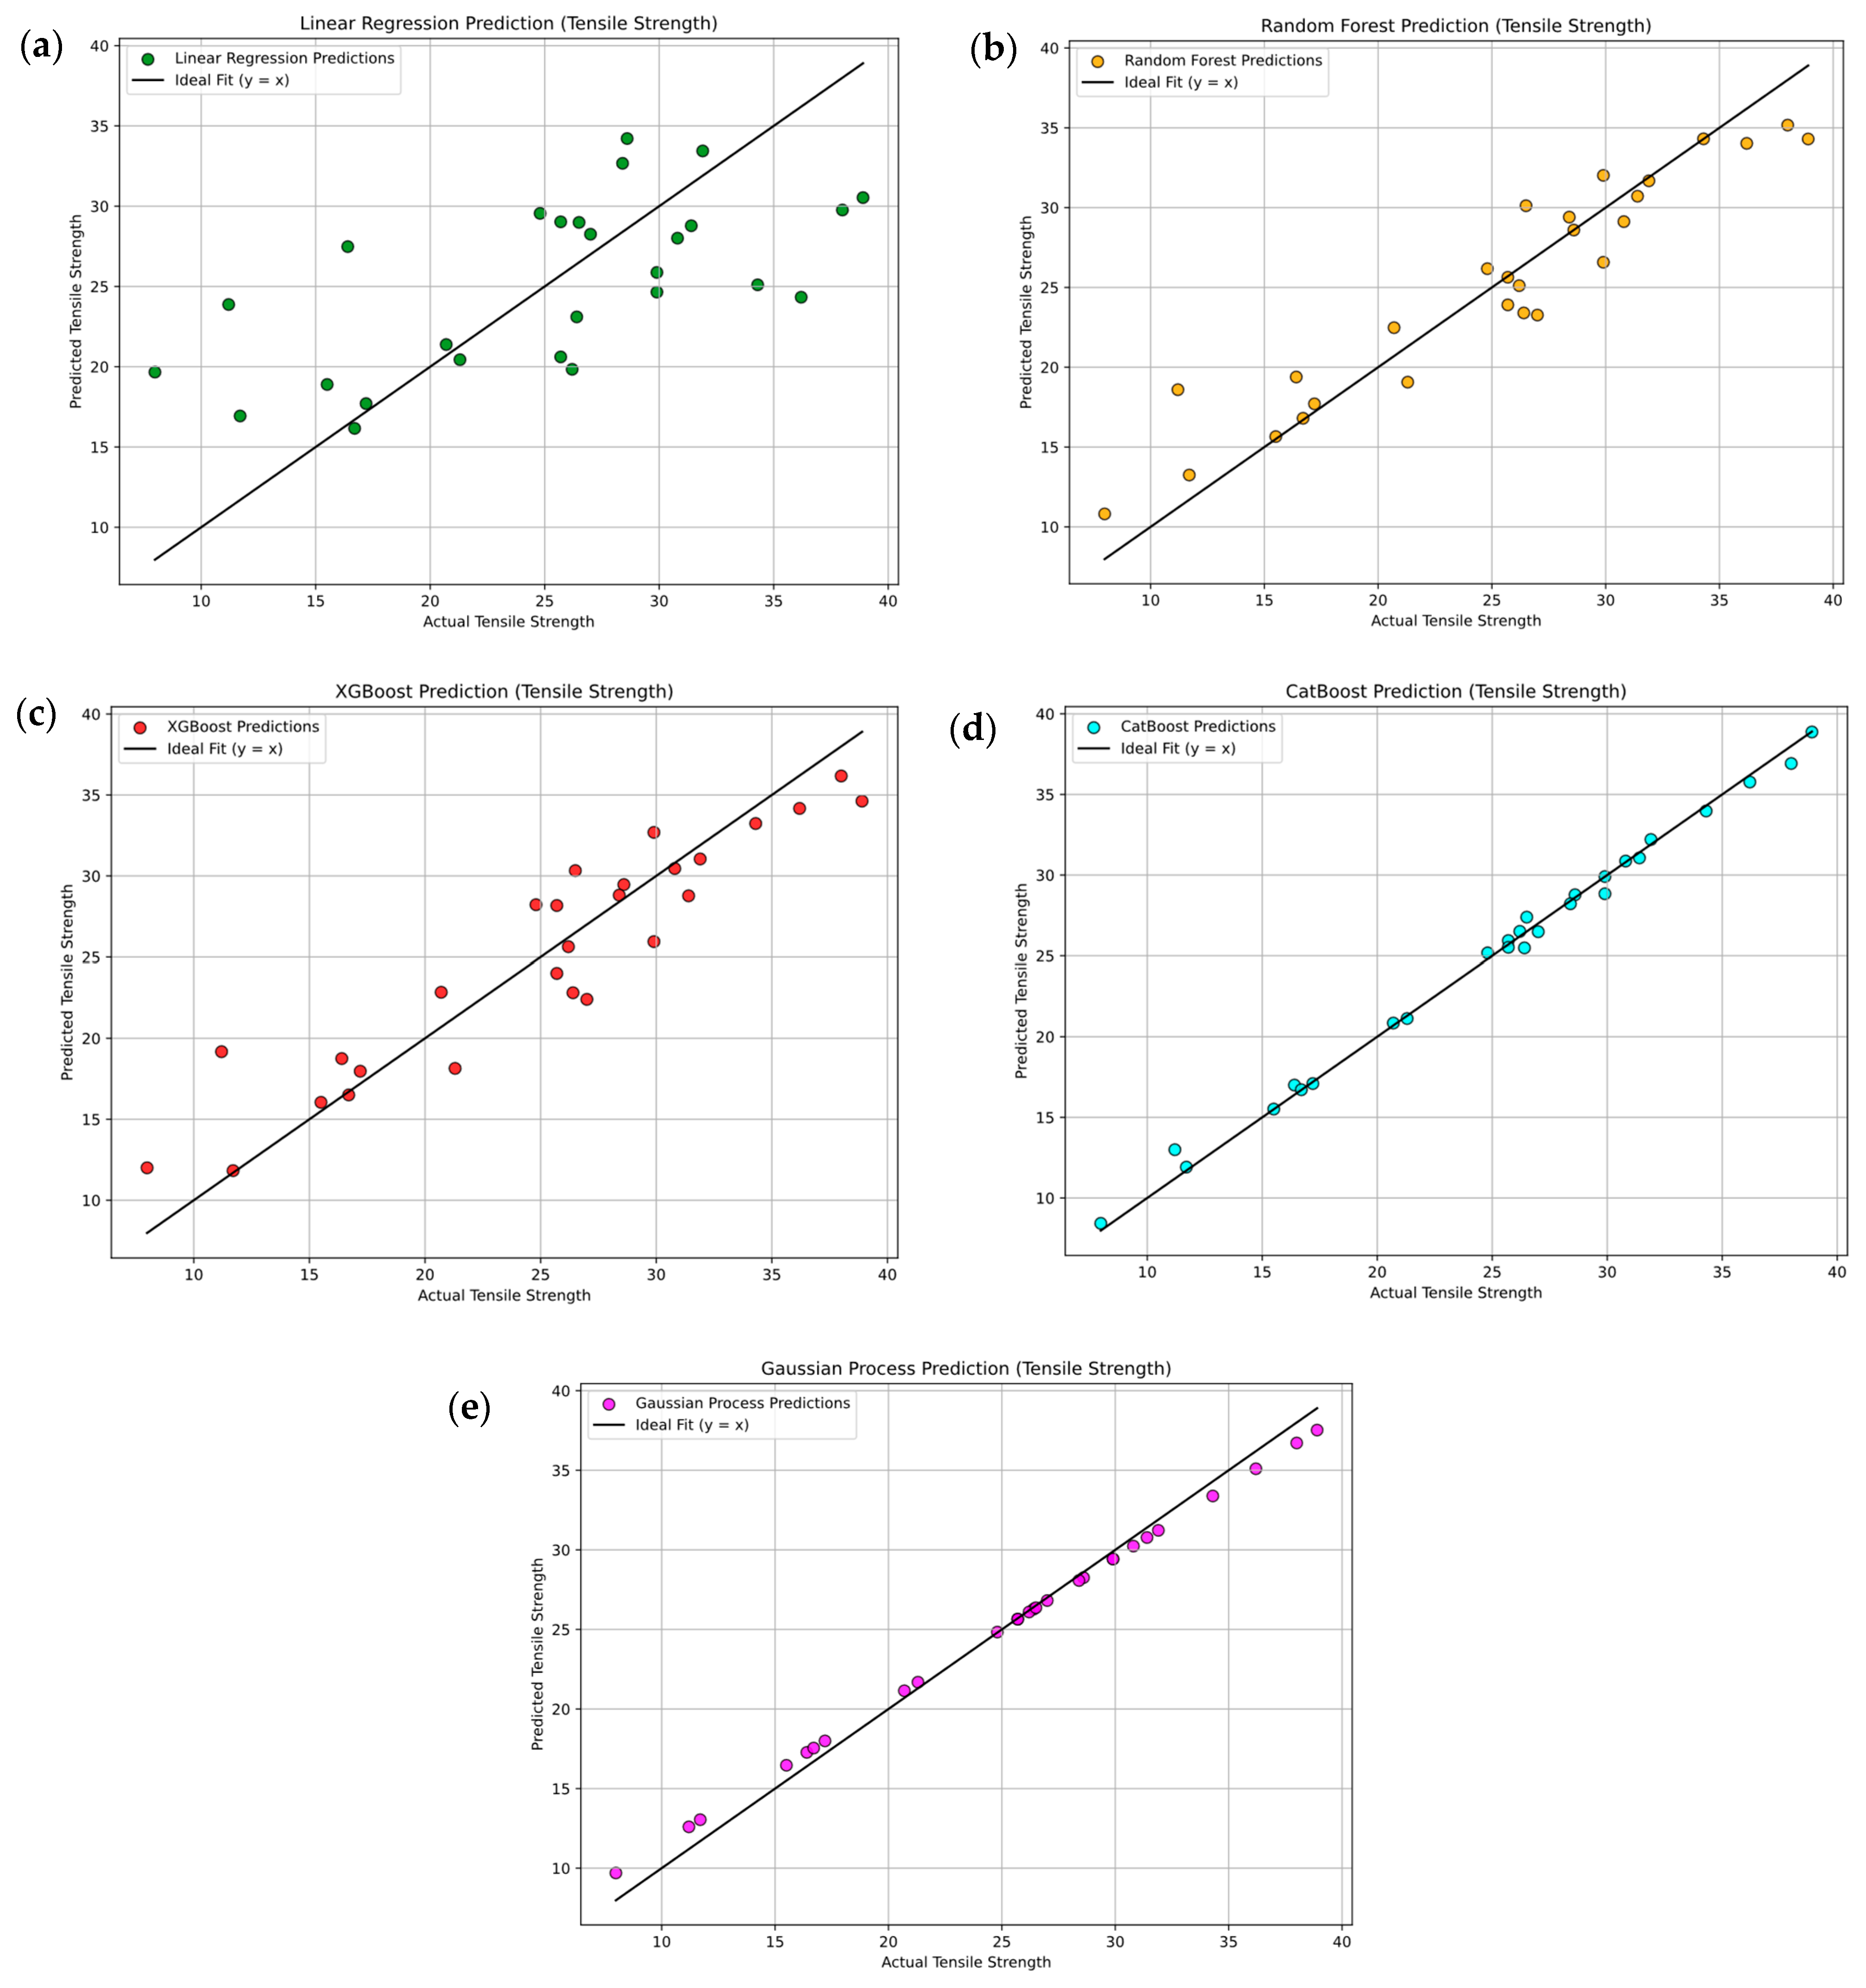
Figure 13a–e presents the parity plots comparing tensile strength values predicted by different machine learning models—linear regression (LR), Random Forest (RFR), XGBoost, CatBoost (CBR), and Gaussian process regression (GPR)—with experimentally measured values, using cross-validation (CV) to assess the robustness of the models. In Figure 13a, the linear regression model exhibits significant deviations from the actual values, with the following standardized CV results: R2 = 0.402 ± 0.045, MSE = 91.7401 ± 78.3100, MAE = 6.4212 ± 4.5286, and MAPE = 25.95 ± 0.0027%. Figure 13b shows the Random Forest model, which aligns more closely with the experimental data, yielding standardized CV results: R2 = 0.899 ± 0.032, MSE = 99.0099 ± 89.4162, MAE = 5.5738 ± 4.1154, and MAPE = 9.92 ± 0.026%. The XGBoost model, illustrated in Figure 13c, achieves moderately high predictive accuracy, as indicated by the standardized CV results: R2 = 0.870 ± 0.031, MSE = 68.4371 ± 96.2664, MAE = 6.3940 ± 5.2492, and MAPE = 11.57 ± 0.0028%. Figure 13d demonstrates that the CatBoost model achieves excellent predictive performance, as indicated by the standardized CV results: R2 = 0.995 ± 0.021, MSE = 0.33, RMSE = 0.58, MAE = 0.40, and MAPE = 2.02 ± 0.0042%. Figure 13e illustrates the Gaussian process model, which shows a highly reliable agreement between predicted and experimental values, with standardized CV results: R2 = 0.990 ± 0.023, MSE = 145.3361 ± 136.3766, MAE = 10.8074 ± 5.3419, and MAPE = 3.61 ± 0.0032%. Overall, ensemble-based and kernel-based models, particularly CatBoost and GPR, demonstrate superior accuracy and reliability in predicting tensile strength, as confirmed by cross-validation, compared to simpler models such as linear regression.
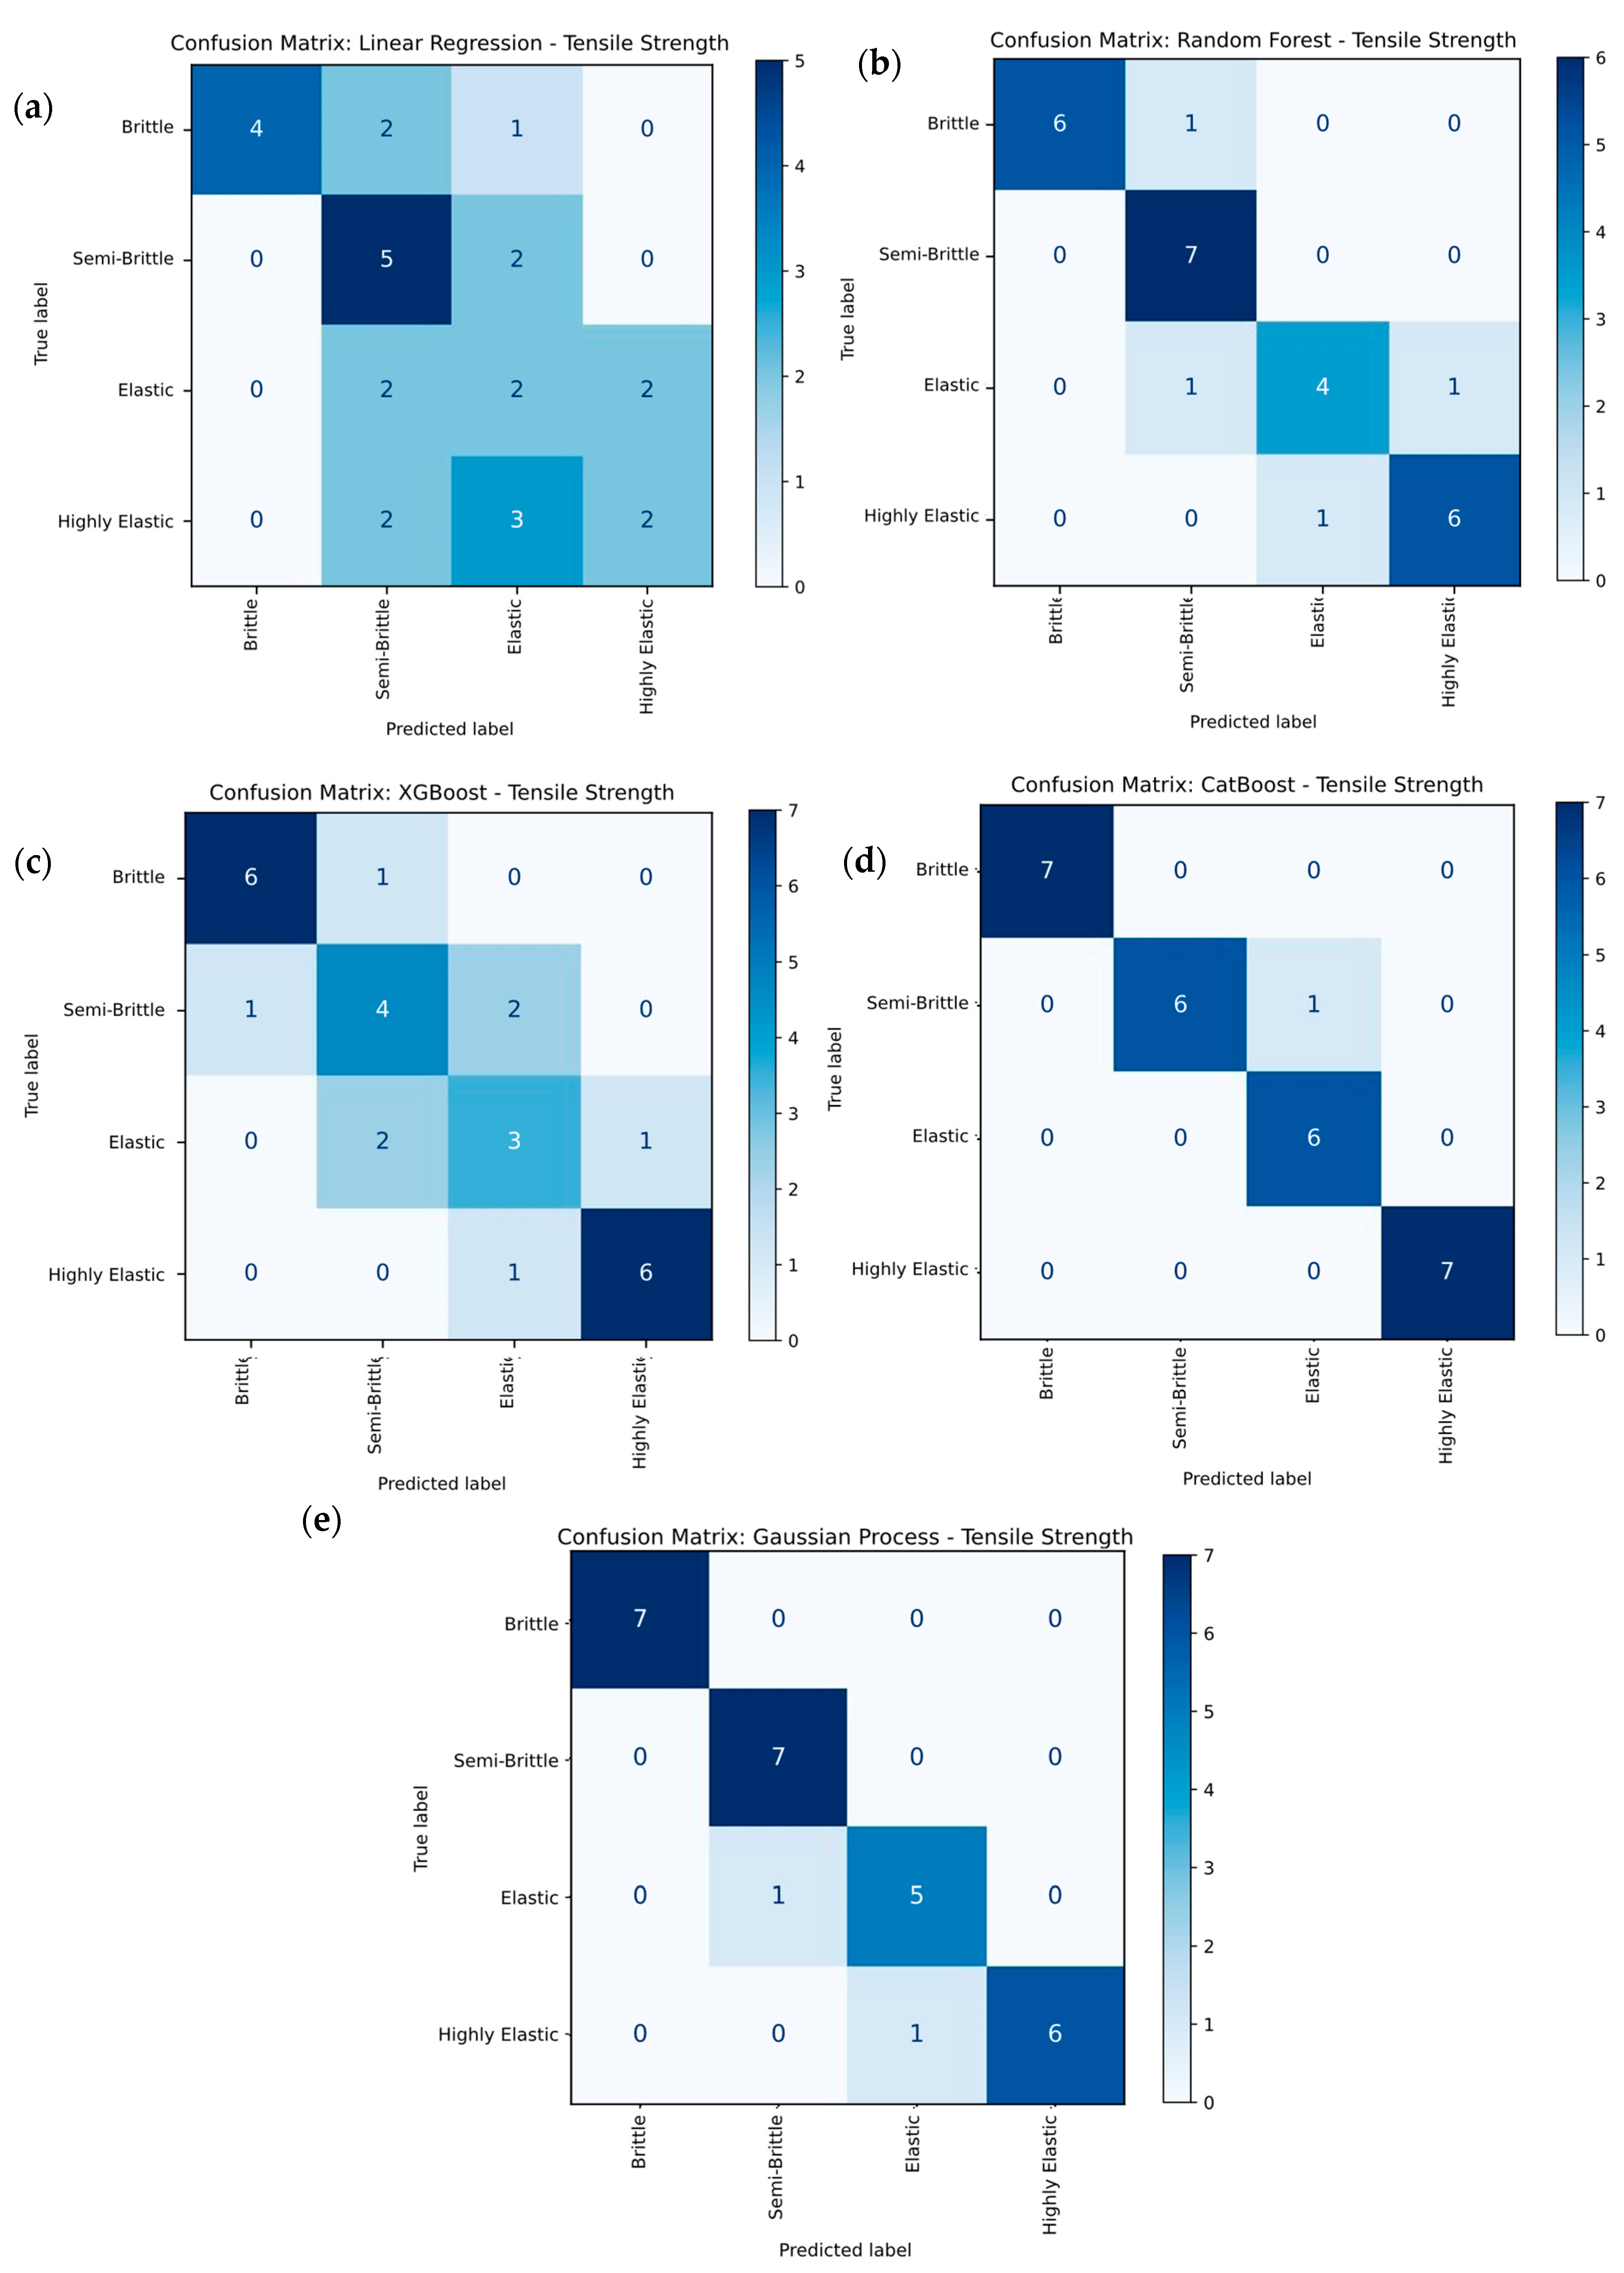
The multi-class classification breakdown in Figure 14a–e demonstrate the performance of five machine learning models—linear regression (LR), Random Forest Regression (RFR), XGBoost, CatBoost (CBR), and Gaussian process regression (GPR)—in categorizing the tensile strength of PLA-BNNP composites into brittle, semi-brittle, elastic, semi-elastic, and highly elastic classes. In Figure 14a, the linear regression model exhibits limited accuracy, correctly classifying only 14 out of 27 samples while misclassifying the remaining 13, resulting in an overall accuracy of 51%. The model often confuses brittle samples with those of semi-brittle, elastic, or highly elastic categories, and vice versa. Figure 14b shows the Random Forest model, which performs better with 20 correct and seven incorrect classifications, achieving an accuracy of 74.07%; however, some misclassifications persist, particularly among brittle, semi-brittle, and semi-elastic samples. In contrast, Figure 14c–e illustrates that the XGBoost, CatBoost, and Gaussian process regression models correctly classify all 27 samples, achieving 100% accuracy with no misclassifications. These results clearly indicate that ensemble-based and kernel-based models provide superior reliability and effectiveness for classifying tensile strength behavior compared to simpler models, such as linear regression.

3.4.2. Machine Learning for Young’s Modulus

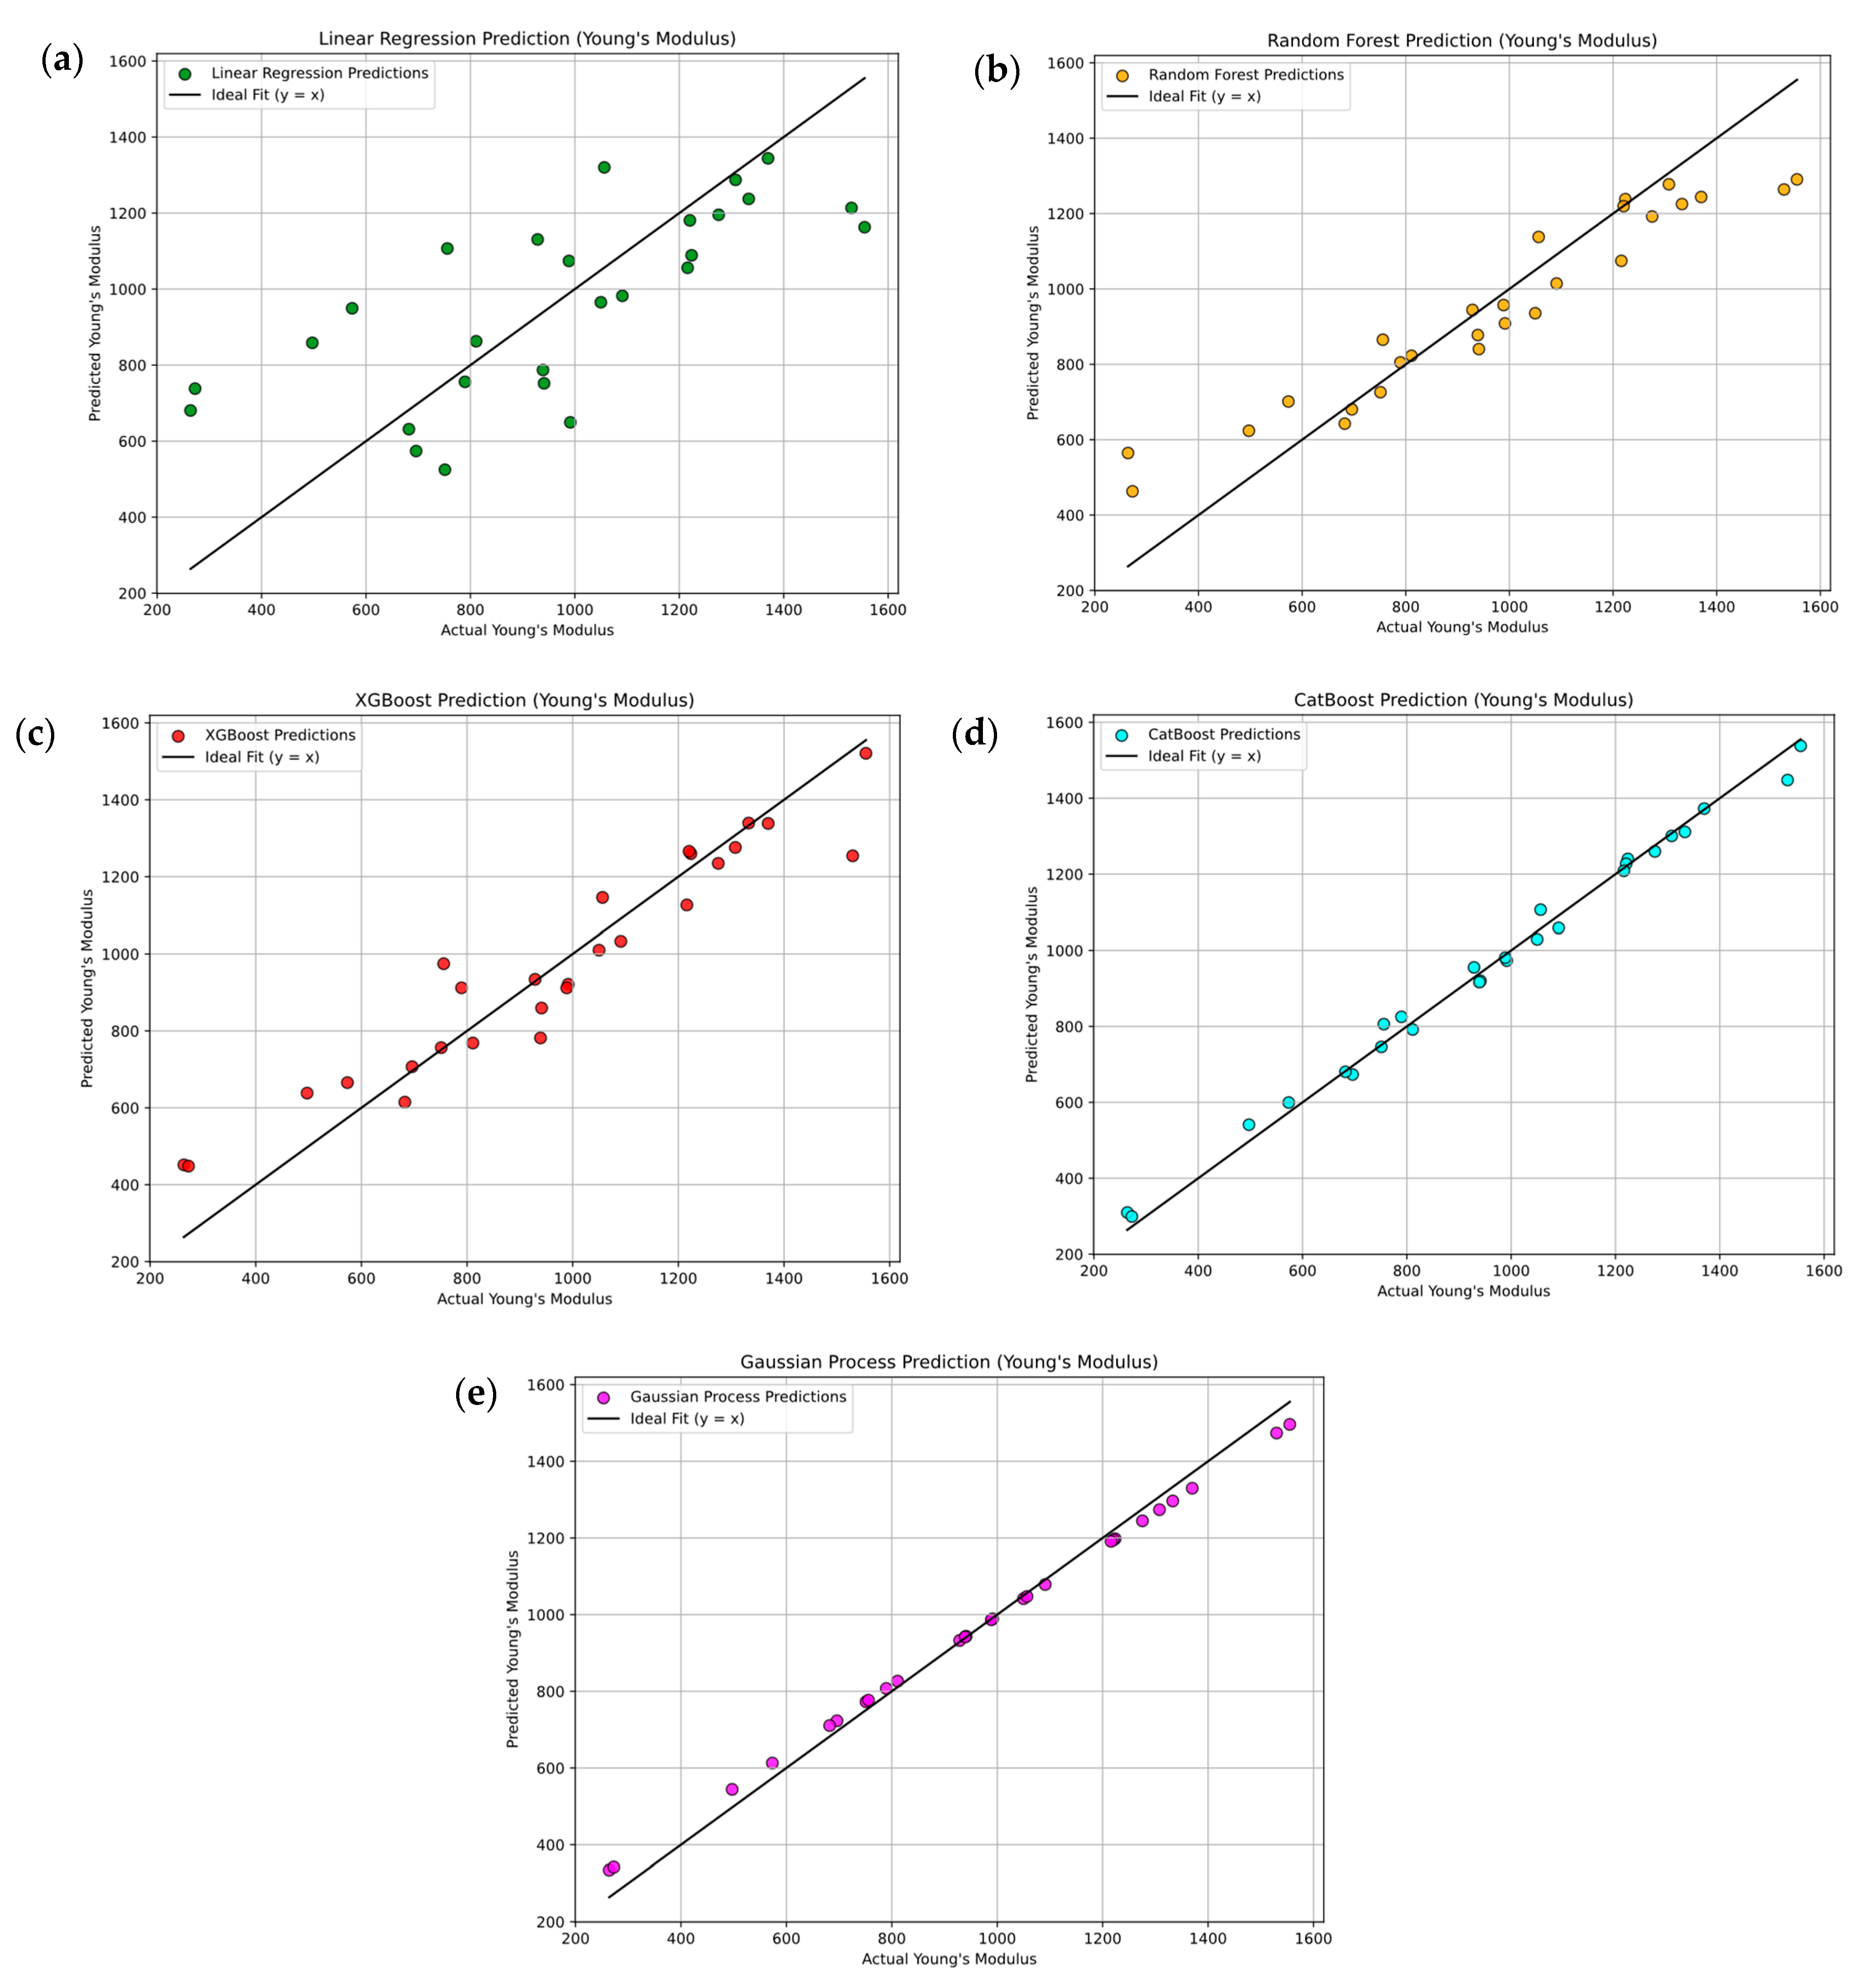
Figure 15a–e present parity plots comparing experimentally measured and predicted Young’s modulus values using five machine learning models: linear regression (LR) (Figure 15a), Random Forest Regression (RFR) (Figure 15b), XGBoost (Figure 15c), CatBoost (CBR) (Figure 15d), and Gaussian process regression (GPR)) (Figure 15e). The LR model Figure 15a exhibits substantial deviations from the experimental data, underscoring its inability to capture nonlinear relationships, with LOOCV results of R2 = 0.513 ± 0.005, MSE = 55,045.34 ± 55,000, RMSE = 234.62 ± 45.0, MAE = 190.63 ± 75.0, and MAPE = 30.13 ± 0.074%. The RFR model (Figure 15b) provides notable improvements, reaching R2 = 0.863 ± 0.045R2 = 0.863 ± 0.045, MSE = 15,465.40 ± 13,000, RMSE = 124.36 ± 35.0, MAE = 94.86 ± 50.0, and MAPE = 14.45 + 0.02%. XGBoost (Figure 15c) further enhances predictive performance, achieving R2 = 0.898 ± 0.034, MSE = 11,535.03 ± 10,000, RMSE = 107.40 ± 30.0, MAE = 82.76 ± 45.0, and MAPE = 12.71 ± 0.000%. CatBoost (Figure 15d) demonstrates excellent accuracy, with R2 = 0.987 ± 0.004R2 = 0.987 ± 0.004, MSE = 900.03 ± 800, RMSE = 30.00 ± 10.0, MAE = 24.16 ± 15.0, and MAPE = 3.35 ± 0.0015%. Finally, GPR (Figure 15e) achieves similarly outstanding predictive reliability, yielding R2 = 0.990 ± 0.035, MSE = 1129.70 ± 1000, RMSE = 33.61 ± 10.0, MAE = 27.19 ± 15.0, and MAPE = 4.26 ± 0.001%. Collectively, ensemble-based and kernel-based models, particularly CatBoost and GPR, exhibit superior accuracy and robustness in predicting Young’s modulus, outclassing simpler approaches such as linear regression.
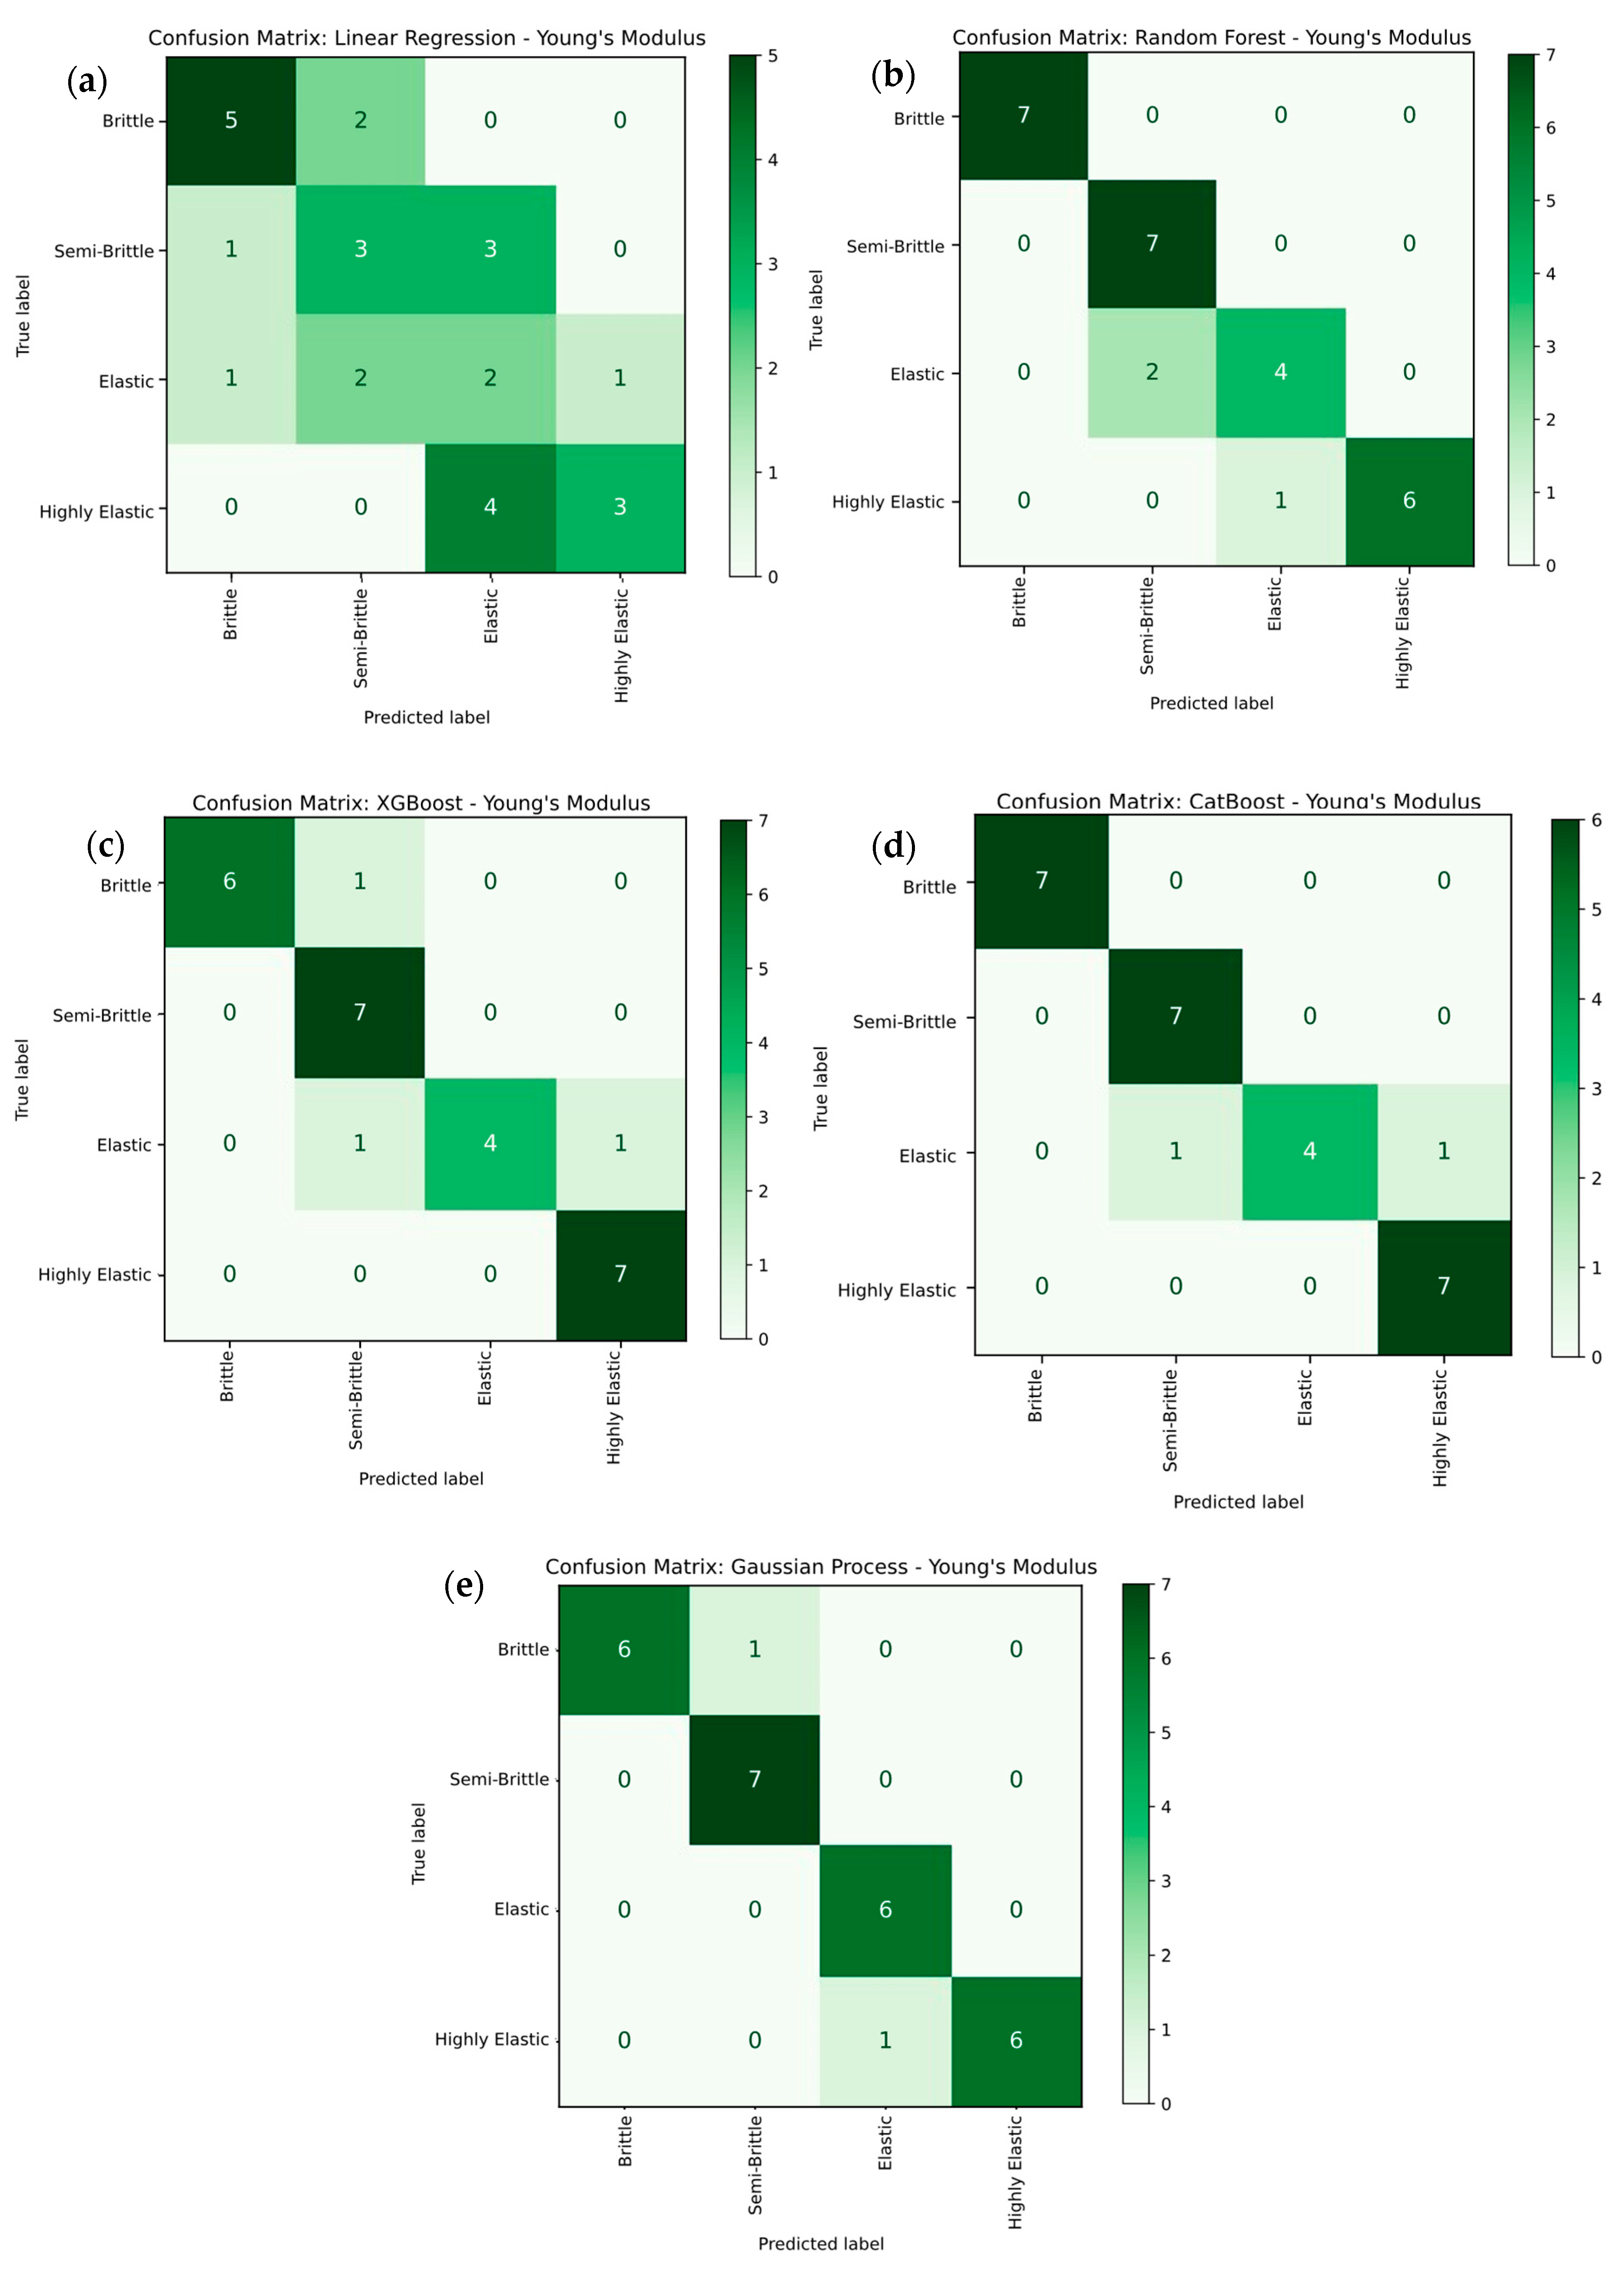
The multi-class classification breakdown in Figure 16a–e illustrate the performance of various machine learning models in classifying Young’s modulus categories of PLA/BNNP composites, labeled as brittle, semi-brittle, elastic, semi-elastic, and highly elastic. In Figure 16a, the linear regression model demonstrates limited accuracy, correctly predicting 15 out of 27 samples while misclassifying the remaining 12, resulting in an overall accuracy of 55.56%. It frequently confuses brittle samples with semi-brittle, elastic, or highly elastic categories, and vice versa. Figure 16b depicts the Random Forest model, which shows improved performance, with 23 correct classifications and four misclassifications, achieving an accuracy of 85%; however, some errors persist among the brittle, semi-brittle, and semi-elastic classes. In contrast, Figure 16c–e displays the XGBoost, CatBoost, and Gaussian process regression models, which achieve accuracies of 100%, 88%, and 96.29%, with 0, 3, and 1 misclassification, respectively. These results indicate that ensemble-based and kernel-based models offer superior reliability and effectiveness in classifying Young’s modulus behavior compared to simpler models, such as linear regression.

3.4.3. Machine Learning for Impact Strength

Figure 17a–e present parity plots comparing the impact strength values predicted by various machine learning models—linear regression (Figure 17a), Random Forest (Figure 17b), XGBoost (Figure 17c), CatBoost (Figure 17d), and Gaussian process regression (GPR) (Figure 17e)—with experimentally measured data, including their respective cross-validation errors. The linear regression model in Figure 17a shows substantial deviations from actual values, reflecting an inability to model complex nonlinear trends, and yields cross-validated results of R2 = 0.224 ± 0.044, MSE = 7.10 ± 2.10, RMSE = 2.66 ± 0.39, MAE = 2.11 ± 0.75, and MAPE = 82.64 ± 18.7%. In Figure 17b, Random Forest demonstrates much better predictive alignment, with R2 = 0.831 ± 0.035, MSE = 1.55 ± 0.65, RMSE = 1.24 ± 0.25, MAE = 0.94 ± 0.37, and MAPE = 39.88 ± 9.5%. The XGBoost model provides moderate accuracy in Figure 17c, achieving R2 = 0.758 ± 0.028, MSE = 2.21 ± 0.78, RMSE = 1.49 ± 0.26, MAE = 0.97 ± 0.29, and MAPE = 53.13 ± 10.2%. CatBoost yields excellent performance with R2 = 0.979 ± 0.012, MSE = 0.189 ± 0.074, RMSE = 0.435 ± 0.11, MAE = 0.292 ± 0.09, and MAPE = 17.27 ± 5.2% in Figure 17d. GPR in Figure 17e achieves superior agreement with experimental values, recording R2 = 0.990 ± 0.009, MSE = 0.091 ± 0.032, RMSE = 0.302 ± 0.06, MAE = 0.259 ± 0.08, and MAPE = 10.44 ± 3.6%. Overall, ensemble-based and kernel-based models such as CatBoost and GPR deliver markedly higher accuracy and reliability—with lower cross-validation errors—than simpler approaches, such as linear regression, for predicting impact strength.
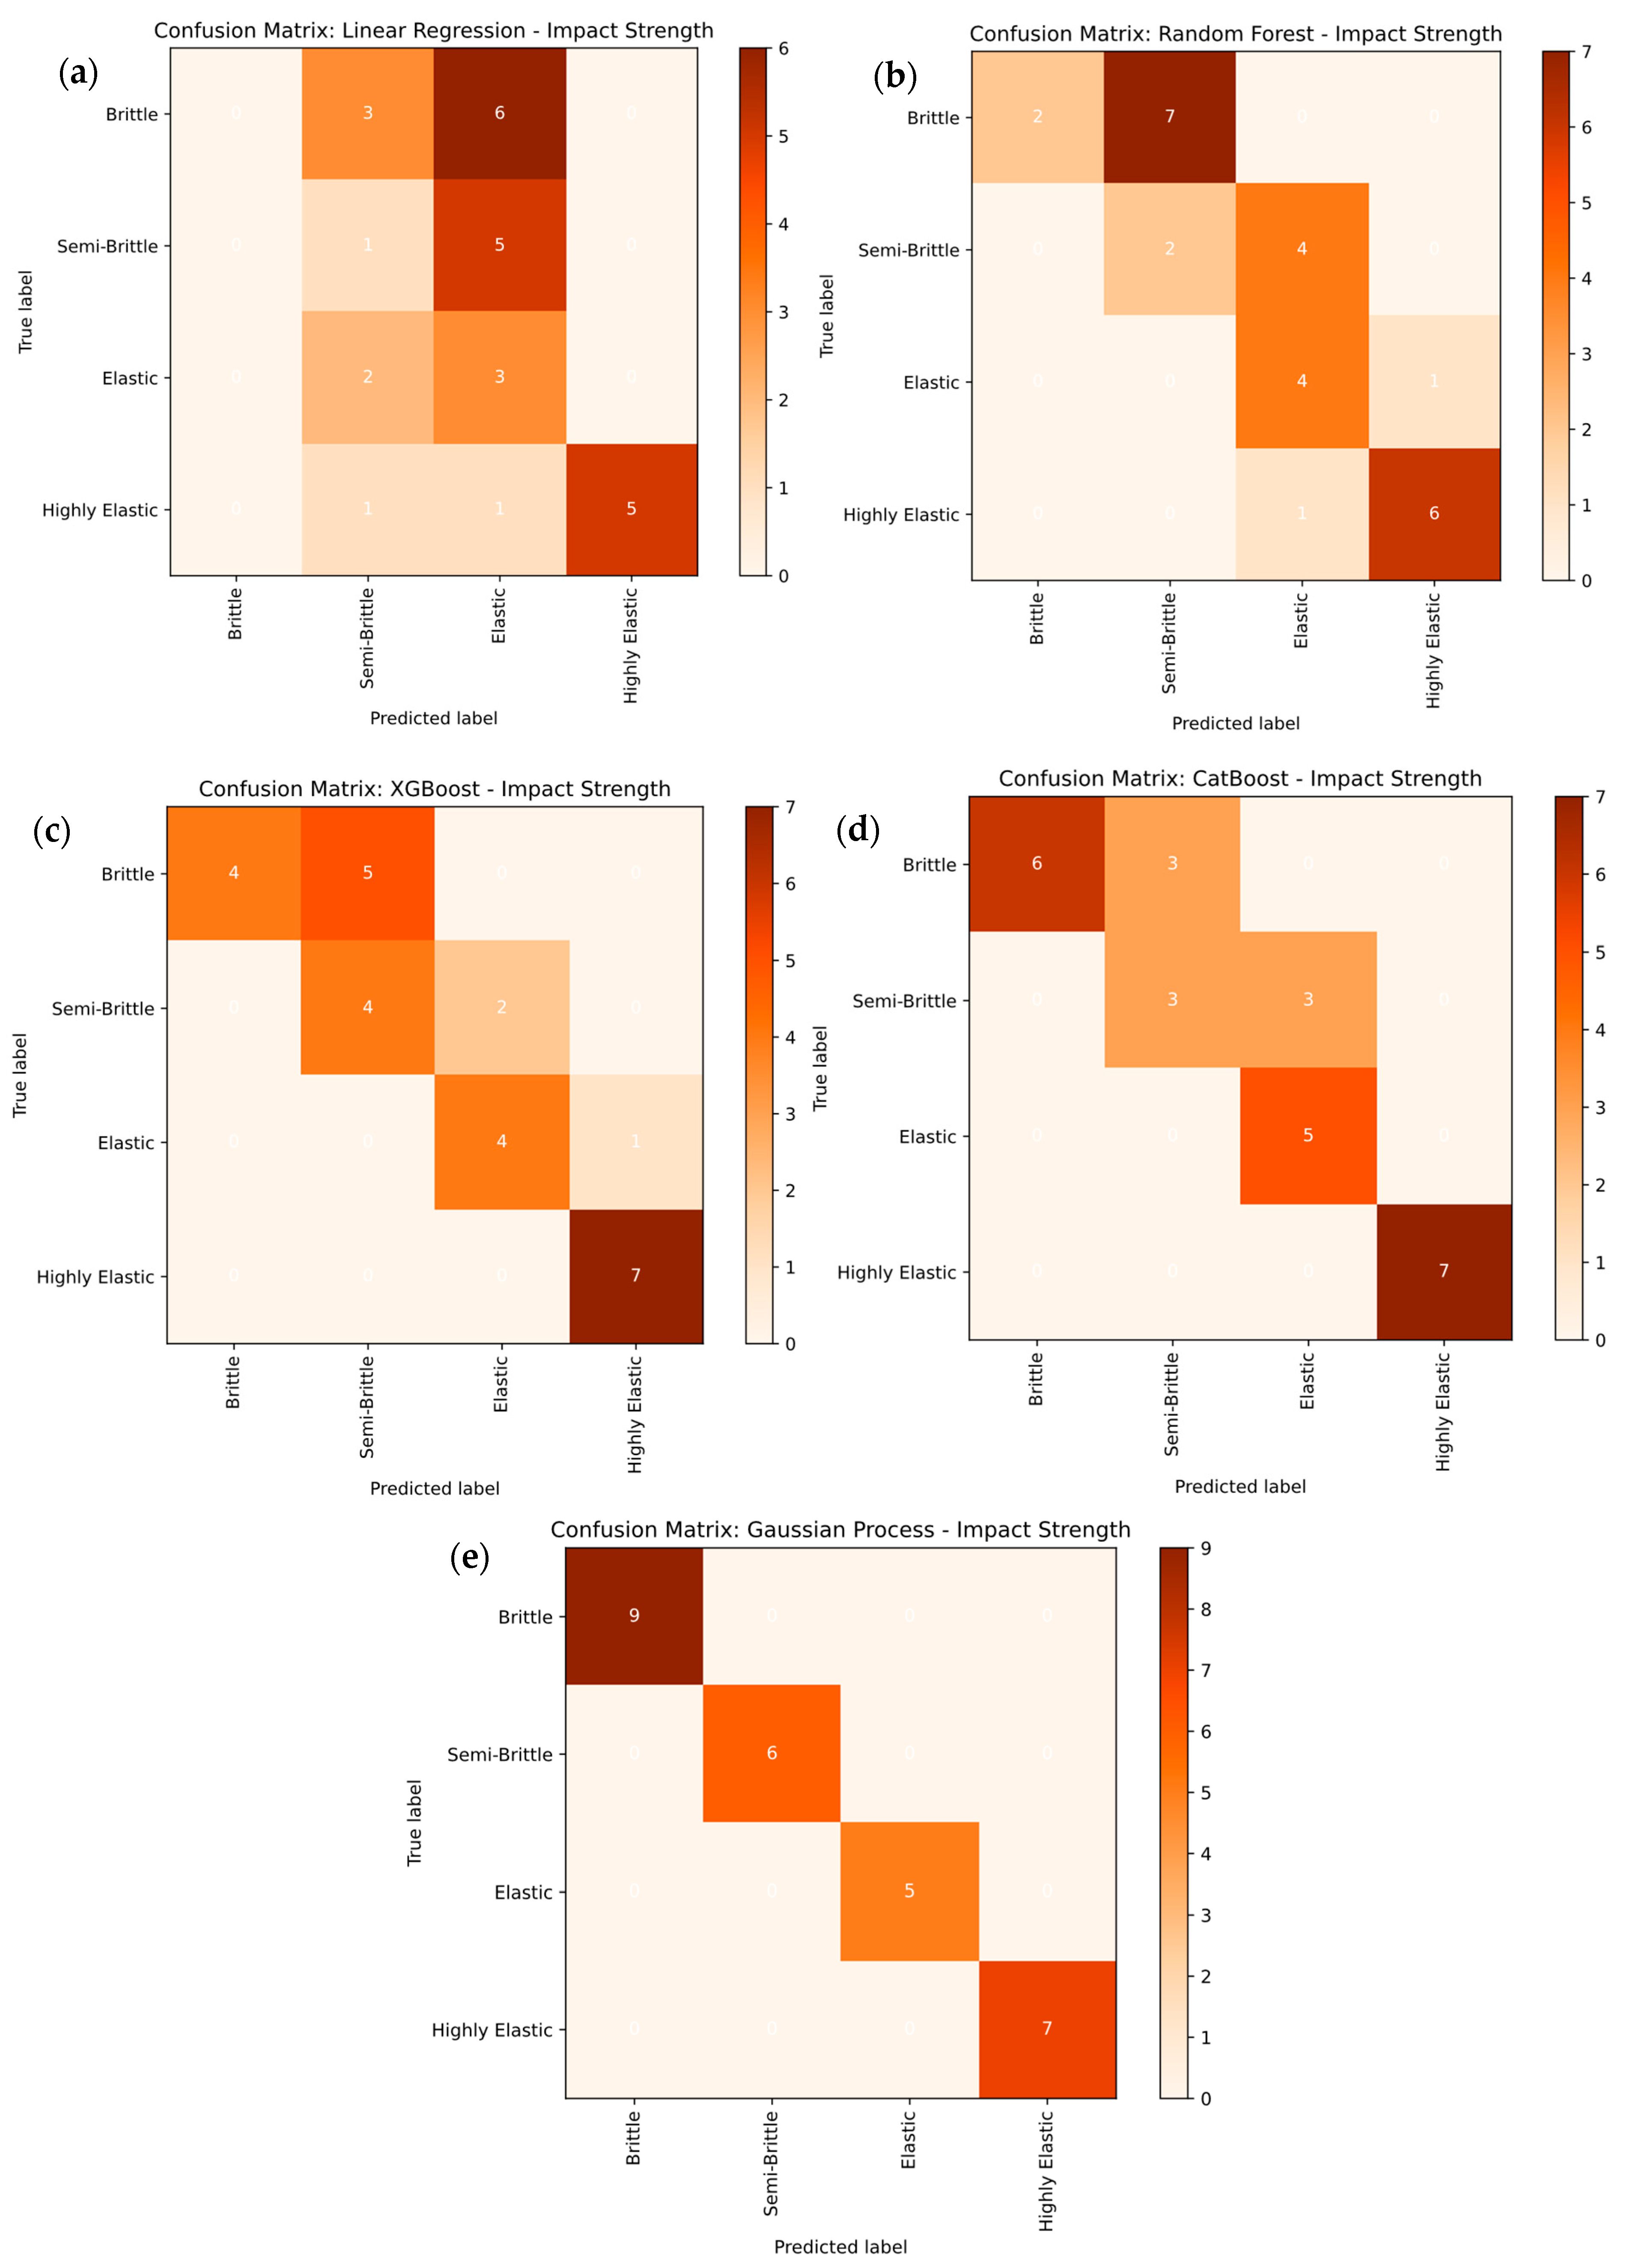
The multi-class classification breakdown in Figure 18a–e illustrates the performance of various machine learning models in classifying the impact strength categories of PLA/BNNP composites, labeled as semi-brittle, elastic, semi-elastic, and highly elastic. In Figure 18a, the linear regression model shows limited accuracy, correctly classifying eight out of 27 samples while misclassifying the remaining 19, resulting in an accuracy of 29.62%. It frequently confuses samples across multiple categories. Figure 18b presents the Random Forest model, which improves performance, with 14 correct and 13 incorrect classifications, achieving 51.85% accuracy; however, misclassifications persist among the semi-brittle, elastic, semi-elastic, and highly elastic classes. In Figure 18c, the XGBoost model demonstrates enhanced classification, achieving 85.18% accuracy, with only four misclassifications. Figure 18d shows the CatBoost model, which correctly classifies 20 out of 27 samples, corresponding to an accuracy of 74.07%, while the remaining samples are misclassified. Figure 18e illustrates the Gaussian process regression model, achieving 77.78% accuracy, with six misclassifications. Overall, these results indicate that ensemble-based and kernel-based models offer greater reliability and effectiveness in classifying impact strength behavior compared to simpler models, such as linear regression.
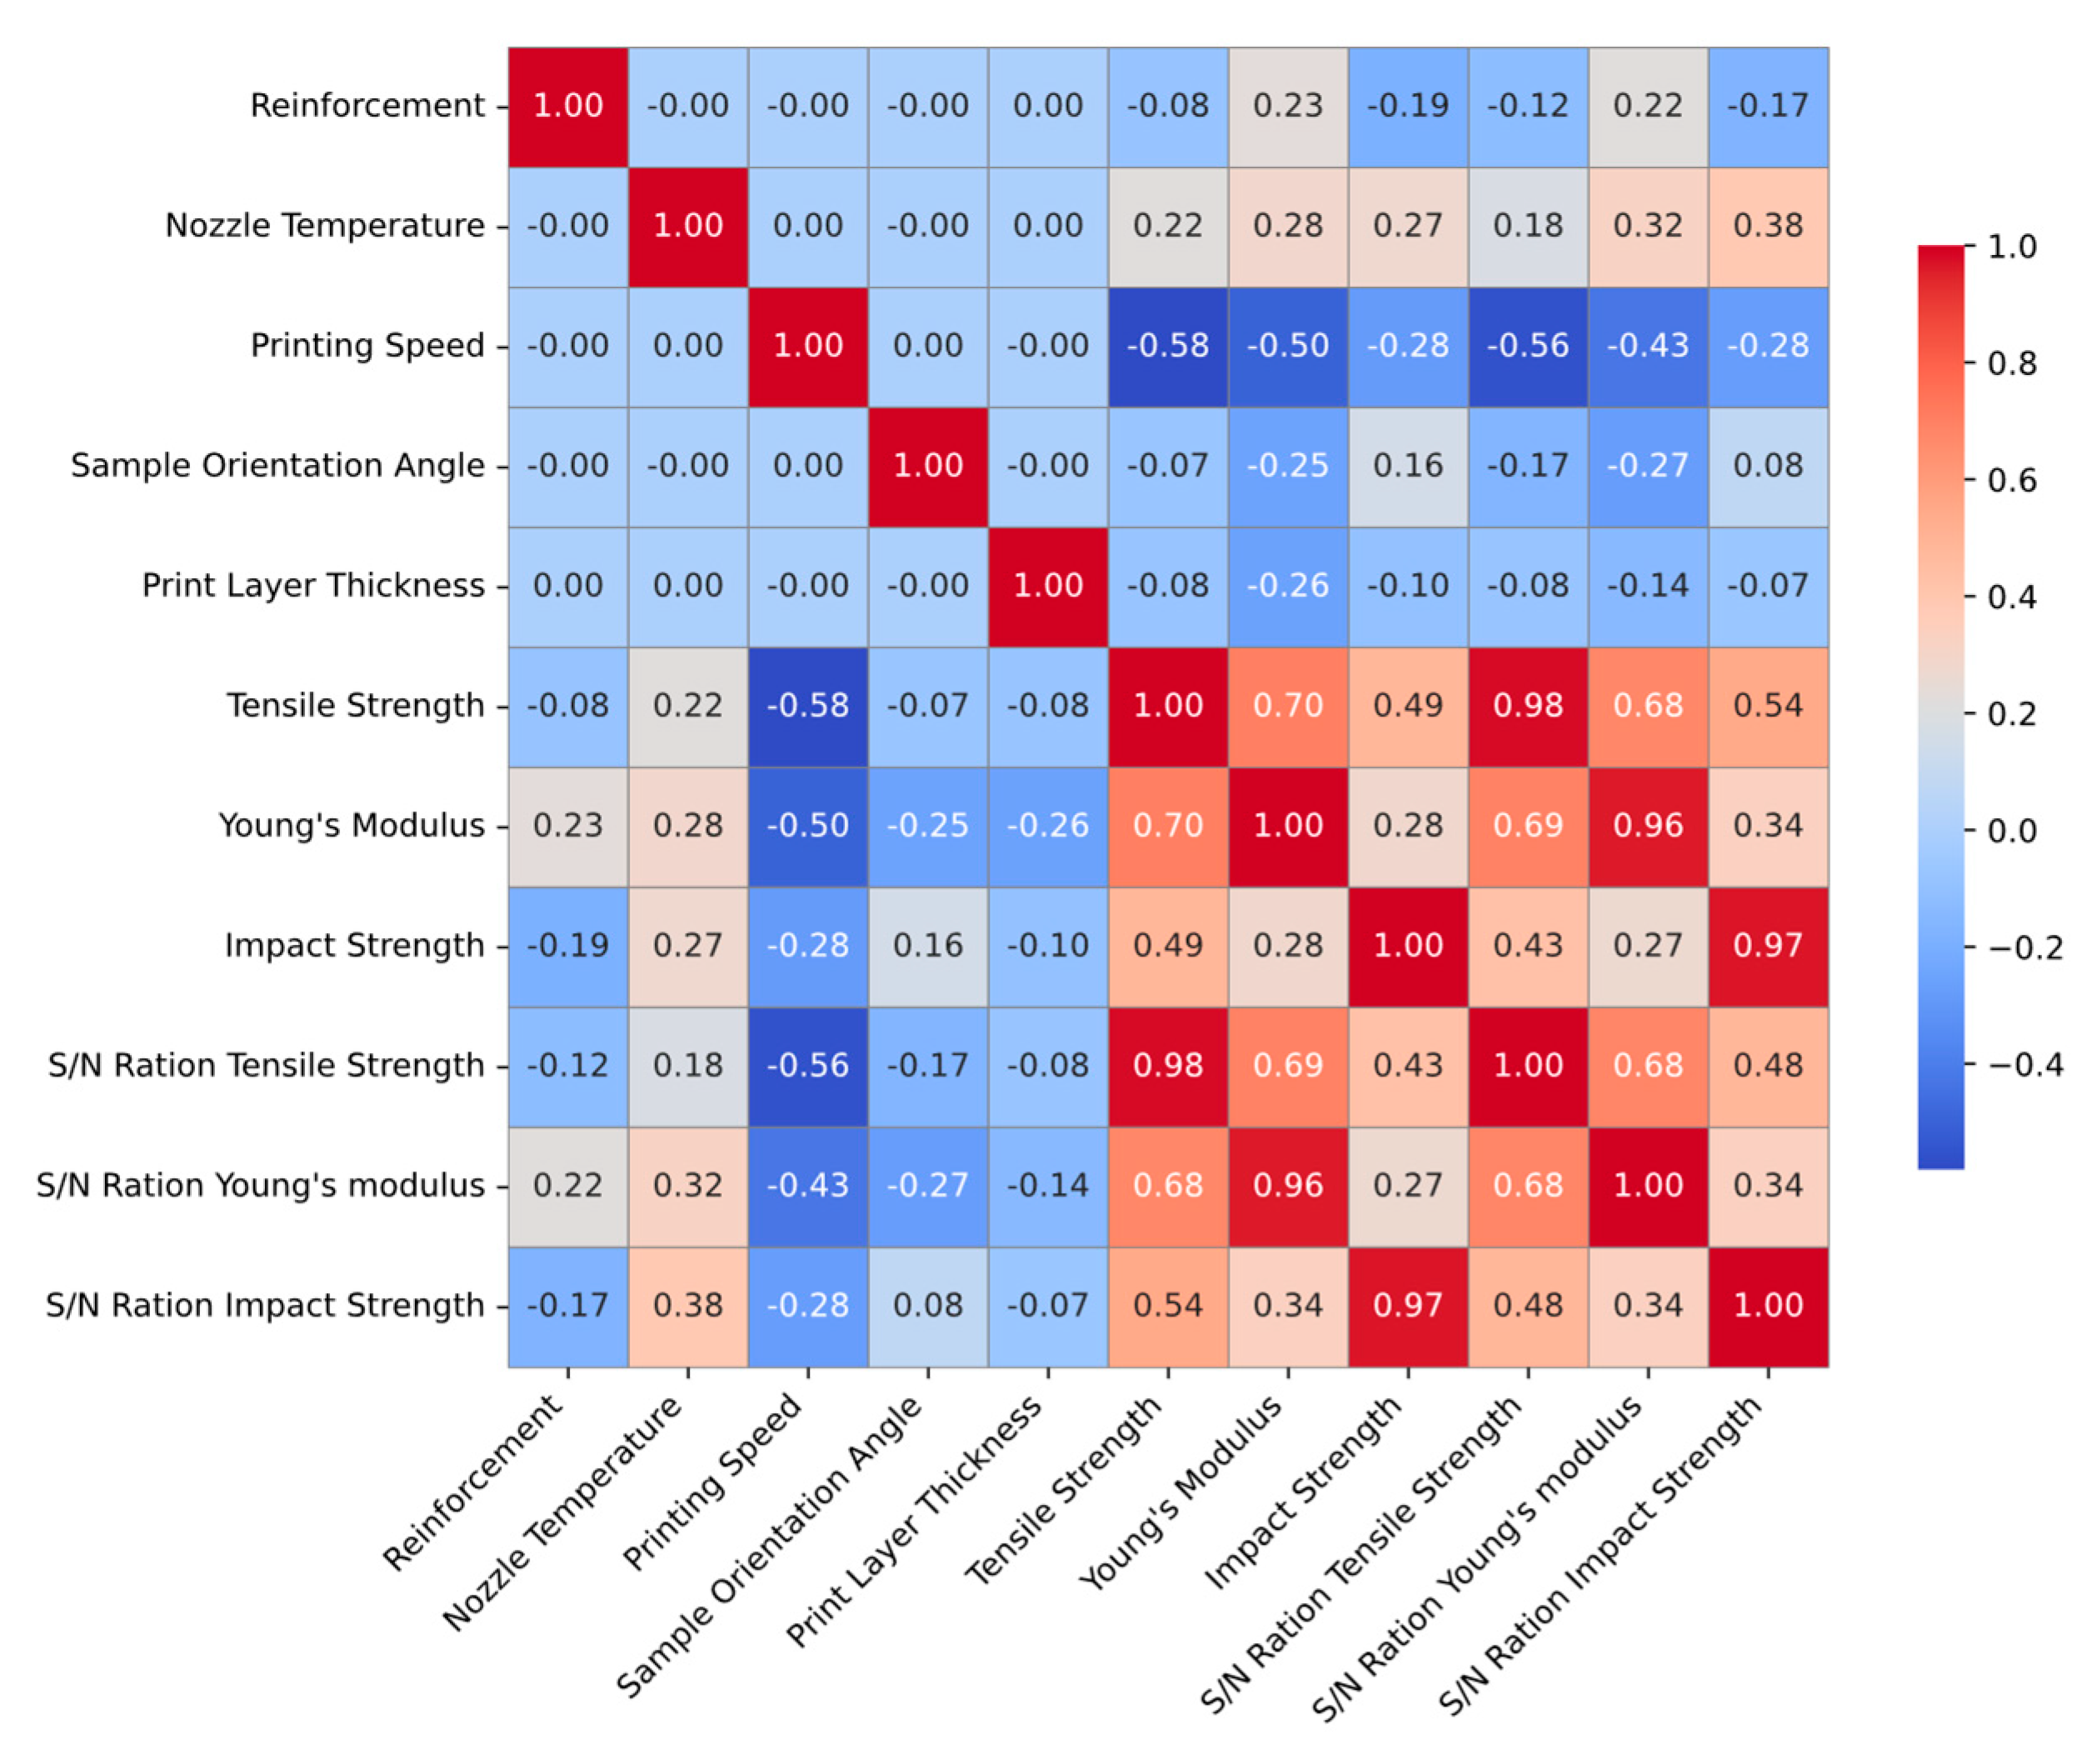
The Pearson correlation heatmap in Figure 19 illustrates the relationships between key 3D printing parameters and the mechanical properties of PLA-based composites. Tensile strength shows a strong negative correlation with printing speed (−0.58) and moderate positive correlations with nozzle temperature (0.22) and reinforcement content (0.23), indicating that slower printing speeds and optimized processing conditions enhance strength. Young’s modulus is positively correlated with tensile strength (0.70) and S/N ratios (0.96), while being negatively affected by printing speed (−0.50). Impact strength exhibits moderate correlations with tensile strength (0.49) and S/N ratios (0.97) but weak negative correlations with reinforcement (−0.19) and printing speed (−0.28). Sample orientation angle and print layer thickness have a minimal influence on all properties. The strong intercorrelations among tensile strength, Young’s modulus, and impact strength highlight the consistency of mechanical responses under varying process conditions. At the same time, the S/N ratios confirm the statistical reliability of these observed trends.

3.5. Model Evaluation by SHAP Analysis

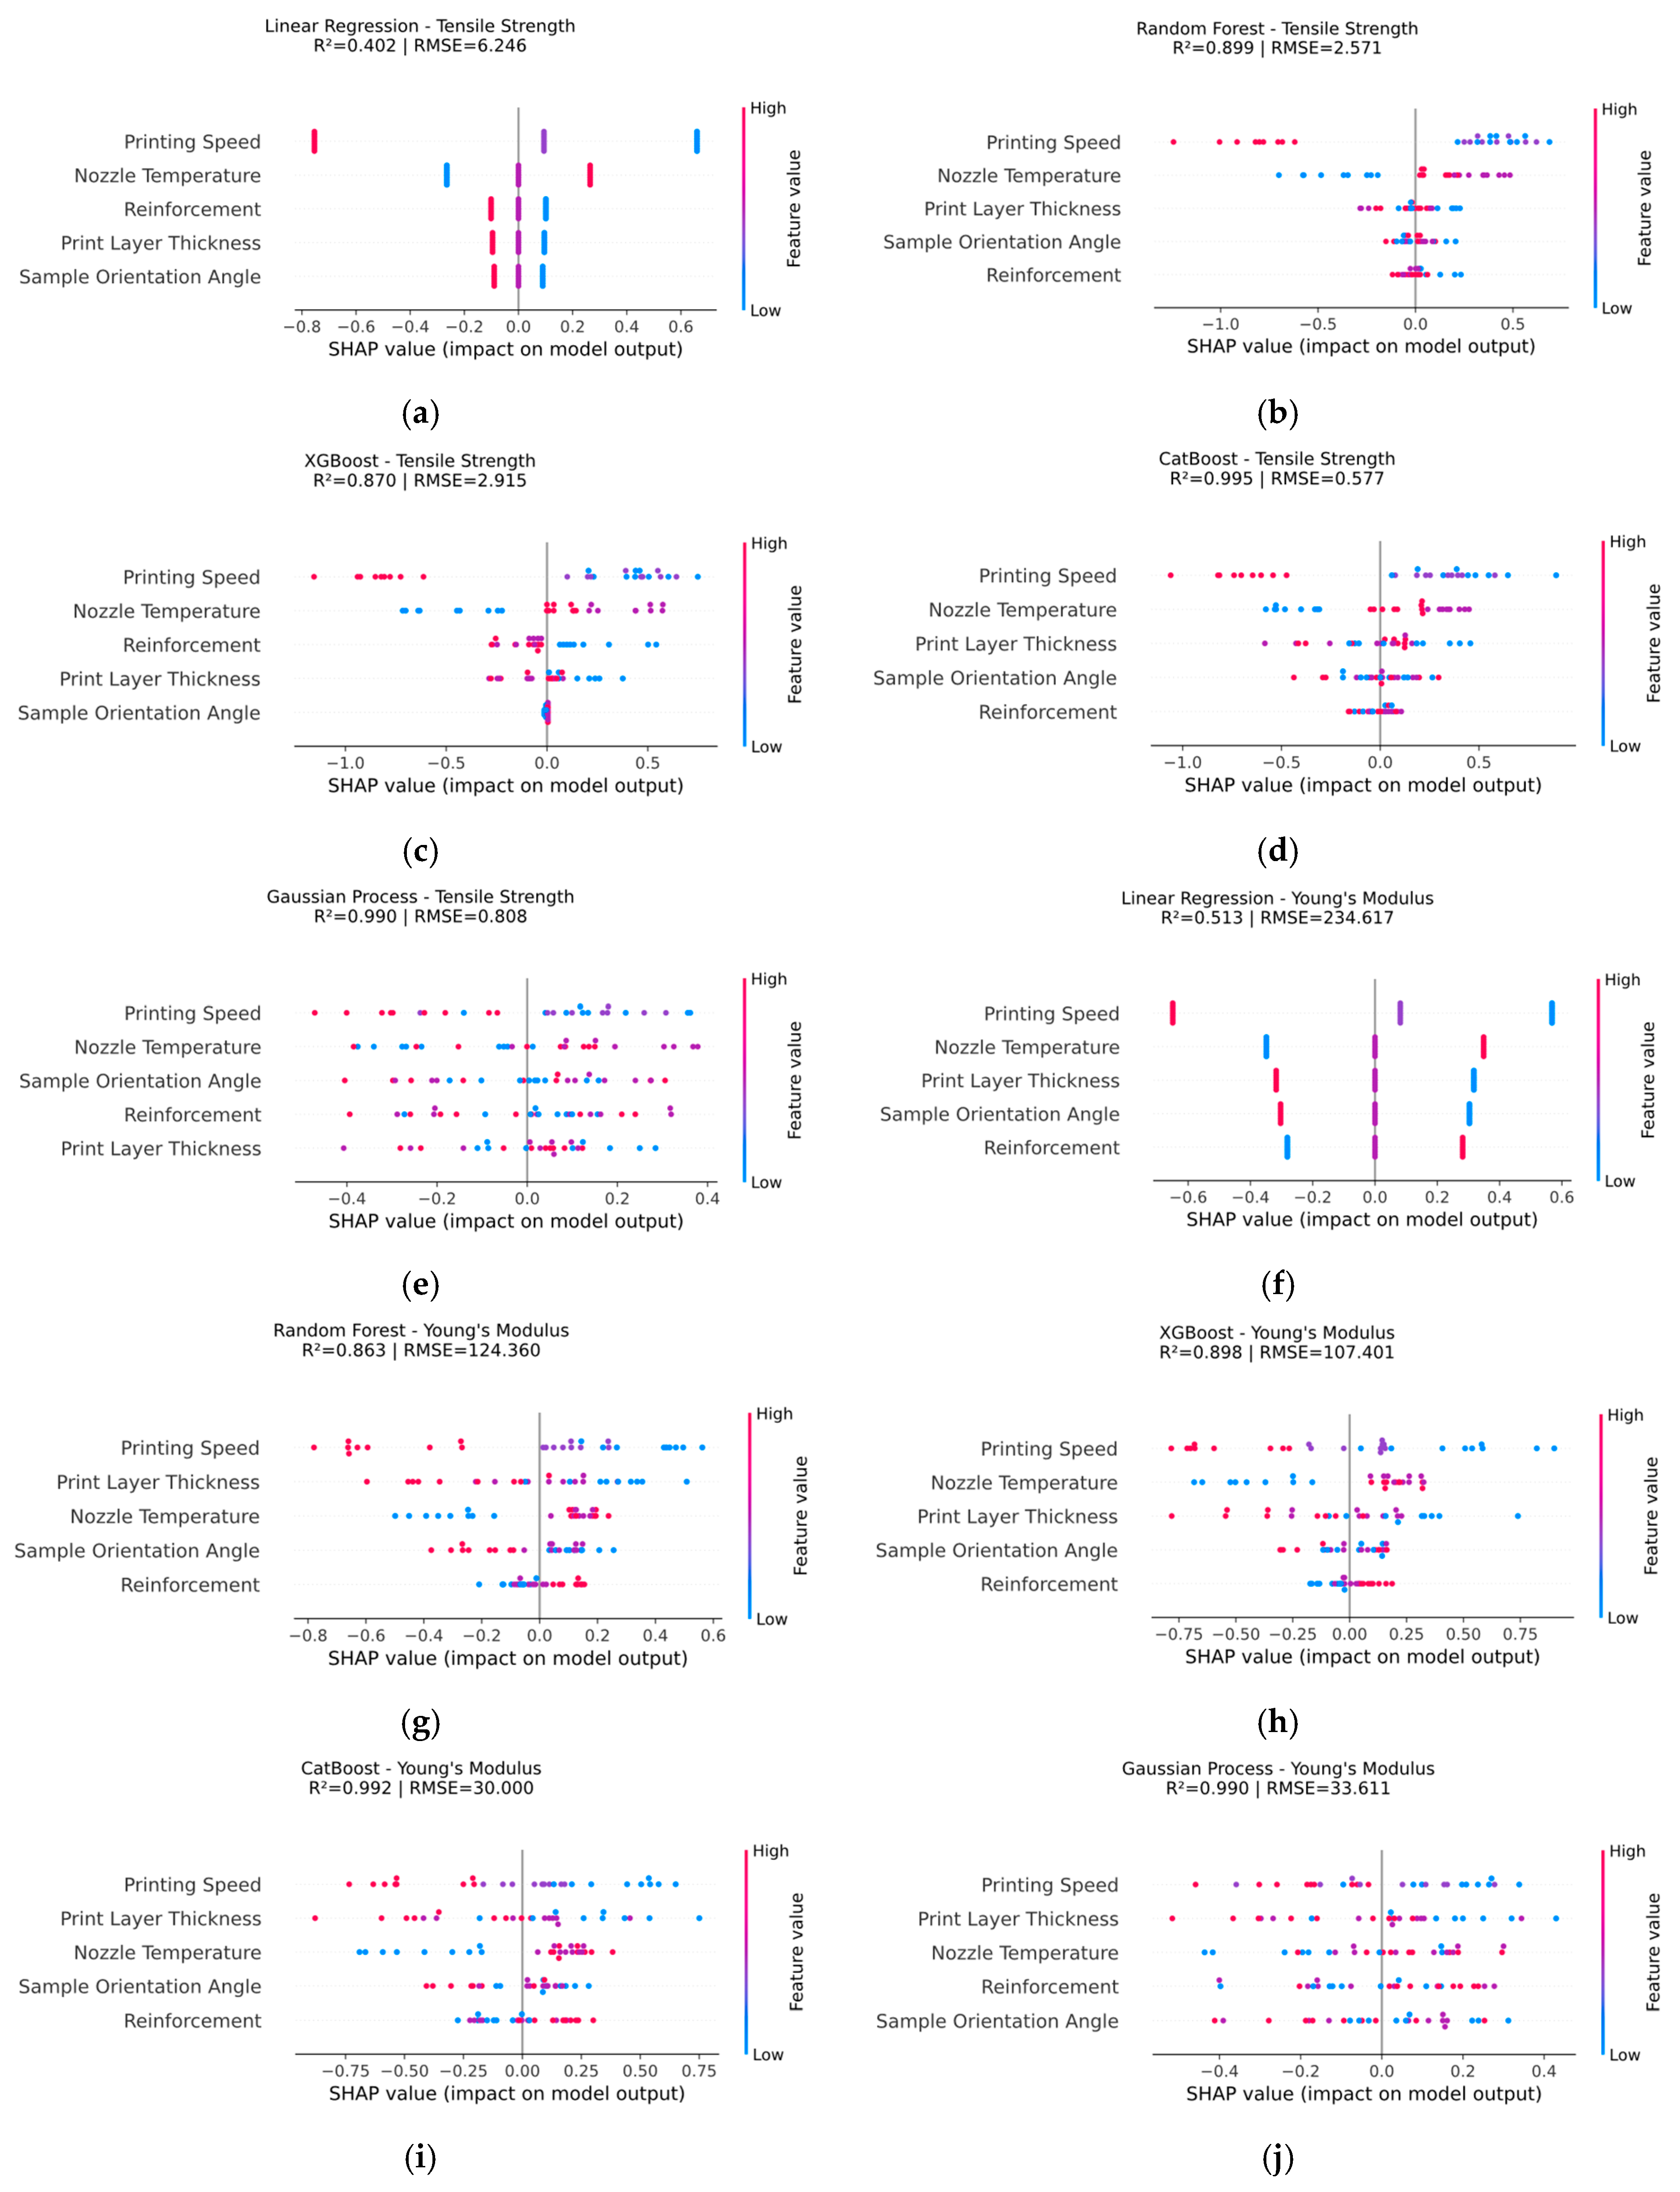
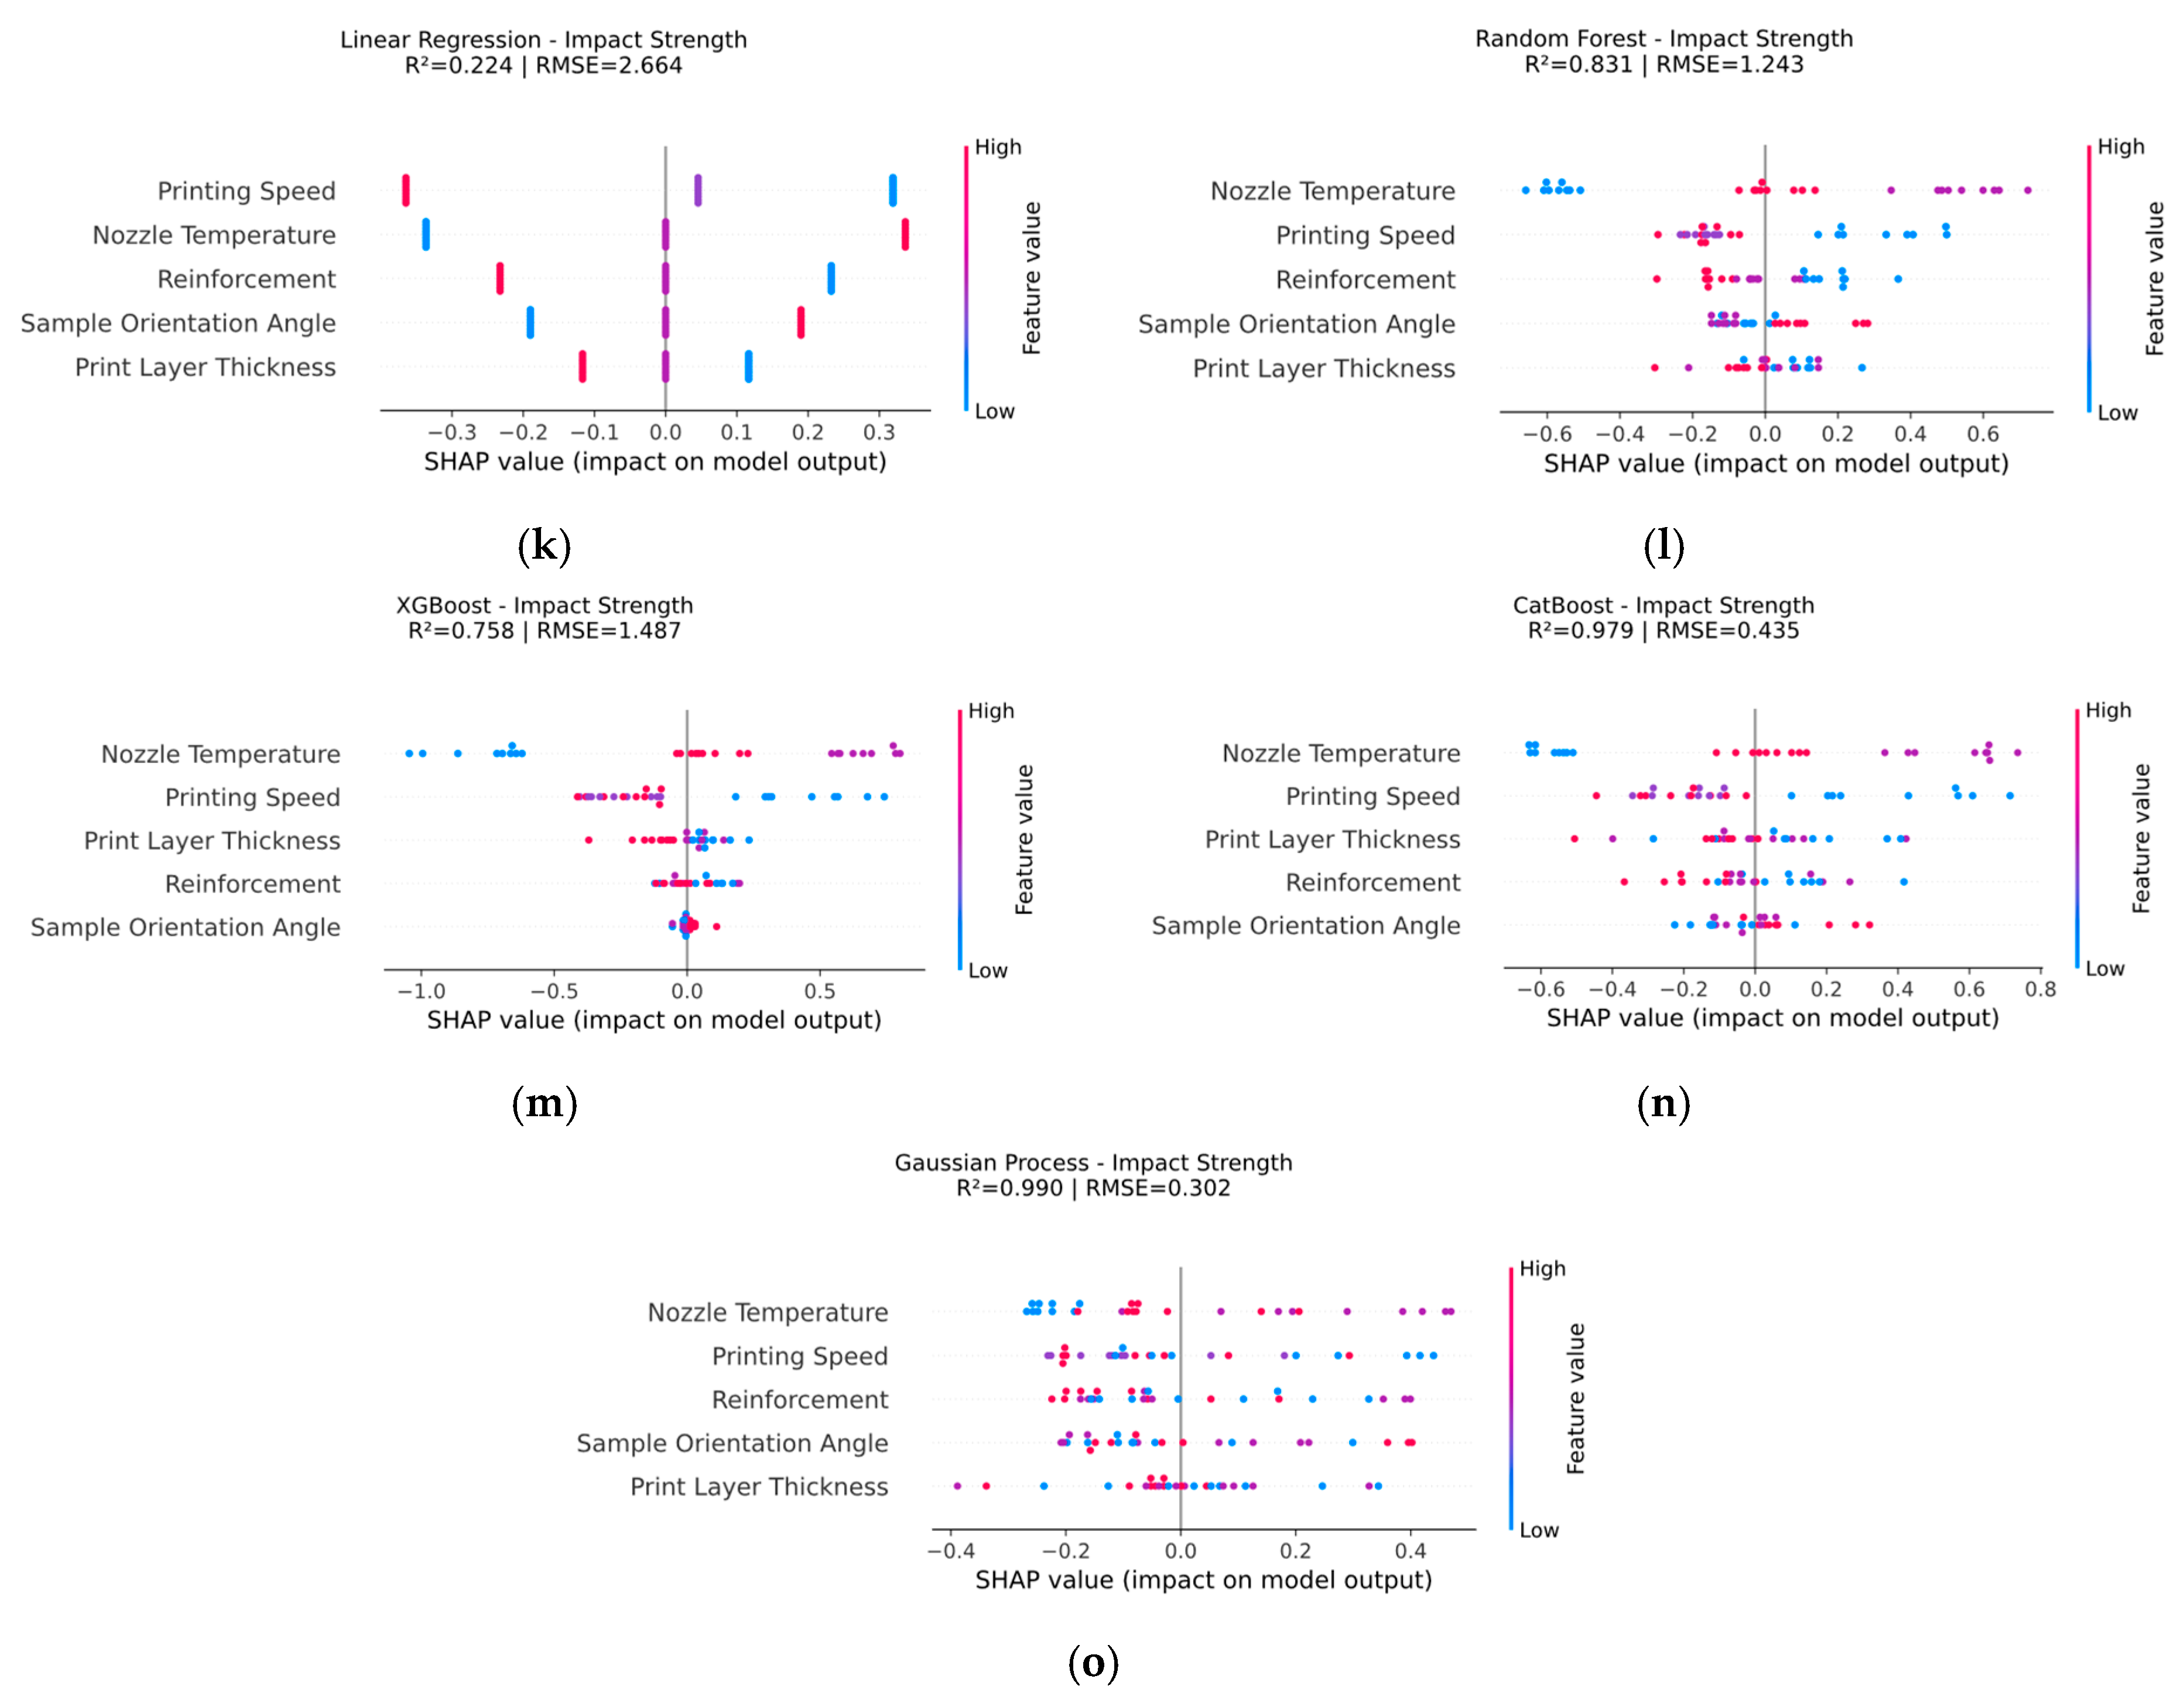
The SHAP analysis of machine learning models, including linear regression, Random Forest Regression, XGBoost, CatBoost, and Gaussian process regression, was visually represented using summary (beeswarm) plots. In these plots, each dot represents a sample, and the x-axis indicates the SHAP value. Positive values indicate an increase in the predicted property, while negative values signal a decrease. The color scale, ranging from red to blue, reflects the magnitude of the input parameter, with red representing high values and blue indicating low values. Figure 20a–e reveal that printing speed is the most influential factor affecting tensile strength across all models, with SHAP values spanning from −0.6 to +0.6. Higher printing speeds tend to reduce tensile strength, whereas lower speeds tend to enhance it. Nozzle temperature follows as the second most important factor, exhibiting nonlinear effects, with SHAP values ranging from −0.4 to +0.4. Reinforcement content is the third most significant factor, with SHAP values ranging from −0.3 to +0.3, generally improving tensile strength at higher reinforcement levels. Print layer thickness and sample orientation angle show negligible influence, with their SHAP values clustered near zero. Among the models, linear regression in Figure 20a shows small, centered SHAP values, whereas Gaussian process regression in Figure 20e demonstrates smoother but moderately larger contributions. Figure 20f–j illustrate the factors influencing Young’s modulus, with printing speed again being the dominant factor (−0.5 to +0.5). Lower printing speeds increase stiffness, while higher speeds decrease it. Nozzle temperature shows notable effects (−0.3 to +0.3), with both positive and negative impacts depending on interactions, while reinforcement content consistently exerts a positive influence, up to +0.25. Sample orientation and layer thickness again have minimal effect. Random Forest in Figure 20h captures distinct distributions of effects, while XGBoost in Figure 20i successfully models nonlinear interactions. Figure 20k–o highlight the impact of various factors on impact strength. Nozzle temperature emerges as the most critical factor, exhibiting both enhancing and diminishing effects (−0.6 to +0.6). Printing speed ranks second in importance (−0.4 to +0.4), typically reducing impact resistance at higher speeds. Reinforcement consistently contributes positively, while layer thickness and orientation have negligible effects. Linear regression in Figure 20k reveals small, centered SHAP distributions, whereas Gaussian process regression in Figure 20o exhibits smoother and broader influence patterns.

4. Conclusions

This study demonstrates substantial enhancement in the mechanical properties of 3D-printed PLA composites reinforced with boron nitride nanoplatelets (BNNP), including tensile strength, Young’s modulus, and impact strength. Utilizing the Taguchi design, ANOVA, and advanced machine learning models—CatBoost and Gaussian process regression—the experimental results were accurately predicted and interpreted through the SHAP analysis. The key observations are as follows:
  • Incorporating 0.04 wt.% BNNP led to remarkable improvements: tensile strength increased by 44.2%, Young’s modulus by 45.5%, and impact strength by over 500% compared to pure PLA.
  • Taguchi and ANOVA analyses identified printing speed and nozzle temperature as the most dominant factors for optimizing mechanical properties, while sample orientation and layer thickness had minor effects.
  • CatBoost and Gaussian process regression models consistently delivered R2 values above 0.98 and mean absolute percentage errors below 4%, outperforming linear regression, Random Forest, and XGBoost models; their reliability was confirmed through parity plots and multi-class classification breakdowns.
  • SHAP analysis reinforced the critical importance of printing speed and nozzle temperature, showing localized and global effects on predictive outputs, with SHAP values reaching up to 0.6.
The robustness and generalizability of the developed machine learning models are constrained by the limited size of the available dataset, which also increases the risk of overfitting. Future research will address these limitations by expanding the dataset, incorporating additional process parameters, and exploring comparisons with other nanofillers. This will improve model accuracy, reduce overfitting, and enhance the real-world applicability of the developed PLA/BNNP composites in advanced engineering applications such as lightweight structural components, biomedical implants, and functional prototyping, where high strength, stiffness, and durability are critical.

Supplementary Materials

The following supporting information can be downloaded at https://www.mdpi.com/article/10.3390/machines13100949/s1, Figure S1: Main effect plots for (a) S/N ratio and (b) mean response to tensile strength. Figure S2: Main effect plots for (a) the S/N ratio and (b) the mean response to Young’s modulus. Figure S3: Main effect plots for (a) the S/N ratio and (b) the mean response to tensile strength; Table S1: Response of signal-to-noise ratio for Tensile strength; Table S2: Response of Mean for Tensile Strength, Table S3: Response of Signal-to-Noise ratio for Young’s modulus, Table S4: Response of Mean for Young’s Modulus, Table S5: Response of Signal-to-Noise Ratio for Impact Strength, Table S6: Response of Mean for Impact Strength.

Author Contributions

Conceptualization, S.H. and S.K.S.; methodology, S.H. and S.K.S.; software, S.H., N.H.A., and S.K.S.; validation, N.H.A., B.L., P.S.R.S., and S.K.S.; formal analysis, N.H.A., B.L., P.S.R.S., and S.K.S.; investigation, N.H.A., B.L., P.S.R.S., and S.K.S.; resources, S.K.S.; data curation, N.H.A., B.L., P.S.R.S., and S.K.S.; writing—original draft preparation, S.H.; writing—review and editing, N.H.A., B.L., P.S.R.S., and S.K.S.; visualization, N.H.A., B.L., P.S.R.S., and S.K.S.; supervision, S.K.S. All authors have read and agreed to the published version of the manuscript.

Funding

This work was supported and funded by the Deanship of Scientific Research at Imam Mohammad Ibn Saud Islamic University (IMSIU) (grant number IMSIU-DDRSP2503).

Data Availability Statement

The original contributions presented in this study are included in the article; further inquiries can be directed to the corresponding authors upon reasonable request.

Conflicts of Interest

The authors declare no conflicts of interest.

Abbreviations

The following abbreviations are used in this manuscript:
PLAPolylactic acid
BNNPBoron nitride nanoplatelets
FDMFused deposition modeling
wt.%Weight percent
ANOVAAnalysis of variance
MLMachine learning
GPRGaussian process regression
SHAPShapley Additive Explanations
TEMTransmission electron microscopy
UTMUniversal Testing Machine
DOEDesign of Experiments
S/NSignal-to-noise
MSEMean squared error
RMSERoot mean square error
MAEMean absolute error
MAPEMean absolute percentage error
RFRRandom Forest Regression
XGBoostExtreme Gradient Boosting
CBRCatBoost Regression
RBFRadial Basis Function

References

  1. Islam, M.A.; Mobarak, M.H.; Rimon, M.I.H.; Al Mahmud, M.Z.; Ghosh, J.; Ahmed, M.M.S.; Hossain, N. Additive manufacturing in polymer research: Advances, synthesis, and applications. Polym. Test. 2024, 132, 108364. [Google Scholar] [CrossRef]
  2. Blasiak, S.; Bochnia, J.; Takosoglu, J.; Kozior, T.; Nowakowski, L.; Skrzyniarz, M.; Krzysztofik, I.; Blasiak, M.; Dindorf, R.; Wos, P. 3D/4D Printing in Advanced Robotics Systems—Recent Developments and Applications. Sustainability 2024, 16, 11174. [Google Scholar]
  3. Alzyod, H.; Kónya, G.; Ficzere, P. Integrating Additive and Subtractive Manufacturing to Optimize Surface Quality of MEX Parts. Results Eng. 2025, 25, 103713. [Google Scholar]
  4. Raja, M.; Krishnan, S.G.; Harish, J.S. The future of 3D printing in manufacturing (innovative technology revolutionizing manufacturing processes and products). Int. J. Sci. Res. Eng. Manag. 2024, 8, 1–6. [Google Scholar]
  5. Herranz, G.; Berges, C.; Hidalgo, J. Material Extrusion Additive Technologies: Benefits, Challenges, and Niche Applications. In Additive Manufacturing—Present and Sustainable Future, Materials and Applications; IntechOpen: London, UK, 2025. [Google Scholar]
  6. Prashar, G.; Vasudev, H. Additive Manufacturing. In Advanced Manufacturing Processes; CRC Press: Boca Raton, FL, USA, 2025; pp. 1–8. [Google Scholar]
  7. Elhady, S.; Ellatif, I.A.B.D.; Abdelrahman, K.M.; Mostaf, A.S.; Fahim, I.S. Innovations in 3D Printing-Assisted Biopolymers for Biomedical Applications. In Sustainable 3D Printing for Innovative Biopolymer Production and Applications; Sharma, B., Pani, B., Shekhar, S., Okolie, J.A., Eds.; Wiley: Hoboken, NJ, USA, 2025; pp. 95–116. [Google Scholar]
  8. Rogachuk, B.E.; Okolie, J.A. Economic and Environmental Assessment of Sustainable Polymer-Based 3D Printing. In Sustainable 3D Printing for Innovative Biopolymer Production and Applications; Sharma, B., Pani, B., Shekhar, S., Okolie, J.A., Eds.; Wiley: Hoboken, NJ, USA, 2025; pp. 233–243. [Google Scholar]
  9. Liu, H. Research Progress in the Synthesis and Modification of Polylactic Acid. Highlights Sci. Eng. Technol. 2024, 84, 35–41. [Google Scholar] [CrossRef]
  10. Kaptan, A.; Kartal, F. Advancements in Polylactic Acid Research: From Material Properties to Sustainable Applications. Eur. Mech. Sci. 2024, 8, 104–114. [Google Scholar] [CrossRef]
  11. Khamvongsa, M.; Milton, K.; Faisal, T.R. Mechanical Characterization of Low-Cost 3D FDM Printed Scaffolds Fabricated with Synthesized PLA/HA Bio-Composite Filament. Ann. 3D Print. Med. 2025, 18, 100194. [Google Scholar]
  12. Arunkumar, P.; Balaji, D.; Radhika, N.; Rajeshkumar, L.; Mavinkere Rangappa, S.; Siengchin, S. Effect of Infill Pattern on Mechanical Properties of 3D Printed PLA-Zn Composites for Drone Frame Structures: A Topology Optimization Integrated Application Study. Results Eng. 2025, 25, 104107. [Google Scholar] [CrossRef]
  13. Firoz, A.B.; Rybakov, V.; Fetisova, A.A.; Shlapakova, L.E.; Pariy, I.O.; Toropkov, N.; Lozhkomoev, A.S.; Mukhortova, Y.R.; Sharonova, A.A.; Wagner, D.V.; et al. 3D-Printed Biodegradable Composite Poly(Lactic Acid)-Based Scaffolds with a Shape Memory Effect for Bone Tissue Engineering. Adv. Compos. Hybrid Mater. 2025, 8, 95. [Google Scholar]
  14. Bakhtiari, A.; Madaah Hosseini, H.R.; Alizadeh, R.; Mohammadi, M.; Zarei, M. Enhancing Mechanical and Biological Properties of 3D-Printed Polylactic Acid Scaffolds by Graphitic Carbon Nitride Addition for Bone Tissue Engineering. J. Mater. Res. Technol. 2025, 35, 308–316. [Google Scholar] [CrossRef]
  15. Mohammed, O.K.; Hassani, A.; Zolfaghari, A.; Diwan, A.A. Mechanical Performance of 3D Printed Polylactic Acid/MWCNT Brackets: Effects of CNT Concentration and Printing Orientation on Stress-Strain Behavior and Deflection Characteristics. Int. J. Eng. 2025, 38, 1782–1792. [Google Scholar] [CrossRef]
  16. Nataraj, G.; Babu, S.R. Enhancing mechanical properties of PLA-based bio composite filament reinforced with horse gram filler for 3D printing applications. J. Vinyl Addit. Technol. 2025, 31, 453–468. [Google Scholar] [CrossRef]
  17. Jasiński, W.; Szymanowski, K.; Nasiłowska, B.; Barlak, M.; Betlej, I.; Prokopiuk, A.; Borysiuk, P. 3D Printing Wood–PLA Composites: The Impact of Wood Particle Size. Polymers 2025, 17, 1165. [Google Scholar] [CrossRef]
  18. Mishra, D.K.; Giri, J.; Sathish, T.; Kanan, M.; Prajapati, D. Influence of 3D printing process parameters on mechanical properties of PLA-based ceramic composite parts. Results Eng. 2025, 25, 104488. [Google Scholar] [CrossRef]
  19. Li, H.; Yu, Z.; Liu, B.; Gao, Y.; Liu, M.; Zhang, J.; Zhu, Y.; Chen, S.; Yu, B.; Wang, B. A Highly Ductile Composite of 3D-Printed Poly (Lactic Acid) With InSe Particles and Flakes as a Filler. SmartMat 2025, 6, e1316. [Google Scholar] [CrossRef]
  20. Neto, T.S.; Maia, L.S.; Zanata, L.; Conceição, M.O.; Medeiros, S.F.; Faria, M.I.S.; Mulinari, D.R. A promising pullulan/PLA composite: Influence of pullulan on the scaffolds’ morphology constructed by 3D printing. J. Appl. Polym. Sci. 2025, 142, e56389. [Google Scholar] [CrossRef]
  21. Koyunbakan, M.; Uslugil, Y.; Ekrem, M.; Eser, Ü. Investigation of the mechanical properties of aramid fiber-reinforced hybrid nanocomposites with BNNP-enhanced epoxy matrix. Compos. Interfaces 2025, 1–17. [Google Scholar] [CrossRef]
  22. Rasul, M.G.; Kiziltas, A.; Arfaei, B.; Shahbazian-Yassar, R. 2D boron nitride nanosheets for polymer composite materials. NPJ 2D Mater. Appl. 2021, 5, 56. [Google Scholar] [CrossRef]
  23. Badgayan, N.D.; Sahu, S.K.; Samanta, S.; Sreekanth, P.S.R. Assessment of bulk mechanical properties of HDPE hybrid composite filled with 1D/2D nanofiller system. Mater. Sci. Forum 2018, 917, 12–16. [Google Scholar] [CrossRef]
  24. Alahmad, H.; Alamir, R.; Asadzadeh, M.; Daood, U.; Qasim, S.S.B. Enhancing PMMA properties: A comprehensive study of nanographene oxide and Boron nitride impact through In-Vitro analysis. BMC Oral Health 2025, 25, 659. [Google Scholar] [CrossRef] [PubMed] [PubMed Central]
  25. Auffray, L.; Gouge, P.-A.; Hattali, L. Design of experiment analysis on tensile properties of PLA samples produced by fused filament fabrication. Int. J. Adv. Manuf. Technol. 2022, 118, 4123–4137. [Google Scholar] [CrossRef]
  26. Mishra, V.; Negi, S.; Bharat, N.; Veeman, D.; Kumar, V. Effect of FFF parameters on PLA/WD composite properties: Comparative analysis using Taguchi and GRA approach. J. Reinf. Plast. Compos. 2025, 44, 1314979. [Google Scholar] [CrossRef]
  27. Vidakis, N.; Petousis, M.; Mountakis, N.; Papadakis, V.M. Glass Fillers in Three Different Forms Used as Reinforcement Agents of Polylactic Acid in Material Extrusion Additive Manufacturing. Appl. Sci. 2023, 13, 6471. [Google Scholar] [CrossRef]
  28. Tosto, C.; Pergolizzi, E.; Vitiello, L.; Filippone, G.; Cicala, G. Production of PLA-milled carbon fiber (MCF) filled filaments for Fused Filament Fabrication (FFF) printing. Macromol. Symp. 2022, 404, 2100417. [Google Scholar]
  29. Sapre, M.; Jatti, A.V.; Khedkar, N.K.; Jatti, V.S. Mechanical Properties of 3D-Printed Components Using Fused Deposition Modeling: Optimization Using the Desirability Approach and Machine Learning Regressor. Appl. Syst. Innov. 2022, 5, 112. [Google Scholar] [CrossRef]
  30. Daly, M.; Tarfaoui, M.; Chihi, M.; Bouraoui, C. FDM technology and the effect of printing parameters on the tensile strength of ABS parts. Int. J. Adv. Manuf. Technol. 2023, 126, 5307–5323. [Google Scholar] [CrossRef]
  31. Hemanth, R.; Sekar, M.; Suresha, B. Effects of fibers and fillers on mechanical properties of thermoplastic composites. Indian J. Adv. Chem. Sci. 2014, 2, 28–35. [Google Scholar]
  32. Uddin, M.S.; Sidek, M.F.R.; Faizal, M.A.; Ghomashchi, R.; Pramanik, A. Evaluating Mechanical Properties and Failure Mechanisms of Fused Deposition Modeling Acrylonitrile Butadiene Styrene Parts. J. Manuf. Sci. Eng. 2017, 139, 081018. [Google Scholar] [CrossRef]
  33. Ul-Hamid, A. Synthesis, microstructural characterization and nanoindentation of Zr, Zr-nitride and Zr-carbonitride coatings deposited using magnetron sputtering. J. Adv. Res. 2021, 29, 107–119. [Google Scholar]
  34. Pernica, J.; Vodák, M.; Šarocký, R.; Šustr, M.; Dostál, P.; Cerny, M.; Dobrocky, D. Mechanical Properties of Recycled Polymer Materials in Additive Manufacturing. Manuf. Technol. 2022, 22, 200–203. [Google Scholar] [CrossRef]
  35. Boangmanalu, E.P.D.; Pratama, A.B.; Qadry, A.; Saragi, J.F.H.; Sinaga, F.T.H. Charpy and Izod Method Impak Strength Analysis on ST 37 Steel with Temperature Variations. J. Sci. Technol. 2023, 2, 7074. [Google Scholar]
  36. Kacem, M.A.; Zekri, A.; Ben Ouada, A.; Abderrazek, H.; Smaoui, N.; El Cafsi, M.; Bouhamed, A. Development and 3D printing of PLA bio-composites reinforced with short yucca fibers and enhanced thermal and dynamic mechanical performance. J. Mater. Res. Technol. 2025, 36, 1243–1258. [Google Scholar] [CrossRef]
  37. Mecha, P.; Zhu, R.; Zhang, J.; Awuah, E.; Soomro, S.A.; Chen, K. Optimization of chanterelle mushroom drying kinetics under heat pump dryer using Taguchi design method. Int. J. Agric. Biol. Eng. 2024, 16, 273–279. [Google Scholar] [CrossRef]
  38. Ong, N.R. Use of Taguchi Method-Based Design of Experiments (DOE) in the Optimization of the Drilling Parameters of Structural A572 Steel. Int. J. Adv. Mech. Eng. 2023, 13, 578. [Google Scholar]
  39. Zheng, M.; Wen, Q.; Xu, F.; Wu, D. Regional Forest Carbon Stock Estimation Based on Multi-Source Data and Machine Learning Algorithms. Forests 2025, 16, 420. [Google Scholar] [CrossRef]
  40. Khalfa, M.A.; Manai, L.; Mchara, W. Advanced artificial intelligence model for solar irradiance forecasting for solar electric vehicles. Int. J. Dyn. Control 2025, 13, 101. [Google Scholar]
  41. Sundarasetty, H.; Sahu, S.K. Tribological behavior of PLA reinforced with boron nitride nanoparticles using Taguchi and machine learning approaches. Results Eng. 2025, 26, 104772. [Google Scholar] [CrossRef]
  42. Yang, L.; Shen, D. Algebraic and Statistical Properties of the Partially Regularized Ordinary Least Squares Interpolator. arXiv 2024, arXiv:2411.06593. [Google Scholar] [CrossRef]
  43. Liu, T.; Sun, Y.; Han, H.; Wu, G.; Zhang, X.; Ren, W.; Chen, Y.; Li, Z. Identification of the primary pollution sources and dominant influencing factors of soil heavy metals using a random forest model optimized by genetic algorithm coupled with geodetector. Ecotoxicol. Environ. Saf. 2025, 290, 117731. [Google Scholar] [CrossRef] [PubMed]
  44. Gao, F.; Xie, J.; Xiong, X.; Wang, L.; Chang, X. Prediction of peak particle vibration velocity based on intelligent optimization algorithm combined with XGBoost. Expert Syst. Appl. 2025, 280, 127654. [Google Scholar] [CrossRef]
  45. Li, X.; Wang, Q.; Du, D.; Yu, Z.; Ma, T.; Liang, Q. A Fusion XGBoost Approach for Large-Scale Monitoring of Soil Heavy Metal in Farmland Using Hyperspectral Imagery. Agronomy 2025, 15, 676. [Google Scholar] [CrossRef]
  46. Zhang, B.; Xu, C.; Dai, X.; Xiong, X. Research on mining land subsidence by intelligent hybrid model based on gradient boosting with categorical features support algorithm. J. Environ. Manag. 2024, 354, 120309. [Google Scholar] [CrossRef] [PubMed]
  47. Dalmasso, M.; Civera, M.; De Biagi, V.; Chiaia, B. Gaussian Process Regression (GPR)-based missing data imputation and its uses for bridge structural health monitoring. Appl. Biomater. Eng. Nanotechnol. 2025, 6, 23. [Google Scholar] [CrossRef]
  48. Zhang, X.; Sun, X.; Lin, Z. Improving soil moisture prediction using Gaussian process regression. Smart Agric. Technol. 2025, 11, 100905. [Google Scholar] [CrossRef]
  49. Ponce-Bobadilla, A.V.; Schmitt, V.; Maier, C.S.; Mensing, S.; Stodtmann, S. Practical guide to SHAP analysis: Explaining supervised machine learning model predictions in drug development. Clin. Transl. Sci. 2024, 17, e70056. [Google Scholar] [CrossRef] [PubMed]
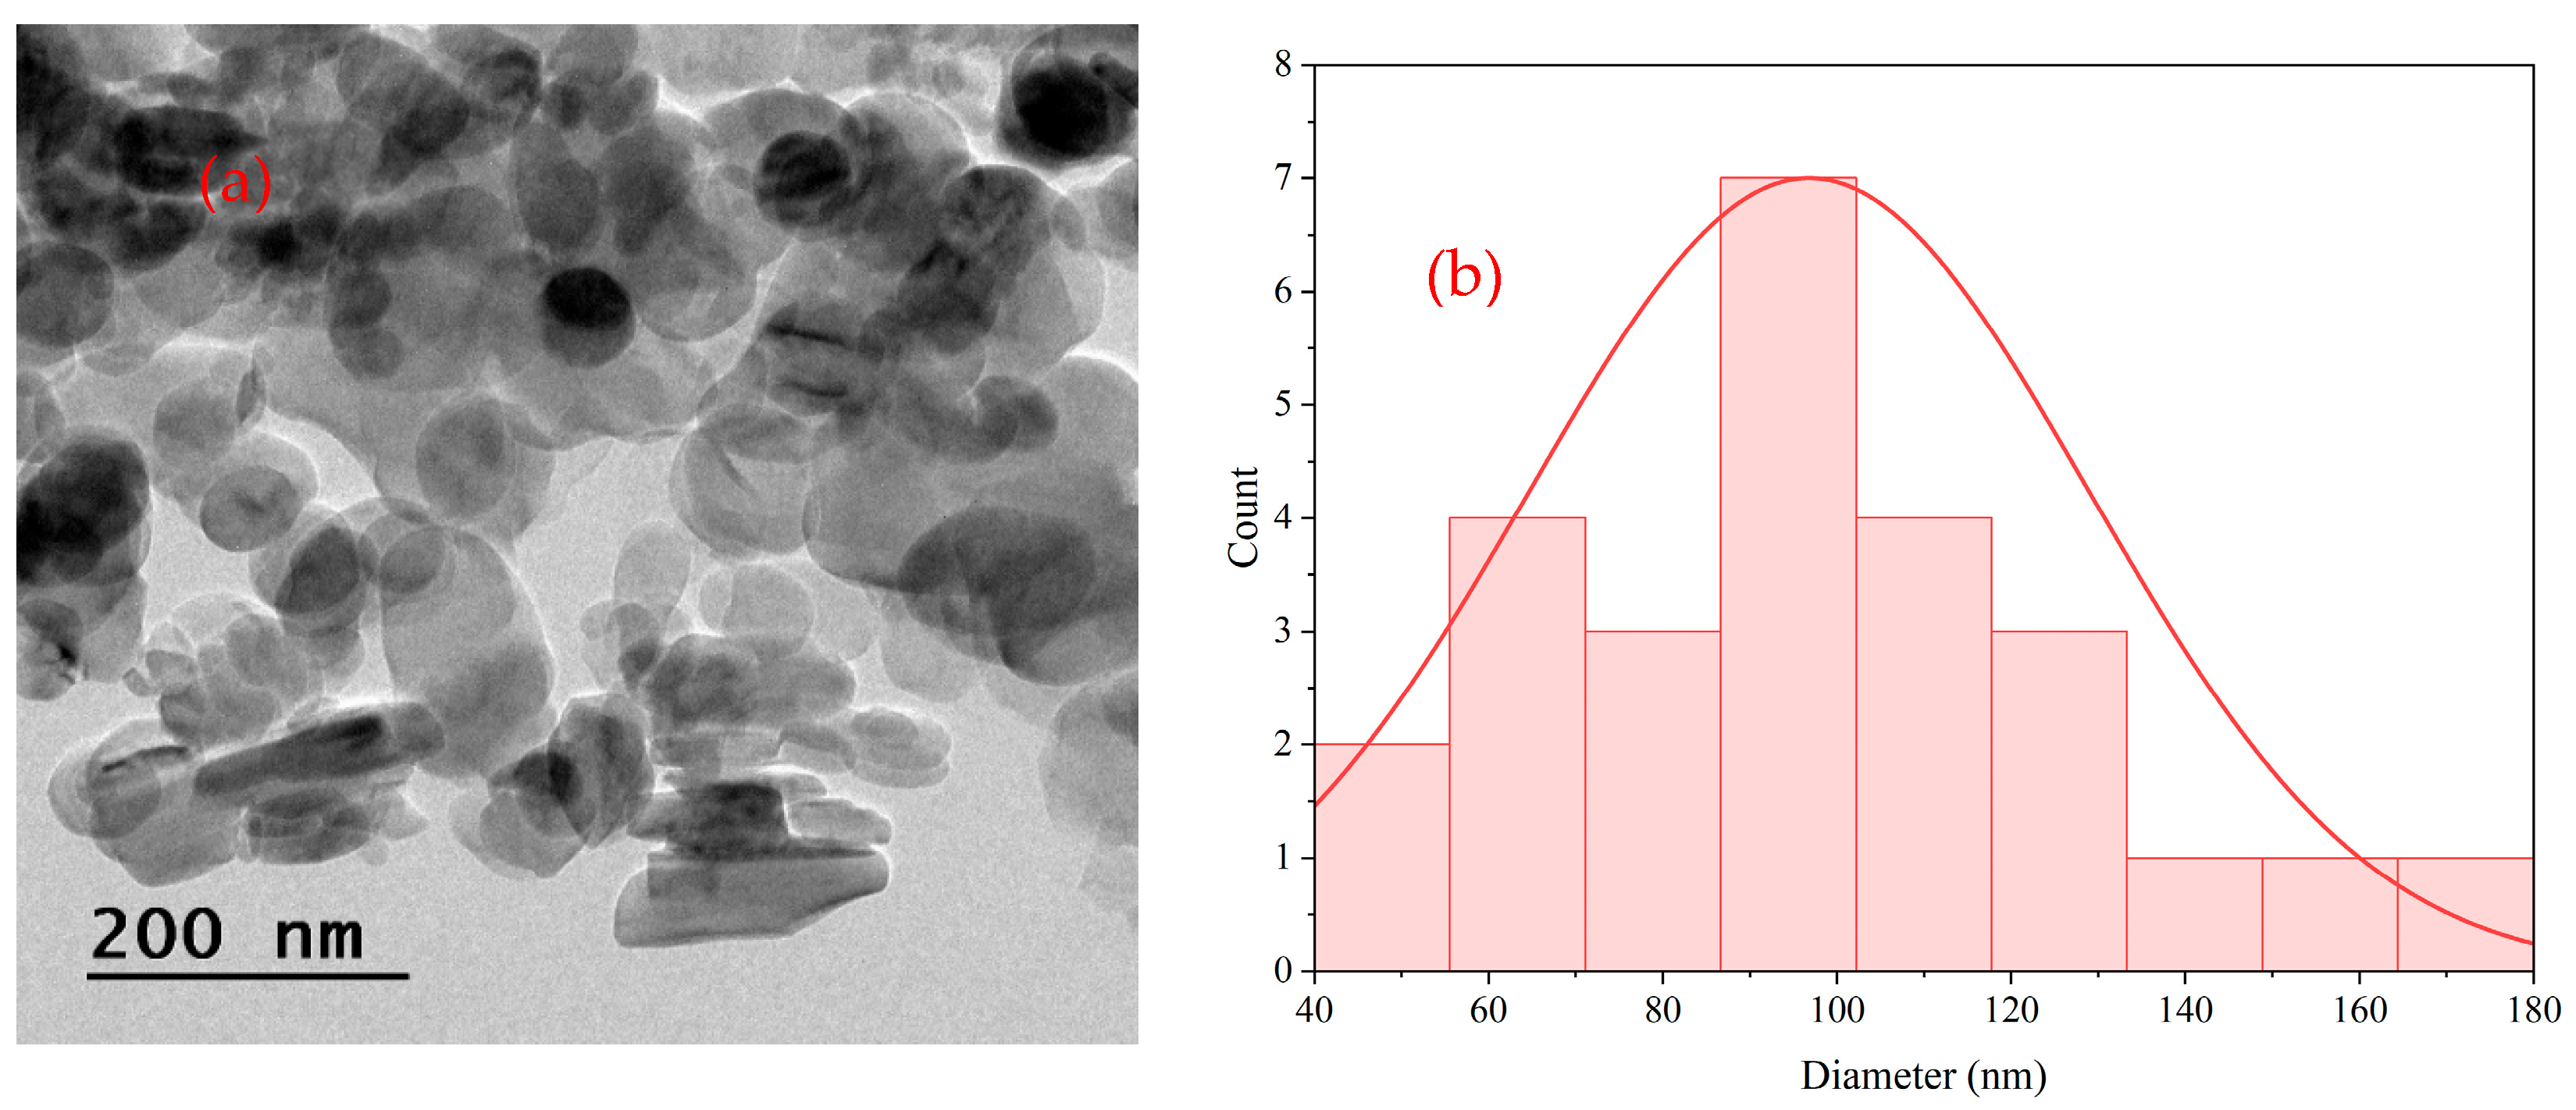
Figure 1. (a) TEM morphology; (b) particle size distribution of BNNP nanoparticles.
Machines 13 00949 g001
Figure 2. (a) Preparation of the composition for filament production and (b) process of filament extrusion.
Machines 13 00949 g002
Figure 3. (a) Dimensions of the tensile sample; (b) dimensions of the impact sample; (c) 3D printing machine used for tensile and impact sample preparation, showing print orientations at (i) 0°, (ii) 45°, and (iii) 90° about the xz plane.
Machines 13 00949 g003
Figure 4. Mechanical properties of PLA/BNNP composites: (a) stress–strain response, (b) tensile strength, (c) Young’s modulus.
Machines 13 00949 g004
Figure 5. Impact performance of L27-designed PLA/BNNP samples.
Machines 13 00949 g005
Figure 6. Interaction plots for tensile strength.
Machines 13 00949 g006
Figure 7. Contour plots for tensile strength under variation in (a) nozzle temperature vs. reinforcement wt.%; (b) printing speed vs. reinforcement wt.%; (c) printing layer thickness vs. reinforcement wt.%; (d) sample orientation vs. reinforcement wt.%.
Machines 13 00949 g007
Figure 8. Interaction plots for Young’s modulus.
Machines 13 00949 g008
Figure 9. Contour plots for Young’s modulus under variation in (a) nozzle temperature vs. reinforcement wt.%; (b) printing speed vs. reinforcement wt.%; (c) printing layer thickness vs. reinforcement wt.%; and (d) sample orientation vs. reinforcement wt.%.
Machines 13 00949 g009
Figure 10. Interaction plots for impact strength.
Machines 13 00949 g010
Figure 11. Contour plots for impact strength under variation in (a) nozzle temperature vs. reinforcement wt.%; (b) printing speed vs. reinforcement wt.%; (c) printing layer thickness vs. reinforcement wt.%; and (d) sample orientation vs. reinforcement wt.%.
Machines 13 00949 g011
Figure 12. Experimental vs. ANOVA-predicted values for (a) tensile strength, (b) Young’s modulus, and (c) impact strength.
Machines 13 00949 g012
Figure 13. Parity plots comparing experimental tensile strength with predictions from ML models (a) linear regression; (b) Random Forest; (c) XGBoost; (d) CatBoost; and (e) Gaussian process regression.
Machines 13 00949 g013
Figure 14. Classification Breakdown for Tensile Strength for: (a) Linear Regression, (b) Random Forest Regression, (c) XGBoost, (d) CatBoost, and (e) Gaussian process regression.
Machines 13 00949 g014
Figure 15. Parity plots comparing experimental Young’s modulus with predictions from ML models: (a) linear regression; (b) Random Forest; (c) XGBoost; (d) CatBoost; and (e) Gaussian process regression.
Machines 13 00949 g015
Figure 16. Classification breakdown for Young’s modulus: (a) linear regression, (b) Random Forest Regression, (c) XGBoost, (d) CatBoost, and (e) Gaussian process regression.
Machines 13 00949 g016
Figure 17. Parity plots comparing experimental impact strength with predictions from ML models. (a) Linear regression, (b) Random Forest Regression, (c) XGBoost, (d) CatBoost, and (e) Gaussian process regression.
Machines 13 00949 g017
Figure 18. Classification breakdown for impact strength: (a) linear regression, (b) Random Forest Regression, (c) XGBoost, (d) CatBoost, and (e) Gaussian process regression.
Machines 13 00949 g018
Figure 19. Correlation map between process parameters and mechanical properties.
Machines 13 00949 g019
Figure 20. SHAP-based interpretability of machine learning models’ predictions for (ae) tensile strength, (fj) Young’s modulus, and (ko) impact strength.
Machines 13 00949 g020aMachines 13 00949 g020b
Table 1. Three-dimensional printing processing parameters.
Processing ParametersLevel-1Level-2Level-3
Reinforcement wt.% (C1)Pure PLA0.020.04
Nozzle Temperature (°C) (C2)190200210
Printing Speed (mm/s) (C3)103060
Sample Orientation Angle (C4)04590
Print Layer Thickness (mm) (C5)0.150.250.35
Table 2. Taguchi L27 DOE.
Exp. No.Sample. NoReinforcement wt.%Nozzle Temperature (°C)Printing Speed (mm/s)Sample Orientation AnglePrint Layer Thickness (mm)
1S1Pure 1901000.15
2S2Pure 1901000.25
3S3Pure 1901000.35
4S4Pure 20030450.15
5S5Pure 20030450.25
6S6Pure 20030450.35
7S7Pure 21060900.15
8S8Pure 21060900.25
9S9Pure 21060900.35
10S100.0219030900.15
11S110.0219030900.25
12S120.0219030900.35
13S130.022006000.15
14S140.022006000.25
15S150.022006000.35
16S160.0221010450.15
17S170.0221010450.25
18S180.0221010450.35
19S190.0419060450.15
20S200.0419060450.25
21S210.0419060450.35
22S220.0420010900.15
23S230.0420010900.25
24S240.0420010900.35
25S250.042103000.15
26S260.042103000.25
27S270.042103000.35
Table 3. Signal-to-noise ratios for mechanical properties.
Exp. NoSample NoTensile StrengthYoung’s ModulusImpact StrengthS/N Ratio Tensile StrengthS/N Ratio Young’s modulusS/N Ratio Impact Strength
1S125.713701.7228.1962.734.71
2S22713332.9528.6362.499.39
3S316.4928.711.9624.2959.365.85
4S429.91275.458.3629.5162.1118.44
5S534.31223.640.4930.7161.756.19
6S636.21091.035.6531.1760.7615.04
7S721.31049.841.4726.5760.423.35
8S87.98497.164.4218.0453.9312.91
9S915.5941.023.4423.8159.4710.73
10S1029.9938.983.1929.5159.4510.08
11S1111.2263.941.4720.9848.433.35
12S1226.4695.961.9628.4356.855.85
13S1320.7810.973.4426.3258.1810.73
14S1425.7789.619.8428.1957.9519.86
15S1526.2991.385.6528.3759.9315.04
16S1628.61307.788.3129.1362.3318.39
17S1731.91220.326.7930.0761.7316.64
18S1828.4988.762.4629.0759.907.82
19S1917.2272.591.9624.7148.715.85
20S2011.7682.161.4721.3656.683.34
21S2116.7751.101.4724.4557.513.35
22S2238.91554.9310.3331.7963.8320.28
23S23381215.999.3531.5961.6919.42
24S2426.5573.459.8428.4655.1719.85
25S2524.81056.393.1927.8860.4810.07
26S2631.41529.913.1929.9463.6910.08
27S2730.8755.743.1929.7757.5710.08
Table 4. ANOVA for tensile strength.
SourceDFSeq. SSAdj. SSAdj. MSF-Valuep-ValueContribution
Reinforcement wt.%227.3127.3113.6561.540.3201.55%
Nozzle Temperature2498.48498.48249.24228.060.00428.29%
Printing Speed (mm/s)2673.26673.26336.63037.890.00338.21%
Sample Orientation Angle221.3821.3810.6921.200.3901.21%
Print Layer Thickness (mm)219.4919.499.7431.100.4171.11%
Nozzle Temperature (°C) * Print Layer Thickness (mm)488.5488.5422.1362.490.1995.03%
Printing Speed (mm/s) * Print Layer Thickness (mm)4193.71193.7148.4285.450.06510.99%
Sample Orientation Print Layer Thickness (mm)4204.29204.2951.0735.750.05911.59%
Error435.5435.548.884 2.02%
Total261762 100%
R-Sq: 97.98%    R-Sq(adj): 86.89%
Note: DF = Degrees of Freedom, SS = Sum of Squares, and MS = Mean Square, “*”—represents the interaction between parameters.
Table 5. ANOVA for Young’s modulus.
SourceDFSeq. SSAdj. SSAdj. MSF-Valuep-ValueContribution
Reinforcement wt.%2177,079177,07988,5404.980.0825.81%
Nozzle Temperature2360,388360,388180,19410.130.02711.82%
Printing Speed (mm/s)2766,204766,204383,10221.540.00725.12%
Sample Orientation Angle2188,951188,95194,4765.310.0756.19%
Print Layer Thickness (mm)2205,214205,214102,6075.770.0666.73%
Reinforcement wt.% * Print Layer Thickness (mm)4310,335310,33577,5844.360.09110.17%
Printing Speed (mm/s) * Print Layer Thickness (mm)4521,768521,768130,4427.330.04017.11%
Sample Orientation Print Layer Thickness (mm)4449,124449,124112,2816.310.05114.72%
Error471,13871,13817,784 2.33%
Total263,050,201 100%
R-Sq: 97.67%    R-Sq(adj): 84.84%
Note: DF = Degrees of Freedom, SS = Sum of Squares, and MS = Mean Square, “*”—represents the interaction between parameters.
Table 6. ANOVA analysis for impact strength.
SourceDFSeq. SSAdj. SSAdj. MSF-Valuep-ValueContribution
Reinforcement wt.%212.7416.02412.746.376.235.16%
Nozzle Temperature (°C)2112.738111.589112.73856.36955.1645.67%
Printing Speed (mm/s)235.50945.86035.50917.75517.3714.38%
C426.7645.9486.7643.3823.312.74%
Print Layer Thickness (mm)22.3434.8642.3431.1721.150.95%
Reinforcement wt.% * Print Layer Thickness (mm)411.62337.65111.6232.9062.844.71%
Printing Speed (mm/s) * Print Layer Thickness (mm)433.26239.89433.2628.3158.1413.47%
Sample Orientation Print Layer Thickness (mm)427.79912.23927.7996.956.811.26%
Error44.0875.1964.087 1.66%
Total26246.865 100.00%
R-Sq: 98.34% R-Sq(adj): 89.24%
Note: DF = Degrees of Freedom, SS = Sum of Squares, and MS = Mean Square, “*”—represents the interaction between parameters.
Disclaimer/Publisher’s Note: The statements, opinions and data contained in all publications are solely those of the individual author(s) and contributor(s) and not of MDPI and/or the editor(s). MDPI and/or the editor(s) disclaim responsibility for any injury to people or property resulting from any ideas, methods, instructions or products referred to in the content.