Article

A Research Method to Investigate the Effect of Vibration Suppression on Thin-Walled Parts of Aluminum Alloy 6061 Based on Cutting Fluid Spraying (CFS)

College of Mechanical Engineering, Tianjin University of Technology and Education, Tianjin 300222, China
*
Author to whom correspondence should be addressed.
Machines 2025, 13(7), 594; https://doi.org/10.3390/machines13070594
Submission received: 19 April 2025 / Revised: 12 June 2025 / Accepted: 26 June 2025 / Published: 9 July 2025

Abstract

This study aims to address the issues of high tool wear rate, severe deterioration of machining accuracy, and surface integrity in thin-walled part cutting processes, which are caused by vibration. To do so, this paper proposes a thin-walled part processing vibration control method based on CFS. With aluminum alloy 6061 planar thin-walled parts as the object of study, in this paper a CFS experimental platform was established, the influence of CFS on the dynamic characteristics of the thin-walled parts was analyzed, the effects of milling force and processing vibration during thin-walled part milling were investigated. The results show that compared with UCFS, CFS can significantly reduce the acceleration response amplitude of thin-walled parts and shorten their vibration decay time. When the spraying point coincides with the hammering point, the optimal vibration suppression effect is achieved at a spraying velocity V of 13 m/s, a spraying area S of 31 mm2, and a spraying angle θ of 30°; the acceleration response amplitude decreases by 76.2%, and the vibration attenuation time decreases by 74.7%. This method can provide a certain support force and damping effect for thin-walled parts by CFS, thus reducing the milling force and machining vibration.

1. Introduction

In order to solve the problem of vibration in the machining of parts, scholars have investigated machining chatter in both thin-walled and non-thin-walled parts and proposed various methods to suppress machining vibration. These methods are mainly divided into two approaches: one is to control the machining vibration by controlling and adjusting the machining process parameters; the other is to improve the stiffness and damping of the product by installing auxiliary devices such as support and damping on the part, so as to improve the machining stability.
Muxuan et al. [1] considered the first- and second-order modal parameters of the tool and thin-walled part, as well as the specific machining parameters, and used a semi-discretization method based on the improved Runge–Kutta method (IRKM-SDM) utilizing a milling dynamics model. The stability analysis of the milling process was performed using a fully discretized method (FDM) by Ozoegwu [2], which is constructed within the framework of the second-order polynomial tensor approximation of the cutting state. The proposed method is applicable to frequent milling models. Mehran et al. [3] proposed a practical approach to solve the instability problem of milled parts by investigating the effect of geometrical parameters such as height, thickness, tool overhang, and the diameter ratio of the workpiece. Song et al. [4] proposed a new method of "equal quality pre determined stable blade diagram (DSLD) workpiece structure method". The results showed that this method can optimize the cutting parameters for the milling of thin-walled parts to avoid vibrations and improve the vibration-free material removal rate and surface finish. Wang et al. [5] proposed a modal coupling method to predict the stability of milling thin-walled parts. In another study, Gao et al. [6] investigated the effect of material removal on the process damping coefficients and revealed the intrinsic relationship between the latter and the dynamic properties of the workpieces. Wang et al. [7] proposed a finite element analysis method for thin-walled curvature modal parameters based on SolidWorks and Ansys, which involves creating solid models and constructing analysis models. Zhou et al. [8] systematically investigated the effects of build strategies (including UV resistance, the number of milling wheels, and build height) on the thermal history, printability, microstructure, and mechanical properties of fabricated thin-walled components. The results showed that the width direction feed was the largest and had the greatest effect on vibration. Jia et al. [9] systematically investigated the process of generating thin walls and found that the main source of this process is the relative vibration of the tool–workpiece system rather than indentation. Compared with the traditional generation model, this model takes into account both the relative vibration of the tool and the workpiece as well as the geometry of the workpiece itself. Zhou et al. [10] proposed a new prediction model that takes into account the effect of removing cutting material around the surface, and the experimental results showed that the proposed method can accurately predict roughness under the conditions of large axial depths and slight chatter. Li [11] explored the effects of spindle speed, machining parameters, and workpiece vibration on the milling process of thin-walled parts via milling experiments. Wu [12] employed the finite element numerical simulation method to conduct experimental verification and analysis on 7075 aluminum alloy plates under different preload conditions, thoroughly exploring the inherent relationship between frequency and preload. The research results reveal that the natural frequency of the aluminum alloy plate shows an increasing trend with the rise in preload.
These methods require physical contact (e.g., magnetorheological fluid fixtures, force-controlled end-effectors, PLA coverings, etc.), which may introduce additional stiffness or damage to the workpiece surface and are not suitable for high-precision or deformable thin-walled components (e.g., aerospace structures). Due to the optimization of material properties (e.g., GO lubricants, shear thickening fluids) or structural parameters, it is difficult to dynamically adapt to changes in stiffness caused by material removal during machining, and vibration damping is greatly limited by the operating conditions.
Kasper et al. [13] proposed a method to maximize the material removal rate without violating forced vibration stability constraints. In addition, the implemented resampling strategy minimized the risk of local minima. Serhii [14] used fluid jet-assisted machining as a stability improvement technique, and the results demonstrated that fluid jet support meets the requirements for the machining of thin-walled parts and reduces machining errors. Wang et al. [15] developed an innovative and effective cutting inhibition method based on shear-thickened corn starch suspension for milling cavity parts. The results showed that the corn starch suspension has excellent vibration suppression performance during the milling process of thin-walled cavity parts. Wang et al. [16] integrated a new type of force-controlled end-effector into a robotic work cell to realize effective vibration control of the workpiece. The results showed a 75% reduction in the vibration amplitude of the workpiece; the stabilized grinding of large thin-walled shells, and significantly improved grinding efficiency. The effective suppression of non-tool passing frequency and the stable grinding of large thin-walled shells greatly improved the depth of each grinding pass up to 0.3 mm, with a depth error less than ±0.1 mm. The surface quality of the workpiece was also significantly improved to Ra = 0.762 μm. Butt, M.A. et al. [17] designed a two-degrees-of-freedom device on a specific behavioral flat plate for vibration suppression after an experimental study of magnet combinations and flux density modes, while Ma et al. [18] designed a flexible fixture based on magneto-rheological (MR) fluids for the study of regenerative chirp vibration during machining suppression. In their study, Li et al. [18] synthesized a grinding coolant by dispersing GO nanosheets in water and systematically conducted lubrication-assisted GGG laser crystal grinding experiments, demonstrating that the friction at the interface between the abrasive and substrate could be significantly reduced due to the self-lubrication of the GO nanosheets. Hu et al. [19] explored the inhibitory effect of the interfacial structure during side-milling laser melting, showing a 55.28% reduction in vibration via laser melting technology, while Zhao [20] et al. explored the inhibitory effect of in-face structures in side-milling laser cladding. Paweł Dunaj et al. [21] proposed a new method of passive vibration damping by using polypropylene glycol ester (PLA) to cover structural elements with low dynamic stiffness. In another study, Li [22] realized transient impact loading at nine discrete locations on a steel plate by adjusting the horizontal position of the excitation tube and the vertical position of the adjustable bracket. The results showed that the EEMD method effectively mitigates mode mixing in the vibration response decomposition of thin-walled structures and addresses the incomplete continuity of the frequency domain in wavelet transforms.
The above research is primarily based on numerical simulations (e.g., modal analysis) or single machining experiments (e.g., grinding, milling) and lacks cross-scale validation of dynamic characteristics (hammering experiments) and machining performance (milling experiments).
In this paper, the modal parameters are obtained through hammering experiments, and the cutting force and vibration response are measured via milling experiments, realizing a full chain validation from “vibration suppression mechanism” to “actual machining effect”. Traditional methods (e.g., magnetorheological fluid, shear thickening fluid) are costly and difficult to recycle, whereas the CFS method in this paper only uses conventional cutting fluid, and efficient vibration damping can be achieved through parameter optimization, which is in line with green manufacturing trends. This study provides a novel method of vibration suppression for aluminum alloy thin-walled parts.

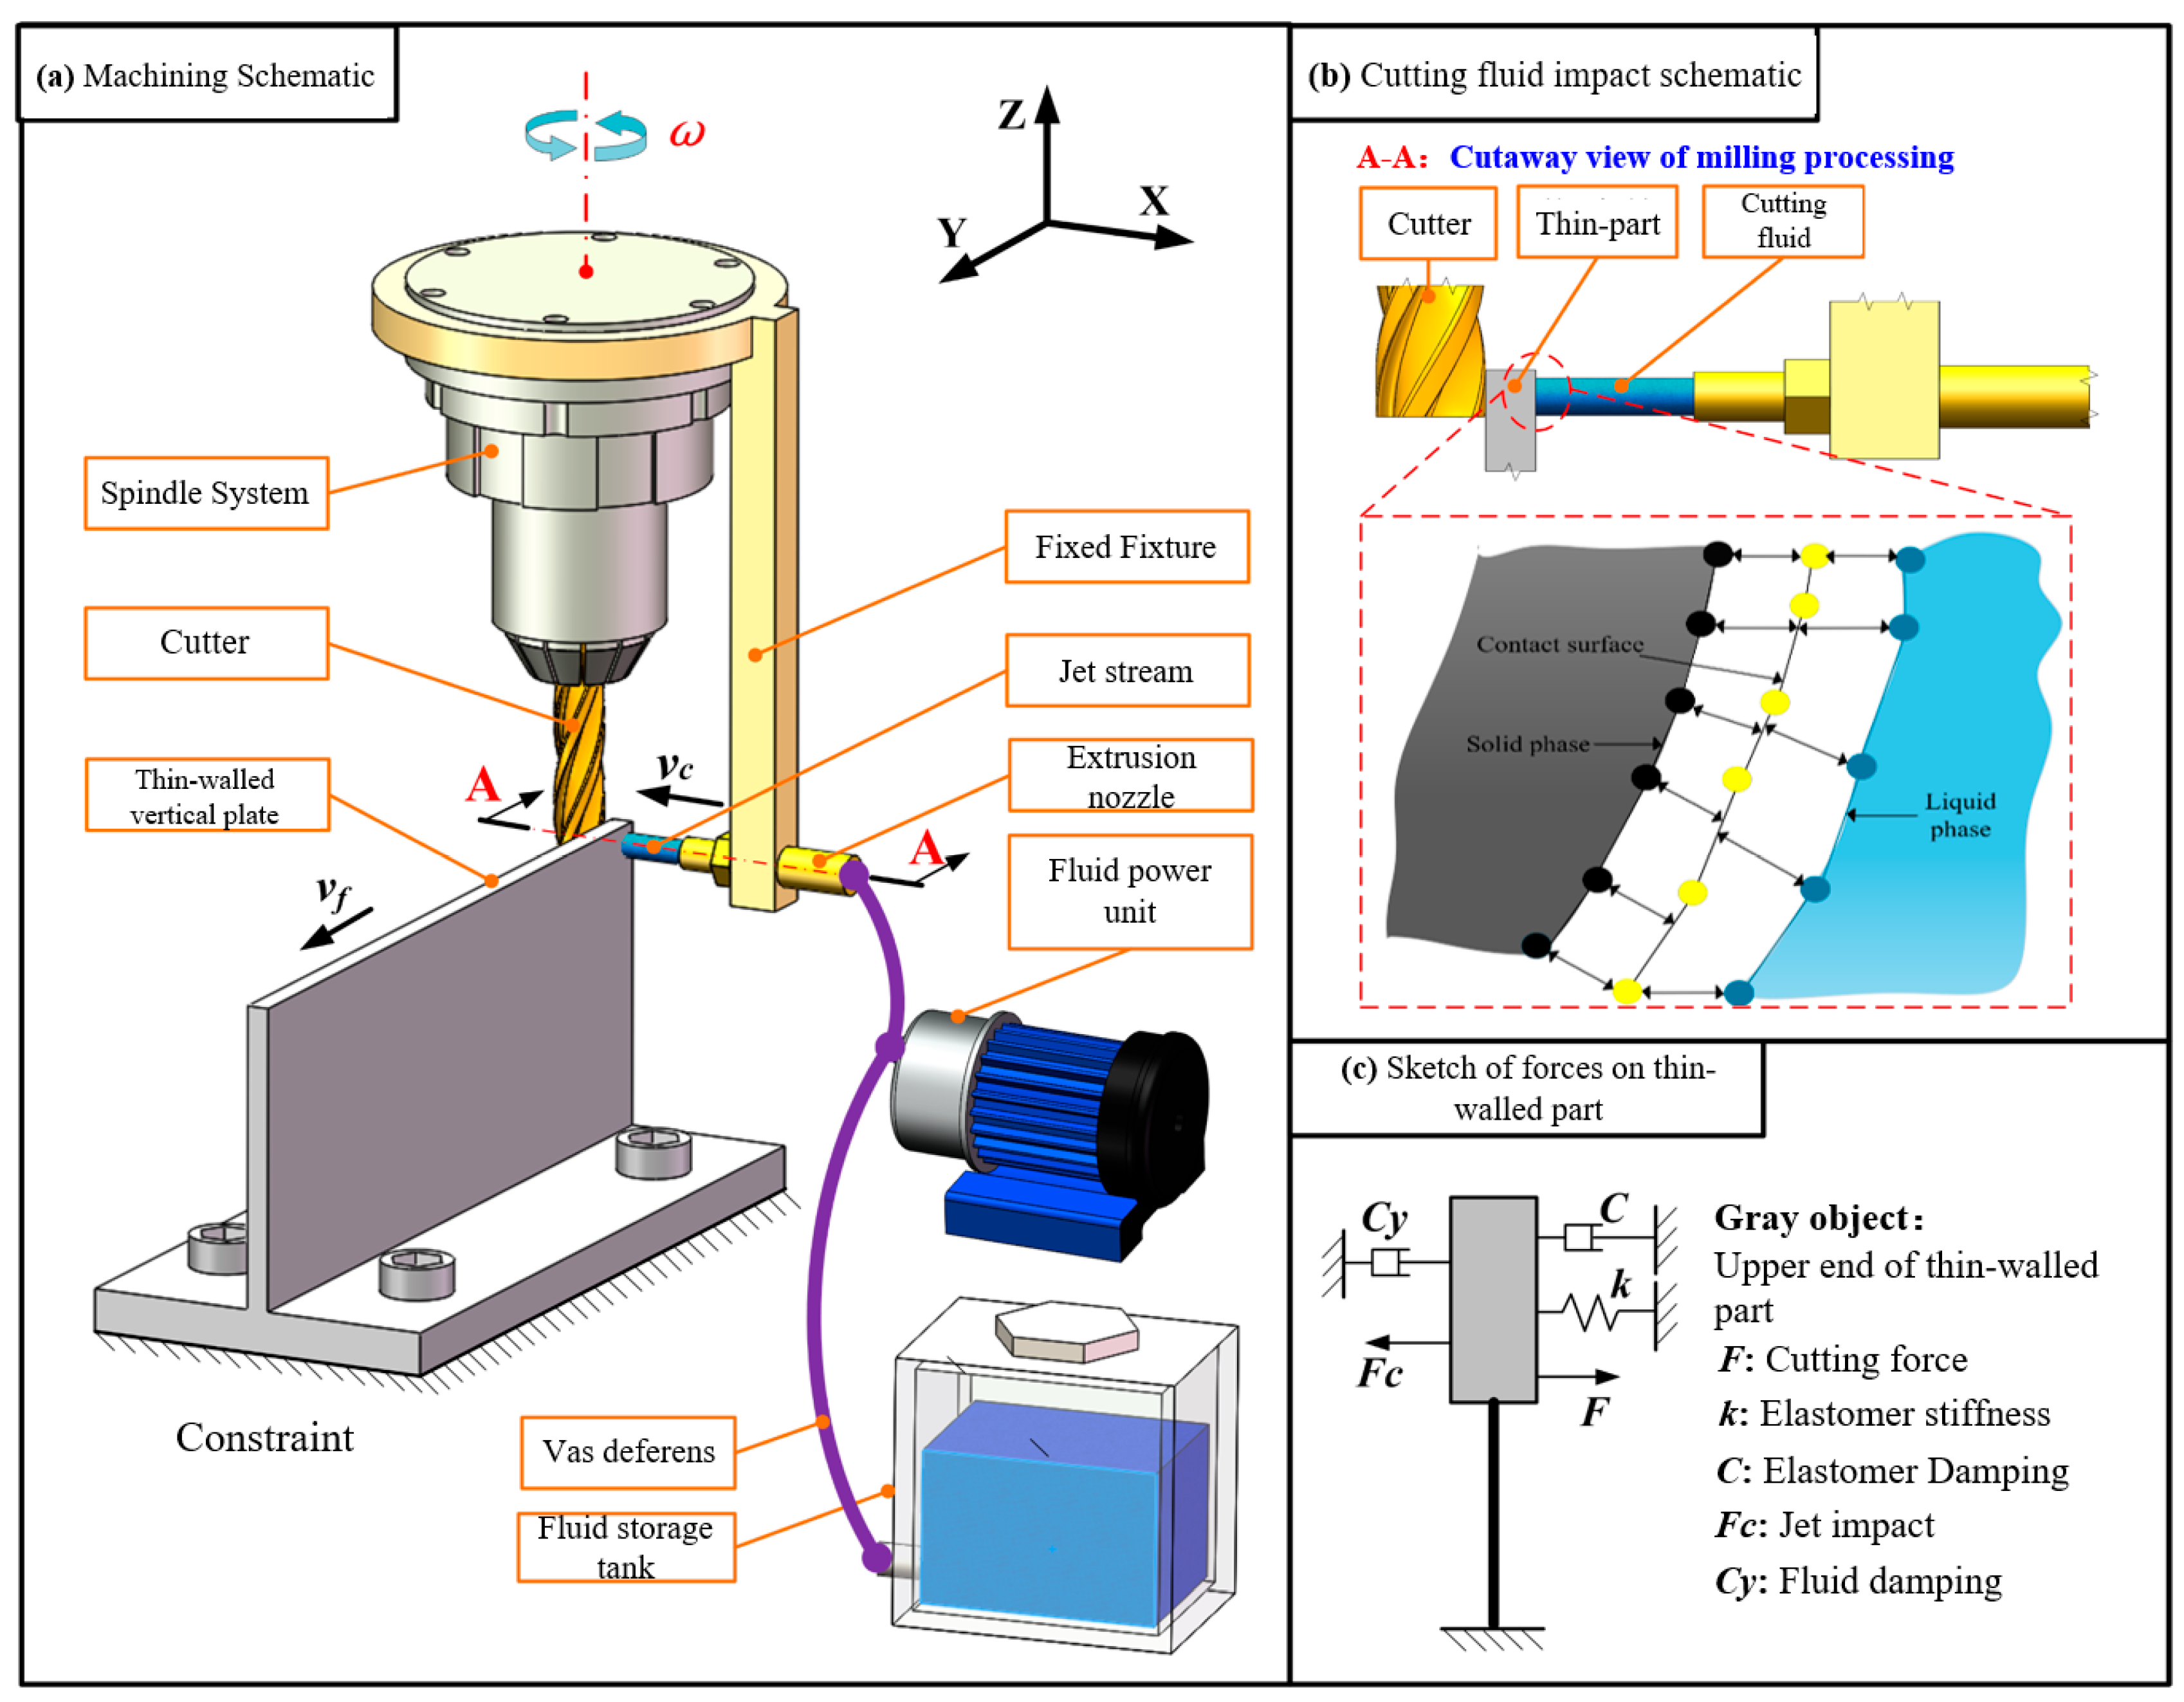
2. Cutting and Machining Methods for Thin-Walled Parts Under CFS

The schematic of the milling process of the flat thin-walled parts under CFS is shown in Figure 1a. The method achieves vibration suppression through contact between the cutting fluid jet and workpiece. The machining part of the experimental platform mainly includes a machine tool spindle system, milling cutter, and thin-walled vertical plate workpiece; the CFS component comprises a fixed fixture, nozzle, fluid power device, fluid delivery pipe, and fluid storage tank. Before milling begins, the fluid power unit and reservoir are secured to the machine table, and the thin-walled vertical plate workpiece is loaded through the fixed constraints. A fixture to hold the cutting fluid nozzle is mounted above the machine spindle system, and the nozzle spray position is controlled by adjusting its height and angle. Once the milling process starts, the milling cutter machines the thin-walled part at a certain feed rate Vf. The fluid power device utilizes a self-priming function to draw the cutting fluid from the storage tank to its own interior through a pipeline and transports it to the nozzle to be sprayed at speed Vc. The CFS position can follow the milling cutter’s path, spraying at the thin-walled part’s real-time machining point.
The CFS principle is shown in Figure 1b, depicting the positional relationship between the milling cutter, thin-walled part, and cutting fluid through a localized view and microscopic resolution of the fluid injection moment. The solid phase in the latter image represents the thin-walled part, the contact surface represents the point between the cutting fluid and thin-walled part, and the liquid phase represents the cutting fluid. In the cutting process, the cutting fluid is sprayed onto the contact surface with a certain velocity Vc, generating the spray force Fc (identified in Figure 1c) and producing a fluid–solid coupling phenomenon with the workpiece. The force generated by the cutting fluid in the jetting process will cause deformation to the thin-walled parts, creating a coupling effect between the cutting fluid and the motion state of the thin-walled workpiece [23]. Fluid damping and jet impact force will offset elastomer damping, elastomer stiffness, and cutting force appropriately [24]. Figure 1c shows the forces acting on the thin-walled part during machining under CFS conditions. The gray block in the figure represents the upper end of the thin-walled part, which is simultaneously subjected to cutting force F, elastomer stiffness k, elastomer damping C, jet injection force Fc, and fluid damping Cy.

3. Platform Construction and Experimental Program

This section details the design of the CFS and UCFS hammering and milling experiments based on the construction and debugging of the experimental platform and selection of materials.

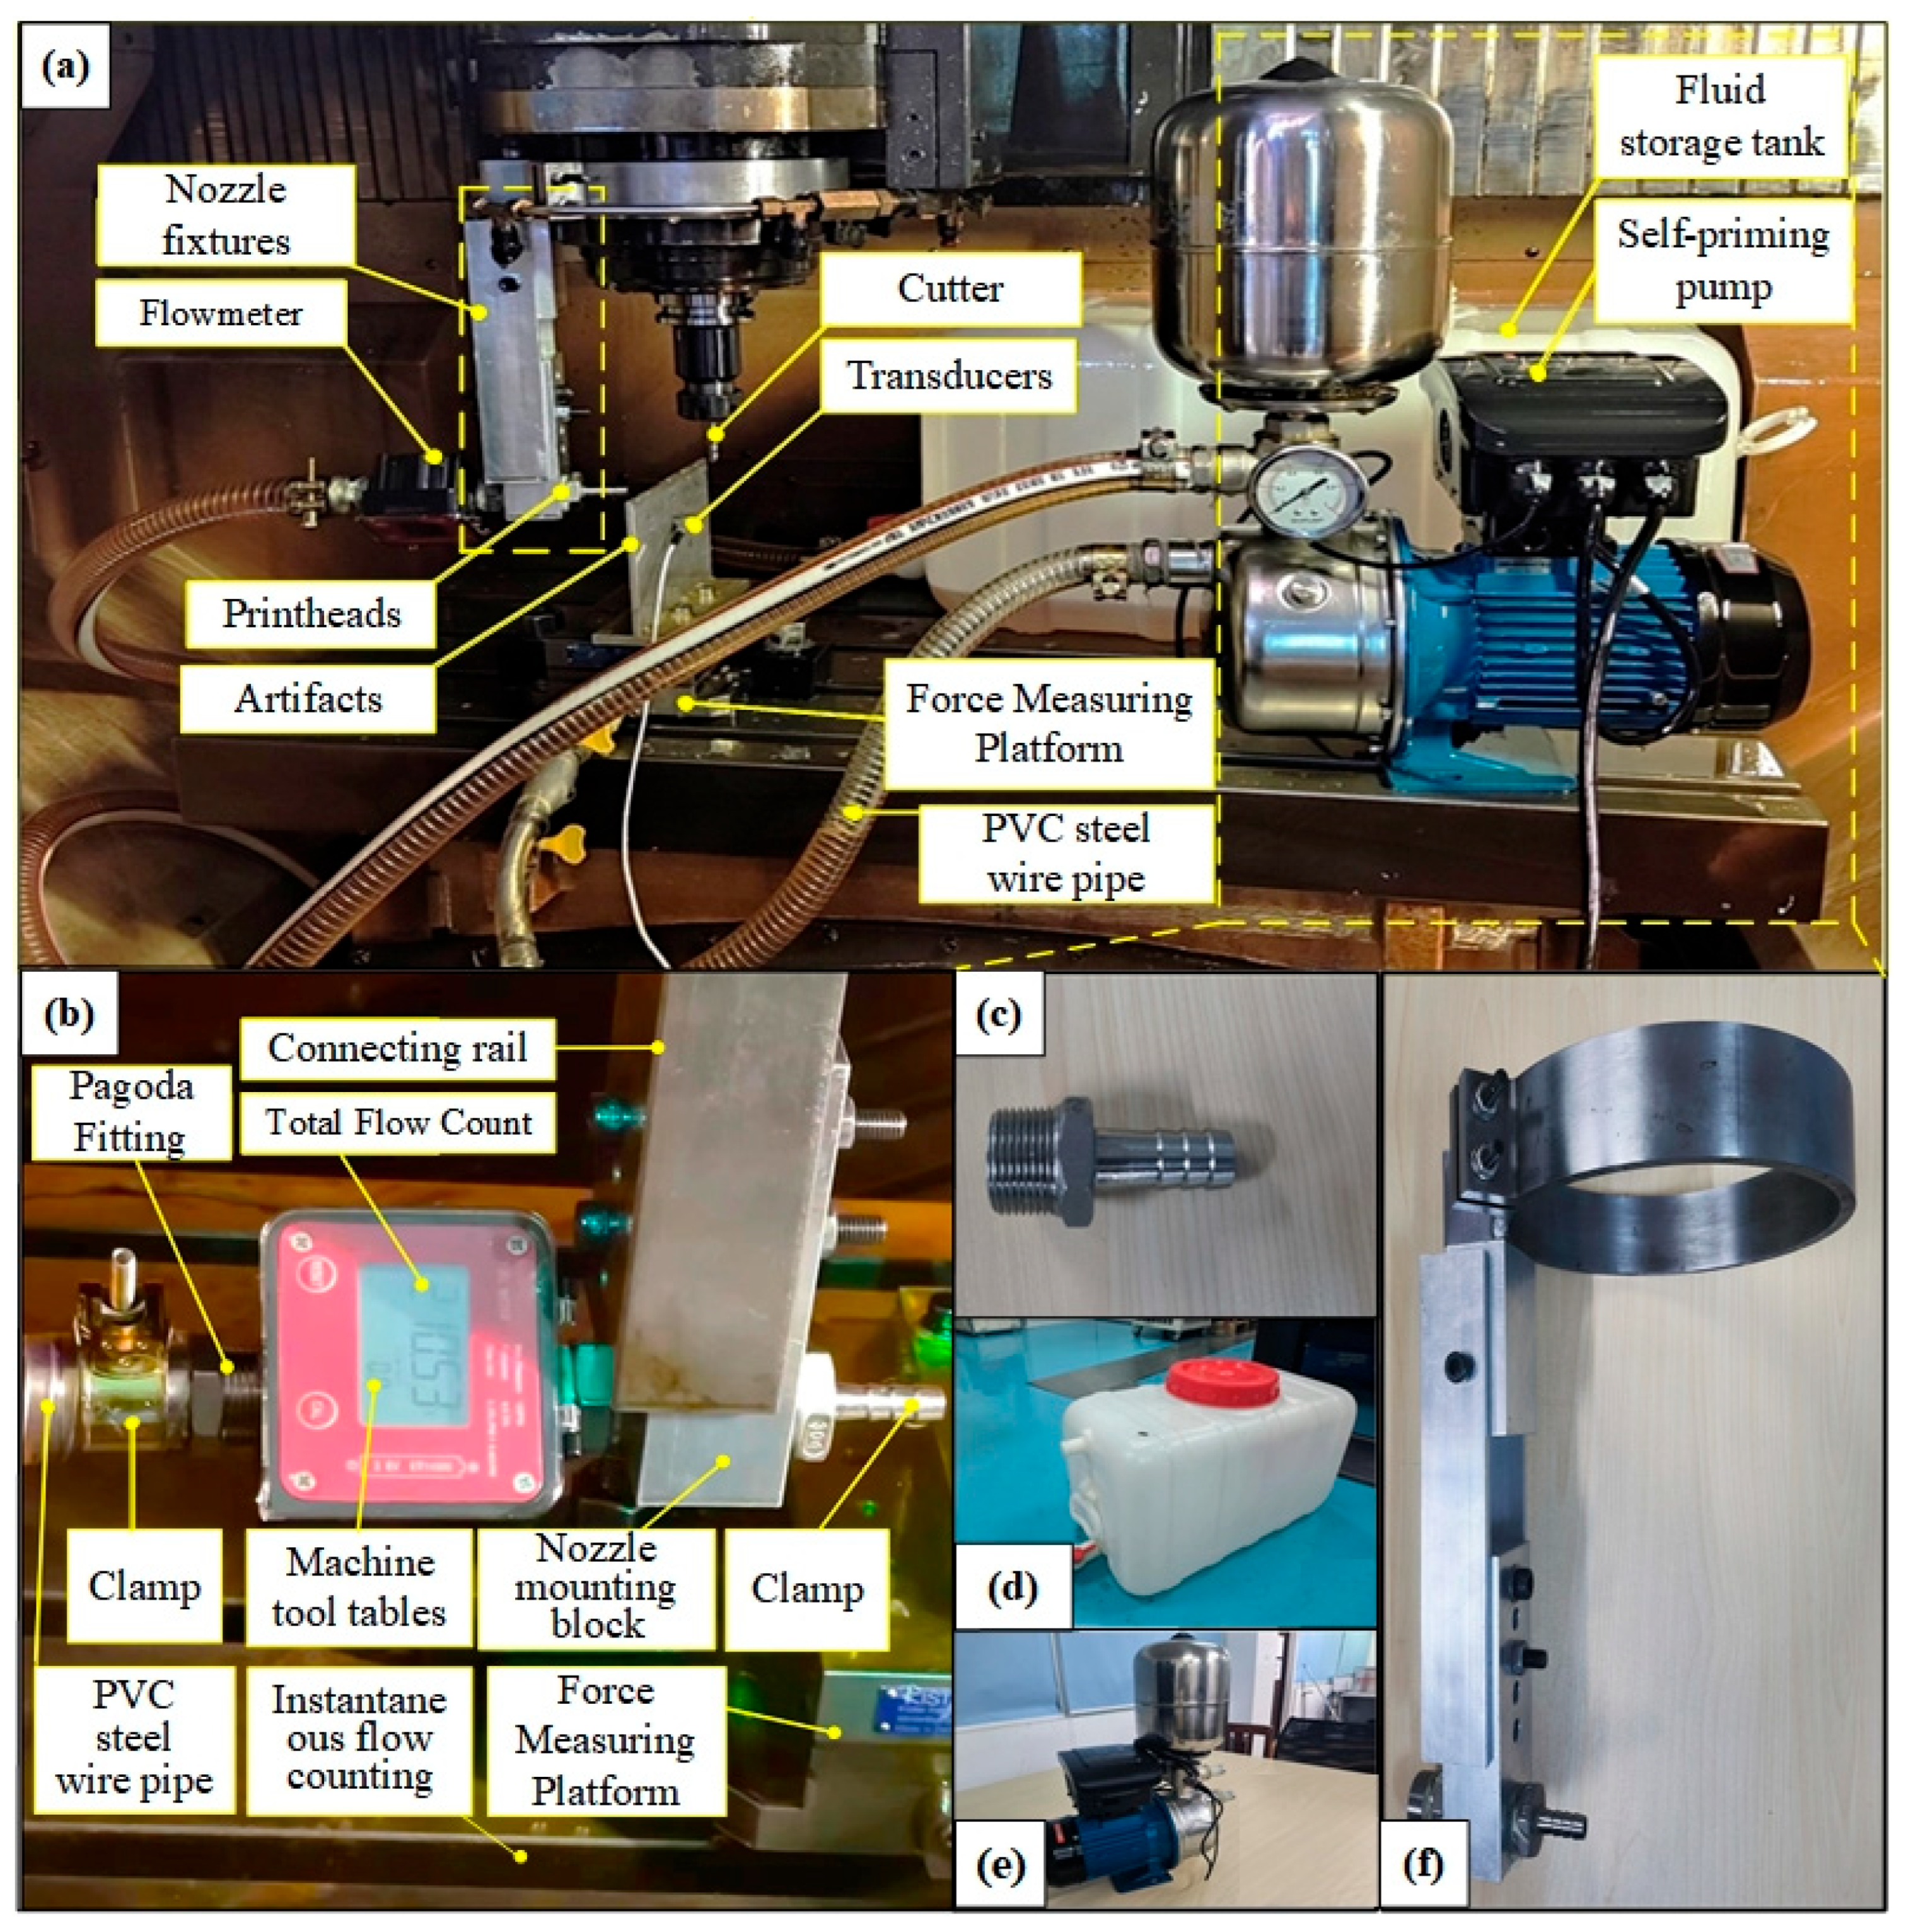
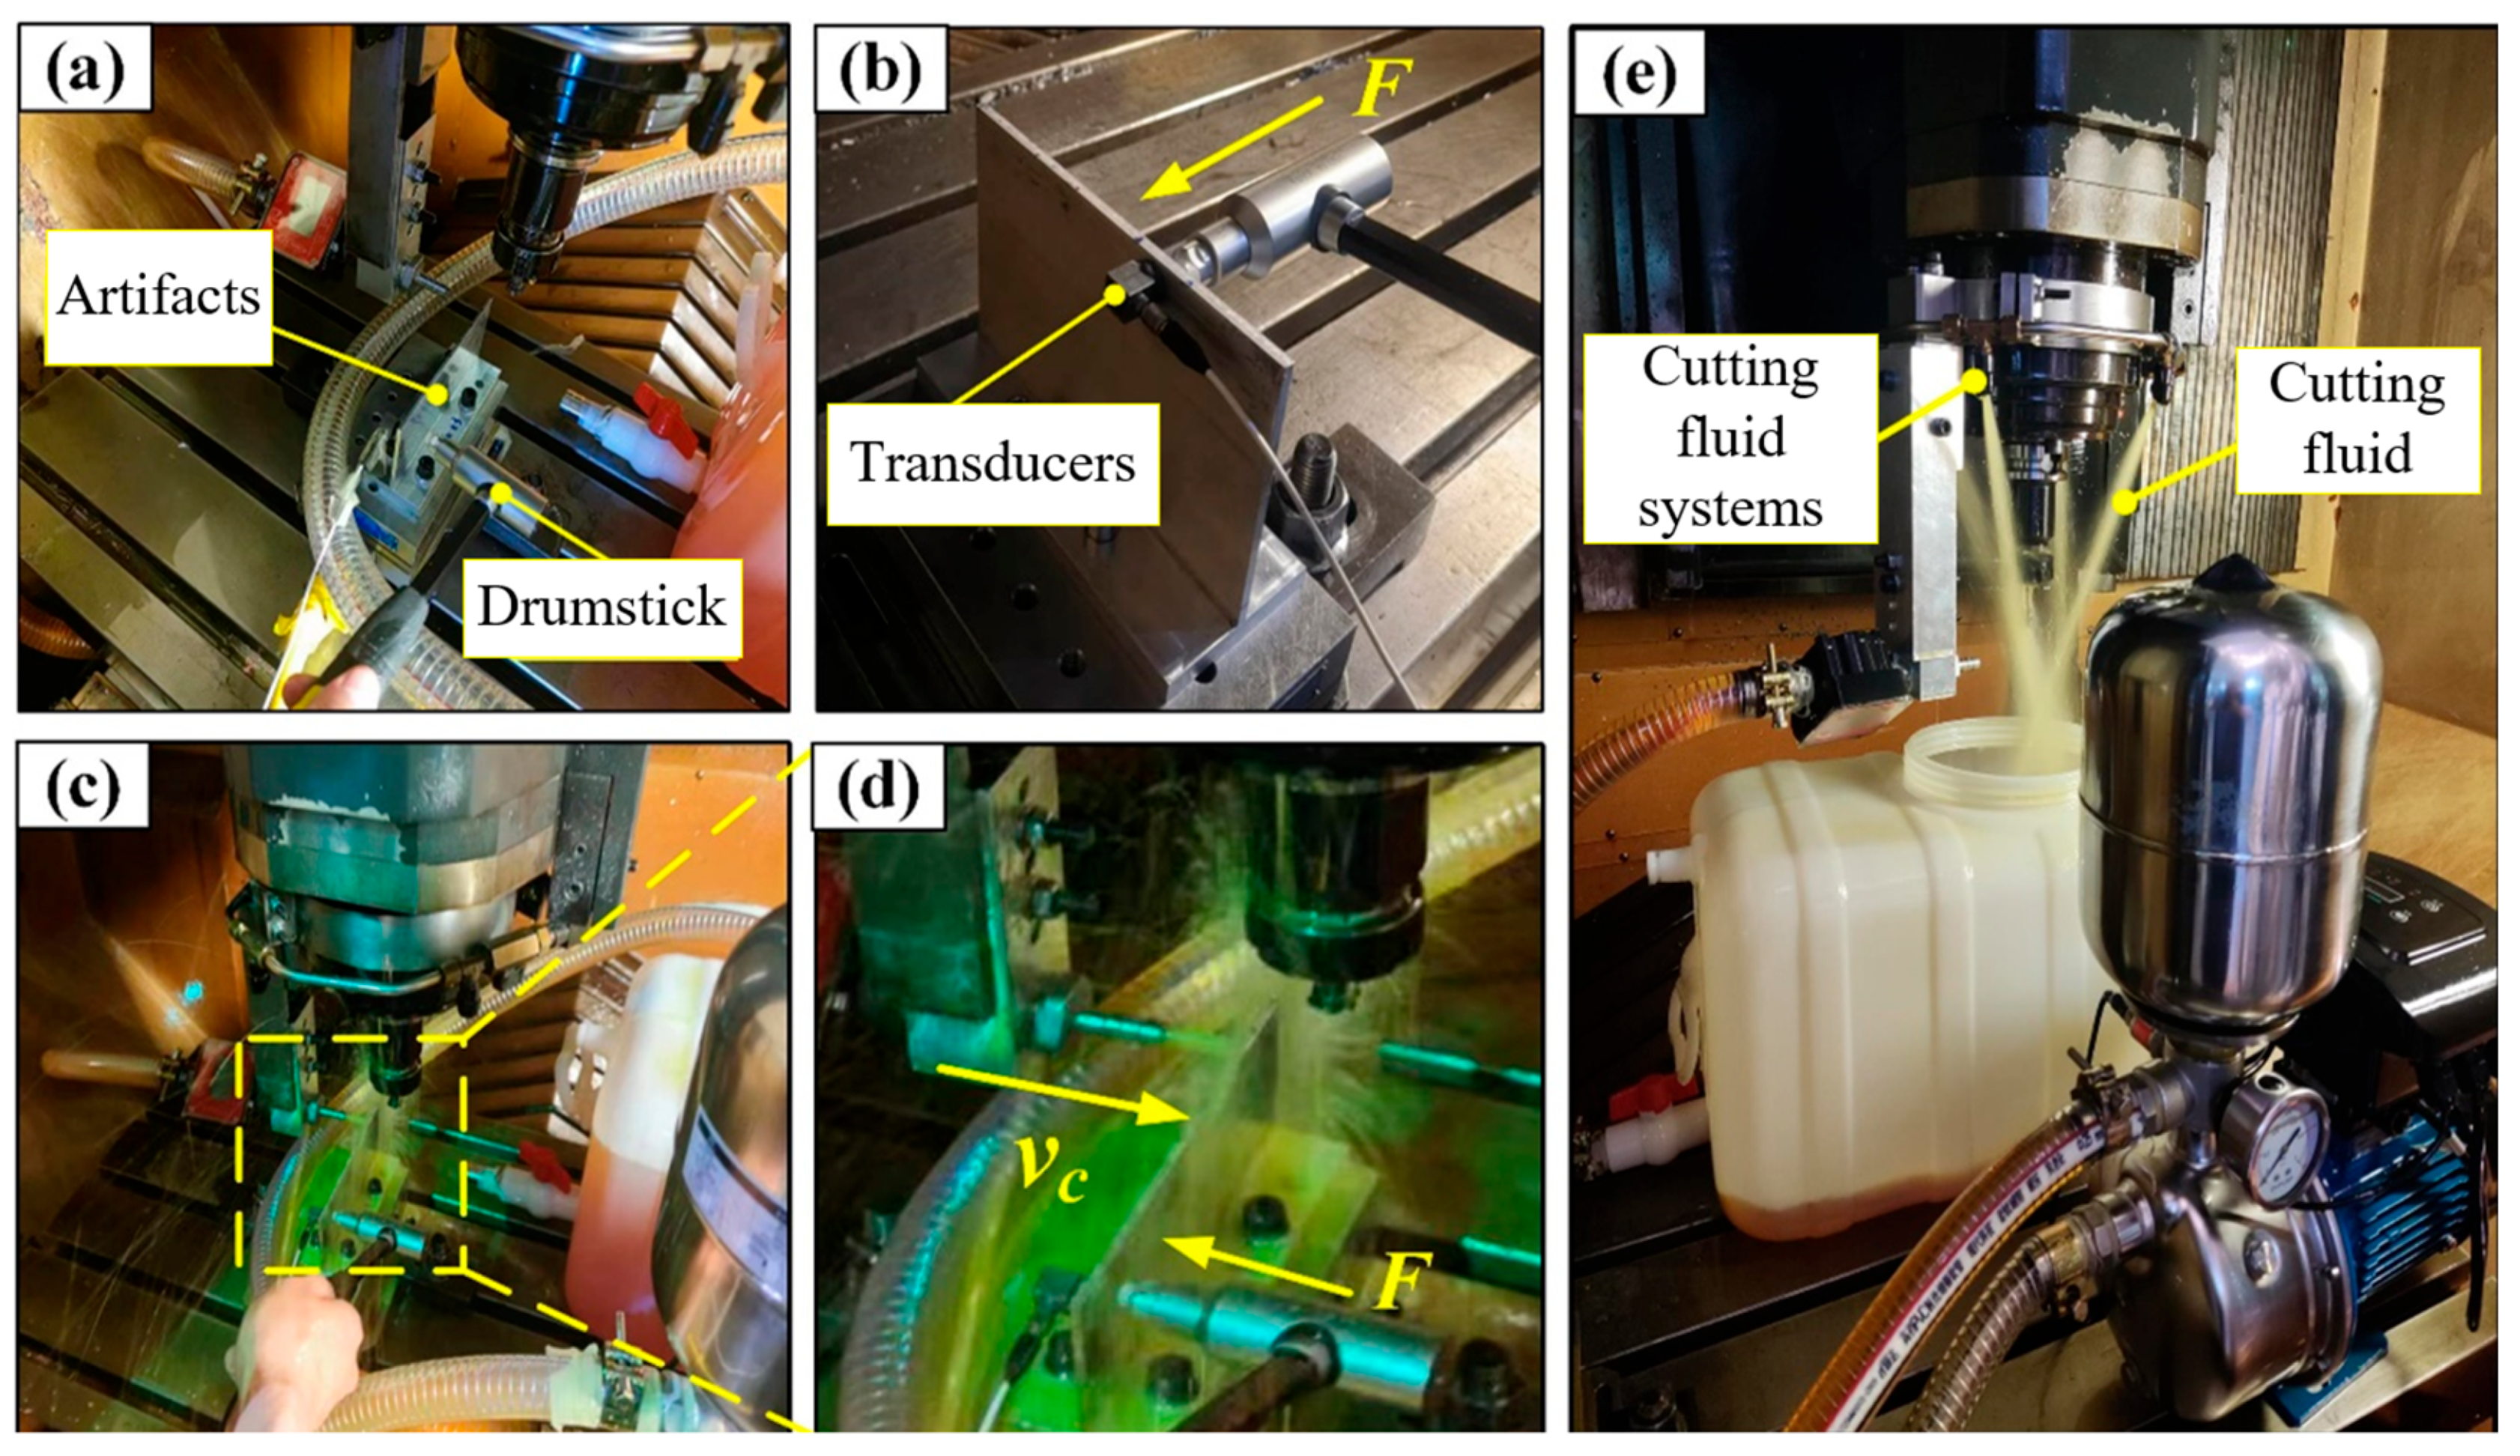
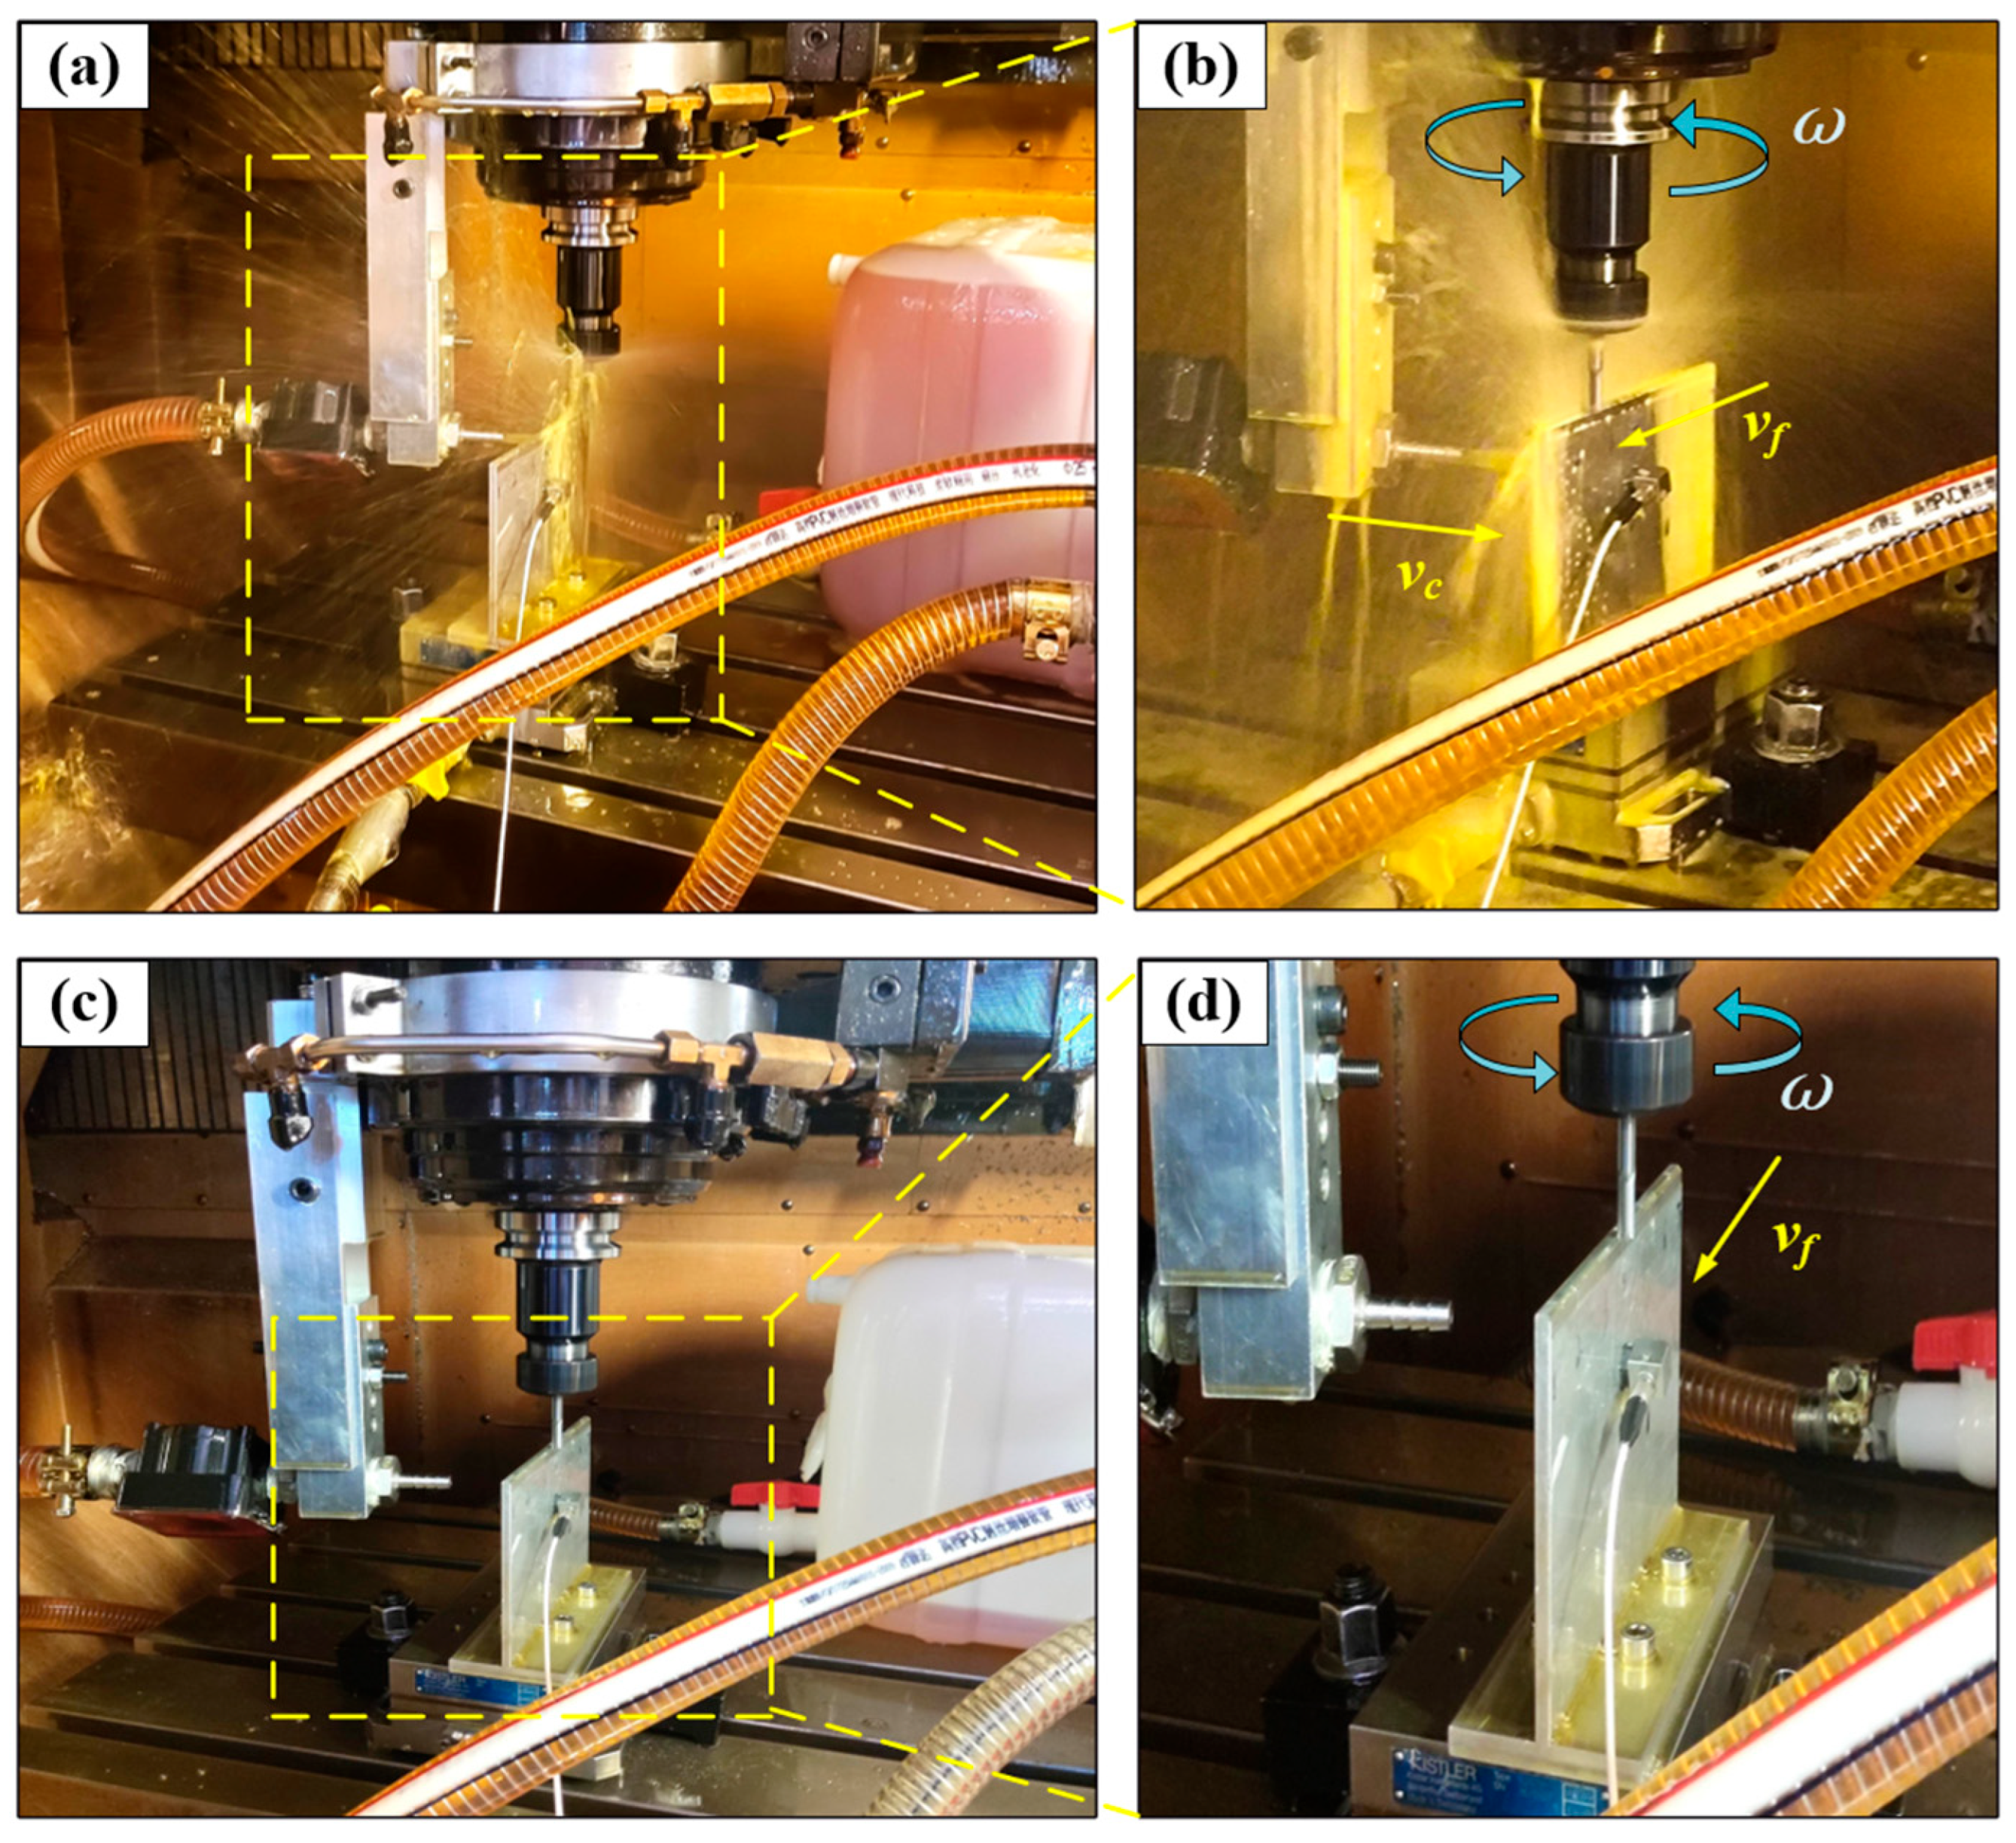
3.1. Experimental Platform Construction

In the actual machining process, workpiece vibration is one of the key factors affecting machining accuracy and surface quality. The emergence of the CFS experimental platform provides a new approach to solve this problem. By precisely controlling the injection of cutting fluid, it can not only effectively reduce the friction between the tool and workpiece, reducing heat generation, but also change the stress distribution on the surface of the workpiece to a certain extent, thus suppressing the occurrence of vibration. For example, in the milling of very hard alloy materials, the cutting process very easily produces vibration, resulting in ripples upon the machined surface, thus affecting the performance of parts. The CFS experimental platform can be tuned upon the characteristics of the alloy material, the requirements of the milling process, and the precise adjustment of the cutting fluid injection angle, flow, and height, so that the cutting fluid can effectively act on the cutting area in a timely manner, buffer the impact between the tool and the workpiece, attenuate the amplitude of vibration, and thus improve the finish and dimensional accuracy of the machined surface. At the same time, the platform can also be used in conjunction with other monitoring equipment, such as vibration sensors, temperature sensors, etc., to collect various data in the machining process in real time, which provides a rich experimental basis for the in-depth study of the mechanisms of vibration suppression provided by the cutting fluid, helping to further optimize the machining process and promote the development of machining technology.
The CFS-based experimental platform is shown in Figure 2, outlining the equipment and accessories involved, including the installation of the toolholder, milling cutter, and equipment required for the experiment.

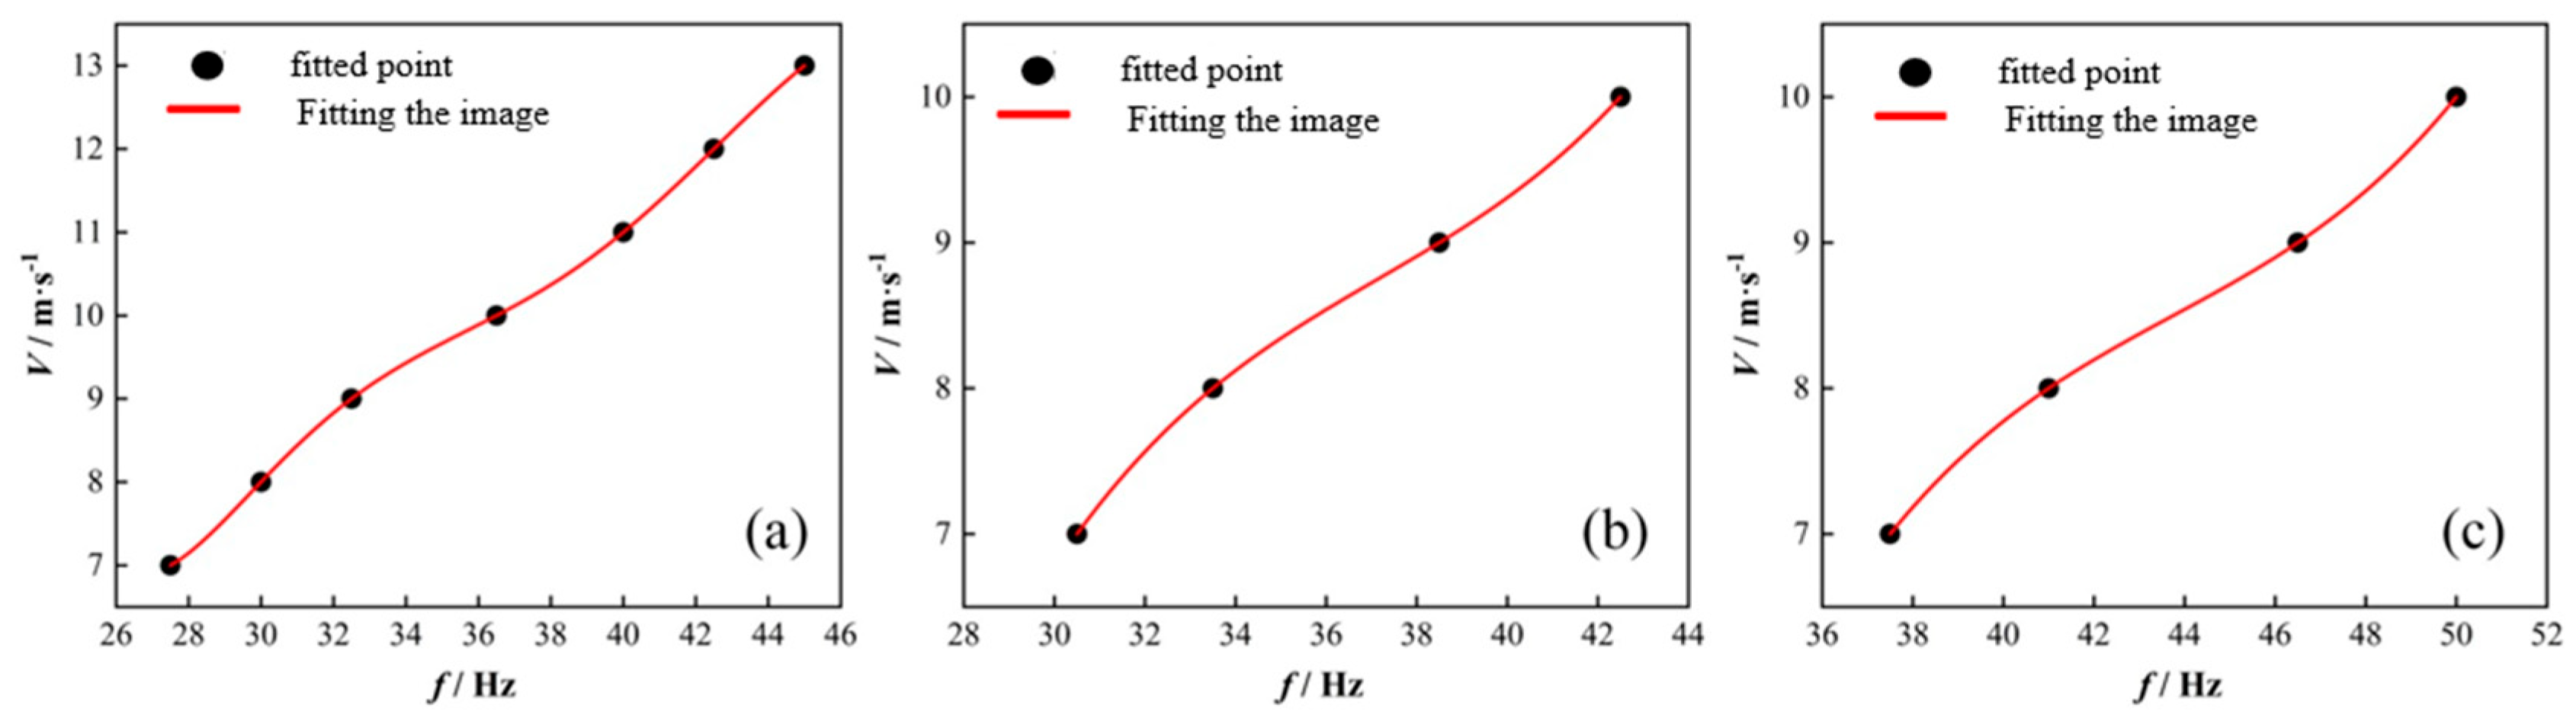
3.2. Debugging of the Experimental Platform

The frequency adjustment range of the pumping machine is 20–50 Hz, and the maximum flow rate is 3 m3/h. Therefore, the threshold value of the spraying speed is lower when the nozzle with a larger spraying area is used. It is worth noting that due to the slow rotation speed of the pumping machine at low frequency, the machine cannot produce enough flow and pressure to work properly, affecting its service life. Therefore, in order to ensure the normal and efficient operation and performance of the pumping machine, it should not be run at too low a frequency. In this test, three different specifications of the outer wire pagoda joints are selected for the nozzle, i.e., nozzle I, II, and III, and the radius and cross-sectional area of the inner cavity are 3.1 mm/31 mm2, 4.1 mm/53 mm2, and 5.3 mm/88 mm2, respectively.
The workpiece used in the test is a flat T-shaped thin-walled part, whose length, height, and thickness are 150 mm, 110 mm, and 4.5 mm, respectively. The bottom surface of the workpiece is fixed on the force-measuring platform by hexagonal bolts. The cutting fluid used for the test is No. 5 mechanical oil, with density ρ = 910 kg/m3. The cutting fluid is sprayed along the X direction of the force-measuring platform at the center of the long side of the thin-walled part. Considering the subsequent experimental contents of this paper, nozzle I, nozzle II, and nozzle III are selected for testing the test results of the operating frequency of the pumping machine and the spraying speed are fitted and illustrated in Figure 3 (a), (b) and (c) respectively.
Due to the CFS direction being fixed, only the X direction of the force changed; Fx is the injection force, and the measured Fz has a certain value because the workpiece was bolted to the force measurement platform, which was subjected to vertical ground downward pressure, as shown in Figure 4a. In addition, due to the cutting fluid’s spraying varying flow rate to begin, the data analysis focused on the stabilized force injection period; the bilateral peak-seeking method was utilized to find the average value of the force and subtract the initial error, as shown in Figure 4b. Figure 4a,b corresponds to the test conditions for V = 10 m/s and S = 88 mm2, depicting the CFS force test results plotting injection velocity vs. injection force as folded line point graphs.
Observing Figure 4a,b, it can be seen that both the jetting force Fx measured by the force measurement system and the jetting force Fc calculated by Eq. are almost linearly related to the jetting velocity V and are enhanced with an increase in jetting velocity.

3.3. Experimental Materials

The experimental workpiece material for the aluminum alloy 6061, the shape of the workpiece for the T-shaped cantilever thin-plate structure, and the base of the symmetrical distribution of four holes can be used to fix the workpiece on the workbench with hexagonal screws.
The experiment uses two workpieces, respectively: piece I and piece II. The length, height, and thickness dimensions were 150 mm × 110 mm × 4.5 mm and 150 mm × 90 mm × 4.5 mm, respectively, and the coordinates of the hammering point, vibration point, and CFS point were marked on the workpiece. Each hammering point was spaced 25 mm apart and located on one side of the workpiece, and the vibration measurement points were all located on the other side of the workpiece corresponding to the hammering points. Theoretically, the position of the spraying point should be the same as the vibration measurement point, but because the vibration measurement point needs to be adhered to the sensor during the actual experimental process, resulting in the cutting fluid not being able to be sprayed at this point, the position of the CFS point was optimized and designed to be located at 10 mm below the corresponding vibration measurement point. The hammering points are denoted by the capital letters A–G, the vibration measurement points are denoted by the lowercase letters a–g, and the spraying points are denoted by the lowercase letters a′–g′, as shown in Figure 5.

3.4. Experimental Program

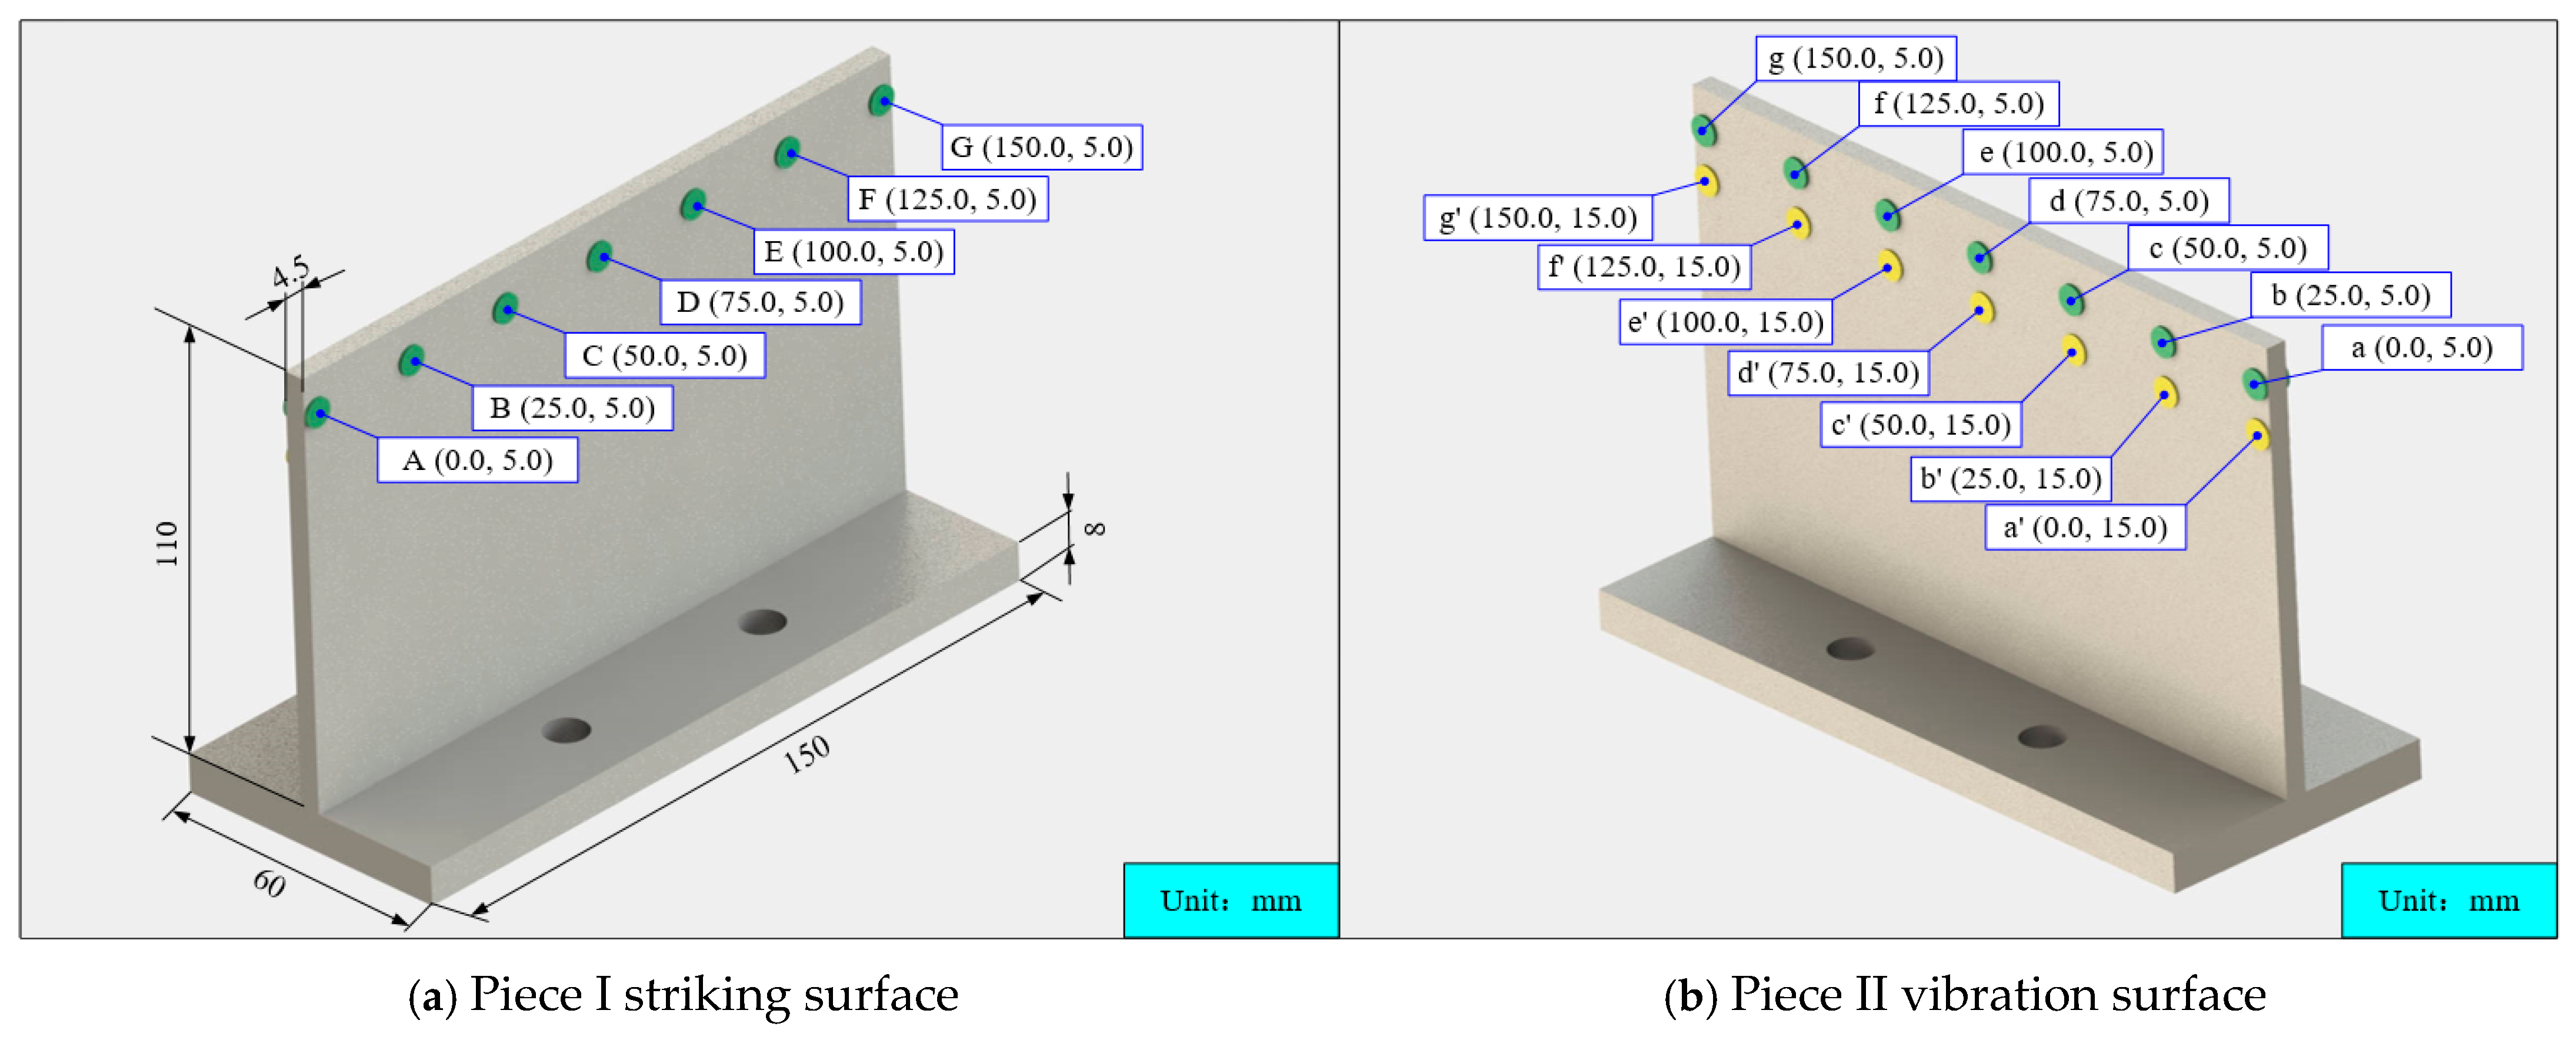
3.4.1. Hammering Test

A one-factor method was used in this experiment. Firstly, hammering experiments were carried out on piece I and piece II, respectively, without adding CFS in order to obtain their modal parameters and transfer functions. After obtaining these data, the transfer functions were fitted to the hammering points of the pieces, and the fitted results were compared with the experimental results to ensure the applicability of the experimental method and the accuracy of the results. After that, the hammering experiment was carried out on piece I under CFS conditions by changing the spraying position, speed, area, and angle in order to obtain the modal parameters and transfer function of the part under the above conditions. Then, the effect of CFS on the dynamic characteristics of the thin-walled parts was investigated by comparing these data. Finally, based on the experimentally obtained modal parameters, the dynamic characteristics of the thin-walled parts under CFS were modeled. The specific experimental parameter settings are shown in Table 1 and Table 2.
The experiments were all conducted using the single-point excitation–single-point response approach, i.e., by applying a hammer excitation at a specific point on the workpiece and then measuring the response at that point or another point on the workpiece. Before the beginning of the experiment, the workpiece, the signal acquisition system, and the CFS system were installed on the machine table, respectively. During the experiment, hammering experiments were carried out sequentially on piece I and piece II under the non-injected cutting fluid condition, and hammering experiments were carried out on piece I under the injected cutting fluid condition.
Firstly, the non-injected condition experiment was conducted, as shown in Figure 6a,b, where the vibration points were changed by bonding the sensors to different positions on the vibration-measuring surface, and excitation was applied to the corresponding points on the hammering surface. Subsequently, the experiments for CFS conditions were conducted, as shown in Figure 6c,d, where the position and angle of the spraying point were varied by controlling the machine tool and rotating the nozzle fixture. The cutting fluid flow rate was varied by adjusting the frequency of the pumping machine and reading the flowmeter indications, and the spraying area was varied by replacing the nozzle with different models. When the cutting fluid in the reservoir was exhausted, it was replenished using the machine’s own circulation system, as shown in Figure 6e.
In order to improve the accuracy of the experimental results, hammering was performed after the jet maintained a stable injection under CFS conditions. Since the excitation in the experimental program originates from the hammer hitting the workpiece, the position, strength, and angle of each hammer blow was maintained as consistent as possible to minimize any error caused by other factors.

3.4.2. Milling Test

Before the start of the experiment, the workpiece, force measurement system, vibration measurement system, and CFS system were installed on the machine table, respectively. The pumping machine was then tuned to ensure that it was able to provide accurate injection parameters. Programming was performed according to the experiment plan. Once the experiment began, the pump, machine tool, and each measurement system was run sequentially. Due to the complexity of the experimental process, the pump machine was stabilized to minimize any potential errors caused by other factors. The experiments employed a unilateral side milling mode, where the tool milled the thin-walled part from one end to the other, sequentially from A1 to A10. When the cutting fluid in the reservoir is depleted, the CFS system of the machine tool was utilized for replenishment. The milling experiment is shown in Figure 7.

4. Experimental Results Analysis

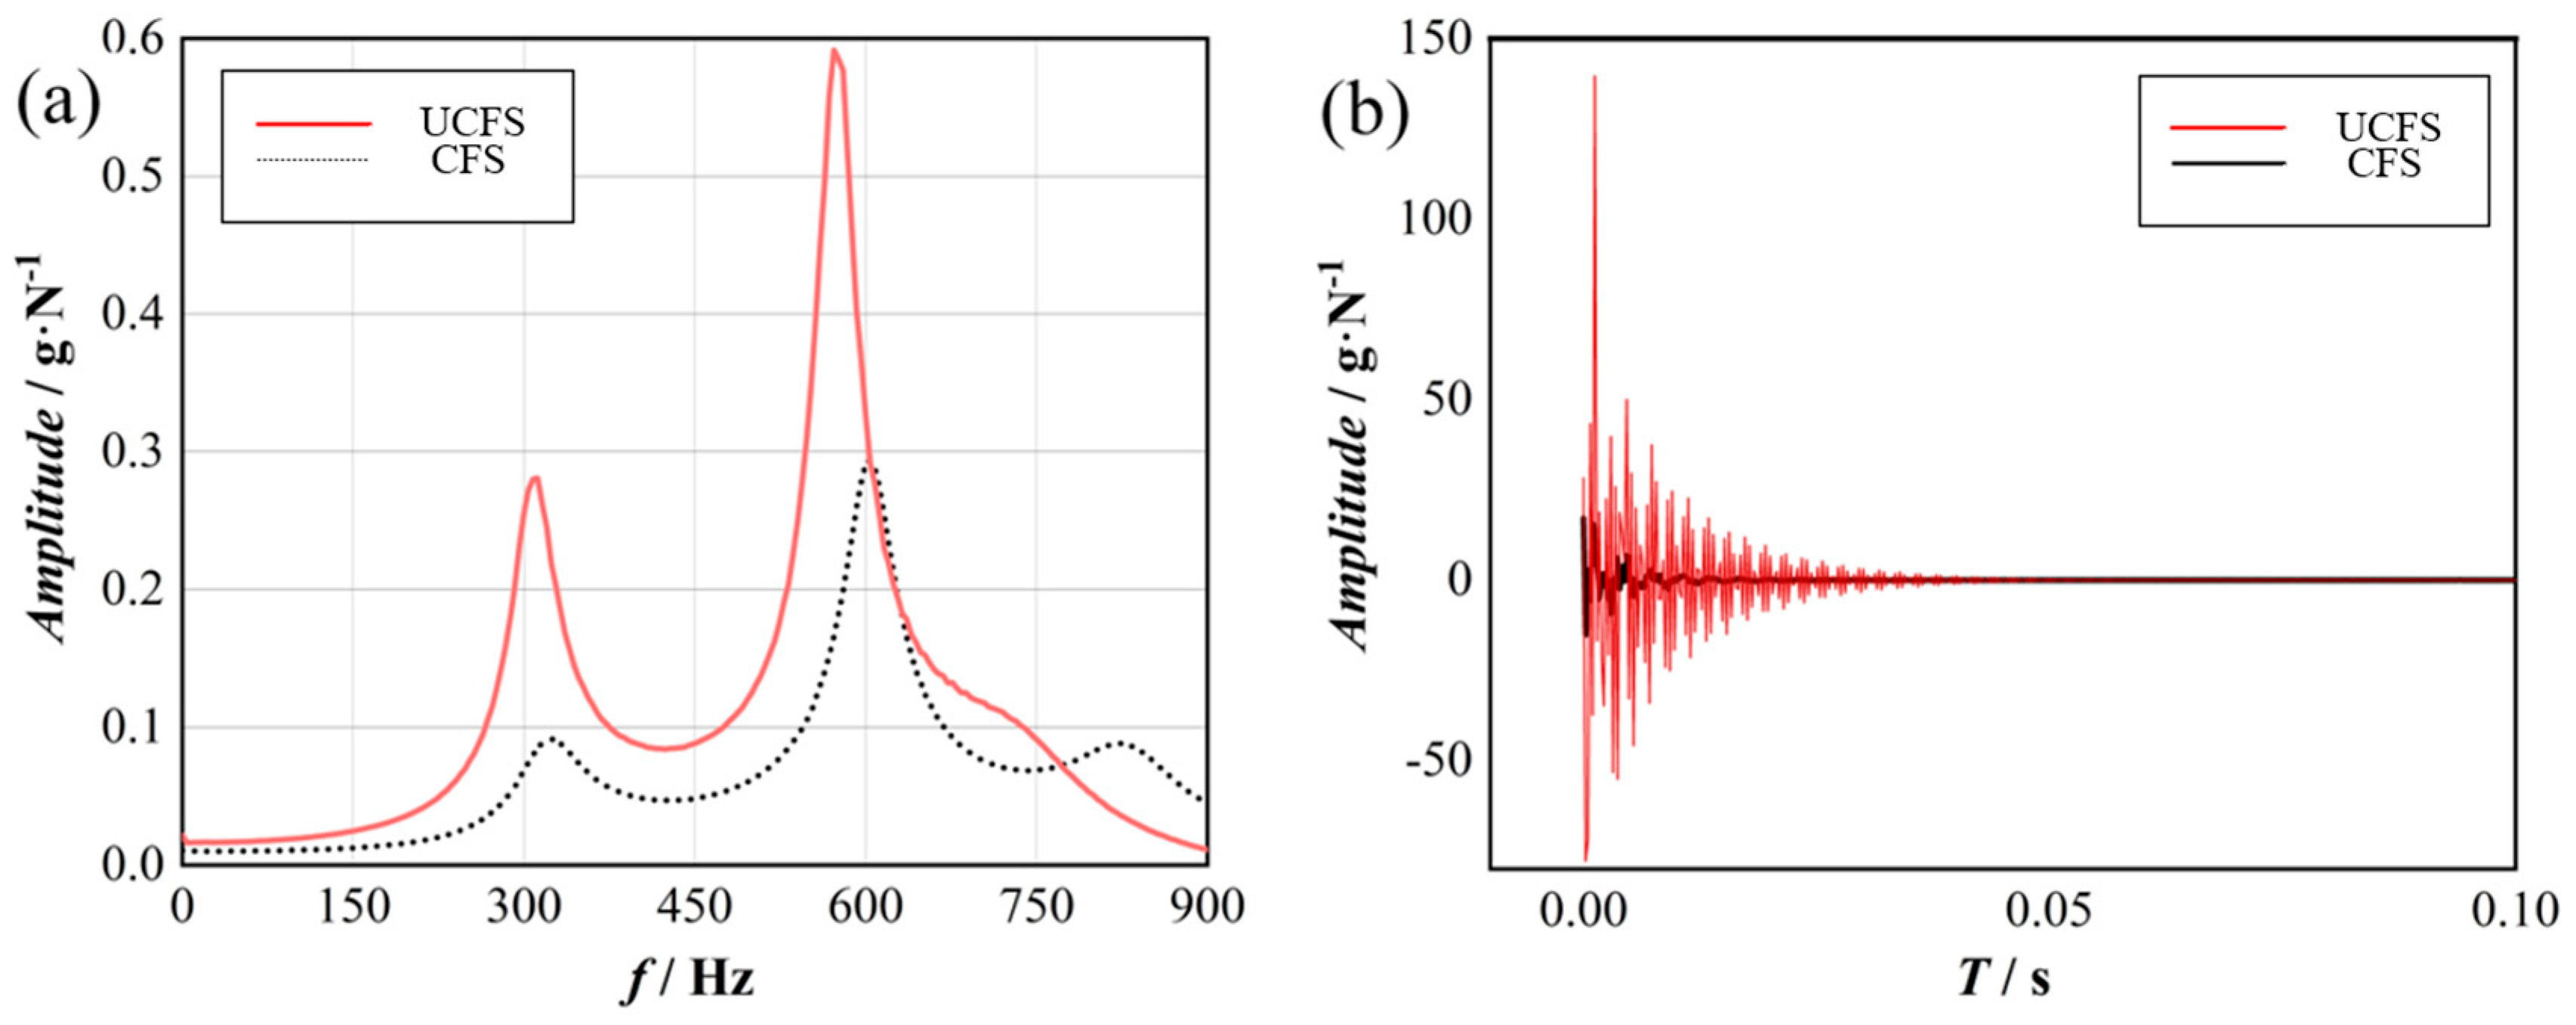
4.1. Analysis of Hammering Experiment Results

The effect of cutting fluid injection on the dynamic characteristics of thin-walled parts can be derived by comparing and studying the frequency- and time-domain response functions of the workpiece under different injection conditions. A total of 30 sets of hammering experiments with different conditions were conducted. Due to the large number of experimental results and considering the space limitation, five research themes are presented in this section, with a pair of experimental images selected for each for comparative analysis [24].
(1) The effect of cutting fluid injection on the dynamic characteristics of the workpiece when the injection point is located at a fixed point.
In this set of experiments, the results of Experiment 1 and Experiment 15 were selected for comparison; Experiment 1 utilized UCFS, and Experiment 15 CFS. The hammering point was located at point A, and the spraying point was located at point g′. The cutting fluid spraying velocity V = 10 m/s, the spraying area S = 31 mm2, the spraying angle θ = 0°, and the frequency- and time-domain plots are shown in Figure 8a,b, respectively.
Figure 8a shows that the peak value of the acceleration amplitude of the workpiece is significantly reduced under the cutting fluid’s fixed-point spraying condition. When the vibration frequency reaches the first-order intrinsic frequency, the peak values of acceleration amplitude without injection and with injection are 0.28 g/N and 0.09 g/N, respectively, with a reduction of 67.9%. When the vibration frequency reaches the second-order intrinsic frequency, the amplitude peak values are 0.59 g/N and 0.29 g/N, respectively, with a reduction of 50.8%. In addition, the values of the first- and second-order intrinsic frequencies of the workpiece under the spraying conditions display a small increase of 8.62 Hz and 38.75 Hz, respectively, equating to an increase of 2.7% and 6.8%, respectively.
It can be observed from Figure 8b that under the condition of cutting fluid jetting, the vibration amplitude of the workpiece decreases significantly, and the vibration decay time also shortens by a relatively large margin. By using the bilateral peak-finding method to calculate the mean acceleration amplitude values under different working conditions respectively, the results show that within 0.1 s of the input vibration signal, the mean acceleration amplitude values without and with cutting fluid jetting are 9.56 g/N and 1.03 g/N respectively, representing a reduction of 89.2%. In addition, the vibration decay times without and with cutting fluid jetting are 0.05 s and 0.02 s respectively, with a reduction of 60%.
The above phenomena occurs due to the fact that under the action of cutting fluid injection, the support and damping effect brought to the workpiece greatly suppresses its vibration response, increasing its mass and rigidity at the current position.
(2) The effect of cutting fluid injection on the dynamic characteristics of the workpiece when the injection point and hammering point are located at the same position.
In this set of experiments, the results of Experiment 5 and Experiment 23 were selected for comparison. Experiment 5 utilized UCFS, and Experiment 23 utilized the same injection and hammering points. The spraying point was actually located 10 mm below the vibration point of the workpiece, which can be approximated as the same spraying and hammering point. The hammering point was located at point E, and the spraying point was located at point e′. The cutting fluid injection velocity V = 10 m/s, the injection area S = 31 mm2, the injection angle θ = 0°, and the frequency- and time-domain results are shown in Figure 9a,b, respectively.
Figure 9a shows the peak value of the acceleration amplitude of the workpiece is significantly reduced when the spraying and hammering points coincide. When the vibration frequency reaches the first-order intrinsic frequency, the peak acceleration amplitudes of the non-injected and injected conditions are 0.38 g/N and 0.19 g/N, respectively, with a reduction of 50%. When the vibration frequency reaches the second-order intrinsic frequency, the amplitudes are 1.59 g/N and 0.49 g/N, respectively, with a reduction of 69.2%. In addition, the first- and second-order intrinsic frequency values of the workpiece under the spraying condition do not change significantly.
Figure 9b shows that the vibration amplitude of the workpiece is significantly reduced when the spraying and the hammering points coincide, and the vibration decay time is not much different. Within 0.1 s of inputting the vibration signal, the average values of the acceleration amplitudes of the unjetted and jetted conditions are 9.8 g/N and 2.48 g/N, respectively, with a reduction of 74.7%.
The principle of the above phenomena is the same as that described in (1). However, the first- and second-order intrinsic frequency values under the two working conditions do not change significantly, probably due to the choice of the experimental point in this group, point E, which is nearer to the midpoint of the workpiece and has a greater stiffness. Whereas in (1), point A is chosen as the experimental point, which is the end point of the workpiece, so the intrinsic frequency change of point A is relatively more obvious under the action of cutting fluid under the same spraying parameters.
(3) Influence of cutting fluid injection velocity V on the dynamic characteristics of the workpiece.
In this set of experiments, the results of Experiment 19 and Experiment 26 were selected for comparison, with a jet velocity V of 10 m/s and 13 m/s, respectively, and the experimental conditions were such that the jet point and hammering point were located at the same position. The hammering point was located at point A, and the spraying point was located at point a′. The cutting fluid spraying area S = 31 mm2, and the spraying angle θ = 0°. The frequency- and time-domain results are shown in Figure 10a,b, respectively.
Figure 10a shows that the peak value of the acceleration amplitude of the workpiece is reduced for V = 13 m/s compared to V = 10 m/s. When the vibration frequency reaches the first-order intrinsic frequency, the peak values of acceleration amplitude of V = 13 m/s and V = 10 m/s are 0.09 g/N and 0.28 g/N, respectively, with a reduction of 67.9%. When the vibration frequency reaches the second-order intrinsic frequency, they amplitudes are 0.29 g/N and 0.42 g/N, respectively, with a reduction of 30.9%. The values of the first- and second-order intrinsic frequencies are slightly reduced.
Figure 10b shows that the vibration amplitude of the workpiece is significantly reduced for V = 13 m/s compared to V = 10 m/s, and the difference in vibration decay time is not significant. Within 0.1 s of inputting the vibration signal, the average values of acceleration amplitude of V = 13 m/s and V = 10 m/s are 1.02 g/N and 4.21 g/N, respectively, and the reduction amplitude is 75.8%.
As the cutting fluid injection speed increases, the support force brought to the workpiece further increases, which in turn increases the rigidity of the workpiece and makes its vibration amplitude decrease; the mass of the cutting fluid received by the workpiece per unit of time becomes larger, resulting in the mass of the workpiece becoming larger, and the intrinsic frequency is slightly reduced.
(4) Influence of cutting fluid spray area S on workpiece dynamic characteristics.
In this set of experiments, the results of Experiment 19 and Experiment 28 were selected for comparison, with a jet velocity S of 31 mm2 and 88 mm2, respectively, and the experimental conditions were such that the jet and hammering points were located at the same position. The hammering point was located at point A, and the spraying point was located at point a′. The cutting fluid injection velocity V = 10 m/s, and the injection angle θ = 0°. The frequency- and time-domain results are shown in Figure 11a,b, respectively.
Figure 11a shows that the peak value of the workpiece acceleration amplitude is increased for S = 88 mm2 compared to S = 31 mm2. When the vibration frequency reaches the first-order intrinsic frequency, the peak values of acceleration amplitude of S = 88 mm2 and S = 31 mm2 are 0.21 g/N and 0.09 g/N, respectively, with the upward value of 133.3%. When the vibration frequency reaches the second-order intrinsic frequency, the amplitudes are 0.31 g/N and 0.29 g/N, respectively, with the upward value of 6.9%. The peak values of the acceleration amplitude of S = 88 mm2 compared to S = 31 mm2 are not that different in the first-order intrinsic frequency; the first-order intrinsic frequency does not change much, and the second-order intrinsic frequency decreases.
Figure 11b shows that the vibration amplitude of the workpiece is significantly increased and the vibration decay time is increased for S = 88 mm2 compared to S = 31 mm2. Within 0.1 s of the input vibration signal, the mean values of the acceleration amplitude of S = 88 mm2 and S = 31 mm2 are 5.36 g/N and 1.02 g/N, respectively, with an upward value of 426.9%. The vibration decay time of the former and the latter are 0.026 s and 0.02 s, respectively, with an upward value of 30%.
Since the cutting fluid flow rate is greatly increased with an increase in cutting fluid injection area, the workpiece is subjected to excessive injection force, and additional excitation is applied to the workpiece, which leads to an increase in workpiece amplitude. Also, the increased mass decreases the intrinsic frequency of the workpiece.
(5) Influence of cutting fluid spraying angle θ on the dynamic characteristics of the workpiece.
In this set of experiments, the results of Experiment 22 and Experiment 30 were selected for comparison. The spraying angles θ were 0° and 30°, and the spraying and hammering points were located at the same position. The hammering point was located at point D, and the spraying point was located at point d′. The cutting fluid spraying velocity V = 10 m/s, and S = 31 mm2. When θ = 30°, according to the trigonometric function calculation, the actual area of the workpiece affected by the cutting fluid was about 42 mm2, while the content shown in Table 3 and above is based on the inner diameter of the cutting fluid nozzle and the cross-sectional area of the cavity. The frequency- and time-domain results are shown in Figure 12a,b, respectively.
Figure 12a shows that the peak value of the acceleration amplitude of the workpiece is significantly reduced for θ = 30°compared to θ = 0°. When the vibration frequency reaches the first-order intrinsic frequency, the peak values of acceleration amplitude of θ = 30°and θ = 0°are 0.05 g/N and 0.21 g/N, respectively, with a reduction of 76.2%. Since this experimental point is the midpoint of the workpiece, and there is no second-order modal parameter, the peaks corresponding to around 570 Hz in this figure correspond to other responses affected by experimental environmental factors.
Figure 12b shows that the vibration amplitude of the workpiece at θ = 30° is significantly lower, and the vibration decay time is also substantially lower, compared to θ = 0°. Within 0.1 s of inputting the vibration signal, the average values of the acceleration amplitude of θ = 30° and θ = 0° are 1.66 g/N and 6.57 g/N, respectively, with a reduction of 74.7%. At θ = 0°, the amplitude of the vibration of the workpiece is not completely attenuated even after 0.1 s, and at θ = 30°, the vibration amplitude of the workpiece is not completely attenuated until 0.07 s.
Since changing the spray angle changes the direction of the spray force, the vertical spray force is reduced while the spray area is increased, thus reducing the acceleration amplitude. Different cutting fluid injection angles will cause different vibration mode excitations or inhibitions, and thus may contribute to the phenomenon.
In summary, when the spray point and the hammering point are located in the same position, the spray flow rate is 13 m/s, the spray area is 31 mm2, and the spray angle is 30°; the acceleration amplitude of the workpiece is the lowest, i.e., the vibration suppression effect is the best.

4.2. Cutting Experiment Results Analysis

4.2.1. Cutting Forces Analysis

After using Dynoware software to measure the force data of the workpiece, the txt file was exported and transferred to Origin software to process, which can fit the time-domain graph of the force (Fx, Fy, Fz) of the workpiece in the X, Y, and Z directions, respectively. The average values ( F ¯ x, F ¯ y, F ¯ z) are obtained by using the bilateral peak-finding method. The average value of the combined force on the workpiece can be calculated from the following equation F ¯ .
F = F x 2 + F y 2 + F z 2
After the experiments, the results, as shown in Table 4, were analyzed separately. Specifically at n = 5000 r/min, the effect of different Vf on the workpiece force under the sprayed or unsprayed conditions were assessed, as shown in Figure 13. First of all, the workpiece forces under the UCFS condition were smaller than those under the CFS condition. This is due to the fact that the spraying force brought by the cutting fluid counteracts part of the milling force, resulting in a lower workpiece force. Secondly, under the same machining parameters, the milling force on the workpiece was in the order of Fx > Fy > Fz, and under the spraying condition, the reduction in Fx was the largest, with the maximum value occurring at Vf = 400 mm/min, and the reduction reached 20.3%. This is due to the experimental milling being side milling, and the spray angle being directed to the back of the vertical thin-walled part processing surface, in the opposite direction of Fx, resulting in the obvious force offset effect. Again, all three directions of force increase with an increase in feed rate. This is due to the fact that the increase in feed rate results in an increase in the area of cutting material removed per unit of time, requiring a greater force to overcome the milling resistance [25]. Finally, as the feed rate increases, the effect of CFS in reducing the Fx milling force becomes greater, and the effect of reducing the Fy and Fz milling forces becomes less. This is due to the increase in feed rate, which increases the milling force on the workpiece; however, since the jet force is the in opposite direction of Fx, a reductive effect on Fx is evident, while a reduction in the Fy and Fz milling force effect is limited.
When Vf = 200 mm/min, the effect of different n values on the force of the workpiece under both conditions of spraying and non-spraying is shown in Figure 14, elucidating the effect of spindle speed n on the force of the workpiece. First of all, as can be obtained from the figure, with an increase in spindle speed, the workpiece is subjected to X, Y, and Z direction forces, and the combined force is reduced. As an increase in spindle speed increases the number of cuts per unit of time, the milling force has a shorter action time, resulting in its reduction [26]. Secondly, the workpiece forces in the CFS condition are less than those in the UCFS condition. At n = 5000 r/min, the workpiece forces in the CFS condition are reduced by 20.43% compared to the non-injected condition, while the workpiece forces in the CFS condition are reduced by only 10.15% at n = 2000 r/min. This is due to the fact that when the CFS parameter is kept constant, the force canceling effect is the same and does not change due to the change in machining parameters. When n = 2000 r/min, the workpiece is subjected to a larger milling force, and the force offset effect brought by CFS is not obvious; when n = 5000 r/min, the workpiece is subjected to a relatively small milling force, and the force offset effect is relatively obvious [27].
When n = 5000 r/min, and Vf = 200 mm/min, the effect of different V values on the workpiece force becomes noticeable. With an increase in injection speed, the workpiece force gradually reduces, in which the reduction in Fx is almost linear, while Fy and Fz first reduce by a large amount, and then the reduction is not obvious, as shown in Figure 15a. When V changes from 0 m/s to 10 m/s, the force reduction of the X, Y, and Z directions of the workpiece is 8.45%, 23.67%, and 24.68% respectively. When V changes from 10 m/s to 13 m/s, the force reduction in the X, Y, and Z directions of the workpiece is 10.68%, 4.93%, and 4.49%, respectively. The magnification of the local time domain of Fx is shown in Figure 15b. As can be seen, the fluctuation of the image with V = 0 m/s is the largest, the image with V = 10 m/s is the second largest, and the image with V = 13 m/s is the smallest. The reason for this phenomenon may be that ① after adding the conditions of CFS, the spray force and the cutting fluid interact to create a counteracting force effect, leading to a reduction in the three-directional forces of the unsprayed condition. ② When the CFS speed is further increased, the jetting force increases, and its direction is in the opposite direction of Fx, so Fx is further reduced, while the reduction in Fy and Fz is not obvious [28].
When n = 5000 r/min, and Vf = 200 mm/min, different S values on the workpiece force/vibration show significant effects. With a gradual increase in spray area, all three directions of force on the workpiece firstly decrease and then significantly increase. When S is changed from 0 mm2 to 31 mm2, as shown in Figure 16a, the magnitude of the change in force on the workpiece in the X, Y, and Z directions is −8.45%, −22.67%, and −24.68%, respectively, and the the magnitude of the change in force on the workpiece in the X, Y, and Z directions is 11.54%, 35.7%, and 38.61%, respectively, when S is changed from S = 31 mm2 to S = 88 mm2. As shown in Figure 16b, it can be obtained that the fluctuation of the image with S = 88 mm2 is the largest, the image with S = 0 mm2 is the second largest, and the fluctuation of the image with S = 31 mm2 is the smallest. The reasons for this phenomenon may be that ① after adding the condition of CFS, the workpiece is subjected to all three directions of force to produce a certain counteracting effect [29]. ② When the CFS area is further increased, the cutting fluid flow rate is greatly increased, and the pressure it exerts on the surface of the workpiece increases, subjecting it to additional injection loads, and this amount exceeds the part of the counteracting milling force, resulting in an increase in the force on the workpiece.

4.2.2. Vibration Analysis for Milling of Thin-Walled Parts

After using the Signature Acquisition module in the Simcenter Testlab software to measure the vibration data of the thin-walled parts, the txt file was exported and transferred to Origin for processing, and the vibration time-domain diagram of the workpiece was fitted. The vibration time-domain diagram of the workpiece is shown in Figure 17, corresponding to experiments A1, A5, and A7, respectively. Observing this figure, it can be obtained that the distribution of the vibration signals of the workpiece in the machining process shows a certain regularity, with the vibration amplitude being more pronounced during the initial and final 30% of the process, and notably lower in between [30]. Therefore, a phased approach is used to study the vibration amplitude of the workpiece machining, which can more accurately describe its vibration characteristics.
The average values of the vibration amplitude of the workpiece in different machining stages are calculated by using the bilateral peak-seeking method, and the average values of the overall vibration amplitude of the workpiece during the machining process are further calculated [30], as shown in Table 5. Since the acceleration sensor is used in the experiment, the results are obtained as the acceleration amplitude in g-N−1.

4.2.3. Analysis of Impact Factors and Comparative Discussion

For ease of representation, the average value symbols are no longer labeled in the text and images in this section, and the vibration amplitudes listed are the values in Table 5.
(1) n = 5000 r/min, different Vf in the injection or not under the conditions of the vibration amplitude of the workpiece machining impact.
Figure 18 show the effect of feed rate Vf on workpiece machining vibration at n = 5000 r/min. Workpiece machining vibration is smaller under the UCFS condition than the CFS condition. CFS improves the dynamic stiffness of the workpiece through support, with the liquid film formed by CFS providing damping and suppression of machining vibration. At Vf = 200 mm/min, the vibration suppression effect of CFS is small, with a minimum reduction of 0.05% in the middle of machining. At Vf = 300 mm/min and 400 mm/min, the suppression effect is large, with a maximum reduction of 74.1% in the middle of machining. The reason is that when n = 5000 r/min and Vf = 200 mm/min, the workpiece processing is stable, and the vibration is small, so the effect of CFS is not obvious. When n = 5000 r/min and Vf = 300/400 mm/min, the processing is unstable, and the support and damping effect of CFS is more significant [31].
(2) n = 2000 r/min, Vf = 200 mm/min, different machining stages under the conditions of spraying or not on the amplitude of the vibration of the workpiece.
The time-domain signal can be obtained by inverse fast Fourier transform to the corresponding frequency-domain signal. Figure 19 gives the frequency domain signals of different machining stages when n = 2000 r/min and Vf =200 mm/min. Figure 19a1–a3 present the vibration frequency-domain signals before, during, and after machining stages, respectively, while Figure 19b1–b3 denote the corresponding local magnification diagrams, respectively. From these, it can be seen that for the workpiece at any stage of machining, the vibration amplitude of the spray cutting fluid is less than the vibration amplitude of the unsprayed parts, and the vibration amplitude generated in the middle section of machining is slightly smaller than that of the pre-processing section and the section that follows it.
As the experimental tool is a three-tooth milling cutter, when n = 2000 r/min, the tooth passing frequency is 33.33 Hz, and the tool rotating frequency is 100 Hz. When the excitation frequency reaches the octave frequency of the above mentioned frequency, it will cause a larger amplitude of the system. In addition, under the condition of no cutting fluid injection, when the frequency f reaches about 300 Hz, a significant increase in amplitude occurs in all sections of machining, which is not only due to the fact that the excitation frequency reaches the octave frequency of the rotational frequency of the milling cutter, but also because it just reaches the first-order intrinsic frequency of the workpiece, and the phenomenon of resonance occurs at this time, leading to a larger amplitude [32]. After the CFS, the amplitude was obviously suppressed, indicating that the CFS not only suppressed the vibration but also increased the intrinsic frequency of the workpiece, so that the overall vibration characteristics of the workpiece have been improved.
(3) Vf = 200 mm/min, different n under the conditions of injection or not on workpiece machining vibration amplitude influence.
Figure 20 shows the influence of spindle speed n on workpiece machining vibration. First of all, as spindle speed increases, the vibration of the workpiece before and in the middle section of machining is reduced, while the change in the machining of the latter section is not obvious, and the total average value of the vibration amplitude is reduced. This is due to the fact that with an increase in spindle speed, the stability and dynamic characteristics of the workpiece during milling are improved, and the resonance phenomenon of the system is avoided to a certain extent. The insignificant change in the post-machining section may be due to the deformation of the workpiece during milling under jet conditions, which leads to an increase in material removal in the post-machining section, which in turn leads to an increase in amplitude [32].
Secondly, the workpiece machining amplitudes for the CFS condition are all smaller than the UCFS condition. The maximum reduction occurs in the pre-machining section at n = 5000 r/min, with a reduction of 25.4%, while the minimum reduction occurs in the mid-machining section at n = 5000 r/min, with a reduction of only 4.5%. A comparison of Figure 18 and Figure 20 shows that spindle speed has less influence than the feed rate in suppressing the machining vibration caused by cutting fluid.
(4) n = 5000 r/min, Vf =200 mm/min, S = 31 mm2, the effect of different V on the overall machining vibration amplitude of the workpiece.
Figure 21 gives the influence of the spraying speed V on the amplitude of workpiece machining vibration. As can be seen in the figure, with an increase in spraying speed, the overall vibration amplitude of the workpiece is first slowly reduced, and then more substantially reduced. In the absence of added injection conditions, the overall acceleration amplitude of the workpiece is 0.747 g/N. When the injection speed reaches 10 m/s, the overall acceleration amplitude is 0.707 g/N, and when the injection speed is further increased to 13 m/s, the overall acceleration amplitude is 0.644 g/N. The reduction reaches 5.35% and 8.91%, respectively.
The reasons for the above phenomenon may be as follows: ① After adding the CFS condition, the workpiece is supported by the cutting fluid, which improves the dynamic stiffness. The vibration amplitude under the same machining parameters is reduced, and after the spraying speed is further increased, the support effect is more obvious, and the amplitude of the workpiece is further reduced. ② CFS forms a liquid film on the surface of the workpiece, which brings a damping effect and enhances the vibration suppression ability of the workpiece. After the spraying speed is further increased, the volume of cutting fluid received by the workpiece in the unit of time increases, the thickness of the liquid film attached to the surface increases, and the liquid film dissipates slower, so the damping effect is further improved, and the effect of vibration suppression is better.
(5) n = 5000 r/min, Vf = 200 mm/min, V = 10 m/s, different S on the overall machining of the workpiece vibration amplitude effects.
Figure 22 gives the effect of spray area S on the amplitude of workpiece machining vibration. As can be seen in the figure, with an enhancement in spraying area, the overall vibration amplitude of the workpiece decreases slowly and then increases significantly. When the spraying condition is not added, the overall acceleration amplitude of the workpiece is 0.747 g/N. and when the spraying area reaches 31 mm2, the overall acceleration amplitude is 0.707 g/N, with a decrease of 5.35%. When the spraying area is further increased to 88 mm2, the overall acceleration amplitude is 0.916 g/N, with an increase of 29.56%.
The reasons for this phenomenon may be that ① after adding the condition of CFS, the amplitude of the workpiece decreases, following the same principle as the previous section. ② When the area of CFS is further increased, the flow rate of the cutting fluid is greatly enhanced, and the workpiece is subjected to an additional spray load, which brings vibration effects beyond the support and damping effect of the cutting fluid, worsening the stability of the workpiece in the machining process and greatly increasing the amplitude of vibration instead.

5. Conclusions

Taking 6061 aluminum alloy as the experimental material, this study proposes a CFS machining method with the core idea of reducing the vibration of thin-walled parts and verifies the feasibility and validity of the method via extending the application of the CFS system through theoretical analysis and experimental cutting research. The conclusions are as follows:
(1)
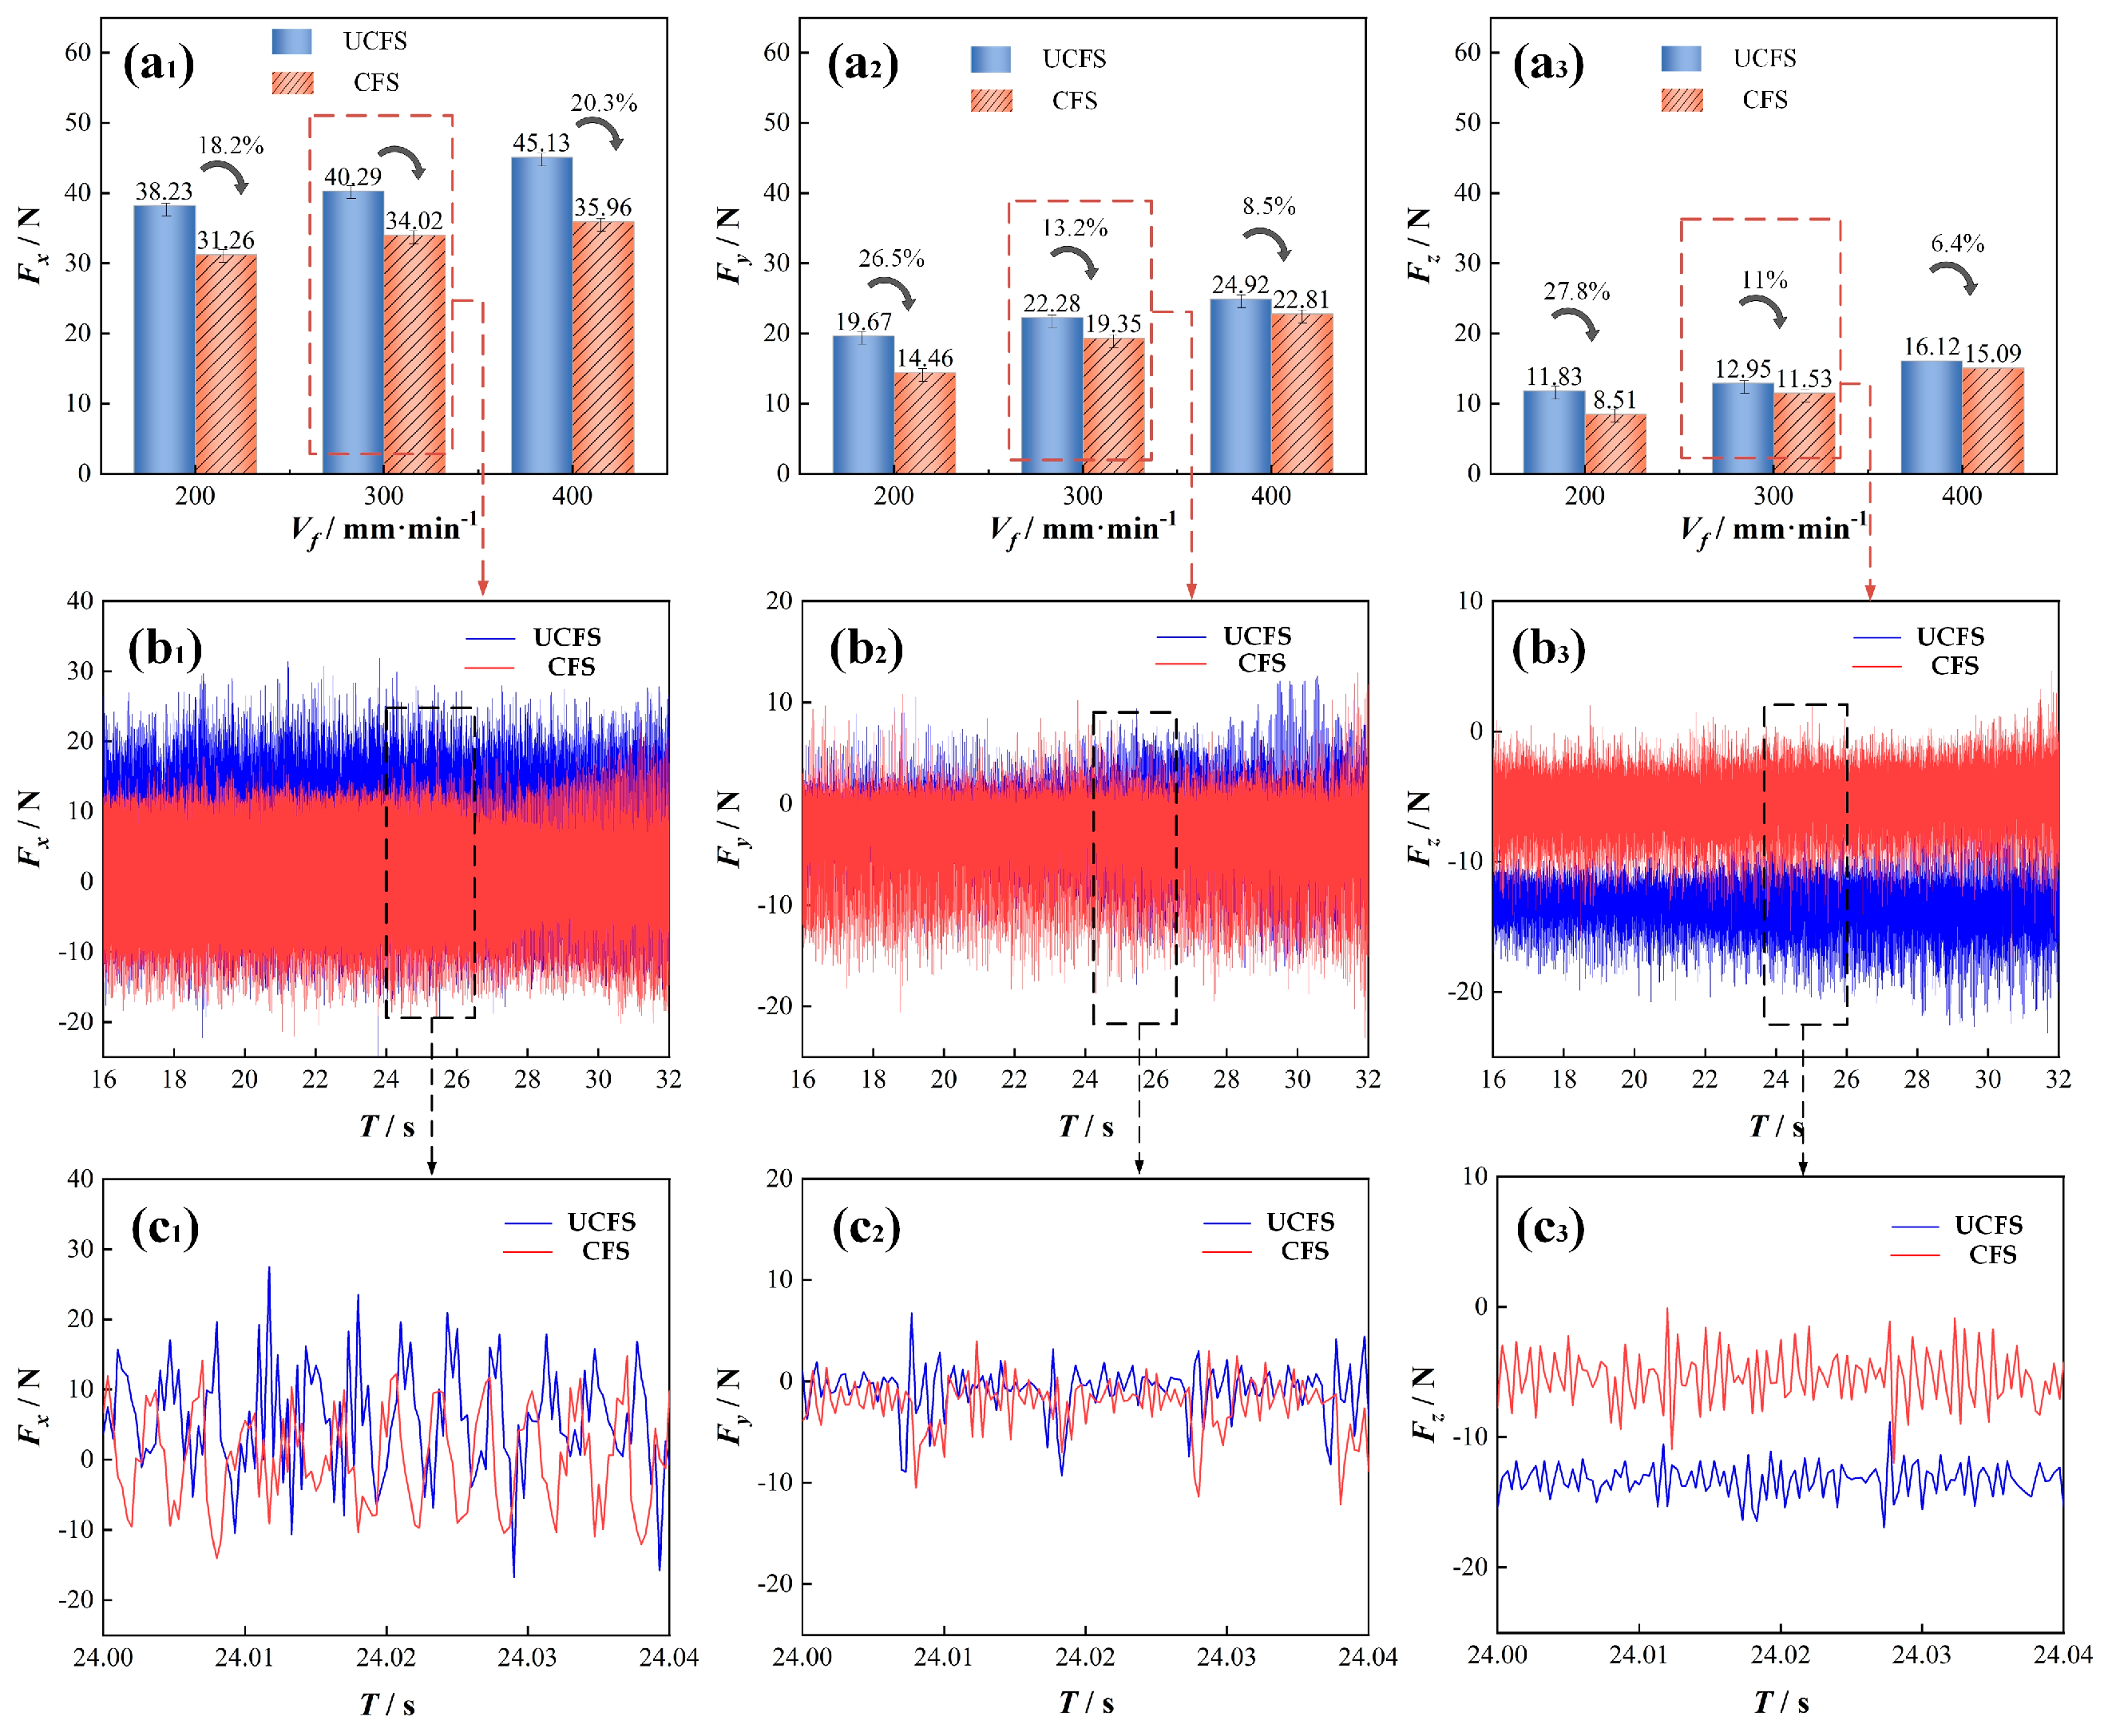
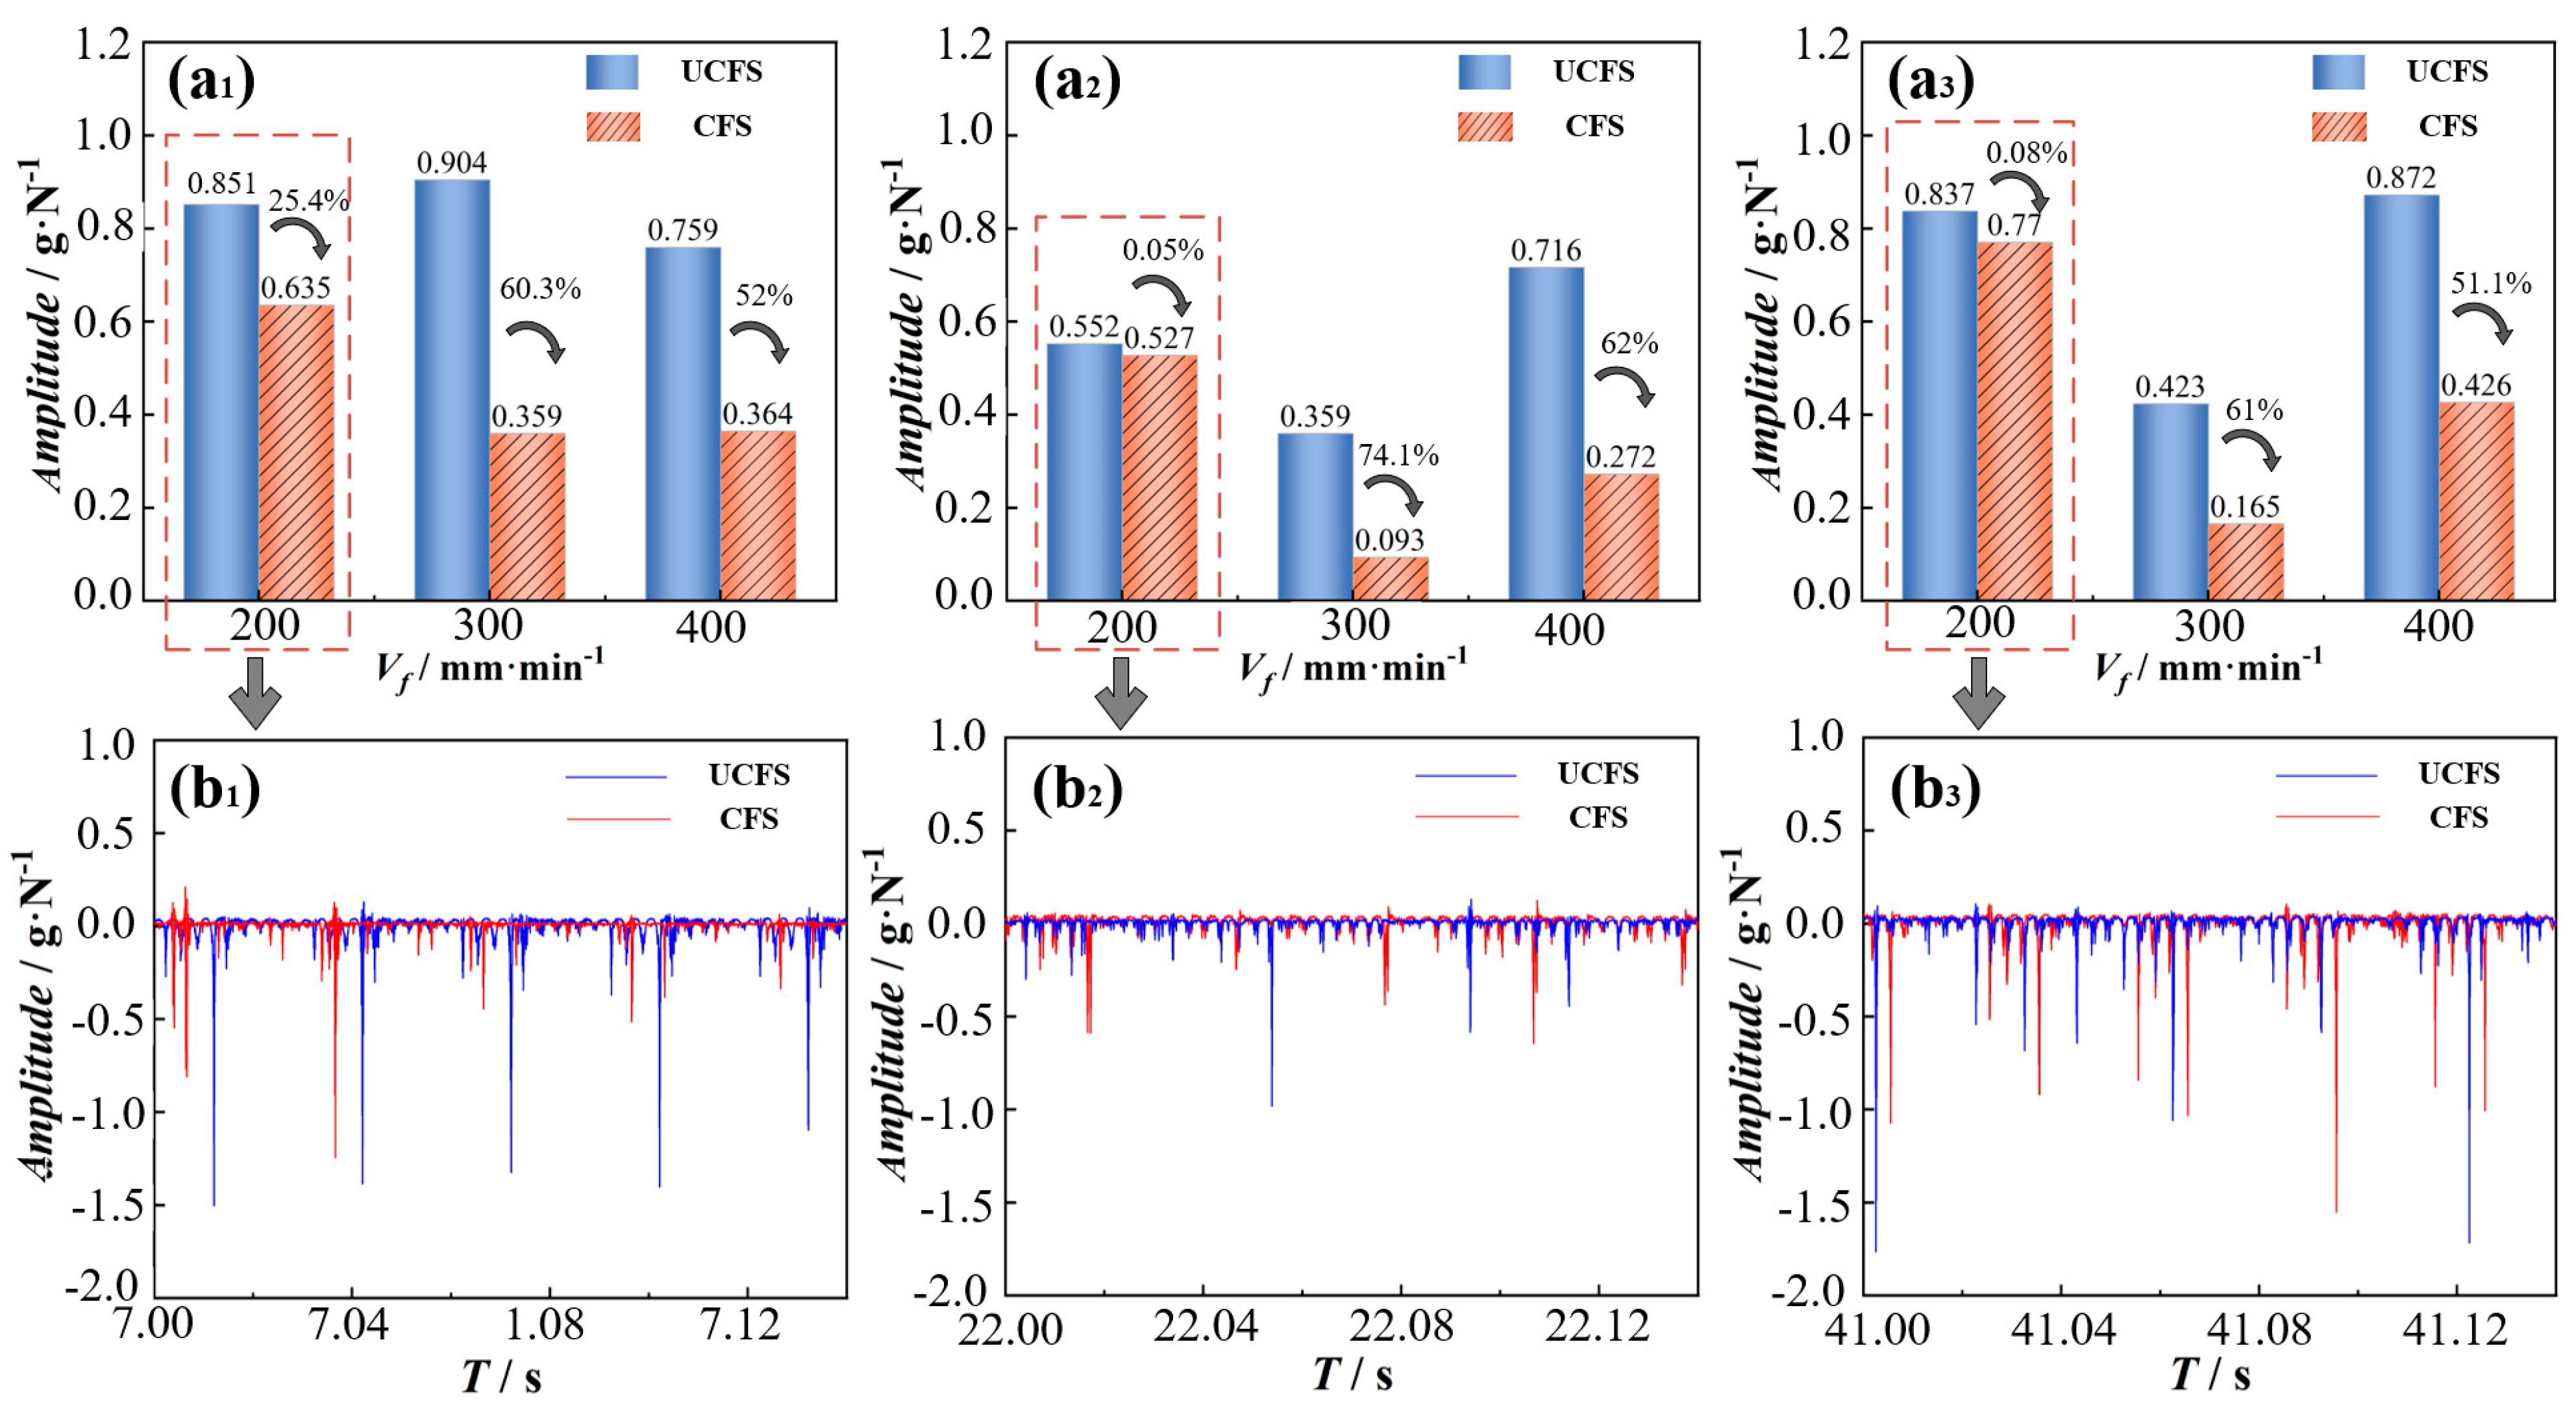
Compared with the non-injected condition, the workpiece force and vibration amplitude of the cutting fluid injection condition are significantly reduced, and under the machining parameters, the size of the milling force on the workpiece is in the order of Fx > Fy > Fz, and the effect of the cutting fluid injection to reduce the milling force of Fx becomes greater with an increase in the feed rate, while the effect of the reduction in the milling force of Fy and Fz becomes less with an increase in the feed rate. Furthermore, the effect of the milling force of Fy and Fz becomes less with an increase in the feed rate when the feed rate is increased by Vf = 300 mm/min. When Vf = 300 mm/min and Vf = 400 mm/min, the vibration suppression effect caused by cutting fluid injection is more obvious.
(2)
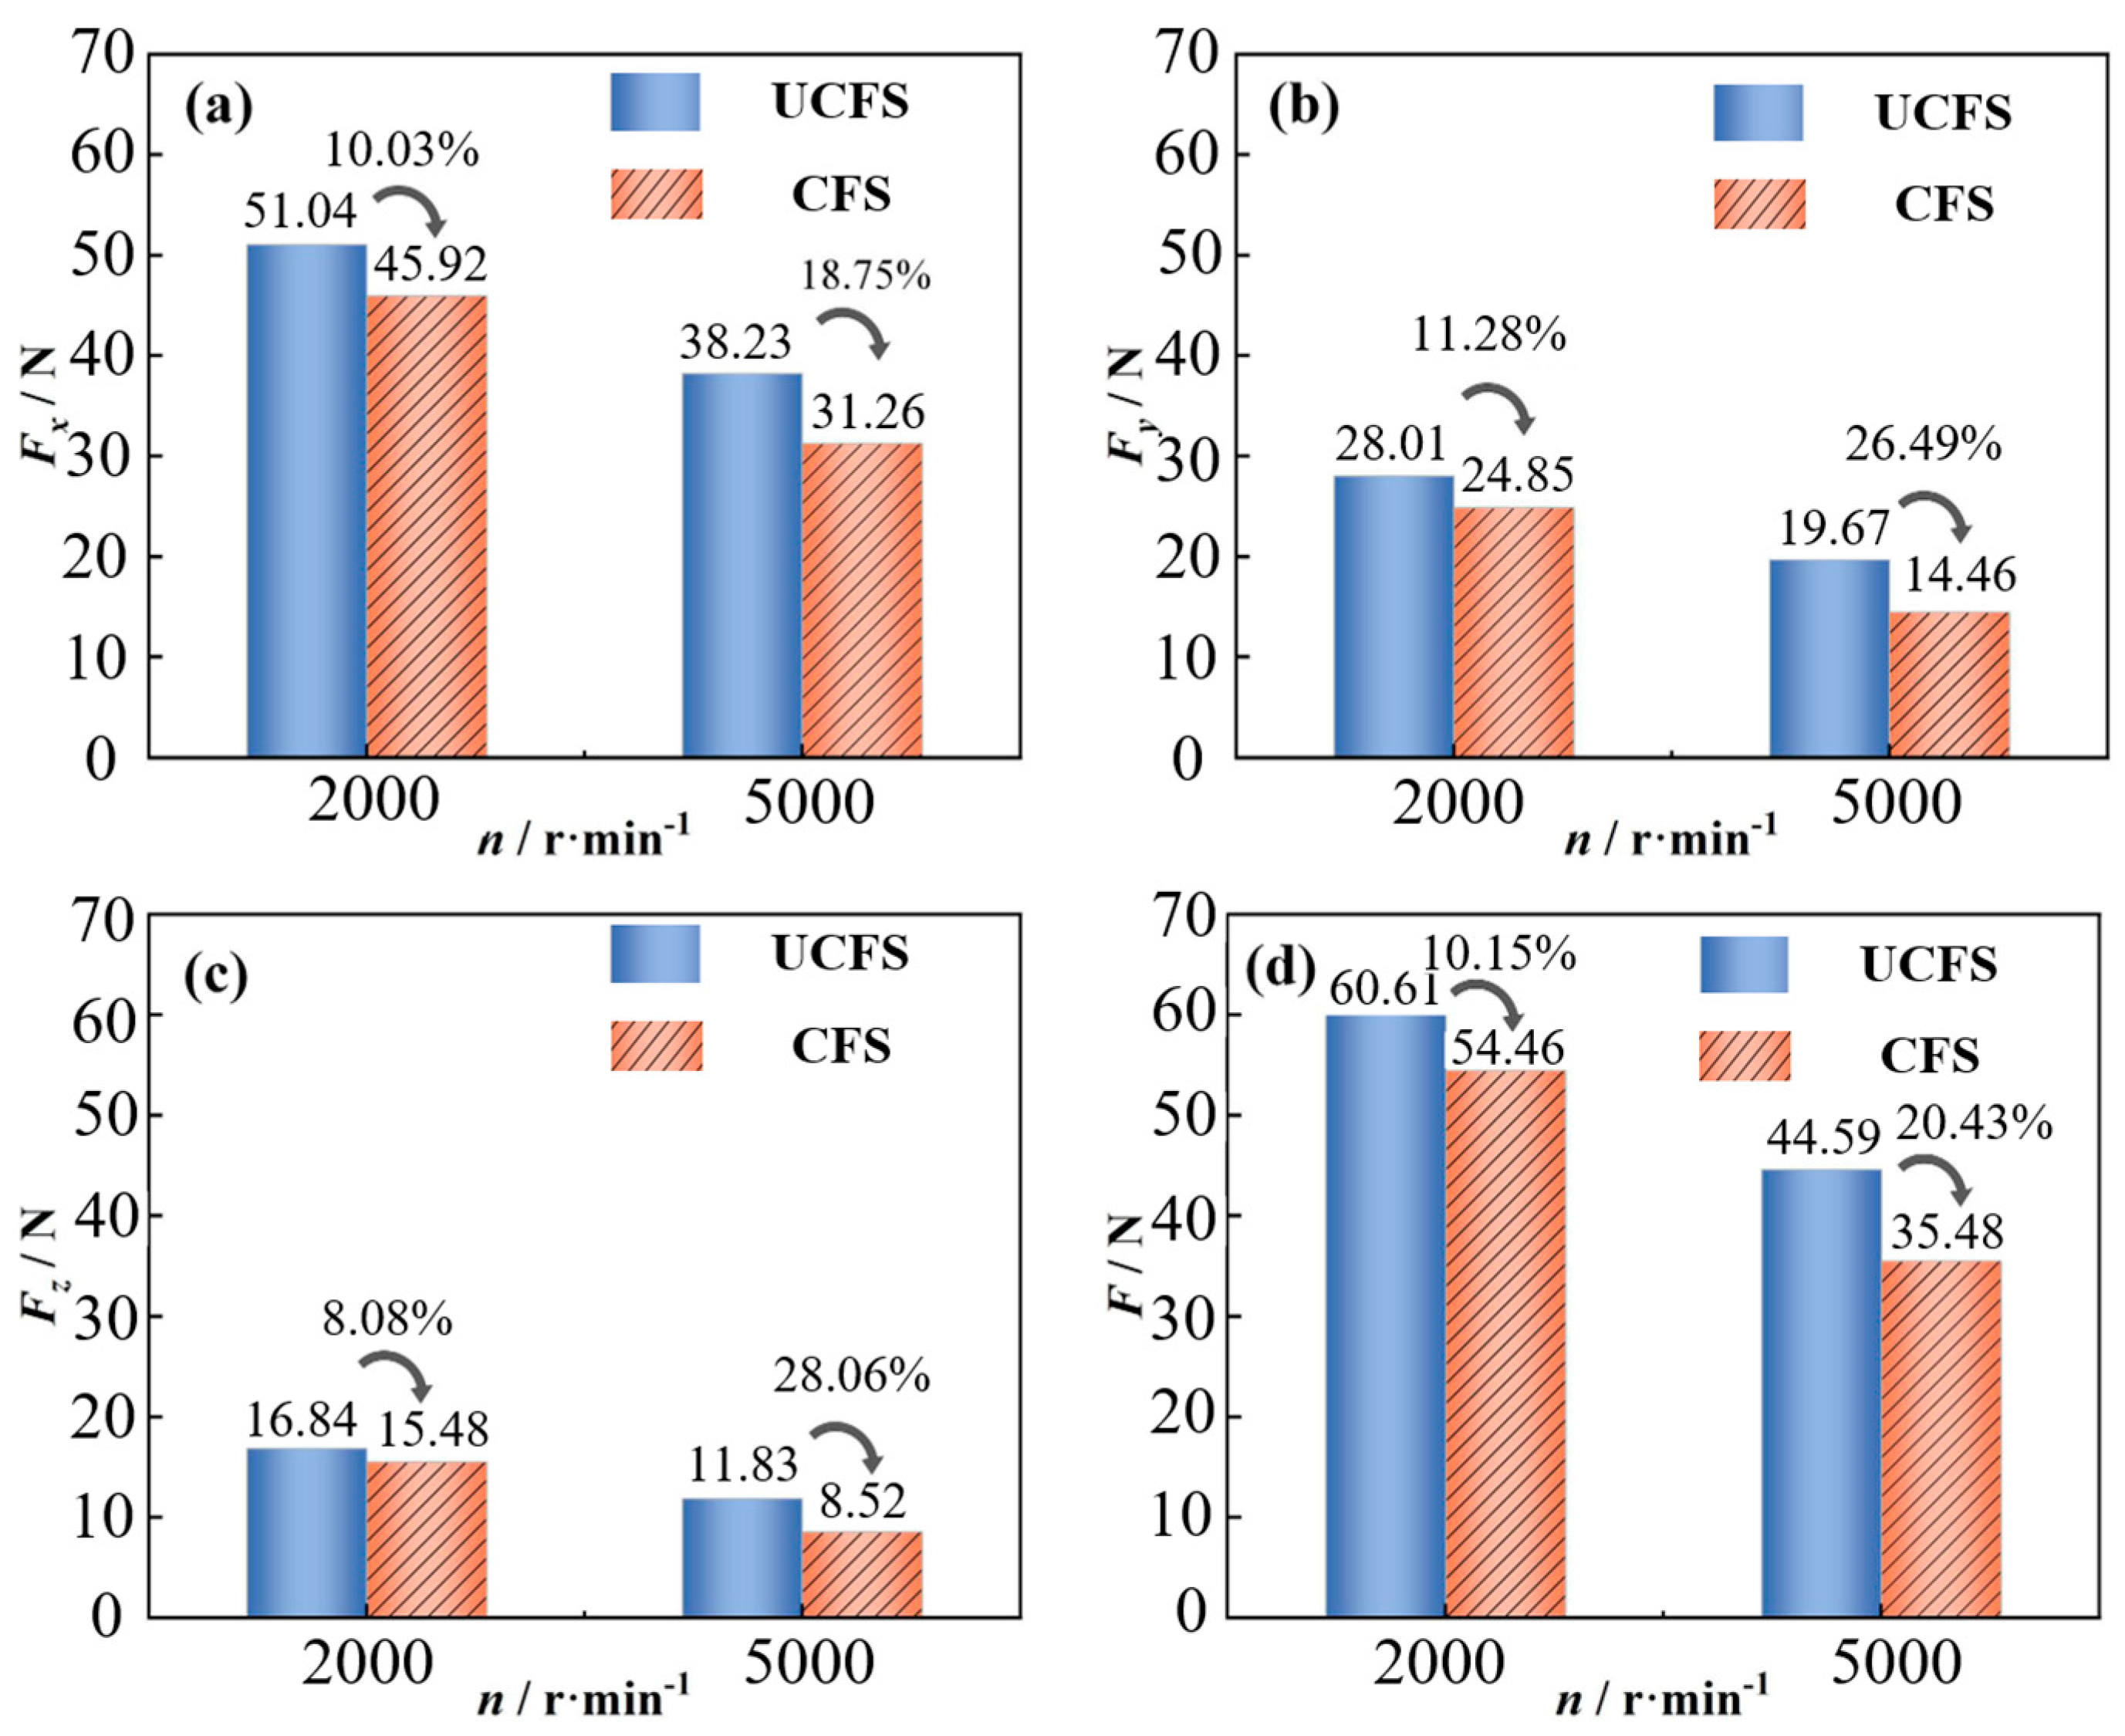
Compared with the non-injected condition, the force on the workpiece under the cutting fluid injection condition is reduced significantly. When n = 2000 r/min, the force and combined force on the workpiece in the X, Y, and Z directions is reduced by 10.03%, 11.28%, 8.08%, and 10.15%, respectively.
(3)
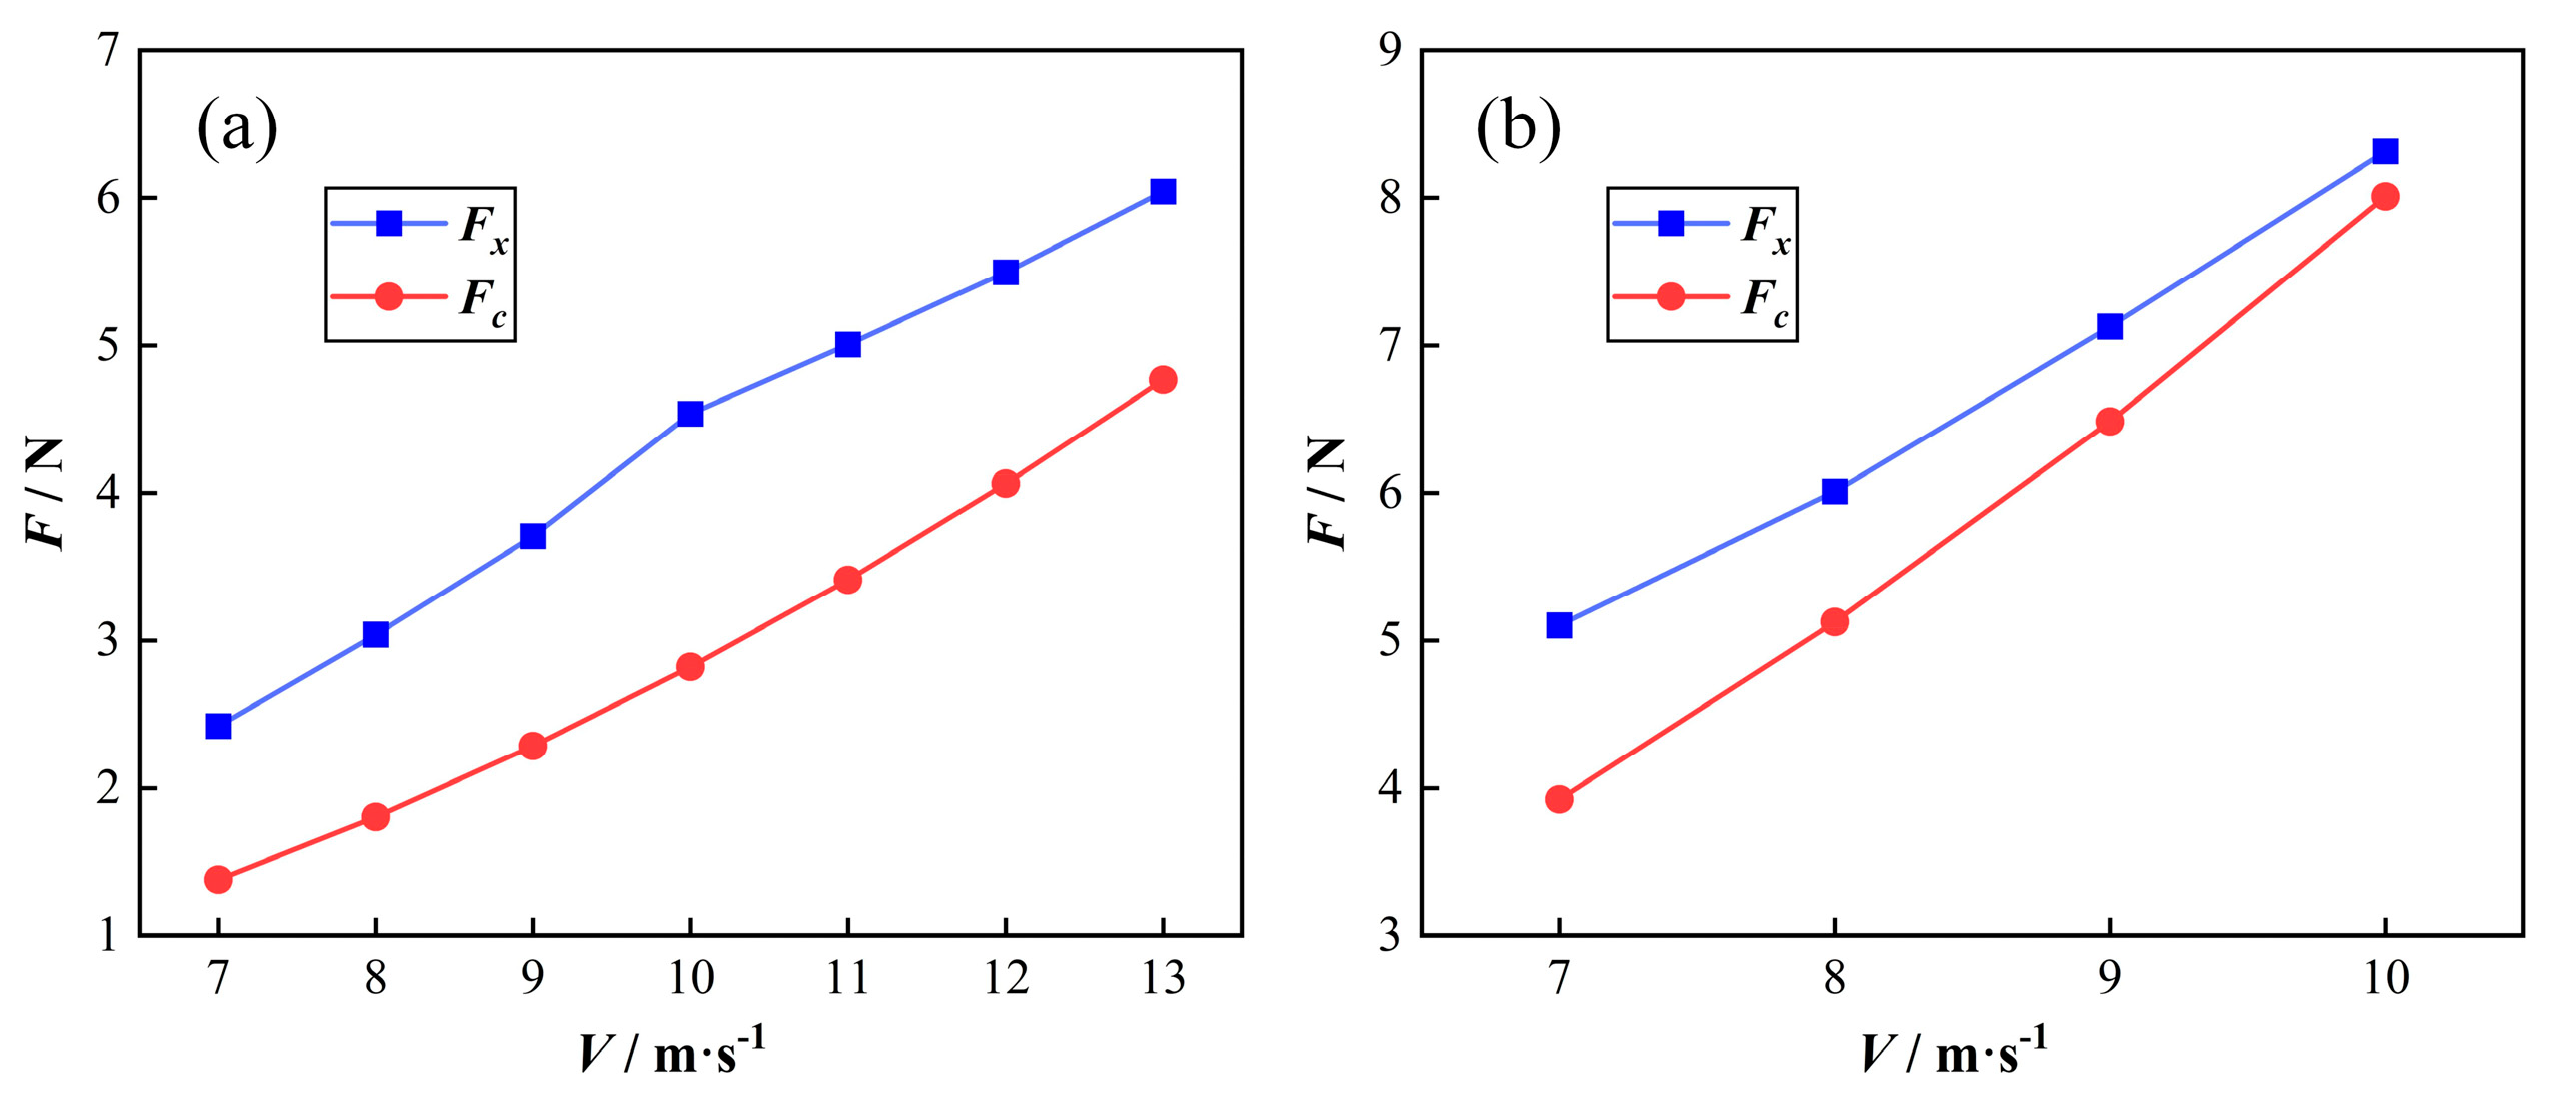
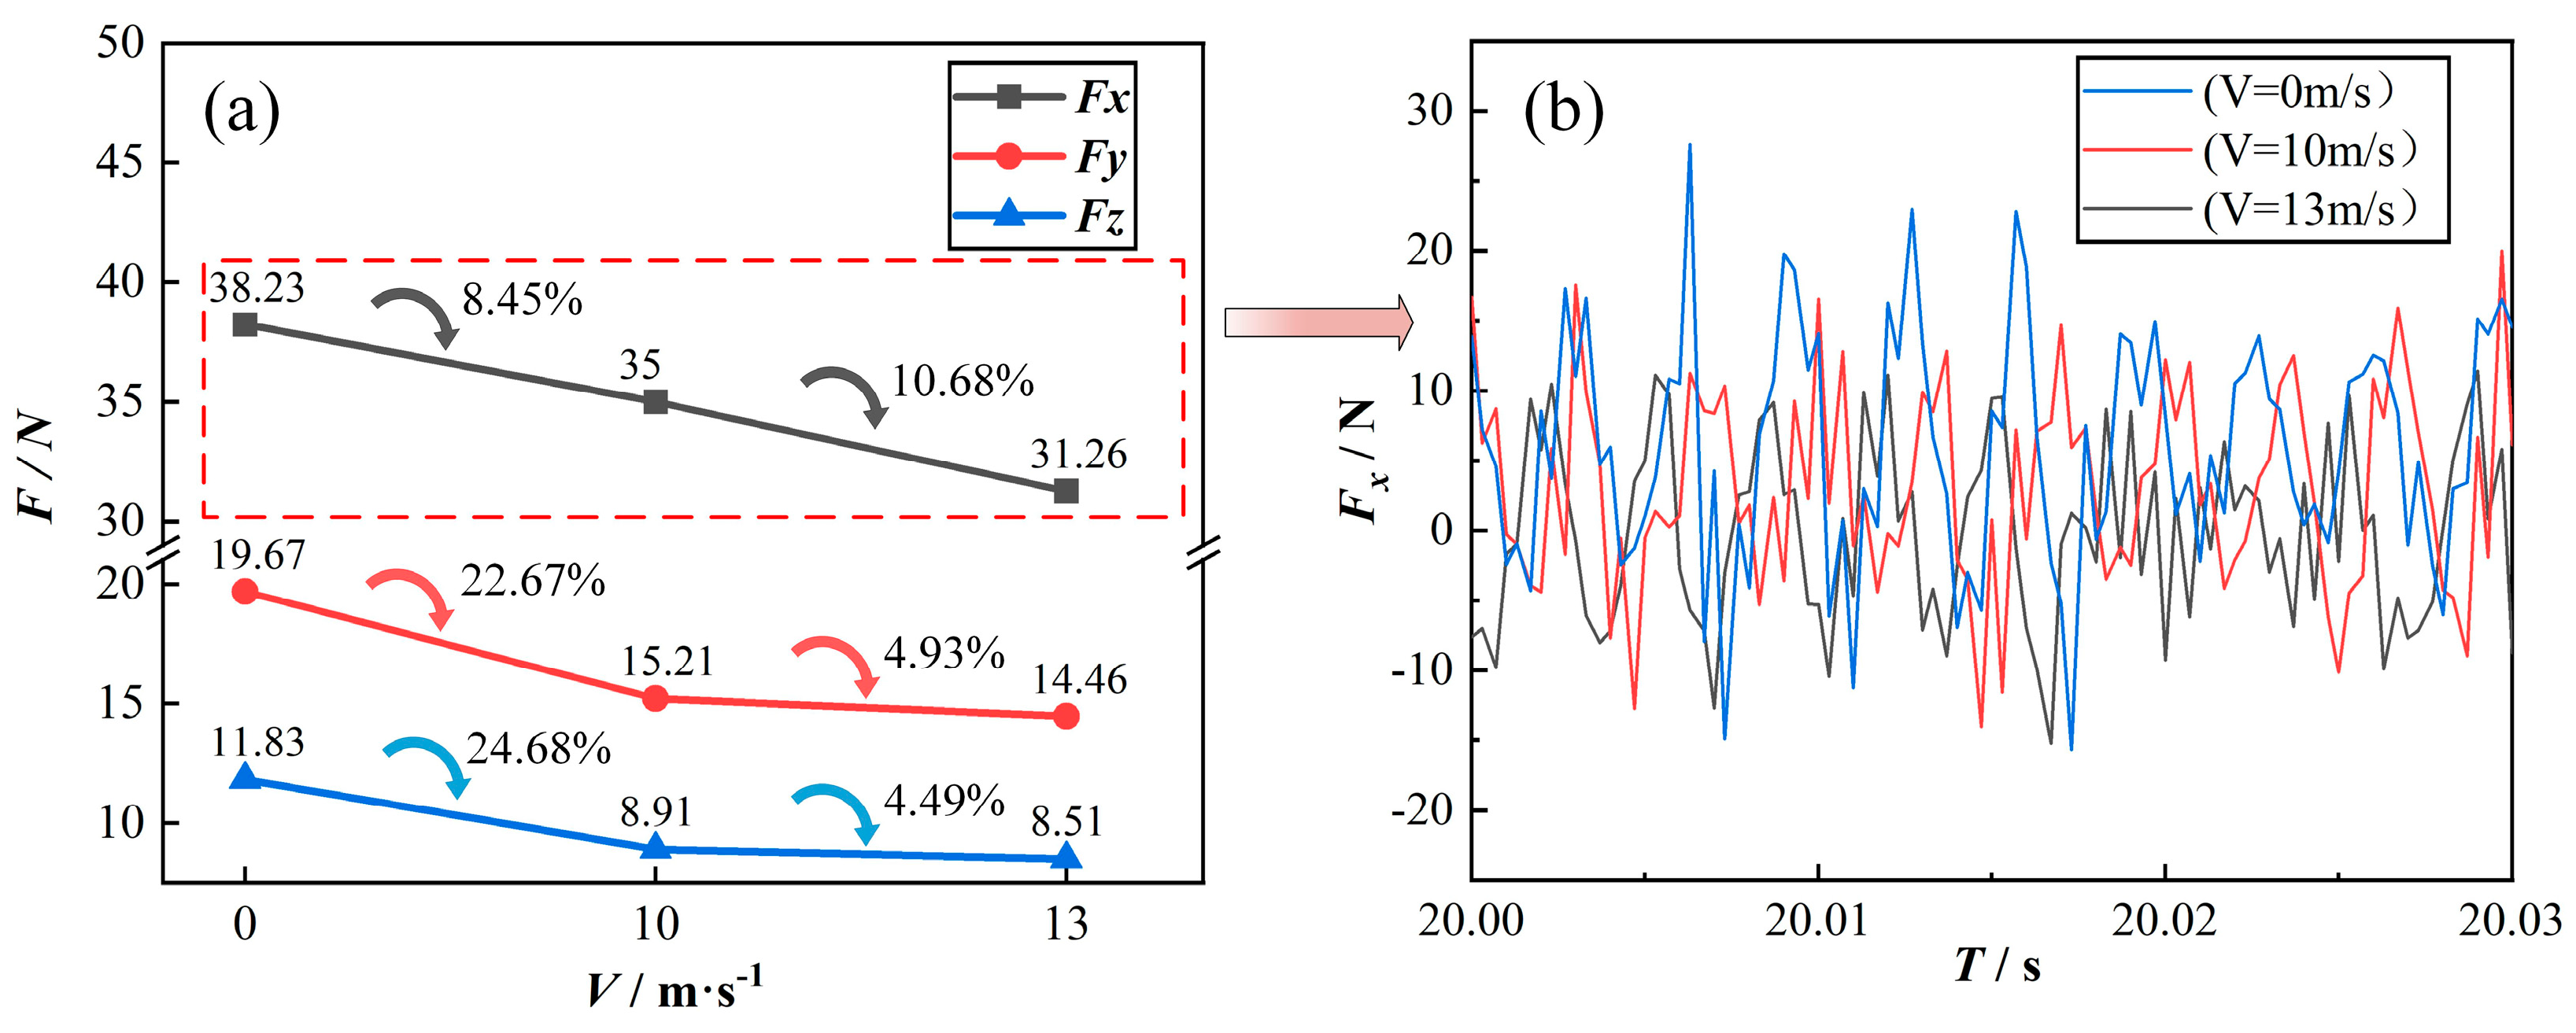
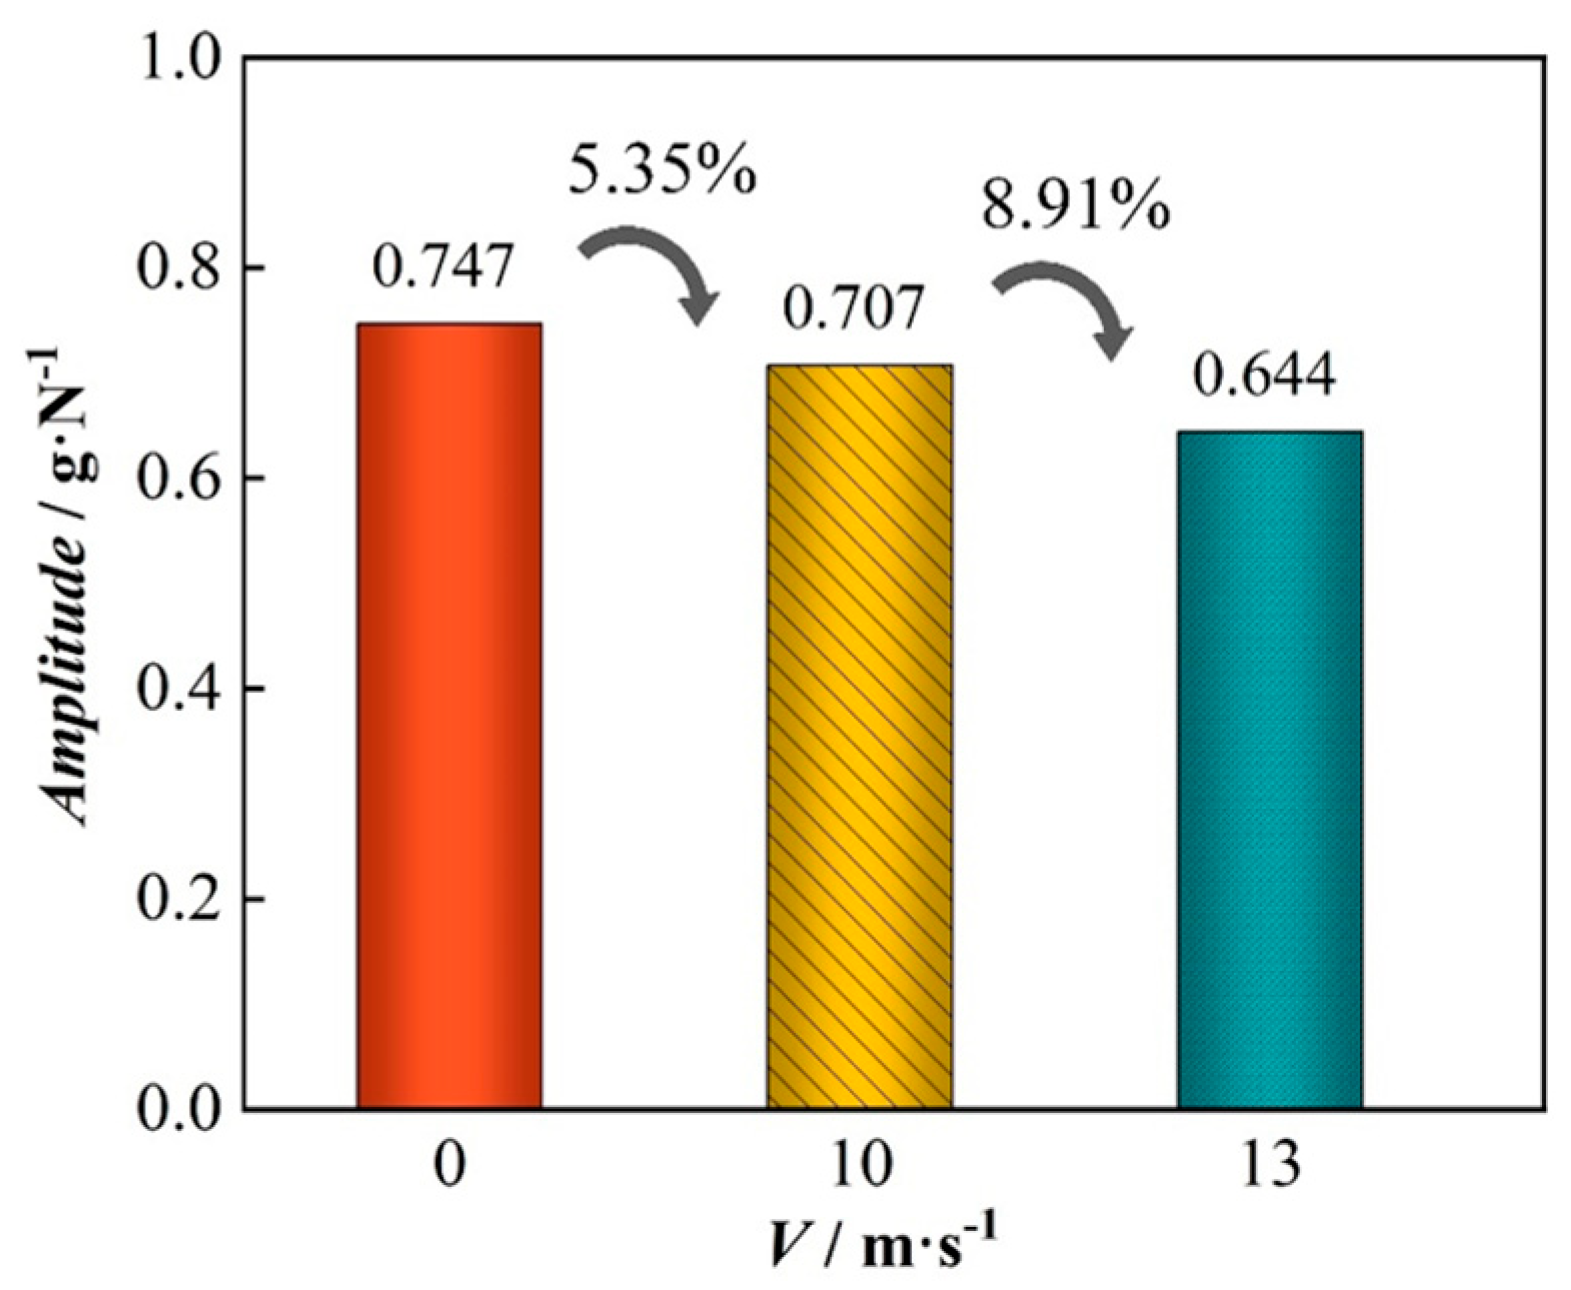
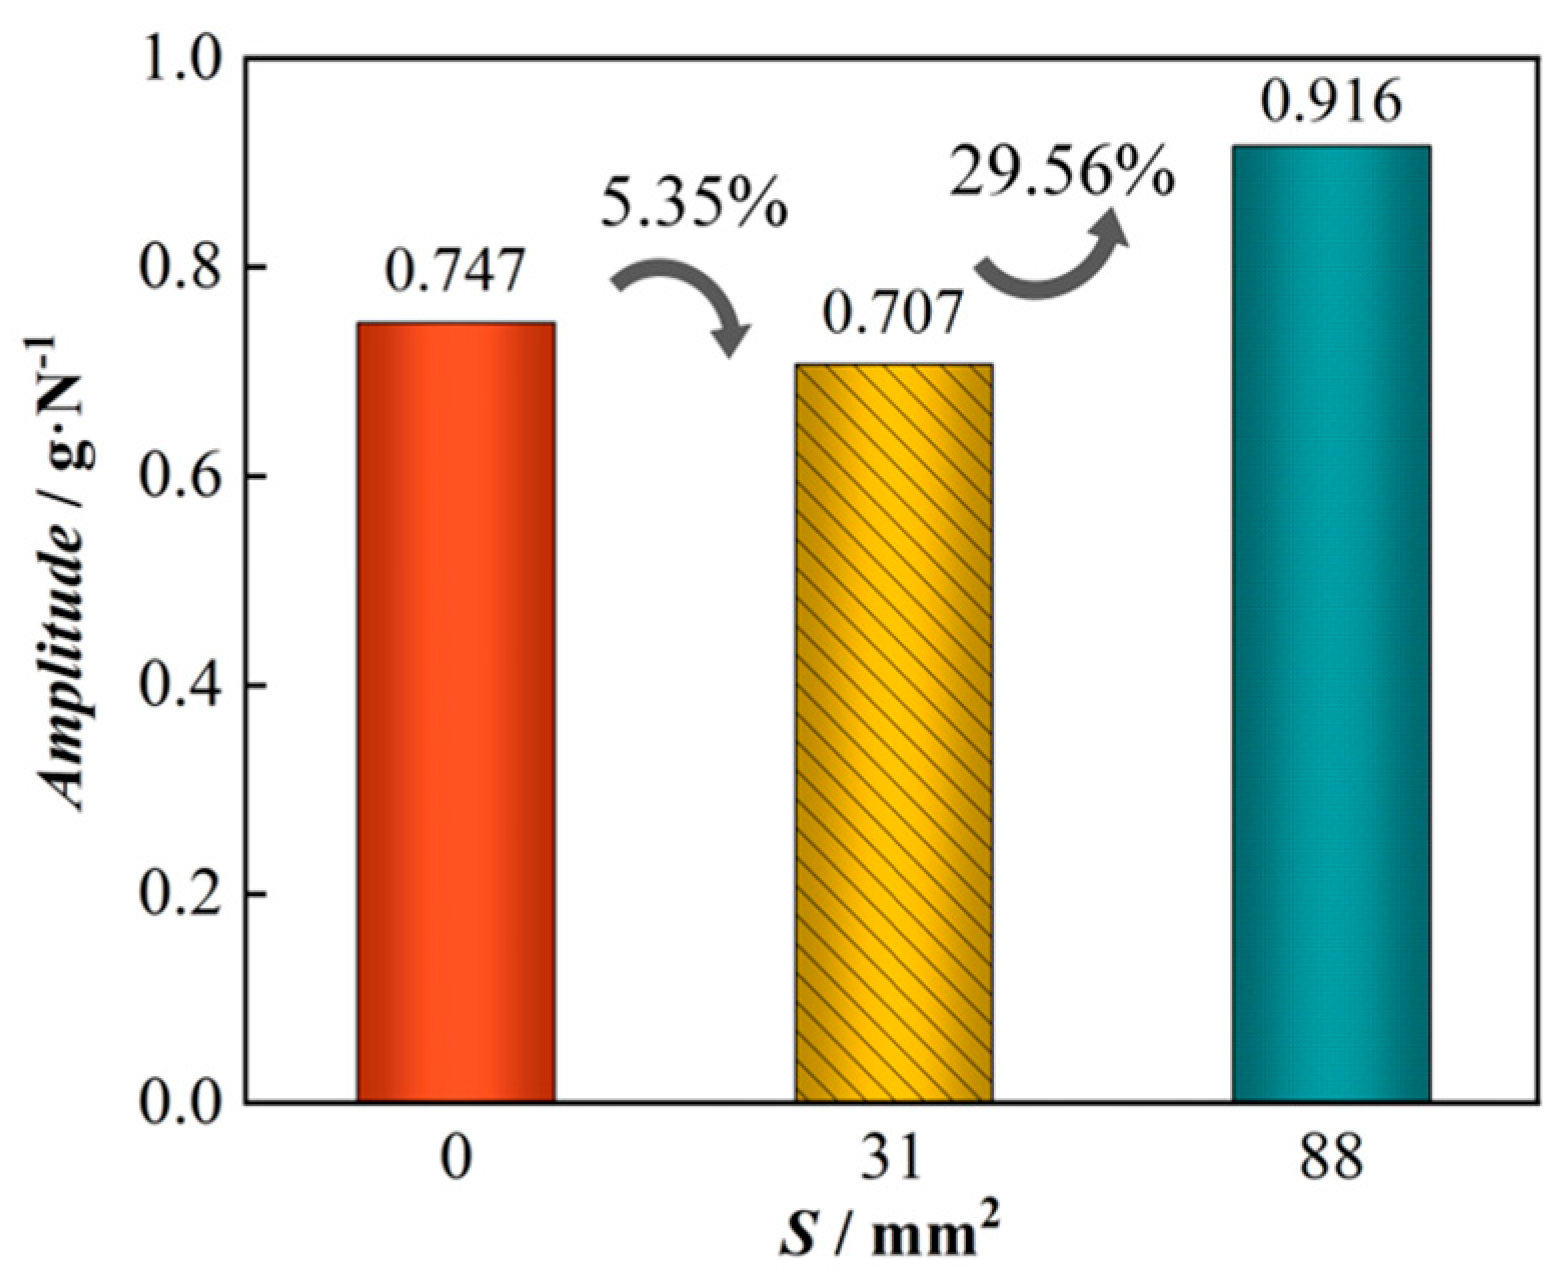
By comparing and analyzing the effects of the different injection flow rates of cutting fluid on the workpiece force and the amplitude of machining vibration, we can surmise that with an increase in injection speed, the workpiece force is gradually reduced, in which the reduction in Fx is the most obvious and almost linear, and the overall amplitude of vibration of the workpiece is gradually reduced.
(4)
The object of this paper was aluminum alloy 6061T-type planar thin-walled parts. Whether the methodology of this paper is applicable to complex thin-walled parts needs to be discussed in depth. At the same time, it is also necessary to carry out further research on titanium alloys and other material thin-walled parts.

Author Contributions

Conceptualization, G.J., methodology, G.H., software, Y.M. (Yonglin Min) and X.L., validation, Y.M. (Yonglin Min) and Y.B., formal analysis, Y.M. (Yuanhao Ma), investigation, Y.M. (Yonglin Min), resources, Y.M. (Yuanhao Ma) and M.H., data curation, Y.M. (Yonglin Min) and Y.X., writing—original draft preparation, Y.M. (Yonglin Min), writing—review and editing, Y.M. (Yonglin Min) and D.L., visualization, Y.M. (Yonglin Min), supervision, X.L., project administration, G.J., funding acquisition, G.H. All authors have read and agreed to the published version of the manuscript.

Funding

This work was supported by the Tianjin Science and Technology Program (No. 24PTLYHZ00030), the Natural Science Foundation of Inner Mongolia Autonomous Region (No. 2024MS05006), Scientific Research Program Project of Tianjin University of Technology and Education (No. KYQD202205), and the Open Project of Key Laboratory of High-end CNC Machine Tool of Genertec (No. KLHCMT202407).

Data Availability Statement

The original contributions presented in this study are included in the article. Further inquiries can be directed to the corresponding author.

Conflicts of Interest

The authors declare no conflicts of interest.

References

  1. Muxuan, G.; Lida, Z.; Boling, Y. Research on the Milling Stability of Thin-walled Parts Based on the Semi-discretizationMethod of Improved Runge-Kutta Method. Int. J. Adv. Manuf. Technol. 2021, 115, 2035. [Google Scholar] [CrossRef]
  2. Chigbogu, G.O. Polynomial Tensor-Based Stability Identification of Milling Process: Application to Reduced Thin-Walled Workpiece. In IUTAM Bookseries, Proceedings of the IUTAM Symposium on Model Order Reduction of Coupled Systems, Stuttgart, Germany, 22–25 May 2018; Springer: Berlin/Heidelberg, Germany, 2019; Volume 209, p. 220. [Google Scholar] [CrossRef]
  3. Mehran, M.; Mohammad, R.; Movahhedy Amir, J. Three dimensional prediction of stability lobes in end milling of thin-walled structures based on tool and workpiece dimensions. Sci. Iran. 2021, 29, 41–52. [Google Scholar] [CrossRef]
  4. Song, Q.H.; Liu, Z.Q.; Wan, Y. Application of Sherman–Morrison–Woodbury formulas in instantaneous dynamic of peripheral milling for thin-walled component. Int. J. Mech. Sci. 2015, 97, 79–90. [Google Scholar] [CrossRef]
  5. Wang, X.J.; Song, Q.H.; Wang, Q. Dynamic model and stability prediction of thin-walled component milling with multi-modes coupling effect. J. Mater. Process. Technol. 2021, 288, 116869. [Google Scholar] [CrossRef]
  6. Gao, H.N.; Liu, X.L. Stability Research Considering Non-Linear Change in the Machining of Titanium Thin-Walled Parts. Materials 2019, 12, 2083. [Google Scholar] [CrossRef]
  7. Wang, B.S.; Li, J.B.; Gao, H.B. Vibration Modal Analysis of Thin-walled Component with Variable Curvature Based on Finite Element. DEStech Trans. Eng. Technol. Res. 2017, 23, 1005–1008. [Google Scholar] [CrossRef]
  8. Zhou, H.; Yang, Y.Q.; Han, C.J. Microstructure and mechanical properties of GH4169 thin-walled parts fabricated by ultrasonic vibration assisted laser directed energy deposition/milling hybrid process. Thin-Walled Struct. 2024, 205, 112349. [Google Scholar] [CrossRef]
  9. Jia, F.; Wan, M.; Gao, T.Q. Mechanism of process damping in milling of thin-walled workpiece. Int. J. Mach. Tools Manuf. 2018, 134, 1–19. [Google Scholar] [CrossRef]
  10. Zhuo, Y.; Han, Z.Y.; Dong, H.Y. Surface topography prediction in peripheral milling of thin-walled parts considering cutting vibration and material removal effect. Int. J. Mech. Sci. 2021, 211, 106797. [Google Scholar] [CrossRef]
  11. Li, W.S.; Jin, G.; Tian, Y.J. Analysis of cutting vibration of aluminum alloy 6061 thin-walled parts. In Proceedings of the 2022 International Symposium on Control Engineering and Robotics, Changsha, China, 18–20 February 2022; Volume 1, pp. 83–86. [Google Scholar] [CrossRef]
  12. Wu, Q.; Li, L.; Zhang, Y.D. Simulations and Experiments on Vibration Control of Aerospace Thin-Walled Parts via Preload. Shock. Vib. 2017, 1, 1–7. [Google Scholar] [CrossRef]
  13. Kasper, R.; Yaser, M.; Christian, H. Optimization of Material Removal Rate in Milling of Thin-walled Structures Using Penalty Cost Function. Int. J. Mach. Tools Manuf. 2019, 145, 103430. [Google Scholar] [CrossRef]
  14. Serhii, K.; Sergey, D.; Yevheniia, B. Adaptive Fluid Jet Support Technique for Variable Stiffness Thin-Walled Parts End Milling. Lect. Notes Mech. Eng. 2024, 1, 223–239. [Google Scholar] [CrossRef]
  15. Wang, S.; Chong, H.; Li, J.G. Vibration-free surface finish in the milling of a thin-walled cavity part using a corn starch suspension. J. Mater. Process. Technol. 2021, 290, 116980. [Google Scholar] [CrossRef]
  16. Wang, Q.L.; Wang, W.; Zheng, L.Y. Force control-based vibration suppression in robotic grinding of large thin-wall shells. Robot. Comput.-Integr. Manuf. 2021, 67, 102031. [Google Scholar] [CrossRef]
  17. Butt, M.A.; Yang, Y.Q.; Pei, X.T. Five-axis milling vibration attenuation of freeform thin-walled part by eddy current damping. Precis. Eng. 2018, 51, 682–690. [Google Scholar] [CrossRef]
  18. Li, C.; Li, X.; Huang, S. Ultra-precision grinding of Gd3Ga5O12 crystals with graphene oxide coolant: Material deformation mechanism and performance evaluation. J. Manuf. Process. 2021, 61, 417–442. [Google Scholar] [CrossRef]
  19. Hu, S.R.; Zhang, P.R.; Du, J.H. Suppression of cutting vibration in side milling of laser cladded layer on thin-walled parts with interfacial structures. J. Manuf. Process. 2024, 111, 32–44. [Google Scholar] [CrossRef]
  20. Zhao, X.; Lianyu, Z.; Fan, W.; Lu, Y. Real-time vibration data-driven adaptive optimization of flat milling process parameters for thin-walled parts. J. Mech. Eng 2020, 56, 172–184. [Google Scholar]
  21. Paweł, D.; Stefan, B.; Karol, M. Increasing Damping of Thin-Walled Structures Using Additively Manufactured Vibration Eliminators. Materials 2020, 13, 2125. [Google Scholar] [CrossRef]
  22. Li, Z.H.; Xu, W.; Wang, C. Investigation on Vibration Characteristics of Thin-Walled Steel Structures under Shock Waves. Materials 2023, 16, 4748. [Google Scholar] [CrossRef]
  23. Shi, Z.M.; Li, B.Z.; Sun, Z.H. Residual stress superposition in milling process of thin-walled parts and comprehensive deformation control method. Res. Sq. 2023, 1, 10–13. [Google Scholar] [CrossRef]
  24. Ding, H.J.; Zhou, B.; Xue, K. Research on Variable Milling Process Parameters of Thin-walled Parts Based on Cutting Force Control. Modul. Mach. Tool Autom. Manuf. Tech. 2020, 9, 117–122. [Google Scholar]
  25. Zhang, S.F.; Ma, J.H.; Wang, S. Milling force prediction of inclined rib with low rigidity in milling process of hollow thin-walled structural parts. Int. J. Adv. Manuf. Technol. 2023, 127, 815–830. [Google Scholar] [CrossRef]
  26. Chen, Z.T.; Yue, C.X.; Liu, X.L. Surface Topography Prediction Model in Milling of Thin-Walled Parts Considering Machining Deformation. Materials 2021, 14, 7679. [Google Scholar] [CrossRef] [PubMed]
  27. Mohammad, R.S.; Selim, G.; Jian, L. Vibration suppression and surface quality enhancement in milling thin-walled structures using shear thickening fluids. J. Manuf. Process. 2024, 131, 2219–2229. [Google Scholar] [CrossRef]
  28. Tong, J.L.; Zhang, Z.P.; Chen, P. Study on surface morphology of titanium alloy curved thin-walled parts by longitudinal-torsional composite ultrasonic assisted milling. J. Manuf. Process. 2022, 84, 316–326. [Google Scholar] [CrossRef]
  29. Fei, J.X.; Lin, B.; Xiao, J.L. Investigation of moving fixture on deformation suppression during milling process of thin-walled structures. J. Manuf. Process. 2018, 32, 403–411. [Google Scholar] [CrossRef]
  30. Zhang, S.Q.; Li, H.N.; Rüdiger, S. Disturbance rejection control for vibration suppression of piezoelectric laminated thin-walled structures. J. Sound Vib. 2014, 333, 1209–1223. [Google Scholar] [CrossRef]
  31. Liu, D.S.; Luo, M.; Urbikain, P.G. Position-oriented process monitoring in milling of thin-walled parts. J. Manuf. Syst. 2021, 60, 360–372. [Google Scholar] [CrossRef]
  32. Sun, Y.X.; Xiang, Z.H. A natural perturbation method with symmetric secant stiffness for stability analyses of quasi-perfect thin-walled structures. Thin-Walled Struct. 2021, 164, 107870. [Google Scholar] [CrossRef]
Figure 1. Schematic diagram of the milling process of planar thin-walled parts under CFS.
Machines 13 00594 g001
Figure 2. CFS-based experimental platform. (a) CFS experimental platform; (b) flow meter; (c) Pagoda conversion joints; (d) Liquid storage tank; (e) Variable frequency self-priming booster pump; (f) Cutting fluid nozzle fixture.
Machines 13 00594 g002
Figure 3. Fitting results of operating frequency and jet velocity: (a) nozzle I, (b) nozzle II, (c) nozzle III.
Machines 13 00594 g003
Figure 4. Plot of jet velocity versus jet force: (a) S = 31 mm2, (b) S = 88 mm2.
Machines 13 00594 g004
Figure 5. Distribution of workpiece dimensions and test points.
Machines 13 00594 g005
Figure 6. Hammering experiments: (a) UCFS hammering experiment; (b) Schematic of hammering; (c) CFS hammering experiment; (d) Partial enlargement of CFS hammering experiment; (e) Supplemental cutting fluid.
Machines 13 00594 g006
Figure 7. Milling experiments for thin-walled parts: (a) CFS milling experiment; (b) Partial enlargement of CFS milling experiment; (c) UCFS milling experiment, (d) Partial enlargement of UCFS milling experiment.
Machines 13 00594 g007
Figure 8. Comparison between Experiment 1 and Experiment 15: (a) frequency-domain plot; (b) time-domain plot.
Machines 13 00594 g008
Figure 9. Comparison between Experiment 5 and Experiment 23: (a) frequency-domain plot; (b) time-domain plot.
Machines 13 00594 g009
Figure 10. Comparison between Experiment 19 and Experiment 26: (a) frequency-domain plot; (b) time-domain plot.
Machines 13 00594 g010
Figure 11. Comparison between Experiment 19 and Experiment 28: (a) frequency-domain plot; (b) time-domain plot.
Machines 13 00594 g011
Figure 12. Comparison between Experiment 22 and Experiment 30: (a) frequency-domain plot; (b) time-domain plot.
Machines 13 00594 g012
Figure 13. Influence of feed rate on workpiece force: (a1a3) Comparison of different feed rates; (b1b3) Time-domain signals of milling force; (c1c3) Amplification of time-domain signals.
Machines 13 00594 g013
Figure 14. Effect of spindle speed on workpiece forces: (a) Fx, (b) Fy, (c) Fz, and (d) combined force F.
Machines 13 00594 g014
Figure 15. Effect of spray velocity on workpiece force: (a) Comparison of different spray velocities; (b) Amplification of time-domain signal.
Machines 13 00594 g015
Figure 16. Effect of spray area on workpiece force: (a) Comparison of different spray areas; (b) Amplification of time-domain signal.
Machines 13 00594 g016
Figure 17. Vibration time-domain signals for workpiece machining: (a) Vf = 200 mm/min; (b) Vf = 300 mm/min; (c) Vf = 400 mm/min.
Machines 13 00594 g017
Figure 18. Influence of feed rate on the vibration amplitude of workpiece machining. (a1) Pre processing stage; (a2) Processing the middle section; (a3) Post processing section; (b1b3) Frequency domain magnified image of Vf = 200mm/min: (b1) Pre processing stage; (b2) Processing the middle section; (b3) Post processing section.
Machines 13 00594 g018
Figure 19. Frequency-domain diagram of the influence of feed rate on the vibration amplitude of the workpiece: (a1a3) Frequency domain signals of the vibration in the front, middle, and back sections of machining; (b1b3) Frequency-domain signal amplification.
Machines 13 00594 g019
Figure 20. Effect of spindle speed on the vibration amplitude of the workpiece: (a) pre-machining section; (b) mid-machining section; (c) post-machining section; (d) average value of vibration amplitude.
Machines 13 00594 g020
Figure 21. Influence of CFS speed on the overall machining vibration amplitude of the workpiece.
Machines 13 00594 g021
Figure 22. Effect of CFS area on the overall machining vibration amplitude of the workpiece.
Machines 13 00594 g022
Table 1. Hammering experiments under non-injected conditions.
ArtifactsExperiment NumberHammer PointPoint of Measurement
Pieces I1,2,3,4,5,6,7A,B,C,D,E,F,Ga,b,c,d,e,f,g
Part II8,9,10,11,12,13,14A,B,C,D,E,F,Ga,b,c,d,e,f,g
Table 2. Annex I hammering experiments under spraying conditions.
Experiment NumberHammer PointPoint of MeasurementInjection PointSpraying Speed (m/s)Nozzle Radius/Area (mm/mm2)Spray Angle
15Aag′103.1/31
16Bbg′103.1/31
17Ccg′103.1/31
18Ddg′103.1/31
19Aaa′103.1/31
20Bbb′103.1/31
21Ccc′103.1/31
22Ddd′103.1/31
23Eee′103.1/31
24Fff′103.1/31
25Ggg′103.1/31
26Aaa′133.1/31
27Ddd′133.1/31
28Aaa′105.3/88
29Ddd′105.3/88
30Ddd′103.1/3130°
Table 3. CFS thin-walled part machining experiments.
Experiment
Serial Number
Spindle Speed n (r/min)Feed Rate Vf
(mm/min)
CFS Speed V
(m/s)
CFS Area S
(mm2)
A1500020000
A250002001031
A350002001331
A450002001088
A5500030000
A650003001331
A7500040000
A850004001331
A9200020000
A1020002001331
Table 4. Experimental force measurement results of CFS thin-walled part machining.
Experiment NumberFx (N)Fy (N)Fz (N) F ¯ (N)
A138.2319.6711.8344.59
A235.0015.218.9139.19
A331.2614.468.5135.48
A439.0420.6412.3545.85
A540.2922.2812.9547.83
A634.0219.3511.5340.80
A745.1324.9216.1254.01
A835.9622.8115.0943.60
A951.0428.0116.8460.61
A1045.9224.8515.4854.46
Table 5. Experimental vibration measurement results of CFS thin-walled part machining.
Experiment NumberMean Value of Acceleration Amplitude at Different Stages (g-N−1)
Pre - Processing   A ¯ 1 Peloton   A ¯ 2 Processed   Back   End   A ¯ 3 Processed   Whole   A ¯ 4
A10.8510.5520.9160.747
A20.7840.5360.8010.707
A30.6350.5270.770.644
A40.8350.6581.2550.916
A50.9040.3590.4230.562
A60.3590.0930.1650.206
A70.7590.7160.8720.782
A80.3640.2720.4260.354
A90.8930.7940.8220.836
A100.7590.7160.7140.73
Disclaimer/Publisher’s Note: The statements, opinions and data contained in all publications are solely those of the individual author(s) and contributor(s) and not of MDPI and/or the editor(s). MDPI and/or the editor(s) disclaim responsibility for any injury to people or property resulting from any ideas, methods, instructions or products referred to in the content.

