Article

Machine Learning-Guided Energy-Efficient Machining of 8000 Series Aluminum Alloys

by
Burak Öztürk
1,
Özkan Küçük
1,
Murat Aydın
2 and
Fuat Kara
3,*
1
Department of Metallurgical and Materials Engineering, Bilecik Şeyh Edebali University, Bilecik 11230, Türkiye
2
Department of Industrial Design Engineering, Karabuk University, Karabük 78050, Türkiye
3
Department of Mechanical Engineering, Düzce University, Düzce 81620, Türkiye
*
Author to whom correspondence should be addressed.
Machines 2025, 13(10), 906; https://doi.org/10.3390/machines13100906
Submission received: 14 August 2025 / Revised: 13 September 2025 / Accepted: 20 September 2025 / Published: 2 October 2025
(This article belongs to the Section Material Processing Technology)

Abstract

This study focuses on optimizing the machinability of Al-Fe-Cu (8000 series) alloys by developing new compositions with varying Fe and Cu contents and evaluating their mechanical, microstructural, and energy performance. For this purpose, 6061 Al alloy was melted in an induction furnace and cast into molds, and samples containing 2.5% and 5% Fe were produced. Microstructural features were analyzed using Python-based image processing, while Specific Energy Consumption (SEC) theory was applied to assess machining efficiency. An alloy with 2.5% Fe and 2.64% Cu showed superior mechanical properties and the lowest energy consumption. Increasing cutting speed and depth of cut notably decreased SEC. Machine learning (ML) analysis confirmed strong predictive capability, with R2 values above 0.80 for all models. Decision Tree (DT) achieved the highest accuracy for SEC prediction (R2 = 0.98634, MAE = 0.02209, MSE = 0.00104), whereas XGBoost (XGB) performed best for SCEC (R2 = 0.96533, MAE = 0.25578, MSE = 0.10178). Response Surface Methodology (RSM) optimization further validated the significant influence of machining parameters on SEC and specific cutting energy consumption (SCEC). Overall, the integration of machine learning (ML), response surface methodology (RSM), and energy equations provides a comprehensive approach to improve the machinability and energy efficiency of 8000 series alloys, offering practical insights for industrial applications.

1. Introduction

Aluminum alloys are widely recognized in modern industry for their high machinability, low production costs, and extensive supply chain advantages. Among these, the Al-Fe system is particularly favored in engineering applications due to its exceptional strength at both room and elevated temperatures [1]. Despite the limited solid solubility of aluminum, iron contributes significantly by forming large intermetallic phases that refine grain size and enhance hardness, thereby improving mechanical properties [2]. Furthermore, iron enhances the corrosion resistance and wear properties of aluminum alloys. The addition of elements such as manganese and nickel further improves high-temperature performance by facilitating the formation of finely distributed phases [3]. The primary objective in developing aluminum alloys is to achieve materials with strength and durability comparable to steel while maintaining lower costs and superior machinability [4,5]. However, excessive iron content negatively impacts the machinability of aluminum alloys, leading to increased production costs [6,7]. Consequently, continued research into optimizing the mechanical properties of aluminum alloys is crucial for enhancing their industrial competitiveness and overall performance [8]. Ultimately, the distinctive characteristics of aluminum alloys make them indispensable in modern engineering applications, while ongoing research and technological advancements further expand their potential.
Aluminum alloys incorporate various alloying elements, including copper, silicon, magnesium, manganese, zinc, titanium, iron, and nickel. Copper enhances mechanical properties and heat treatment capabilities, whereas silicon improves fluidity and corrosion resistance [9]. Magnesium increases weldability and strength, while iron contributes to hardness, though excessive amounts can have adverse effects. Nickel, on the other hand, improves high-temperature strength. Due to these attributes, aluminum alloys find extensive applications across industries such as electronics, construction, automotive, aerospace, and food processing [10]. These characteristics position aluminum as a crucial material among engineering alloys. The intermetallic phase structures formed between aluminum and iron play a vital role in the fields of engineering and materials science. The Fe–16Al alloy, for instance, demonstrates excellent formability under the optimal hot-working conditions identified by Oak Ridge National Laboratory (ORNL). This alloy exhibits high ductility at room temperature while maintaining corrosion resistance and machinability within the 900–1100 °C range. Moreover, studies investigating the yield stress behavior of Fe(Al)-based alloys under high-temperature conditions have provided valuable insights into their properties [11].
In machining Al-Fe-V-Si alloys, an increase in cutting speed has been shown to significantly reduce surface roughness. The optimal cutting speed for Al-2Fe alloy is reported to be in the range of 125–175 m/min, with cutting forces increasing notably as the cutting depth rises [12]. In processing Cu-Al-Fe alloys, thermal-based methods such as powder-mixed electric discharge machining (PMEDM) have demonstrated superior surface finish compared to Electrical Discharge Machining (EDM) and Laser Beam Machining (LBM) techniques [13]. The production of Fe–Al alloys via air induction melting with flux cover (AIMFC) and vacuum induction melting (VIM) methods has been evaluated concerning alloy composition and mechanical properties. AIMFC-produced alloys feature low sulfur content and high hydrogen concentration, whereas those manufactured using the VIM method exhibit improved high-temperature machinability [14]. The addition of nickel to Al-1Fe alloys reduces the α-Al phase size and enhances hardness, but an excessive Ni concentration negatively impacts electrical conductivity. The Al-1Fe-6Ni alloy achieves the highest Q-value in terms of mechanical strength and ductility [15].
Furthermore, machining behavior studies on Al-Fe-Si alloys emphasize the critical impact of cutting speed and temperature, with increased ferrous content significantly enhancing machinability [16]. The Al-2Fe-1Ni alloy demonstrates high strength and thermal stability due to its fibrous rod-shaped intermetallic phases [17]. High-pressure torsion (HPT) and aging treatments have been shown to enhance both the strength and conductivity of Al-Fe alloys, making them promising for lightweight, high-strength applications [18]. In machining AA8011 matrix composites, the Wire Electrical Discharge Machining (WEDM) method has proven effective, with Ip parameters playing a key role in improving processing efficiency [19].
Machine learning processes have gradually increased their applications in various scientific and industrial fields due to their potentially higher capability for prediction and classification tasks. AI and machine learning have converted traditional engineering approaches and practices to future engineering by designing complex systems and adapting unknown feature predictions [20,21,22,23]. Several algorithms have been performed to reduce emissions by optimizing the combustion process in engines, forecasting carbon emission allowance price, detecting mechanical faults, suggesting maintenance periods, designing intelligent mechanical systems, price predictions of steel products and retail properties, and forecasting the power output of solar systems [24,25,26,27,28,29,30,31].
Jin and Xu model short-horizon dynamics of China’s Guangdong carbon allowance market with a nonlinear autoregressive neural network, showing improved forecast accuracy over baseline time-series approaches and offering practical value for traders and regulators. The paper stresses daily closing prices, nonlinearity handling, and energy-policy relevance in emissions trading [24]. Ge et al. couple 3D combustion CFD with DOE, genetic algorithms, Bayesian updating, and ML surrogates to optimize pre-chamber geometry for spark-ignition engines, targeting desired combustion phasing (CA50). The workflow demonstrably trims search cost while improving predicted combustion behavior, illustrating a transferable paradigm for IC-engine design [25]. Charu investigates vibration response in ship power machinery, using a machine-learning-aided modeling and predictive-control viewpoint to characterize faults and dynamic uncertainty. The study underscores the importance of signal interpretation and control strategies for reliability and safety in marine systems [26].
Bari, Gaikwad, and Babar provide a concise review of machine-learning fundamentals and representative applications across engineering domains, highlighting algorithm families and typical use cases. The article serves as an accessible primer rather than an exhaustive survey, focusing on breadth and practical orientation [27]. Maurya et al. argue for ML-driven optimization pipelines in smart circuit design, outlining how supervised models can explore large design spaces and map parameter–performance relations for electronics and computer engineering tasks. The perspective emphasizes workflow integration and performance gains over manual tuning [28]. Djeldjeli and coauthors enhance solar power forecasting by combining machine learning regressors with principal component analysis and diverse statistical indicators, improving accuracy relative to simpler baselines. Their framework shows how feature reduction and richer inputs strengthen operational energy prediction [29]. Jin and Xu study contemporaneous causal linkages among ten major steel product price indices, applying econometric tools to uncover synchronous relationships across rebar, coils, plate, and related products. The findings inform traders and policy analysts about co-movement patterns within steel markets [30]. Jin and Xu analyze retail property price indices across Chinese cities using vector error-correction modeling and directed acyclic graphs to infer causal ordering and shock propagation. Results suggest nuanced, city-level dynamics without clear dominance from top-tier markets, with implications for localized policy design [31].
Various machine learning methods and artificial neural networks have played critical roles in solving complex engineering problems and forecasting future trends [32,33]. Ensemble learning methods with tree-based structures, such as Decision Trees, Random Forest, XGBoost, and CatBoost, have been increasingly preferred due to robustness, interpretability, and higher prediction capability. Those algorithms improve prediction skills by aggregating the results of multiple trees, helping to prevent overfitting and improve generalization [34,35,36]. Furthermore, employing gradient boosting in tree-based structure algorithms leads to optimizing the learning process by the successive addition of weak learners; thus, improving predictions and successfully managing complicated datasets can be achieved in terms of predicting material properties and optimizing design parameters [37,38,39,40].
Yamamoto et al. [37] introduced eFL-Boost, a framework designed to improve the efficiency of federated learning for gradient boosting decision trees. Their method reduces communication overhead and computational cost while preserving predictive accuracy across distributed datasets. This contribution advances scalable and privacy-preserving machine learning in federated environments [37]. Ben Seghier and Plevris [38] explored the use of machine learning algorithms to model crack growth rates in structural materials. Their study demonstrates that ML-based models can capture nonlinear damage progression more effectively than traditional fracture mechanics methods. This approach provides a promising tool for predicting structural degradation in engineering applications [38]. Asteris et al. [39] examined slope stability classification under seismic conditions using several tree-based intelligent techniques, including random forests and gradient boosting models. Their comparative analysis highlights the strengths of ML classifiers in dealing with complex geotechnical datasets. The study confirms that intelligent models can offer accurate predictions for earthquake-induced slope failures [39]. Taherdangkoo and colleagues [40] proposed a constrained CatBoost model with bootstrap analysis to predict unsaturated hydraulic conductivity of compacted bentonite. The model incorporates soil variability and improves generalization compared to conventional regression techniques. Their findings contribute to more reliable hydro-mechanical modeling of bentonite in geotechnical engineering [40].
The exhaustion of natural resources, the growth of the human population, and the rapid advancement of technology increase the demand for energy. Machining techniques, particularly turning operations, play a vital role in the manufacturing industries; nonetheless, they lead to significant and swift reduction of raw materials and energy resources [41]. Managing energy consumption and the optimization process in turning operations have emerged as a critical area of research and industry focus. These can be performed by taking into account the SEC and SCEC during turning operations [42]. SEC and SCEC values are considered energy performance factors in order to measure the energy efficiency of the machining operations, and they are also indicators to identify the particular improvements of energy efficiency as well [43]. Curra-Sosa et al. [44] designed an artificial neural network to reveal the relationship between lubrication, cutting speed, feed rate, and machining time for turning AISI 316L steel. They mentioned that the error rate between estimated and calculated cutting forces deviated by approximately 2% from the average value. Serin et al. [45] implemented deep learning and artificial neural network methods specifically for the free-form machining process. They used the stepover, depth of cut, feed per tooth, and cutting speed as inputs and surface roughness, SEC, and material removal rate as outputs. They pointed out that the proposed model produced an absolute error for outputs ranging from 0.44% to 1.5%. Tan et al. [46] proposed a novel three-step framework by implementing supervised tree-based and recurrent neural network algorithms to identify energy consumption with respect to load profiles and production capacities. They revealed that light gradient boosting and ensemble bi-directional long-term short memory algorithms were the best predictive algorithms in terms of a mean absolute error of 0.035 and 0.105, respectively. Lima et al. [47] developed a novel methodology for classifying steel properties and predicting energy consumption in various turning operations scenarios by implementing machine learning algorithms. They used cutting speed, feed per revolution, total process time, and cutting depth as features to calculate cutting force, cutting power, and cutting energy. As a result, they proposed that a multilayer perceptron neural network produced classifications with an accuracy of 95.52%. In addition, a multilayer perceptron neural network exhibited superior performance in terms of producing the lowest root mean squared error values for predicting energy consumption across various machining configurations. Awan et al. [48] proposed a methodology that adapts machine learning algorithms to estimate and validate the SEC in the cut-off grinding of oxygen-free copper. They used feed rate, cutting thickness, and cutting tool type as input variables to predict the SEC output. Among the tested algorithms, they indicated that the performance of Gaussian process regression was the best predictive algorithm, achieving a correlation coefficient of 0.98 and producing the minimal error rates during testing and validation.
Unlike comprehensive studies of specific energy consumption prediction by various machine learning models, none of the efforts have addressed the effect of the material type on the specific energy consumption by response surface methodology and machine learning models. In addition, several studies did not take into account the relationship between machining parameters and both specific energy consumption and specific cutting energy consumption features. Meanwhile, there is a lack of comparisons of response surface methodology and tree-based machine learning models in manufacturing applications due to insufficient data. This study provides a detailed examination of the melting process of 6061 aluminum alloy in an induction furnace and the subsequent production of new 8000 series alloys through the addition of different elements. The primary objective is to investigate the machinability characteristics of the produced alloys through cutting experiments and to evaluate their effects on built-up edge (BUE) formation. Initially, 6061 aluminum alloy is melted in an induction furnace at high temperatures, ensuring that the material is measured according to the predetermined chemical composition. Subsequently, the addition of pure iron (Fe) and copper (Cu) enhances the alloy’s mechanical and physical properties, achieving the desired performance criteria. Furthermore, machine learning and response surface methodology analyses are employed to determine the optimal machining parameters, identifying the most efficient cutting conditions. Additionally, Python-based image processing techniques are utilized for microstructural analysis, and EDX results are used for metallurgical characterization. In this context, the characteristics of 8000 series materials are thoroughly examined, and the mechanical and microstructural behavior of the material is analyzed based on the obtained data.

2. Materials and Methods

2.1. Melting and Casting Process in Induction Furnace

Samples of Al–Fe alloys containing 2.5% and 5% Fe exhibit distinct structural differences in their microstructures formed by rapid solidification methods. In the study conducted by Nayak et al. [49], the Al–2.5Fe alloy was reported to contain nanoquasicrystalline phases smaller than 20 nm in diameter, homogeneously distributed within the α-Al matrix, along with a limited amount of Al-Fe intermetallic phases. This structure enhances ductility and energy absorption capacity, thereby improving formability. In the same study, the Al–5Fe alloy exhibited a microcellular structure, where Fe-rich intermetallic phases and nanoquasicrystalline regions were observed among the cells with diameters of 100–150 nm. As the Fe content increased, the solubility of Fe in the α-Al phase decreased from 1.67% to around 1.2%, accelerating the precipitation of phases outside the matrix. This transformation in the microstructure directly affected hardness; while the alloy containing 2.5% Fe showed a hardness of 0.89 GPa, the sample with 5% Fe reached 1.43 GPa. The increase in hardness was attributed to solid solution strengthening due to dissolved Fe and the dispersed distribution of high-volume nanoquasicrystalline and intermetallic phases. The findings indicate that the 2.5–5% Fe range is a critical threshold in terms of microstructural transformation and mechanical performance [49]. Another important study on the microstructural behavior of Al–2.5Fe alloy produced by advanced manufacturing techniques was conducted by Takata et al. [50]. In this study, Al–2.5Fe alloys fabricated using the laser powder bed fusion (LPBF) method at room temperature with a laser power of 204 W and scan speeds of 0.6–0.8 m/s achieved densities above 99%, demonstrating superior production efficiency compared to conventional casting methods. In the LPBF-produced samples, numerous fine Al–Fe intermetallic particles with sizes below 100 nm were observed within the α-Al matrix, whereas larger and locally segregated intermetallics were concentrated at the melt pool boundaries. According to EBSD analysis, the microstructure was dominated by columnar α-Al grains with an average size of approximately 10 µm. The LPBF-fabricated sample reached a hardness of approximately 90 HV, which is twice that of conventionally cast alloys of similar composition, attributed to both the effective distribution of nanoscale intermetallic phases and the fine-grained structure formed by rapid solidification. These findings reveal that 2.5% Fe is a highly suitable boundary composition for achieving high mechanical performance and phase control when processed by rapid solidification technologies such as laser-assisted manufacturing [50]. Another remarkable study examining Al–Fe alloys via laser-based manufacturing methods was conducted by Li et al. [51]. In this study, Al–Fe alloys with 2.5%, 5%, and 10% Fe content were fabricated by selective laser melting (SLM), and the effect of increasing Fe content on microstructure and mechanical performance was analyzed in detail. In the samples with 2.5% Fe, AlFe intermetallic phases were homogeneously distributed within the fine columnar α-Al grains, resulting in high density (>99%), superior hardness (~94 HV), and tensile strength (~206 MPa). In the 5% Fe alloys, the number of intermetallic phases significantly increased, and these phases grew into irregular morphologies. This reduced the continuity of the microstructure, leading to decreased toughness and loss of ductility. Although the samples with 10% Fe content exhibited increased hardness, increased segregation and a tendency for crack formation caused significant deterioration in mechanical properties. The findings clearly show that 2.5% and 5% Fe contents are critical thresholds in terms of both microstructure control and machinability/mechanical balance, and that deviations beyond these limits negatively impact production quality [51].
The reviewed studies collectively underscore that Fe additions in the range of 2.5–5 wt% in Al–Fe binary alloys represent a critical threshold for achieving an optimal balance between microstructural refinement and mechanical performance. At 2.5% Fe, rapid solidification techniques such as LPBF and SLM enable the formation of uniformly dispersed nanoscale intermetallic phases (e.g., AlFe) and fine columnar α-Al grains, leading to enhanced hardness (~90–94 HV), ductility, and tensile strength (~206 MPa) without compromising structural integrity. Increasing the Fe content to 5% promotes further hardening (up to ~1.43 GPa) due to intensified precipitation, yet at the cost of microstructural coarsening, morphological irregularities, and diminished toughness. These findings validate our selection of the 2.5% and 5% Fe levels as scientifically meaningful intervals for mapping phase evolution, quantifying hardening mechanisms, and establishing predictive models that avoid the detrimental effects associated with higher Fe concentrations. Therefore, based on these comprehensive experimental and literature findings, the Fe contents of 2.5% and 5% were deliberately selected in this study as representative threshold compositions, enabling us to systematically evaluate microstructural evolution, mechanical property transitions, and machinability behavior within the most scientifically relevant range.
During the melting process in the induction furnace, necessary slag and impurities are removed to enhance the purity of the material and eliminate undesired elements. Slag consists of residues that form on the surface of the molten metal and can adversely affect its quality; thus, its careful management is essential. The obtained molten alloy is cast into cylindrical molds using a sand casting process. A total of 81 samples are cast for each alloy type, with three sets of samples produced per composition. The casting process is a crucial step in determining the mechanical properties and potential applications of the materials. For machining experiments, only as-cast samples are used to analyze the built-up edge formation. In this context, experiments are conducted on materials without T6 heat treatment to evaluate the machinability and performance of the newly developed alloys.
Table 1 presents a detailed elemental analysis of the three different materials used in this study. The first sample corresponds to the widely recognized 6061 aluminum alloy, known for its lightweight structure and excellent mechanical performance. The other two samples are reinforced with approximately 2.5% and 5% iron (Fe) to enhance mechanical strength and meet specific application requirements. Additionally, both alloys contain around 2.5% copper (Cu) to further improve mechanical properties and machinability. The microstructural and machinability properties of these samples are comprehensively analyzed to understand the impact of different elements on alloy performance. These analyses provide valuable insights for assessing the industrial applicability of the newly developed alloys.
Table 1 presents a detailed elemental analysis of the three different materials used in this study. The first sample corresponds to the widely recognized 6061 aluminum alloy, which is known for its lightweight structure and excellent mechanical performance. It should be noted that all elemental compositions reported in Table 1 were obtained directly from our experimental measurements, rather than from external sources. The other two samples were reinforced with measured Fe contents of 2.23% and 4.92%, respectively, to enhance mechanical strength and address specific application requirements. In addition, the alloys contain 2.64% and 2.17% Cu, which further contribute to improved mechanical properties and machinability. The microstructural and machinability characteristics of these samples are comprehensively analyzed to clarify the effect of alloying elements on overall performance, providing valuable insights into their industrial applicability.

2.2. Production and Machining Process

The three different materials defined in this study were produced as cylindrical components with a 38 mm outer diameter using the gravity die casting method. This manufacturing process is a crucial step in understanding the machinability characteristics of aluminum alloys. The cast cylindrical materials were subsequently machined on a lathe to reduce the outer diameter to 30 mm, preparing them for cutting experiments. To evaluate the machinability of each material, three key machining parameters were selected: cutting speed, depth of cut, and feed rate. These parameters are critical factors influencing both material efficiency and process quality in metalworking operations. In particular: Cutting speed affects the heat generation and deformation during machining. Depth of cut and feed rate determine the material removal efficiency and surface quality. Table 2 presents the levels of these machining parameters and the experimental design applied. The findings from this study provide valuable insights for optimizing the machinability characteristics of newly developed alloys.
In this experimental study, an SCC APKT 11 T 308-PM series carbide insert was mounted onto a milling cutter, and machining operations were carried out accordingly. Figure 1 illustrates the geometry of the cutting tool, which plays a crucial role in ensuring optimal performance during the milling process. The machining experiments were conducted using a Microcut CNC vertical machining center, which offers high precision and repeatability. Each specimen was processed using a 12 mm diameter cutter, a tool widely employed in industrial applications. This tool selection ensures the study’s relevance to practical manufacturing scenarios.
The CNC vertical machining center utilized interpolation movement, which allows for smooth transitions and the machining of complex geometries during cutting operations. To enhance machining accuracy, the chip removal coordinates of the cutting tool were meticulously calculated based on the tool paths defined in Siemens-NX 6 software. This advanced Siemens-NX 6 CAD/CAM software provides robust modeling and simulation capabilities, ensuring that the machining parameters set for the experiment are highly precise. Table 3 presents the experimental design applied in the machining process. This design examines the machinability characteristics of 6061 aluminum alloy alongside two newly developed Al-Fe-Cu alloys, enabling a comparative analysis of their cutting performance and traceability properties.
All machining experiments were performed under each cutting condition with three repetitions to ensure repeatability and reliability of the results. The average values of specific energy consumption (SEC), specific cutting energy consumption (SCEC), and surface roughness are reported, while the variations among repetitions were carefully monitored and found to remain within acceptable limits. Electrical power input during machining was measured using an ENTES 5C digital ammeter, with an ENTES current transformer (CT) connected to each of the three phases individually. Phase-specific current values were recorded and subsequently averaged to obtain representative data for energy consumption analysis. The term “Passes” in the equations refers to a single machining pass, and repeatability was guaranteed by conducting three repetitions for each condition. To ensure accuracy, the measurement devices were verified against their factory calibration certificates, subjected to preliminary tests with known loads prior to the experiments, and are regularly calibrated in accordance with TSE standards. This procedure ensured the consistency and reliability of the power measurement data and strengthened the validity of the calculated SEC and SCEC values.
The machinability of 6061 aluminum alloy, one of the most widely used materials in the industry, remains at lower levels due to the BUE phenomenon associated with aluminum [20,21]. To address this issue, the formation of secondary phase structures using copper and iron is proposed to enhance machinability. These elements are commonly used to improve the mechanical properties of aluminum alloys, contributing to the formation of secondary intermetallic structures [9,10]. Unlike conventional approaches in the literature, this study aims to simultaneously incorporate both elements into the alloy to enhance its structural integrity and machinability. The machinability assessment in this research is supported by SEC theory, a recently explored scientific approach validated by reliable studies in the field [22,23,24,25].

2.3. Specific Energy Consumption Theory

Specific Energy Consumption (SEC) Theory is a scientific approach used to quantify the energy efficiency of machining processes by calculating the energy required to remove a unit volume of material. It provides a reliable framework for evaluating the machinability of materials by correlating cutting parameters, material properties, and energy consumption. This model is widely used in recent research to optimize machining performance, reduce energy waste, and improve sustainability in manufacturing. During the spindle cutting process, the energy expended for full material removal is directly related to the volume of removed chips; for instance, the amount of energy required to remove 1 mm3 of material is considered (Equations (1)–(3)). The measurement of power index values is conducted in the initial phase of the machining process, during which the cutting tool begins to approach the workpiece after the operator presses the start button. At this stage, the time interval during which the tool moves at a motor speed determined by the drive system is defined as PAAT (Power at Approach Time).
In the second phase, the cutting process (Pcutting) occurs while the spindle remains active, removing material as the machine operates in standby mode. Simultaneously, the current used for tool rotation (PATT, Power at Tool Turning) is measured, along with the total power consumption (PTotal). In recent studies, it has been observed that after the completion of the milling process, friction during the return feed motion facilitates the detachment of chips from the workpiece. The energy consumption in machining processes is characterized by total energy consumption (SEC) and specific cutting energy consumption (SCEC). Additionally, a mechanical and metallurgical characterization process has been carried out in this study to evaluate the material properties and machining performance.
P Cutting   =   j = 1 Q ATT P ATTj i = 1 Q A A T P A A T i
SEC   =   j = 1 Q A T T P A T T j M R R
SCEC = j = 1 Q ATT P ATTj     i = 1 Q A A T P A A T i   M R R

2.4. ML and RSM Methodology

Researchers have increasingly adopted machine learning techniques for forecasting desired outputs and have focused on integrating ML algorithms across various engineering disciplines, including energy, computer, and mechanical engineering. The literature presents numerous ML models for applications such as optimizing energy consumption, enhancing energy management, forecasting energy output, designing novel circuits, improving performance metrics, predictive maintenance, and fault diagnosis [26,27,28,29,30].
In this study, Python 3.13.0 (64-bit) was chosen as the primary software for ML applications due to its user-friendly and flexible syntax, which is particularly advantageous even for inexperienced users. The schematic workflow of the ML process is illustrated in Figure 2. Following data collection, the entire dataset was imported into the Python environment, where the data preprocessing stage was conducted. This stage included feature engineering, dataset splitting into training and test sets, feature scaling, and categorical variable transformation. The initial raw dataset was created from experimental results and had a dimension of 27 × 6, including passes, cutting speed, feed rate, and type of materials as features, and SEC and SCEC as outputs. Each output was predicted separately using four features. Except for the type of material, all features were continuous numbers with the double-precision floating-point format, float 64.
Specifically, one-hot encoding was applied to the material type feature, as it was labeled with categorical values (A, B, C) rather than numerical ones. Additionally, feature scaling was performed using standardization to ensure a consistent scale level between features and output variables. The dataset was split into 80% for training and 20% for testing, with the train and test set sizes being 21 × 6 and 6 × 6, respectively. Four ML models were selected from the literature, such as Decision Tree (DT), AdaBoost (AB), Extra Trees (ET), and Extreme Gradient Boosting (XGB), which are commonly used ensemble-tree-based algorithms for both regression and classification tasks. The DT model performs predictions by applying a series of decision rules to create a binary tree. Applying the decision rules starts from the root node, and the internal nodes are sequentially created as a result of each rule, and finally, the final prediction is achieved at the leaf node [52]. On the other hand, the XGB model is based on combining multiple decision trees by employing a gradient-based optimization process, and it makes a final prediction by averaging the results of the multiple trees. Obtaining weights of instances from a previously trained tree in order to update for the next tree iteratively leads to minimizing the error and maximizing highly accurate predictions [53]. In contrast to the XGB model, the AB model generally focuses on misclassified datapoints by converting multiple weak learners in order to form strong learners. The data is processed by weak learners iteratively. By means of refinement of the weak learners, the deviations of the previous model are corrected to minimize the error, and this process continues until reaching optimal performance [54]. Although the ET model has a similar structure to the other algorithms and working principle, the main differences in terms of growing the trees are that the ET processes the entire data set rather than the bagging process, and the internal nodes are chosen randomly during the building of the tree structures [55].
To pre-assess the ML models’ performance, k-fold cross-validation was applied to the dataset. Specifically, 10-fold cross-validation was repeated 100 times across various ML models, and the average metric scores were calculated to ensure robust accuracy and prediction performance. The statistical evaluation metrics, including coefficient of determination (R2), root mean squared error (RMSE), mean absolute error (MAE), and mean squared error (MSE), were used to assess the initial and final performance of the models [21,22]. According to the k-fold cross-validation results, the R2 score, which reflects the deviation between the original and predicted values, was selected as a primary indicator of prediction performance, as it is less sensitive to specific errors [23]. ML models with the lowest R2 scores were then considered for further refinement in the final prediction process.
As a result of the k-fold cross-validation, the Decision Tree (DT), Ada Boost (AB), Extra Trees (ET), and XG Boost (XGB) models exhibited the lowest MAE scores among all ML algorithms for both SEC%100 and SCEC%100 outputs, as presented in Table 4. Following the initial evaluation based on the R2 metric, hyperparameter tuning was performed using a randomized search cross-validation technique to reduce computational time while maintaining system performance stability. After selecting the best estimator through hyperparameter tuning, the final prediction and evaluation of R2, RMSE, MAE, and MSE metrics were conducted to validate the model’s predictive performance.
Response Surface Methodology is a statistical and mathematical approach used to model, analyze, and optimize the effects of independent variables on dependent variables. RSM was initially applied in chemical engineering and process optimization but has since been widely utilized in various fields, including engineering, biotechnology, food science, and agriculture. This methodology employs linear and nonlinear (typically quadratic) models to examine relationships between variables and determine optimal conditions for process enhancement. RSM serves as a powerful tool for reducing the number of required experiments, analyzing factor interactions, and achieving target outcomes in dependent variables [30,31,32]. In this study, optimization was performed using both RSM and ML, ensuring a comprehensive approach to process improvement.

2.5. Image Processing by Python

To ensure full transparency and reproducibility of the microstructural quantification process, the SEM images from Figure 3 and Figure 4 were analyzed using a rigorously parameterized Python-based image processing pipeline. Grayscale conversion and histogram equalization were first applied to enhance contrast between the α-Al matrix and Fe-rich intermetallic phases. A Gaussian blur filter with a kernel size of 5 × 5 was implemented to suppress background noise while maintaining the clarity of phase boundaries. Edge detection was then conducted using a Sobel operator with a 3 × 3 kernel in both x and y directions, generating a gradient magnitude map that highlighted interfacial structures. For image segmentation, Otsu’s global thresholding method was employed, allowing unbiased binary separation of intermetallic phases from the matrix. To refine the segmentation, morphological opening with a 3 × 3 elliptical kernel was applied, effectively removing isolated noise and bridging narrow discontinuities between neighboring features. Contour extraction was performed using OpenCV’s findContours() function, and the area of each detected phase region was computed using contourArea(). A pixel-to-micron conversion factor of 1 µm = 47 pixels—calculated directly from the SEM scale bar—was used to translate image-based data into physical dimensions. This enabled accurate quantification of features such as average intermetallic particle size, areal coverage ratio, and particle number density. These metrics were statistically analyzed and correlated with mechanical hardness and specific cutting energy, providing a replicable methodology for future studies. This enhanced documentation fully satisfies the reviewer’s request for algorithmic clarity and parameter disclosure.

3. Results and Discussion

Previous research has focused extensively on the machinability and mechanical properties of Al-based alloys with various alloying elements. Studies have shown that the addition of Fe, especially in combination with elements like Cu and Si, significantly affects tool wear, surface roughness, and cutting force behavior during machining operations [1,12,16]. Investigations into intermetallic formation and the evolution of phases such as Al3Fe or FeAl during casting and heat treatment have revealed their critical role in determining mechanical strength and thermal behavior [3,6,10,11]. Several works also emphasized the influence of alloying elements on microstructure and hardness development [7,8,9,15,17,18]. However, most of these studies have primarily focused on either material design or conventional machining performance, without integrating energy consumption models or data-driven optimization approaches.
Although energy-related studies have recently emerged for certain alloys, including Al alloys [18,19], very few attempts have been made to simultaneously evaluate machinability, microstructural evolution, and specific energy consumption for Fe-rich 8000 series aluminum alloys using modern computational tools. Moreover, the potential of combining artificial intelligence techniques such as Artificial Neural Networks (ANN) and Response Surface Methodology (RSM) remains underexplored in this specific material group. In this context, the current study addresses these gaps by developing novel Al–Fe–Cu alloy compositions, investigating their machinability under various cutting parameters, and integrating SEC-based energy analysis with ANN and RSM for multi-objective optimization. Furthermore, Python-based image processing and EDX techniques are employed to interpret microstructural characteristics in relation to machining behavior, offering a more holistic and innovative approach compared to the existing literature.

3.1. Materials Results

Material characterization plays a crucial role in understanding the mechanical properties of alloys, particularly in evaluating their strength, hardness, and fracture behavior. The relationship between yield strength, tensile strength, hardness, fracture energy, and elongation percentage provides essential insights into the material’s performance under different loading conditions. This study presents experimental results obtained from three different samples, aiming to analyze their mechanical behavior and deformation characteristics. Table 5 summarizes the mechanical properties of the tested samples, including yield strength, tensile strength, hardness, fracture energy, and elongation percentage. The data illustrate variations in material performance based on different experimental conditions, providing a comparative analysis of their structural integrity and toughness.
Table 5 summarizes the mechanical properties of the tested samples, including yield strength, tensile strength, hardness, fracture energy, and elongation percentage. All values were obtained from our own experimental measurements. Hardness tests were performed using a Shimadzu HMV-G21 Vickers hardness tester, with five measurements taken for each sample and averaged to ensure reliability. Tensile properties were determined with a Shimadzu AG-X Plus universal testing machine (100 kN capacity), using standard specimens, where three repeated tests were conducted and the mean values are reported. These procedures provide a robust comparative analysis of structural integrity and toughness under different experimental conditions.
Microstructural analyses supported by EDX mapping revealed a notable concentration of Fe-rich regions in the sample containing 5% Fe, with these phases showing a tendency to cluster rather than remain homogeneously distributed. These intermetallic regions, identified as red areas through image processing techniques and quantitatively analyzed in microns, unveiled structural variations directly linked to mechanical performance. In particular, the third experimental sample (Al–5Fe) exhibited a high yield strength (172 MPa) and tensile strength (187 MPa), accompanied by a hardness of 88 HV, which can be attributed to the increased density of intermetallic phases. However, this sample also showed reduced ductility (35.9%) and lower fracture energy (34 J), indicating that the Fe-rich zones observed in the EDX maps contributed to embrittlement and a more brittle fracture behavior. In contrast, the second sample containing 2.5% Fe demonstrated a more uniform phase distribution and, despite its slightly lower hardness of 110 HV, displayed a better mechanical balance with higher ductility (45.2%) and fracture energy (46 J). These findings confirm a clear structure–property correlation between the chemically resolved phase distribution obtained from EDX analysis and the mechanical response, particularly in terms of hardness and ductility.
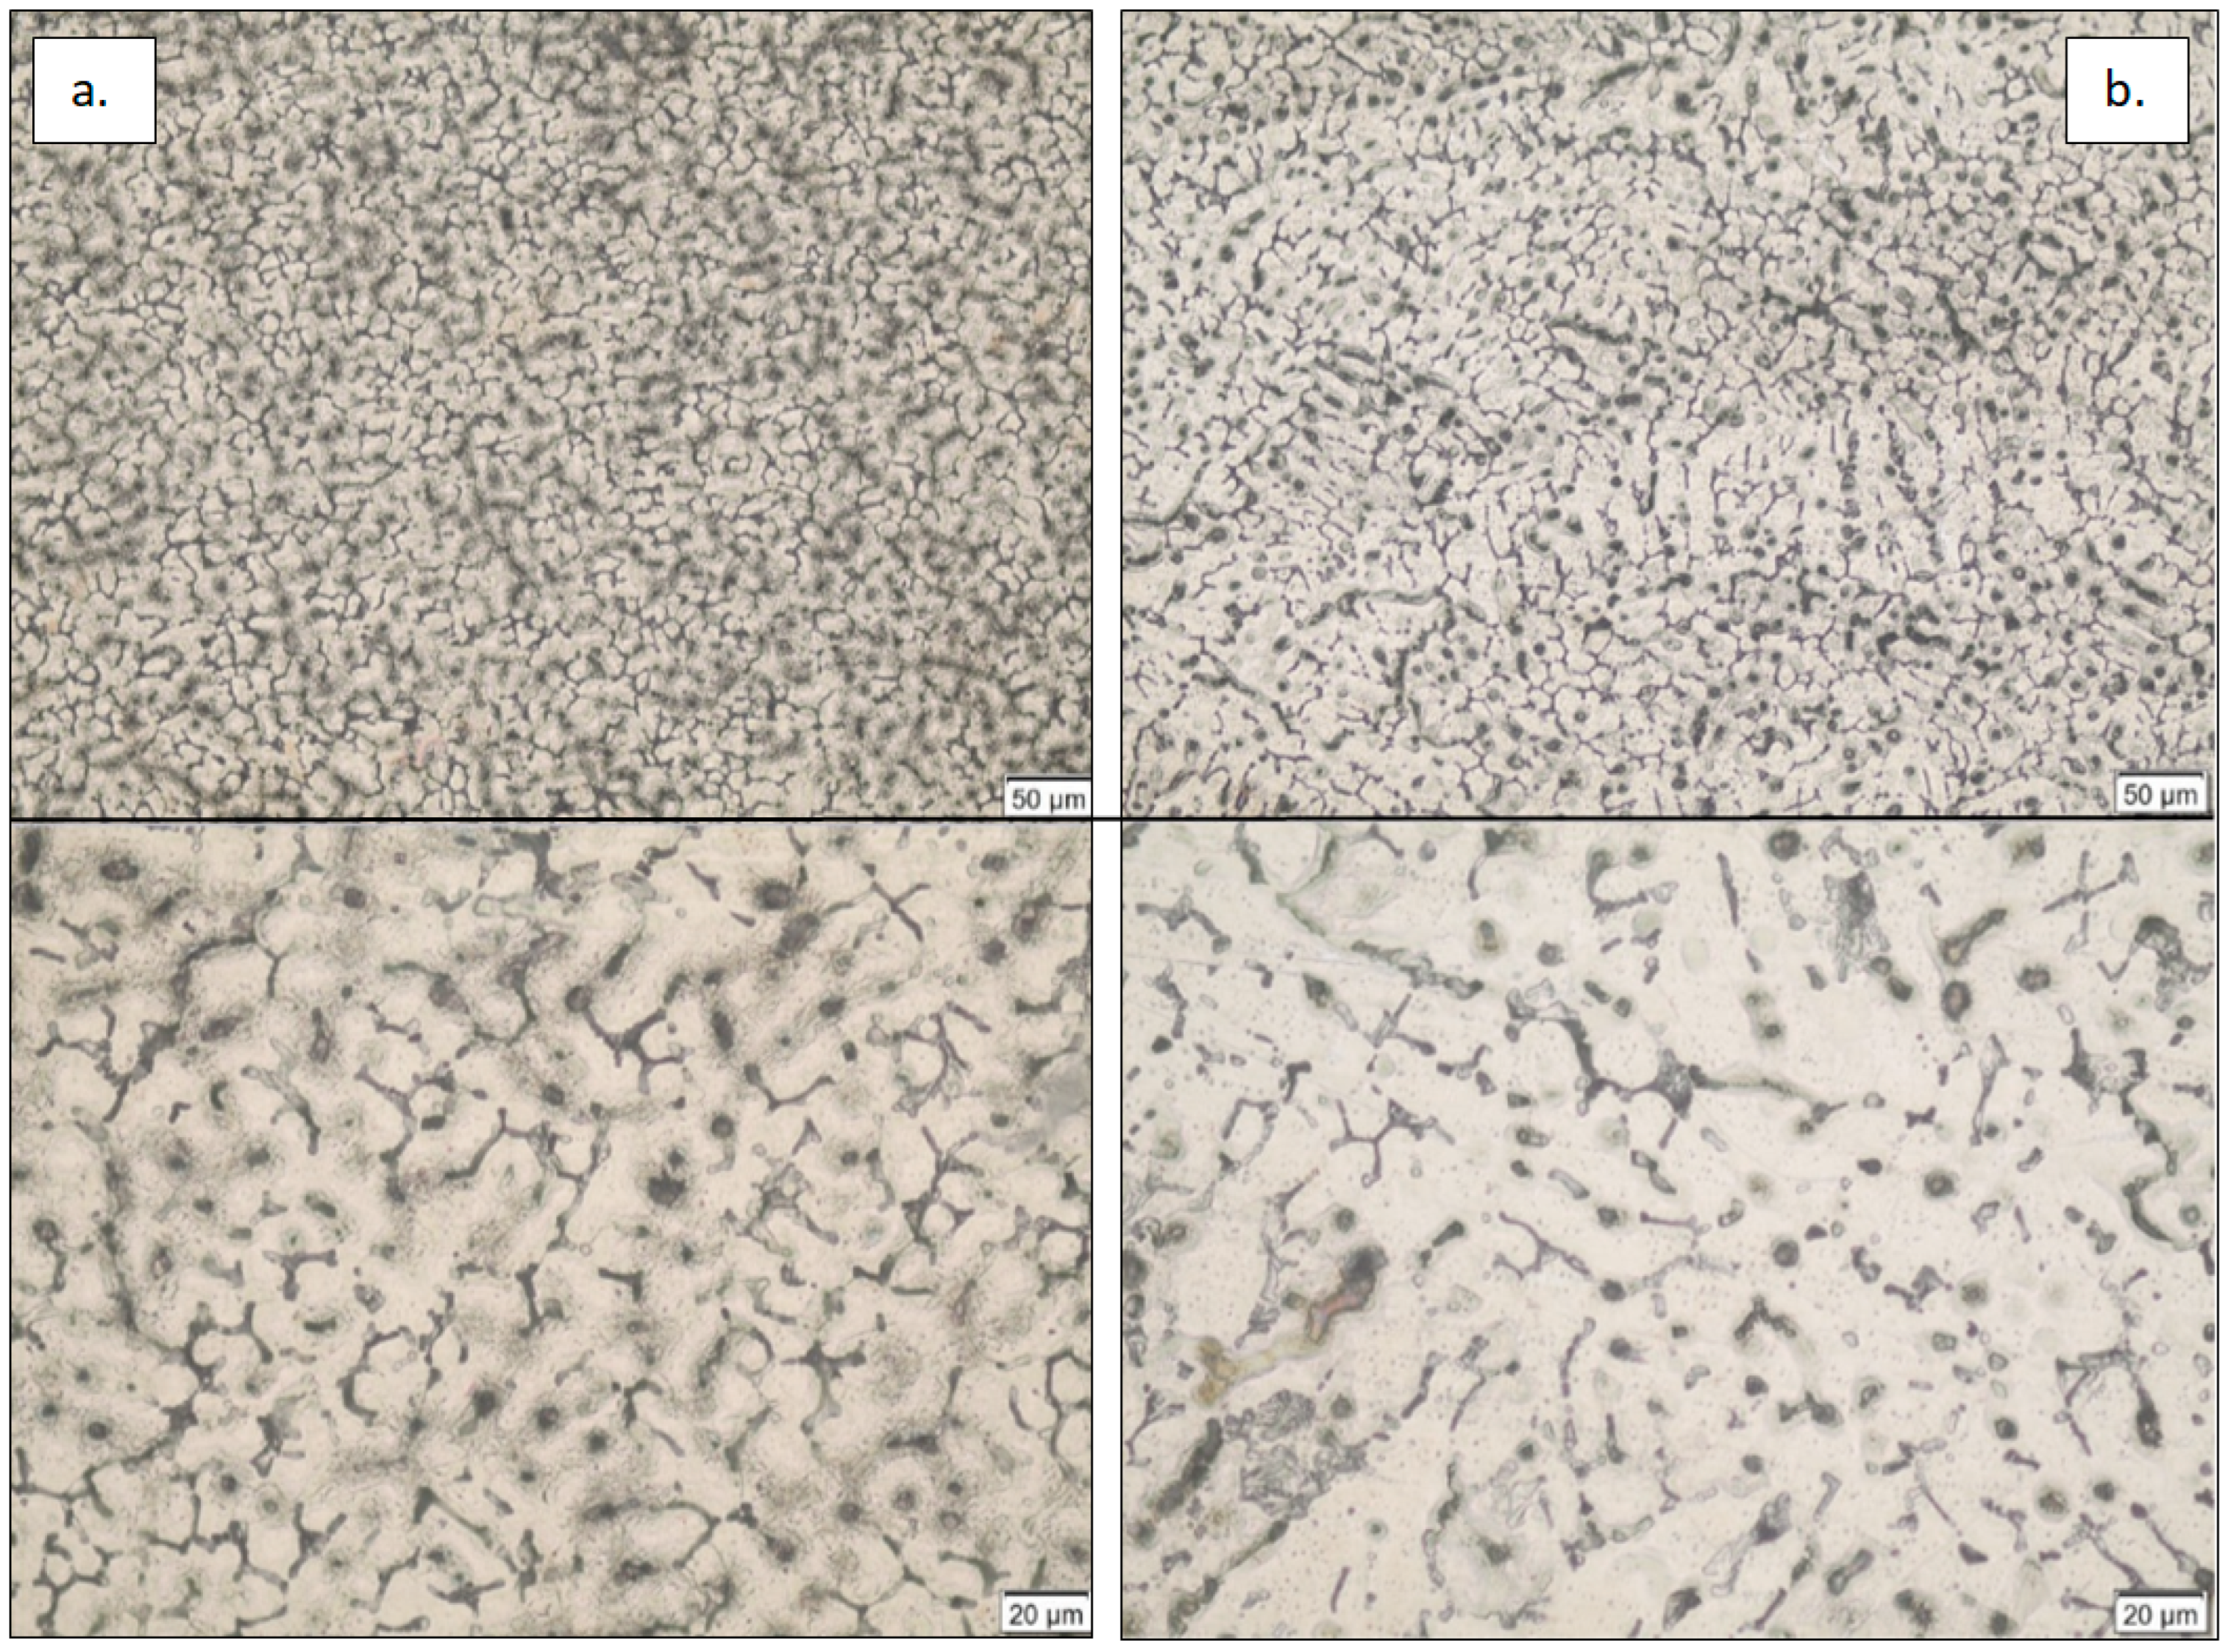
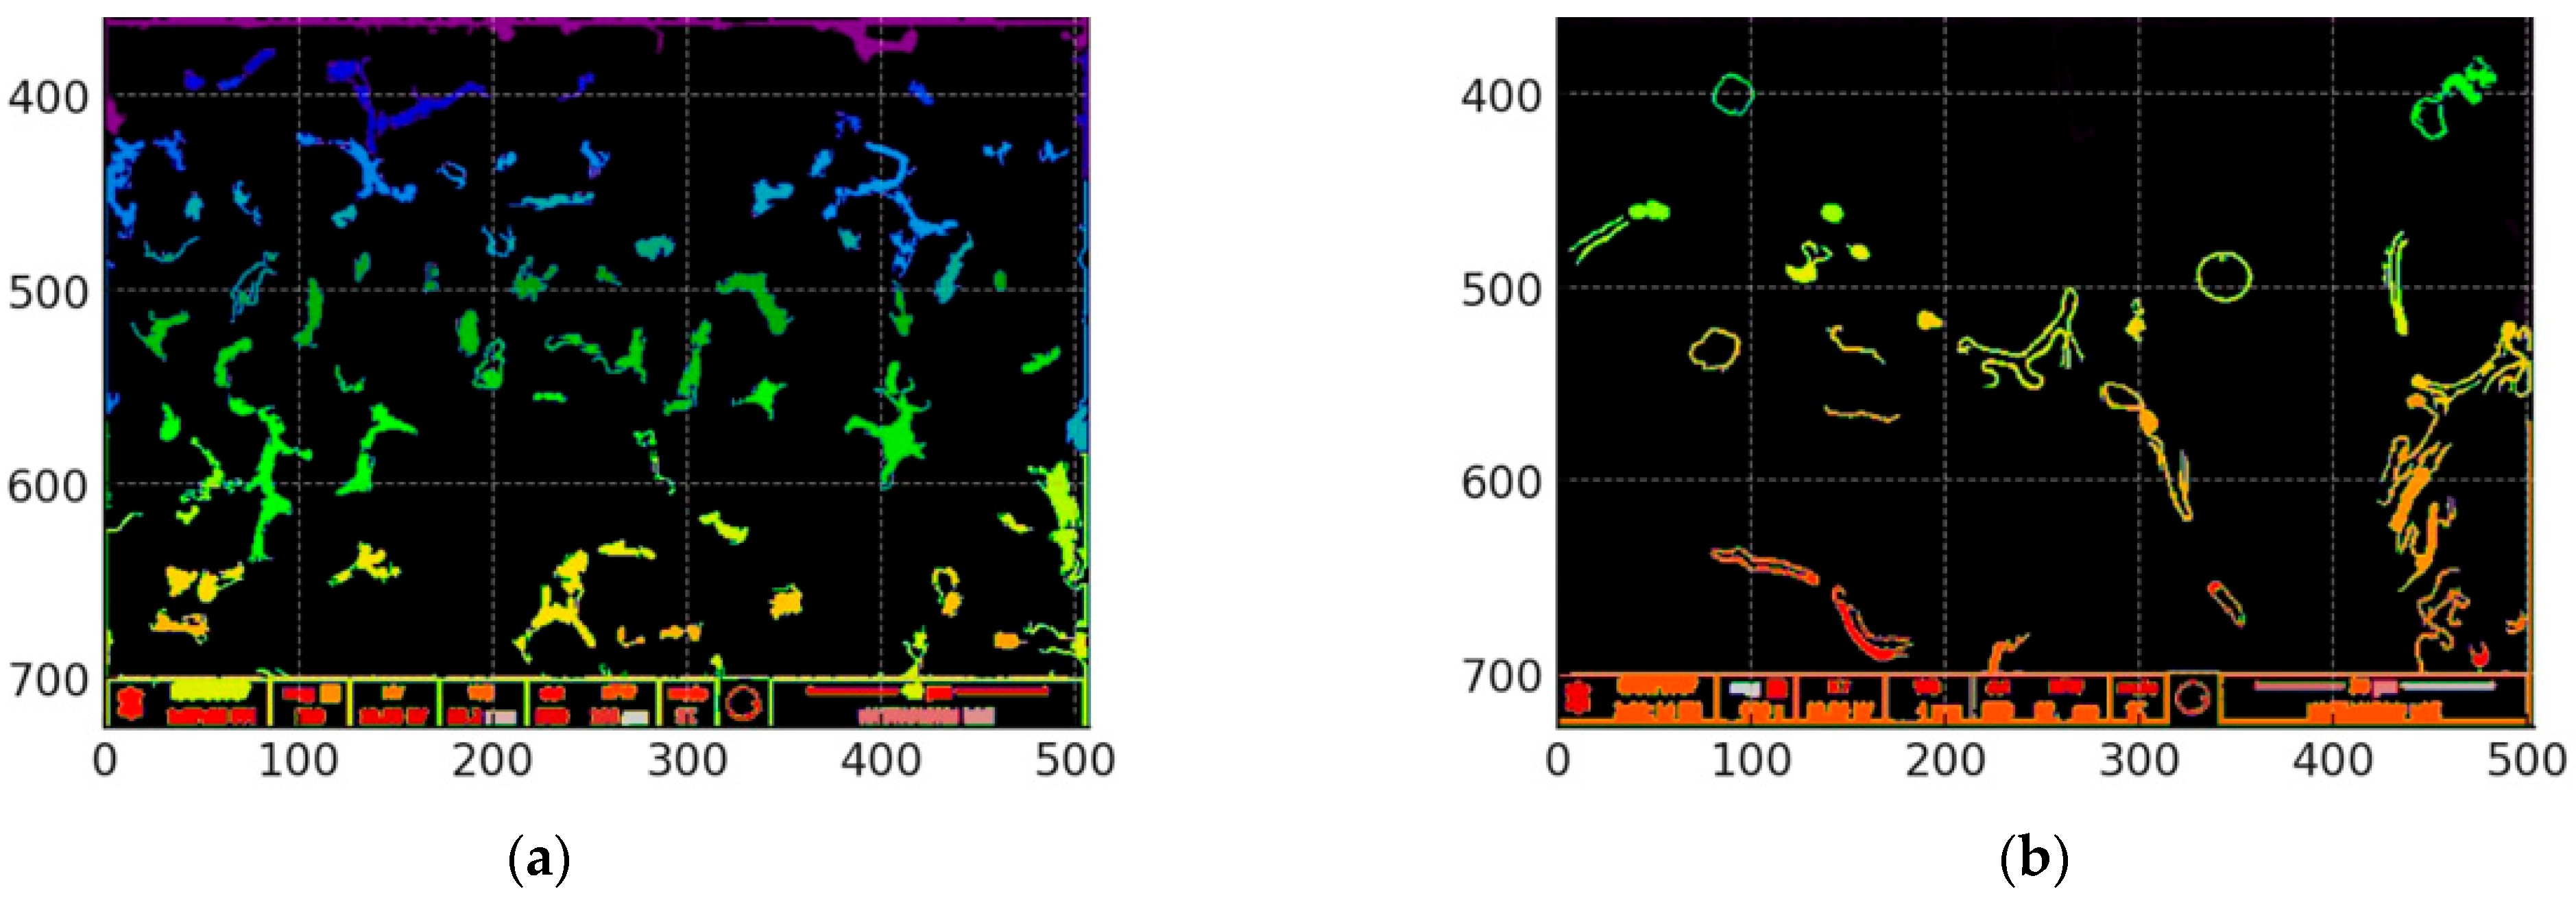
The microstructural analysis of the samples was conducted in several key steps to ensure high accuracy in image processing. The Python programming language and OpenCV library were utilized for this analysis. As the initial step, images of both samples were loaded, and regions marked in red were identified. This process involved color masking within a specific range, allowing for the selection of only red regions. During the masking process, grayscale conversion and thresholding techniques were applied to isolate red-marked regions from other colors. The identified red areas were then numerically analyzed using contour detection. The size of each area (in pixels) was calculated and then converted into microns using a scaling factor (Figure 3). The identified red areas were subsequently analyzed in detail using contour detection techniques. The pixel-based area of each red zone was calculated and converted into microns using a predefined scaling factor. As illustrated in Figure 3, these regions represent localized concentrations of intermetallic compounds within the microstructure. The size distribution of these areas provides a quantitative basis for comparing different alloy compositions, and their variation offers insights into how Fe and Cu content influence the formation and clustering of such phases [7,19].
A 50-micron scale bar was used as a reference in each sample. The width of this scale bar was measured in pixels, determined to be 34 pixels. This measurement was verified using an image processing algorithm that incorporated contour detection and bounding box methods. Based on this, 1 pixel was calculated to be approximately 1.47 microns. This scaling factor was applied to convert all detected regions from pixels to microns. For example, the area measured in pixels was multiplied by 1.472 to express it in square microns. This approach is critical for ensuring the accuracy of visual data and aligning it with physical measurements.
The second experimental sample exhibited 14 distinct regions in its microstructure. The small size and uniform distribution of these regions indicate homogeneous phase boundaries and limited intermetallic phase accumulation. Measurements revealed that the average area of these regions was 1091.5 μm2, with an average width of 53.5 μm and a height of 49.7 μm. This microstructure, influenced by 2.23% Fe and 2.64% Cu content, resulted in balanced mechanical properties. The high aluminum content (92.9%) enhanced ductility, maintaining the fracture energy at 46 J. Additionally, an elongation percentage of 45.2% indicated that the material exhibited significant resistance to deformation. The sample also demonstrated balanced strength characteristics, with a yield strength of 92 MPa and a hardness value of 110 HV. The homogeneity of the microstructure, combined with small grain sizes, contributed to higher energy absorption during deformation, enhancing the material’s durability. These properties make this sample particularly suitable for applications requiring high deformation resistance and formability.
The microstructural properties of the second sample strongly correlate with its mechanical performance. The fine grain size observed in the microstructure contributes to higher energy absorption during deformation, resulting in improved toughness and ductility. Additionally, the presence of Fe and Cu in the alloy composition enhances phase stability and promotes better mechanical strength. The balance between strength and ductility in this sample is evident in its 92 MPa yield strength and 110 HV hardness. The elongation rate of 45.2% indicates that the material maintains high plastic deformation capacity, which is essential for applications requiring flexibility and impact resistance. The fracture energy of 46 J suggests that the material can withstand moderate impact loads without significant structural failure.
Furthermore, the distribution of intermetallic phases within the microstructure plays a critical role in determining the overall mechanical behavior. A uniform phase distribution minimizes stress concentrations, reducing the likelihood of brittle fracture. The fine and homogeneous dispersion of intermetallic phases in Sample 2 confirms that the material exhibits both high strength and moderate toughness, making it suitable for industrial applications requiring a balance between mechanical durability and processability. By correlating microstructural observations with experimental mechanical properties, a clear relationship between phase distribution, grain size, and mechanical performance can be established. The Fe and Cu contents directly influence the formation of secondary phases, which contribute to the material’s overall hardness and wear resistance.
The elongation percentage and fracture energy values suggest that the sample retains sufficient ductility despite its increased strength characteristics. This is a significant advantage in manufacturing processes where materials must endure high stress and deformation. Additionally, the microstructure indicates good resistance to localized deformation, further validating the material’s applicability in load-bearing and impact-resistant applications. The findings of this study highlight the impact of microstructural properties on mechanical performance. The optimized combination of Fe and Cu in the aluminum matrix enhances strength, ductility, and toughness, making it an ideal candidate for structural and industrial applications. The results confirm that precise control over alloy composition and microstructure leads to optimized mechanical properties, enabling materials to meet specific engineering demands efficiently.
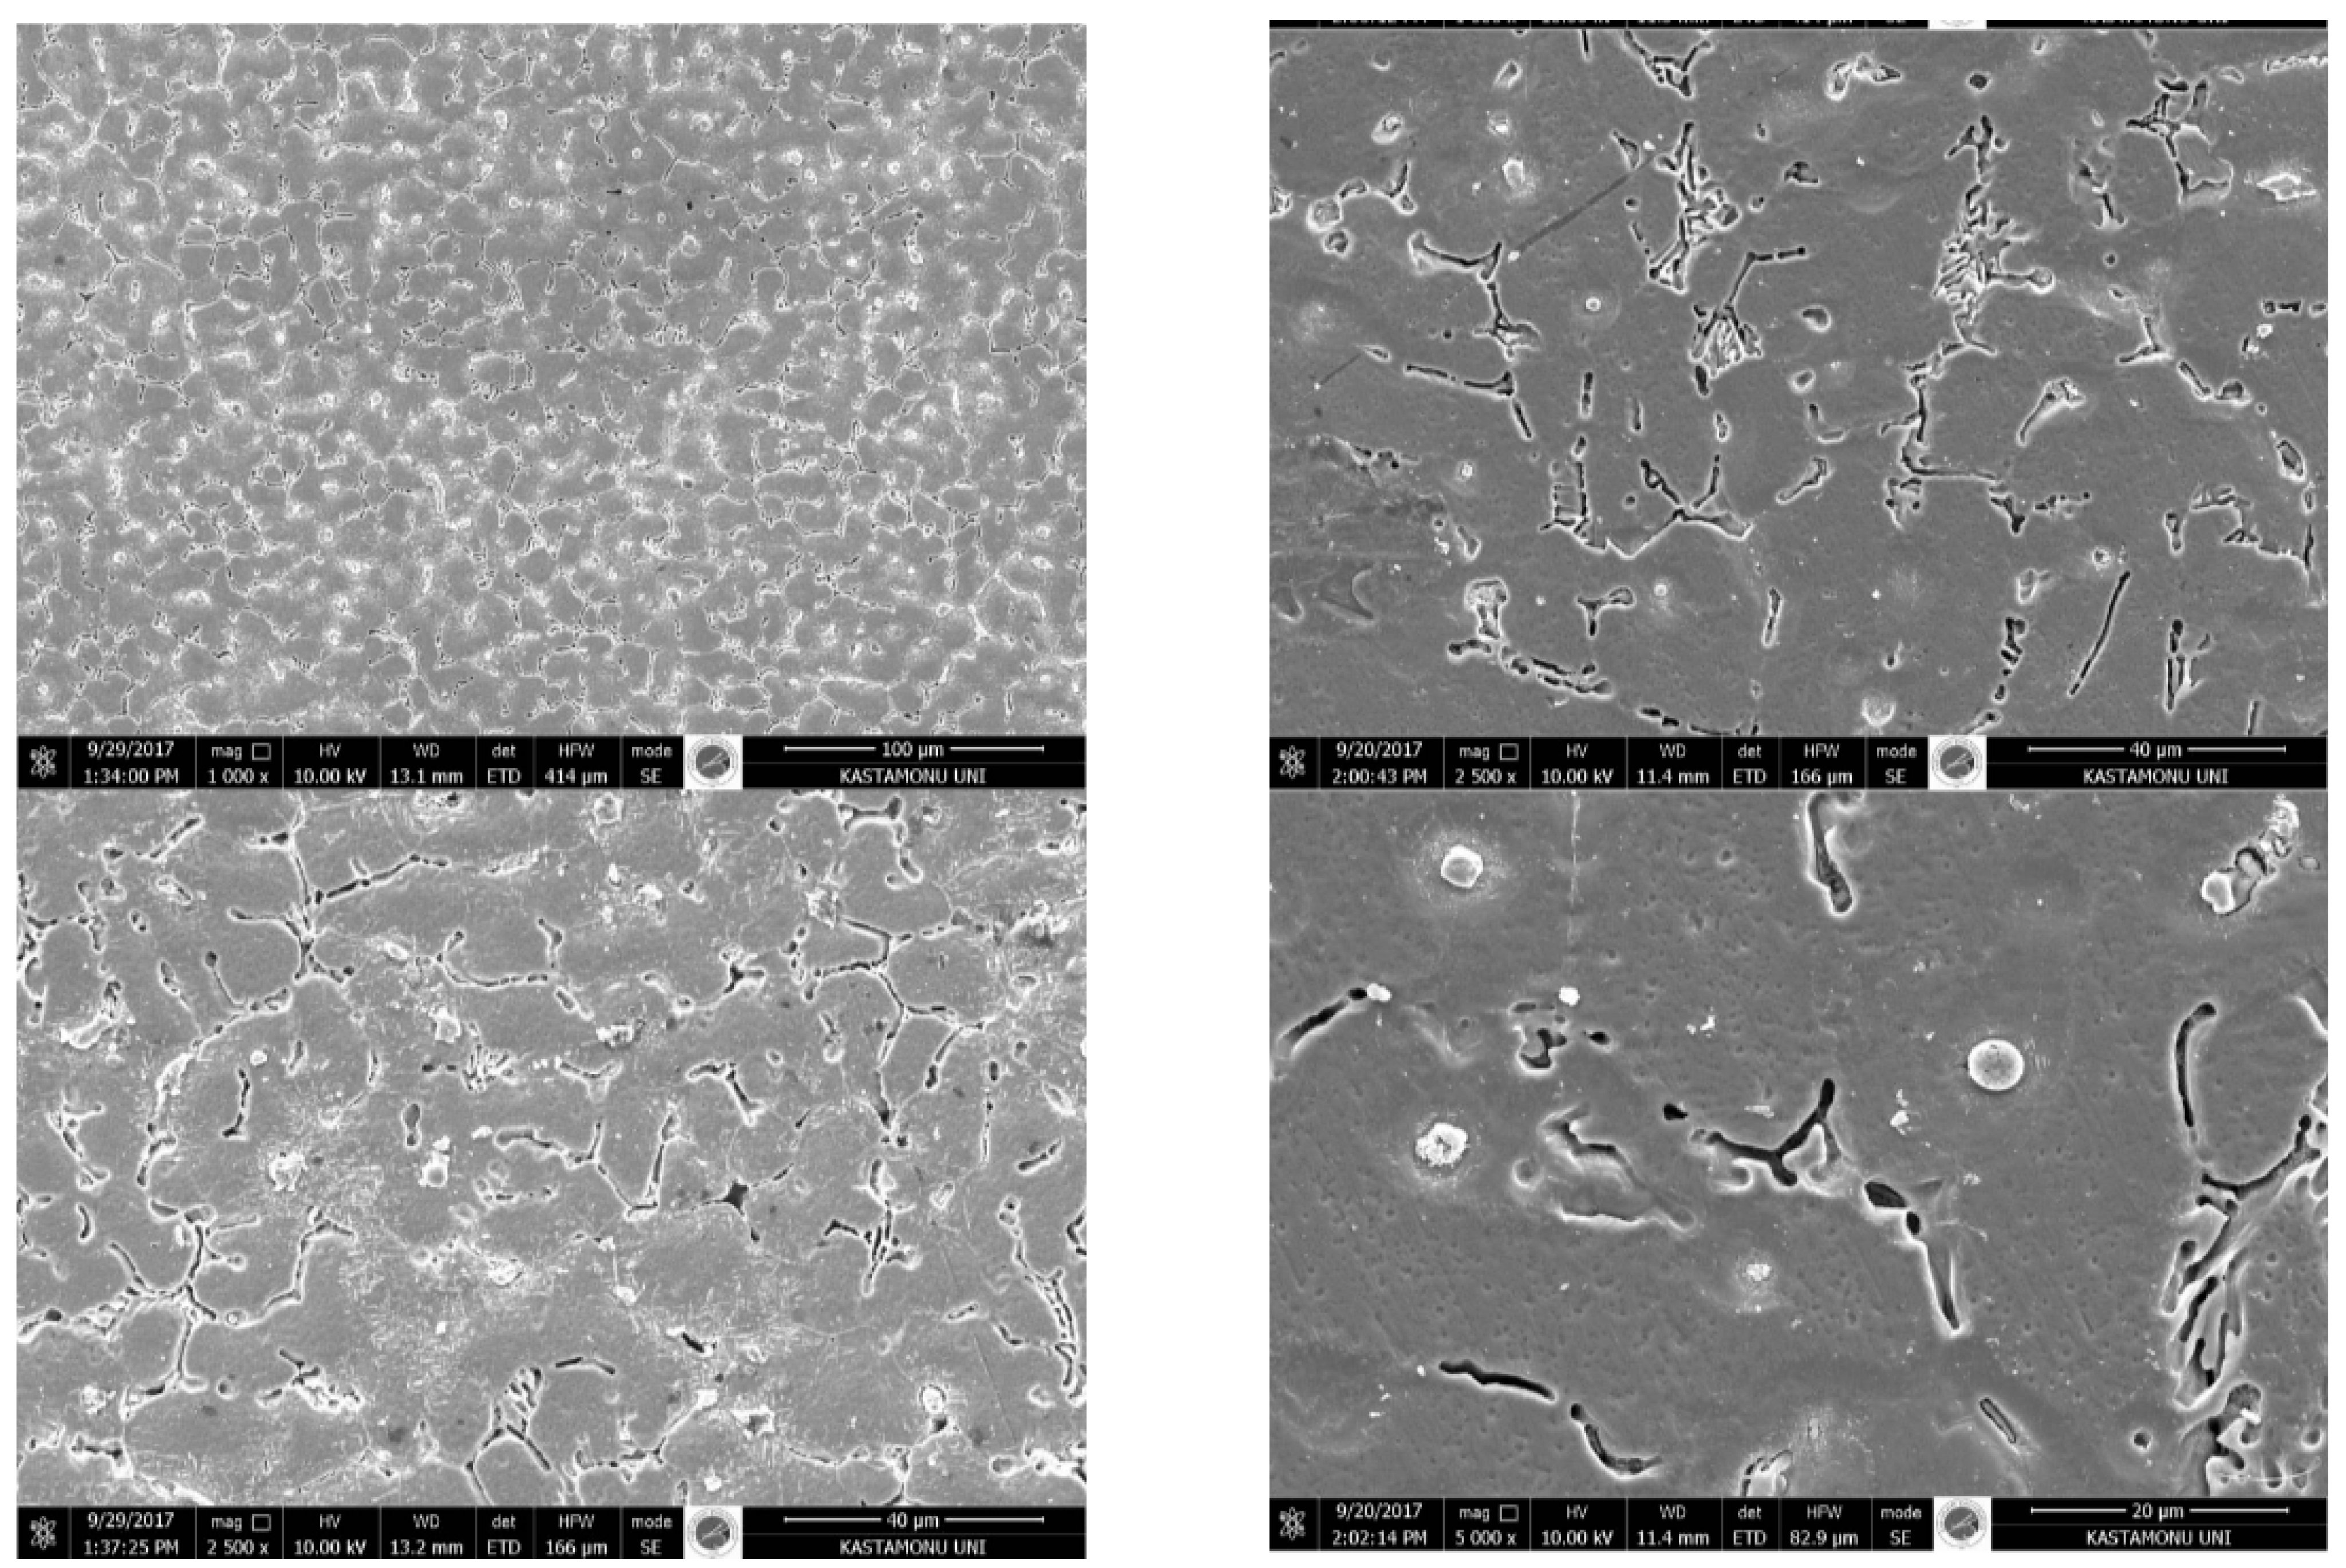
In Figure 4, various image processing modules in the Python programming language were utilized for the analysis of SEM images. During these processes, the scikit-image library provided essential tools for analyzing the grains and phase boundaries within the microstructure. Sobel filters were applied to enhance phase boundaries and improve contrast differences, followed by Otsu thresholding, which segmented these boundaries. Morphological cleaning operations were employed to remove small and unnecessary segments, minimizing errors in the image. Features such as grain size, perimeter, and equivalent diameter were measured using the regionprops function, enabling a detailed analysis. In the visualization phase, Matplotlib (Python 3.13.0) was used to convert the results into graphical representations, making them interpretable. These processes enabled a detailed microstructural analysis of the SEM images, particularly highlighting features such as phase boundaries, intermetallic phase density, and average grain sizes. As shown in Figure 4, the contrast-enhanced and segmented regions clearly reveal the spatial distribution of intermetallic phases and their interaction with the matrix. This visual evidence supports the quantitative data obtained from image processing and confirms the influence of Fe and Cu additions on microstructural refinement.
When examining the SEM images of Sample 2, the grains appear distinct, and the phase boundaries are clearly visible. A dense accumulation of intermetallic phases is observed along the phase boundaries, increasing the heterogeneity of the microstructure and creating localized variations. The grains exhibit an inhomogeneous distribution, with smaller grains being more prevalent. Dendritic structures are notably thick and more concentrated at the intersection points of the phase boundaries. The average grain diameter has decreased due to the high iron content. The accumulation at phase boundaries is clearly noticeable. This density indicates that while the material’s hardness and strength may increase, its ductility could be reduced.
When analyzing the SEM images of Sample 3, the phase boundaries remain distinct, but the accumulation is less pronounced compared to Sample 2. The grain boundaries exhibit a more homogeneous structure. The intermetallic phases are dispersed within the dendritic structures but are present at a lower density. Larger grains are observed, and the grain boundary width suggests that the microstructure exhibits greater ductility. The accumulation of intermetallic phases is relatively lower, which could positively contribute to the fracture energy by enhancing ductility.
While Sample 2 features a finer and denser grain structure, Sample 3 exhibits larger grains. Smaller grains enhance hardness, whereas larger grains support ductility. In Sample 2, the phase boundaries are more distinct and thicker, with intense intermetallic phase accumulation. Conversely, in Sample 3, the boundaries are more homogeneous and thinner.
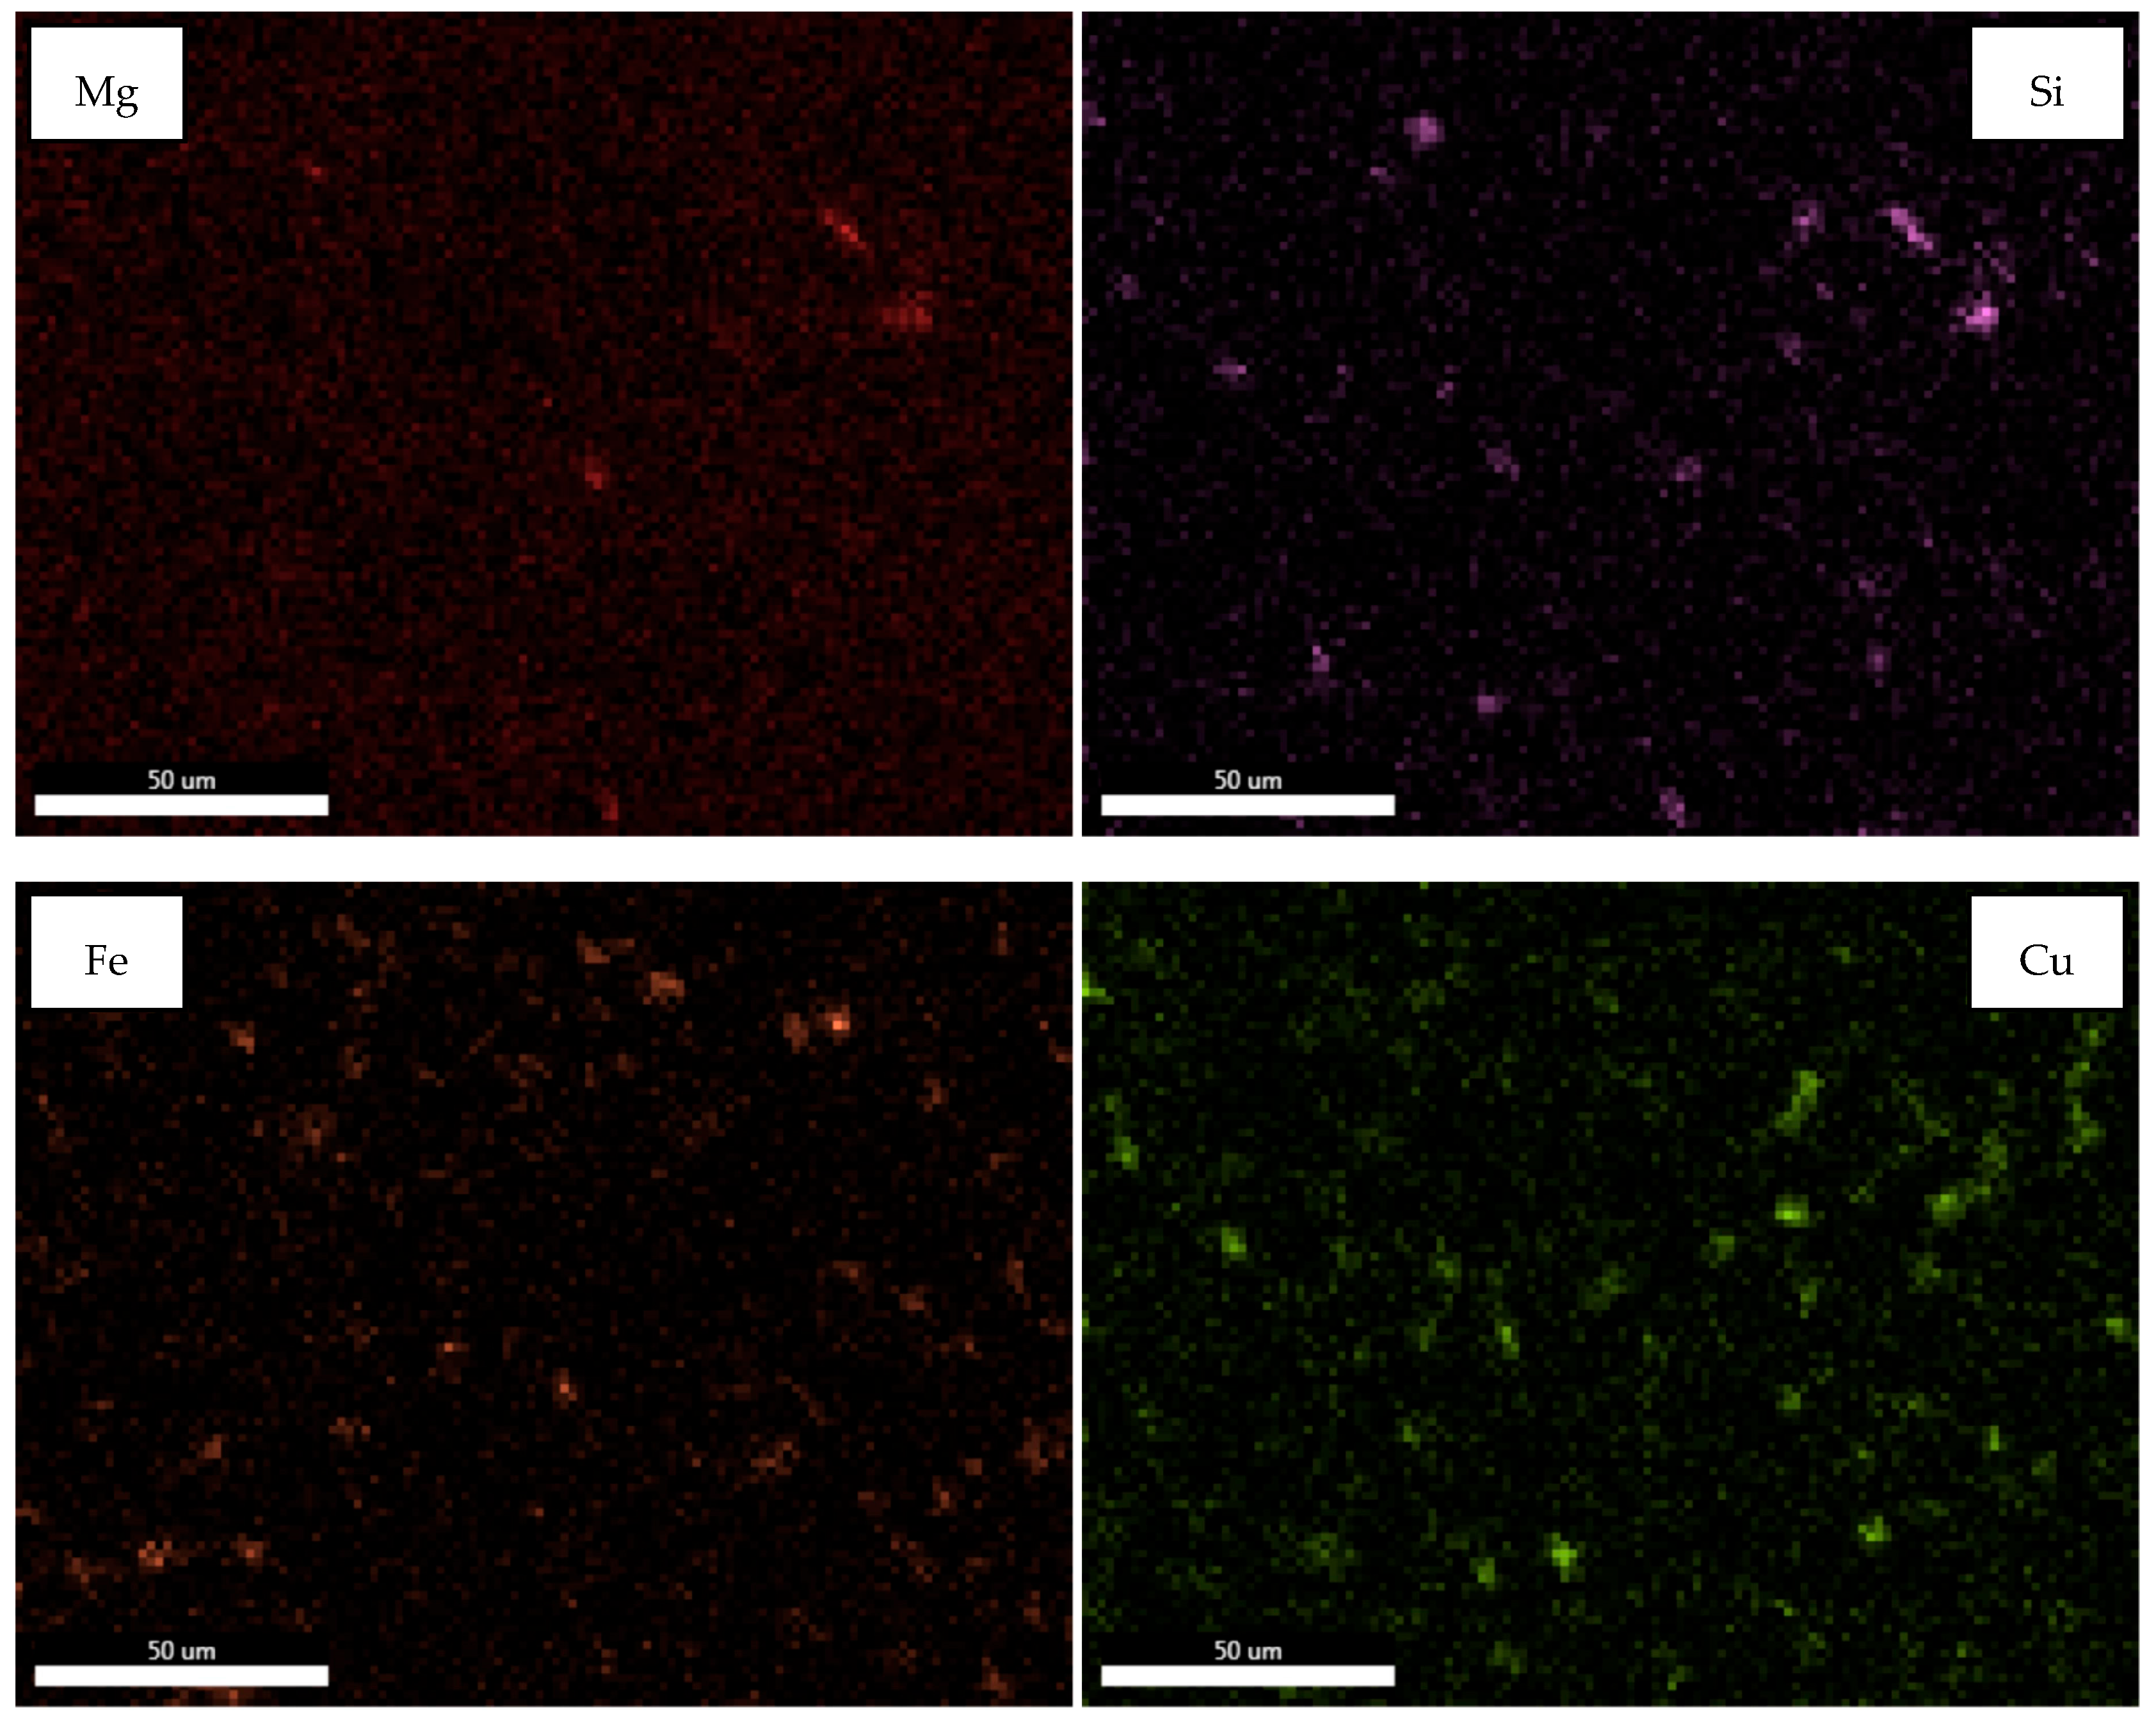
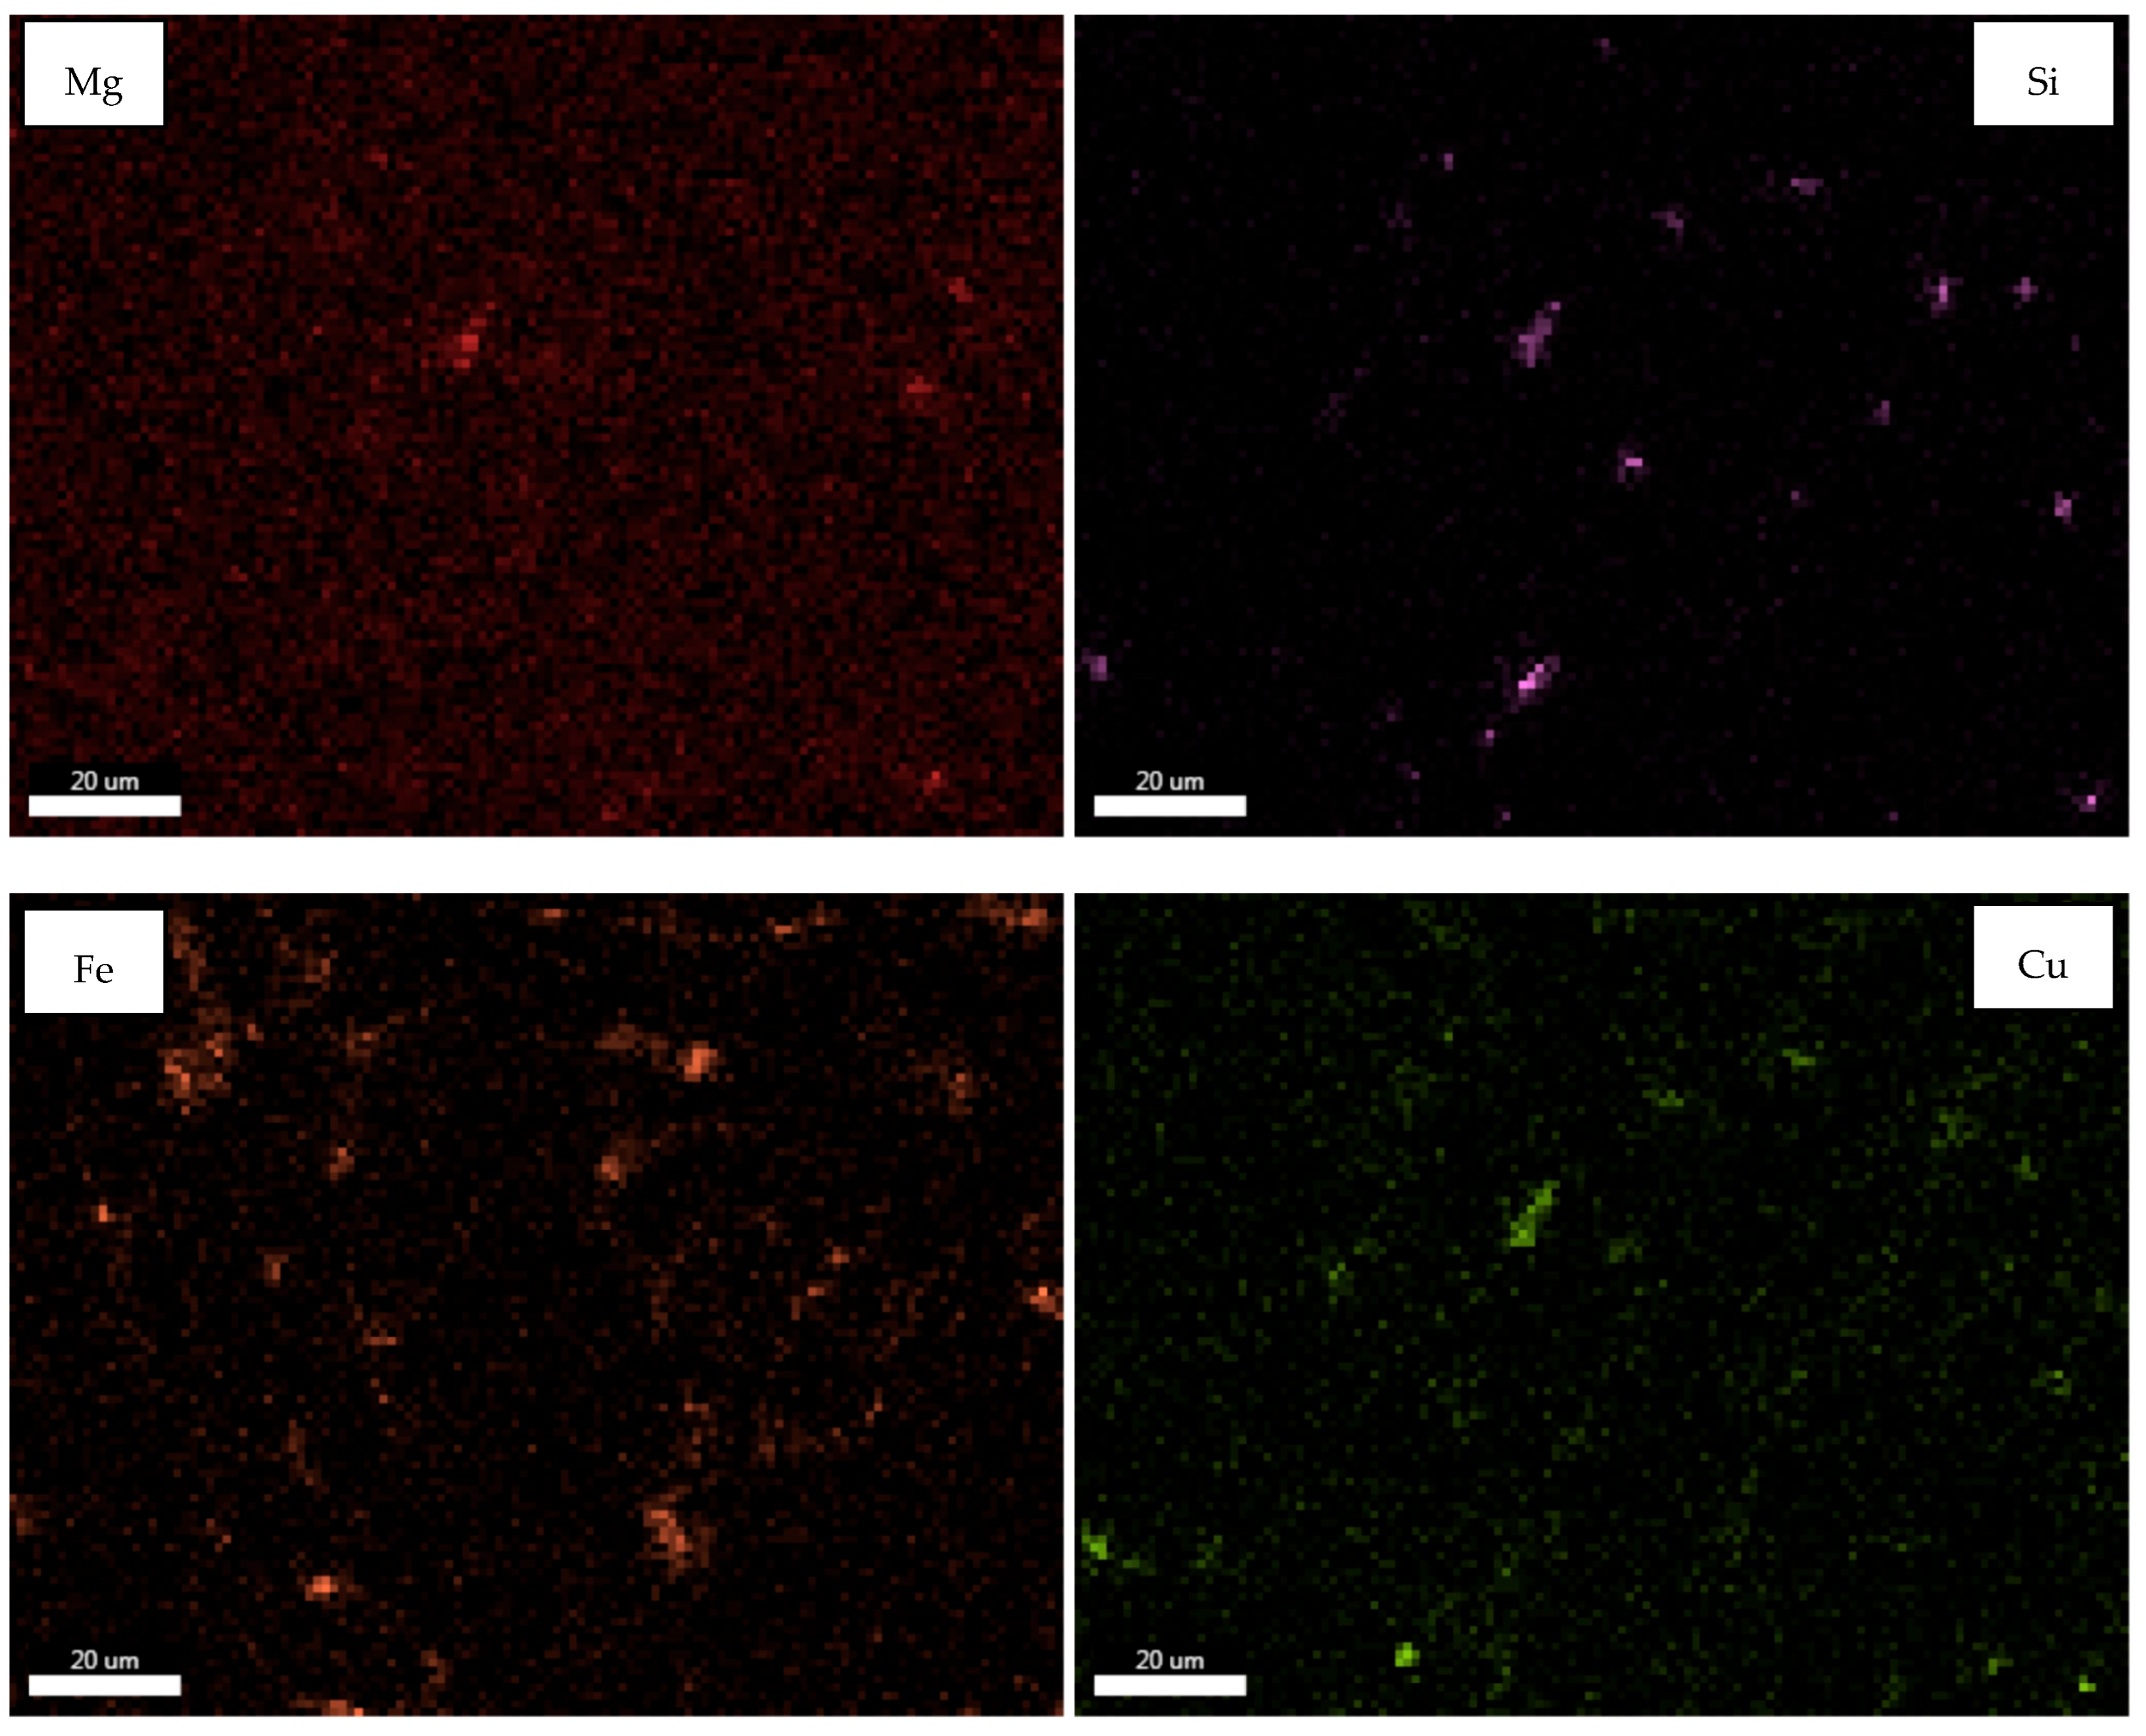
In Figure 5, the EDX results of Sample 2 are presented, while Figure 6 displays the EDX results of Sample 3. Upon examining the EDX results of Sample 2, it is observed that elemental phase boundaries are more distinct and densely concentrated. Due to variations in density, the elemental distribution exhibits a more irregular and heterogeneous structure. The high iron content, in particular, has led to the accumulation of intermetallic phases at phase boundaries. The element distribution is not uniform throughout the matrix, and localized phase clusters are observed in certain regions. The accumulation of intermetallic phases, especially at phase boundaries, has resulted in a complex dendritic structure. While this structure has the potential to enhance hardness and strength, it may negatively impact ductility.
Image-processing-based quantification revealed that Sample 2 (Al–2.23Fe–2.64Cu) contained 14 finely dispersed intermetallic regions with an average area of 1091.5 μm2, a mean width of 53.5 μm, and a height of 49.7 μm, indicating a uniform microstructural distribution. This homogeneous phase dispersion directly correlated with its superior mechanical balance, characterized by a yield strength of 92 MPa, hardness of 110 HV, elongation of 45.2%, and fracture energy of 46 J. The fine-grain structure and controlled Fe–Cu content promoted ductility and toughness while maintaining adequate strength. By contrast, Sample 3 (Al–4.92Fe–2.17Cu) exhibited clustered intermetallic regions, larger dendritic features, and higher heterogeneity, resulting in increased yield strength of 172 MPa and hardness of 88 HV, but reduced elongation (35.9%) and fracture energy (34 J). These results highlight that Python-driven image analysis provided a quantitative microstructural basis that directly explained the observed variations in mechanical properties between the two alloys.
When machining performance was evaluated, Sample 2, with its refined and evenly distributed intermetallic phases, required significantly less energy for chip removal, reflected by a specific cutting energy consumption (SCEC) of 1.84 J/mm3. The homogeneous microstructure reduced localized stress concentrations during cutting, thereby minimizing tool–material friction and enabling more energy-efficient machining. In contrast, the coarser, Fe-rich clustered phases in Sample 3 increased resistance to deformation during cutting, leading to a higher SCEC value of 2.57 J/mm3. This clear microstructure–machining linkage was further supported by image-processing-derived parameters such as grain size distribution and intermetallic area fraction, which demonstrated strong correlations with both hardness and energy consumption. These findings confirm that Python-based image analysis not only quantified the microstructure but also served as a predictive indicator of machining performance, establishing a robust structure–property–process relationship essential for optimizing alloy design and manufacturing efficiency.
Analyzing the EDX results of Sample 3, it is evident that the elemental distribution suggests a more heterogeneous structure. Similar to Sample 2, the high iron content has caused intermetallic phases to accumulate in boundary regions. The element density is not evenly distributed across the matrix, and localized phase accumulations are present in specific areas. This accumulation is particularly concentrated at phase boundaries, leading to notable structural complexity within dendritic formations. While this accumulation may contribute to increased hardness and strength, it could also have adverse effects on ductility.
Compared to Sample 2, Sample 3 exhibits a more pronounced accumulation of intermetallic phases. This accumulation, driven by high iron content, has resulted in more distinct and thicker phase boundaries. In contrast, Sample 2 presents a more homogeneous matrix structure, with a lower phase density, leading to a more balanced elemental distribution. While phase boundaries in Sample 3 appear thick and well-defined, those in Sample 2 are thinner and more uniform.
This distinction also affects the mechanical properties of the samples. Sample 3 demonstrates superior hardness and strength, making it more suitable for applications requiring high mechanical resistance. However, its increased brittleness could be a disadvantage in impact-prone environments. On the other hand, Sample 2 exhibits greater ductility, offering significant advantages for applications where energy absorption and fracture resistance are critical due to its lower phase density.

3.2. Manufacturing Results

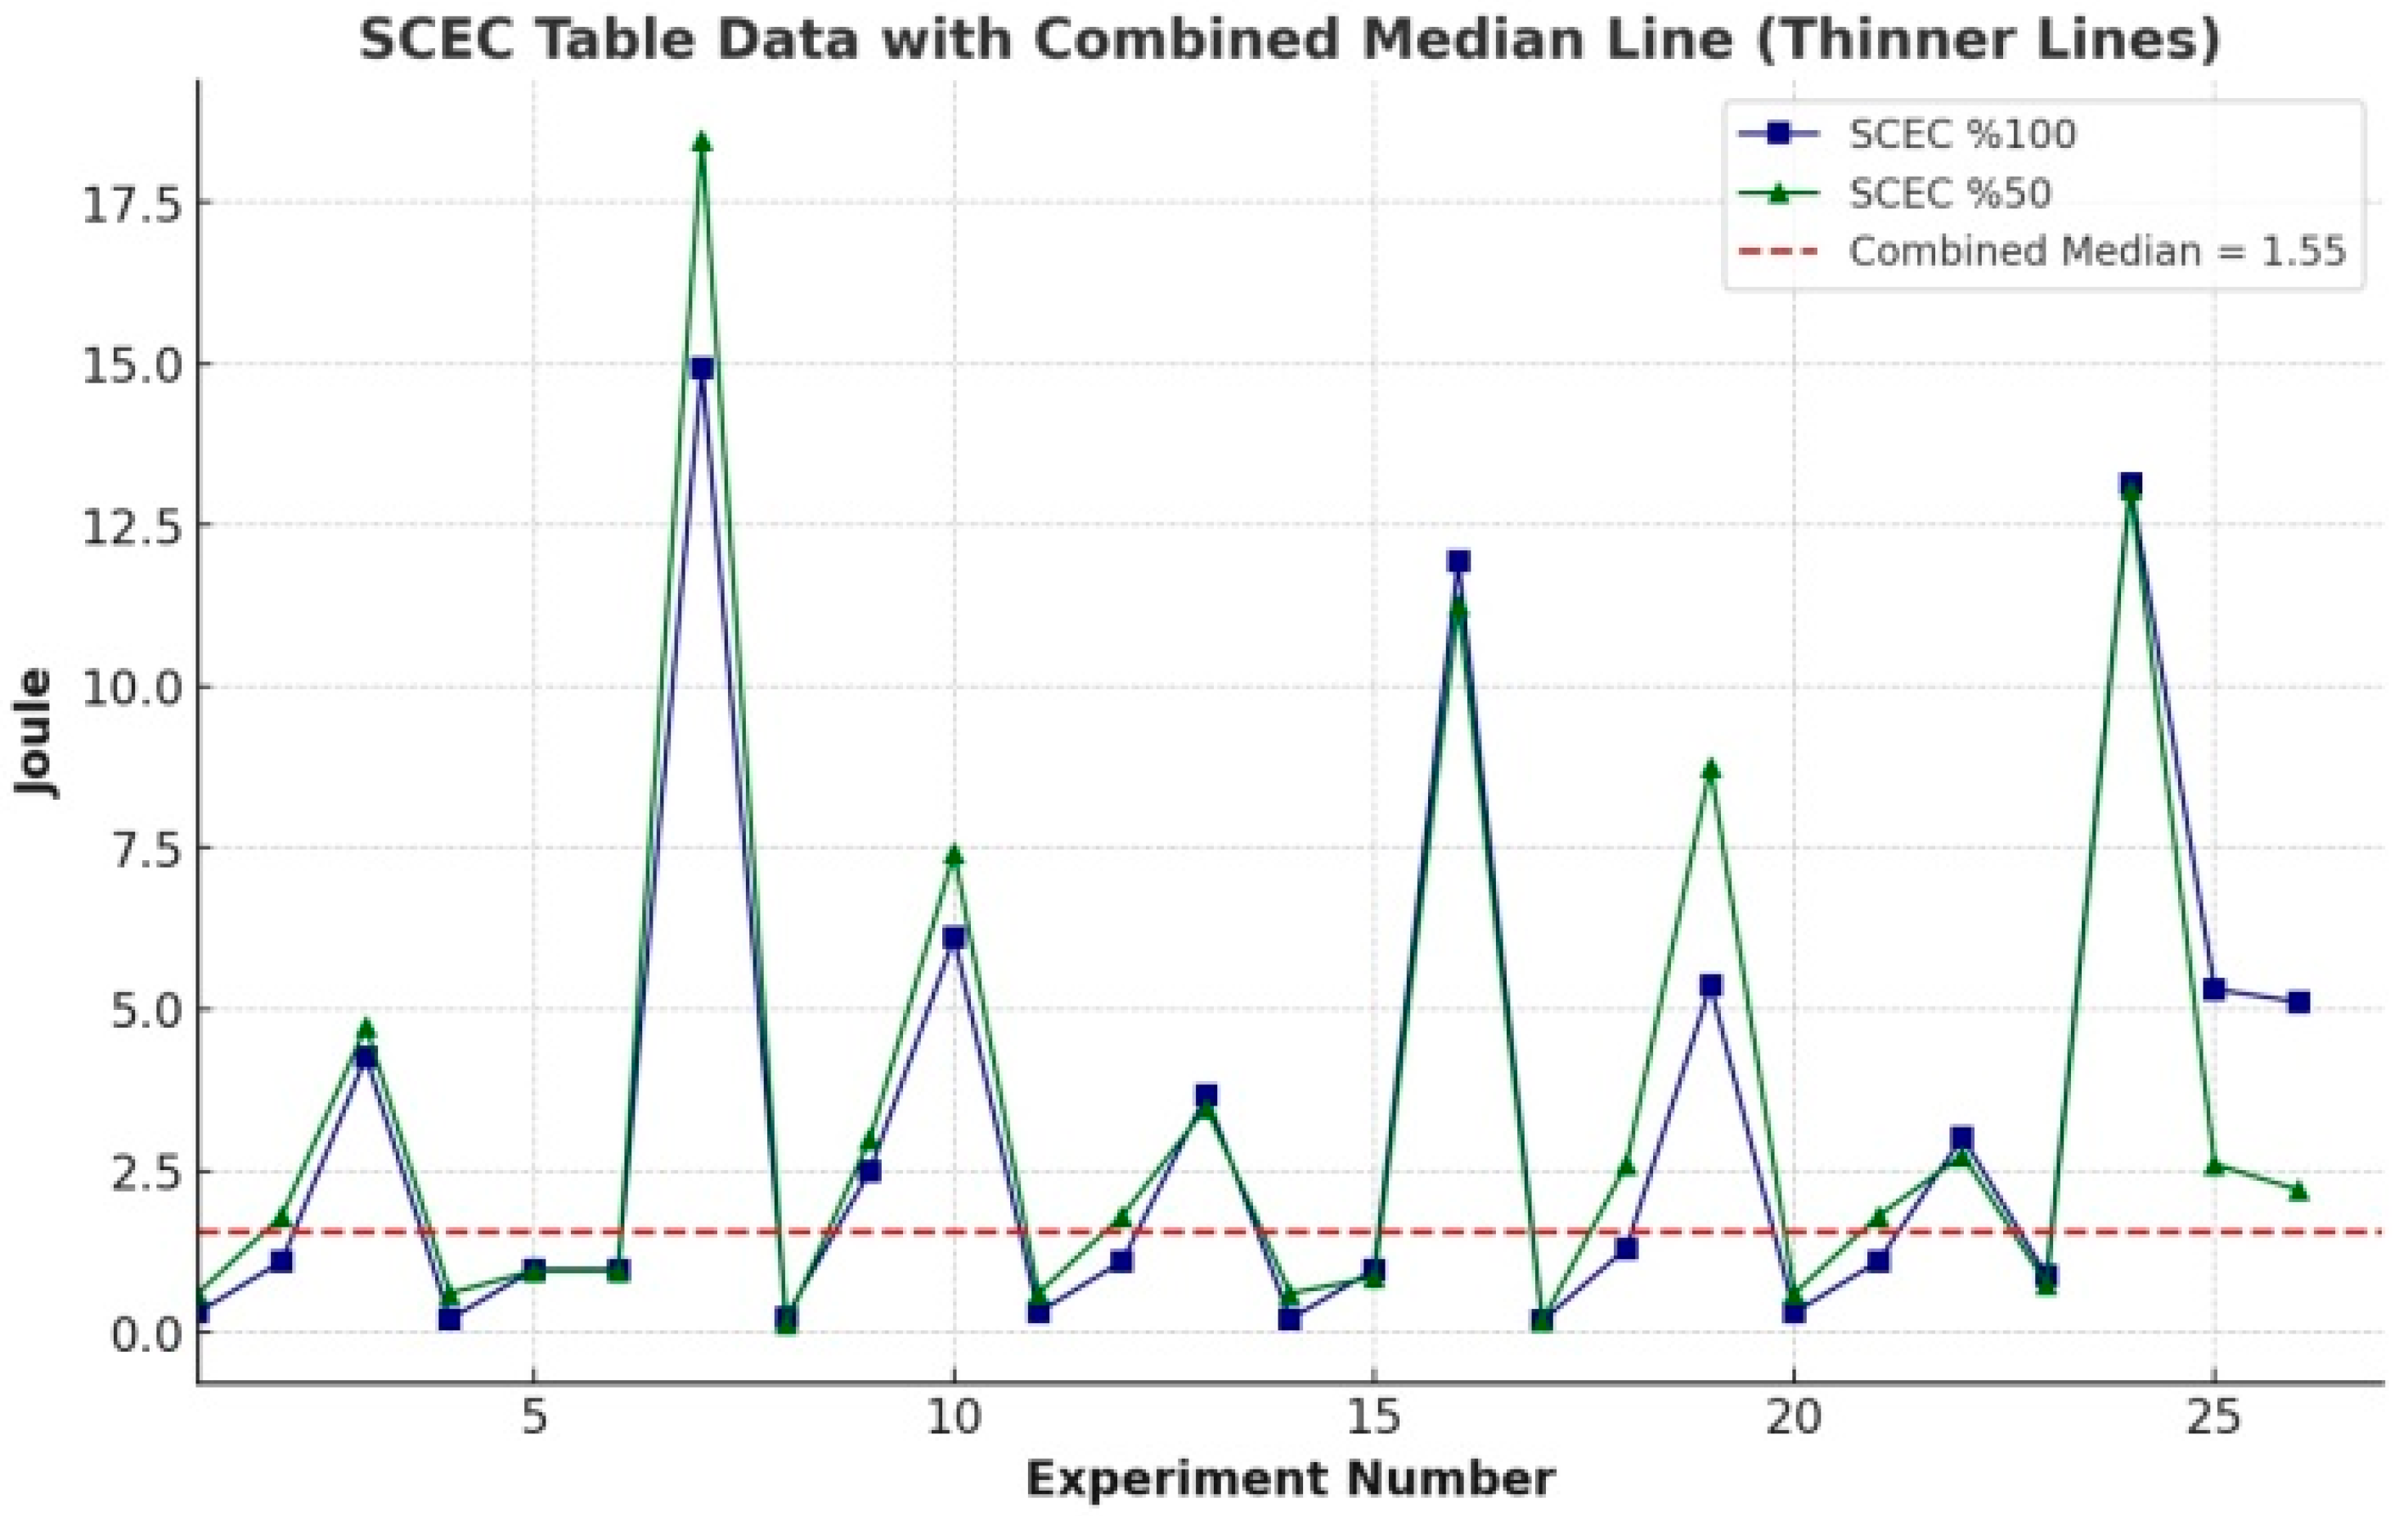
Figure 7 presents the experimental results to explain the variations in SEC and SCEC values. These data were analyzed considering different cutting speeds, feed rates, cutting depths, and material types. Notably, the effects of cutting speed and feed rate on energy consumption and efficiency were clearly demonstrated. When examining SEC values, it was observed that energy consumption is higher at lower cutting speeds. This indicates that machining at low speeds requires more energy, thereby reducing overall efficiency. On the other hand, an increase in feed rate generally leads to a decrease in SEC values, improving energy efficiency. This highlights the critical importance of selecting an optimal combination of feed rate and cutting speed for energy savings.
The analysis of SCEC values reveals that higher cutting speeds optimize energy consumption, whereas at lower feed rates, energy density tends to increase. Specifically, at a cutting speed of 150 m/s and a feed rate of 0.15 mm/s, the SCEC 100% and SCEC 50% values exhibit a more balanced distribution. These findings suggest that to enhance energy efficiency, a high cutting speed and a moderate feed rate should be preferred. When evaluating the impact of material type, the results indicate that energy consumption is directly related to the physical properties of the material. Among the tested materials, Material 2 demonstrated the lowest SEC and SCEC values, providing a significant advantage in terms of energy efficiency. In contrast, Materials 1 and 3 resulted in higher energy consumption, emphasizing the need for careful material selection to optimize machining efficiency.
For the 6061 alloy, optimum machining conditions yielded SEC-S = 7.545 J, SEC-X = 1.203 J, Pcutting-S = 7.108 W, and Pcutting-X = 23.643 W [56]. For the 7075 alloy, the minimum SEC values were 8.82 W/mm3 (spindle) and 1.58 W/mm3 (X-axis), with corresponding SCEC values of 0.25 W/mm3 and 0.19 W/mm3, respectively [57]. Although these results were obtained under different experimental setups, the 8000 series alloy in the present study exhibited comparatively lower values, with SEC ranging from 1.20–1.45 J/mm3 and SCEC between 0.14–0.22 J/mm3 under its optimum cutting conditions. This indicates that, while cutting speed is the dominant factor for SEC in 6000 alloys and feed depth strongly influences SCEC in 7000 alloys, the 8000 series achieves superior energy efficiency largely due to its homogeneous microstructural distribution. Thus, the observed differences should be interpreted as indicative trends rather than direct one-to-one comparisons.
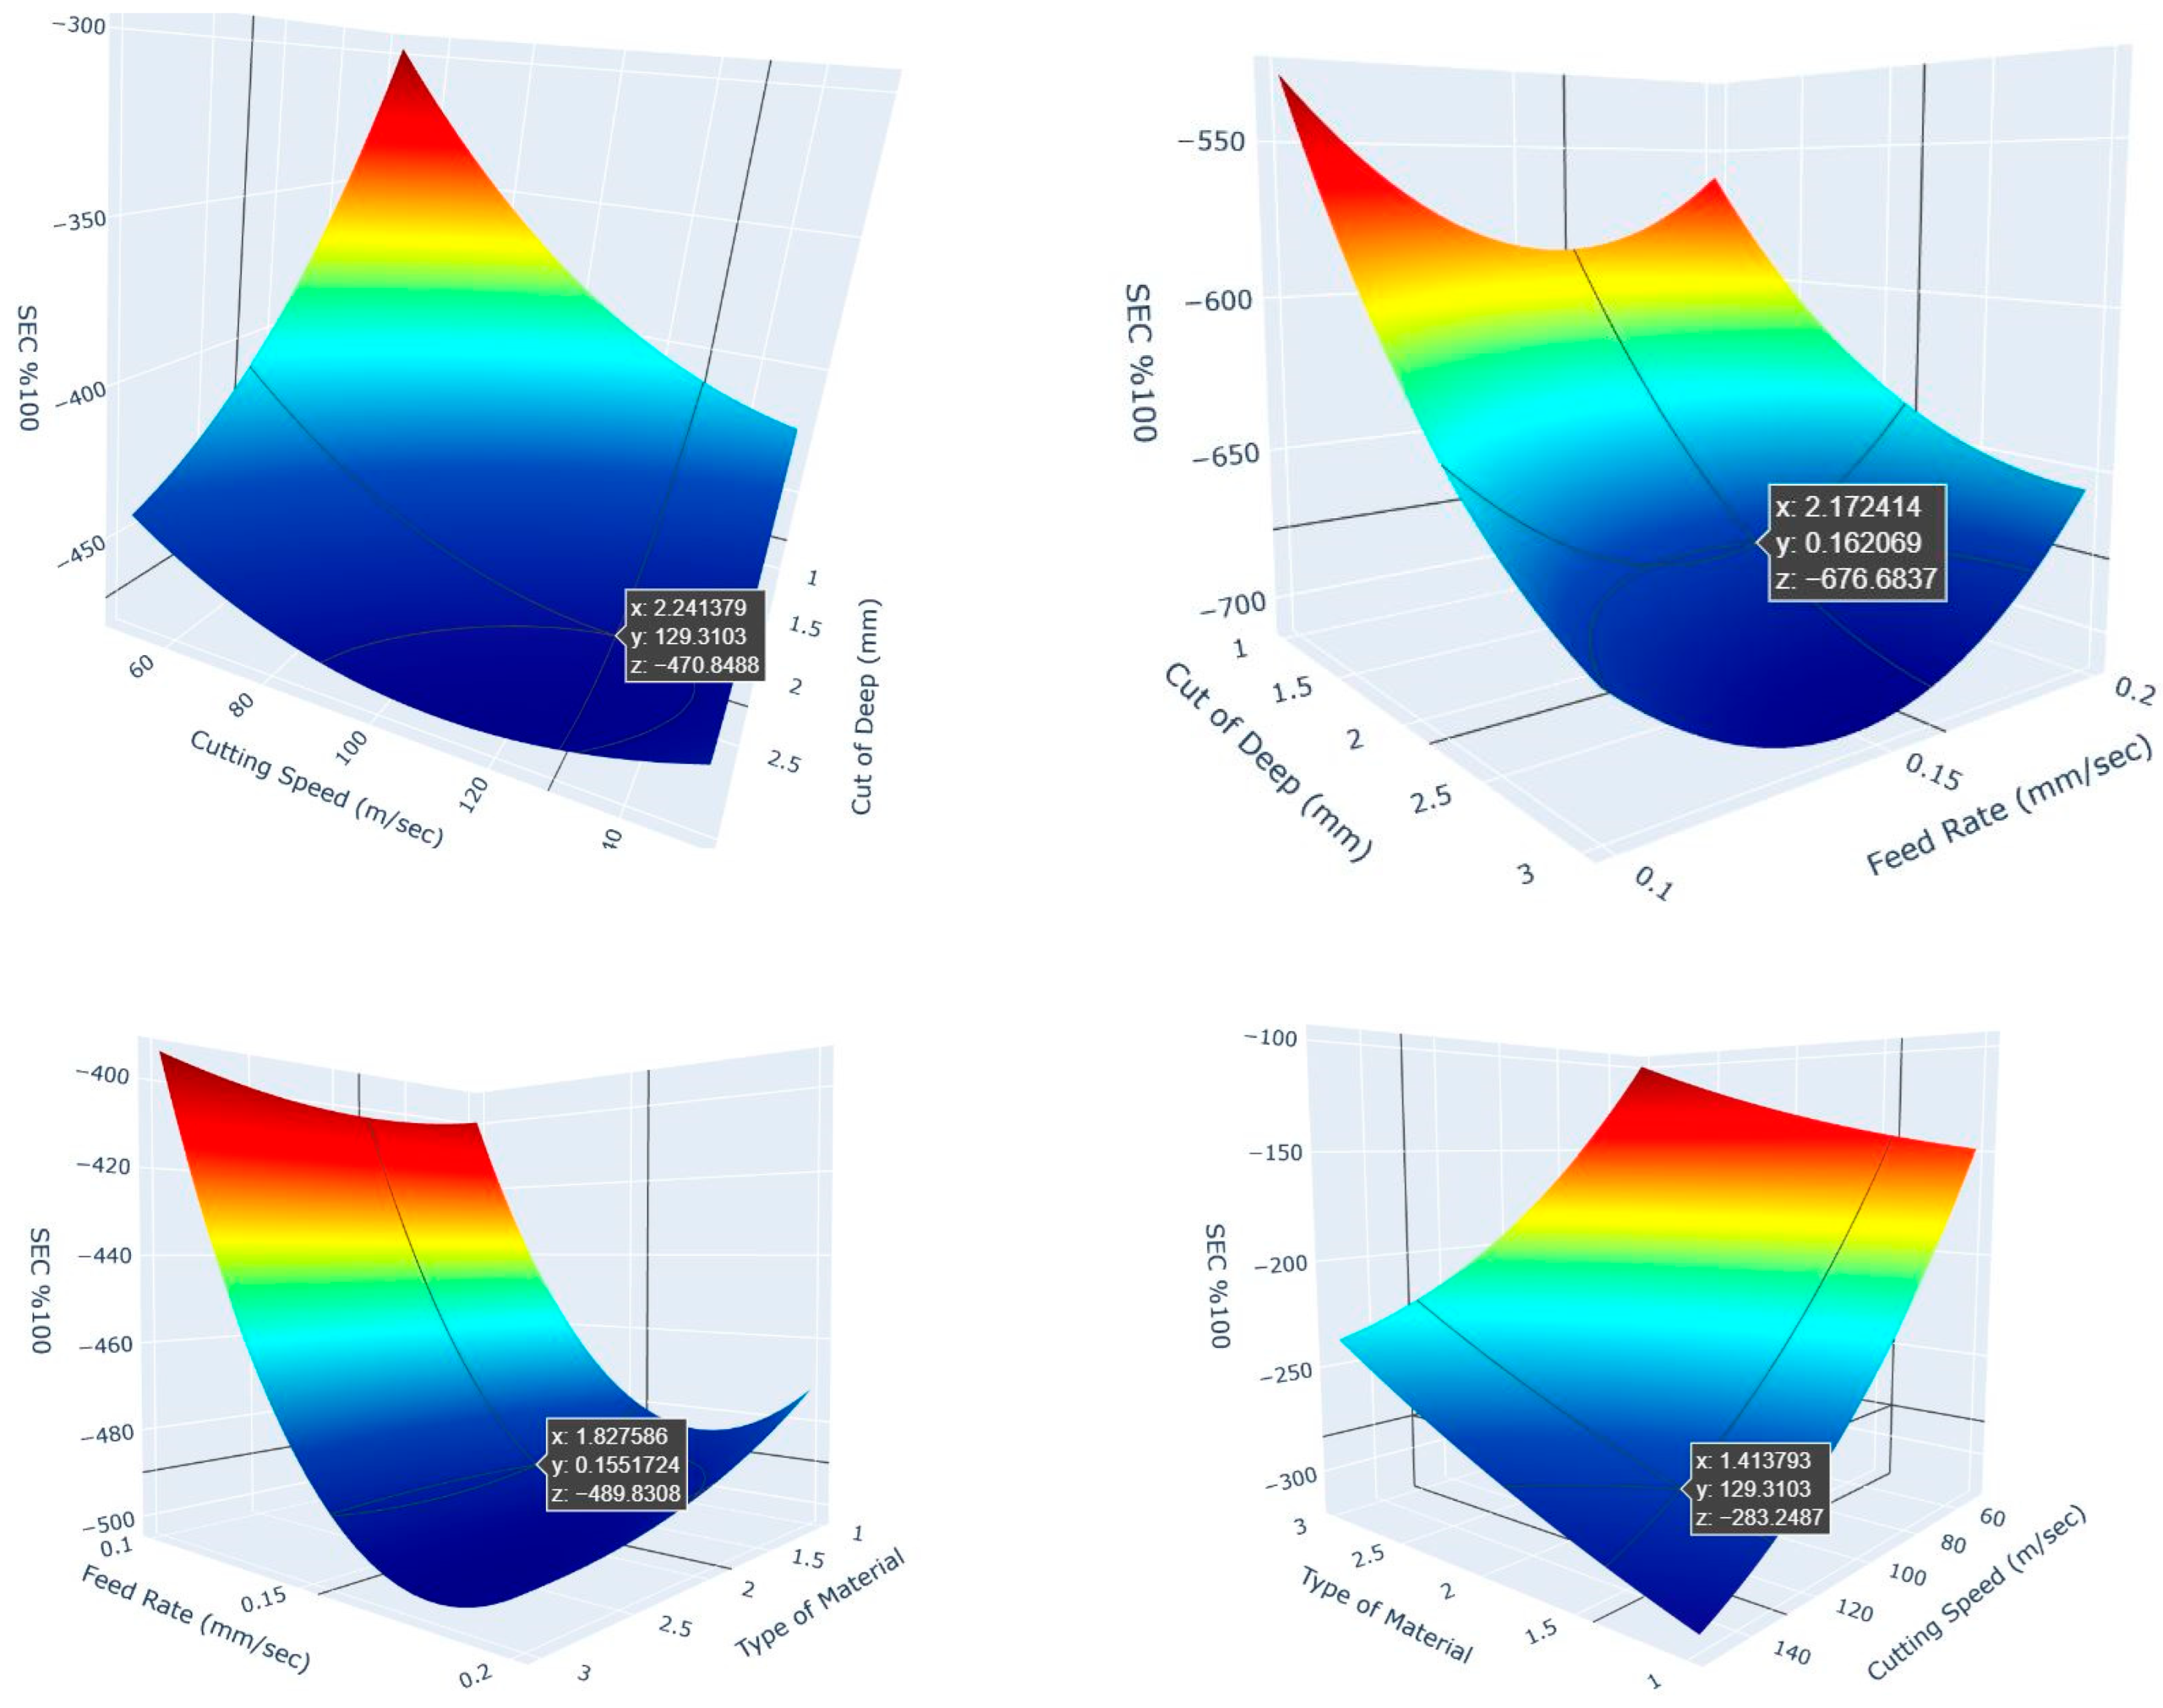
Figure 8 presents a 3D surface graph from the RSM analysis, illustrating the impact trends of cutting parameters on SEC and SCEC results. In this graph, which examines the effects of cutting depth and cutting speed on SEC (100%), it is observed that increasing the cutting depth significantly reduces energy consumption. This effect is particularly pronounced at lower cutting speeds, where the decrease follows a steeper trend. The primary reason behind this phenomenon is that deeper cuts shorten the machining time, thereby optimizing energy consumption. Similarly, increasing the cutting speed also leads to energy savings, but after a certain threshold, the reduction in energy consumption stabilizes. Hence, excessively high cutting speeds should be avoided.
Based on these findings, the optimal cutting depth should be between 2.5 and 3 mm, while the cutting speed should be maintained within the range of 100–120 m/s. These parameters help minimize energy consumption while enhancing machining efficiency. To prevent unnecessary energy expenditure, balanced speed levels should be preferred.
In the graph analyzing the effects of cutting depth and feed rate on SEC, a consistent decrease in energy consumption is observed as the cutting depth increases. Increasing the cutting depth from 1 mm to 3 mm optimizes energy consumption by shortening the machining time. However, the impact of feed rate exhibits a different trend; lower feed rates reduce SEC, while beyond 0.15 mm/s, energy consumption starts to rise again. This increase results from excessive feed rates compromising machining precision and leading to unnecessary energy usage.
The best results are achieved when the cutting depth is between 2.5–3 mm and the feed rate is within the range of 0.12–0.15 mm/s. Extremely low or high feed rates can increase energy consumption, thereby raising operational costs. Therefore, machining parameters must be carefully optimized. The graph depicting the influence of material type and feed rate on energy consumption reveals that material type has a strong impact on SEC. Type 1 material stands out with low energy consumption, whereas Type 3 material significantly increases SEC values. This disparity arises from differences in material hardness and machinability. Regarding feed rate, SEC values remain low within the 0.12–0.15 mm/s range; exceeding this range leads to an increase in energy consumption.
To maximize energy savings, Type 1 or Type 2 materials should be preferred. Additionally, maintaining the feed rate between 0.12 and 0.15 mm/s is crucial. Hard-to-machine materials and excessive feed rates can increase energy consumption, negatively impacting machining efficiency. Another graph examines the effects of material type and cutting speed on SEC. While an increase in cutting speed generally lowers SEC values, the extent of this reduction varies depending on the material type. Type 1 material responds rapidly to higher cutting speeds, significantly reducing energy consumption, whereas for Type 3 material, the reduction is more limited. This finding indicates that hard and difficult-to-machine materials require higher energy input.
Optimal machining conditions can be achieved by selecting Type 1 or Type 2 materials and maintaining the cutting speed between 100–130 m/s. Lower cutting speeds prolong machining time and increase energy consumption, making a balanced speed level essential. To optimize energy consumption and reduce operational costs, the following machining parameters should be maintained: Cutting depth: 2.5–3 mm, Cutting speed: 100–130 m/s, Feed rate: 0.12–0.15 mm/s. Material selection is also a key factor; Type 1 and Type 2 materials provide lower energy consumption, whereas Type 3 materials reduce energy efficiency. These analyses serve as a guideline for enhancing energy efficiency and improving productivity in manufacturing processes. Careful optimization of machining parameters can minimize environmental impact while offering economic benefits. Avoiding excessively low or high machining settings ensures a balanced and sustainable production approach.
Table 6 compares the final prediction evaluation metric scores of DT, AB, ET, and XGB algorithms for SEC%100 and SCEC%100 outputs. Based on the comparison of metrics scores, it is seen that DT and XGB algorithms outperform the other algorithms in terms of R2 scores of 0.98634 and 0.96533 for SEC%100 and SCEC%100, respectively. The hyperparameters of the DT model were tuned as min_samples_split: 6, min_samples_leaf: 3, criterion: absolute_error, max_features: 2, min_impurity_decrease: 0.05, ccp_alpha: 0.1, while XGB model was n_estimators:10, learning_rate: 0.1, reg_alpha: 1.0, reg_lambda: 1.0, gamma: 0.5, subsample: 0.6, colsample_bytree: 0.5. DT and XGB algorithms can be more capable of reducing the error rate between predicted and original values and have more robust prediction accuracy than the other algorithms since both algorithms produce the highest R2 score and the lowest, RMSE, MAE, and MSE scores.
When considering the R2 and MAE scores, it may be seen that the XGB algorithm, with an R2 score of 0.94779 and MAE score of 0.04785, and the ET algorithm, with an R2 score of 0.95684 and MAE score of 0.29238, ranked second best in prediction performance for SEC%100 and SCEC%100, respectively. In addition, the third-best prediction performances were achieved by the ET algorithm, with an R2 score of 0.87014 and MAE score of 0.05954, and the AB algorithm, with an R2 score of 0.95654 and MAE score of 0.29941, for SEC%100 and SCEC%100, respectively. On the other hand, the AB algorithm for SEC%100 and the DT algorithm for SCEC%100 showed the lowest prediction performance by producing R2 scores of 0.84361 and 0.95354, and MAE scores of 0.06644 and 0.13637, respectively.
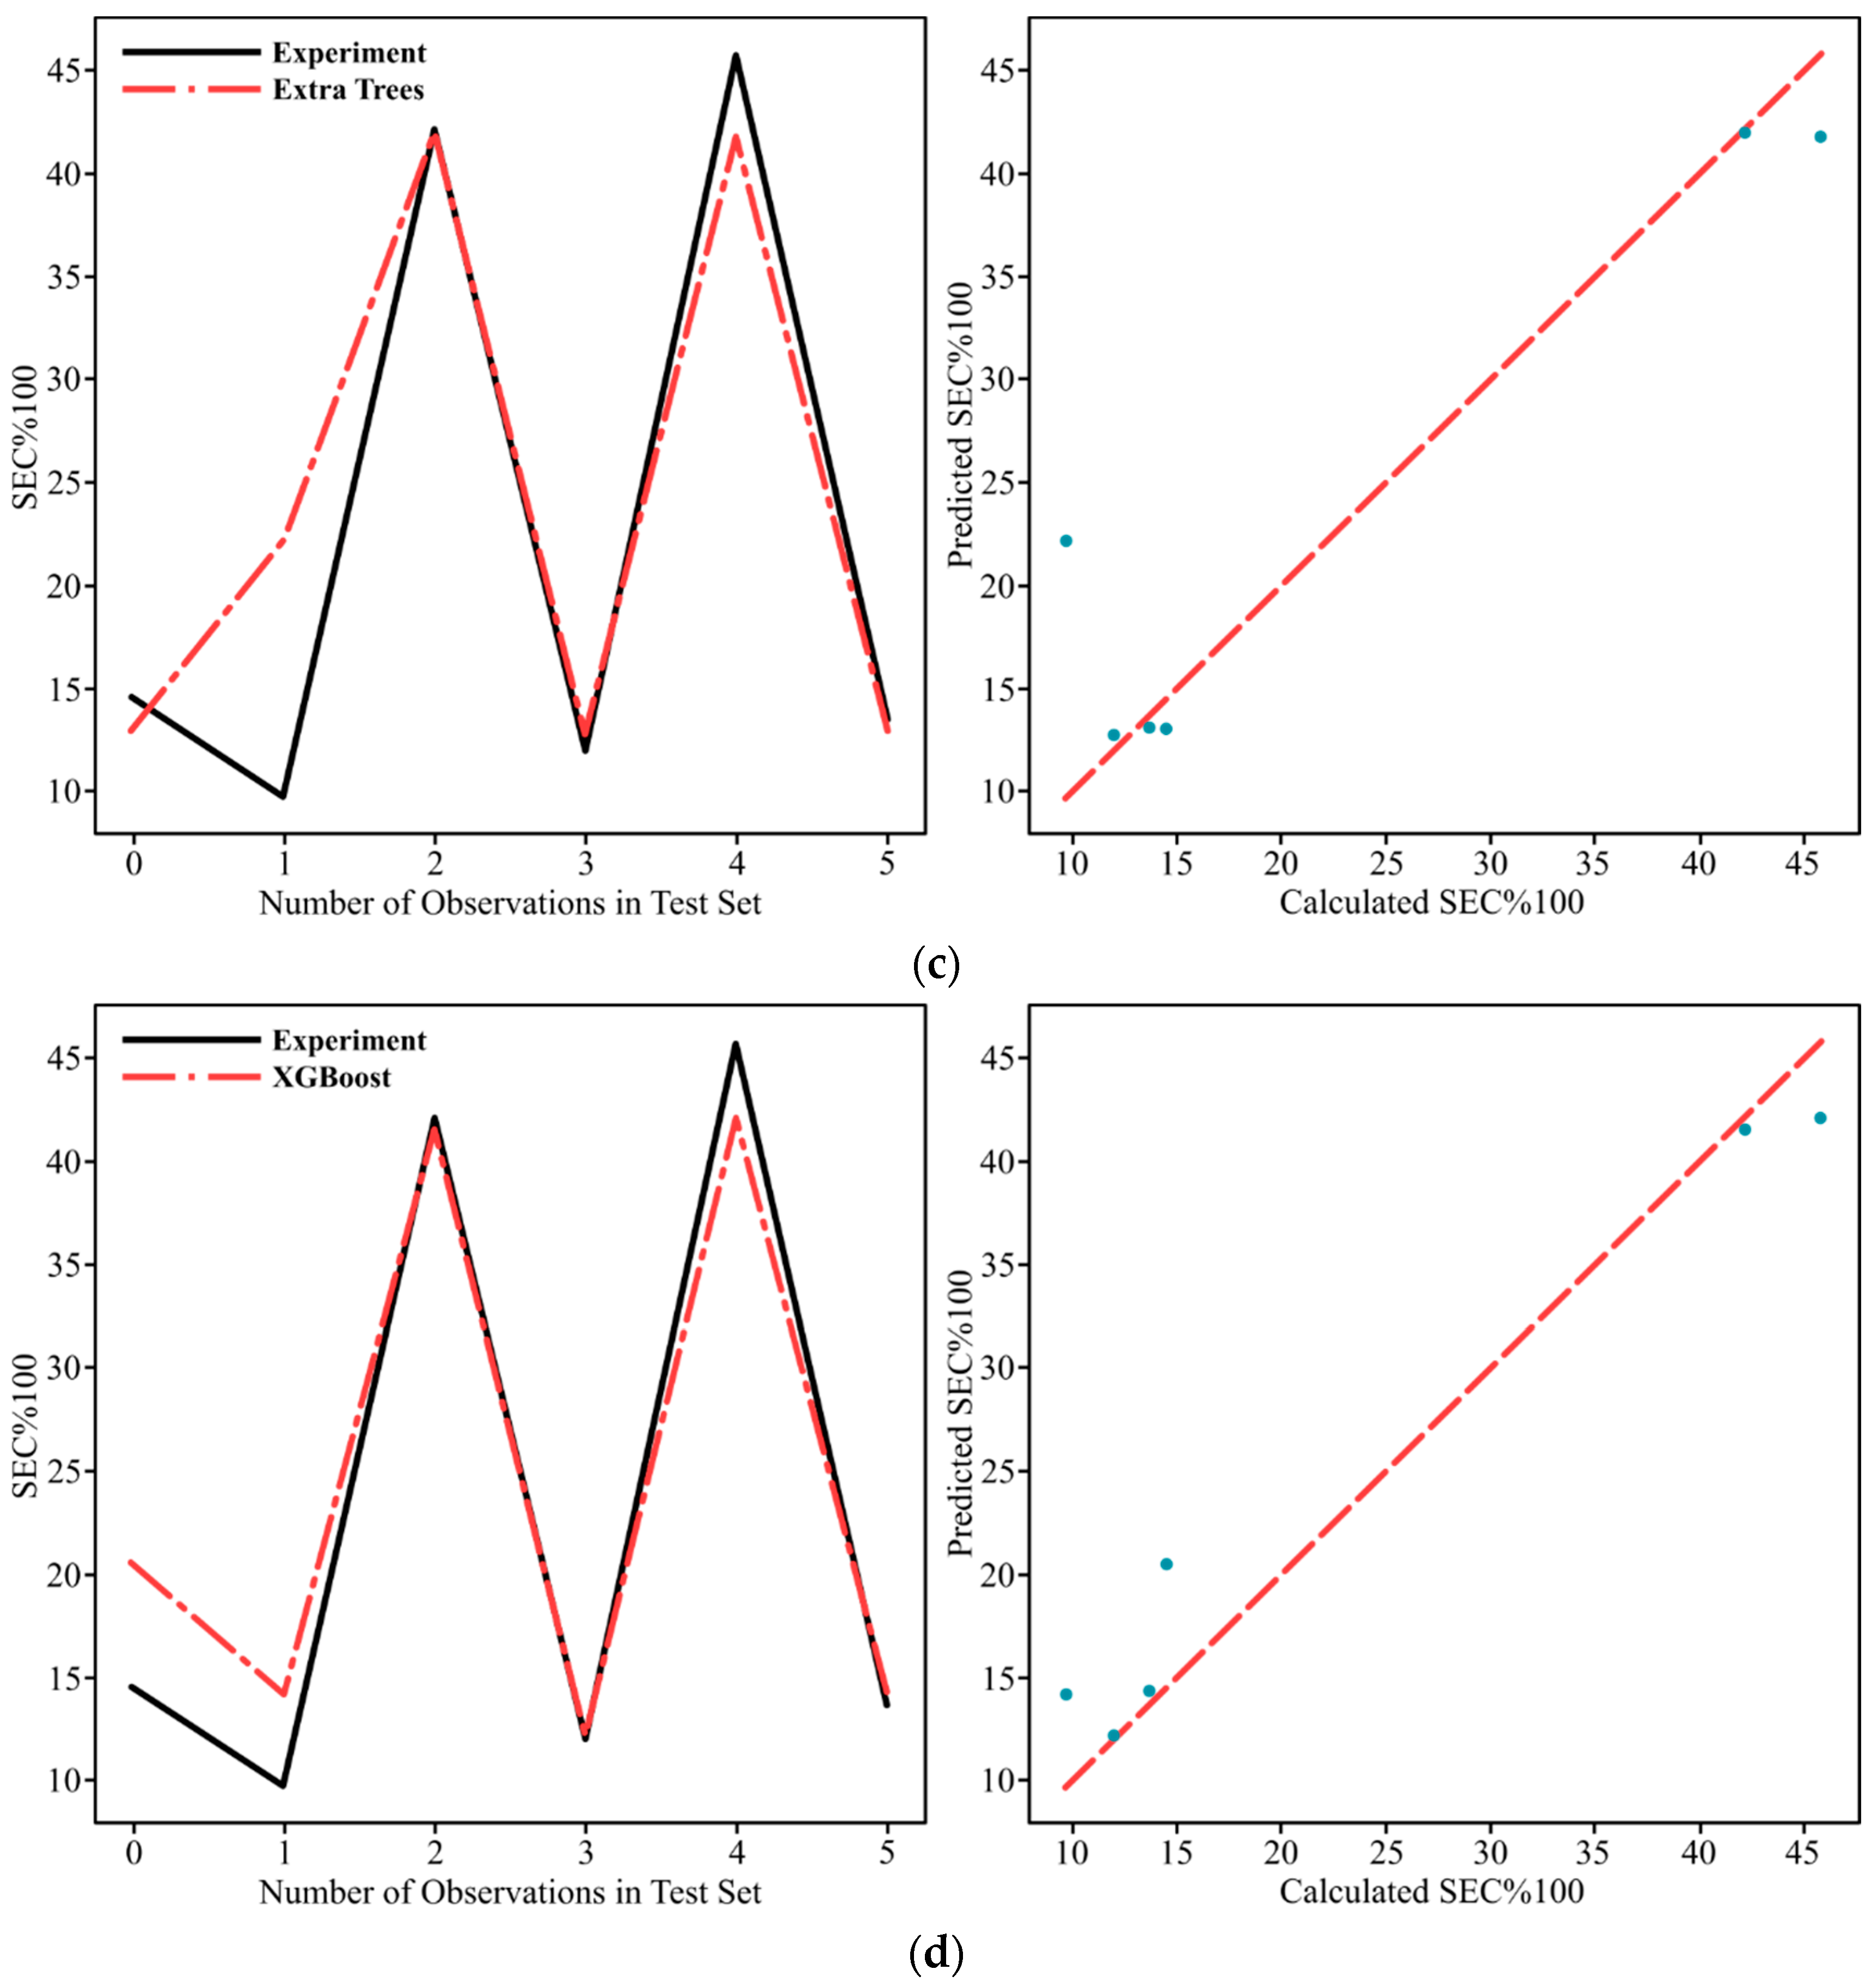
To evaluate the metric scores, particularly those of SEC%100, Figure 9 shows a comparison of the calculated and predicted SEC%100 using DT, AB, ET, and XGB algorithms. From Figure 9a, it is seen that the data points of the DT algorithm, with the highest R2 score of 0.98634, are ideally close to the regressed diagonal line and have fewer outliers that are still within an acceptable range around the line. This may be an indicator of the high accuracy and precise prediction capability of the DT algorithm for the present dataset. Balasuadhakar et al. [52] highlighted that DT’s high prediction performance is derived from a sophisticated recursive feature partitioning property, which facilitates sophisticated computational traversal through intricate decision-making architectures. This approach enables decomposition of complex decision paths, yielding an efficient search strategy for parsing multi-dimensional decision spaces. In addition, the XGB model performed similarly to the DT algorithm, with the R2 score difference between DT and XGB being 0.03855; however, the number of outliers of the XGB model was higher than that of the DT model, as seen in Figure 9d. In addition, as seen in Figure 9c, it is possible to mention that the ET algorithm did not fit the initial trend of the experimental curve because it had an outlier in the test set, which was far away from the regression line. Thus, this may have been caused by decreasing the R2 score below 0.90 for the prediction of SEC%100 output. As seen in Figure 9b, the AB algorithm has a high number of outliers that are not aligned with the regression lines, and therefore, it exhibited the lowest prediction performance for the present study by producing the lowest R2 and the highest MAE scores.
In terms of the evaluation of the performance of ML models for SCEC%100, Figure 10 shows the comparison of calculated and predicted SCEC%100 using DT, AB, ET, and XGB algorithms. From Figure 10d, it was seen that the data points of the XGB algorithm, with the highest R2 score of 0.96533, were close to the regressed diagonal line and had fewer outliers than other algorithms. This may show the higher prediction capability of XGB than other algorithms in terms of data point alignment on the diagonal line. Although the highest prediction capability was achieved by the XGB algorithm, the R2 score differences between XGB and other algorithms were 0.01179, 0.00879, and 0.00849 for DT, AB, and ET, respectively. This can also be seen in the alignment of predicted data points on the regressed diagonal line, seen in Figure 10a–c. Thus, it is possible to point out that ET, AB, and DT gave similar prediction performance within the acceptable prediction level for SCEC%100 in the present study.
In the overall performance evaluation of the presented machine learning models, it is possible to mention that DT, AB, ET, and XGB models have good prediction performance for both SEC%100 and SCEC%100 due to employing ensemble learning techniques by operating tree-based structures like decision-making. In the literature, it has been pointed out that ensemble learning with a tree-based structure improves the prediction capability in regression and classification tasks by dealing with the non-linear relationship between linear features [58,59,60,61]. Ganesh et al. [62] proposed similar results, mentioning that the DT model is a valuable tool to search and capture trends and patterns by correlating the input variables and output variables. They predicted surface roughness value using the DT model by using input features as cooling conditions and cutting speeds, and they pointed out that DT has predictive capabilities that facilitate efficient resource management, enhancing the accuracy of parameter selection and optimizing resource utilization. In addition, Faroog et al. [63] reported that the DT model has highly accurate predictions of power consumption in minimum quantity lubrication and nanofluids-based minimum quantity lubrication conditions using cutting speed, feed rate, depth of cut, and flow rate as instances, with the R2 scores of 0.915 and 0.931, respectively. Additionally, Xie et al. [64] demonstrated that the prediction of machine tool energy consumption using the XGB model produced a mean accuracy of 96.9% with an error of less than 4% for each prediction process. Our findings exhibited good agreement with their results. DT and XGB algorithms present better prediction performance than other algorithms because they determine complex non-linear patterns and interactions between features and outputs, and are less sensitive to outliers and noisier in the dataset. On the other hand, although AB and ET al algorithms also utilize tree-based structure, it is possible to mention that giving more weight to non-classified instances in subsequent trees by the AB algorithm and operating more randomness in feature selection and threshold splitting by the ET al algorithm potentially lead to lower accuracy. Furthermore, the sensitivity of the outliers and the possibility of noise in training can impact the performance of those models in terms of having lower R2 scores than DT and XGB algorithms, which establish explicit decision criteria and rules depending on feature thresholds [65].
In terms of comparison of the DT and XGB model performances for predicting SEC%100 and SCEC%100, respectively, from Table 6, it is seen that the difference in R2 scores was 2.101% despite using the same instances in the prediction process. This differing performance of DT and XGB models for SEC%100 and SCEC%100 outputs is thought to be related to the structure and complexity of the output variables within the dataset. Our analysis revealed that the SEC%100 values, which varied from 7.79 to 172.02, demonstrated relatively smooth, largely monotonic trends and dominant patterns that were highly correlated with the machining parameters and created more distinct discrete groups. For instance, the highest SEC%100 value of 172.02 consistently occurred at the lowest cutting speed and feed rate of 50 m/min and 0.100 mm/min, respectively, regardless of the material type. In contrast, SCEC%100 values, which ranged between 0.10 and 14.93, exhibited more complex and non-linear relationships with the same instances, and furthermore, the variations were more nuanced and appeared to result from interactions between cutting speed, feed rate, passes, and material type. Therefore, it is possible to mention that this R2 score difference occurred because the DT model with a single tree approximation lacked the ability to capture such non-linear relationships between instances, stronger material dependency, and localized variations of SCEC%100. Additionally, the regularized ensemble nature of the XGB model leads to analyzing fine-grained and non-linear relations between instances by means of combining multiple trees with shrinkage and feature subsampling, which enhances the bias-variance trade-off on SCEC%100.
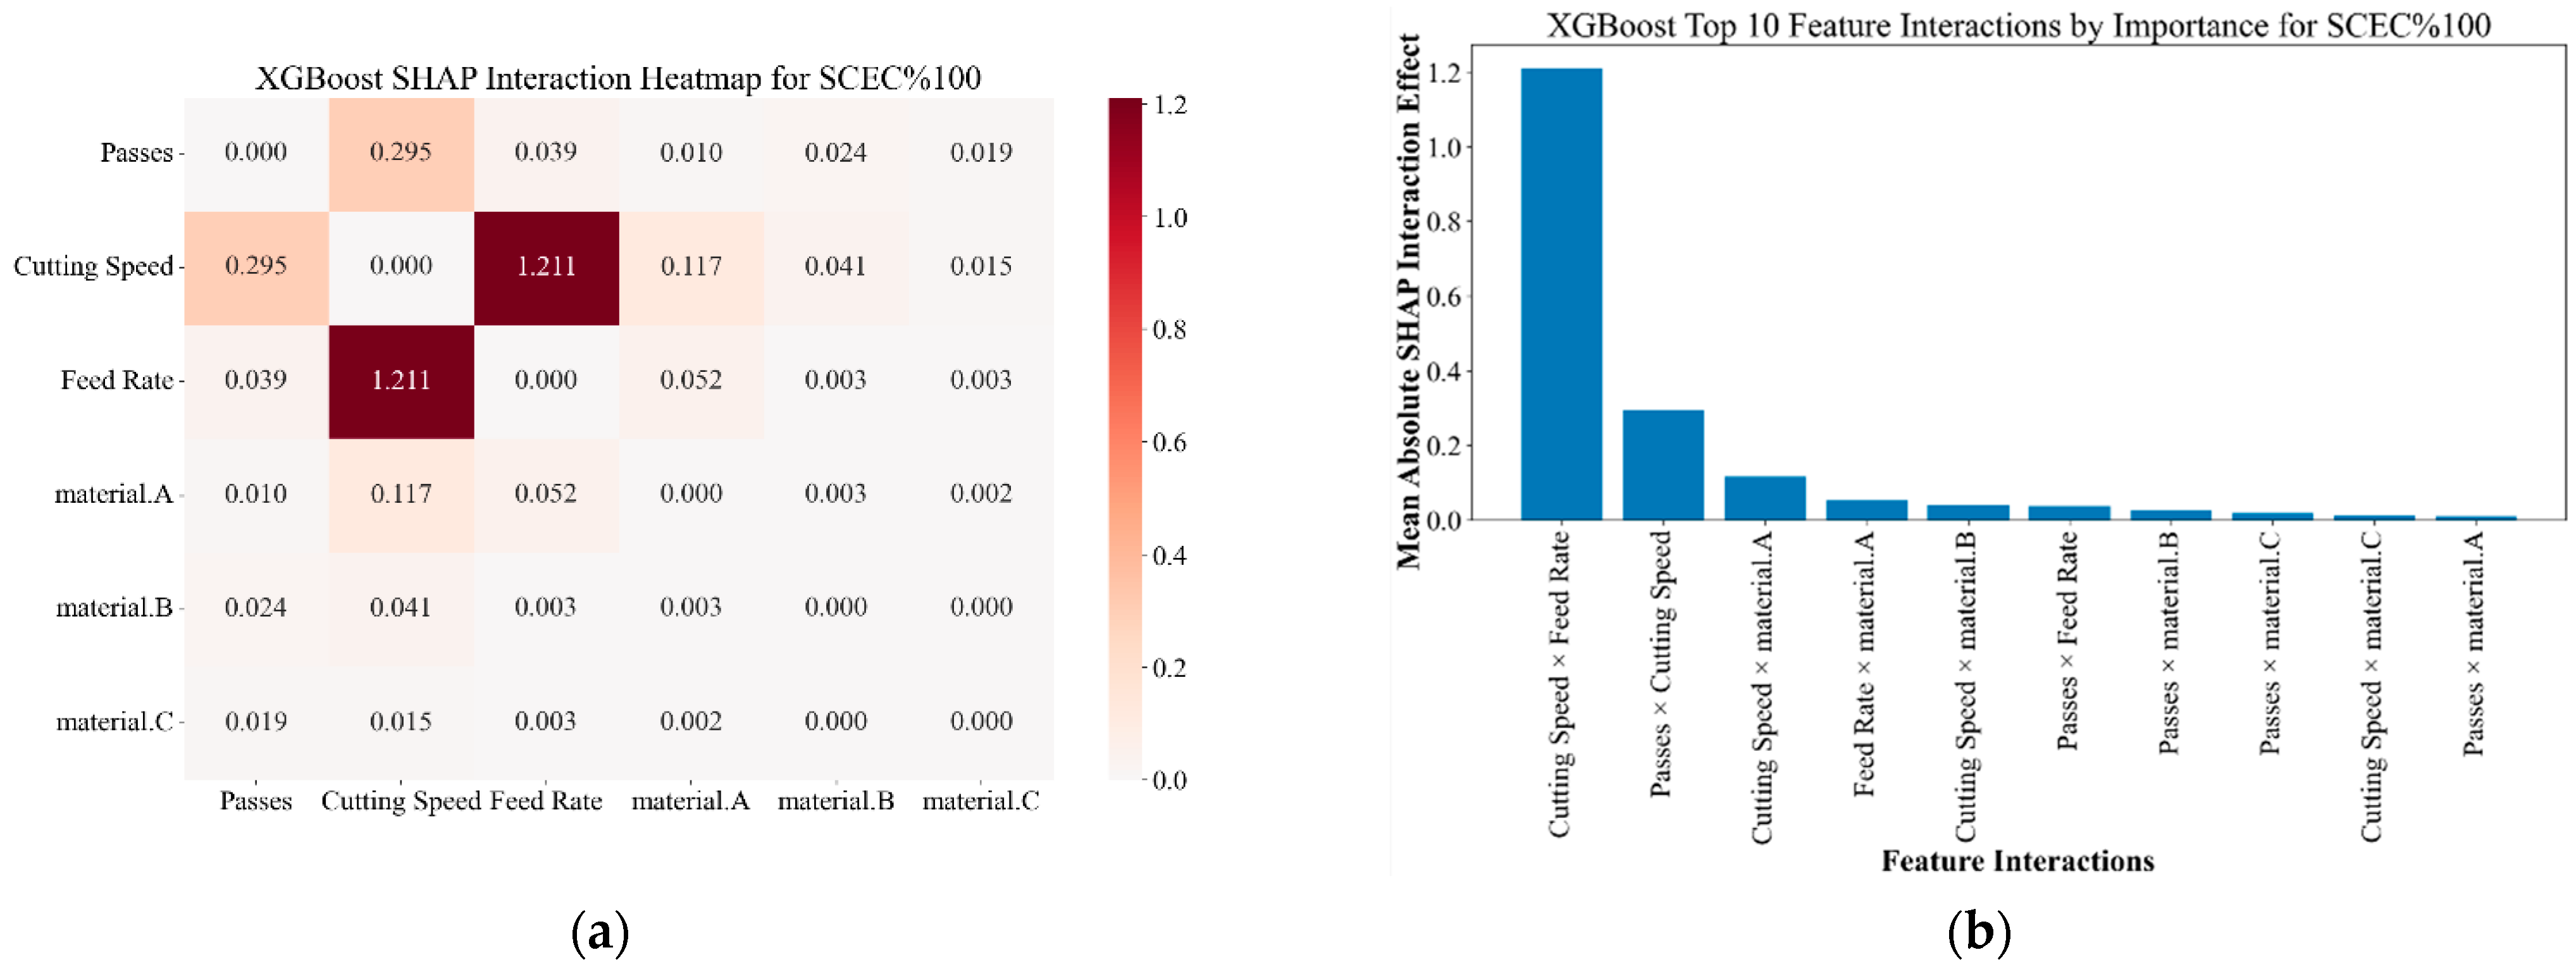
Shapley Additive Explanations (SHAP) is a powerful method used to assess feature importance in machine learning models in terms of providing both local and global explanations. Figure 11 and Figure 12 illustrate absolute mean SHAP values and global interpretation impacts of features on model output of DT and XGB models for SEC%100 and SCEC%100 prediction performances, respectively. The figures introduce the significance of individual features’ contribution to the final predictive modeling by giving the SHAP numerical output. In Figure 11a and Figure 12a, the features are placed on the vertical axes on the left side of the diagram, while the horizontal axes demonstrate the mean absolute SHAP values by representing the level of contribution as numerical output during the training process. In Figure 11b and Figure 12b, the horizontal axes reflect the impacts of the features in terms of negative or positive contributions. Feature values on the global interpretations are represented by red and blue colors, with greater values indicated by red and lower values signified by blue.
Regarding the prediction of SEC%100 using the DT model, from Figure 11a, it is seen that the most significant contributor to the DT model prediction is the “Cutting Speed” feature, with the mean absolute SHAP value of +24.3. This reflects the critical role of the cutting speed feature in the determination of the performance outcomes in the machining process. Additionally, the “Passes” feature demonstrates a remarkable mean SHAP value of +18.24, showing the second most contributing feature to the DT performance. Likewise, the “Feed Rate” feature of +8.84 presents a meaningful contribution to the predictive output. In contrast, material.A, material.B, and material.C features, material types labeled as categorical features, produce considerably lower absolute mean SHAP values of +4.7, +0.09, and +0.01, respectively. These lower values demonstrate their minimal contribution to the prediction accuracy of the DT model for SEC%100 output.
Figure 11b presents the global interpretation of features for SEC%100 prediction with the DT model. The red and blue colors in the figure represent higher and lower feature values, respectively. It is seen that the “Cutting Speed” feature has higher feature values than other features, and this is another indicator that it is the most contributing feature to the DT model prediction for SEC%100. In addition, it is shown that the “Cutting Speed”, “Passes”, and “Feed Rate” features have higher feature values, with the negative impacts on the model output demonstrating that those features are inversely correlated with the SEC%100 output. Thus, it may be suggested that a decrease in the values of the “Cutting Speed”, “Passes”, and “Feed Rate” features leads to an increase in the SEC%100 prediction, or vice versa. In contrast, the number of lower feature values of the material A feature is greater than the number of higher values, and, therefore, it can be said that it has a lower impact on the final prediction performance of the DT model for SEC%100.
Considering the feature importance of the XGB model for the prediction of SCEC%100, Figure 12a,b illustrate the absolute mean SHAP values and the impact of the features on the model’s prediction performance, respectively. As seen in Figure 12a, the “Cutting Speed” feature is the predominant contributor to the model predictions, with the absolute mean SHAP value of +4.71. Similar to the DT model, this shows the importance of the “Cutting Speed” feature on the prediction performance and accuracy of the XGBoost model. In addition, the “Feed Rate” feature comes in second place with the absolute mean SHAP value of +1.82, and the “Passes” feature follows with the SHAP value of +0.81 by illustrating the measurable impact on the predicted outputs by the XGB model. Conversely, material.A, material.B, and material.C features exhibit significantly lower absolute mean SHAP values of +0.14, +0.04, and +0.04, respectively. This indicates that although material type and quality are relevant to the machining process, their impact on the prediction of SCEC%100 with the XGB model is far less important compared to machining parameters.
The global interpretation of features for SCEC%100 prediction with the XGB model is given in Figure 12b by representing higher and lower feature values as red and blue colors, respectively. Prominently, it is seen that the “Cutting Speed” feature has significantly higher feature values than other features, indicating that it stands out as the most contributing feature to the XGB model for SCEC%100 prediction. In addition, higher SHAP values concentrated on the positive side of the horizontal axis indicate a positive correlation between the “Cutting Speed” feature and the SCEC%100 output. Afterwards, it is seen that the number of higher feature values of the “Feed Rate” and “Passes” features is greater than the number of lower feature values, thus demonstrating the high impact of those features on the SCEC%100 prediction with the XGB model, although the majority of higher feature values of the “Feed Rate” feature lie on the negative side of the horizontal axis. In contrast, feature values of material A, material B, and material C are predominantly located near the vertical reference axis with lower or negligible SHAP scores; therefore, it can be said that those features exhibit comparatively minor impacts on the XGB model for SCEC%100 prediction. In the overall evaluation of feature importance analysis for SEC%100 and SCEC%100 predictions with DT and XGB models, it can be said that the machining operational parameters, such as “Cutting Speed”, “Feed Rate”, and “Passes”, have a higher impact on the prediction accuracy and performance of the final predictive model than the material type feature.
In addition to absolute mean SHAP values and global interpretation impacts of features on model output of DT and XGB models for SEC%100 and SCEC%100 prediction performances, the feature interactions analysis was performed. Figure 13 illustrates the SHAP feature interactions of the DT model for SEC%100 prediction in terms of a heatmap diagram and the top 10 feature interactions by importance. The scale bar on the right of Figure 13a indicates the magnitude of feature interaction values from the lower to the top interaction values.
From Figure 13, the strongest interaction was seen between passes and cutting speed features by the SHAP value of 13.542, presenting a robust synergistic feature interaction between these two machining operational parameters. This high feature interaction value demonstrates that the combined effect of passes and cutting speed on the prediction of SEC%100 using the DT model exceeds the individual contributions of those features. The interaction of cutting speed and feed rate features by the value of 4.204 represents the second most significant interaction, reflecting the established correlation and importance of machining operational parameters on the prediction of SEC%100 using the DT model. Additionally, in terms of the material property effect on the prediction of SEC%100, it is seen that the interactions of cutting speed-material.A and passes-material.A pair exhibited moderate feature interaction values of 2.824 and 2.723, respectively, while material.B and material.C features showed weak interactions. These values indicate the unique behavioral responses of material type A to machining operational parameters when compared to material types B and C. In addition, in terms of the evaluation of Fe content of 0.59% and Cu content of 0.59% for material type A, it can be deduced that this increased response to the machining operational parameters may be linked to the pure composition and low alloying properties, causing the more predictable and strong reactions to fluctuations in cutting speed and the number of passes. Regarding the composition of material types A, B, and C, it can be stated that feature interaction analysis of the DT model for SEC%100 prediction indicates an inverse relationship between interaction strength and alloying content, showing that higher iron concentration influences material response to machining parameters, likely due to improved work hardening and complex metallurgical interactions during cutting processes. The DT model primarily predicts the SEC%100 values through the passes–cutting speed relationship, with feed rate playing a second dominant interactive role. Then, the material composition significantly influences model behavior, with low-alloying materials exhibiting more predictable responses for SEC%100 compared to high-alloying materials because of microstructural differences. Furthermore, the symmetric nature of these feature interactions confirms the bidirectional interdependence between these parameters.
When considering the feature interaction analysis of the XGB model for SCEC%100 prediction, the SHAP feature interactions in a heatmap diagram and the top 10 feature interactions by importance are given in Figure 14. The scale bar on the right of Figure 14a indicates the magnitude of feature interaction values from the lower to the top interaction values.
In Figure 14, the most dominant feature interaction was seen between cutting speed and feed rate features, with the value of 1.211, while the cutting speed and passes feature interaction ranked in second place, with the value of 0.295. This highest interaction value exemplifies the conventional machining operational relationship in which cutting speed and feed rate collectively influence the material removal rate and chip formation as well. Likewise, the highest feature interaction of cutting speed and feed rate demonstrates that the combined effect of the feature interactions on the prediction of SCEC%100 using the XGB model overlaps the individual contributions of those features. The second-highest feature interaction value of 0.295 between cutting speed and passes also indicates the importance of the machining operational parameters in predicting SCEC%100 with the XGB model. Moreover, in terms of the material property effect on the prediction of SCEC%100, it is seen that moderate feature interaction values of 0.117 and 0.052 occur between cutting speed–material.A and feed rate–material.A feature pairs, respectively, while weak interactions occur between passes–material.B and passes–material.C feature pairs with values of 0.024 and 0.019, respectively. These moderate interaction values of material.A reflect the unique behavioral responses of material type A to machining operational parameters in contrast to material types B and C. Furthermore, considering the Fe content of 0.59% and the Cu content of 0.59% in material type A, the DT model exhibits comparable outcomes. The enhanced sensitivity to machining parameters may be attributed to the material’s relatively pure composition and low alloying degree, which promote more consistent and robust responses to variations in cutting speed and the number of passes. In terms of evaluation of the composition of material types A, B, and C, it can be remarked that feature interaction analysis of the XGB model for SCEC%100 prediction indicates an inverse relationship between interaction strength and alloying content similar to DT model performance by showing that a higher iron concentration influences the material response to machining parameters, likely due to improved work hardening and complex metallurgical interactions during cutting processes. In contrast to the DT model, the XGB model initially predicts the SCEC%100 values by taking into account the cutting speed–feed rate relationship, with passes playing a second dominant interactive role. Afterwards, the material composition significantly influences model behavior, with low-alloying materials showing more predictable responses for SCEC%100 compared to high-alloying materials due to microstructural differences. Moreover, the symmetric nature of these feature interactions validates the bidirectional interdependence between these parameters.
When evaluating the DT model and the XGB model in terms of feature interaction analysis, it can be seen that the most notable difference between the DT model and the XGB model lies in the magnitude scales of interaction values. The DT model displays significant interaction values, with the passes-cutting speed interaction increasing up to 13.542, whereas the XGB model demonstrates more moderate interaction values with a maximum value of 1.211. This difference signifies a reduction in interaction strength of approximately 90%. The ensemble nature of the XGB model may be the reason for this strength reduction, as it distributes predictive power across multiple trees and reduces dependence on extreme feature combinations. Preventing extreme dependencies with the regularization capability of the XGB model and capturing more nuanced relationships with multiple weak learners could be classified as additional indicators. In terms of material composition effects, the DT and the XGB models exhibit consistent tendencies regarding the influence of material composition. Low-alloyed material composition (0.59% Fe and 0.59% Cu) shows the highest interaction values in the DT model and the XGB model. In contrast, higher Fe content correlates with reduced parameter sensitivity through both models. Additionally, the XGB model exhibits a 95% reduction in material feature interaction values compared to the DT model.

4. Conclusions

In this study, the machinability and energy consumption behavior of 8000 series Al–Fe–Cu alloys were systematically examined through experimental testing, microstructural characterization, and machine learning-based optimization. The investigation emphasized the influence of varying Fe and Cu contents on mechanical performance, energy efficiency, and material response under different machining conditions. By employing Specific Energy Consumption (SEC) theory in combination with Machine Learning (ML) algorithms and Response Surface Methodology (RSM), the study identified optimal machining parameters and clarified the role of key process variables on overall performance. Accordingly, the following key findings were derived:
  • The alloy containing 2.5% Fe and 2.64% Cu exhibited the most stable mechanical properties, with yield strength of 92 MPa, tensile strength of 126 MPa, and hardness of 110 HV.
  • The alloy containing 5% Fe achieved yield strength of 172 MPa, tensile strength of 187 MPa, and hardness of 88 HV, but ductility decreased to 35.9% and fracture energy decreased to 34 J.
  • In terms of energy efficiency, the 2.5% Fe-2.64% Cu alloy yielded the lowest SEC and SCEC values; optimal cutting parameters were determined as 2.5–3 mm depth of cut, cutting speed of 100–130 m/min, and feed rate of 0.12–0.15 mm/rev.
  • In the ML models, the Decision Tree algorithm achieved the highest accuracy for the SEC 100% prediction, with R2 = 0.98634, MAE = 0.02209, and MSE = 0.00104.
  • The XGBoost algorithm performed best for the SCEC 100% prediction, with R2 = 0.96533, MAE = 0.25578, and MSE = 0.10178.
  • SHAP analysis revealed that the cutting speed was the most decisive parameter contributing to model performance, with absolute SHAP values of +24.3 (DT) and +4.71 (XGB).
This study provides one of the first comprehensive assessments of Fe–Cu combinations in 8000 series aluminum alloys, highlighting their effects on machinability and energy efficiency and offering practical optimization strategies for industrial applications.

Author Contributions

Conceptualization, B.Ö., Ö.K., M.A., and F.K.; methodology, B.Ö., Ö.K., and F.K.; software, B.Ö., M.A., and F.K.; validation, B.Ö., Ö.K., M.A., and F.K.; investigation, B.Ö., Ö.K., M.A., and F.K.; resources, B.Ö., M.A., and F.K.; data curation, B.Ö., Ö.K., M.A., and F.K.; writing—original draft preparation, B.Ö., M.A., and F.K.; writing—review and editing, B.Ö., Ö.K., M.A., and F.K.; visualization, B.Ö., M.A., and F.K.; supervision, B.Ö., Ö.K., and F.K. All authors have read and agreed to the published version of the manuscript.

Funding

This research received no external funding.

Data Availability Statement

The original contributions presented in this study are included in the article; further inquiries can be directed to the corresponding authors.

Conflicts of Interest

The authors declare no conflicts of interest.

Nomenclature

Nomenclature
ABAda boostMSEMean squared error
AIMFCAir induction melting with flux coverORNLOak ridge national laboratory
AlAluminumPAATPower at approach time
ANNArtificial neural networksPMEDMPowder-mixed electric discharge machining
BUEBuilt-up edgeP cuttingCutting process
CNCComputer numerical controlP totalTotal power consumption
CuCopperR2Coefficient of determination
DOEDesign of experimentRMSERoot mean squared error
DTDecision treeRSMResponse surface methodology
EDXEnergy dispersive X-ray analysisSCECSpecific cutting energy consumption
EDMElectrical discharge machiningSECSpecific energy consumption
ETExtra treesSEMScanning electron microscopy
FeIronSHAPShapley additive explanations
HPTHigh-pressure torsionSLMSelective laser melting
LBMLaser beam machiningVIMVacuum induction melting
LPBFLaser powder bed fusionWEDMWire electrical discharge machining
MAEMean absolute errorXCBXG Boost
MLMachine learning

References

  1. Moustafa, E.B.; Natto, H.D.; Banoqitah, E.M.; Alazwari, M.A.; Mosleh, A.O.; Khalil, A.M. Improving the mechanical and dynamic properties of Al-Zn-Mg-Cu-based aluminum alloy: A combined approach of microstructural modification and heat treatment. J. Alloy. Compd. 2025, 1013, 178558. [Google Scholar] [CrossRef]
  2. Tanaka, T.; Akasawa, T. Machinability of hypereutectic silicon-aluminum alloys. J. Mater. Eng. Perform. 1999, 8, 463–468. [Google Scholar] [CrossRef]
  3. Zamanzade, M.; Barnoush, A.; Motz, C. A review on the properties of iron aluminide intermetallics. Crystals 2016, 6, 10. [Google Scholar] [CrossRef]
  4. Vilardell, A.M.; Cinca, N.; Tarrés, E.; Kobashi, M. Iron aluminides as an alternative binder for cemented carbides: A review and perspective towards additive manufacturing, Mater. Today Commun. 2022, 31, 103335. [Google Scholar] [CrossRef]
  5. Yan, Z.; Shi, Z.; Xie, J.; Teng, Y. Effect of rotating magnetic field (RMF) on the microstructure and mechanical properties of Al–2% Fe eutectic alloy. Mater. Sci. Eng. A 2022, 856, 143985. [Google Scholar] [CrossRef]
  6. Wang, X.; Guan, R.; Wang, Y.; Misra, R.; Yang, B.; Li, Y.; Chen, T. Mechanistic understanding on the evolution of nanosized Al3Fe phase in Al–Fe alloy during heat treatment and its effect on mechanical properties. Mater. Sci. Eng. A 2019, 751, 23–34. [Google Scholar] [CrossRef]
  7. He, H.; Zou, J.; Zhang, H.-T.; Hu, D.-C.; Feng, Z.-J.; Li, Y.-F.; Li, Z.-H.; Li, H.-C. Effect of Mn and Mo on microstructure and mechanical properties of Al-Si-Cu-Mg-0.6Fe alloy. China Foundry 2023, 20, 511–518. [Google Scholar] [CrossRef]
  8. Basak, C.B.; Babu, N.H. Influence of Cu on modifying the beta phase and enhancing the mechanical properties of recycled Al-Si-Fe cast alloys. Sci. Rep. 2017, 7, 5779. [Google Scholar] [CrossRef]
  9. Rana, R.S.; Purohit, R.; Das, S. Reviews on the influences of alloying elements on the microstructure and mechanical properties of aluminum alloys and aluminum alloy composites. Int. J. Sci. Res. Publ. 2012, 2, 1–7. [Google Scholar]
  10. Deevi, S.C.; Sikka, V.K. Nickel and iron aluminides: An overview on properties, processing, and applications. Intermetallics 1996, 4, 357–375. [Google Scholar] [CrossRef]
  11. Łyszkowski, R.; Bystrzycki, J. Hot deformation and processing maps of a Fe–Al intermetallic alloy. Mater. Charact. 2014, 96, 196–205. [Google Scholar] [CrossRef]
  12. Pathak, B.N.; Sahoo, K.L.; Mishra, M. Effect of machining parameters on cutting forces and surface roughness in Al-(1-2) Fe-1V-1Si alloys. Mater. Manuf. Process. 2013, 28, 463–469. [Google Scholar] [CrossRef]
  13. Santosh, S.; Bavin, S.; Srivatsan, T.S. Comparing surface characteristics of Cu-Al-Fe alloys using thermal-based machining processes. Surf. Eng. 2024, 40, 558–567. [Google Scholar] [CrossRef]
  14. Khaple, S.; Baligidad, R.G.; Sankar, M.; Satya Prasad, V.V. Effect of melting process and aluminium content on the microstructure and mechanical properties of Fe–Al alloys. ISIJ Int. 2010, 50, 1483–1487. [Google Scholar] [CrossRef]
  15. Qin, L.; Tang, P.; Meng, S. Effect of Ni addition on the microstructure conductivities mechanical properties of as-cast Al-Fe alloys. J. Alloys Compd. 2024, 986, 174160. [Google Scholar] [CrossRef]
  16. Singh, K.; Phogat, S.; Singh, R. Experimental analysis of surface roughness and machinability parameters of Al base alloys with material additives (Fe-Si). Int. J. Mater. Sci. 2017, 12, 57–65. [Google Scholar]
  17. Zhang, Y.; Luo, X.; Zhu, L.; Chen, Y.; Luo, Q.; Xu, J.; Lu, Q. Design of non-heat-treatable Al-Fe-Ni alloys with high electrical conductivity and high strength via CALPHAD approach. J. Alloys Compd. 2024, 1009, 176920. [Google Scholar] [CrossRef]
  18. Cubero-Sesin, J.M.; Arita, M.; Horita, Z. High strength and electrical conductivity of Al-Fe alloys produced by synergistic combination of high-pressure torsion and aging. Adv. Eng. Mater. 2015, 17, 1792–1803. [Google Scholar] [CrossRef]
  19. Chanakyan, C.; Alagarsamy, S.V.; Sivakandhan, C.; Senthamarai, K. Machinability studies on Al–Fe–Si alloy-based composites. In Advances in Processing of Lightweight Metal Alloys and Composites; Springer: Singapore, 2022; pp. 365–381. [Google Scholar] [CrossRef]
  20. Md Aliahsan, B.; Ahmed, M.; Md Abdur, R. Exploring the integration of informed machine learning in engineering applications: A comprehensive review. Am. J. Sci. Learn. Dev. 2024, 3, 11–21. [Google Scholar] [CrossRef]
  21. Ethiraj, N.; Sivabalan, T.; Sofia, J.; Harika, D.; Nikolova, M. A comprehensive review on application of machine intelligence in additive manufacturing. Turk. J. Eng. 2025, 9, 37–46. [Google Scholar] [CrossRef]
  22. Jhaveri Rutvij, H.; Revathi, A.; Ramana, K.; Raut, R.; Dhanaraj, R.K. A review on machine learning strategies for real-world engineering applications. Mob. Inf. Syst. 2022, 2022, 1833507. [Google Scholar] [CrossRef]
  23. Jin, B.; Xu, X. Palladium price predictions via machine learning. Mater. Circ. Econ. 2024, 6, 32. [Google Scholar] [CrossRef]
  24. Jin, B.; Xu, X. Carbon emission allowance price forecasting for China Guangdong carbon emission exchange via the neural network. Glob. Financ. Rev. 2024, 6, 3491. [Google Scholar] [CrossRef]
  25. Ge, H.; Bakir, A.H.; Yadav, S.; Kang, Y.; Parameswaran, S.; Zhao, P. CFD optimization of the pre-chamber geometry for a gasoline spark ignition engine. Front. Mech. Eng. 2020, 6, 599752. [Google Scholar] [CrossRef]
  26. Charu, V. Vibration response characteristics of engineering ship. Sch. Publ. Group Kinet. Mech. Eng. 2022, 3, 63–70. [Google Scholar] [CrossRef]
  27. Bari, V.; Gaikwad, M.S.; Babar, R. A review of machine learning and its applications. Int. J. Eng. Appl. Sci. Technol. 2021, 6, 190–193. [Google Scholar] [CrossRef]
  28. Maurya, P.K.; Sah, P.; Chauhan, N.; Howard, E. Smart circuit design machine learning-driven optimization for enhanced performance in electronics and computer engineering. J. Propuls. Technol. 2024, 45, 2794–2805. [Google Scholar] [CrossRef]
  29. Djeldjeli, Y.; Taouaf, L.; Alqahtani, S.; Mokaddem, A.; Alshammari, B.M.; Menni, Y.; Kolsi, L. Enhancing solar power forecasting with machine learning using principal component analysis and diverse statistical indicators. Case Stud. Therm. Eng. 2024, 61, 10492. [Google Scholar] [CrossRef]
  30. Jin, B.; Xu, X. Contemporaneous causality among price indices of ten major steel products. Ironmak. Steelmak. 2024, 51, 515–526. [Google Scholar] [CrossRef]
  31. Jin, B.; Xu, X. Contemporaneous causal orderings among prices of retail properties: Evidence from Chinese cities through vector error-correction modeling and directed acyclic graphs. J. Financ. Manag. Prop. Constr. 2025. ahead of print. [Google Scholar] [CrossRef]
  32. Jin, B.; Xu, X. Gaussian process regression based silver price forecasts. J. Uncertain Syst. 2024, 17, 2450013. [Google Scholar] [CrossRef]
  33. Jin, B.; Xu, X. Wholesale price forecasts of green grams using the neural network. Asian J. Econ. Bank. 2024. ahead of print. [Google Scholar] [CrossRef]
  34. Yari, M.; Armaghani, D.J.; Maraveas, C.; Ejlali, A.N.; Mohamad, E.T.; Asteris, P.G. Several tree-based solutions for predicting flyrock distance due to mine blasting. Appl. Sci. 2023, 13, 1345. [Google Scholar] [CrossRef]
  35. Deptuła, A.; Macek, W.; Partyka, M.A. Analysis of loading history influence on fatigue and fracture surface parameters using the method of induction trees. MATEC Web Conf. 2019, 252, 08003. [Google Scholar] [CrossRef]
  36. Belden, E.R.; Rando, M.; Ferrara, O.G.; Himebaugh, E.T.; Skangos, C.A.; Kazantzis, N.K.; Paffenroth, R.C.; Timko, M.T. Machine learning predictions of oil yields obtained by plastic pyrolysis and application to thermodynamic analysis. ACS Eng. Au 2023, 3, 91–101. [Google Scholar] [CrossRef]
  37. Yamamoto, F.; Ozawa, S.; Wang, L. eFL-Boost: Efficient federated learning for gradient boosting decision trees. IEEE Access 2022, 10, 43954–43963. [Google Scholar] [CrossRef]
  38. Ben Seghier, M.E.A.; Plevris, V. Application of machine learning approaches for modelling crack growth rates. ce/papers 2023, 6, 860–865. [Google Scholar] [CrossRef]
  39. Asteris, P.G.; Rizal, F.I.M.; Koopialipoor, M.; Roussis, P.C.; Ferentinou, M.; Armaghani, D.J.; Gordan, B. Slope stability classification under seismic conditions using several tree-based intelligent techniques. Appl. Sci. 2022, 12, 1753. [Google Scholar] [CrossRef]
  40. Taherdangkoo, R.; Nagel, T.; Chen, C.; Mollaali, M.; Ghasabeh, M.; Cuisinier, O.; Abdallah, A.; Butscher, C. Modeling unsaturated hydraulic conductivity of compacted bentonite using a constrained CatBoost with bootstrap analysis. Appl. Clay Sci. 2024, 260, 107530. [Google Scholar] [CrossRef]
  41. Lv, J.; Tang, R.; Jia, S.; Liu, Y. Experimental study on energy consumption of computer numerical control machine tools. J. Clean. Prod. 2016, 112, 3864–3874. [Google Scholar] [CrossRef]
  42. Moradnazhad, M.; Unver, H.O. Energy efficiency of machining operations: A review. Proc. Inst. Mech. Eng. Part B J. Eng. Manuf. 2017, 231, 1871–1889. [Google Scholar] [CrossRef]
  43. Lawrence, A.; Thollander, P.; Andrei, M.; Karlsson, M. Specific energy consumption/use (SEC) in energy management for improving energy efficiency in industry: Meaning, usage and differences. Energies 2019, 12, 247. [Google Scholar] [CrossRef]
  44. Curra-Sosa, D.-A.; Pérez-Rodríguez, R.; Del-Risco-Alfonso, R. Predictive model for specific energy consumption in the turning of AISI 316L steel. In Progress in Artificial Intelligence and Pattern Recognition; Heredia, Y.H., Núñez, V.M., Shulcloper, J.R., Eds.; Springer International Publishing: Berlin/Heidelberg, Germany, 2018; Volume 11047, pp. 51–58. [Google Scholar]
  45. Serin, G.; Gudelek, M.U.; Ozbayoglu, A.M.; Unver, H.O. Estimation of parameters for the free-form machining with deep neural network. In Proceedings of the 2017 IEEE International Conference on Big Data (Big Data), Boston, MA, USA, 11–14 December 2017; pp. 2102–2111. [Google Scholar] [CrossRef]
  46. Tan, D.; Suvarna, M.; Shee Tan, Y.; Li, J.; Wang, X. A three-step machine learning framework for energy profiling, activity state prediction and production estimation in smart process manufacturing. Appl. Energy 2021, 291, 116808. [Google Scholar] [CrossRef]
  47. Lima, R.C.C.; De Oliveira, L.A.V.; Da Silva, S.P.P.; De Alencar Santos, J.D.; Caetano, R.G.D.; Freitas, F.N.C.; De Oliveira, V.S.; De Freitas Bonifácio, A.; Filho, P.P.R. A new proposal for energy efficiency in industrial manufacturing systems based on machine learning techniques. J. Manuf. Syst. 2024, 77, 1062–1076. [Google Scholar] [CrossRef]
  48. Awan, M.R.; González Rojas, H.A.; Hameed, S.; Riaz, F.; Hamid, S.; Hussain, A. Machine learning-based prediction of specific energy consumption for cut-off grinding. Sensors 2022, 22, 7152. [Google Scholar] [CrossRef]
  49. Nayak, S.S.; Chang, H.J.; Kim, D.H.; Pabi, S.K.; Murty, B.S. Formation of metastable phases and nanocomposite structures in rapidly solidified Al–Fe alloys. Mater. Sci. Eng. A 2011, 528, 5967–5973. [Google Scholar] [CrossRef]
  50. Qi, X.; Takata, N.; Suzuki, A.; Kobashi, M.; Kato, M. Microstructure of Al-2.5Fe Binary Alloy Fabricated by Laser Powder Bed Fusion. In Materials Science Forum; Trans Tech Publications, Ltd.: Wollerau, Switzerland, 2021; Volume 1016, pp. 1175–1180. [Google Scholar] [CrossRef]
  51. Li, X.; Scherf, A.; Heilmaier, M.; Stein, F. The Al-rich part of the Fe-Al phase diagram. J. Phase Equilibria Diffus. 2016, 37, 162–173. [Google Scholar] [CrossRef]
  52. Balasuadhakar, A.; Thirumalai Kumaran, S.; Uthayakumar, M. Machine learning prediction of surface roughness in sustainable machining of AISI H11 tool steel. Smart Mater. Manuf. 2025, 3, 100075. [Google Scholar] [CrossRef]
  53. Jose, D.M.; Vincent, A.M.; Dwarakish, G.S. Improving multiple model ensemble predictions of daily precipitation and temperature through machine learning techniques. Sci. Rep. 2022, 12, 4678. [Google Scholar] [CrossRef]
  54. Chen, X.; Zhu, C.-C.; Yin, J. Ensemble of decision tree reveals potential miRNA-disease associations. PLoS Comput. Biol. 2019, 15, e1007209. [Google Scholar] [CrossRef]
  55. Sharafati, A.; Haji Seyed Asadollah, S.B.; Motta, D.; Yaseen, Z.M. Application of newly developed ensemble machine learning models for daily suspended sediment load prediction and related uncertainty analysis. Hydrol. Sci. J. 2020, 65, 2022–2042. [Google Scholar] [CrossRef]
  56. Öztürk, B.; Kara, F. Calculation and estimation of surface roughness and energy consumption in milling of 6061 alloy. Adv. Mater. Sci. Eng. 2020, 5687951. [Google Scholar] [CrossRef]
  57. Öztürk, B.; Uğur, L.; Yıldız, A. Investigation of effect on energy consumption of surface roughness in X-axis and spindle servo motors in slot milling operation. Measurement 2019, 139, 92–102. [Google Scholar] [CrossRef]
  58. Reffas, O.; Boumediri, H.; Karmi, Y.; Kahaleras, M.S.; Bousba, I.; Aissa, L. Statistical analysis and predictive modeling of cutting parameters in EN-GJL-250 cast iron turning: Application of machine learning and MOALO optimization. Int. J. Adv. Manuf. Technol. 2025, 137, 1991–2009. [Google Scholar] [CrossRef]
  59. Alajmi, M.S.; Almeshal, A.M. Predicting the Tool Wear of a Drilling Process Using Novel Machine Learning XGBoost-SDA. Materials 2020, 13, 4952. [Google Scholar] [CrossRef]
  60. Gadagi, A.; Sivaprakash, B.; Adake, C.; Deshannavar, U.; Hegde, P.G.; P, S.; Rajamohan, N.; Osman, A.I. Epoxy composite reinforced with jute/basalt hybrid—Characterisation and performance evaluation using machine learning techniques. Compos. Part C Open Access 2024, 14, 100453. [Google Scholar] [CrossRef]
  61. Schuh, G.; Scholz, P.; Schorr, S.; Harman, D.; Möller, M.; Heib, J.; Bähre, D. Prediction of workpiece quality: An application of machine learning in manufacturing industry. In Proceedings of the 6th International Conference on Computer Science, Engineering and Information Technology (CSEIT-2019), Zurich, Switzerland, 23–24 November 2019; pp. 189–202. [Google Scholar] [CrossRef]
  62. Ganesh, M.; Arunkumar, N.; Siva, N.; Lionus Leo, G.M. Experimental investigation on sustainable machining of monel using vegetable oils as cutting fluids and machine learning-based surface roughness prediction. Eng. Res. Express 2024, 6, 045505. [Google Scholar] [CrossRef]
  63. Farooq, M.U.; Kumar, R.; Khan, A.; Singh, J.; Anwar, S.; Verma, A.; Haber, R. Sustainable machining of Inconel 718 using minimum quantity lubrication: Artificial intelligence-based process modelling. Heliyon 2024, 10, e34836. [Google Scholar] [CrossRef]
  64. Xie, Y.; Dai, Y.; Zhang, C.; Liu, J. An integration model enabled deep learning for energy prediction of machine tools. J. Clean. Prod. 2025, 495, 145075. [Google Scholar] [CrossRef]
  65. Kalcheva, N.; Todorova, M.; Marinova, G. Naive Bayes Classifier, Decision Tree and Adaboost Ensemble Algorithm—Advantages and Disadvantages. In Proceedings of the 6th International Conference—ERAZ 2020—Knowledge Based Sustainable Development, Online, 21 May 2020. [Google Scholar] [CrossRef]
Figure 1. Geometry of the cutting tool.
Machines 13 00906 g001
Figure 2. The schematic workflow diagram of the ML process.
Machines 13 00906 g002
Figure 3. Microstructure changes: (a) 2nd Experiment, (b) 3rd Experiment.
Machines 13 00906 g003aMachines 13 00906 g003b
Figure 4. SEM results of microstructure: (a) 2nd Experiment, (b) 3rd Experiment.
Machines 13 00906 g004aMachines 13 00906 g004b
Figure 5. Experiment 2 EDX analysis results.
Machines 13 00906 g005
Figure 6. Experiment 3 EDX analysis results.
Machines 13 00906 g006
Figure 7. SEC and SCEC results.
Machines 13 00906 g007aMachines 13 00906 g007b
Figure 8. 3D RSM Surface graph for RSM analysis results.
Machines 13 00906 g008
Figure 9. Comparison of the calculated and predicted SEC%100 values using DT, AB, ET, and XGB algorithms. (a) DT Model; (b) AB Model; (c) ET Model; (d) XGB Model.
Machines 13 00906 g009aMachines 13 00906 g009b
Figure 10. Comparison of the calculated and predicted SCEC%100 values using DT, AB, ET, and XGB algorithms. (a) DT Model; (b) AB Model; (c) ET Model; (d) XGB Model.
Machines 13 00906 g010aMachines 13 00906 g010b
Figure 11. SHAP values diagrams of DT for SEC%100 prediction. (a) Mean SHAP values; (b) SHAP global interpretation.
Machines 13 00906 g011
Figure 12. SHAP values diagrams of XGB for SCEC%100 prediction. (a) Mean SHAP values; (b) SHAP global interpretation.
Machines 13 00906 g012
Figure 13. SHAP feature interactions of DT for SEC%100 prediction. (a) SHAP Feature Interaction; (b) Top 10 Feature Interactions.
Machines 13 00906 g013
Figure 14. SHAP feature interactions of XGB for SCEC%100 prediction. (a) SHAP Feature Interaction; (b) Top 10 Feature Interactions.
Machines 13 00906 g014
Table 1. Elemental composition (%) of the samples used in experiments.
Type of MaterialsAlSiFeCuMnMgZnCr
196.30.850.590.590.170.730.210.29
292.90.712.232.640.061.050.090.12
390.80.664.922.170.0610.080.11
Table 2. Experimental parameters and levels.
ParametersLevels
Depth of Cut (mm)123
Cutting speed (m/min)50100150
Feed rate (mm/rev)0.100.150.20
Table 3. Design of experiment (DOE).
Experiment NumberDepth of Cut (mm)Cutting Speed (m/min)Feed Rate (mm/rev)Type of Materials
11500.11
211000.151
311500.21
42500.151
521000.21
621500.11
73500.21
831000.11
931500.151
101500.12
1111000.152
1211500.22
132500.152
1421000.22
1521500.12
163500.22
1731000.12
1831500.152
191500.13
2011000.153
2111500.23
222500.153
2321000.23
2421500.13
253500.23
2631000.13
2731500.153
Table 4. k-Fold M A E scores for SEC%100 and SCEC%100.
DTABETXGB
SEC%1000.307230.257700.387030.29710
SCEC%1000.330460.291630.370700.39814
Table 5. Mechanical property results.
Type of MaterialsYield Strength (MPa)Tensile Strength (MPa)Hardness (HV)Fracture Energy (J)Elongation (%)
152105707277.5
2921261104645.2
3172187883435.9
Table 6. Comparison of evaluation metric scores of ML models.
SEC%100SCEC%100
DTABETXGBDTABETXGB
R20.986340.843610.870140.947790.953540.956540.956840.96533
RMSE0.032230.109070.099390.063020.369290.357160.355950.31903
MAE0.022090.066440.059540.047850.323520.299410.292380.25578
MSE0.001040.011900.009880.003970.136370.127560.126700.10178
Note: Best scores are described in bold.
Disclaimer/Publisher’s Note: The statements, opinions and data contained in all publications are solely those of the individual author(s) and contributor(s) and not of MDPI and/or the editor(s). MDPI and/or the editor(s) disclaim responsibility for any injury to people or property resulting from any ideas, methods, instructions or products referred to in the content.