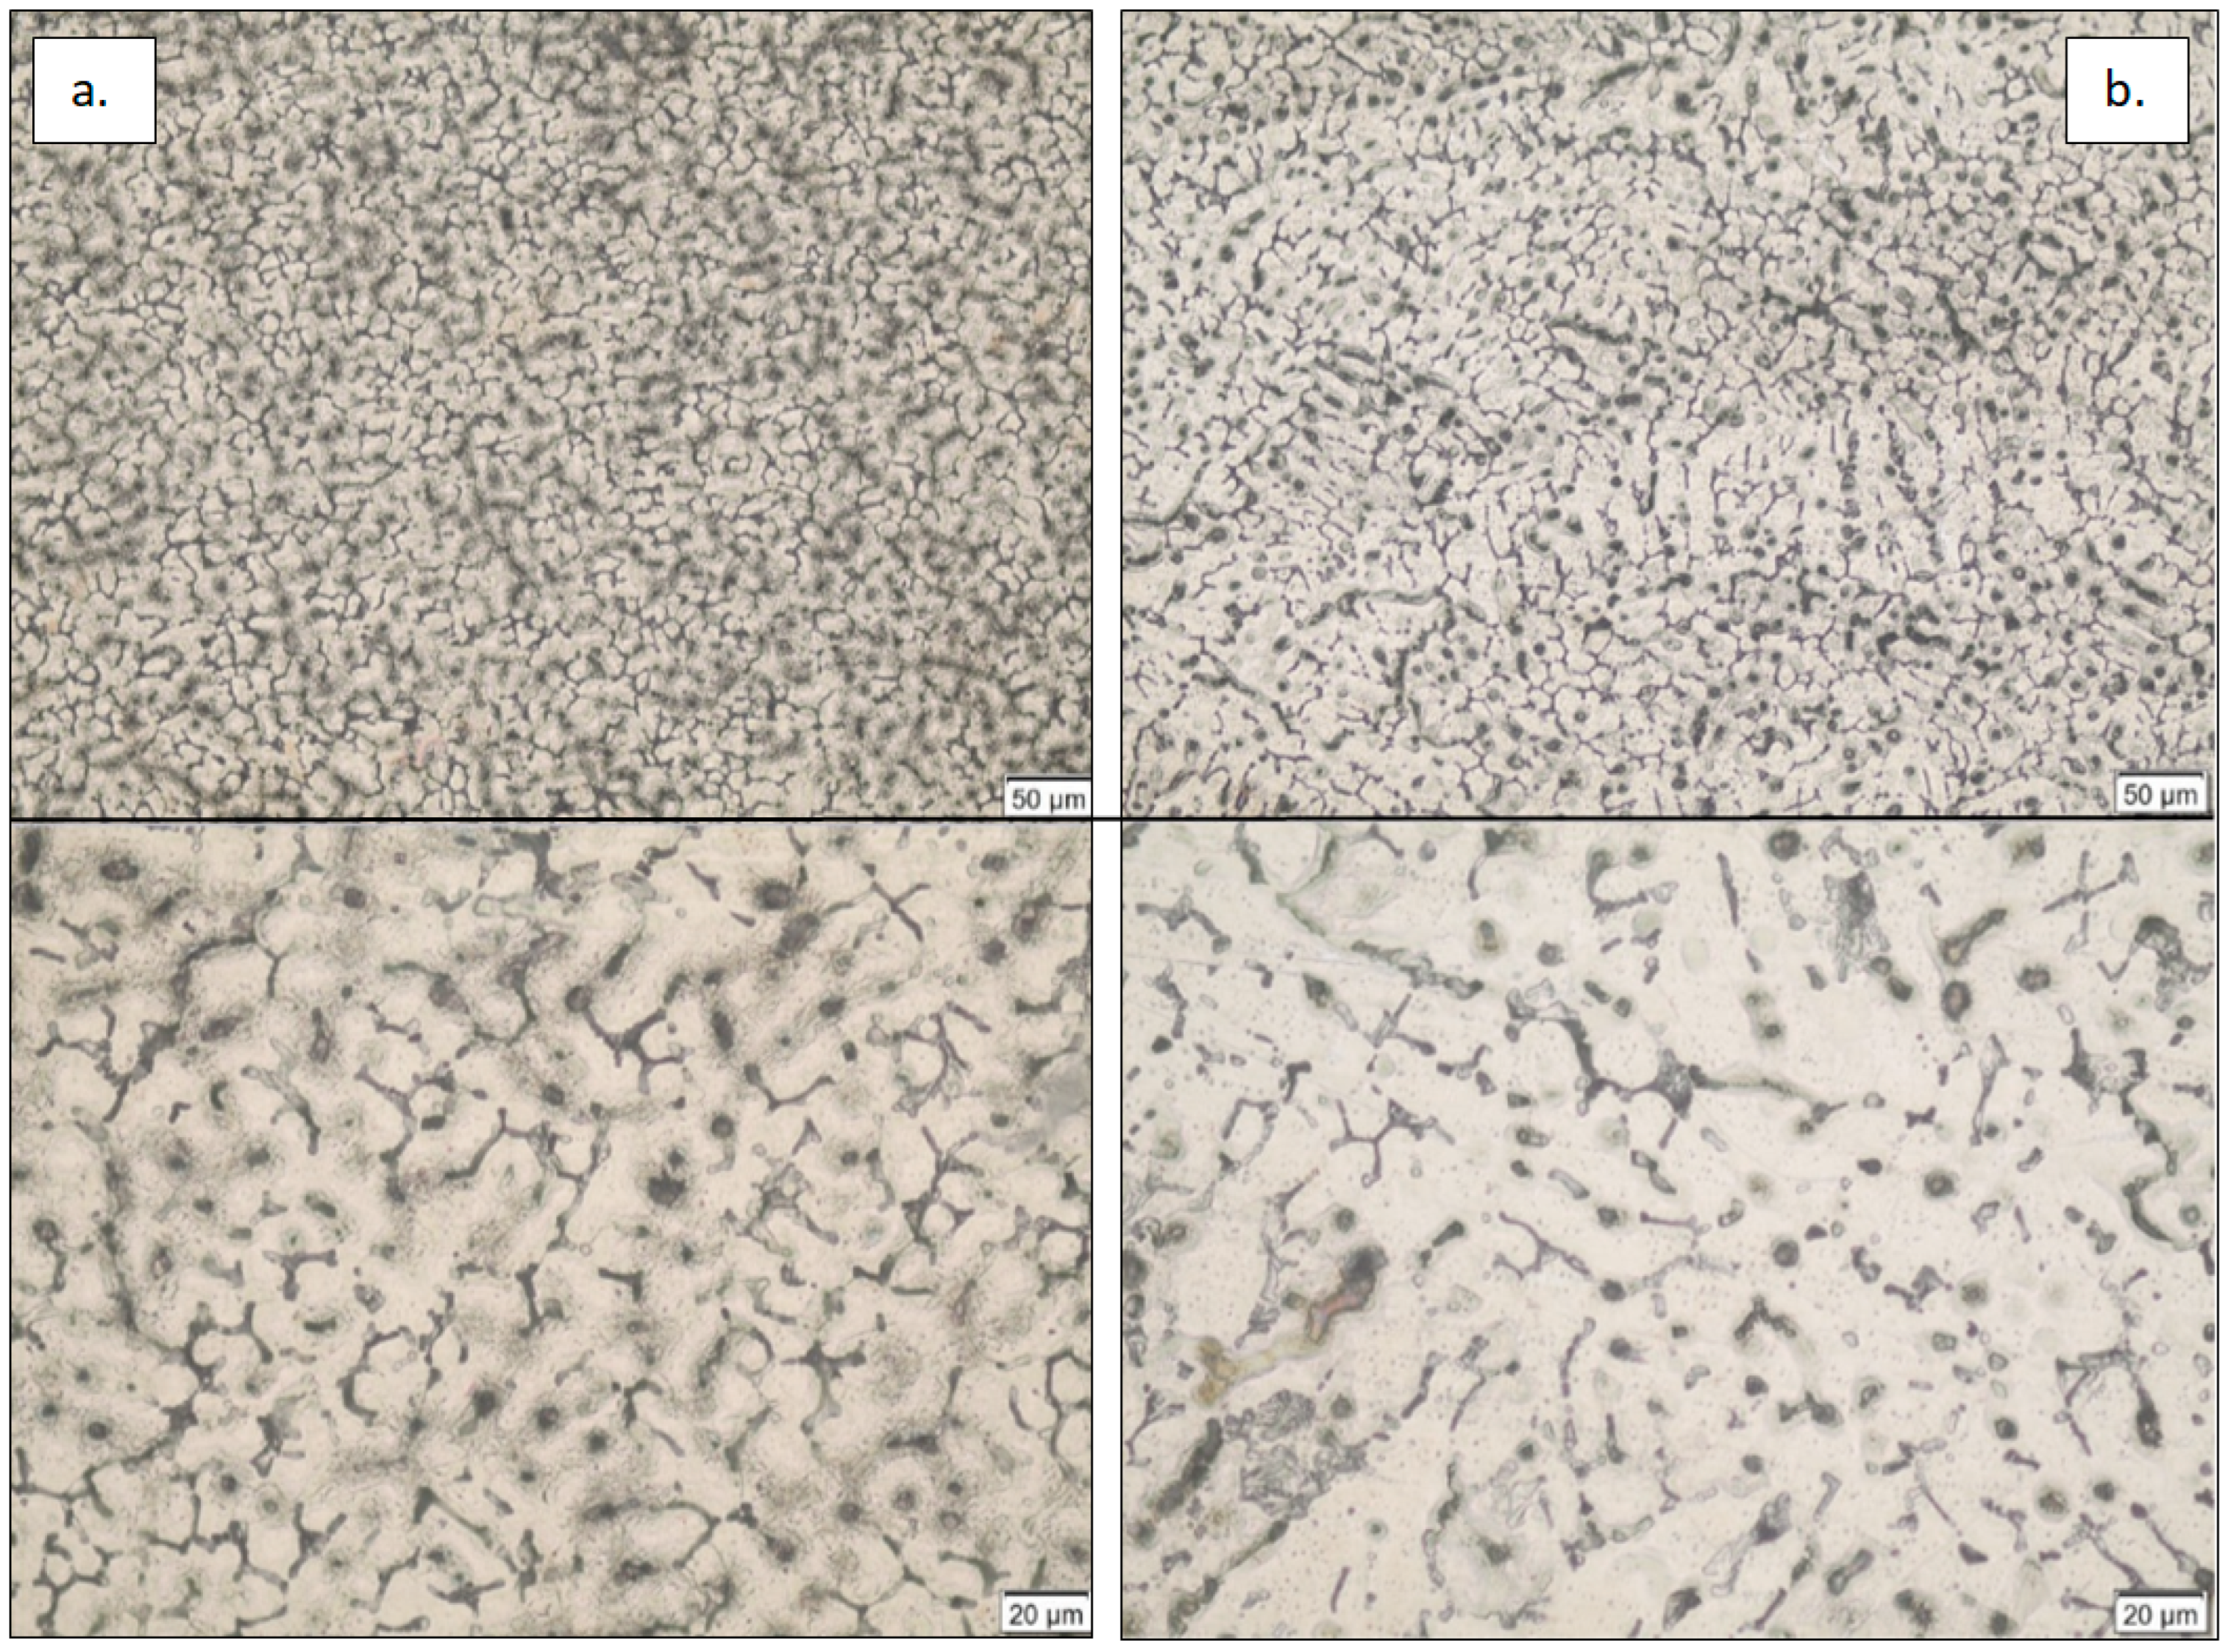
3.1. Materials Results
Material characterization plays a crucial role in understanding the mechanical properties of alloys, particularly in evaluating their strength, hardness, and fracture behavior. The relationship between yield strength, tensile strength, hardness, fracture energy, and elongation percentage provides essential insights into the material’s performance under different loading conditions. This study presents experimental results obtained from three different samples, aiming to analyze their mechanical behavior and deformation characteristics.
Table 5 summarizes the mechanical properties of the tested samples, including yield strength, tensile strength, hardness, fracture energy, and elongation percentage. The data illustrate variations in material performance based on different experimental conditions, providing a comparative analysis of their structural integrity and toughness.
Table 5 summarizes the mechanical properties of the tested samples, including yield strength, tensile strength, hardness, fracture energy, and elongation percentage. All values were obtained from our own experimental measurements. Hardness tests were performed using a Shimadzu HMV-G21 Vickers hardness tester, with five measurements taken for each sample and averaged to ensure reliability. Tensile properties were determined with a Shimadzu AG-X Plus universal testing machine (100 kN capacity), using standard specimens, where three repeated tests were conducted and the mean values are reported. These procedures provide a robust comparative analysis of structural integrity and toughness under different experimental conditions.
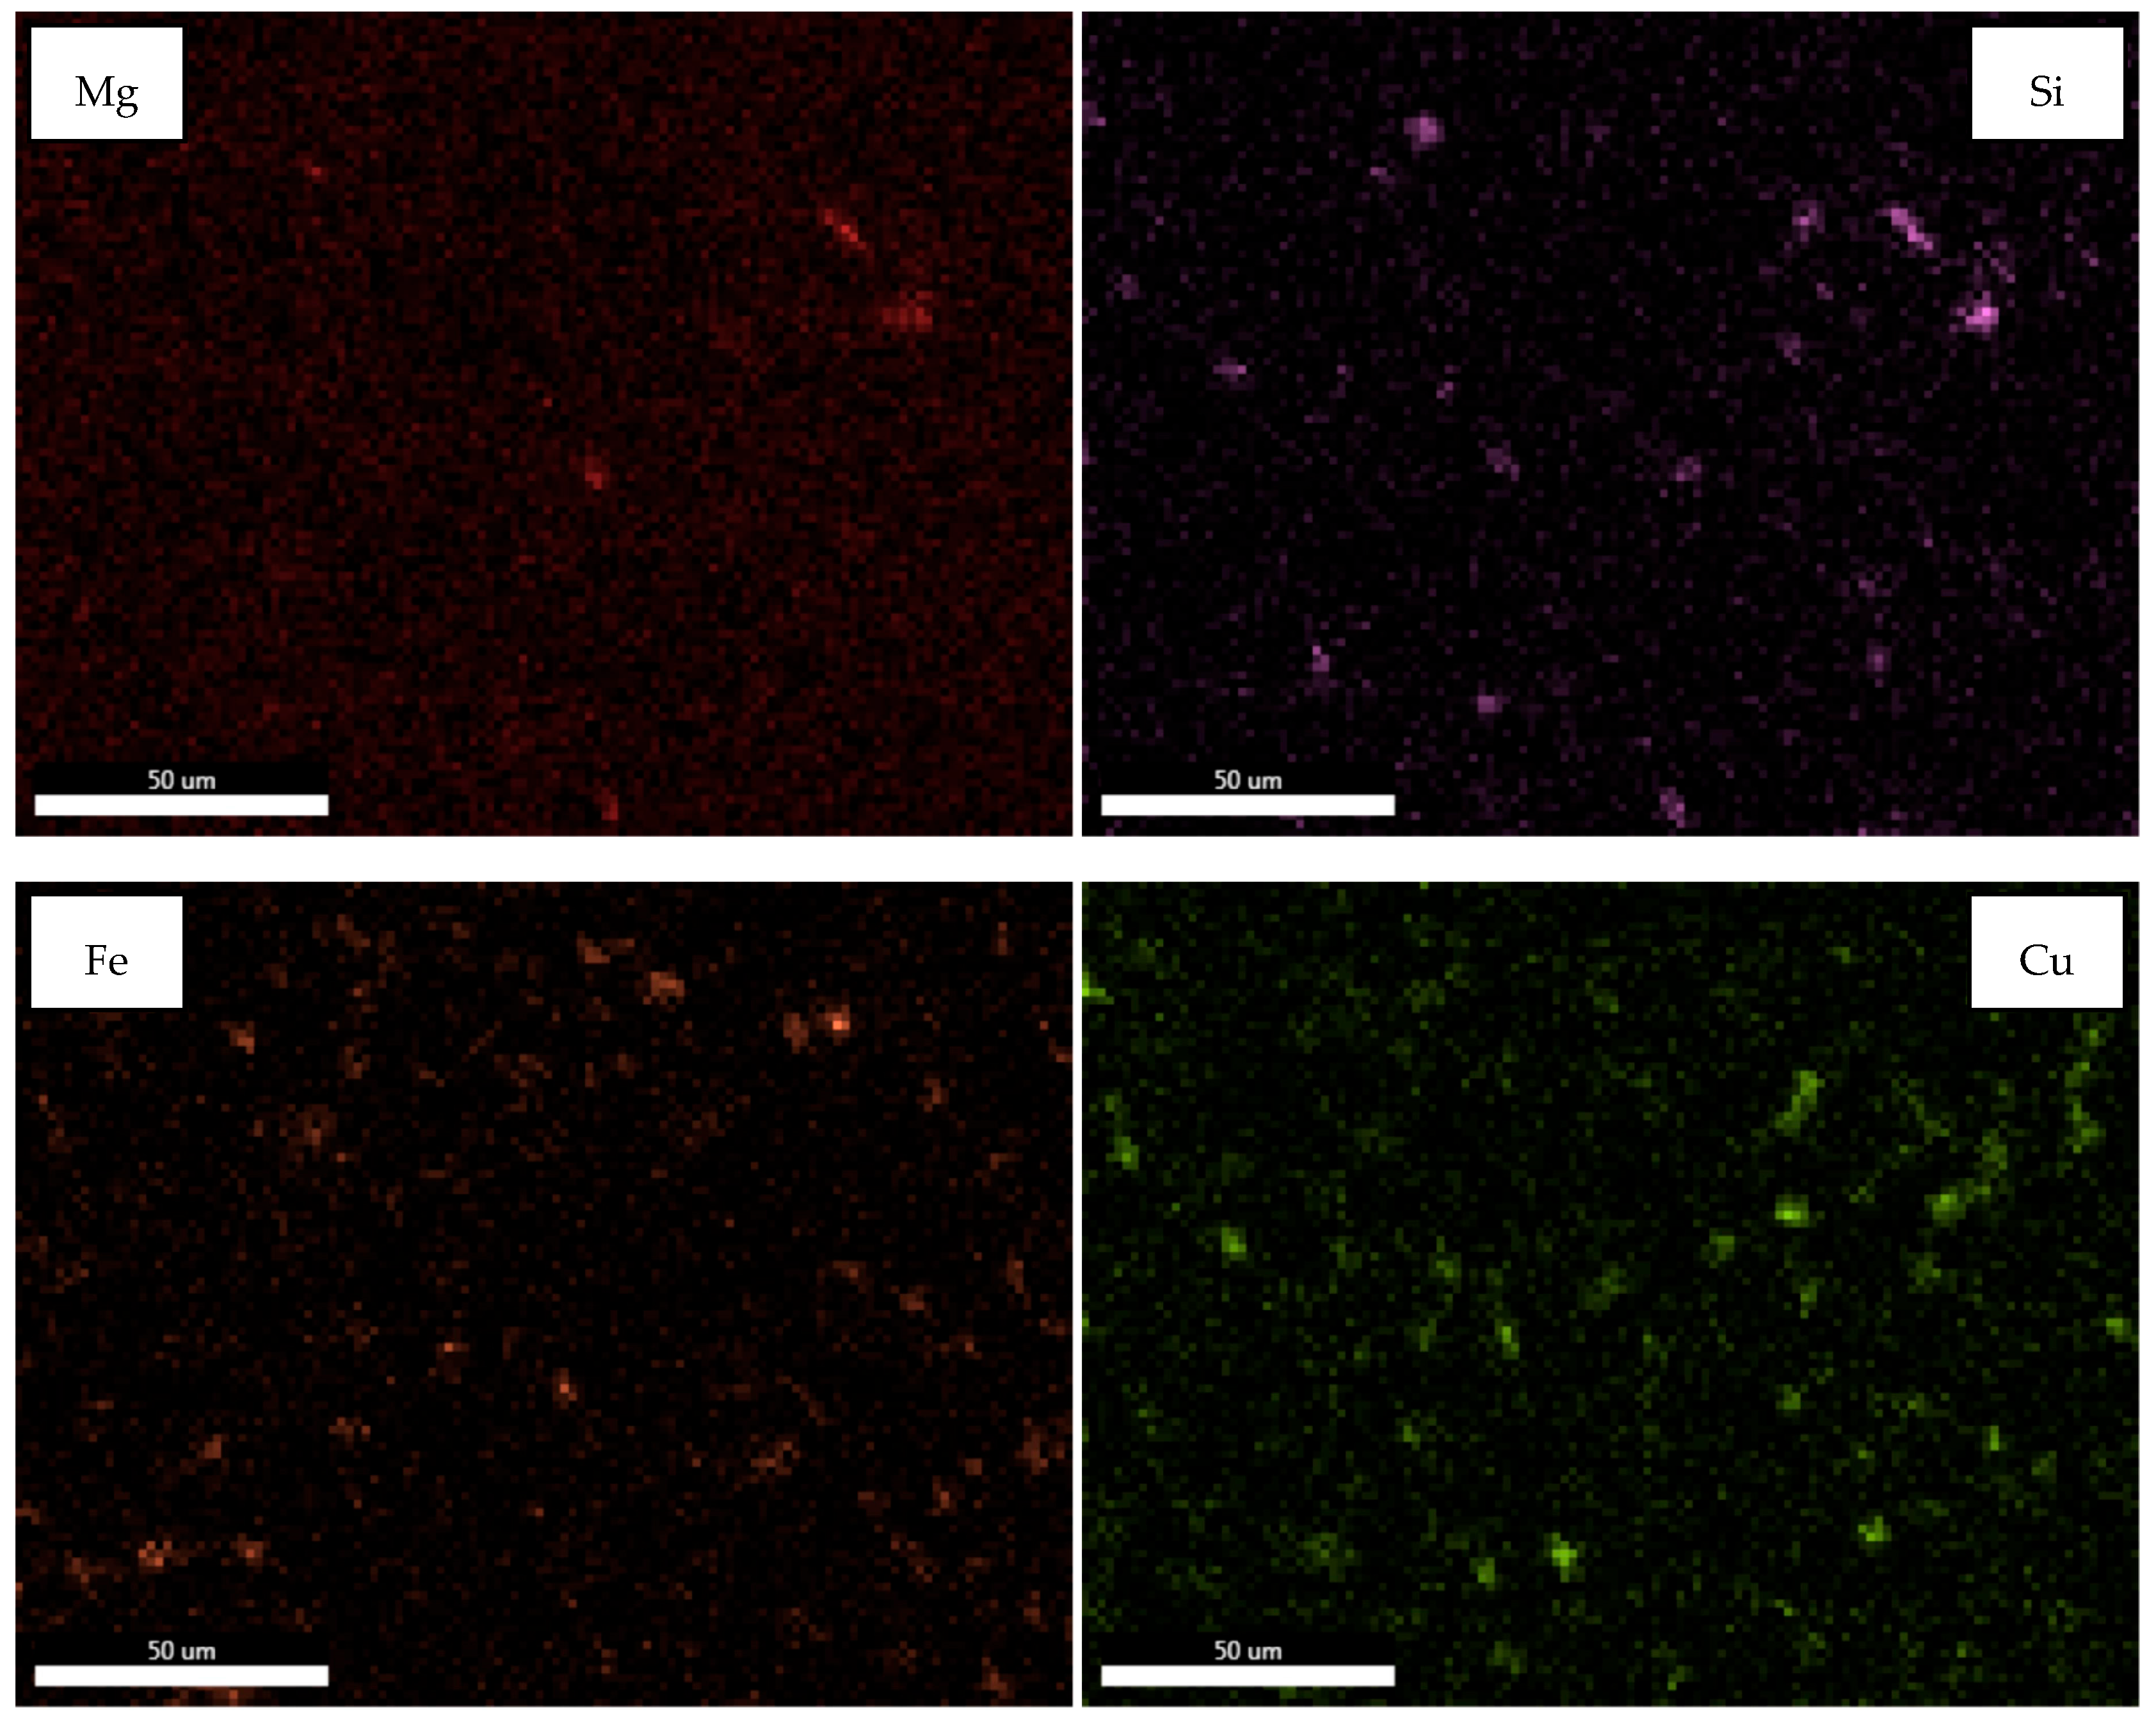
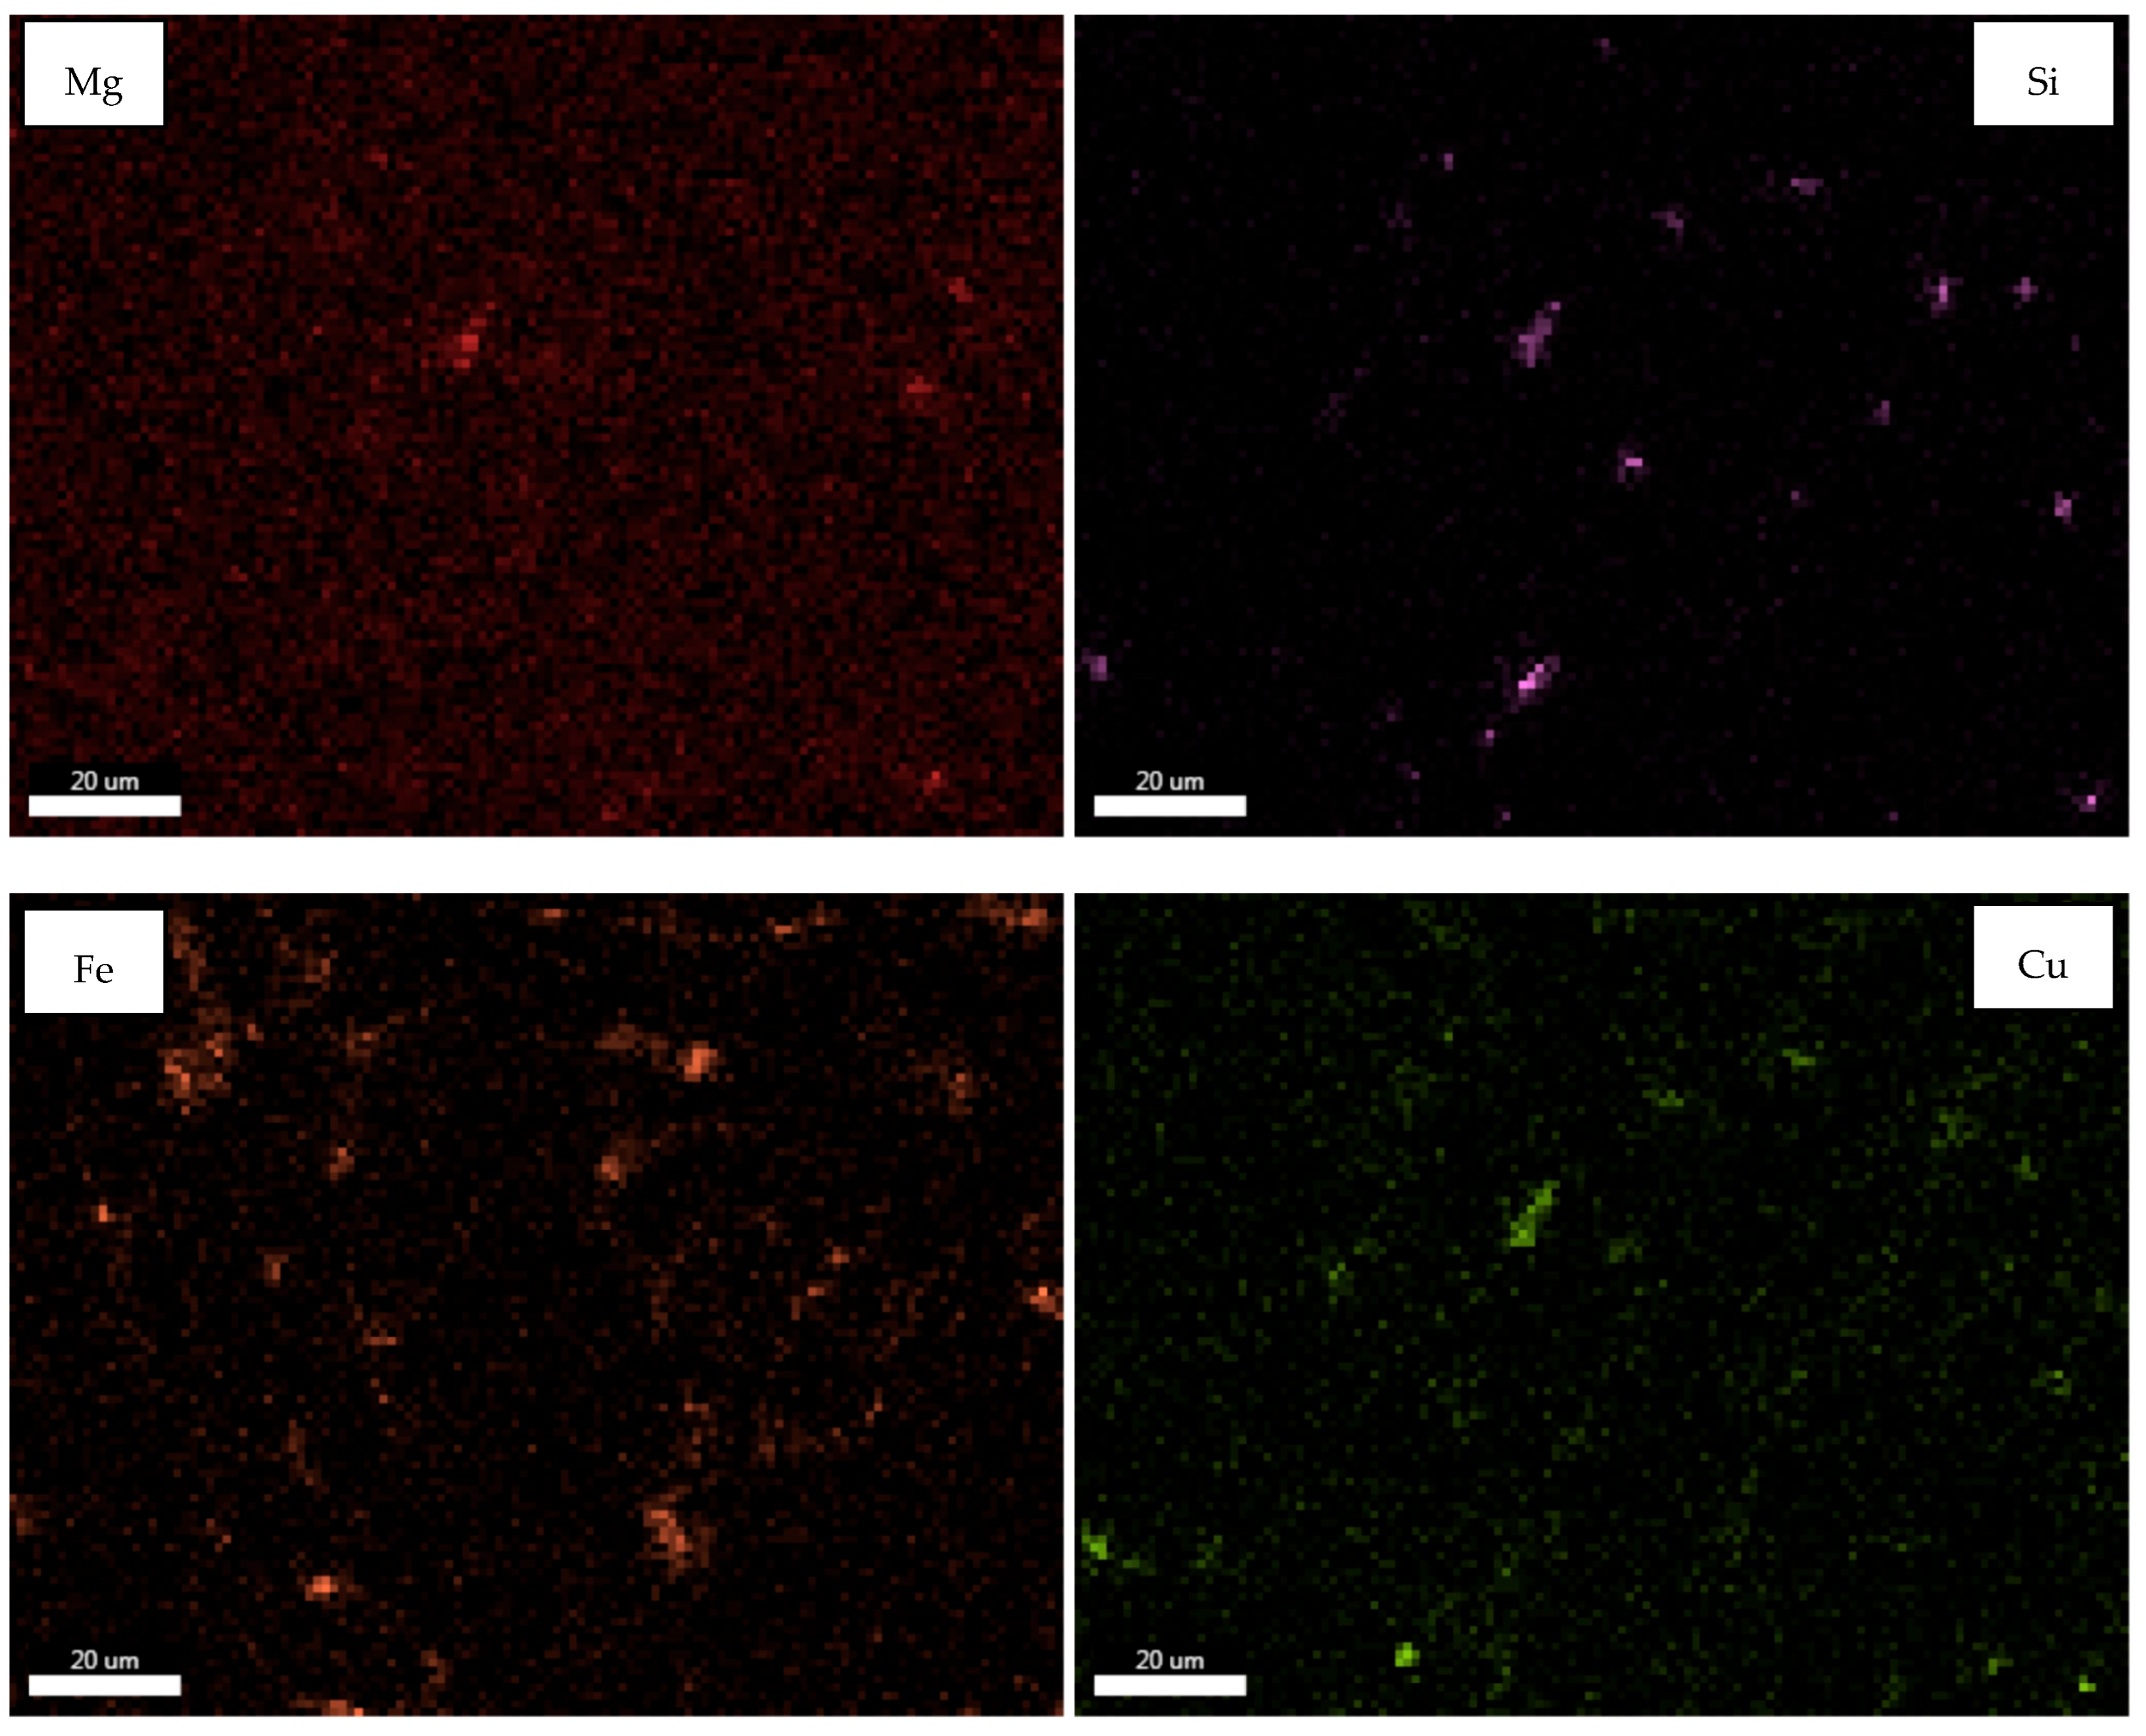
Microstructural analyses supported by EDX mapping revealed a notable concentration of Fe-rich regions in the sample containing 5% Fe, with these phases showing a tendency to cluster rather than remain homogeneously distributed. These intermetallic regions, identified as red areas through image processing techniques and quantitatively analyzed in microns, unveiled structural variations directly linked to mechanical performance. In particular, the third experimental sample (Al–5Fe) exhibited a high yield strength (172 MPa) and tensile strength (187 MPa), accompanied by a hardness of 88 HV, which can be attributed to the increased density of intermetallic phases. However, this sample also showed reduced ductility (35.9%) and lower fracture energy (34 J), indicating that the Fe-rich zones observed in the EDX maps contributed to embrittlement and a more brittle fracture behavior. In contrast, the second sample containing 2.5% Fe demonstrated a more uniform phase distribution and, despite its slightly lower hardness of 110 HV, displayed a better mechanical balance with higher ductility (45.2%) and fracture energy (46 J). These findings confirm a clear structure–property correlation between the chemically resolved phase distribution obtained from EDX analysis and the mechanical response, particularly in terms of hardness and ductility.
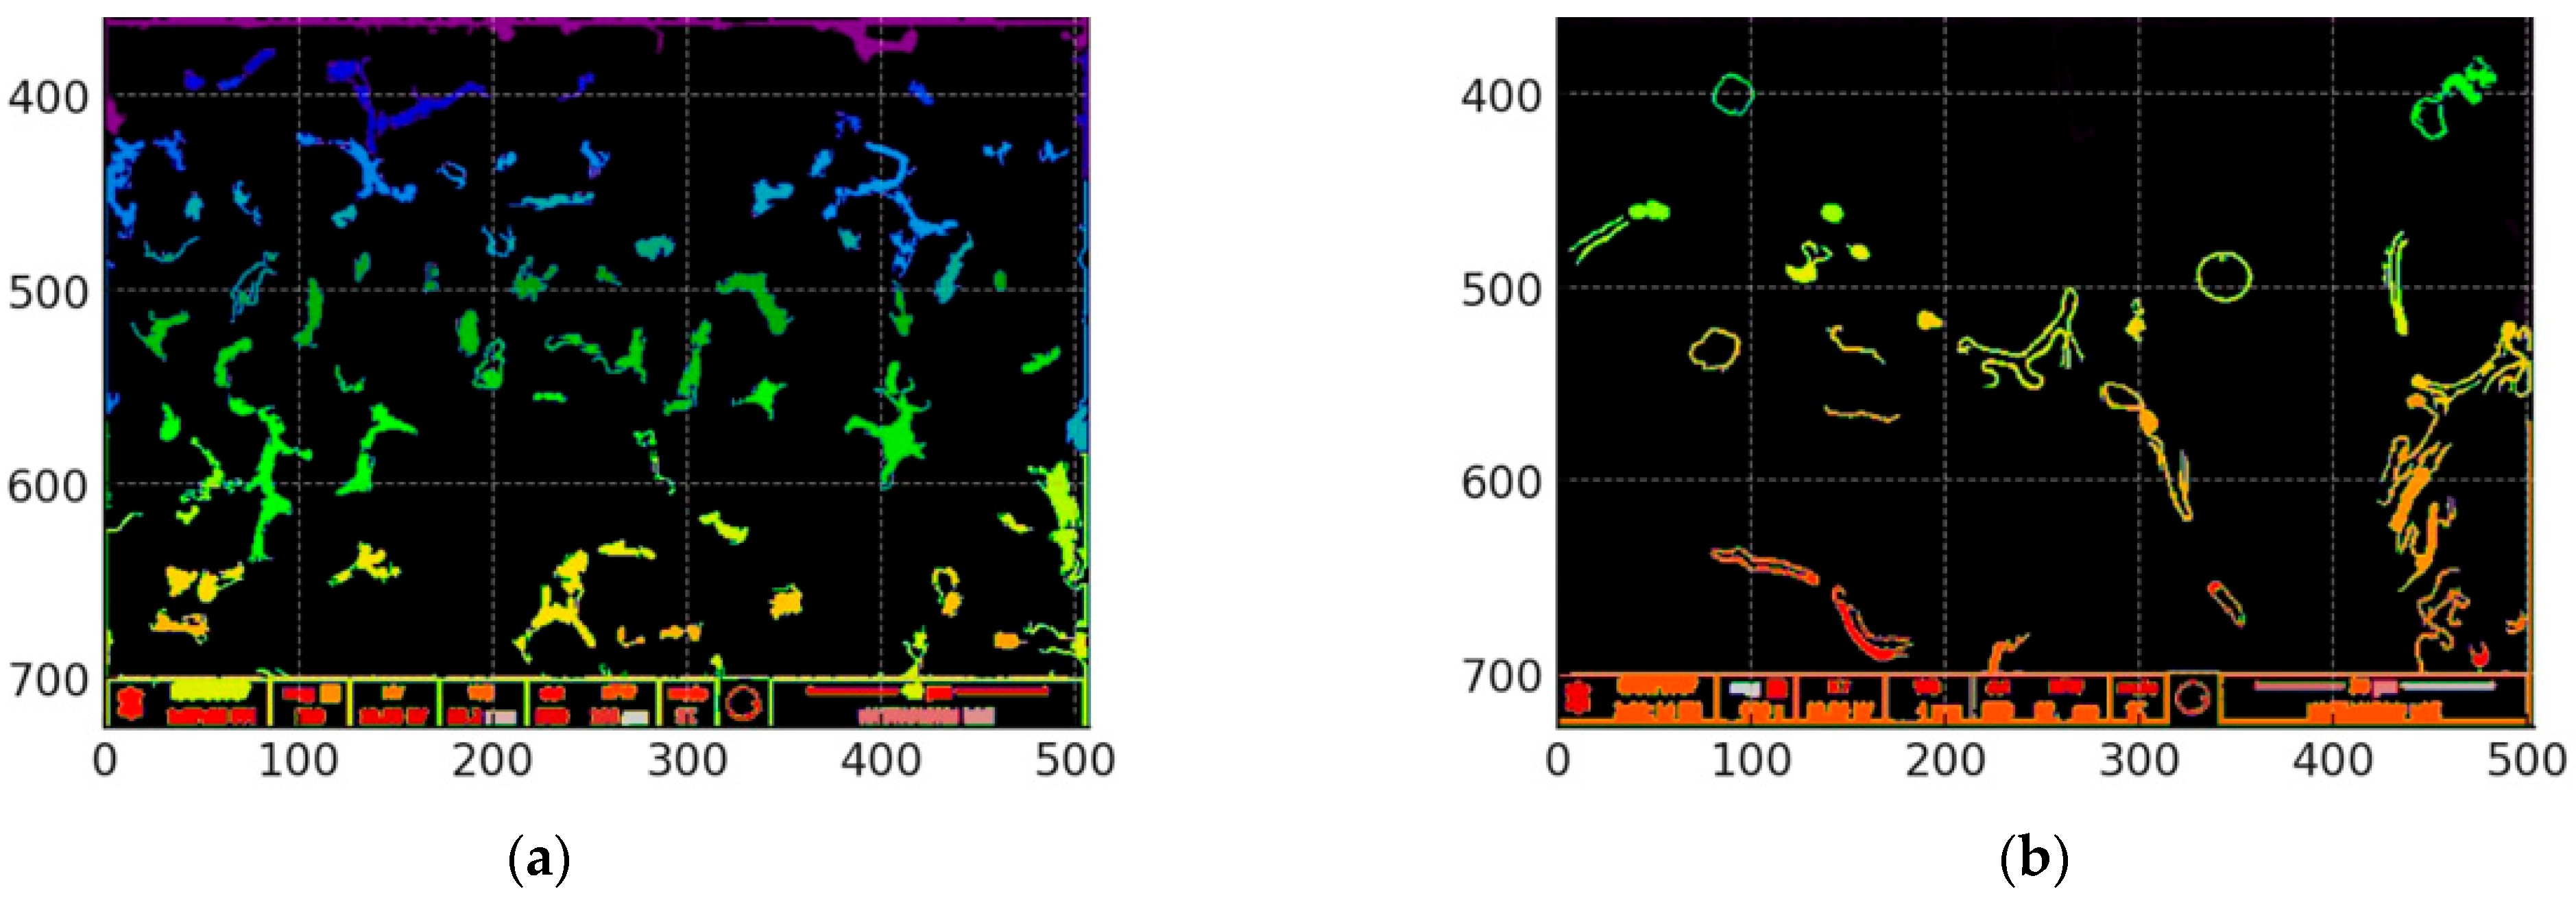
The microstructural analysis of the samples was conducted in several key steps to ensure high accuracy in image processing. The Python programming language and OpenCV library were utilized for this analysis. As the initial step, images of both samples were loaded, and regions marked in red were identified. This process involved color masking within a specific range, allowing for the selection of only red regions. During the masking process, grayscale conversion and thresholding techniques were applied to isolate red-marked regions from other colors. The identified red areas were then numerically analyzed using contour detection. The size of each area (in pixels) was calculated and then converted into microns using a scaling factor (
Figure 3). The identified red areas were subsequently analyzed in detail using contour detection techniques. The pixel-based area of each red zone was calculated and converted into microns using a predefined scaling factor. As illustrated in
Figure 3, these regions represent localized concentrations of intermetallic compounds within the microstructure. The size distribution of these areas provides a quantitative basis for comparing different alloy compositions, and their variation offers insights into how Fe and Cu content influence the formation and clustering of such phases [
7,
19].
A 50-micron scale bar was used as a reference in each sample. The width of this scale bar was measured in pixels, determined to be 34 pixels. This measurement was verified using an image processing algorithm that incorporated contour detection and bounding box methods. Based on this, 1 pixel was calculated to be approximately 1.47 microns. This scaling factor was applied to convert all detected regions from pixels to microns. For example, the area measured in pixels was multiplied by 1.472 to express it in square microns. This approach is critical for ensuring the accuracy of visual data and aligning it with physical measurements.
The second experimental sample exhibited 14 distinct regions in its microstructure. The small size and uniform distribution of these regions indicate homogeneous phase boundaries and limited intermetallic phase accumulation. Measurements revealed that the average area of these regions was 1091.5 μm2, with an average width of 53.5 μm and a height of 49.7 μm. This microstructure, influenced by 2.23% Fe and 2.64% Cu content, resulted in balanced mechanical properties. The high aluminum content (92.9%) enhanced ductility, maintaining the fracture energy at 46 J. Additionally, an elongation percentage of 45.2% indicated that the material exhibited significant resistance to deformation. The sample also demonstrated balanced strength characteristics, with a yield strength of 92 MPa and a hardness value of 110 HV. The homogeneity of the microstructure, combined with small grain sizes, contributed to higher energy absorption during deformation, enhancing the material’s durability. These properties make this sample particularly suitable for applications requiring high deformation resistance and formability.
The microstructural properties of the second sample strongly correlate with its mechanical performance. The fine grain size observed in the microstructure contributes to higher energy absorption during deformation, resulting in improved toughness and ductility. Additionally, the presence of Fe and Cu in the alloy composition enhances phase stability and promotes better mechanical strength. The balance between strength and ductility in this sample is evident in its 92 MPa yield strength and 110 HV hardness. The elongation rate of 45.2% indicates that the material maintains high plastic deformation capacity, which is essential for applications requiring flexibility and impact resistance. The fracture energy of 46 J suggests that the material can withstand moderate impact loads without significant structural failure.
Furthermore, the distribution of intermetallic phases within the microstructure plays a critical role in determining the overall mechanical behavior. A uniform phase distribution minimizes stress concentrations, reducing the likelihood of brittle fracture. The fine and homogeneous dispersion of intermetallic phases in Sample 2 confirms that the material exhibits both high strength and moderate toughness, making it suitable for industrial applications requiring a balance between mechanical durability and processability. By correlating microstructural observations with experimental mechanical properties, a clear relationship between phase distribution, grain size, and mechanical performance can be established. The Fe and Cu contents directly influence the formation of secondary phases, which contribute to the material’s overall hardness and wear resistance.
The elongation percentage and fracture energy values suggest that the sample retains sufficient ductility despite its increased strength characteristics. This is a significant advantage in manufacturing processes where materials must endure high stress and deformation. Additionally, the microstructure indicates good resistance to localized deformation, further validating the material’s applicability in load-bearing and impact-resistant applications. The findings of this study highlight the impact of microstructural properties on mechanical performance. The optimized combination of Fe and Cu in the aluminum matrix enhances strength, ductility, and toughness, making it an ideal candidate for structural and industrial applications. The results confirm that precise control over alloy composition and microstructure leads to optimized mechanical properties, enabling materials to meet specific engineering demands efficiently.
In
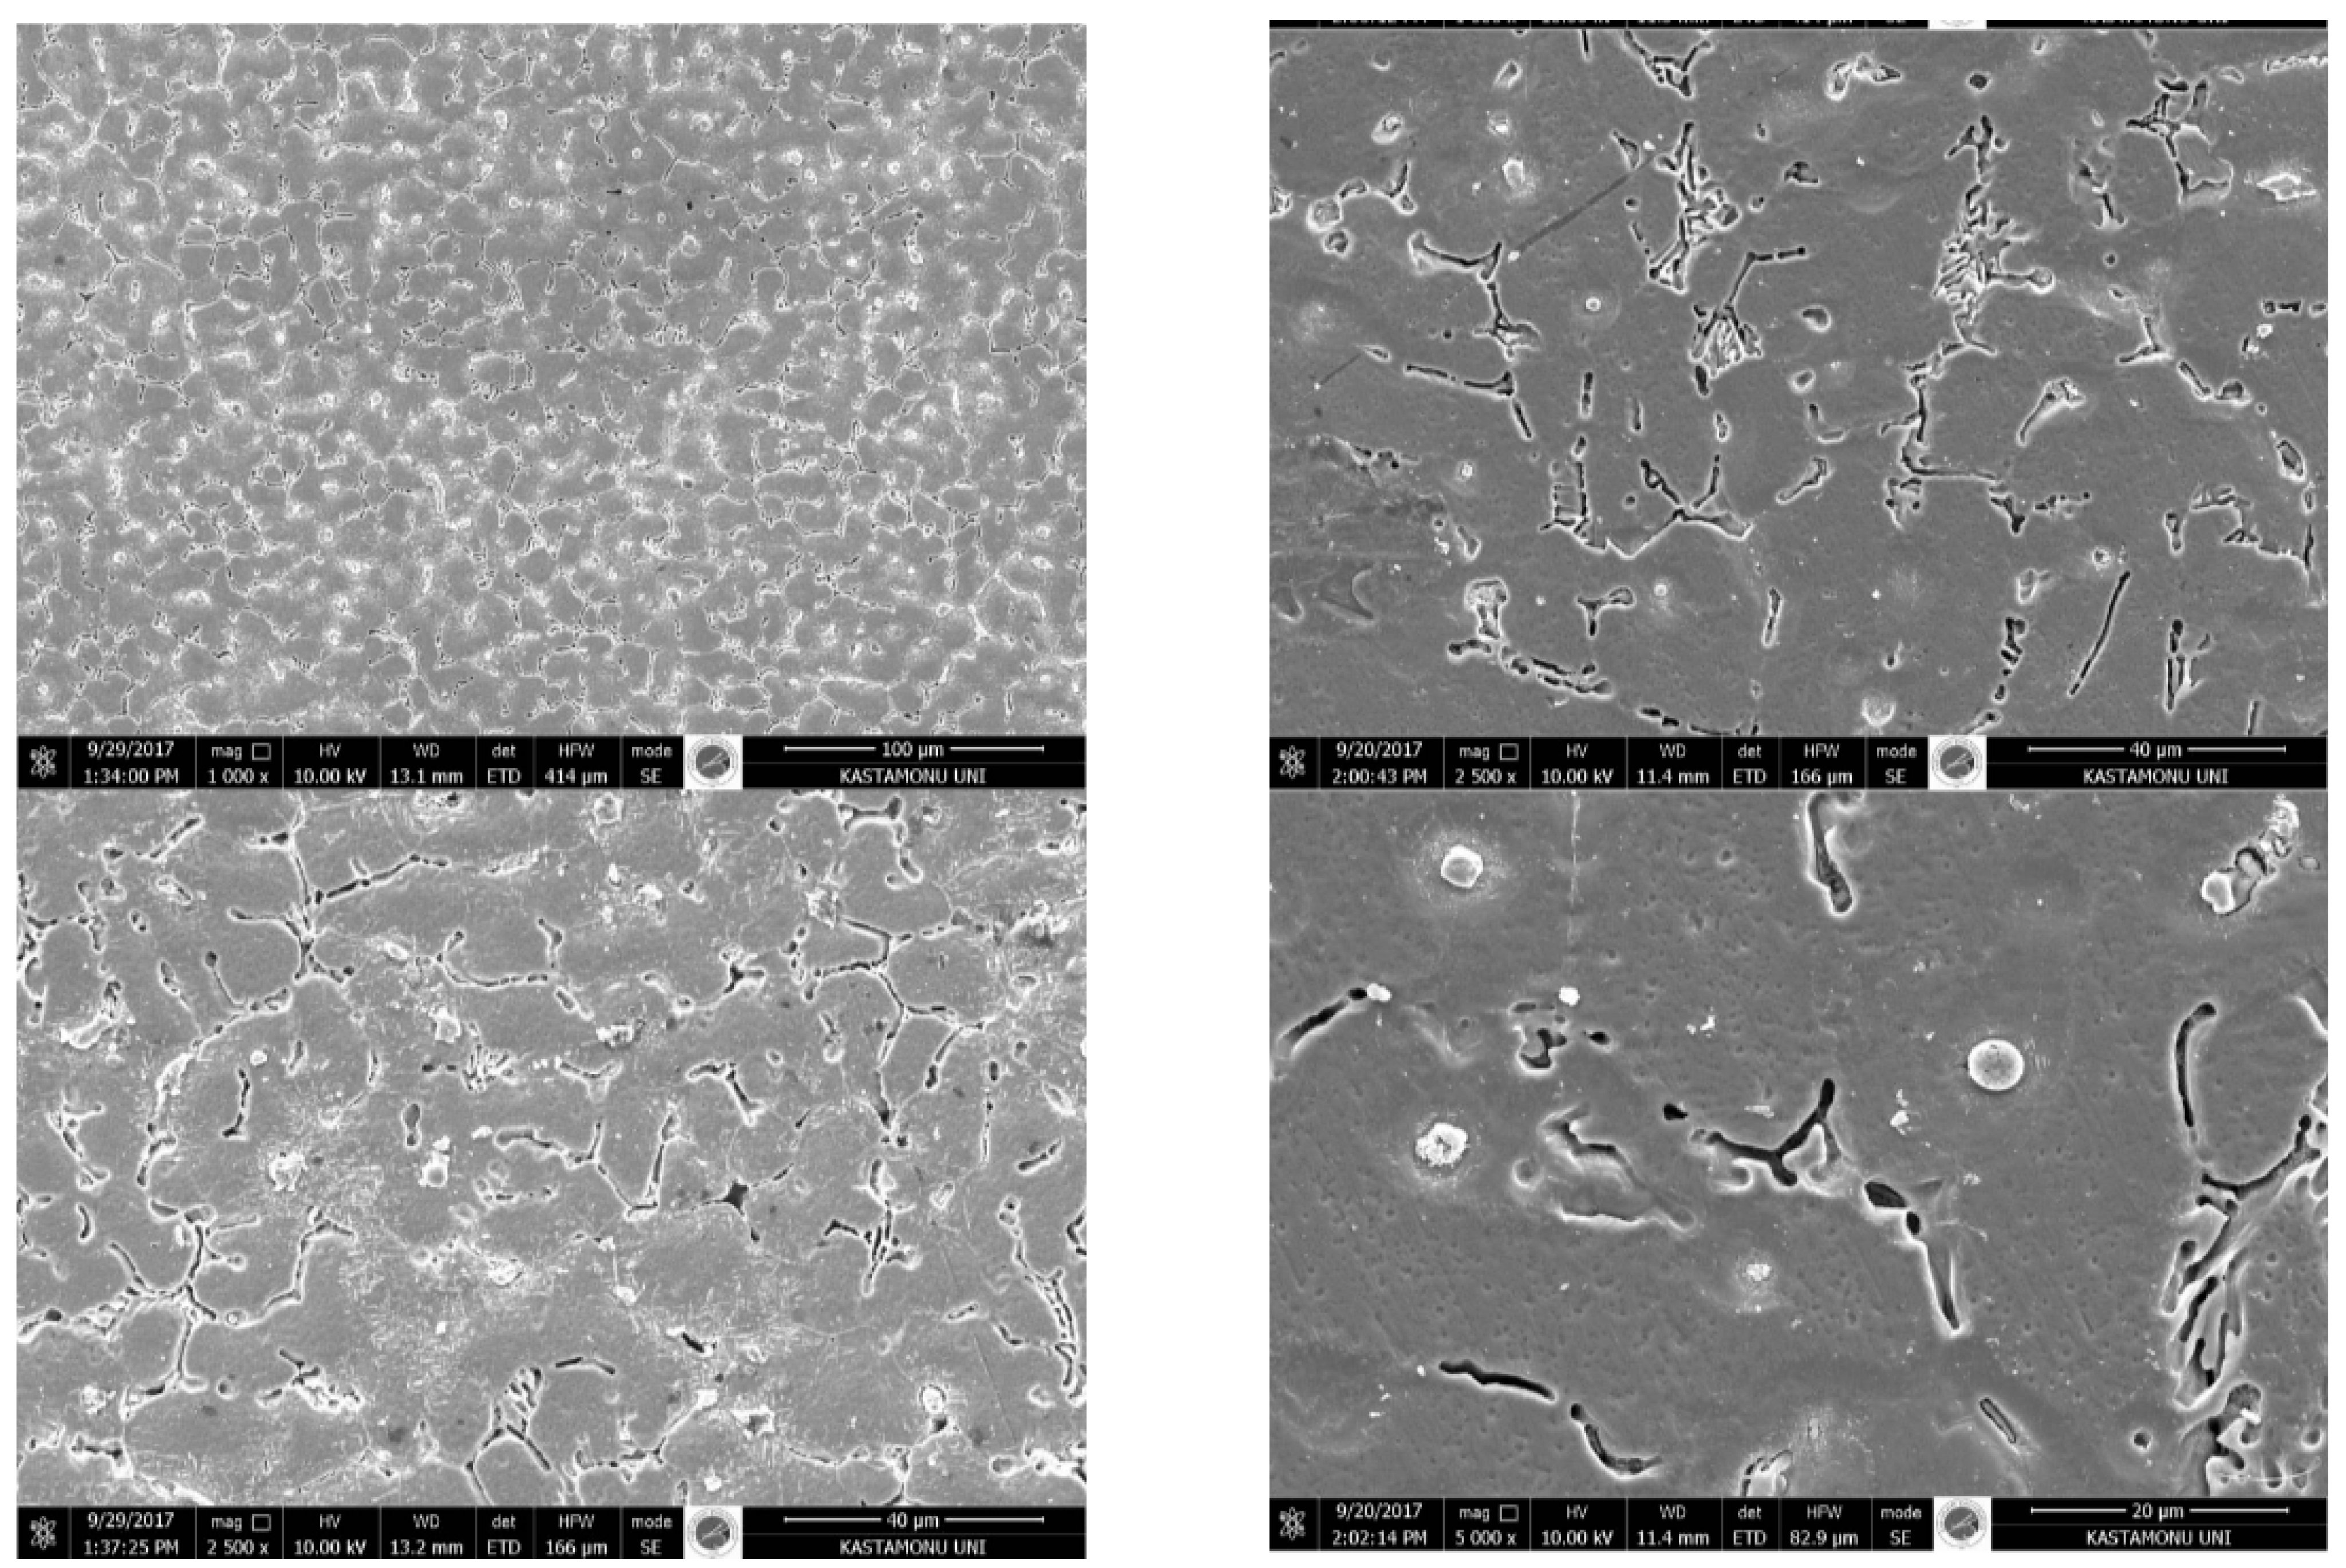
Figure 4, various image processing modules in the Python programming language were utilized for the analysis of SEM images. During these processes, the scikit-image library provided essential tools for analyzing the grains and phase boundaries within the microstructure. Sobel filters were applied to enhance phase boundaries and improve contrast differences, followed by Otsu thresholding, which segmented these boundaries. Morphological cleaning operations were employed to remove small and unnecessary segments, minimizing errors in the image. Features such as grain size, perimeter, and equivalent diameter were measured using the regionprops function, enabling a detailed analysis. In the visualization phase, Matplotlib (Python 3.13.0) was used to convert the results into graphical representations, making them interpretable. These processes enabled a detailed microstructural analysis of the SEM images, particularly highlighting features such as phase boundaries, intermetallic phase density, and average grain sizes. As shown in
Figure 4, the contrast-enhanced and segmented regions clearly reveal the spatial distribution of intermetallic phases and their interaction with the matrix. This visual evidence supports the quantitative data obtained from image processing and confirms the influence of Fe and Cu additions on microstructural refinement.
When examining the SEM images of Sample 2, the grains appear distinct, and the phase boundaries are clearly visible. A dense accumulation of intermetallic phases is observed along the phase boundaries, increasing the heterogeneity of the microstructure and creating localized variations. The grains exhibit an inhomogeneous distribution, with smaller grains being more prevalent. Dendritic structures are notably thick and more concentrated at the intersection points of the phase boundaries. The average grain diameter has decreased due to the high iron content. The accumulation at phase boundaries is clearly noticeable. This density indicates that while the material’s hardness and strength may increase, its ductility could be reduced.
When analyzing the SEM images of Sample 3, the phase boundaries remain distinct, but the accumulation is less pronounced compared to Sample 2. The grain boundaries exhibit a more homogeneous structure. The intermetallic phases are dispersed within the dendritic structures but are present at a lower density. Larger grains are observed, and the grain boundary width suggests that the microstructure exhibits greater ductility. The accumulation of intermetallic phases is relatively lower, which could positively contribute to the fracture energy by enhancing ductility.
While Sample 2 features a finer and denser grain structure, Sample 3 exhibits larger grains. Smaller grains enhance hardness, whereas larger grains support ductility. In Sample 2, the phase boundaries are more distinct and thicker, with intense intermetallic phase accumulation. Conversely, in Sample 3, the boundaries are more homogeneous and thinner.
In
Figure 5, the EDX results of Sample 2 are presented, while
Figure 6 displays the EDX results of Sample 3. Upon examining the EDX results of Sample 2, it is observed that elemental phase boundaries are more distinct and densely concentrated. Due to variations in density, the elemental distribution exhibits a more irregular and heterogeneous structure. The high iron content, in particular, has led to the accumulation of intermetallic phases at phase boundaries. The element distribution is not uniform throughout the matrix, and localized phase clusters are observed in certain regions. The accumulation of intermetallic phases, especially at phase boundaries, has resulted in a complex dendritic structure. While this structure has the potential to enhance hardness and strength, it may negatively impact ductility.
Image-processing-based quantification revealed that Sample 2 (Al–2.23Fe–2.64Cu) contained 14 finely dispersed intermetallic regions with an average area of 1091.5 μm2, a mean width of 53.5 μm, and a height of 49.7 μm, indicating a uniform microstructural distribution. This homogeneous phase dispersion directly correlated with its superior mechanical balance, characterized by a yield strength of 92 MPa, hardness of 110 HV, elongation of 45.2%, and fracture energy of 46 J. The fine-grain structure and controlled Fe–Cu content promoted ductility and toughness while maintaining adequate strength. By contrast, Sample 3 (Al–4.92Fe–2.17Cu) exhibited clustered intermetallic regions, larger dendritic features, and higher heterogeneity, resulting in increased yield strength of 172 MPa and hardness of 88 HV, but reduced elongation (35.9%) and fracture energy (34 J). These results highlight that Python-driven image analysis provided a quantitative microstructural basis that directly explained the observed variations in mechanical properties between the two alloys.
When machining performance was evaluated, Sample 2, with its refined and evenly distributed intermetallic phases, required significantly less energy for chip removal, reflected by a specific cutting energy consumption (SCEC) of 1.84 J/mm3. The homogeneous microstructure reduced localized stress concentrations during cutting, thereby minimizing tool–material friction and enabling more energy-efficient machining. In contrast, the coarser, Fe-rich clustered phases in Sample 3 increased resistance to deformation during cutting, leading to a higher SCEC value of 2.57 J/mm3. This clear microstructure–machining linkage was further supported by image-processing-derived parameters such as grain size distribution and intermetallic area fraction, which demonstrated strong correlations with both hardness and energy consumption. These findings confirm that Python-based image analysis not only quantified the microstructure but also served as a predictive indicator of machining performance, establishing a robust structure–property–process relationship essential for optimizing alloy design and manufacturing efficiency.
Analyzing the EDX results of Sample 3, it is evident that the elemental distribution suggests a more heterogeneous structure. Similar to Sample 2, the high iron content has caused intermetallic phases to accumulate in boundary regions. The element density is not evenly distributed across the matrix, and localized phase accumulations are present in specific areas. This accumulation is particularly concentrated at phase boundaries, leading to notable structural complexity within dendritic formations. While this accumulation may contribute to increased hardness and strength, it could also have adverse effects on ductility.
Compared to Sample 2, Sample 3 exhibits a more pronounced accumulation of intermetallic phases. This accumulation, driven by high iron content, has resulted in more distinct and thicker phase boundaries. In contrast, Sample 2 presents a more homogeneous matrix structure, with a lower phase density, leading to a more balanced elemental distribution. While phase boundaries in Sample 3 appear thick and well-defined, those in Sample 2 are thinner and more uniform.
This distinction also affects the mechanical properties of the samples. Sample 3 demonstrates superior hardness and strength, making it more suitable for applications requiring high mechanical resistance. However, its increased brittleness could be a disadvantage in impact-prone environments. On the other hand, Sample 2 exhibits greater ductility, offering significant advantages for applications where energy absorption and fracture resistance are critical due to its lower phase density.
3.2. Manufacturing Results
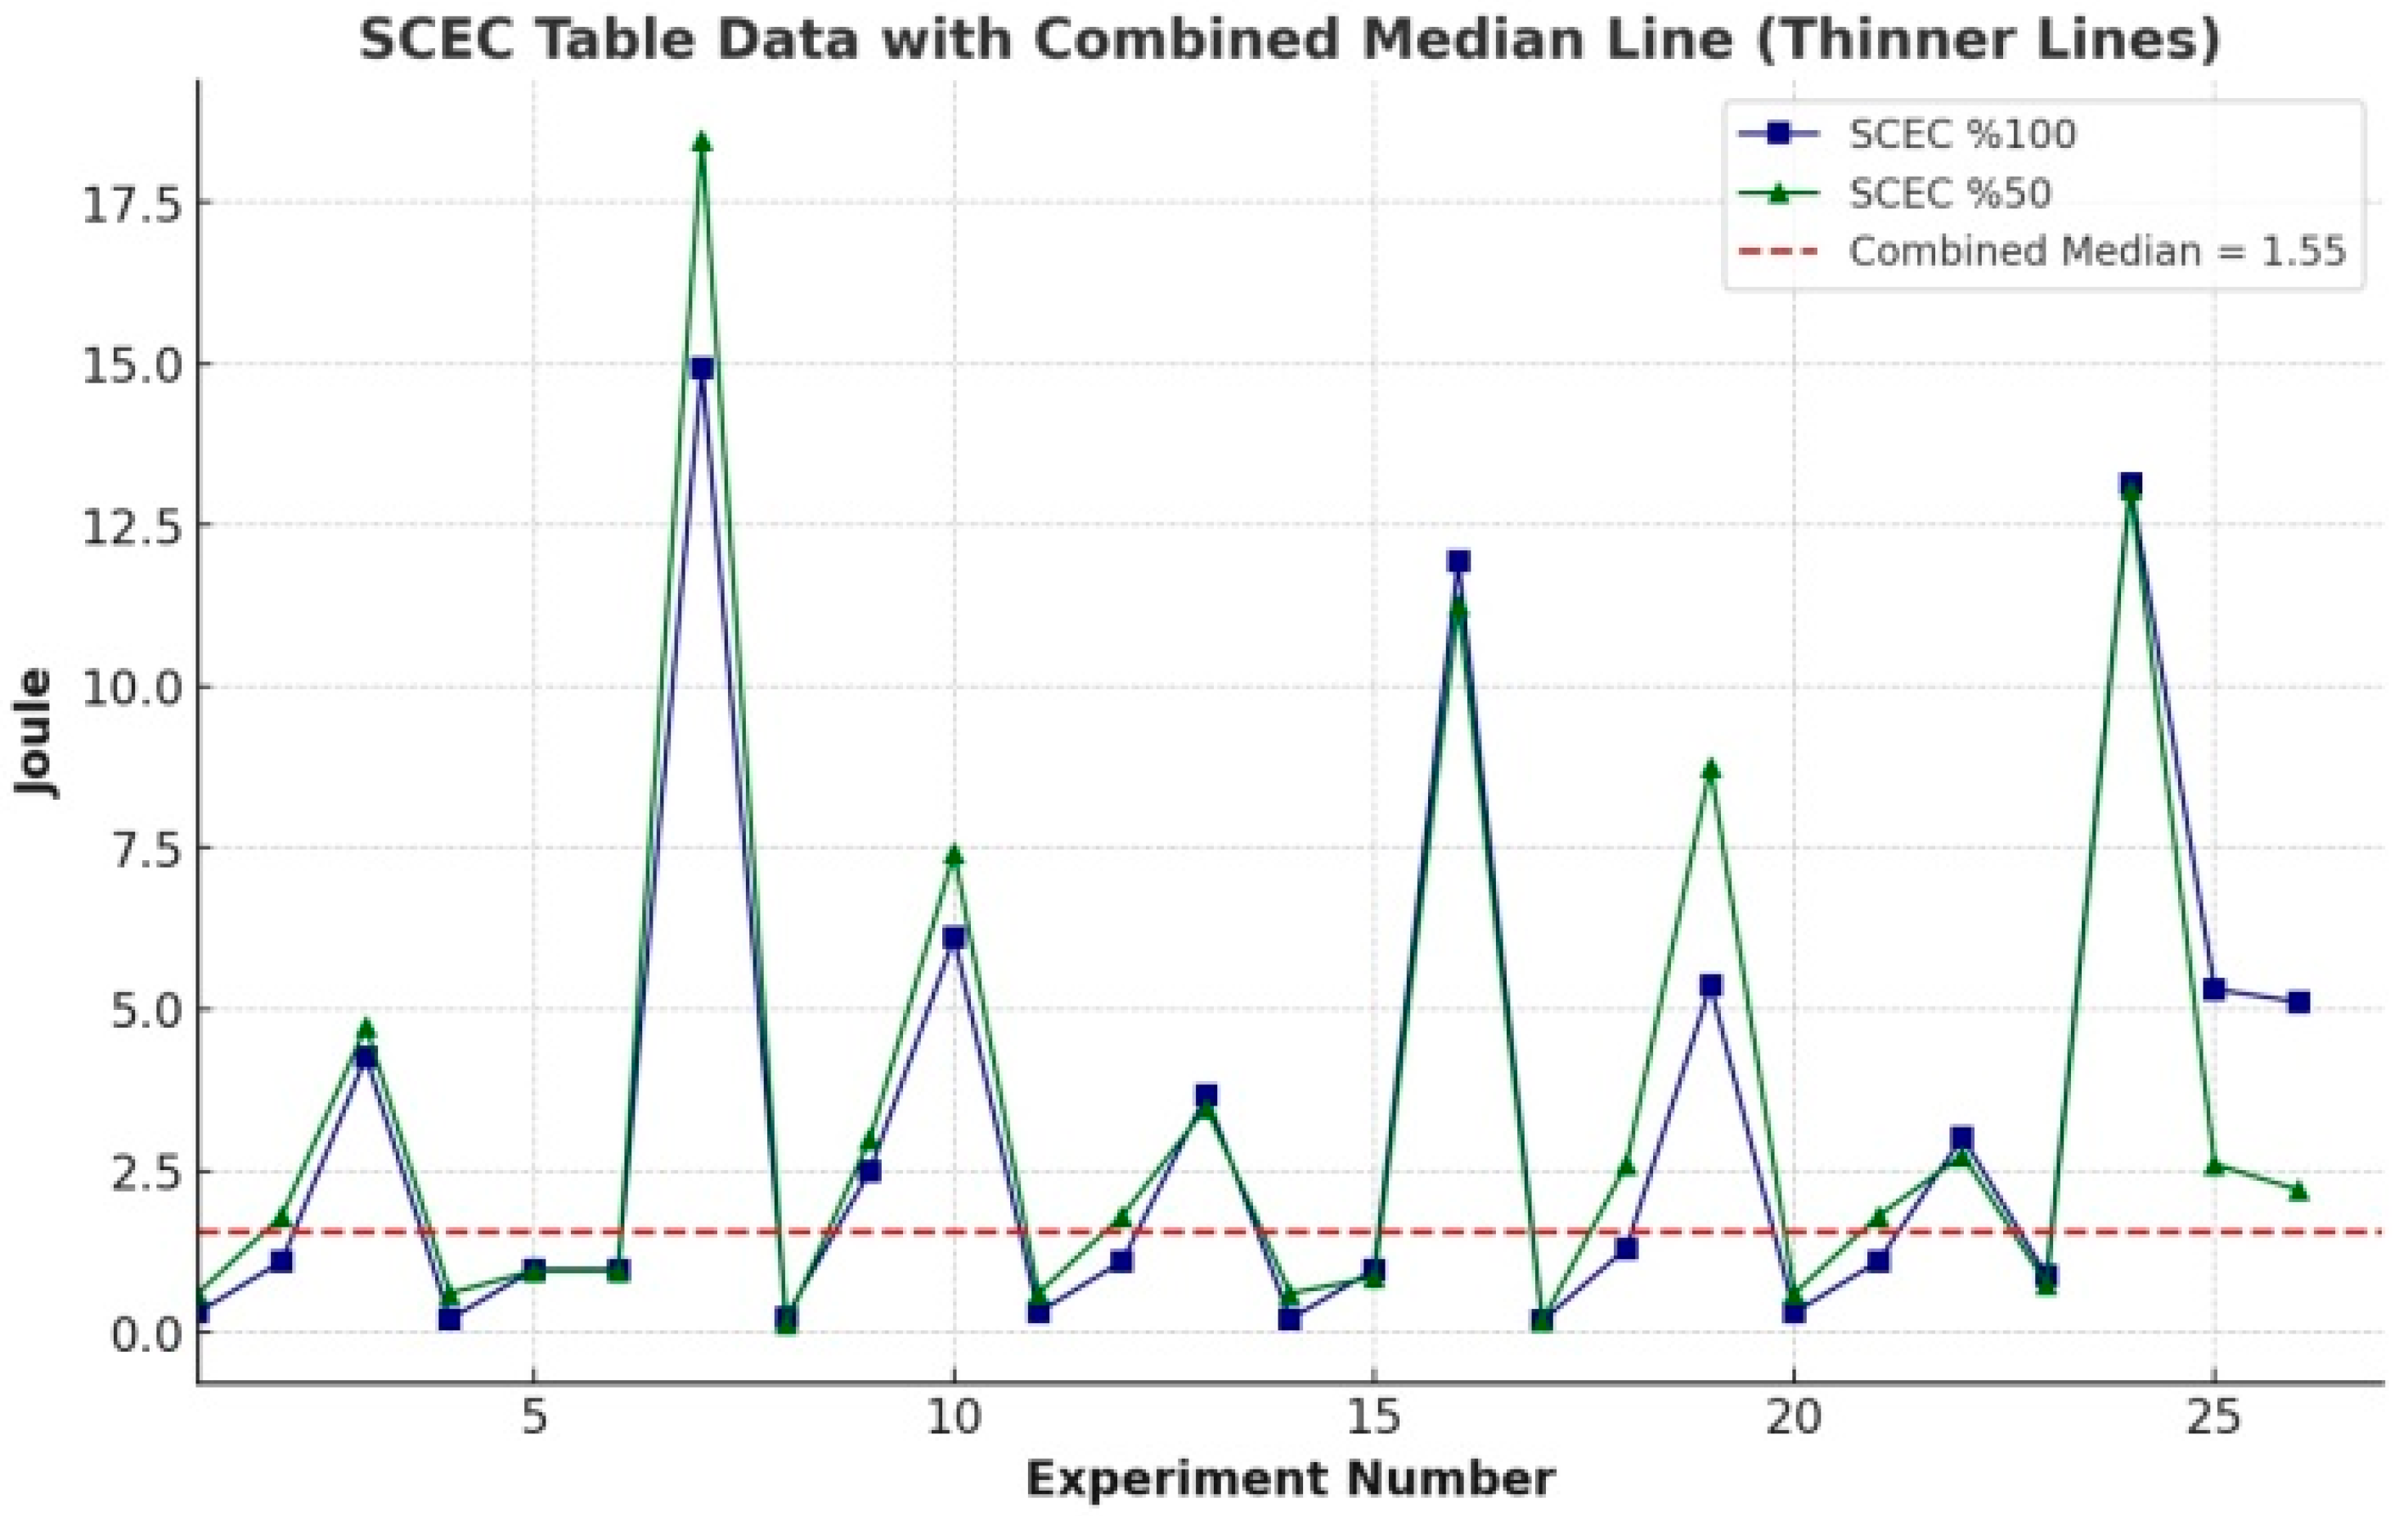
Figure 7 presents the experimental results to explain the variations in SEC and SCEC values. These data were analyzed considering different cutting speeds, feed rates, cutting depths, and material types. Notably, the effects of cutting speed and feed rate on energy consumption and efficiency were clearly demonstrated. When examining SEC values, it was observed that energy consumption is higher at lower cutting speeds. This indicates that machining at low speeds requires more energy, thereby reducing overall efficiency. On the other hand, an increase in feed rate generally leads to a decrease in SEC values, improving energy efficiency. This highlights the critical importance of selecting an optimal combination of feed rate and cutting speed for energy savings.
The analysis of SCEC values reveals that higher cutting speeds optimize energy consumption, whereas at lower feed rates, energy density tends to increase. Specifically, at a cutting speed of 150 m/s and a feed rate of 0.15 mm/s, the SCEC 100% and SCEC 50% values exhibit a more balanced distribution. These findings suggest that to enhance energy efficiency, a high cutting speed and a moderate feed rate should be preferred. When evaluating the impact of material type, the results indicate that energy consumption is directly related to the physical properties of the material. Among the tested materials, Material 2 demonstrated the lowest SEC and SCEC values, providing a significant advantage in terms of energy efficiency. In contrast, Materials 1 and 3 resulted in higher energy consumption, emphasizing the need for careful material selection to optimize machining efficiency.
For the 6061 alloy, optimum machining conditions yielded SEC-S = 7.545 J, SEC-X = 1.203 J, Pcutting-S = 7.108 W, and Pcutting-X = 23.643 W [
56]. For the 7075 alloy, the minimum SEC values were 8.82 W/mm
3 (spindle) and 1.58 W/mm
3 (
X-axis), with corresponding SCEC values of 0.25 W/mm
3 and 0.19 W/mm
3, respectively [
57]. Although these results were obtained under different experimental setups, the 8000 series alloy in the present study exhibited comparatively lower values, with SEC ranging from 1.20–1.45 J/mm
3 and SCEC between 0.14–0.22 J/mm
3 under its optimum cutting conditions. This indicates that, while cutting speed is the dominant factor for SEC in 6000 alloys and feed depth strongly influences SCEC in 7000 alloys, the 8000 series achieves superior energy efficiency largely due to its homogeneous microstructural distribution. Thus, the observed differences should be interpreted as indicative trends rather than direct one-to-one comparisons.
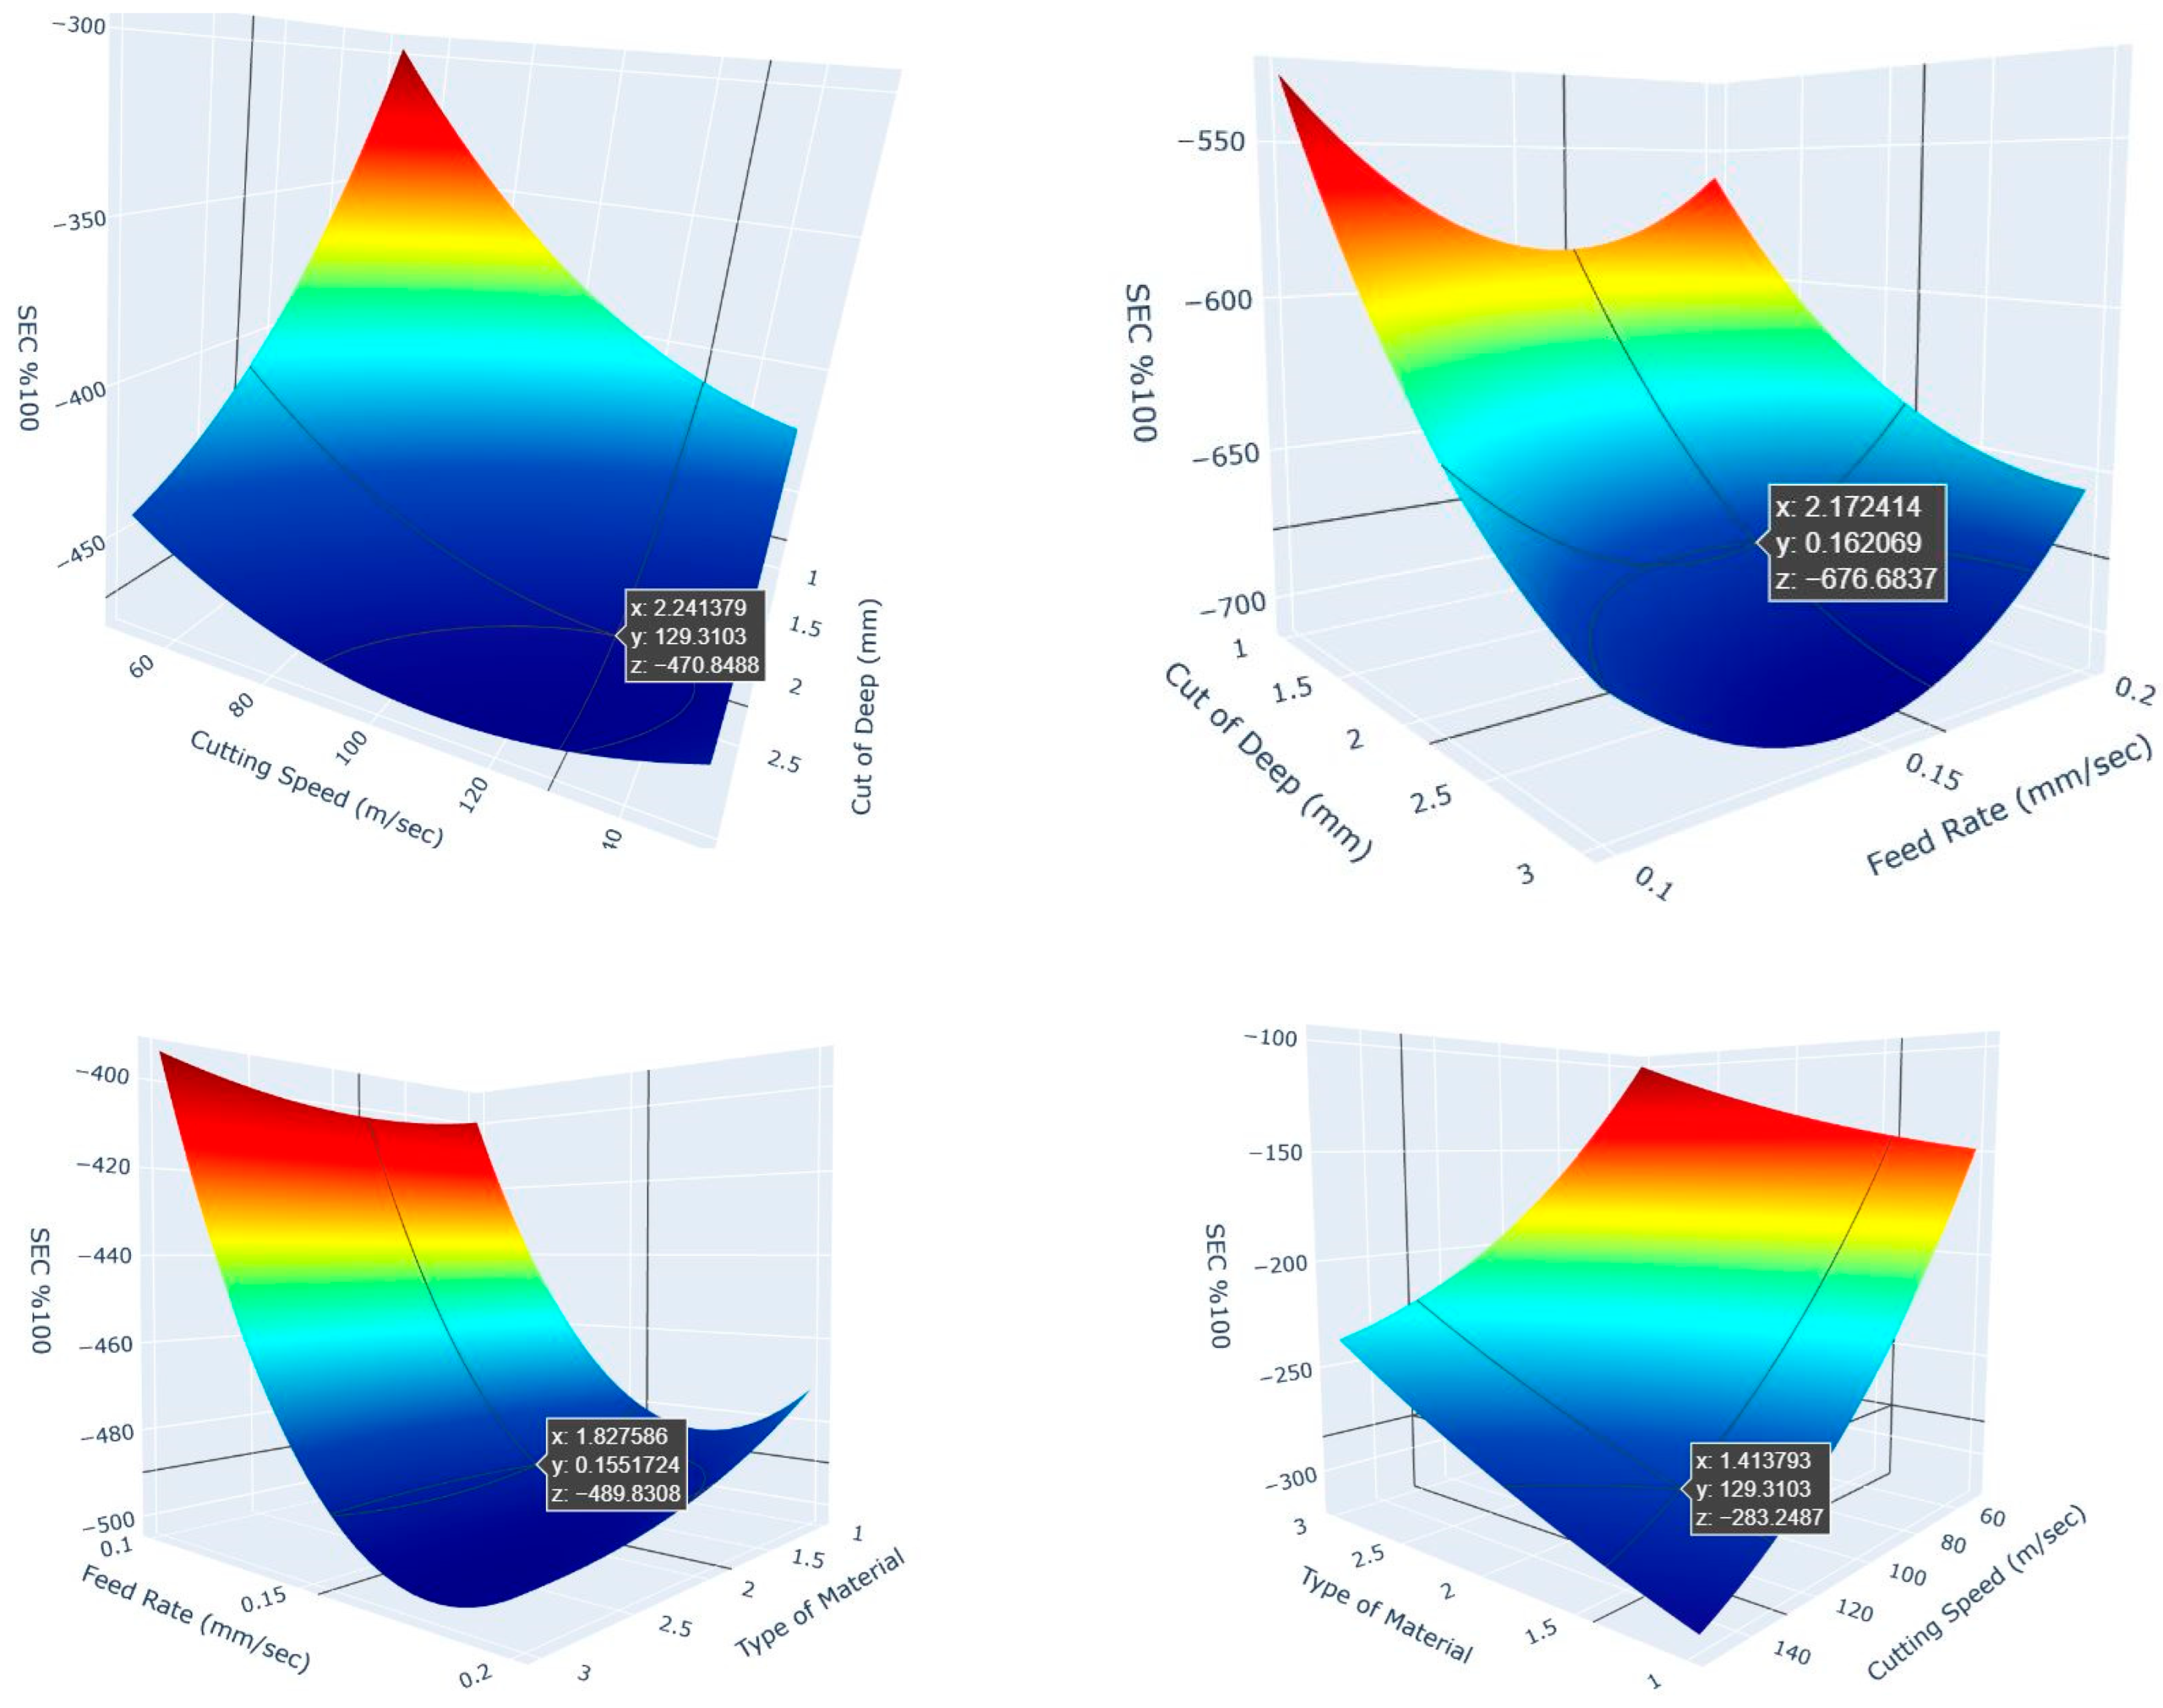
Figure 8 presents a 3D surface graph from the RSM analysis, illustrating the impact trends of cutting parameters on SEC and SCEC results. In this graph, which examines the effects of cutting depth and cutting speed on SEC (100%), it is observed that increasing the cutting depth significantly reduces energy consumption. This effect is particularly pronounced at lower cutting speeds, where the decrease follows a steeper trend. The primary reason behind this phenomenon is that deeper cuts shorten the machining time, thereby optimizing energy consumption. Similarly, increasing the cutting speed also leads to energy savings, but after a certain threshold, the reduction in energy consumption stabilizes. Hence, excessively high cutting speeds should be avoided.
Based on these findings, the optimal cutting depth should be between 2.5 and 3 mm, while the cutting speed should be maintained within the range of 100–120 m/s. These parameters help minimize energy consumption while enhancing machining efficiency. To prevent unnecessary energy expenditure, balanced speed levels should be preferred.
In the graph analyzing the effects of cutting depth and feed rate on SEC, a consistent decrease in energy consumption is observed as the cutting depth increases. Increasing the cutting depth from 1 mm to 3 mm optimizes energy consumption by shortening the machining time. However, the impact of feed rate exhibits a different trend; lower feed rates reduce SEC, while beyond 0.15 mm/s, energy consumption starts to rise again. This increase results from excessive feed rates compromising machining precision and leading to unnecessary energy usage.
The best results are achieved when the cutting depth is between 2.5–3 mm and the feed rate is within the range of 0.12–0.15 mm/s. Extremely low or high feed rates can increase energy consumption, thereby raising operational costs. Therefore, machining parameters must be carefully optimized. The graph depicting the influence of material type and feed rate on energy consumption reveals that material type has a strong impact on SEC. Type 1 material stands out with low energy consumption, whereas Type 3 material significantly increases SEC values. This disparity arises from differences in material hardness and machinability. Regarding feed rate, SEC values remain low within the 0.12–0.15 mm/s range; exceeding this range leads to an increase in energy consumption.
To maximize energy savings, Type 1 or Type 2 materials should be preferred. Additionally, maintaining the feed rate between 0.12 and 0.15 mm/s is crucial. Hard-to-machine materials and excessive feed rates can increase energy consumption, negatively impacting machining efficiency. Another graph examines the effects of material type and cutting speed on SEC. While an increase in cutting speed generally lowers SEC values, the extent of this reduction varies depending on the material type. Type 1 material responds rapidly to higher cutting speeds, significantly reducing energy consumption, whereas for Type 3 material, the reduction is more limited. This finding indicates that hard and difficult-to-machine materials require higher energy input.
Optimal machining conditions can be achieved by selecting Type 1 or Type 2 materials and maintaining the cutting speed between 100–130 m/s. Lower cutting speeds prolong machining time and increase energy consumption, making a balanced speed level essential. To optimize energy consumption and reduce operational costs, the following machining parameters should be maintained: Cutting depth: 2.5–3 mm, Cutting speed: 100–130 m/s, Feed rate: 0.12–0.15 mm/s. Material selection is also a key factor; Type 1 and Type 2 materials provide lower energy consumption, whereas Type 3 materials reduce energy efficiency. These analyses serve as a guideline for enhancing energy efficiency and improving productivity in manufacturing processes. Careful optimization of machining parameters can minimize environmental impact while offering economic benefits. Avoiding excessively low or high machining settings ensures a balanced and sustainable production approach.
Table 6 compares the final prediction evaluation metric scores of DT, AB, ET, and XGB algorithms for SEC%100 and SCEC%100 outputs. Based on the comparison of metrics scores, it is seen that DT and XGB algorithms outperform the other algorithms in terms of R
2 scores of 0.98634 and 0.96533 for SEC%100 and SCEC%100, respectively. The hyperparameters of the DT model were tuned as min_samples_split: 6, min_samples_leaf: 3, criterion: absolute_error, max_features: 2, min_impurity_decrease: 0.05, ccp_alpha: 0.1, while XGB model was n_estimators:10, learning_rate: 0.1, reg_alpha: 1.0, reg_lambda: 1.0, gamma: 0.5, subsample: 0.6, colsample_bytree: 0.5. DT and XGB algorithms can be more capable of reducing the error rate between predicted and original values and have more robust prediction accuracy than the other algorithms since both algorithms produce the highest R
2 score and the lowest, RMSE, MAE, and MSE scores.
When considering the R2 and MAE scores, it may be seen that the XGB algorithm, with an R2 score of 0.94779 and MAE score of 0.04785, and the ET algorithm, with an R2 score of 0.95684 and MAE score of 0.29238, ranked second best in prediction performance for SEC%100 and SCEC%100, respectively. In addition, the third-best prediction performances were achieved by the ET algorithm, with an R2 score of 0.87014 and MAE score of 0.05954, and the AB algorithm, with an R2 score of 0.95654 and MAE score of 0.29941, for SEC%100 and SCEC%100, respectively. On the other hand, the AB algorithm for SEC%100 and the DT algorithm for SCEC%100 showed the lowest prediction performance by producing R2 scores of 0.84361 and 0.95354, and MAE scores of 0.06644 and 0.13637, respectively.
To evaluate the metric scores, particularly those of SEC%100,
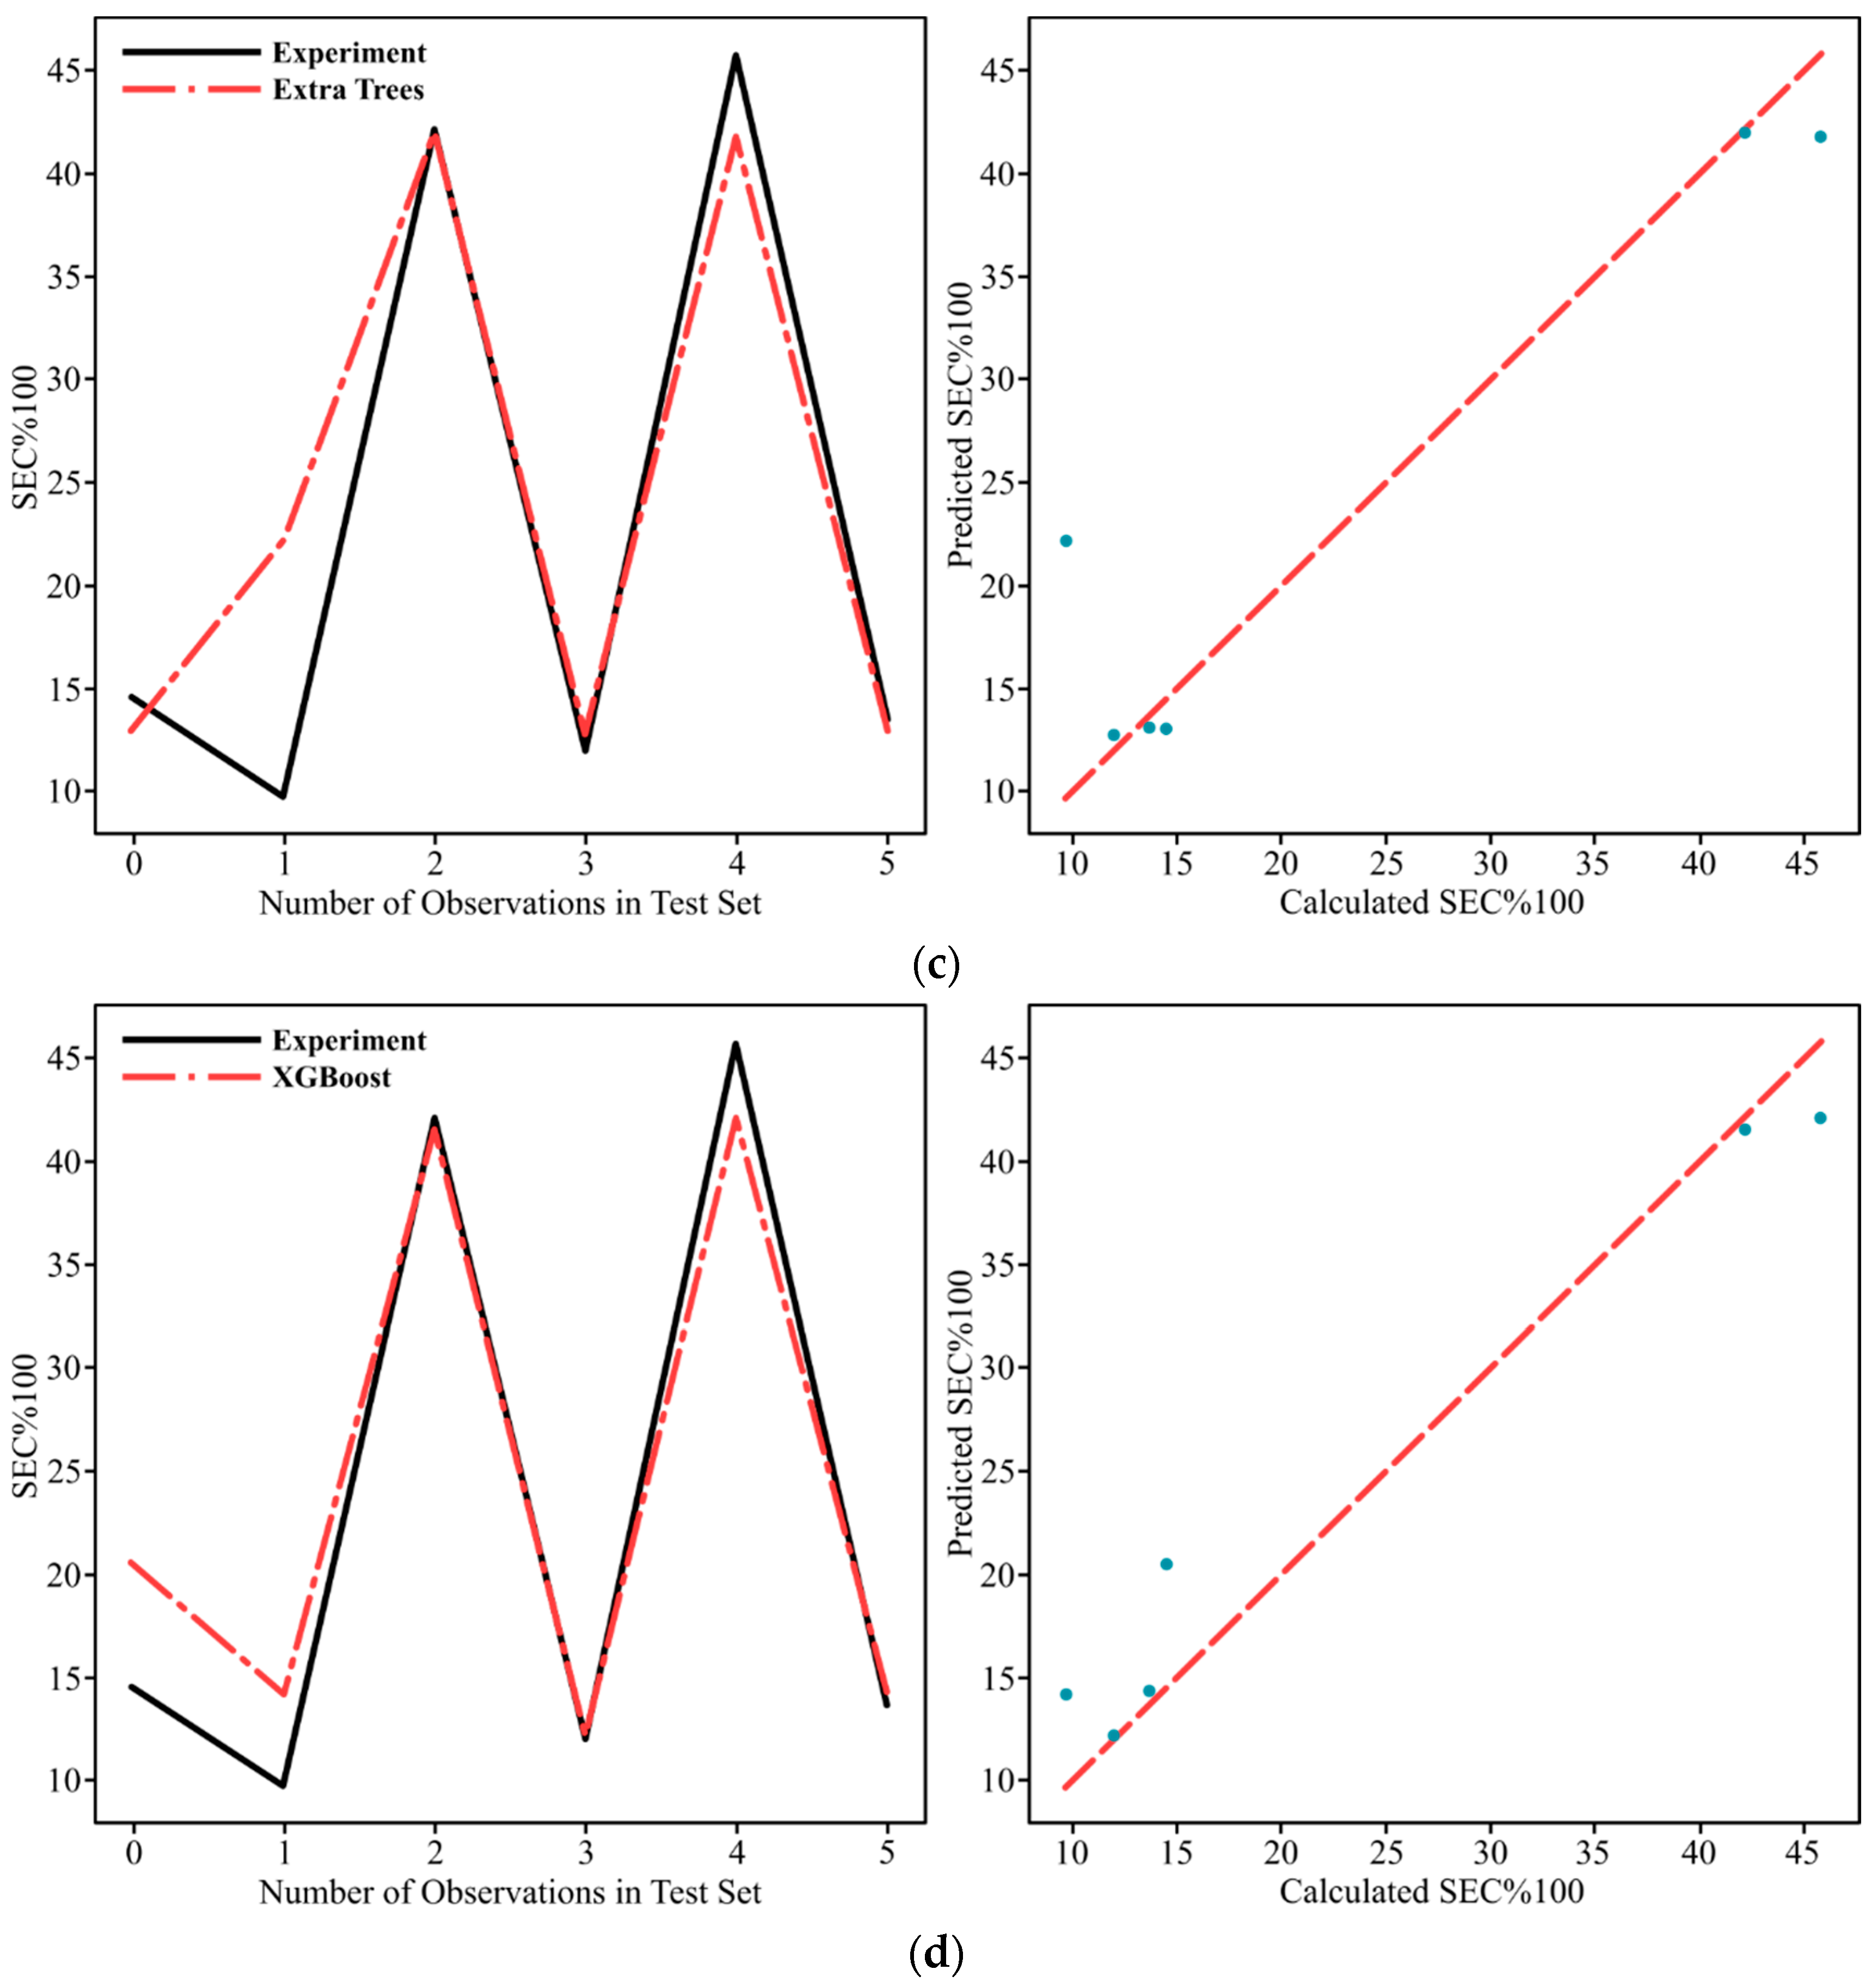
Figure 9 shows a comparison of the calculated and predicted SEC%100 using DT, AB, ET, and XGB algorithms. From
Figure 9a, it is seen that the data points of the DT algorithm, with the highest R
2 score of 0.98634, are ideally close to the regressed diagonal line and have fewer outliers that are still within an acceptable range around the line. This may be an indicator of the high accuracy and precise prediction capability of the DT algorithm for the present dataset. Balasuadhakar et al. [
52] highlighted that DT’s high prediction performance is derived from a sophisticated recursive feature partitioning property, which facilitates sophisticated computational traversal through intricate decision-making architectures. This approach enables decomposition of complex decision paths, yielding an efficient search strategy for parsing multi-dimensional decision spaces. In addition, the XGB model performed similarly to the DT algorithm, with the R
2 score difference between DT and XGB being 0.03855; however, the number of outliers of the XGB model was higher than that of the DT model, as seen in
Figure 9d. In addition, as seen in
Figure 9c, it is possible to mention that the ET algorithm did not fit the initial trend of the experimental curve because it had an outlier in the test set, which was far away from the regression line. Thus, this may have been caused by decreasing the R
2 score below 0.90 for the prediction of SEC%100 output. As seen in
Figure 9b, the AB algorithm has a high number of outliers that are not aligned with the regression lines, and therefore, it exhibited the lowest prediction performance for the present study by producing the lowest R
2 and the highest MAE scores.
In terms of the evaluation of the performance of ML models for SCEC%100,
Figure 10 shows the comparison of calculated and predicted SCEC%100 using DT, AB, ET, and XGB algorithms. From
Figure 10d, it was seen that the data points of the XGB algorithm, with the highest R
2 score of 0.96533, were close to the regressed diagonal line and had fewer outliers than other algorithms. This may show the higher prediction capability of XGB than other algorithms in terms of data point alignment on the diagonal line. Although the highest prediction capability was achieved by the XGB algorithm, the R
2 score differences between XGB and other algorithms were 0.01179, 0.00879, and 0.00849 for DT, AB, and ET, respectively. This can also be seen in the alignment of predicted data points on the regressed diagonal line, seen in
Figure 10a–c. Thus, it is possible to point out that ET, AB, and DT gave similar prediction performance within the acceptable prediction level for SCEC%100 in the present study.
In the overall performance evaluation of the presented machine learning models, it is possible to mention that DT, AB, ET, and XGB models have good prediction performance for both SEC%100 and SCEC%100 due to employing ensemble learning techniques by operating tree-based structures like decision-making. In the literature, it has been pointed out that ensemble learning with a tree-based structure improves the prediction capability in regression and classification tasks by dealing with the non-linear relationship between linear features [
58,
59,
60,
61]. Ganesh et al. [
62] proposed similar results, mentioning that the DT model is a valuable tool to search and capture trends and patterns by correlating the input variables and output variables. They predicted surface roughness value using the DT model by using input features as cooling conditions and cutting speeds, and they pointed out that DT has predictive capabilities that facilitate efficient resource management, enhancing the accuracy of parameter selection and optimizing resource utilization. In addition, Faroog et al. [
63] reported that the DT model has highly accurate predictions of power consumption in minimum quantity lubrication and nanofluids-based minimum quantity lubrication conditions using cutting speed, feed rate, depth of cut, and flow rate as instances, with the R
2 scores of 0.915 and 0.931, respectively. Additionally, Xie et al. [
64] demonstrated that the prediction of machine tool energy consumption using the XGB model produced a mean accuracy of 96.9% with an error of less than 4% for each prediction process. Our findings exhibited good agreement with their results. DT and XGB algorithms present better prediction performance than other algorithms because they determine complex non-linear patterns and interactions between features and outputs, and are less sensitive to outliers and noisier in the dataset. On the other hand, although AB and ET al algorithms also utilize tree-based structure, it is possible to mention that giving more weight to non-classified instances in subsequent trees by the AB algorithm and operating more randomness in feature selection and threshold splitting by the ET al algorithm potentially lead to lower accuracy. Furthermore, the sensitivity of the outliers and the possibility of noise in training can impact the performance of those models in terms of having lower R
2 scores than DT and XGB algorithms, which establish explicit decision criteria and rules depending on feature thresholds [
65].
In terms of comparison of the DT and XGB model performances for predicting SEC%100 and SCEC%100, respectively, from
Table 6, it is seen that the difference in
R2 scores was 2.101% despite using the same instances in the prediction process. This differing performance of DT and XGB models for SEC%100 and SCEC%100 outputs is thought to be related to the structure and complexity of the output variables within the dataset. Our analysis revealed that the SEC%100 values, which varied from 7.79 to 172.02, demonstrated relatively smooth, largely monotonic trends and dominant patterns that were highly correlated with the machining parameters and created more distinct discrete groups. For instance, the highest SEC%100 value of 172.02 consistently occurred at the lowest cutting speed and feed rate of 50 m/min and 0.100 mm/min, respectively, regardless of the material type. In contrast, SCEC%100 values, which ranged between 0.10 and 14.93, exhibited more complex and non-linear relationships with the same instances, and furthermore, the variations were more nuanced and appeared to result from interactions between cutting speed, feed rate, passes, and material type. Therefore, it is possible to mention that this
R2 score difference occurred because the DT model with a single tree approximation lacked the ability to capture such non-linear relationships between instances, stronger material dependency, and localized variations of SCEC%100. Additionally, the regularized ensemble nature of the XGB model leads to analyzing fine-grained and non-linear relations between instances by means of combining multiple trees with shrinkage and feature subsampling, which enhances the bias-variance trade-off on SCEC%100.
Shapley Additive Explanations (SHAP) is a powerful method used to assess feature importance in machine learning models in terms of providing both local and global explanations.
Figure 11 and
Figure 12 illustrate absolute mean SHAP values and global interpretation impacts of features on model output of DT and XGB models for SEC%100 and SCEC%100 prediction performances, respectively. The figures introduce the significance of individual features’ contribution to the final predictive modeling by giving the SHAP numerical output. In
Figure 11a and
Figure 12a, the features are placed on the vertical axes on the left side of the diagram, while the horizontal axes demonstrate the mean absolute SHAP values by representing the level of contribution as numerical output during the training process. In
Figure 11b and
Figure 12b, the horizontal axes reflect the impacts of the features in terms of negative or positive contributions. Feature values on the global interpretations are represented by red and blue colors, with greater values indicated by red and lower values signified by blue.
Regarding the prediction of SEC%100 using the DT model, from
Figure 11a, it is seen that the most significant contributor to the DT model prediction is the “Cutting Speed” feature, with the mean absolute SHAP value of +24.3. This reflects the critical role of the cutting speed feature in the determination of the performance outcomes in the machining process. Additionally, the “Passes” feature demonstrates a remarkable mean SHAP value of +18.24, showing the second most contributing feature to the DT performance. Likewise, the “Feed Rate” feature of +8.84 presents a meaningful contribution to the predictive output. In contrast, material.A, material.B, and material.C features, material types labeled as categorical features, produce considerably lower absolute mean SHAP values of +4.7, +0.09, and +0.01, respectively. These lower values demonstrate their minimal contribution to the prediction accuracy of the DT model for SEC%100 output.
Figure 11b presents the global interpretation of features for SEC%100 prediction with the DT model. The red and blue colors in the figure represent higher and lower feature values, respectively. It is seen that the “Cutting Speed” feature has higher feature values than other features, and this is another indicator that it is the most contributing feature to the DT model prediction for SEC%100. In addition, it is shown that the “Cutting Speed”, “Passes”, and “Feed Rate” features have higher feature values, with the negative impacts on the model output demonstrating that those features are inversely correlated with the SEC%100 output. Thus, it may be suggested that a decrease in the values of the “Cutting Speed”, “Passes”, and “Feed Rate” features leads to an increase in the SEC%100 prediction, or vice versa. In contrast, the number of lower feature values of the material A feature is greater than the number of higher values, and, therefore, it can be said that it has a lower impact on the final prediction performance of the DT model for SEC%100.
Considering the feature importance of the XGB model for the prediction of SCEC%100,
Figure 12a,b illustrate the absolute mean SHAP values and the impact of the features on the model’s prediction performance, respectively. As seen in
Figure 12a, the “Cutting Speed” feature is the predominant contributor to the model predictions, with the absolute mean SHAP value of +4.71. Similar to the DT model, this shows the importance of the “Cutting Speed” feature on the prediction performance and accuracy of the XGBoost model. In addition, the “Feed Rate” feature comes in second place with the absolute mean SHAP value of +1.82, and the “Passes” feature follows with the SHAP value of +0.81 by illustrating the measurable impact on the predicted outputs by the XGB model. Conversely, material.A, material.B, and material.C features exhibit significantly lower absolute mean SHAP values of +0.14, +0.04, and +0.04, respectively. This indicates that although material type and quality are relevant to the machining process, their impact on the prediction of SCEC%100 with the XGB model is far less important compared to machining parameters.
The global interpretation of features for SCEC%100 prediction with the XGB model is given in
Figure 12b by representing higher and lower feature values as red and blue colors, respectively. Prominently, it is seen that the “Cutting Speed” feature has significantly higher feature values than other features, indicating that it stands out as the most contributing feature to the XGB model for SCEC%100 prediction. In addition, higher SHAP values concentrated on the positive side of the horizontal axis indicate a positive correlation between the “Cutting Speed” feature and the SCEC%100 output. Afterwards, it is seen that the number of higher feature values of the “Feed Rate” and “Passes” features is greater than the number of lower feature values, thus demonstrating the high impact of those features on the SCEC%100 prediction with the XGB model, although the majority of higher feature values of the “Feed Rate” feature lie on the negative side of the horizontal axis. In contrast, feature values of material A, material B, and material C are predominantly located near the vertical reference axis with lower or negligible SHAP scores; therefore, it can be said that those features exhibit comparatively minor impacts on the XGB model for SCEC%100 prediction. In the overall evaluation of feature importance analysis for SEC%100 and SCEC%100 predictions with DT and XGB models, it can be said that the machining operational parameters, such as “Cutting Speed”, “Feed Rate”, and “Passes”, have a higher impact on the prediction accuracy and performance of the final predictive model than the material type feature.
In addition to absolute mean SHAP values and global interpretation impacts of features on model output of DT and XGB models for SEC%100 and SCEC%100 prediction performances, the feature interactions analysis was performed.
Figure 13 illustrates the SHAP feature interactions of the DT model for SEC%100 prediction in terms of a heatmap diagram and the top 10 feature interactions by importance. The scale bar on the right of
Figure 13a indicates the magnitude of feature interaction values from the lower to the top interaction values.
From
Figure 13, the strongest interaction was seen between passes and cutting speed features by the SHAP value of 13.542, presenting a robust synergistic feature interaction between these two machining operational parameters. This high feature interaction value demonstrates that the combined effect of passes and cutting speed on the prediction of SEC%100 using the DT model exceeds the individual contributions of those features. The interaction of cutting speed and feed rate features by the value of 4.204 represents the second most significant interaction, reflecting the established correlation and importance of machining operational parameters on the prediction of SEC%100 using the DT model. Additionally, in terms of the material property effect on the prediction of SEC%100, it is seen that the interactions of cutting speed-material.A and passes-material.A pair exhibited moderate feature interaction values of 2.824 and 2.723, respectively, while material.B and material.C features showed weak interactions. These values indicate the unique behavioral responses of material type A to machining operational parameters when compared to material types B and C. In addition, in terms of the evaluation of Fe content of 0.59% and Cu content of 0.59% for material type A, it can be deduced that this increased response to the machining operational parameters may be linked to the pure composition and low alloying properties, causing the more predictable and strong reactions to fluctuations in cutting speed and the number of passes. Regarding the composition of material types A, B, and C, it can be stated that feature interaction analysis of the DT model for SEC%100 prediction indicates an inverse relationship between interaction strength and alloying content, showing that higher iron concentration influences material response to machining parameters, likely due to improved work hardening and complex metallurgical interactions during cutting processes. The DT model primarily predicts the SEC%100 values through the passes–cutting speed relationship, with feed rate playing a second dominant interactive role. Then, the material composition significantly influences model behavior, with low-alloying materials exhibiting more predictable responses for SEC%100 compared to high-alloying materials because of microstructural differences. Furthermore, the symmetric nature of these feature interactions confirms the bidirectional interdependence between these parameters.
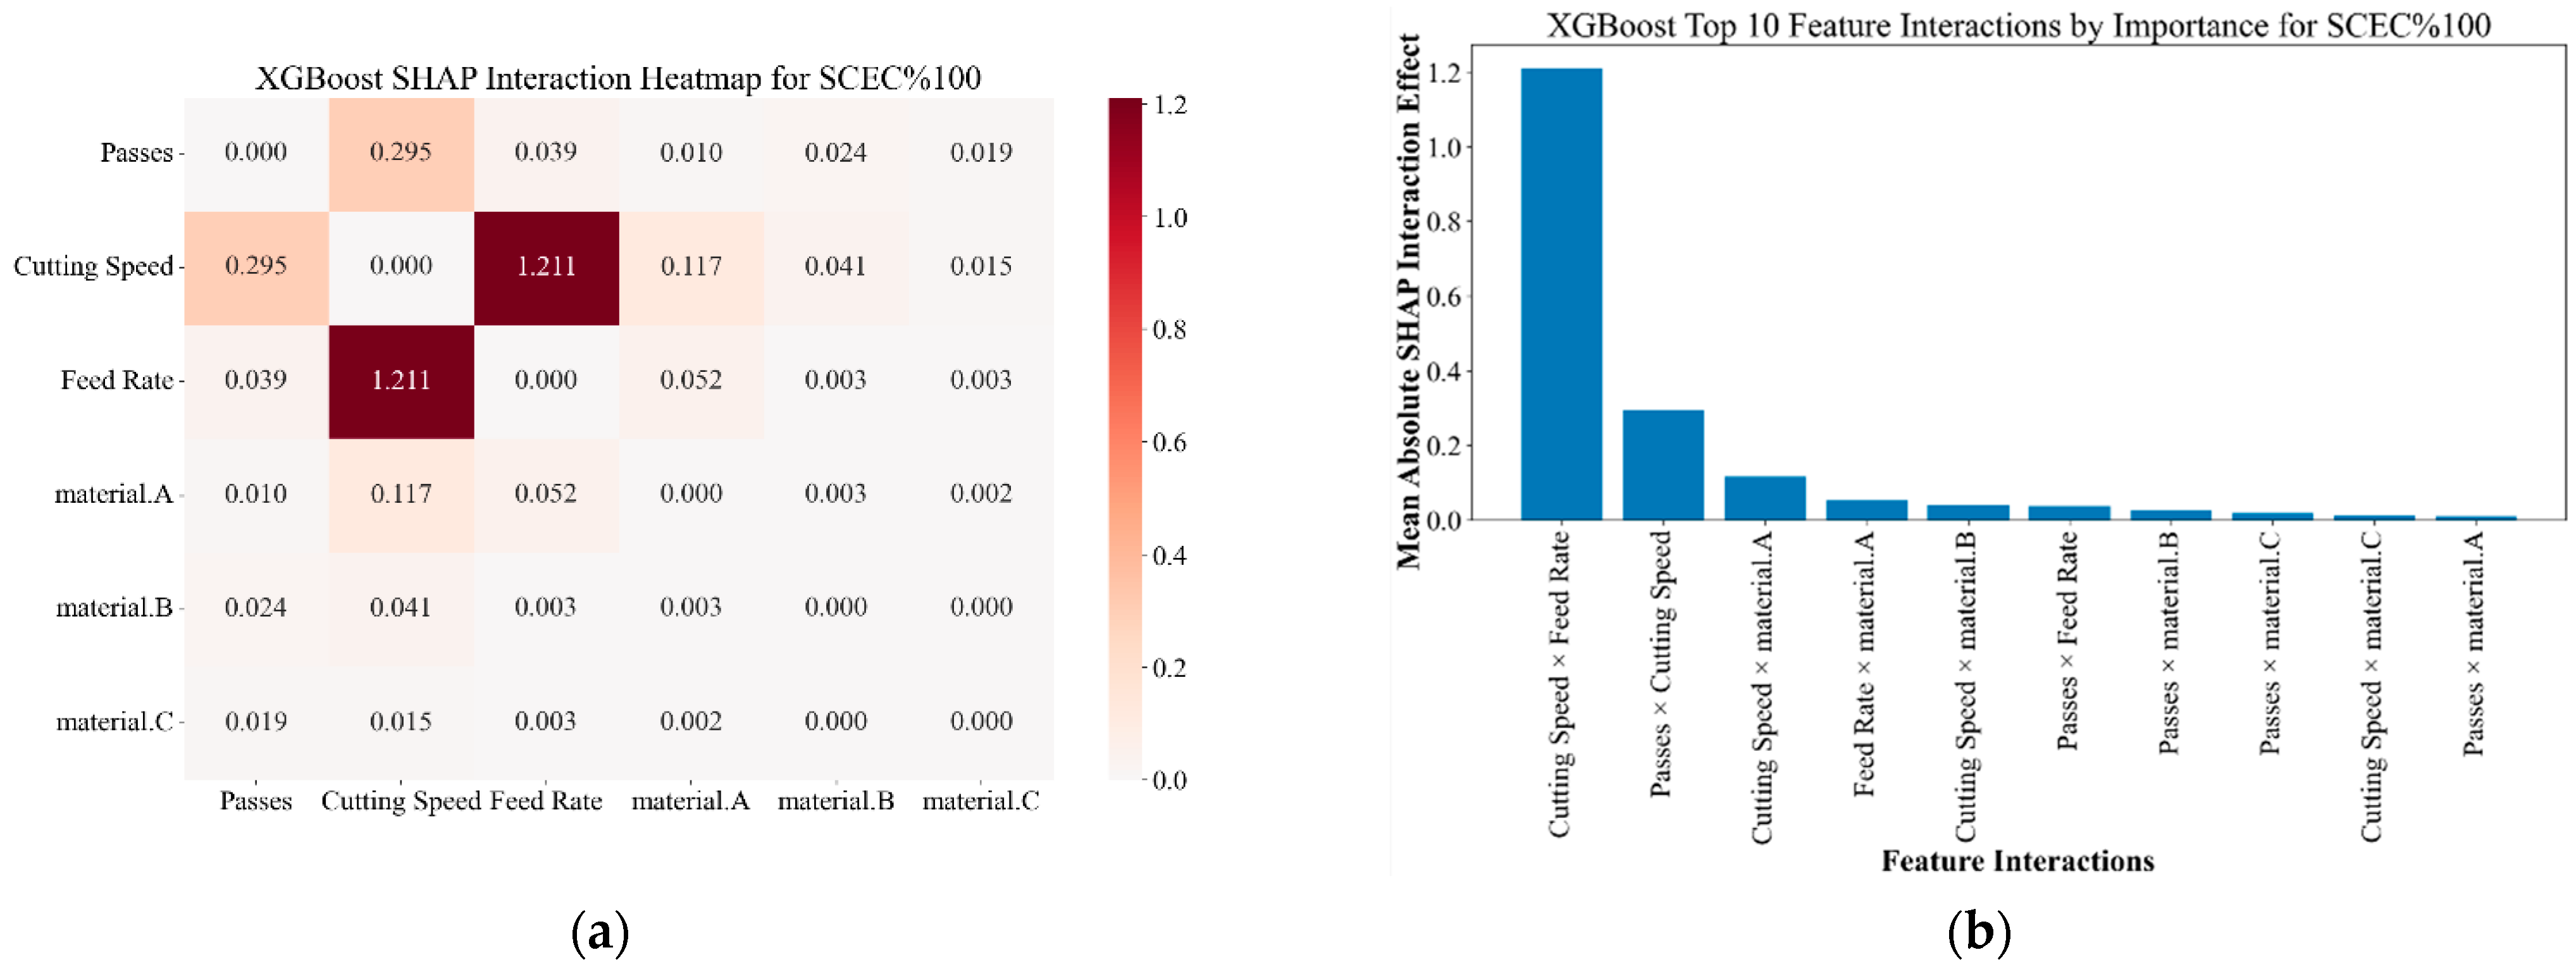
When considering the feature interaction analysis of the XGB model for SCEC%100 prediction, the SHAP feature interactions in a heatmap diagram and the top 10 feature interactions by importance are given in
Figure 14. The scale bar on the right of
Figure 14a indicates the magnitude of feature interaction values from the lower to the top interaction values.
In
Figure 14, the most dominant feature interaction was seen between cutting speed and feed rate features, with the value of 1.211, while the cutting speed and passes feature interaction ranked in second place, with the value of 0.295. This highest interaction value exemplifies the conventional machining operational relationship in which cutting speed and feed rate collectively influence the material removal rate and chip formation as well. Likewise, the highest feature interaction of cutting speed and feed rate demonstrates that the combined effect of the feature interactions on the prediction of SCEC%100 using the XGB model overlaps the individual contributions of those features. The second-highest feature interaction value of 0.295 between cutting speed and passes also indicates the importance of the machining operational parameters in predicting SCEC%100 with the XGB model. Moreover, in terms of the material property effect on the prediction of SCEC%100, it is seen that moderate feature interaction values of 0.117 and 0.052 occur between cutting speed–material.A and feed rate–material.A feature pairs, respectively, while weak interactions occur between passes–material.B and passes–material.C feature pairs with values of 0.024 and 0.019, respectively. These moderate interaction values of material.A reflect the unique behavioral responses of material type A to machining operational parameters in contrast to material types B and C. Furthermore, considering the Fe content of 0.59% and the Cu content of 0.59% in material type A, the DT model exhibits comparable outcomes. The enhanced sensitivity to machining parameters may be attributed to the material’s relatively pure composition and low alloying degree, which promote more consistent and robust responses to variations in cutting speed and the number of passes. In terms of evaluation of the composition of material types A, B, and C, it can be remarked that feature interaction analysis of the XGB model for SCEC%100 prediction indicates an inverse relationship between interaction strength and alloying content similar to DT model performance by showing that a higher iron concentration influences the material response to machining parameters, likely due to improved work hardening and complex metallurgical interactions during cutting processes. In contrast to the DT model, the XGB model initially predicts the SCEC%100 values by taking into account the cutting speed–feed rate relationship, with passes playing a second dominant interactive role. Afterwards, the material composition significantly influences model behavior, with low-alloying materials showing more predictable responses for SCEC%100 compared to high-alloying materials due to microstructural differences. Moreover, the symmetric nature of these feature interactions validates the bidirectional interdependence between these parameters.
When evaluating the DT model and the XGB model in terms of feature interaction analysis, it can be seen that the most notable difference between the DT model and the XGB model lies in the magnitude scales of interaction values. The DT model displays significant interaction values, with the passes-cutting speed interaction increasing up to 13.542, whereas the XGB model demonstrates more moderate interaction values with a maximum value of 1.211. This difference signifies a reduction in interaction strength of approximately 90%. The ensemble nature of the XGB model may be the reason for this strength reduction, as it distributes predictive power across multiple trees and reduces dependence on extreme feature combinations. Preventing extreme dependencies with the regularization capability of the XGB model and capturing more nuanced relationships with multiple weak learners could be classified as additional indicators. In terms of material composition effects, the DT and the XGB models exhibit consistent tendencies regarding the influence of material composition. Low-alloyed material composition (0.59% Fe and 0.59% Cu) shows the highest interaction values in the DT model and the XGB model. In contrast, higher Fe content correlates with reduced parameter sensitivity through both models. Additionally, the XGB model exhibits a 95% reduction in material feature interaction values compared to the DT model.


