4.1. Production Period Summary
Following the testing period, the data from both the traditional and digital performance management solutions were exported, cleaned, and analyzed. A total of 7051 parts were processed over the three-day production schedule (see
Table 3). Improvement efforts between testing days resulted in a 36.6% increase in parts produced on the last day as compared to the first. The overall quality of parts processed was 99.53% good product.
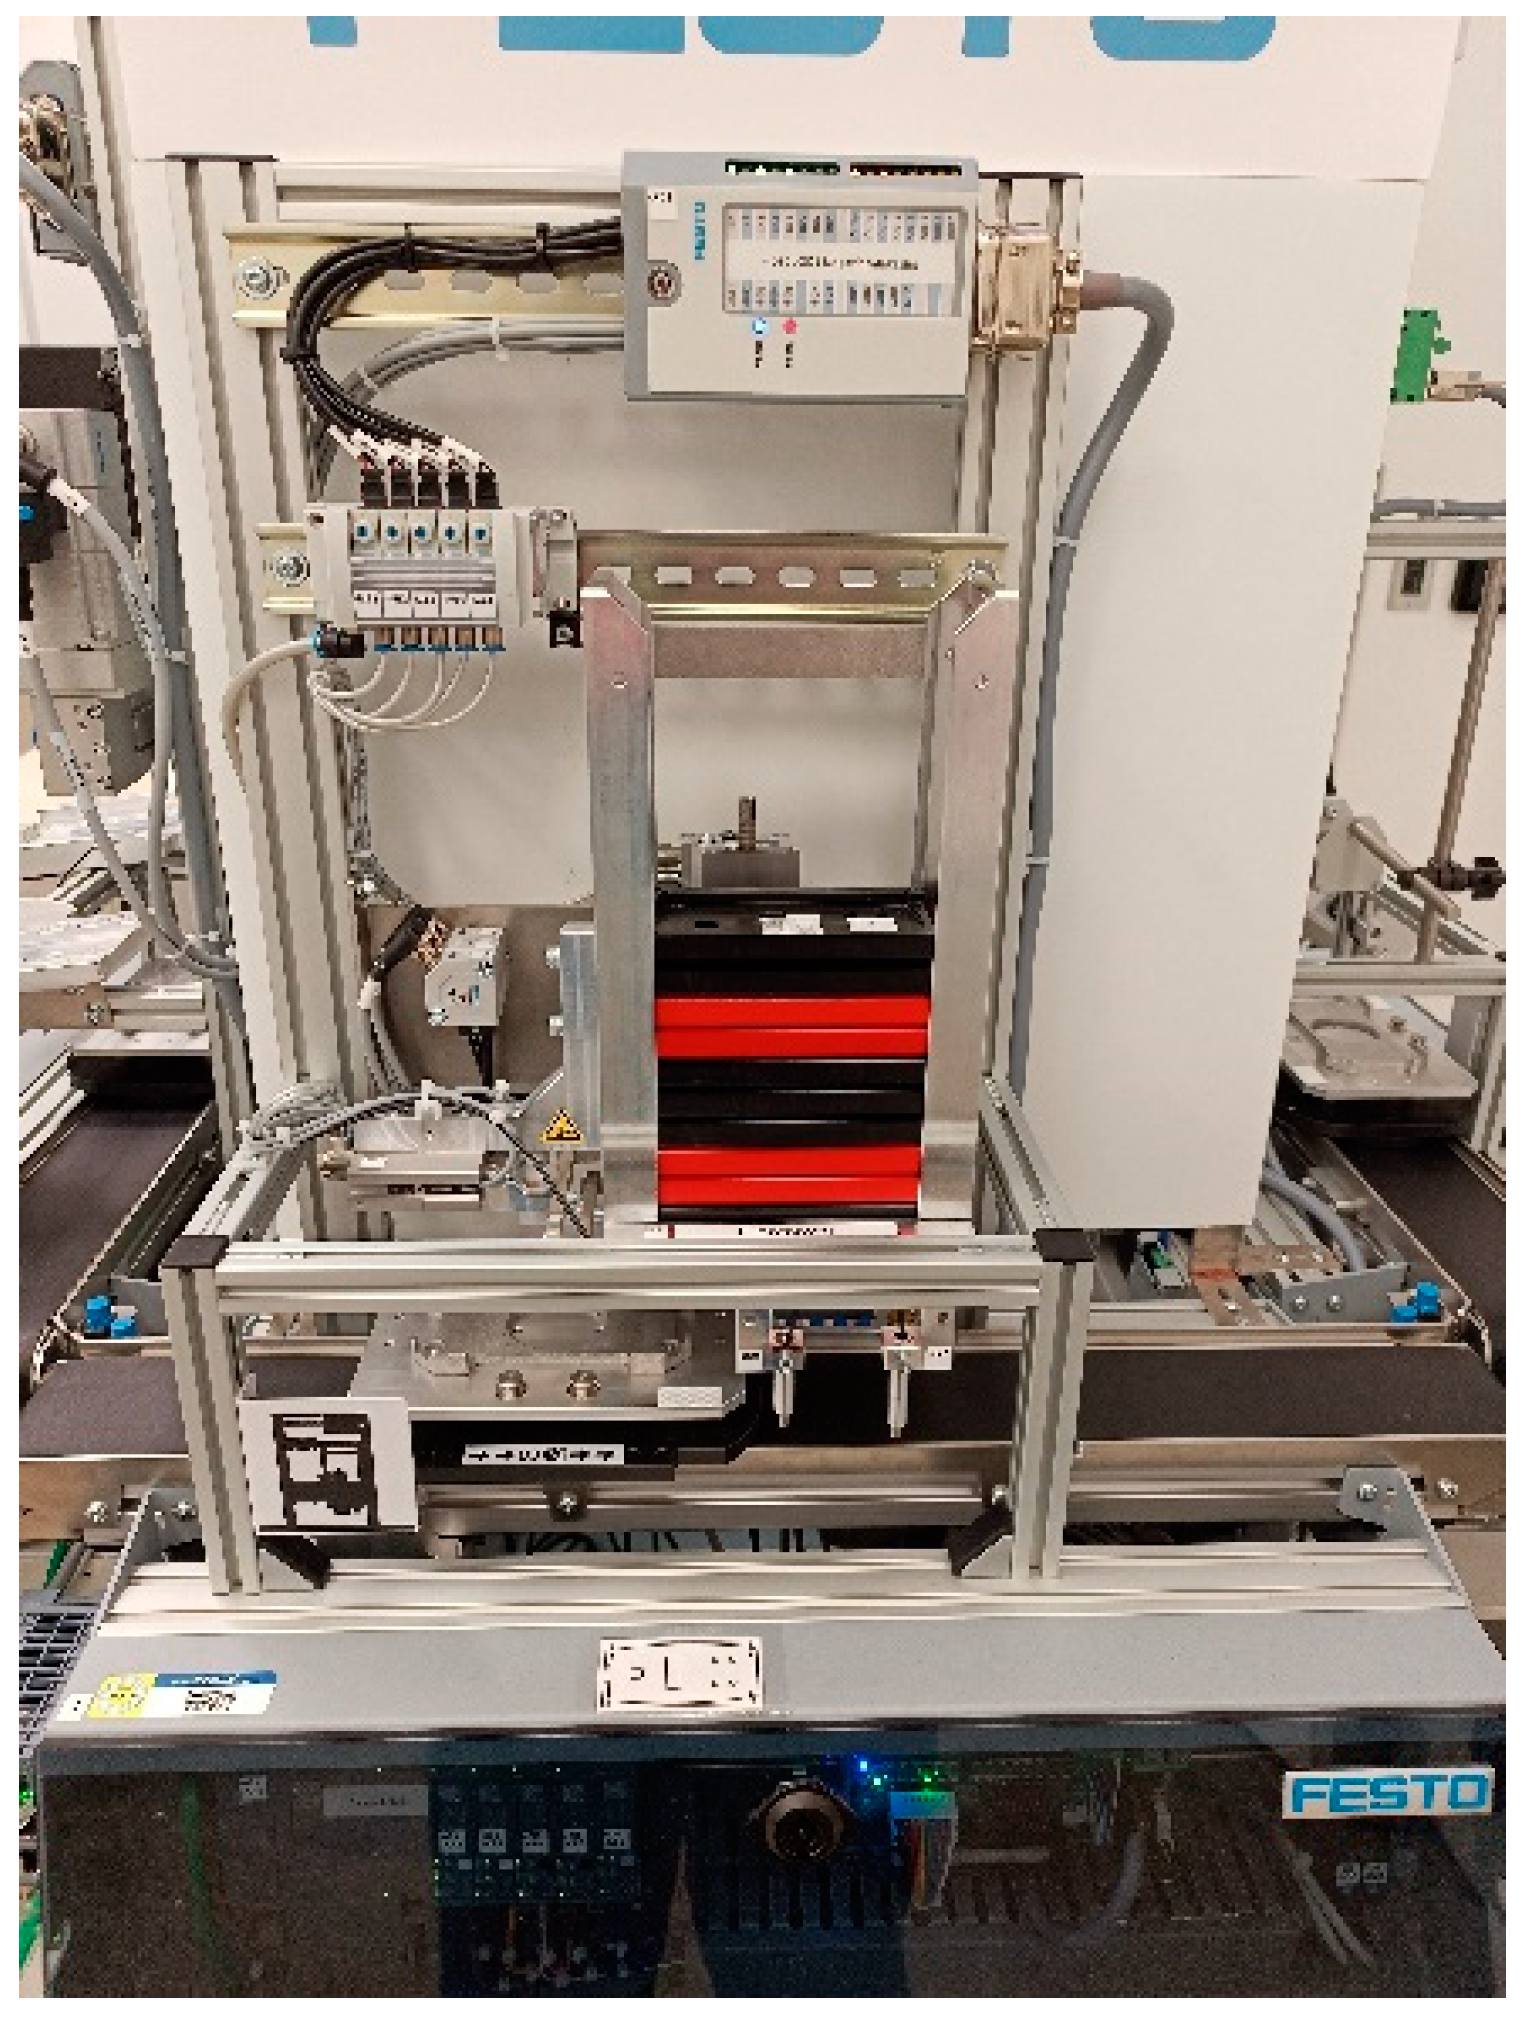
A machine breakdown occurred late on the second day of the test, resulting in a drop in production on that day. This machine failure occurred in the magazine module’s part isolation system, which had experienced occasional errors at the end of the first day and in the early hours of the second day. At six hours into the shift (14:00 h of production), the part isolation system began to detrimentally misbehave, failing to drop parts correctly and jamming frequently. Within a few minutes, the pneumatically actuated inlay strips had seized and would no longer release a part without manual assistance. Galling between the upper set of inlay strips and their housing was determined to be the cause of the issue and was remedied with appropriate application of machine grease. The problem identification, partial disassembly, lubrication, and reassembly of the system resulted in 73 min of unplanned downtime for maintenance. The downtime duration recorded at each station differed slightly due to other automatically reported loss statuses (i.e., emergency stop, conveyor output jam) caused by the maintenance being performed. Another seven minutes of unplanned maintenance occurred on the third production day to remove excess grease that had begun to leak onto the parts being released and inhibit their transfer onto the part carriers.
As guided by the in-process data being received from the performance management solutions, improvement efforts were undertaken between testing phases. These improvements took place at the bottleneck process identified by the performance management systems. Improvements focused on reducing the cycle time of the production-limiting station, utilizing the available changeable parameters identified in
Table 1.
At the end of the first testing phase, both traditional and digital performance management solutions showed that the drilling module acted as the system bottleneck. To decrease the cycle time at that station, the drilling operation parameter was changed from the default of drilling both hole sets to just drilling the left set. This removed the horizontal traversal of the drills and reduced the cycle time from 10.9 s to 4.9 s. In a real production environment, this would be akin to adding another set of drills to machine all four corner holes at the same time. In addition, the pneumatic pressure of the system was raised from the default 5 Bar to 6 Bar. This pressure increase was taken in reaction to the errors seen at the end of the first day on the magazine module and increase the consistency of that process. Changing the pneumatic pressure had a negligible effect on ideal cycle times.
At the end of the second testing phase, both performance management solutions agreed that the output module had become the bottleneck process. To alleviate this station’s restriction on production, the gripper horizontal motor speed was increased from the default 60 mm/s to the maximum 800 mm/s. This new speed should not be reached in normal operation as a limited acceleration rate would require the full stroke length of the horizontal axis to achieve that speed. However, this new setting raised the achievable speed of a normal half stroke operation between the center and an output tray to over 300 mm/s and decreased the cycle time from 10.1 s to 6.6 s, as shown in
Table 4.
4.2. Traditional Performance Management
Reviewing the testing results from a traditional performance management solution can be done in three layers of increasing detail. The first of these is the OEE metric, followed by the component measures (availability, performance efficiency, and quality rate), and lastly, the constituent data that forms the component measures. At the beginning of each day, the data used in the calculations were reset, allowing for the individual days to be measured independent of each other. The ideal cycle time was also updated for the drilling and output modules as improvements were made to them between phases.
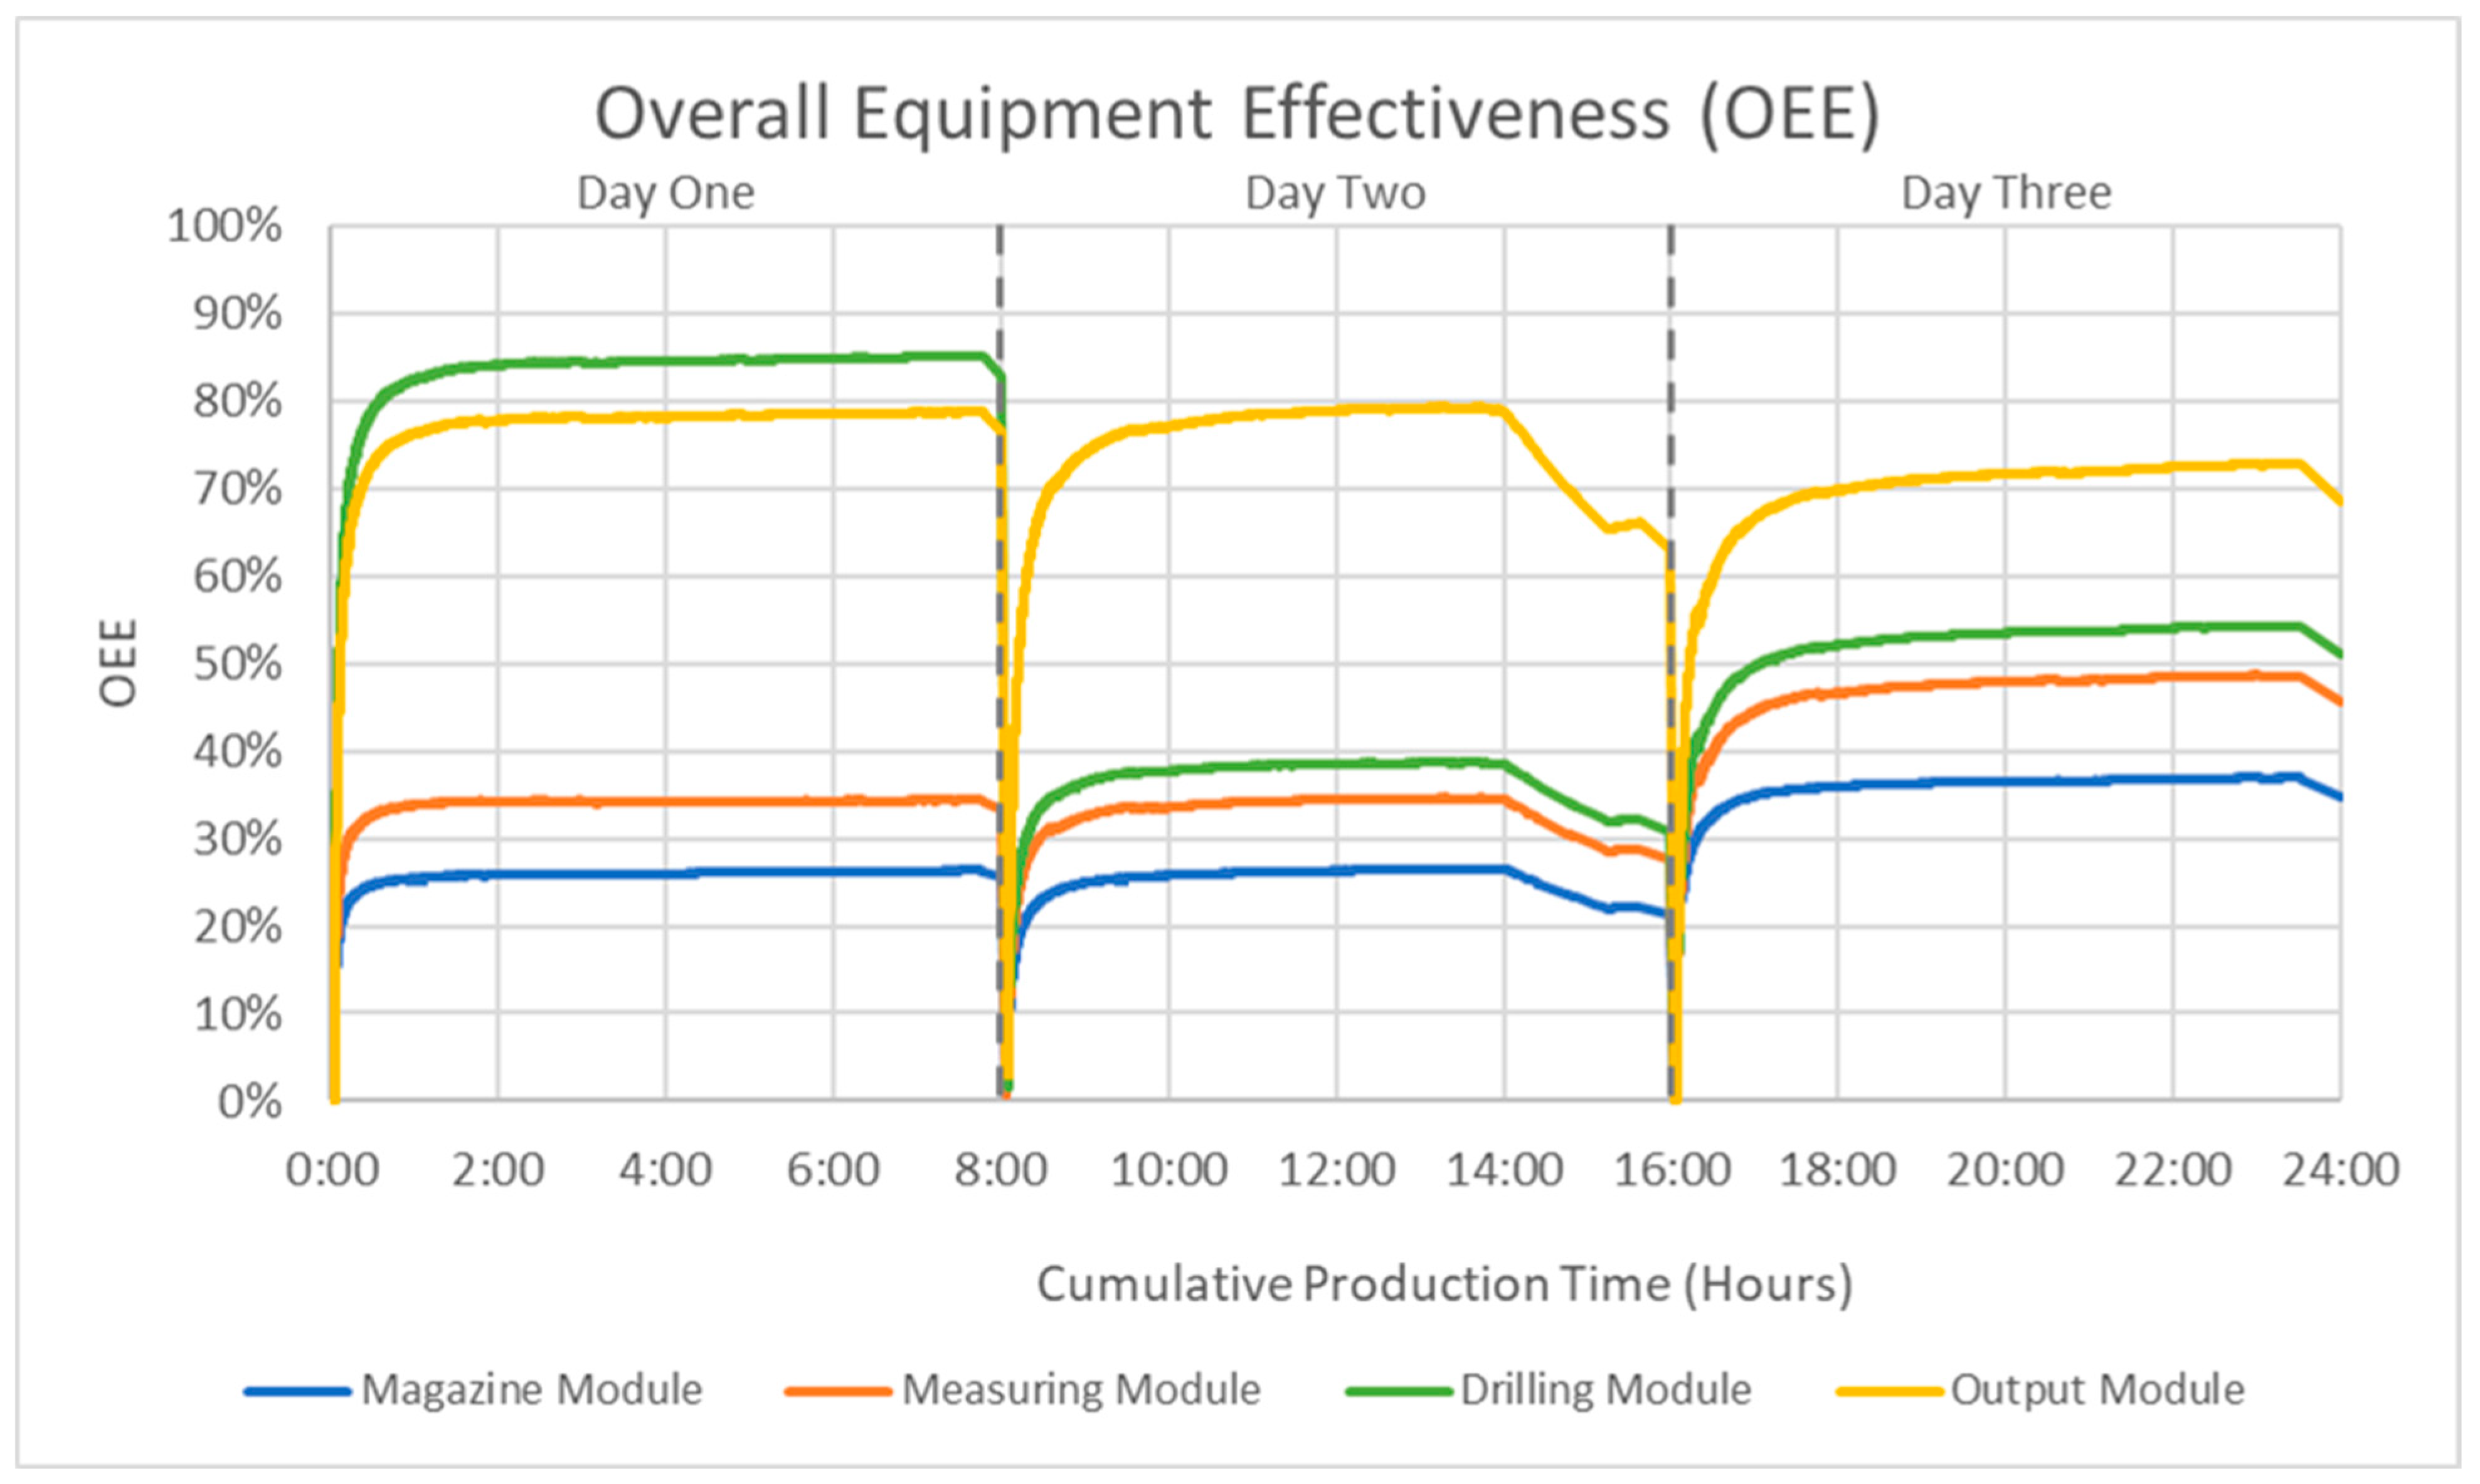
The OEE metric for the testing data is shown in
Figure 8 on the vertical axis with cumulative production hours on the horizontal axis. The drilling and output modules can be identified as the bottlenecks due to their being the greatest OEE during a given day. This correlation between greatest OEE and bottleneck processes is due to the nature of the system. The FCPL has a limited number of part carriers and does not create excess inventory between stations, meaning faster modules cannot operate at a pace greater than the bottleneck process cycle time. The high OEE to bottleneck relation is also inherent to lean balanced production lines for similar reasons, as maximizing OEE for non-bottleneck processes creates surplus work in progress inventory.
Over the course of the three-day testing period, both the bottleneck OEE and average OEE decreased despite a significant increase in the number of parts produced. Additionally, the OEE of the output module on day one was very near that of the drilling module bottleneck, explaining the lack of increased production rate the following day where the output module became the bottleneck. The effect of the unplanned downtime maintenance event is apparent from the negative slopes beginning at 14:00 h of production. Day three showed an increase in OEE for all stations except the output module, which decreased from the first day’s 76.6% to 68.5%, while production between these two days increased by over one-third.
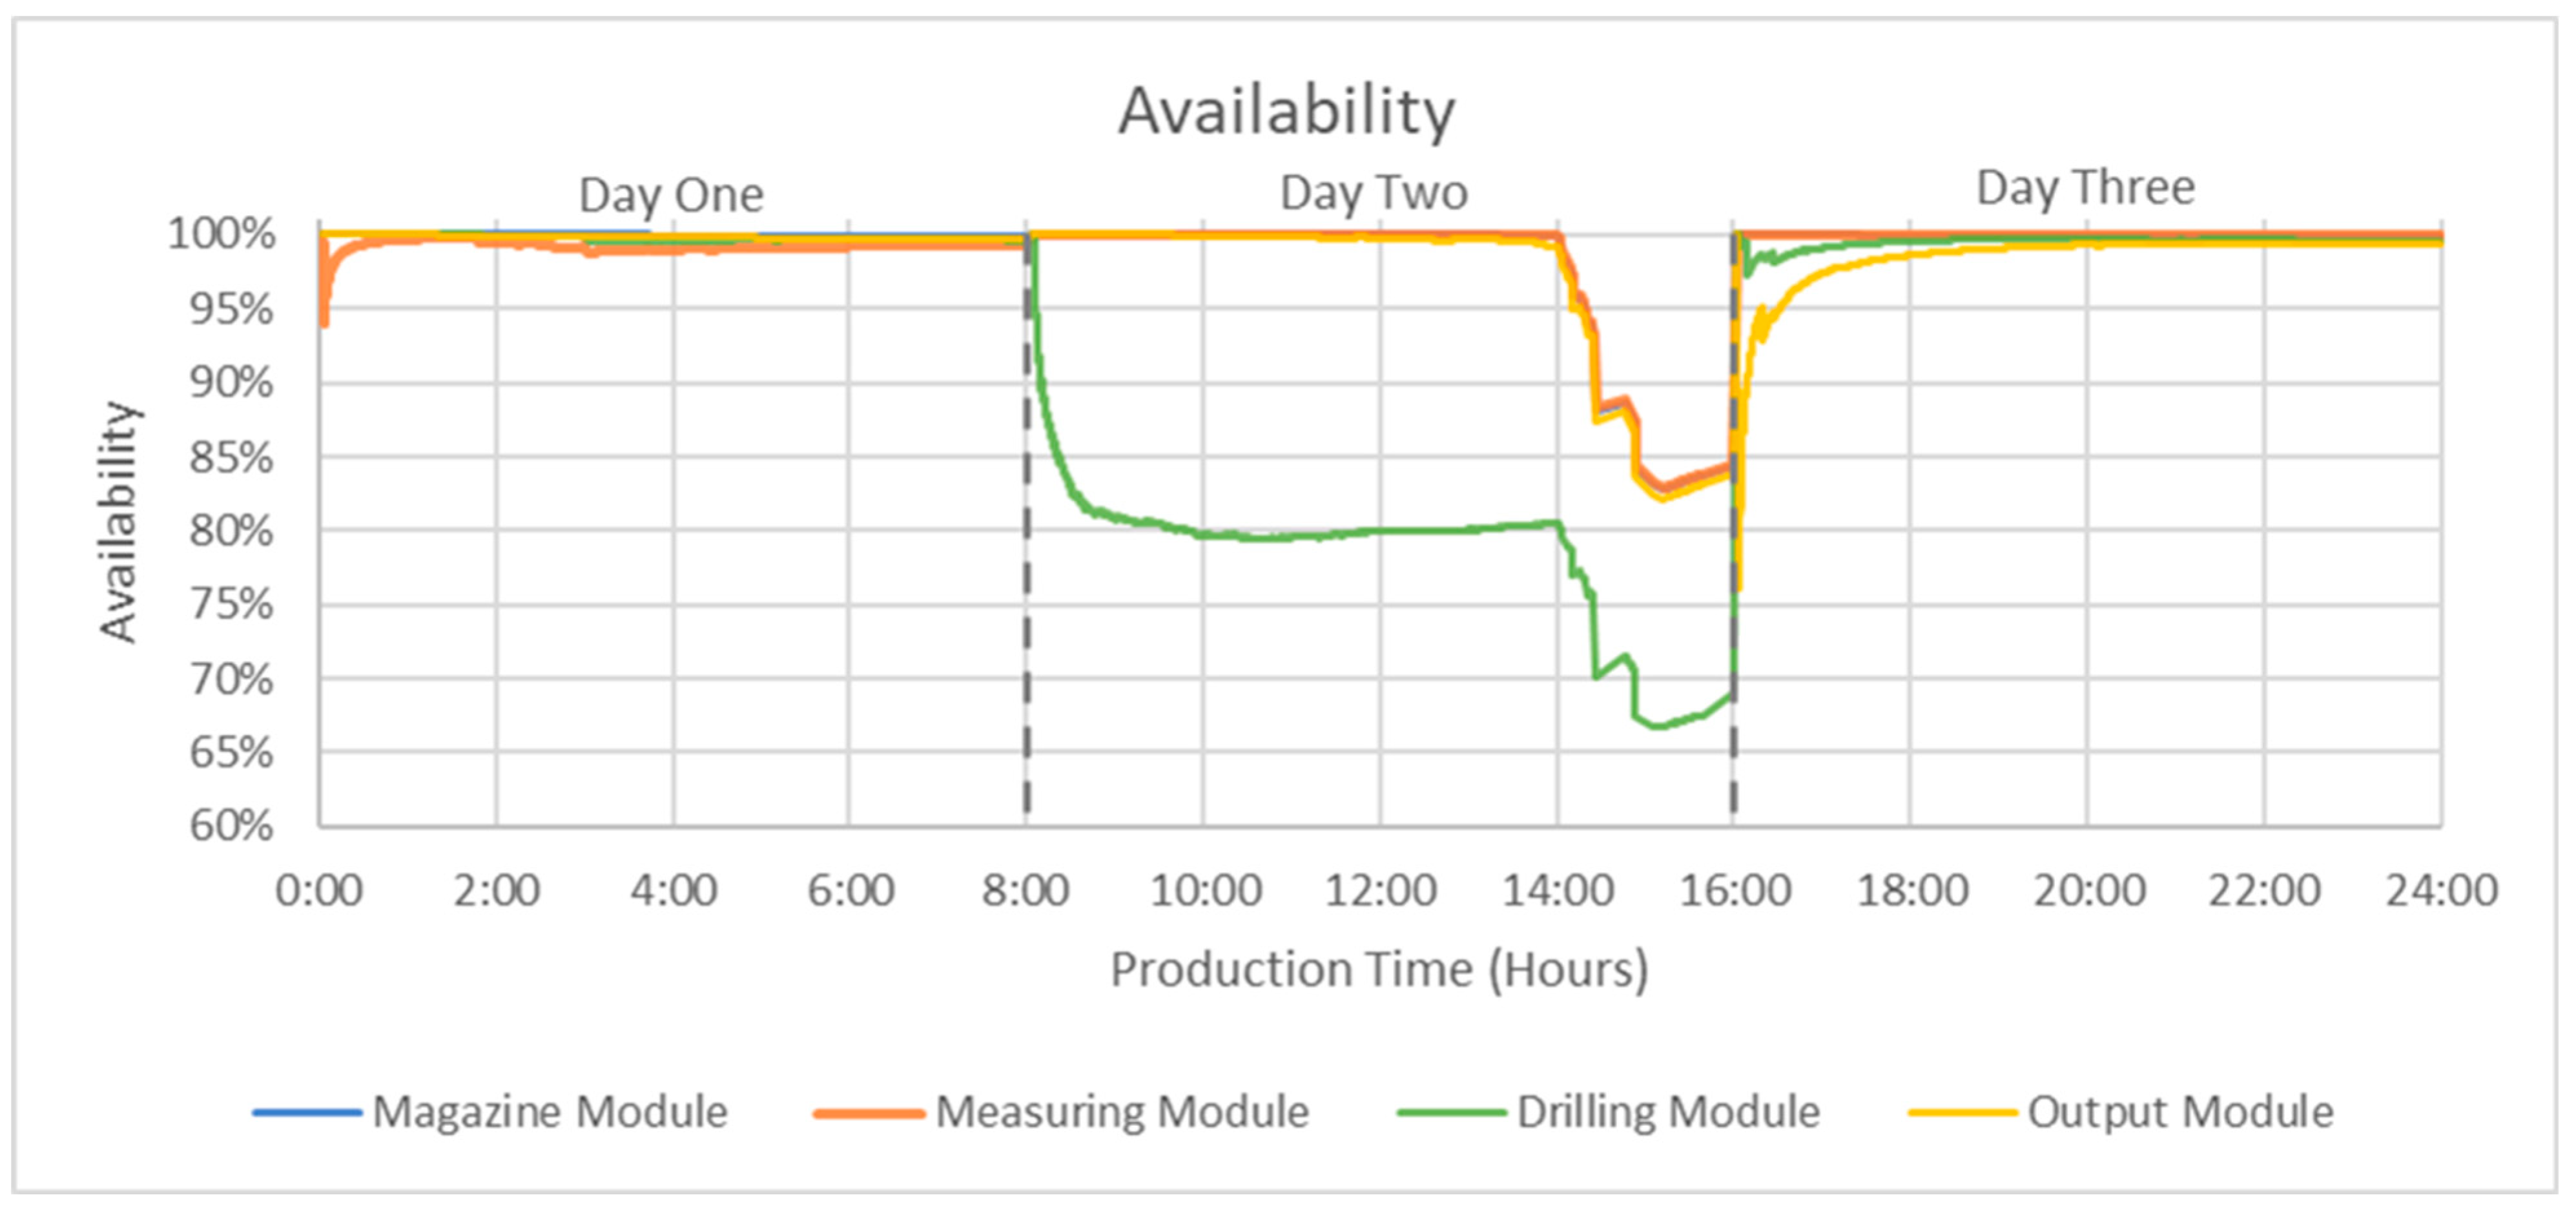
Breaking OEE into its component parts should yield further insight regarding the trends seen in the parent measure. A plot of availability, shown in
Figure 9, displays the ratio of operating time, or uptime, to planned production time (see Equation (2)). As such, the unplanned maintenance downtime on day two was readily apparent, creating a large drop in availability roughly between 14:00 and 15:15 production hours. Outside of this event, there were two notable exceptions to the general trend of near 100% availability: the obvious drop in availability at the drilling module during day two, and the low starting points of the measuring and output modules on days one and three, respectively. The latter anomalies were due to short periods of downtime early in the shift, lowering the availability ratio immediately but approaching normalcy as more uptime accrued during the day. The drilling module availability drop was also due to downtime, though it did not recover and stabilized around 80% availability. The reasons for this trend will be examined further when investigating availability’s constituent data. Other than the noted exceptions, availability stayed near 100% and had only a minor impact on OEE.
A plot of performance efficiency, shown in
Figure 10, can be summarized as the ratio between the ideal effective production time, representative of producing at the ideal cycle time, and operating time. Some noise was present in the data during the unplanned maintenance downtime period due to errant signals during maintenance. The similarity between performance efficiency and OEE in the data shows the former to be the driving component of the latter, and thus, many of the observations regarding OEE apply to performance efficiency as well. This includes the decrease in the metric at the bottleneck process despite an increase in units produced. Notable here, however, is the tightening range of the performance efficiency and OEE values between stations. This trend is indicative of the smaller range of the cycle times between stations that occurred because of the improvements made, resulting in less backup at the bottleneck station and less idle time waiting for carriages at the non-bottleneck stations.
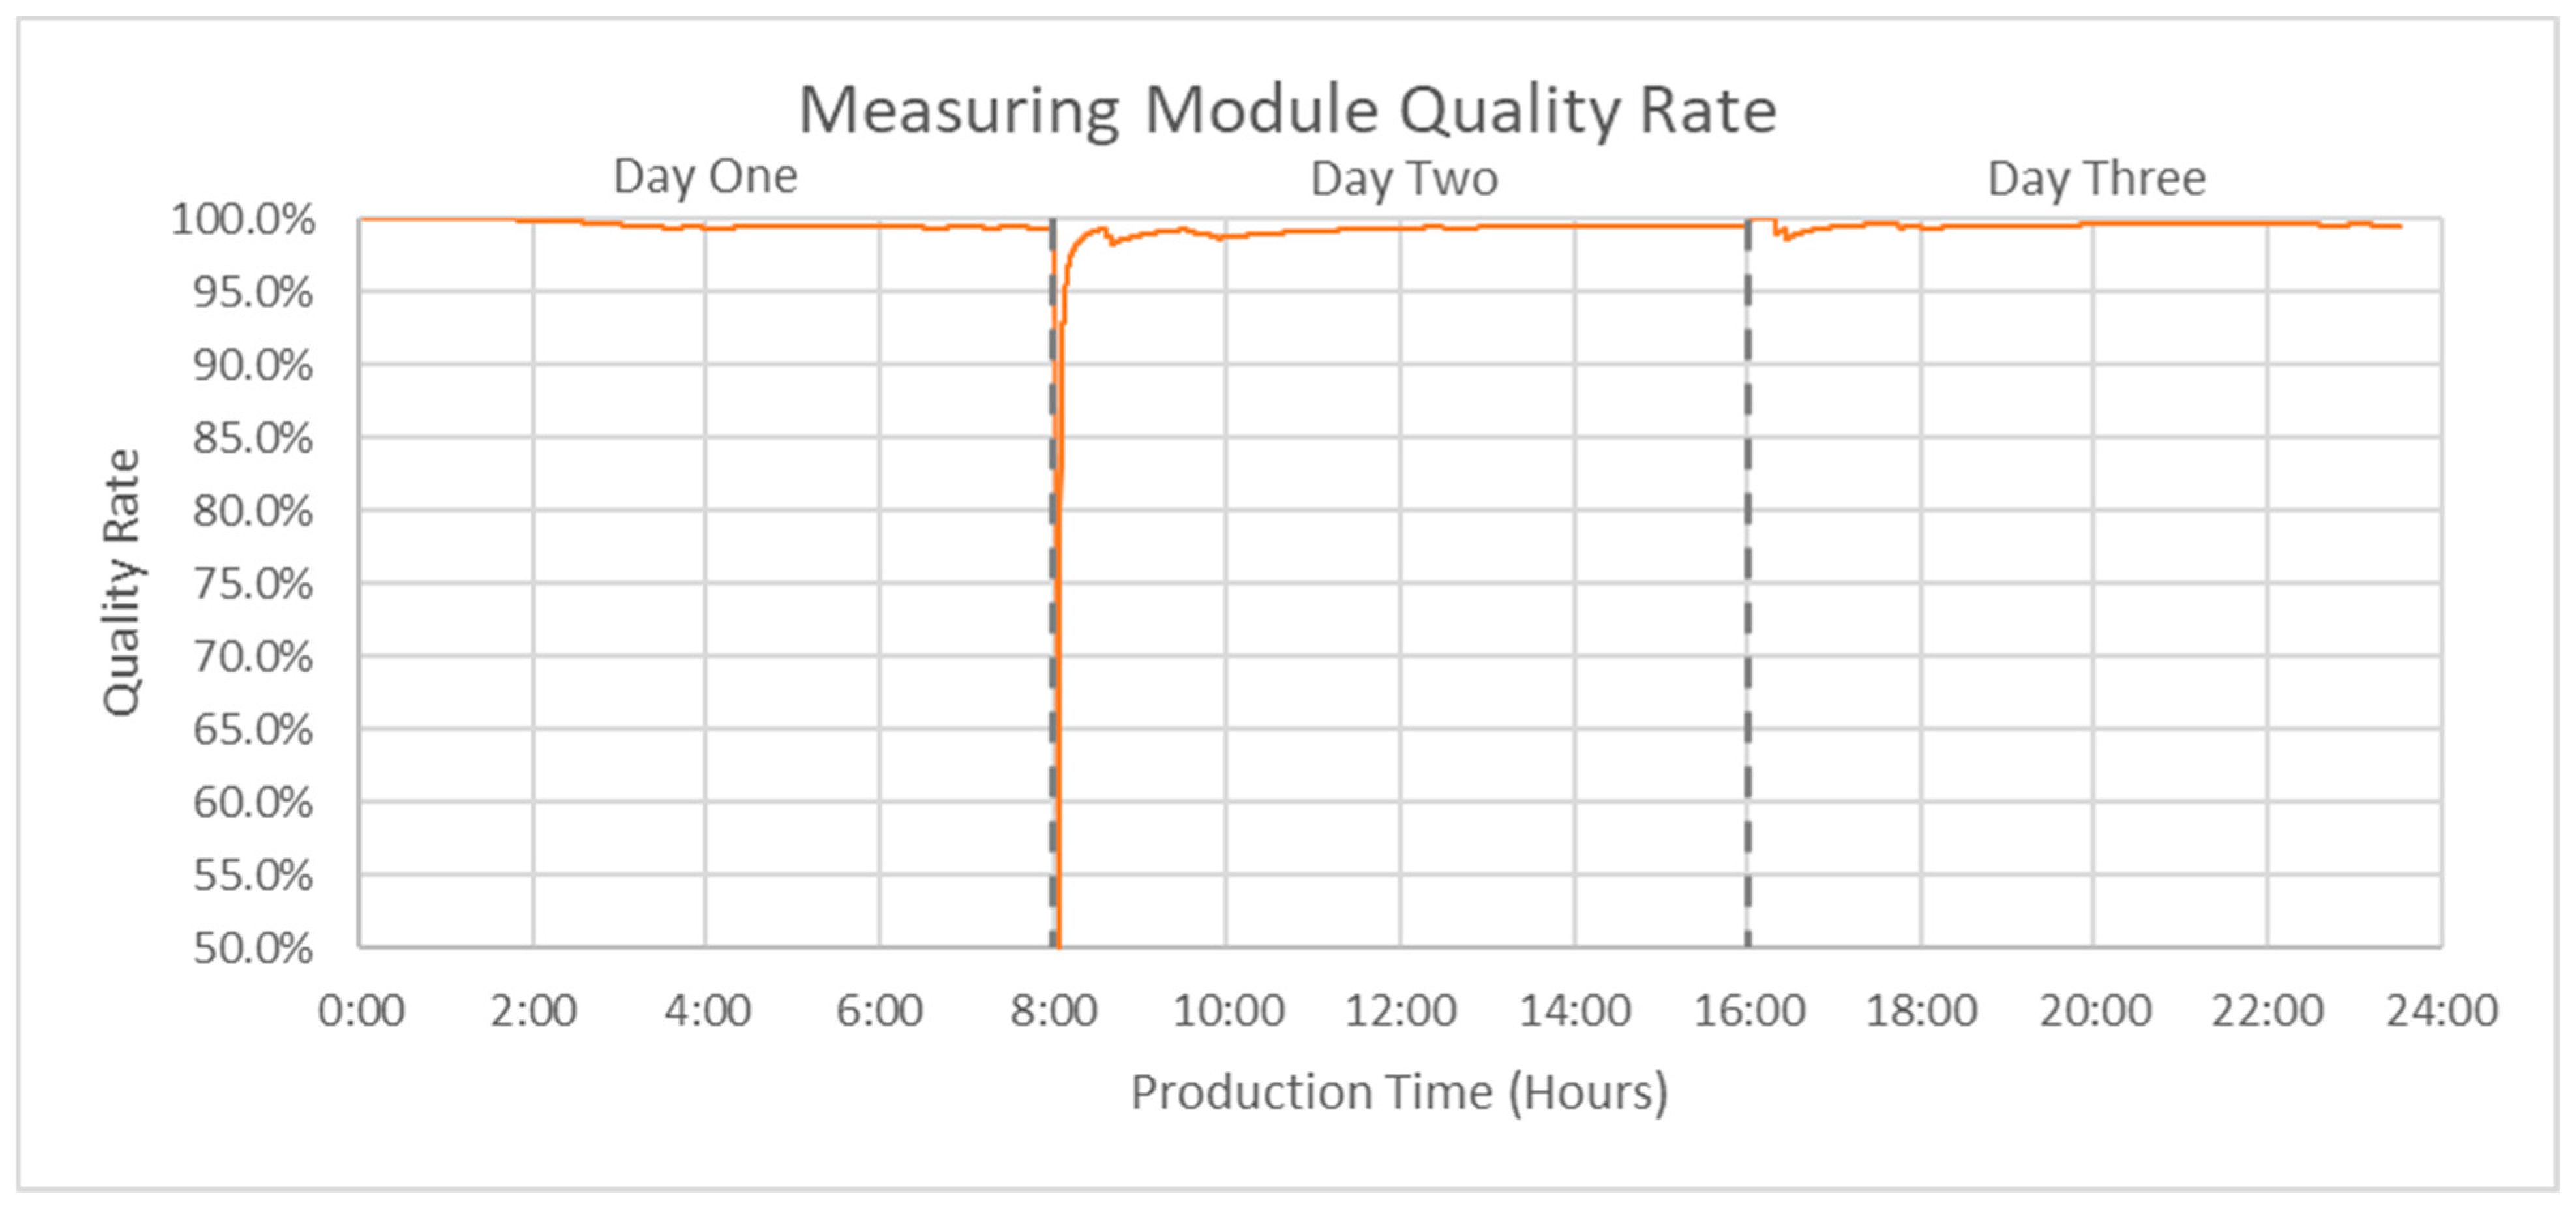
The quality rate, shown in
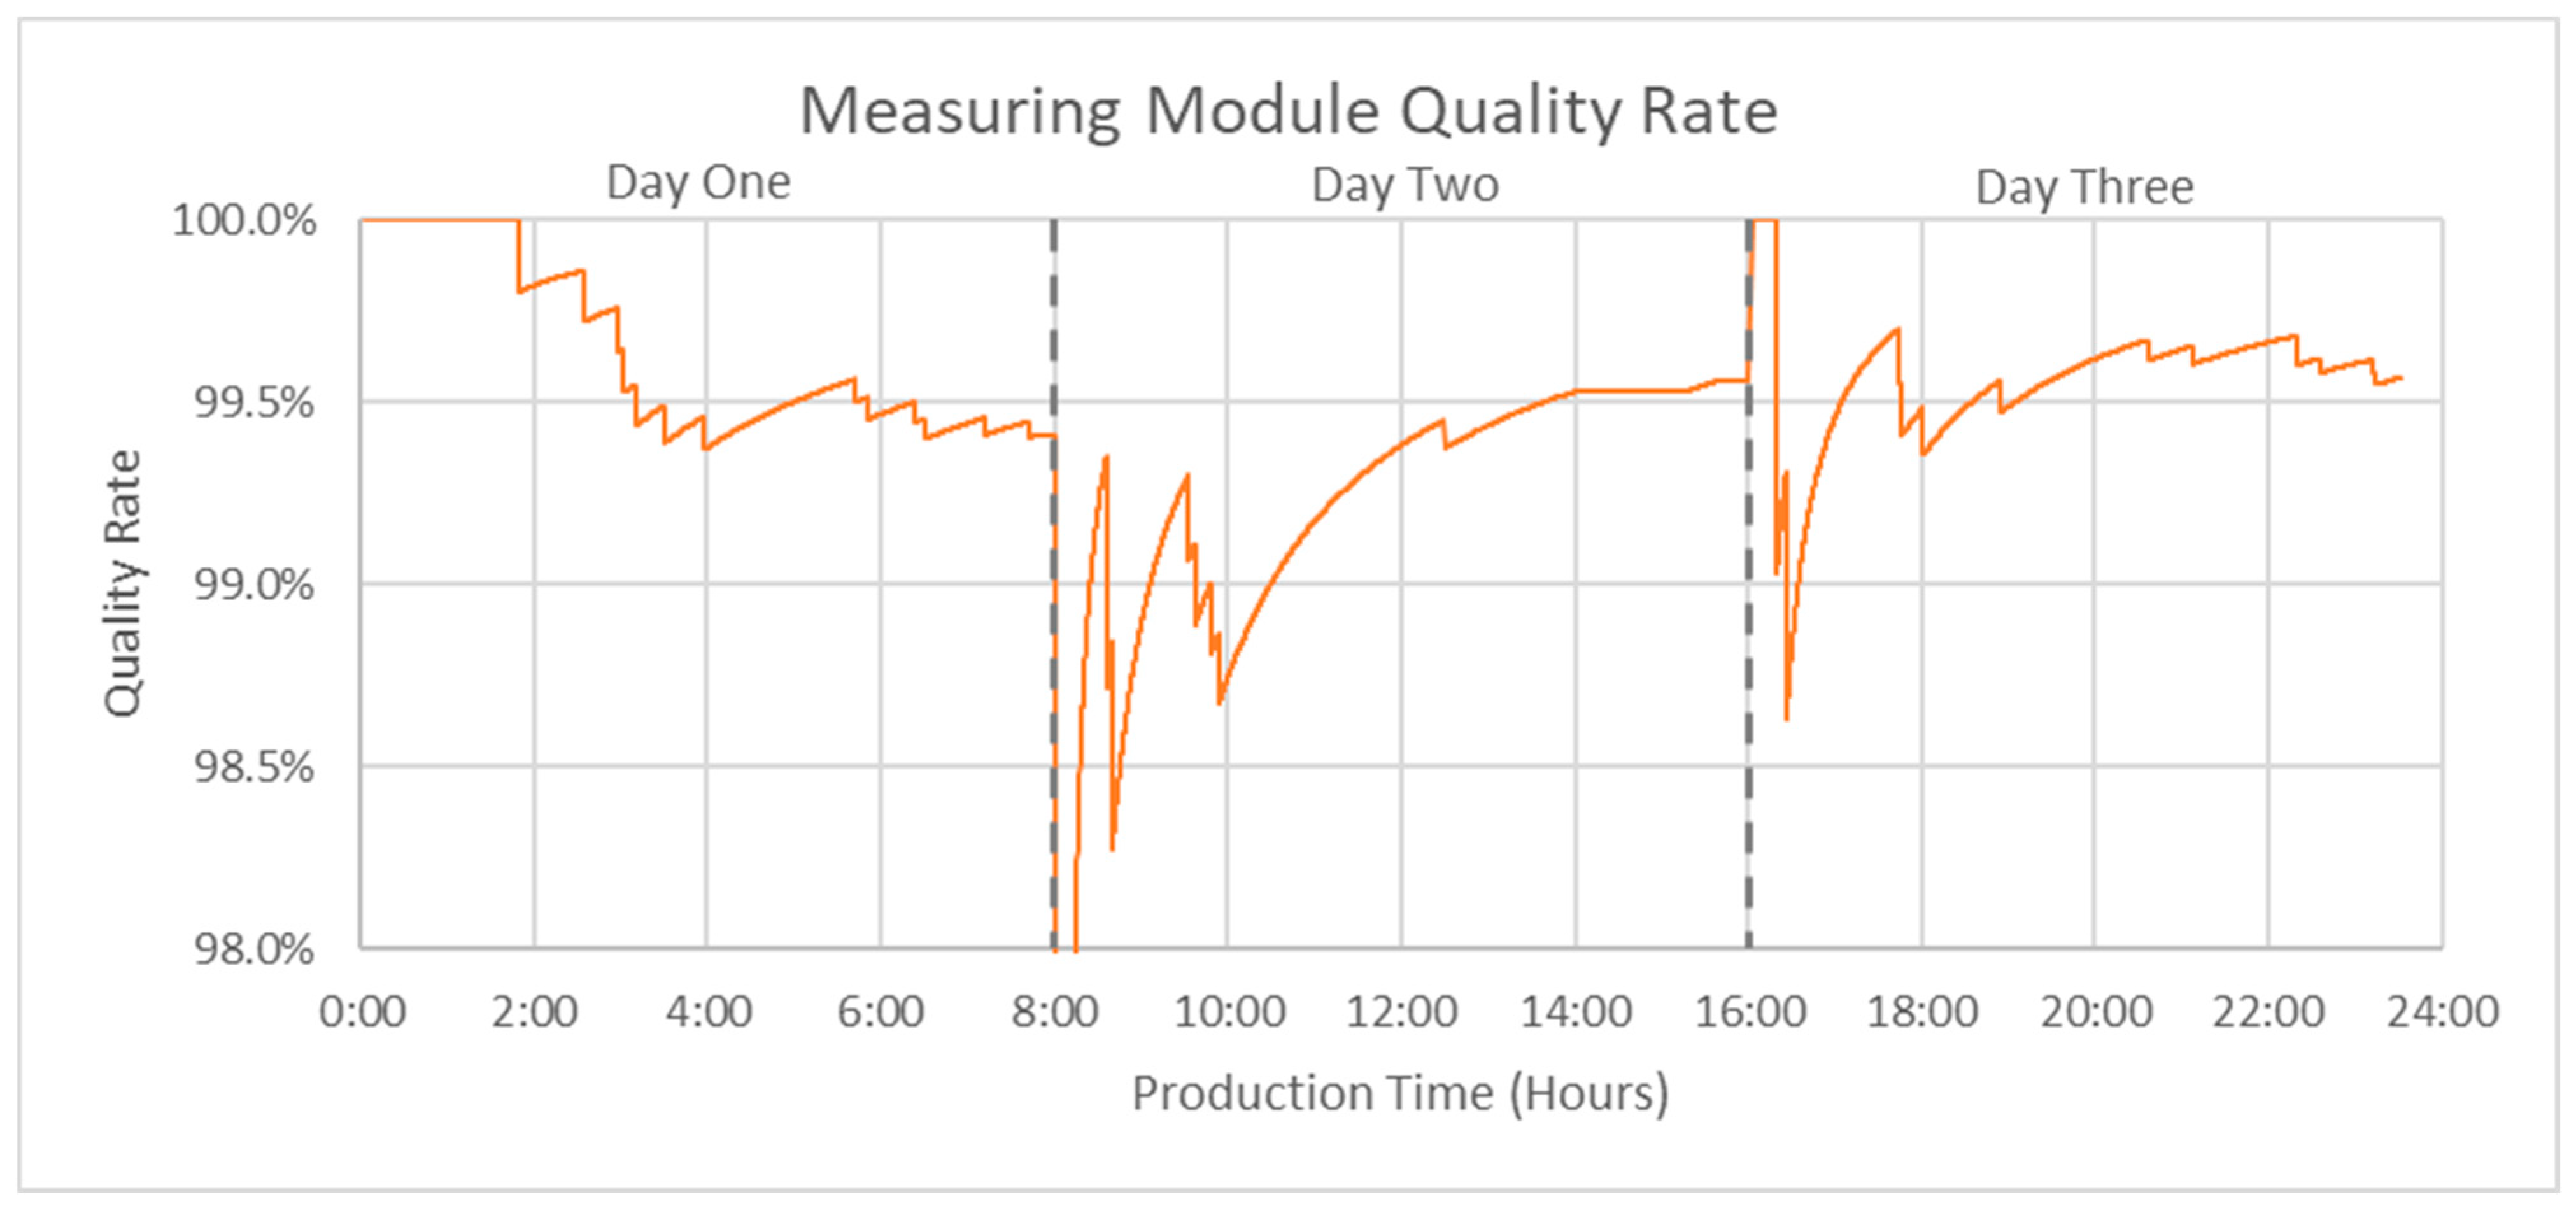
Figure 11, is the ratio between the number of good parts produced and the total parts processed. The measuring module is the only station of the FCPL that reports part quality and produces scrap parts. Losses from passing scrap along in the drilling and output modules were captured in lengthened cycle times between good parts and were thus assumed to have a quality rate of 100% to avoid double counting the lost time. The magazine module was also assumed to have a perfect quality rate as bad parts cannot be identified at that stage. The only notable anomaly present in the quality rate data from the measuring module was a short but sharp drop at the beginning of day two (8:00 production hours). This reduction in quality was due to the second part processed that day being marked as scrap. This resulted in a single data point showing a 50% quality rate, after which the quality rate quickly recovered (see
Figure 12 and
Figure 13). Outside of the first 15 min of day two, the quality rate stayed above 98% (see
Figure 12), having only a minor effect on OEE.
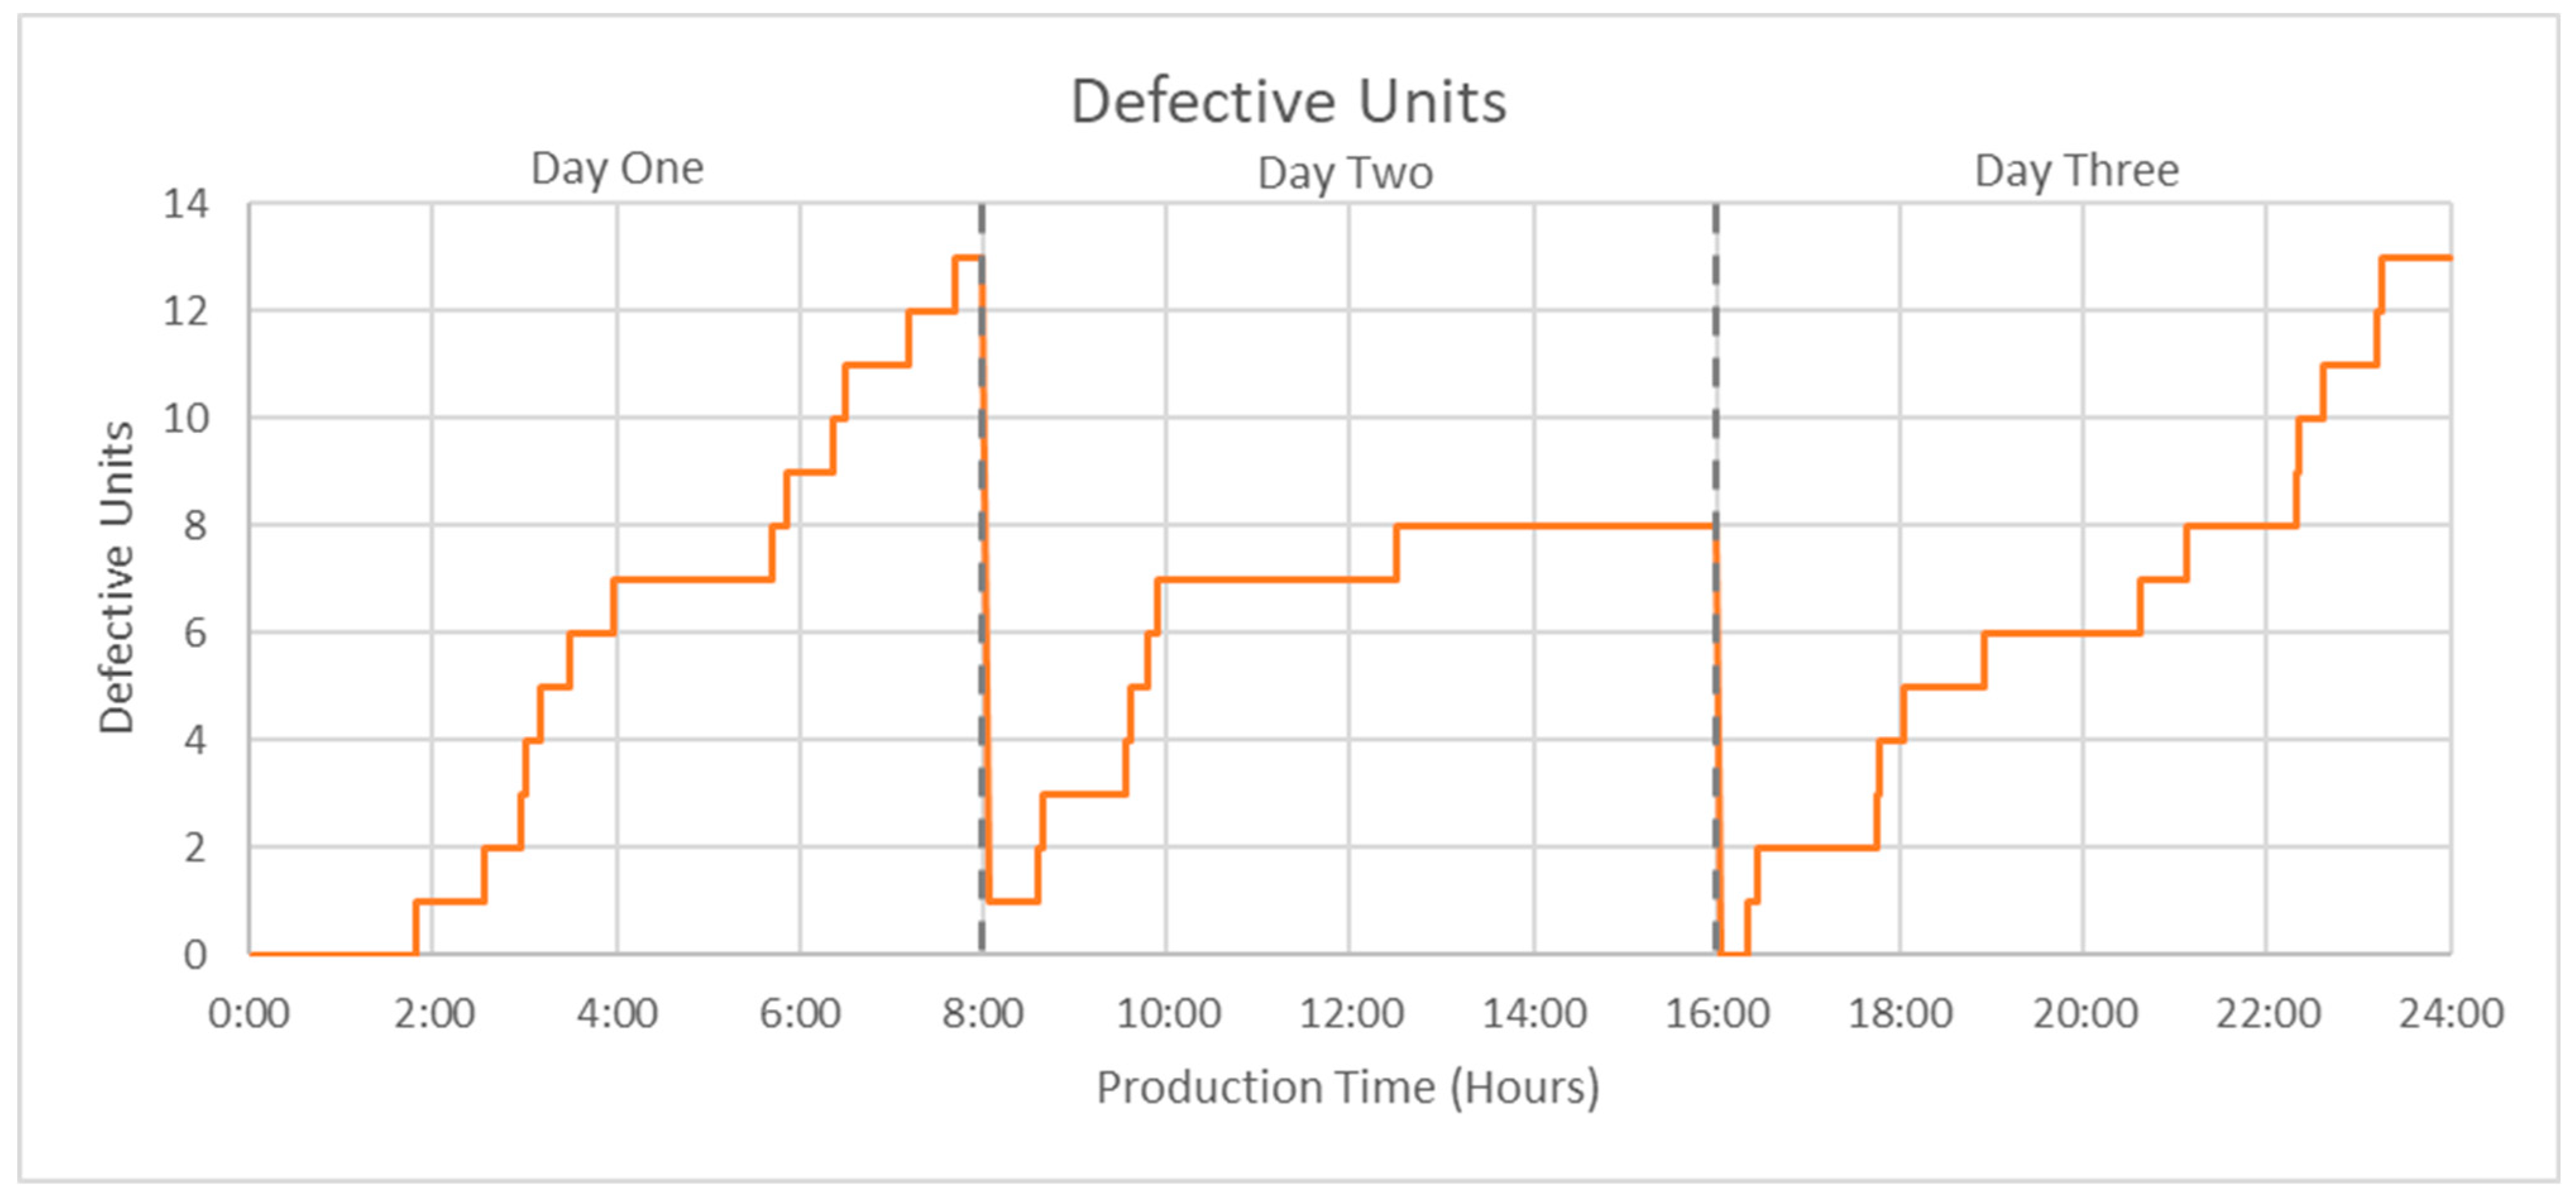
Actual operating time provides insight into the drop in availability observed at the drilling module on the second day of testing. Actual operating time is deduced from measuring downtime and subtracting it from the planned production time. The downtime recorded during testing, shown in
Figure 14, shows the reasoning behind the drop in availability at the drilling module on the second testing day. The cumulative recorded downtime data show the drilling module downtime increasing at a steady rate of approximately 12 min per hour throughout the day (1.19 h total), excluding the unplanned maintenance downtime between roughly 14:00 and 15:15 production hours when all stations experienced downtime. However, without further investigation past this final level of discretization for OEE, the cause of this additional 1.19 h of downtime accumulation cannot be determined. Additionally, reporting only final values for the day would not reveal this trend but would only show the final difference in downtime between the drilling module and the other stations.
From examining OEE and the data that formed it, several insights have been gleaned.
Due to the nature of the process, the module with the highest OEE is identified as the bottleneck. From this correlation, it is evident that improvements between testing phases shifted the bottleneck from the drilling module to the output module.
A machine failure requiring an unplanned maintenance event lowered availability and OEE for all stations between approximately 14:00 and 15:15 production hours.
Despite an increase in production and decreased cycle time, the performance efficiency and OEE at the output module were reduced between the first and third day of testing.
The availability at the drilling module on the second day of testing was decreased due to a steady accumulation of 1.19 additional hours of downtime over the course of that day.
The range of the four station’s OEE and performance efficiency decreased due to process improvements during the testing period, balancing cycle times across the entire FCPL and showing increased utilization overall.
4.3. Digital Performance Management
Results presented by the digital performance management solution come in two forms, namely waterfall and pareto charts, and can be viewed for the FCPL as a whole or by individual station. The DPM solution autonomously differentiates data by day, ensuring the three phases can be assessed independently. Ideal cycle times were updated through the dashboard for the drilling and output modules following the inter-phase improvements. Data were recorded from the dashboard output, and the visualizations are recreated here for consistency and clarity.
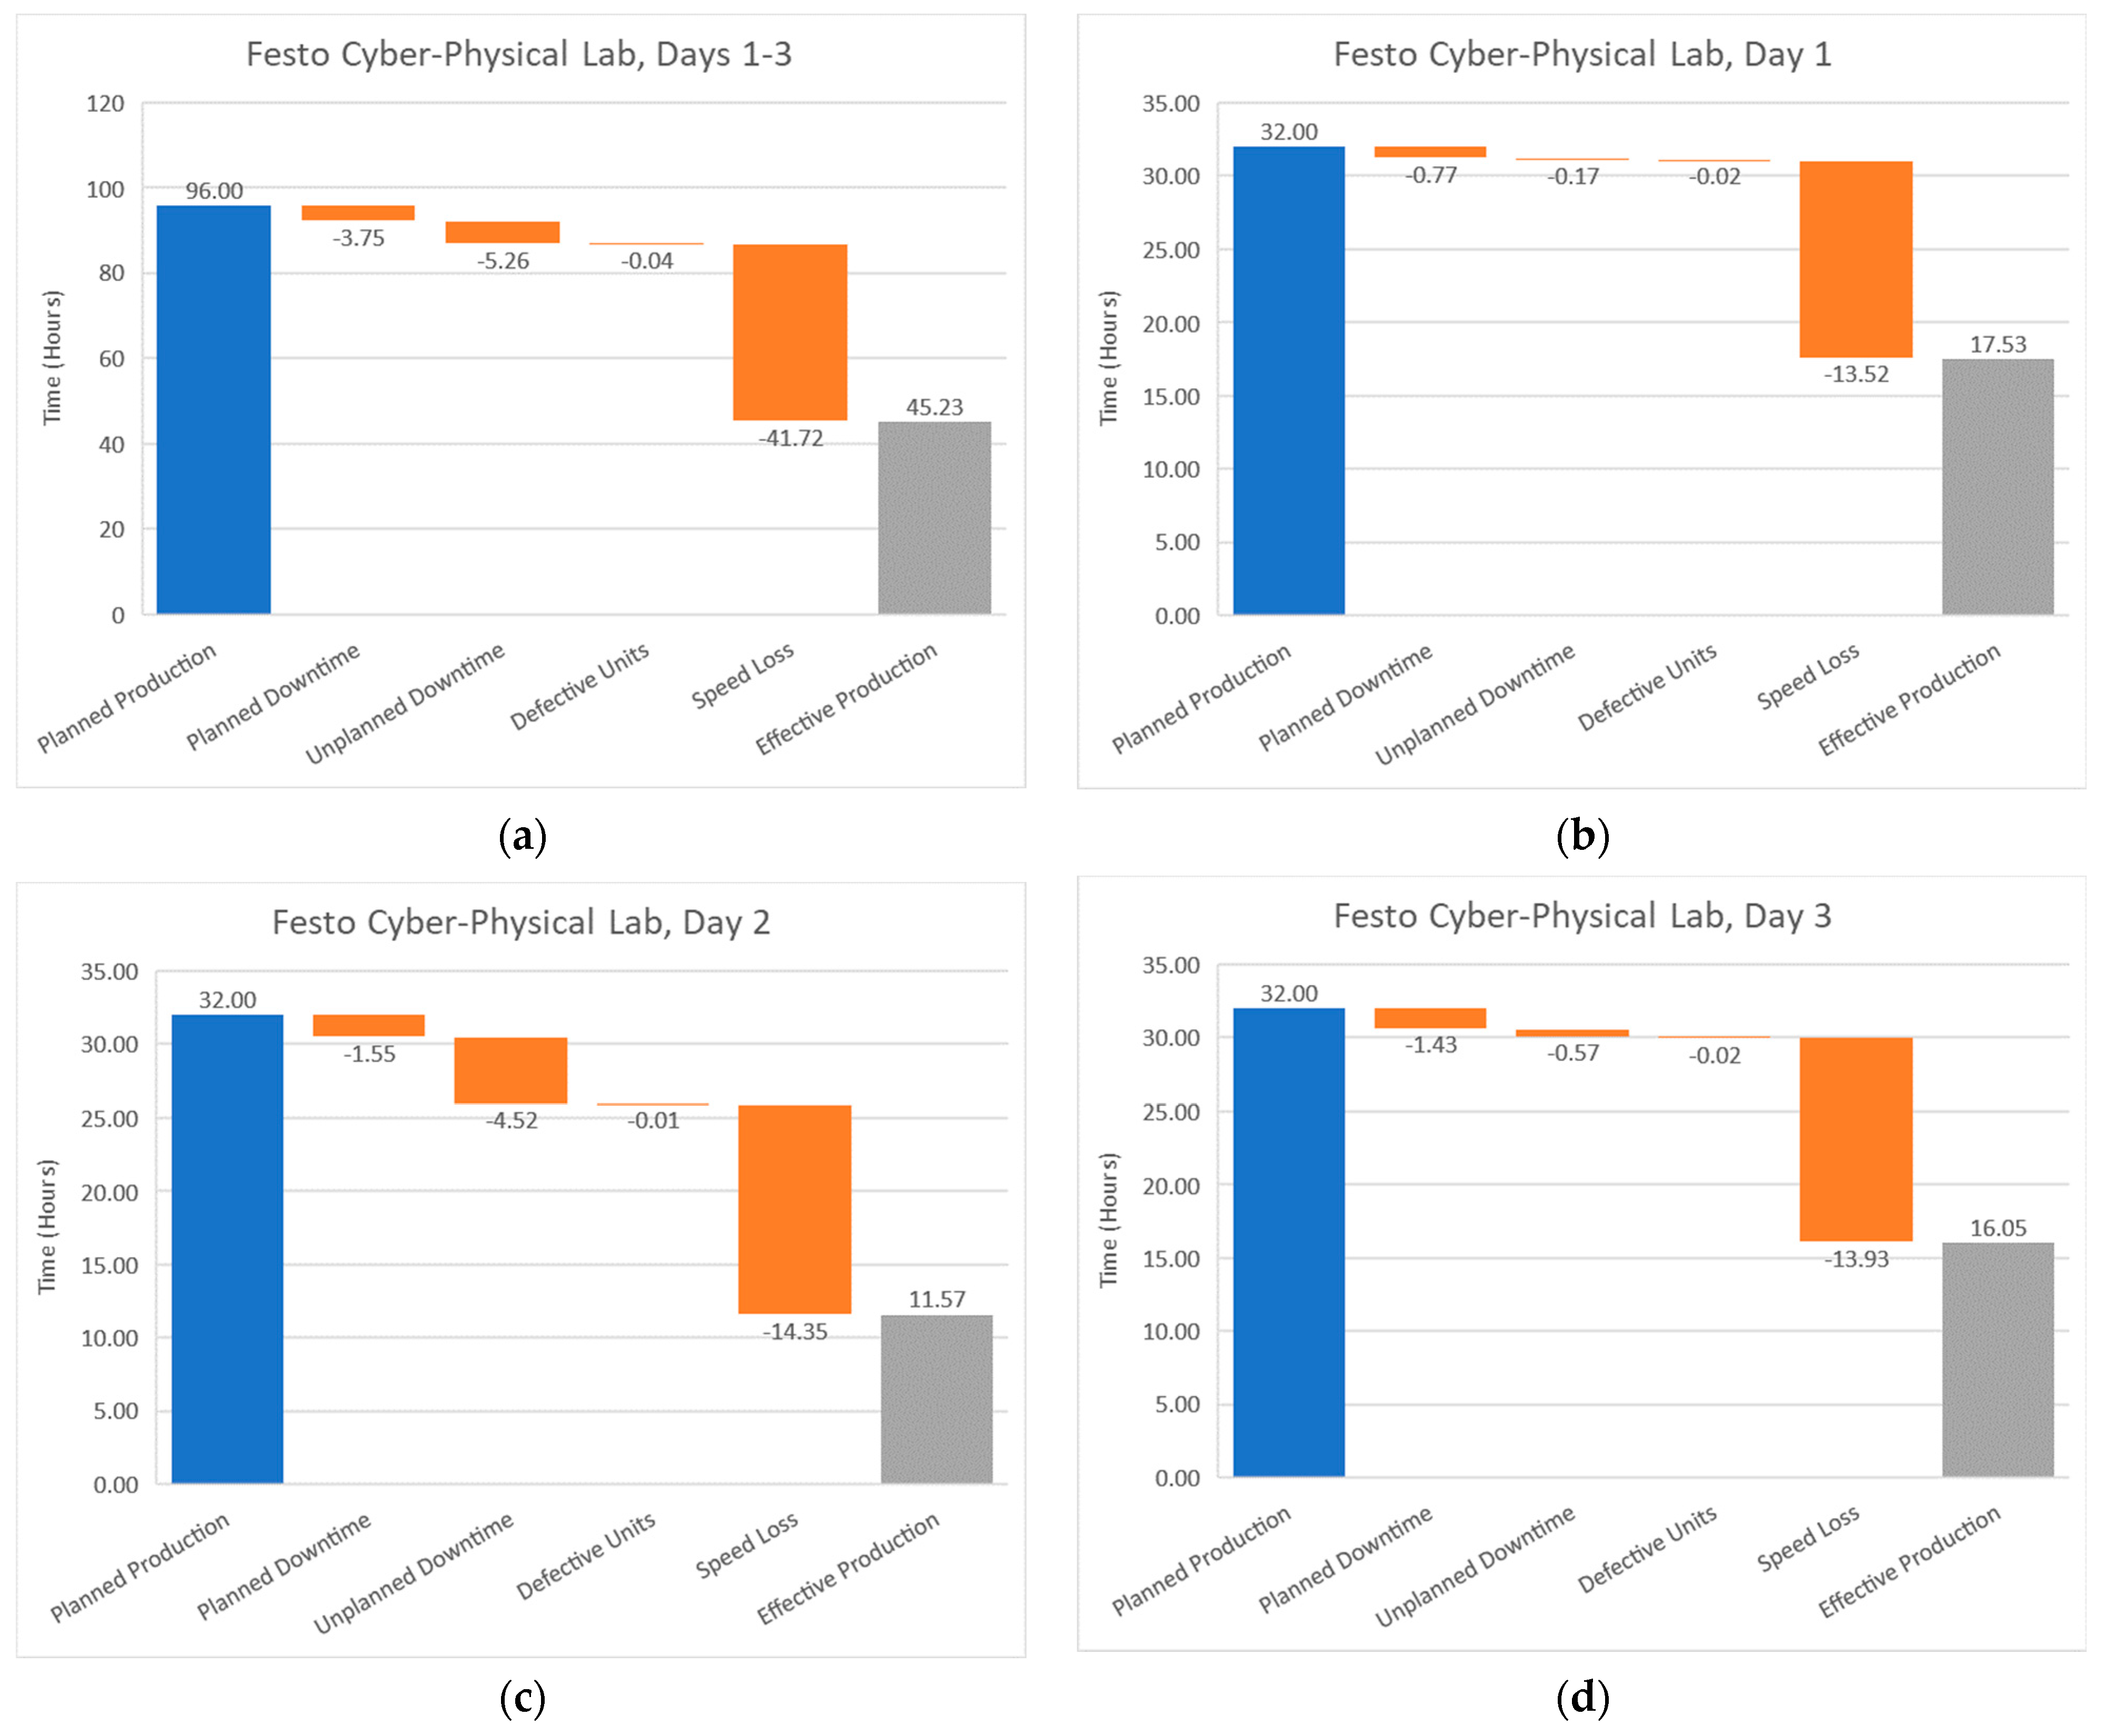
A cumulative waterfall chart is shown in
Figure 15a, combining data from all four stations over the three-day testing period, which sums the four station’s planned production of three 8 h shifts for a total of 96 total production hours. This total planned production time is the leftmost column of the waterfall charts presented by DPM. The columns following this subtract time in various loss categories, such as unplanned downtime. A key measurement from these waterfall charts is the effective production time, which is a result of subtracting the reported losses from the planned production time. From this cumulative view, DPM shows an effective production time of 45.23 h out of the 96 total scheduled production hours. When differentiated by day, each view having a total planned production time of 32 h from the sum of the four stations’ individual 8 h shifts (see
Figure 15b–d), the FCPL shows a decrease in effective time between the first and last day of testing, with increases in all loss categories except scrap. The unplanned maintenance event on day two is also apparent from the increase in unplanned downtime on that day.
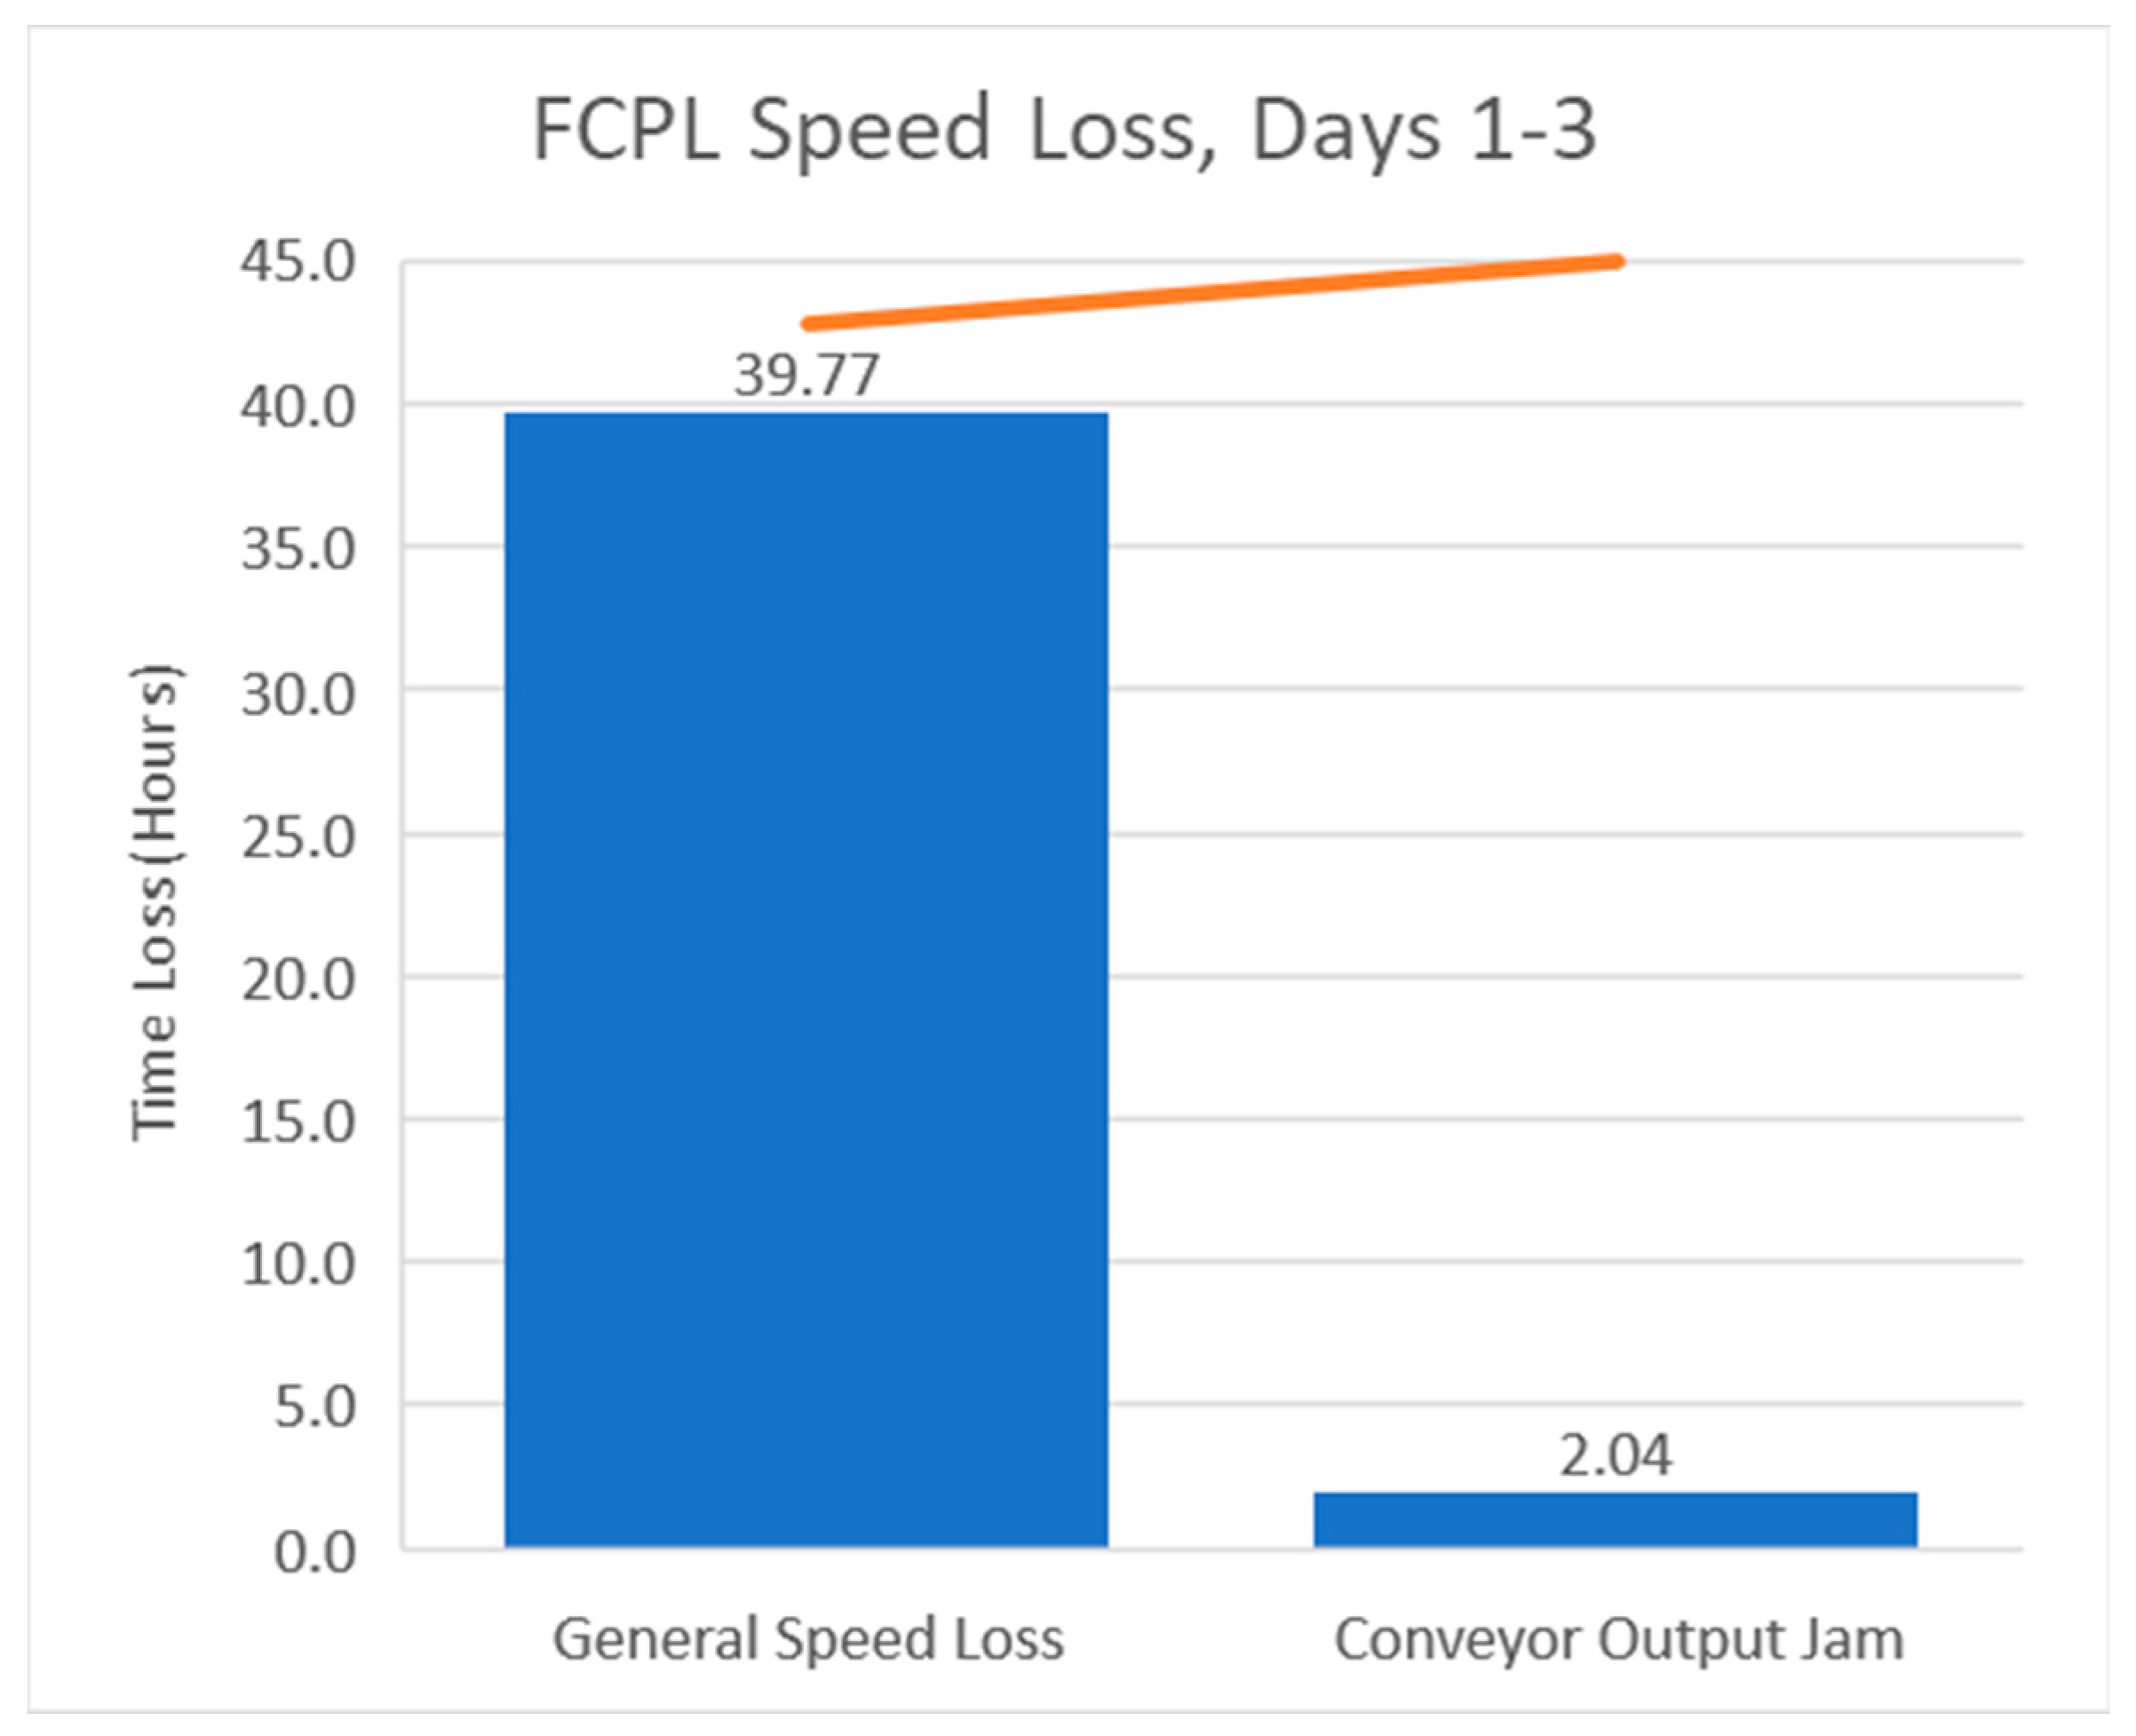
The time loss categories are further expounded upon through pareto charts, which detail the individual loss reasons in each category. The pareto charts presented by DPM show the loss reasons that constitute a category in order of greatest to least impact. A line accompanies each set of bars showing the percentage of the category accounted for as the reasons are listed. The cumulative FCPL speed loss pareto chart, shown in
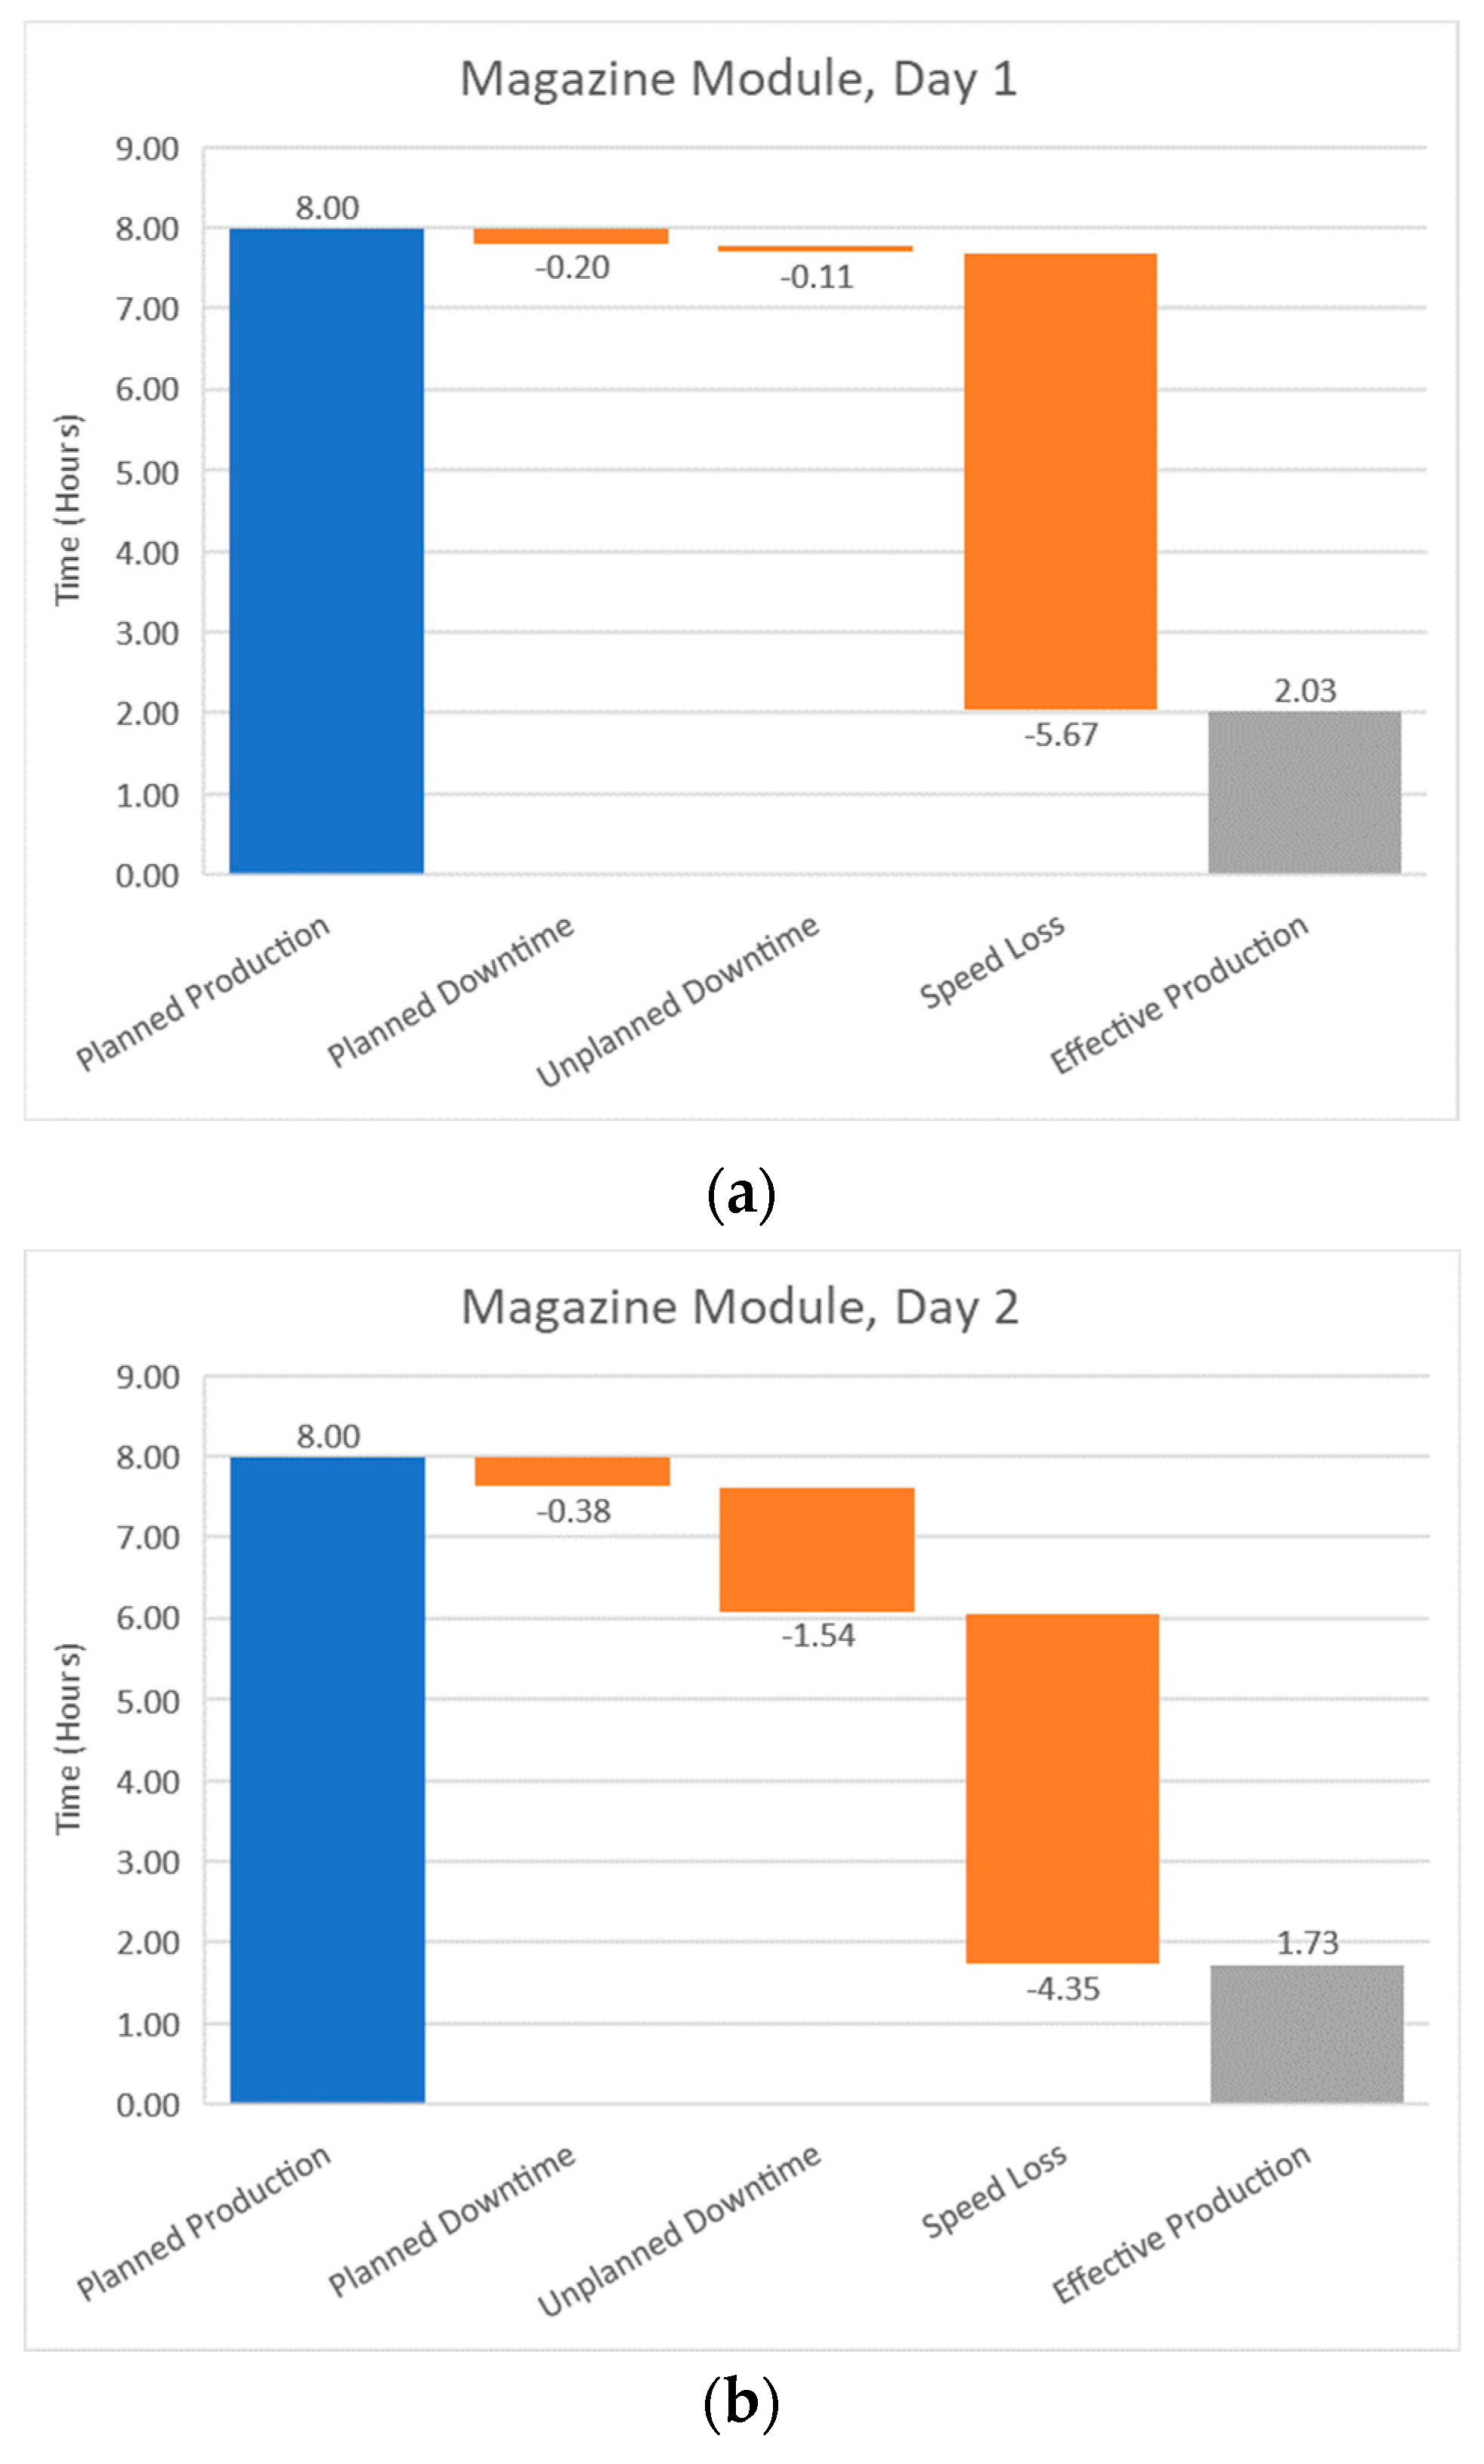
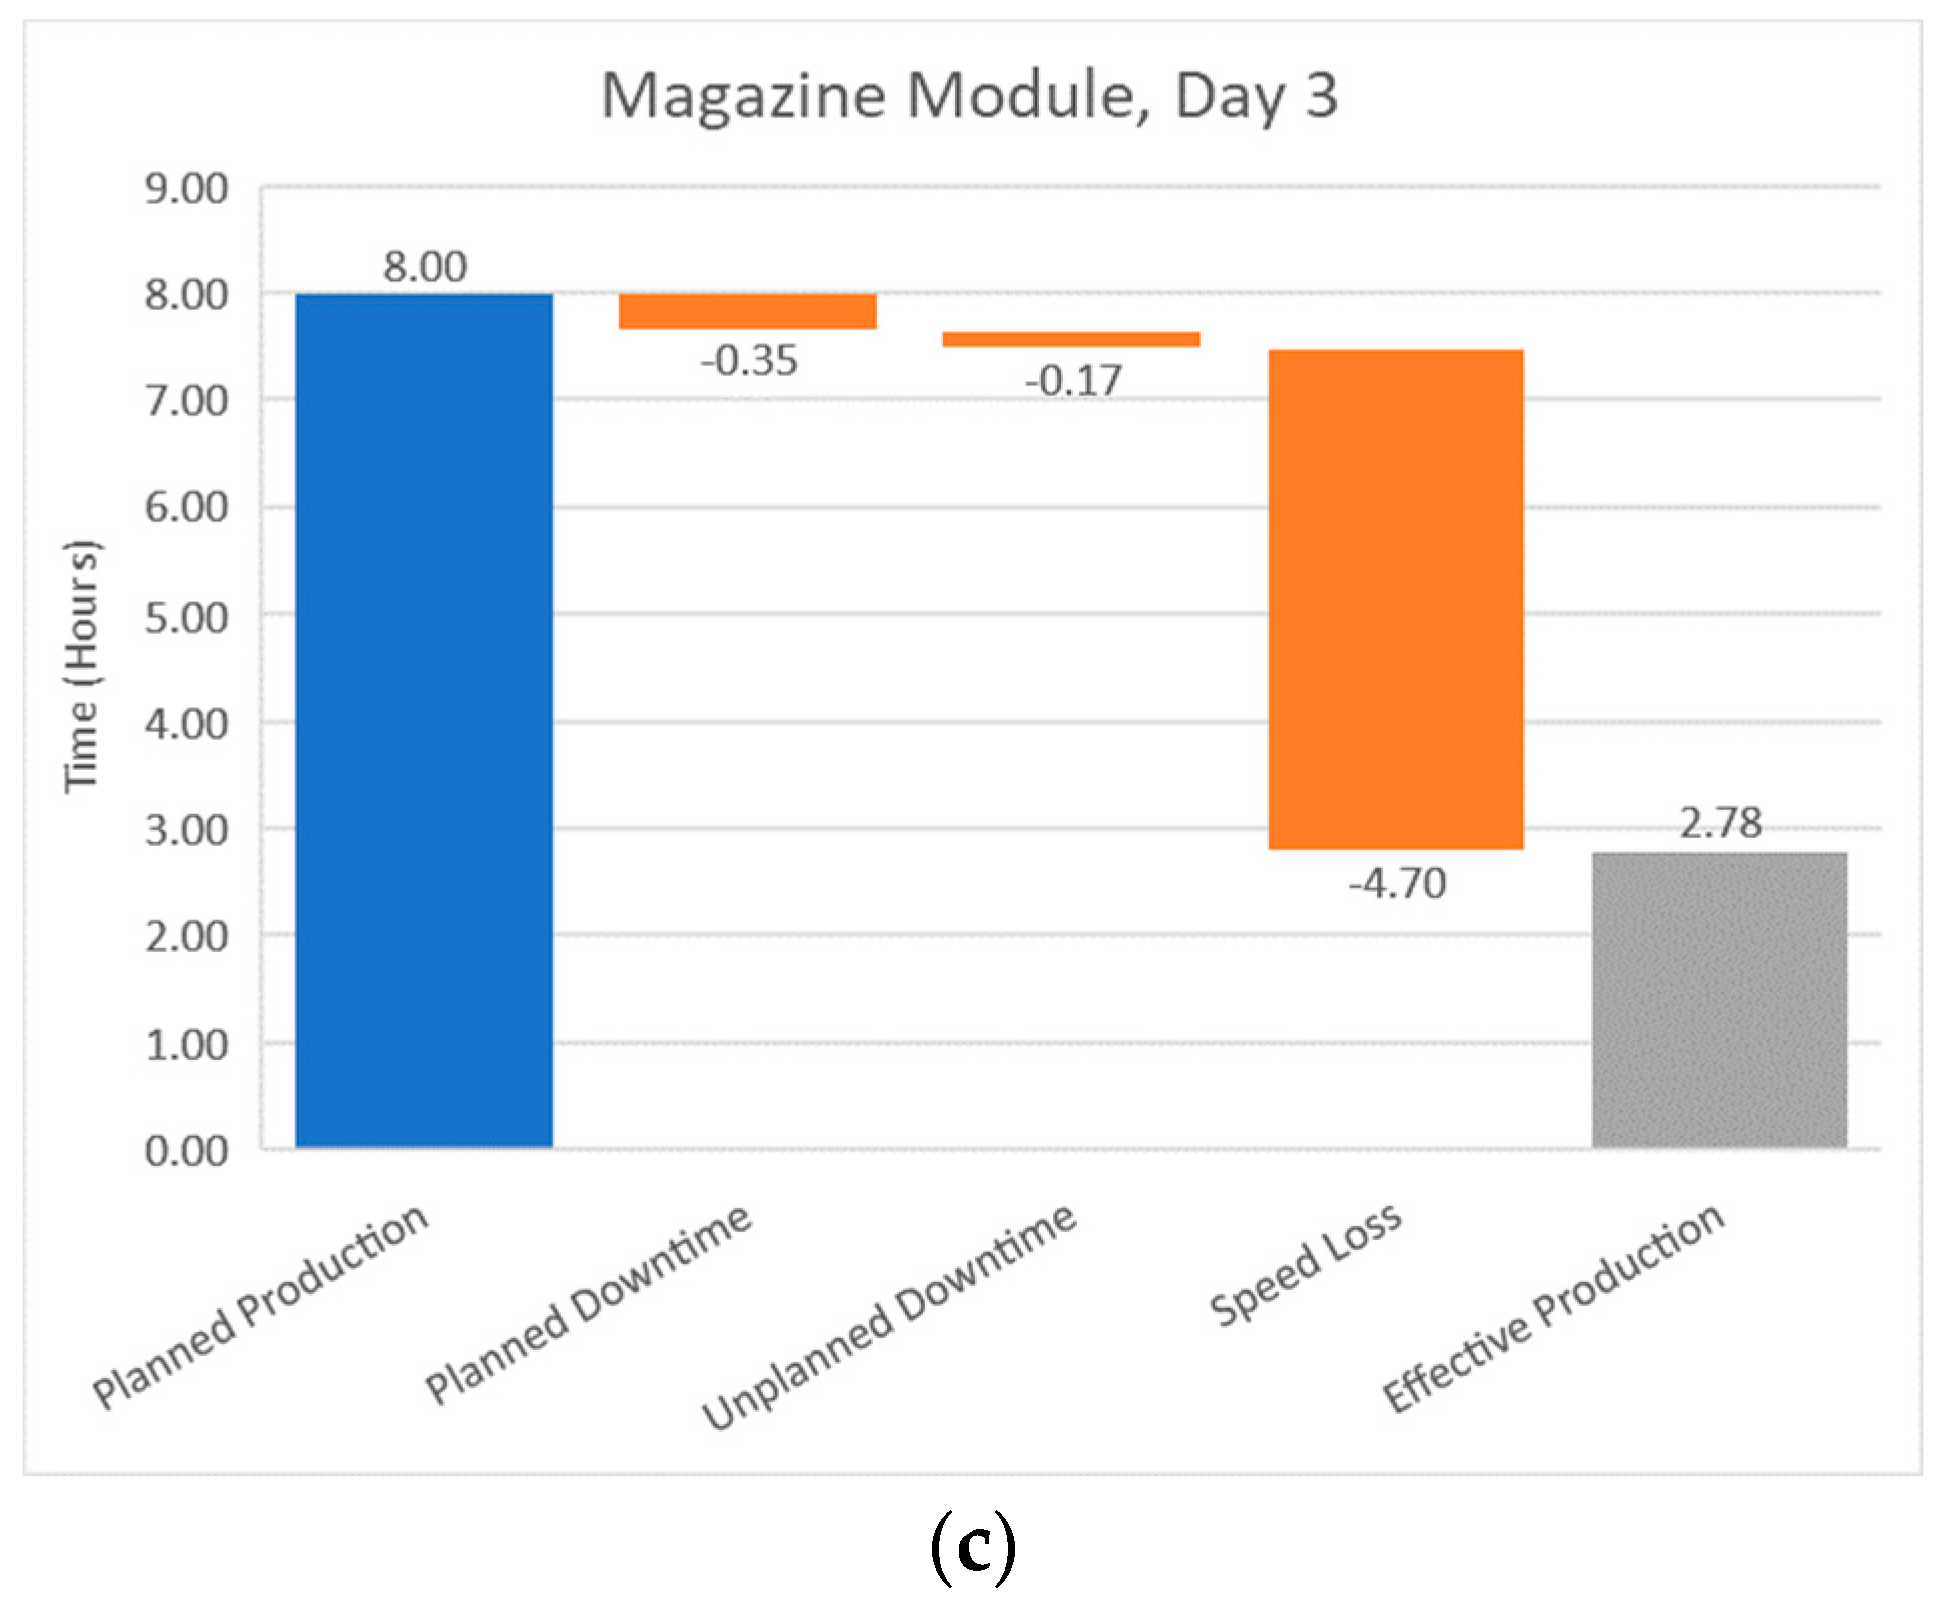
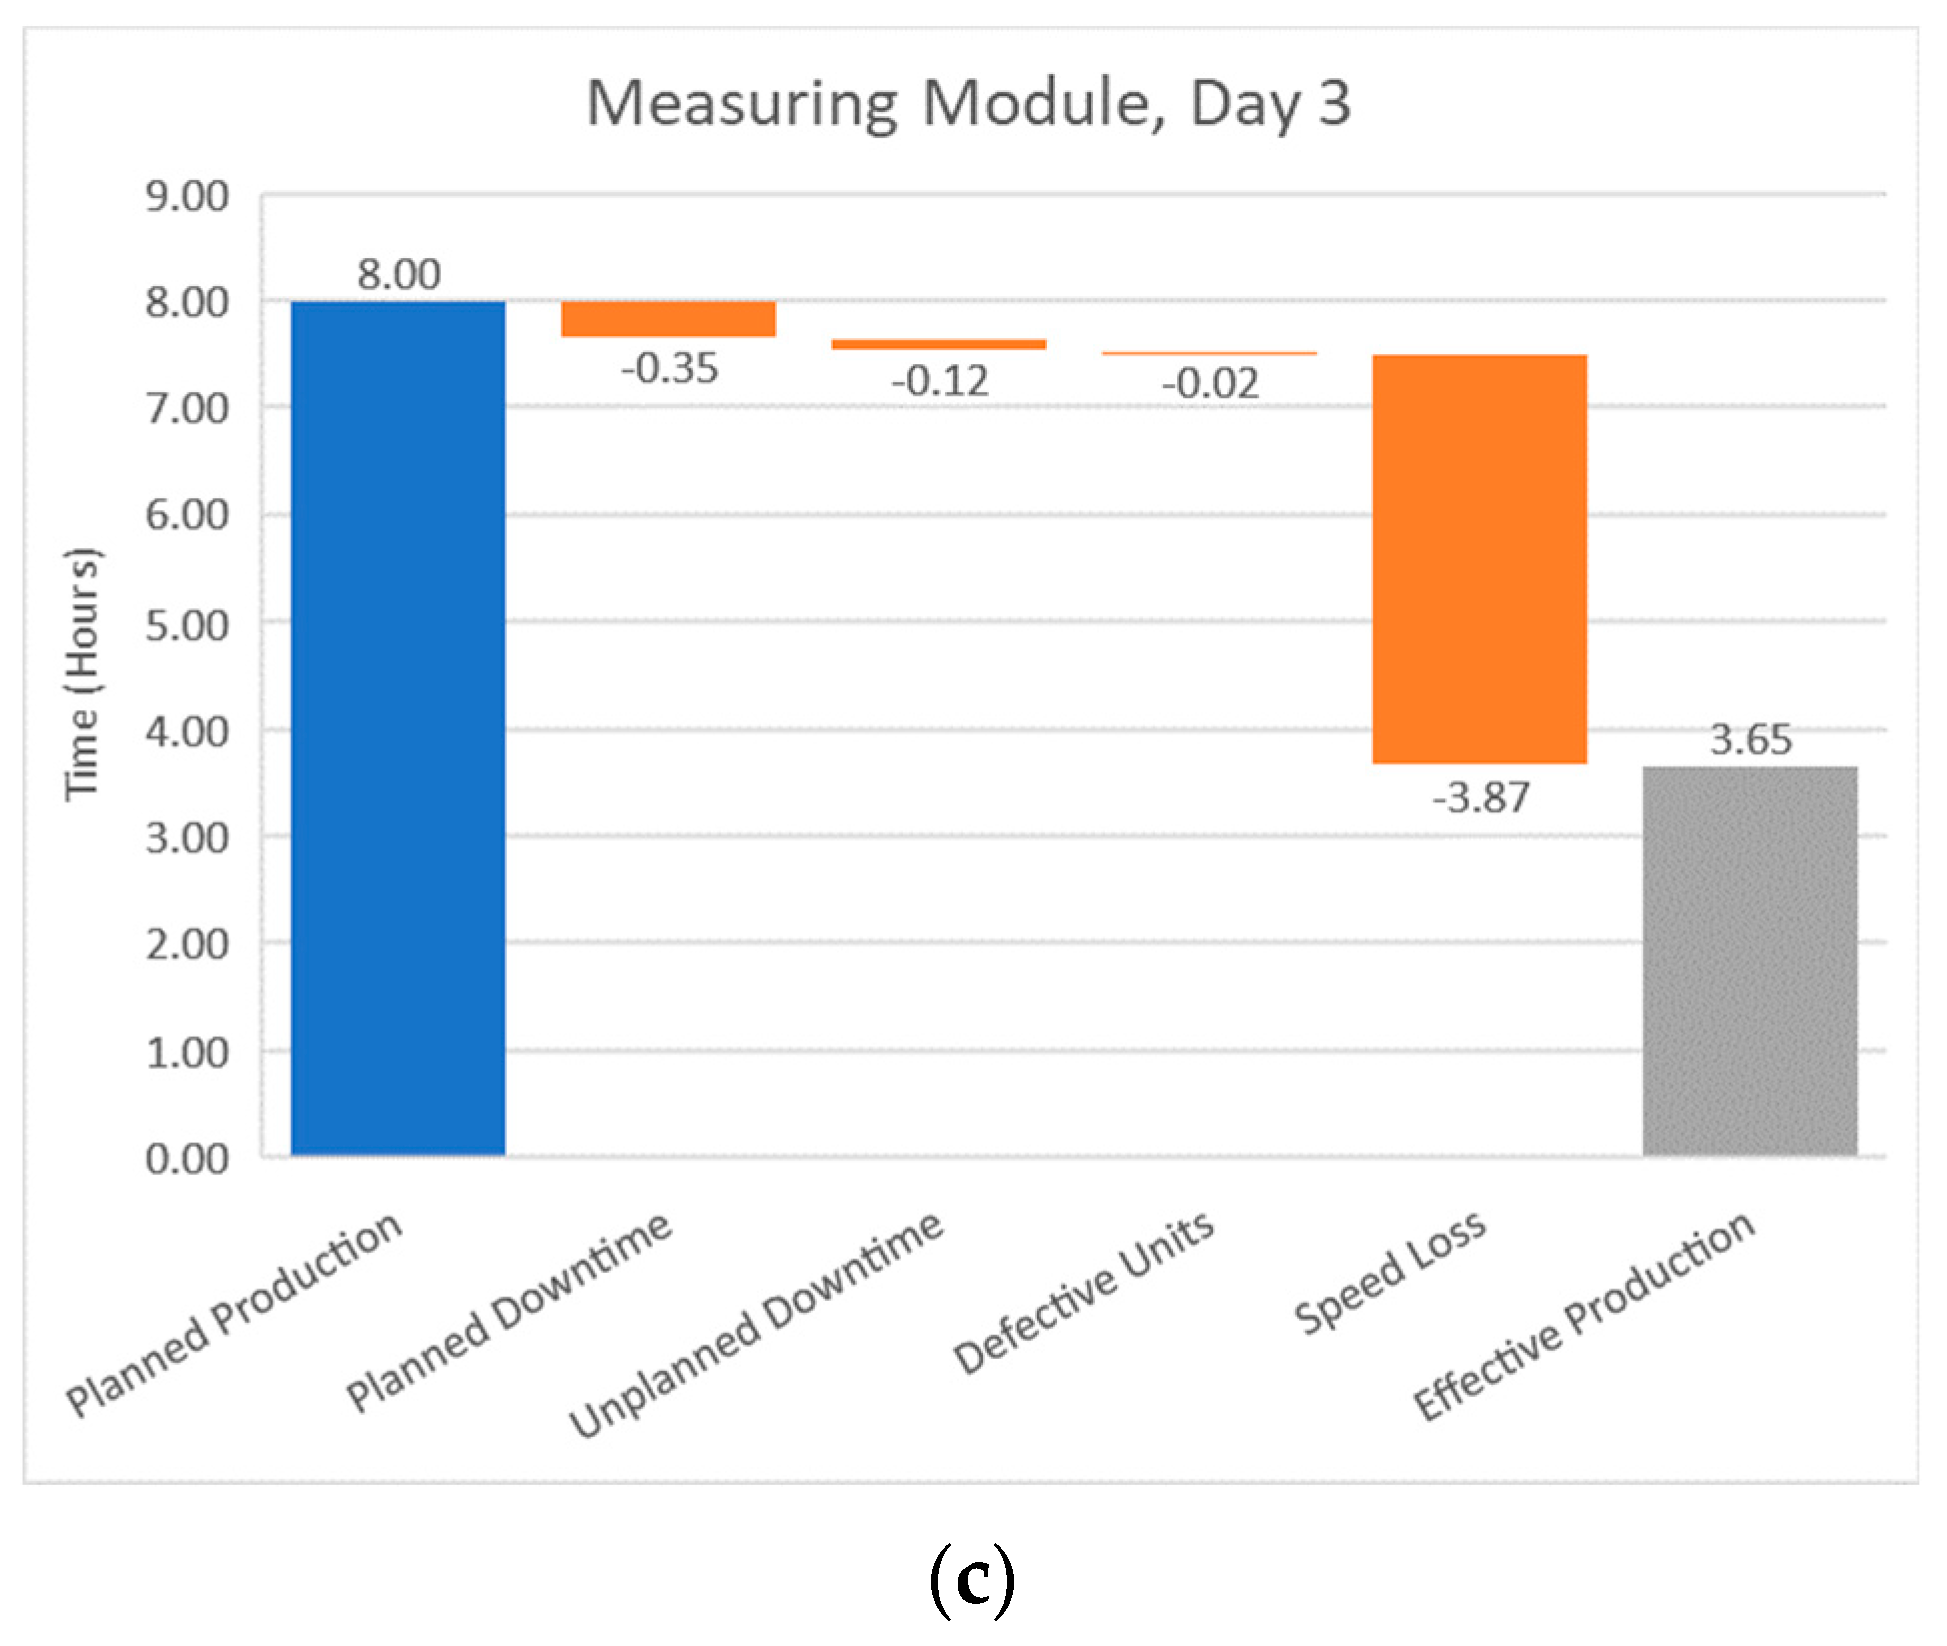
Figure 16, visualizes the large difference between the loss category’s two reasons, the automatically reported conveyor output jam and manually reported general speed loss events. Conveyor output jams are caused by a backup of carriages on the conveyor ahead of a station, preventing the release of a processed part from the reporting station. DPM reported that 1878 conveyor output jam events summed to 2.04 h of lost time. General speed losses are manually reported by the operator as any time not accounted for by other loss reasons, primarily encapsulating non-bottleneck stations waiting for part carriers and running over their ideal cycle time as they slow to the pace of the bottleneck. For example, on day three, the magazine module’s average cycle time increased by an average of 4.64 s as it had to wait for parts to arrive for inspection. Over the 3001 parts it processed that day, this extra waiting time accumulated into 3.87 h of general speed loss (see Figure 23c).
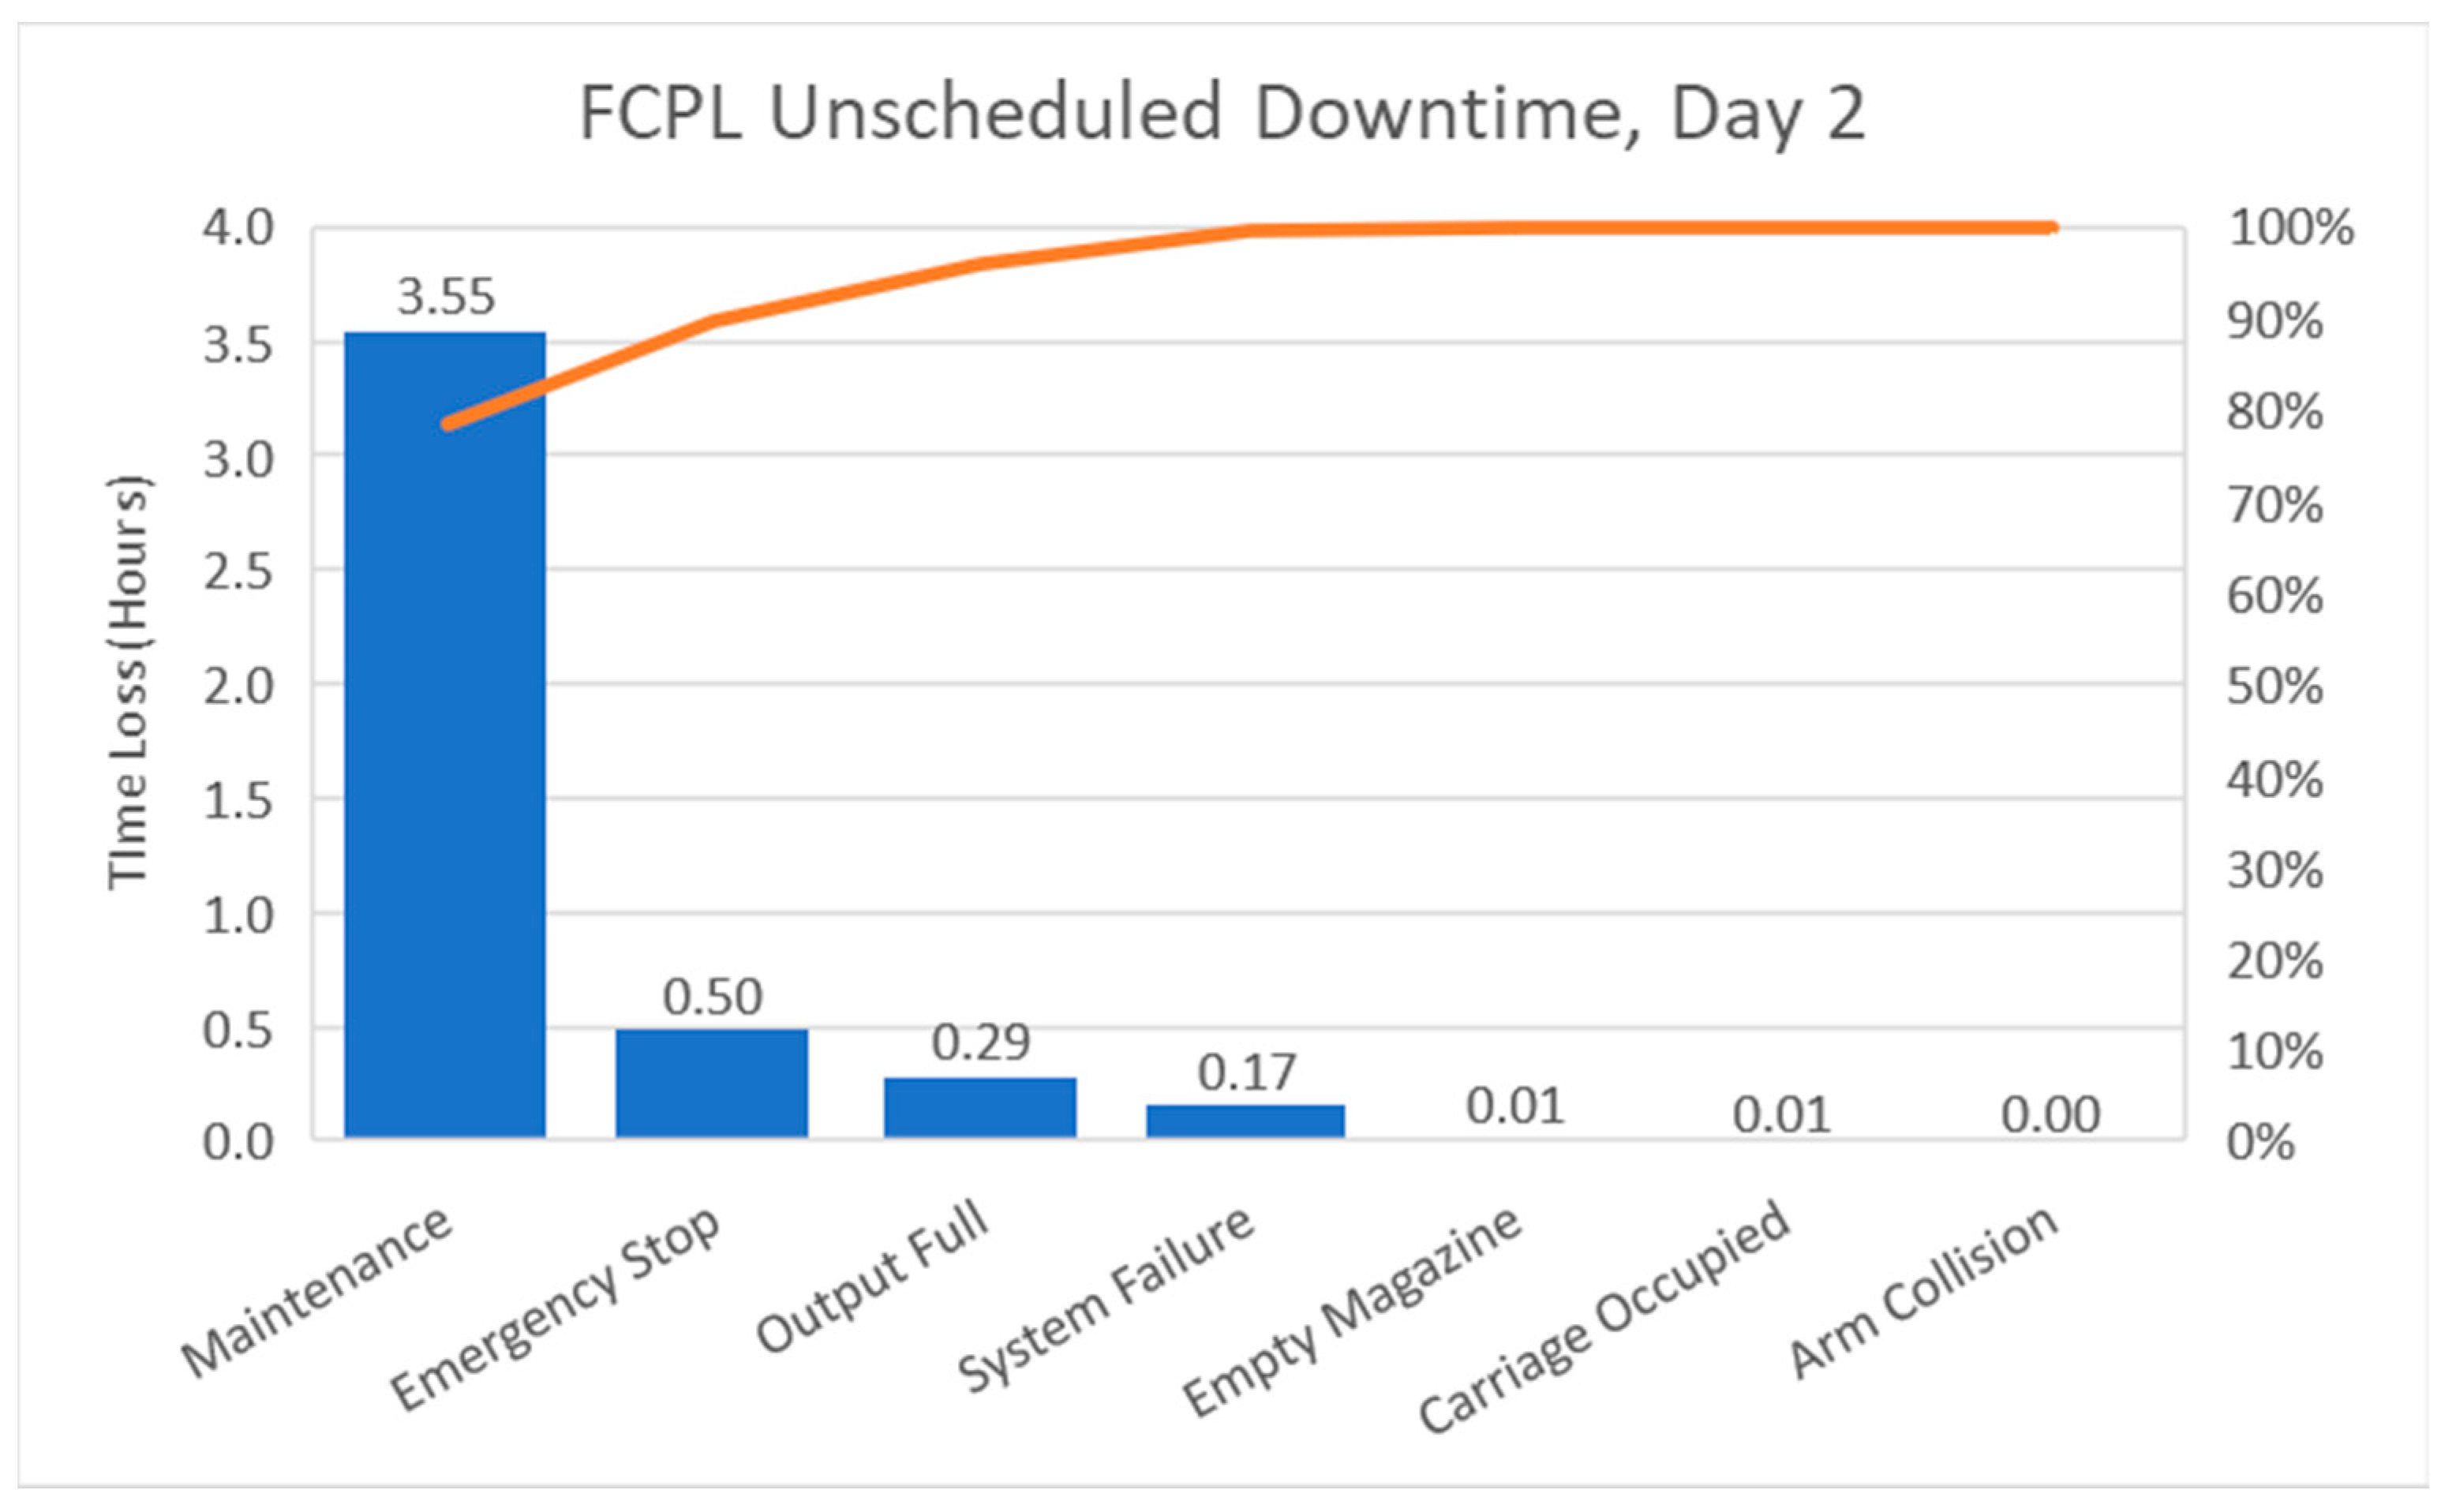
Inspecting the pareto chart of the FCPL unplanned downtime on day two (see
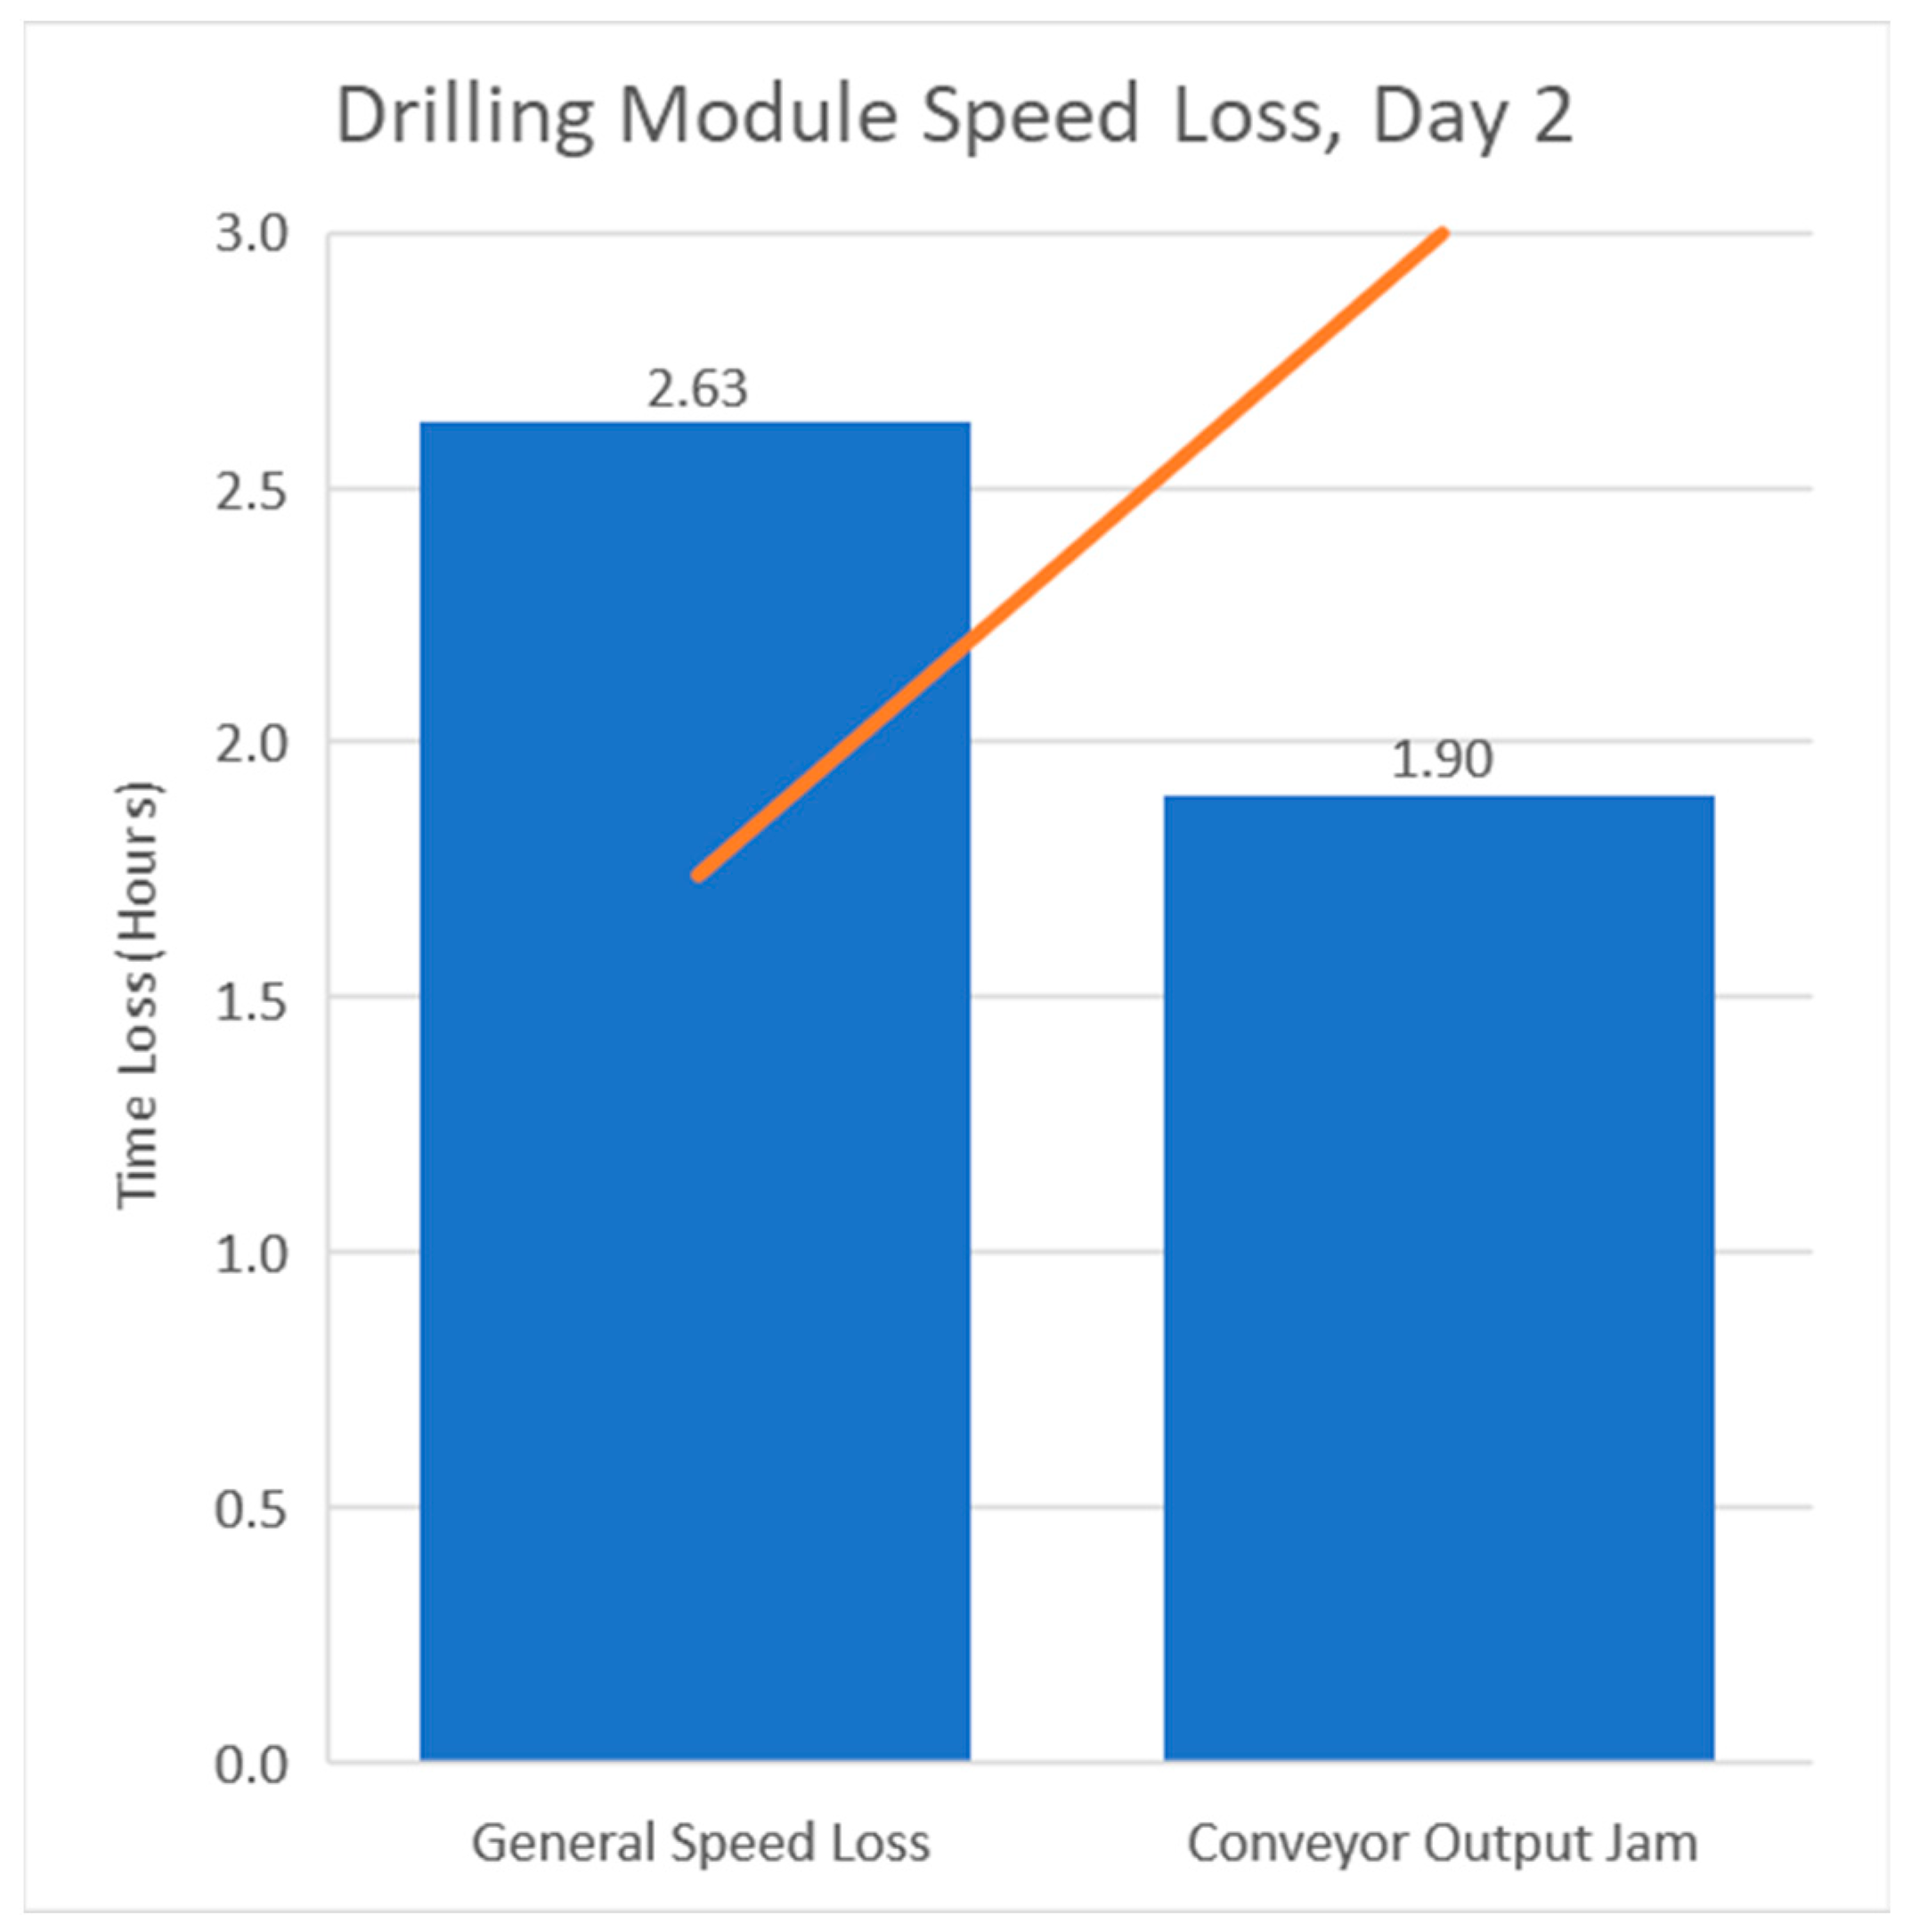
Figure 17) sheds further light on the impact of the unplanned maintenance event on that day. The obvious impact of performing the maintenance is visible, along with additional losses that may have been caused by the event including the initial system failure leading to the maintenance. Another notable loss on the second day occurred at the drilling module. Inspecting the pareto chart of the speed loss of that station on that day (see
Figure 18) shows a significant portion of the losses from the combined speed loss pareto chart (see
Figure 16) can be attributed to this location and time, comprising 1.90 h of the total loss of 2.04 h. Further information from the DPM solution shows that the cumulative conveyor output jam losses occurred over 1878 events, 1746 of which occurred at the drilling module on the second day of testing. These data show an obvious issue at that station resulting in the gradual accumulation of speed loss from a plethora of small events.
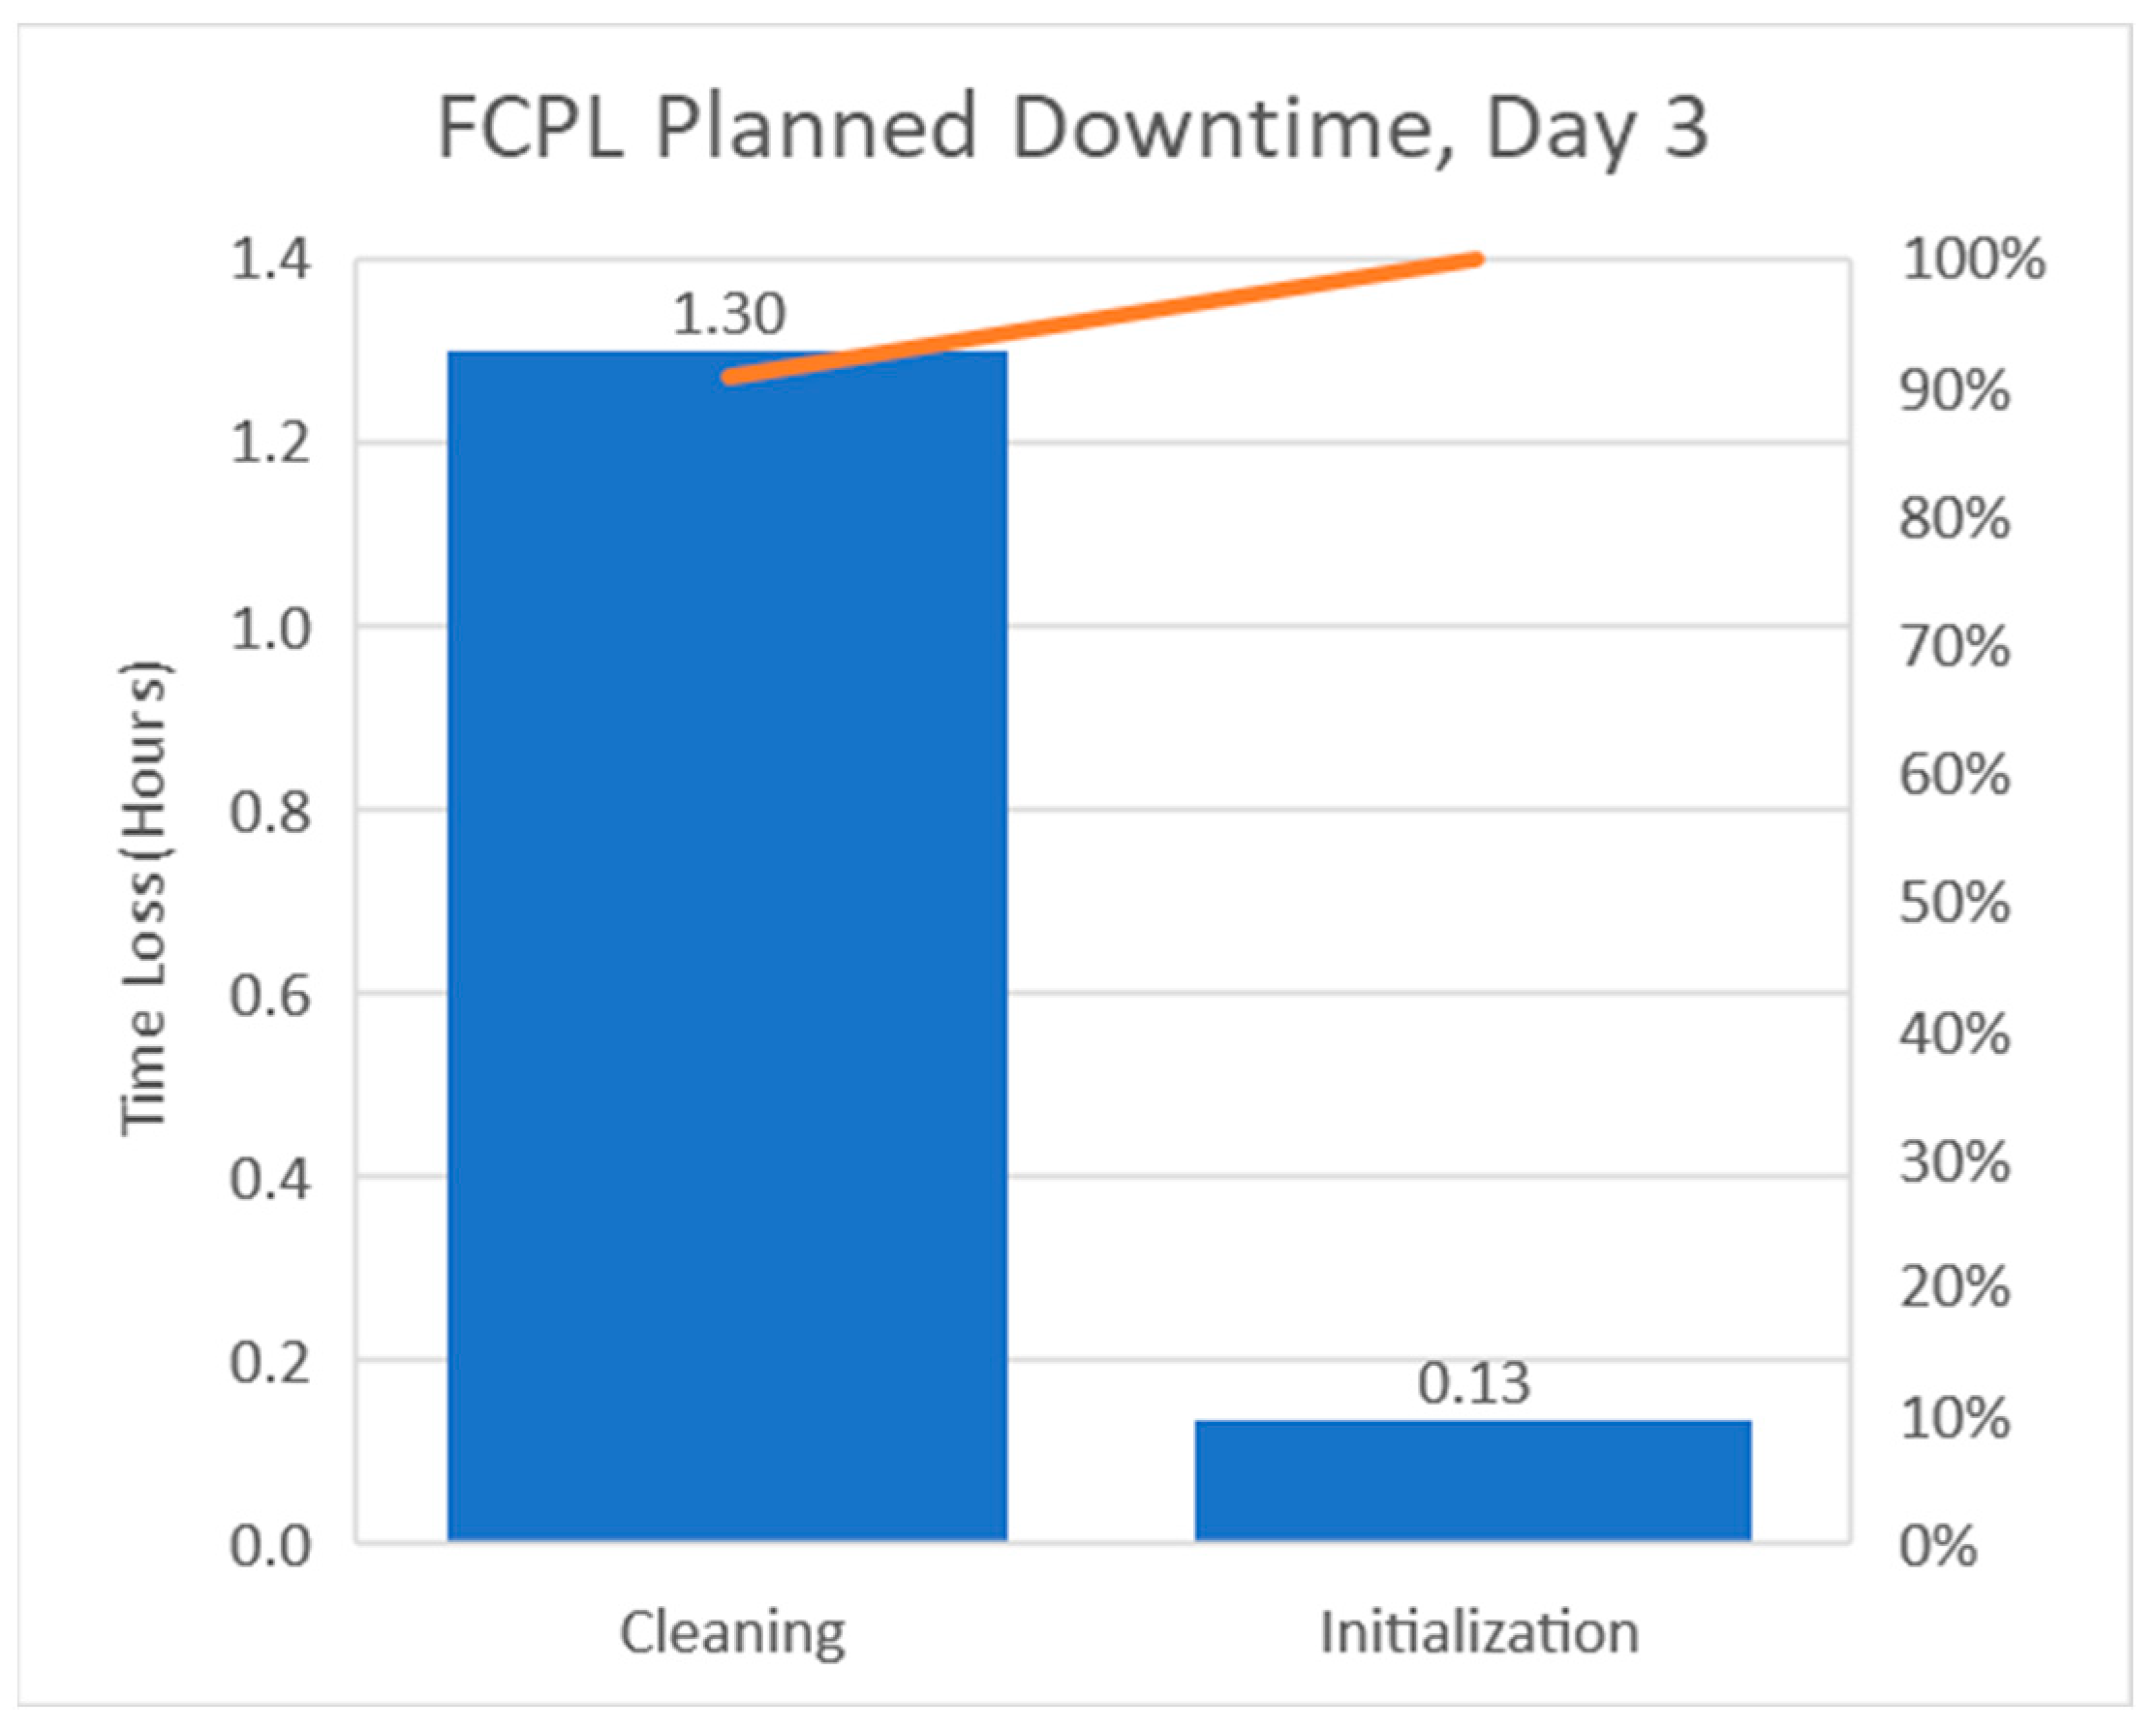
Further loss explanation regarding the drop in the FCPL’s effective time between the first and third day can be gleaned using the planned downtime pareto charts (see
Figure 19 and
Figure 20). These charts show that cleaning time nearly doubled between the first and last day, with an additional 36 min of allotted time. Combining this additional time with the known 7 min maintenance event on the third day (28 min cumulative) and the 26 min increase in speed loss visible between
Figure 15b,d results in 90 min of loss. This additional lost time accounts for 89.6% of the difference in effective time between the first and third day, giving specific insight to the reasons behind that drop.
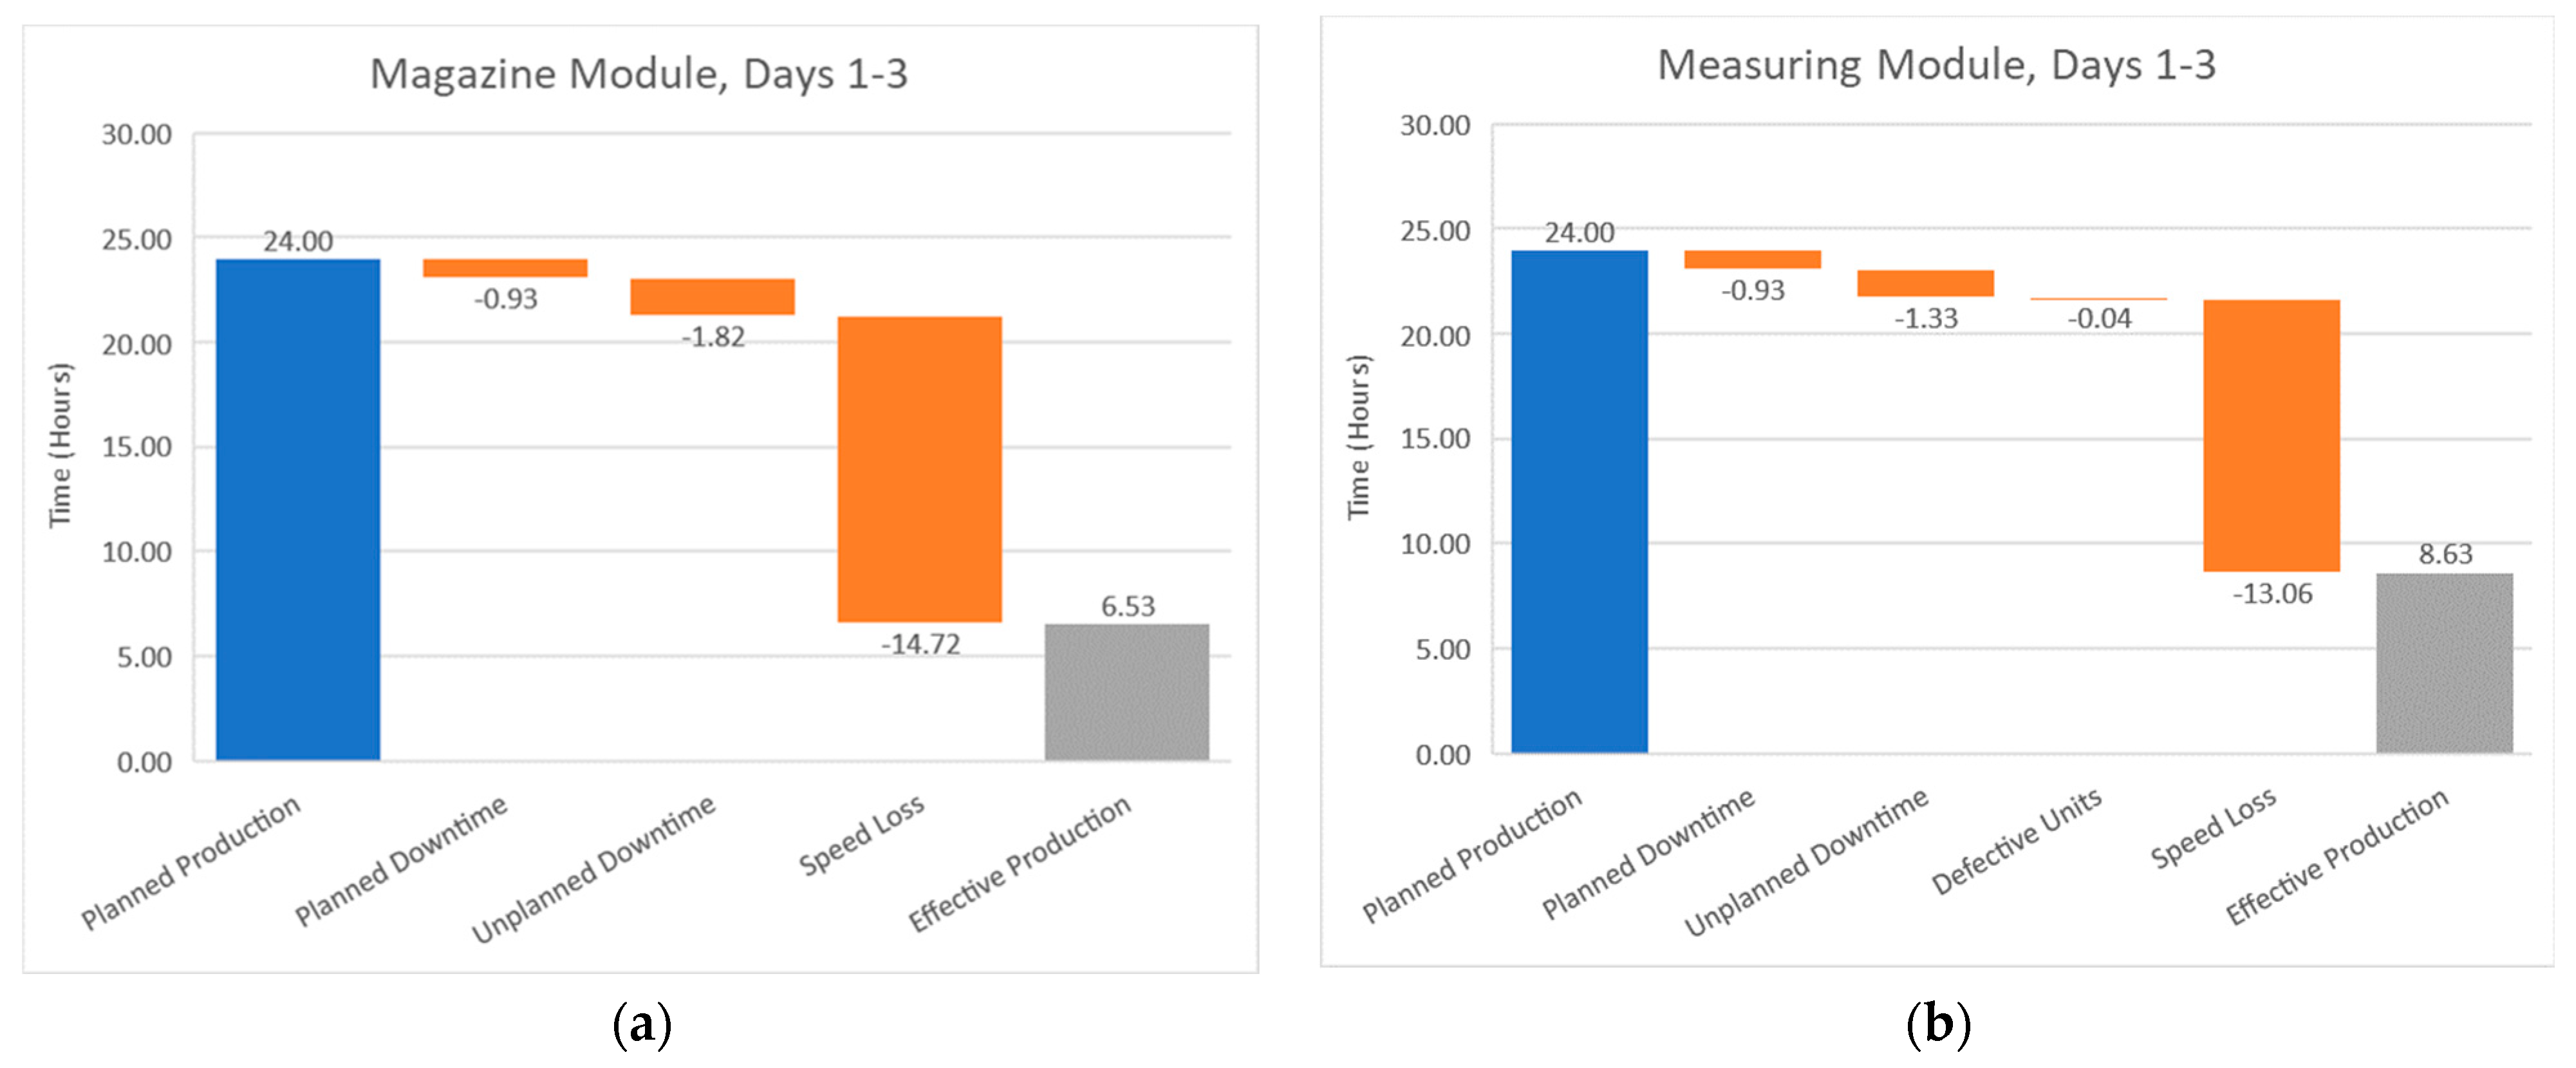
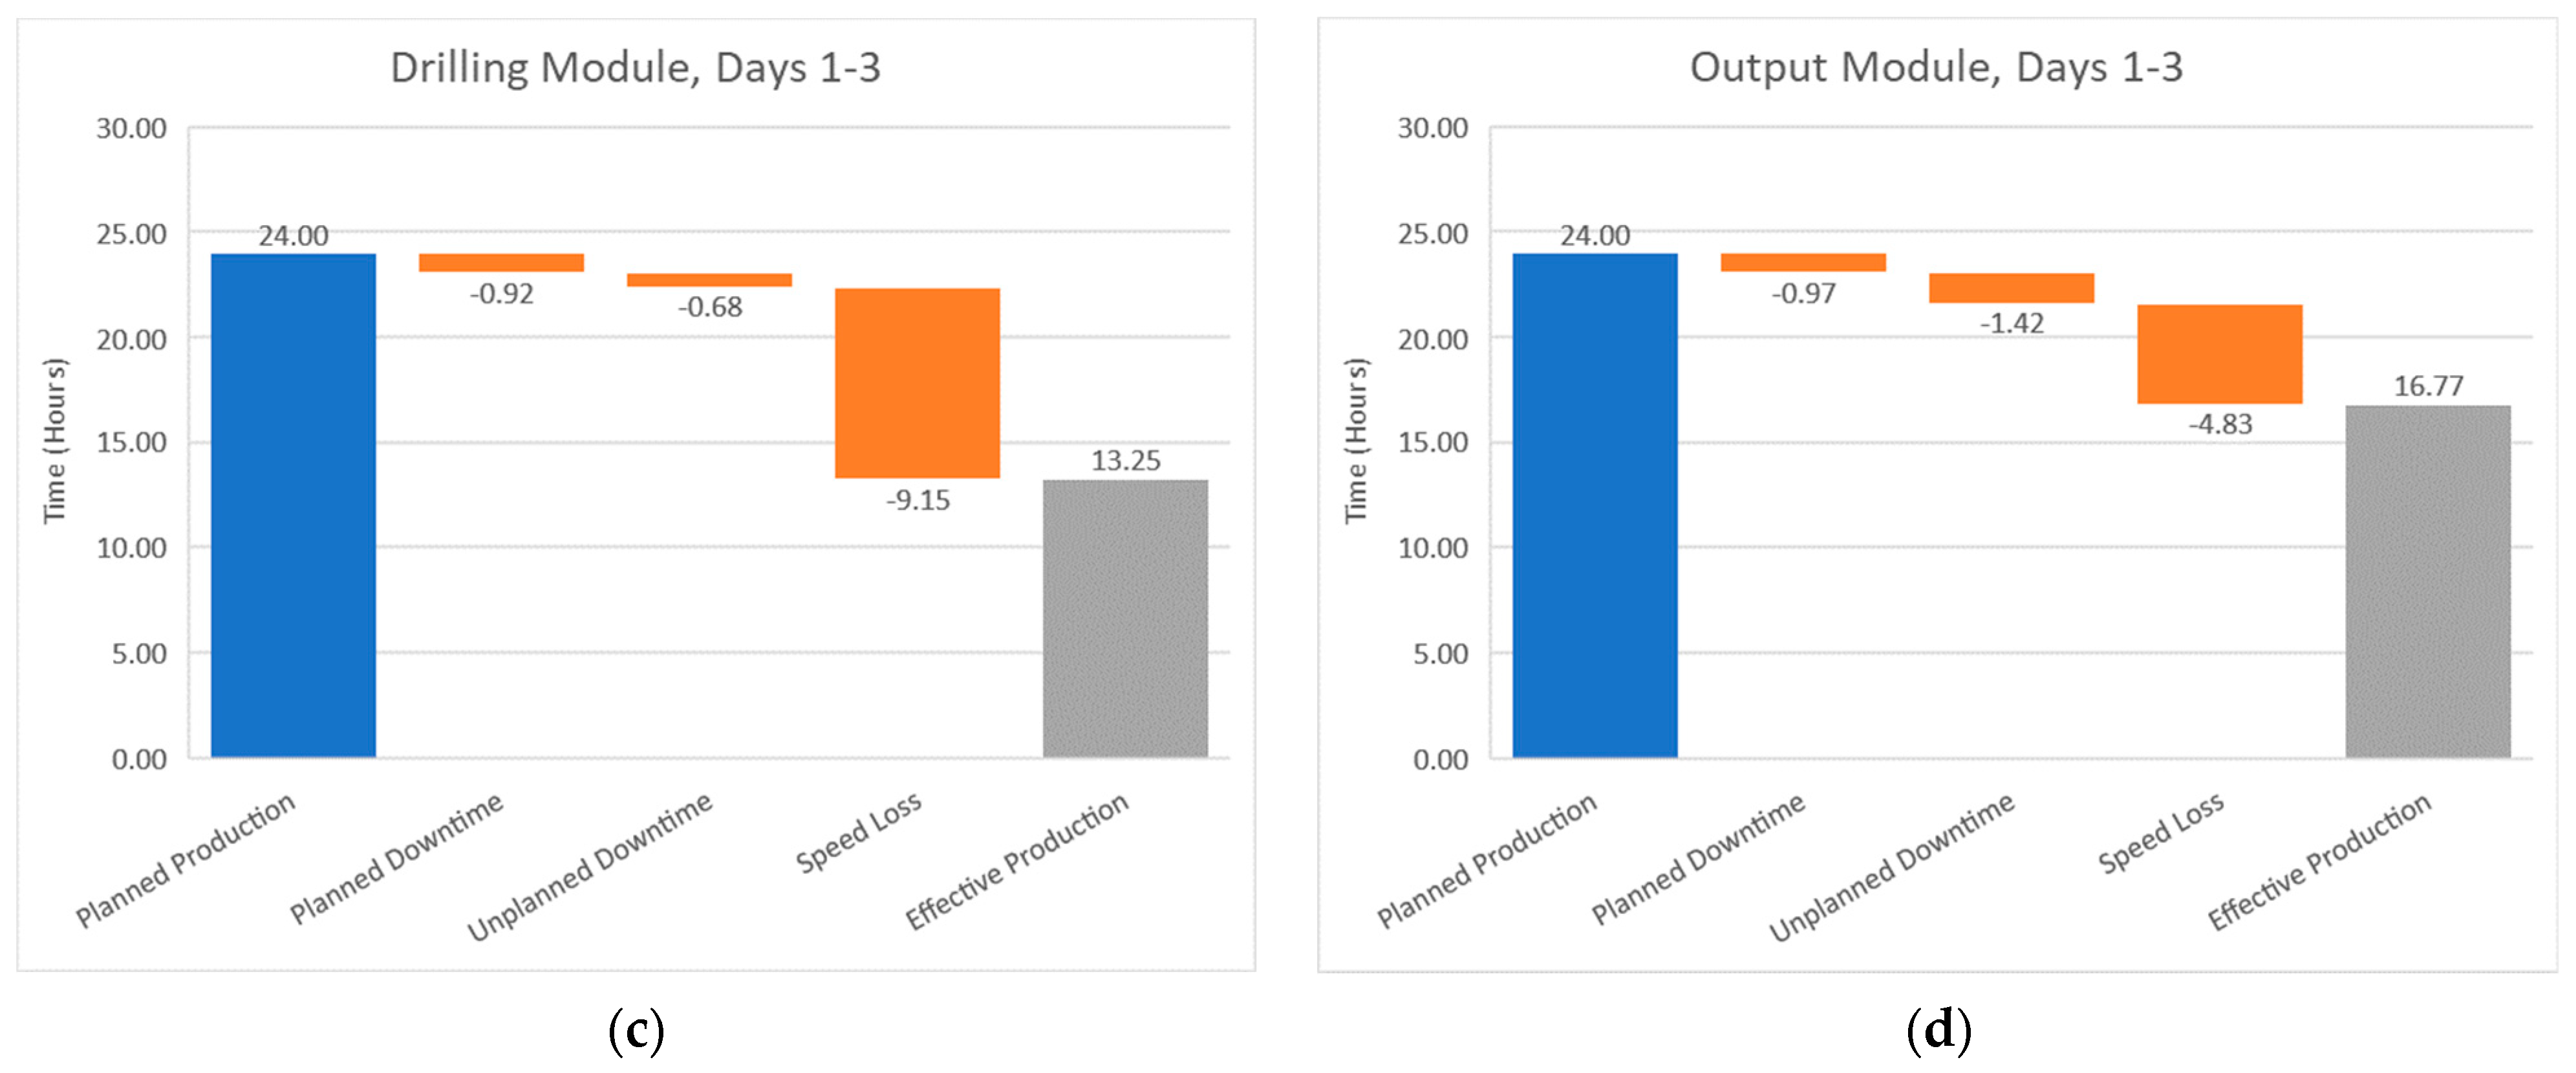
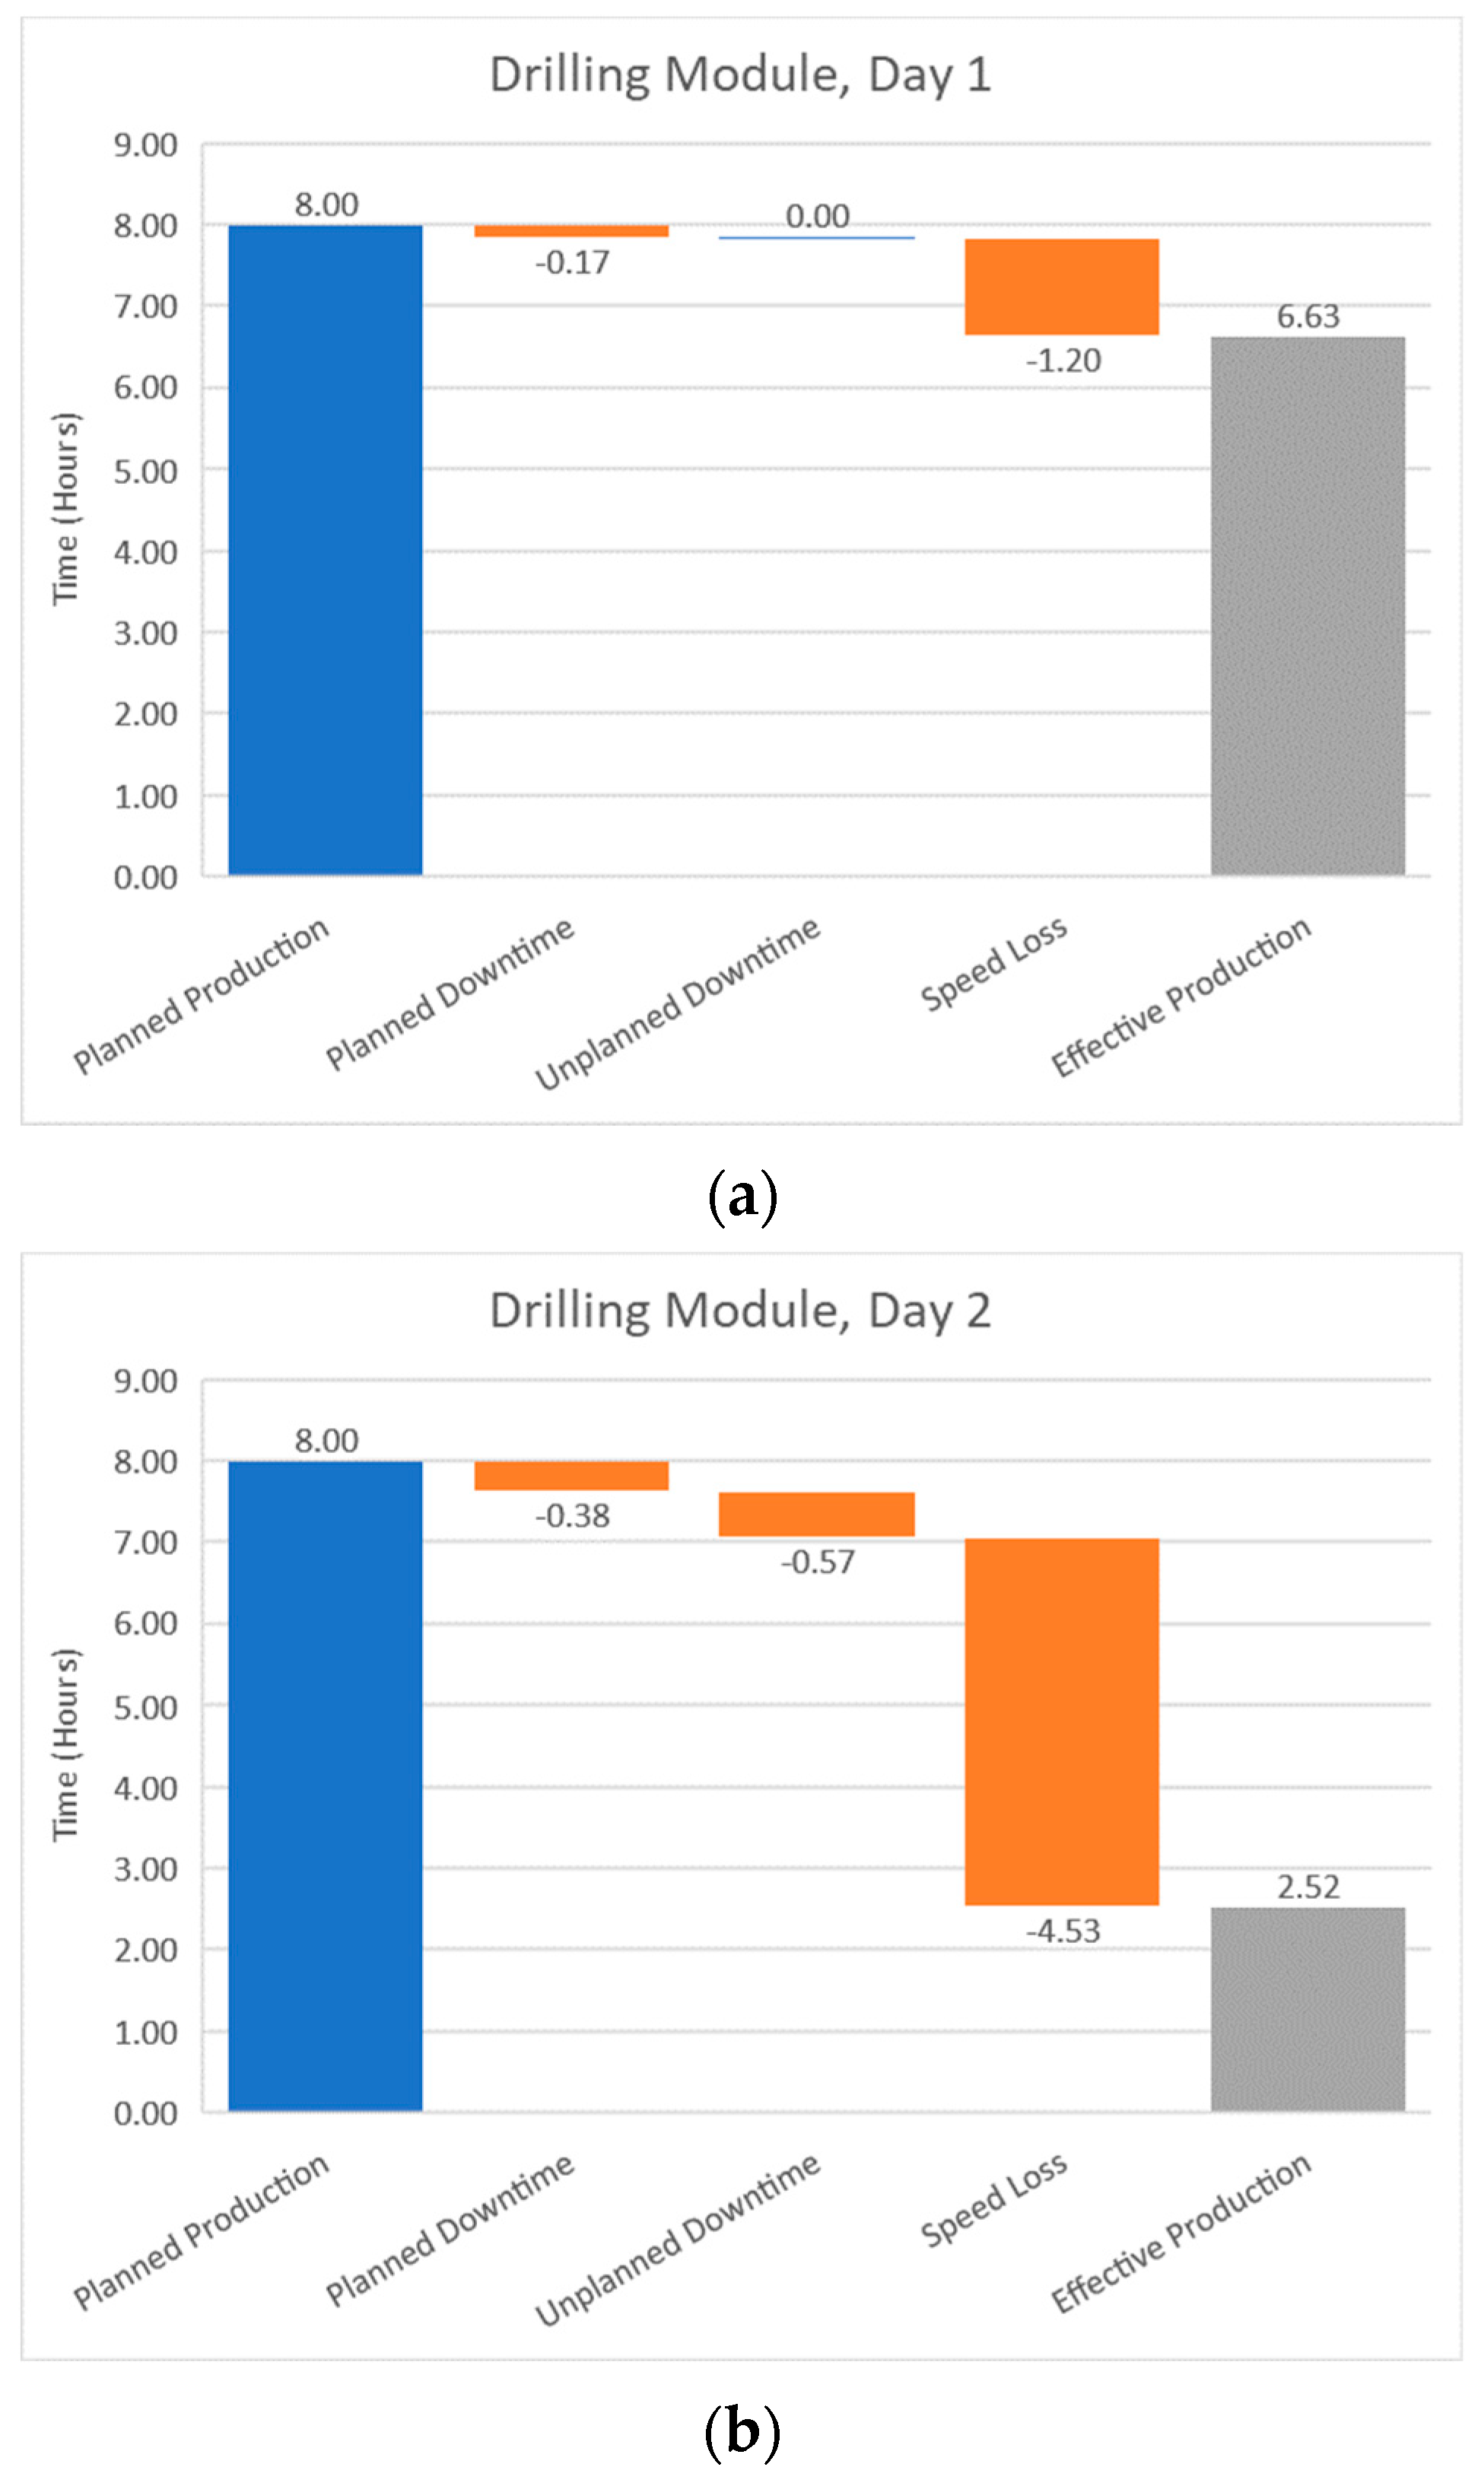
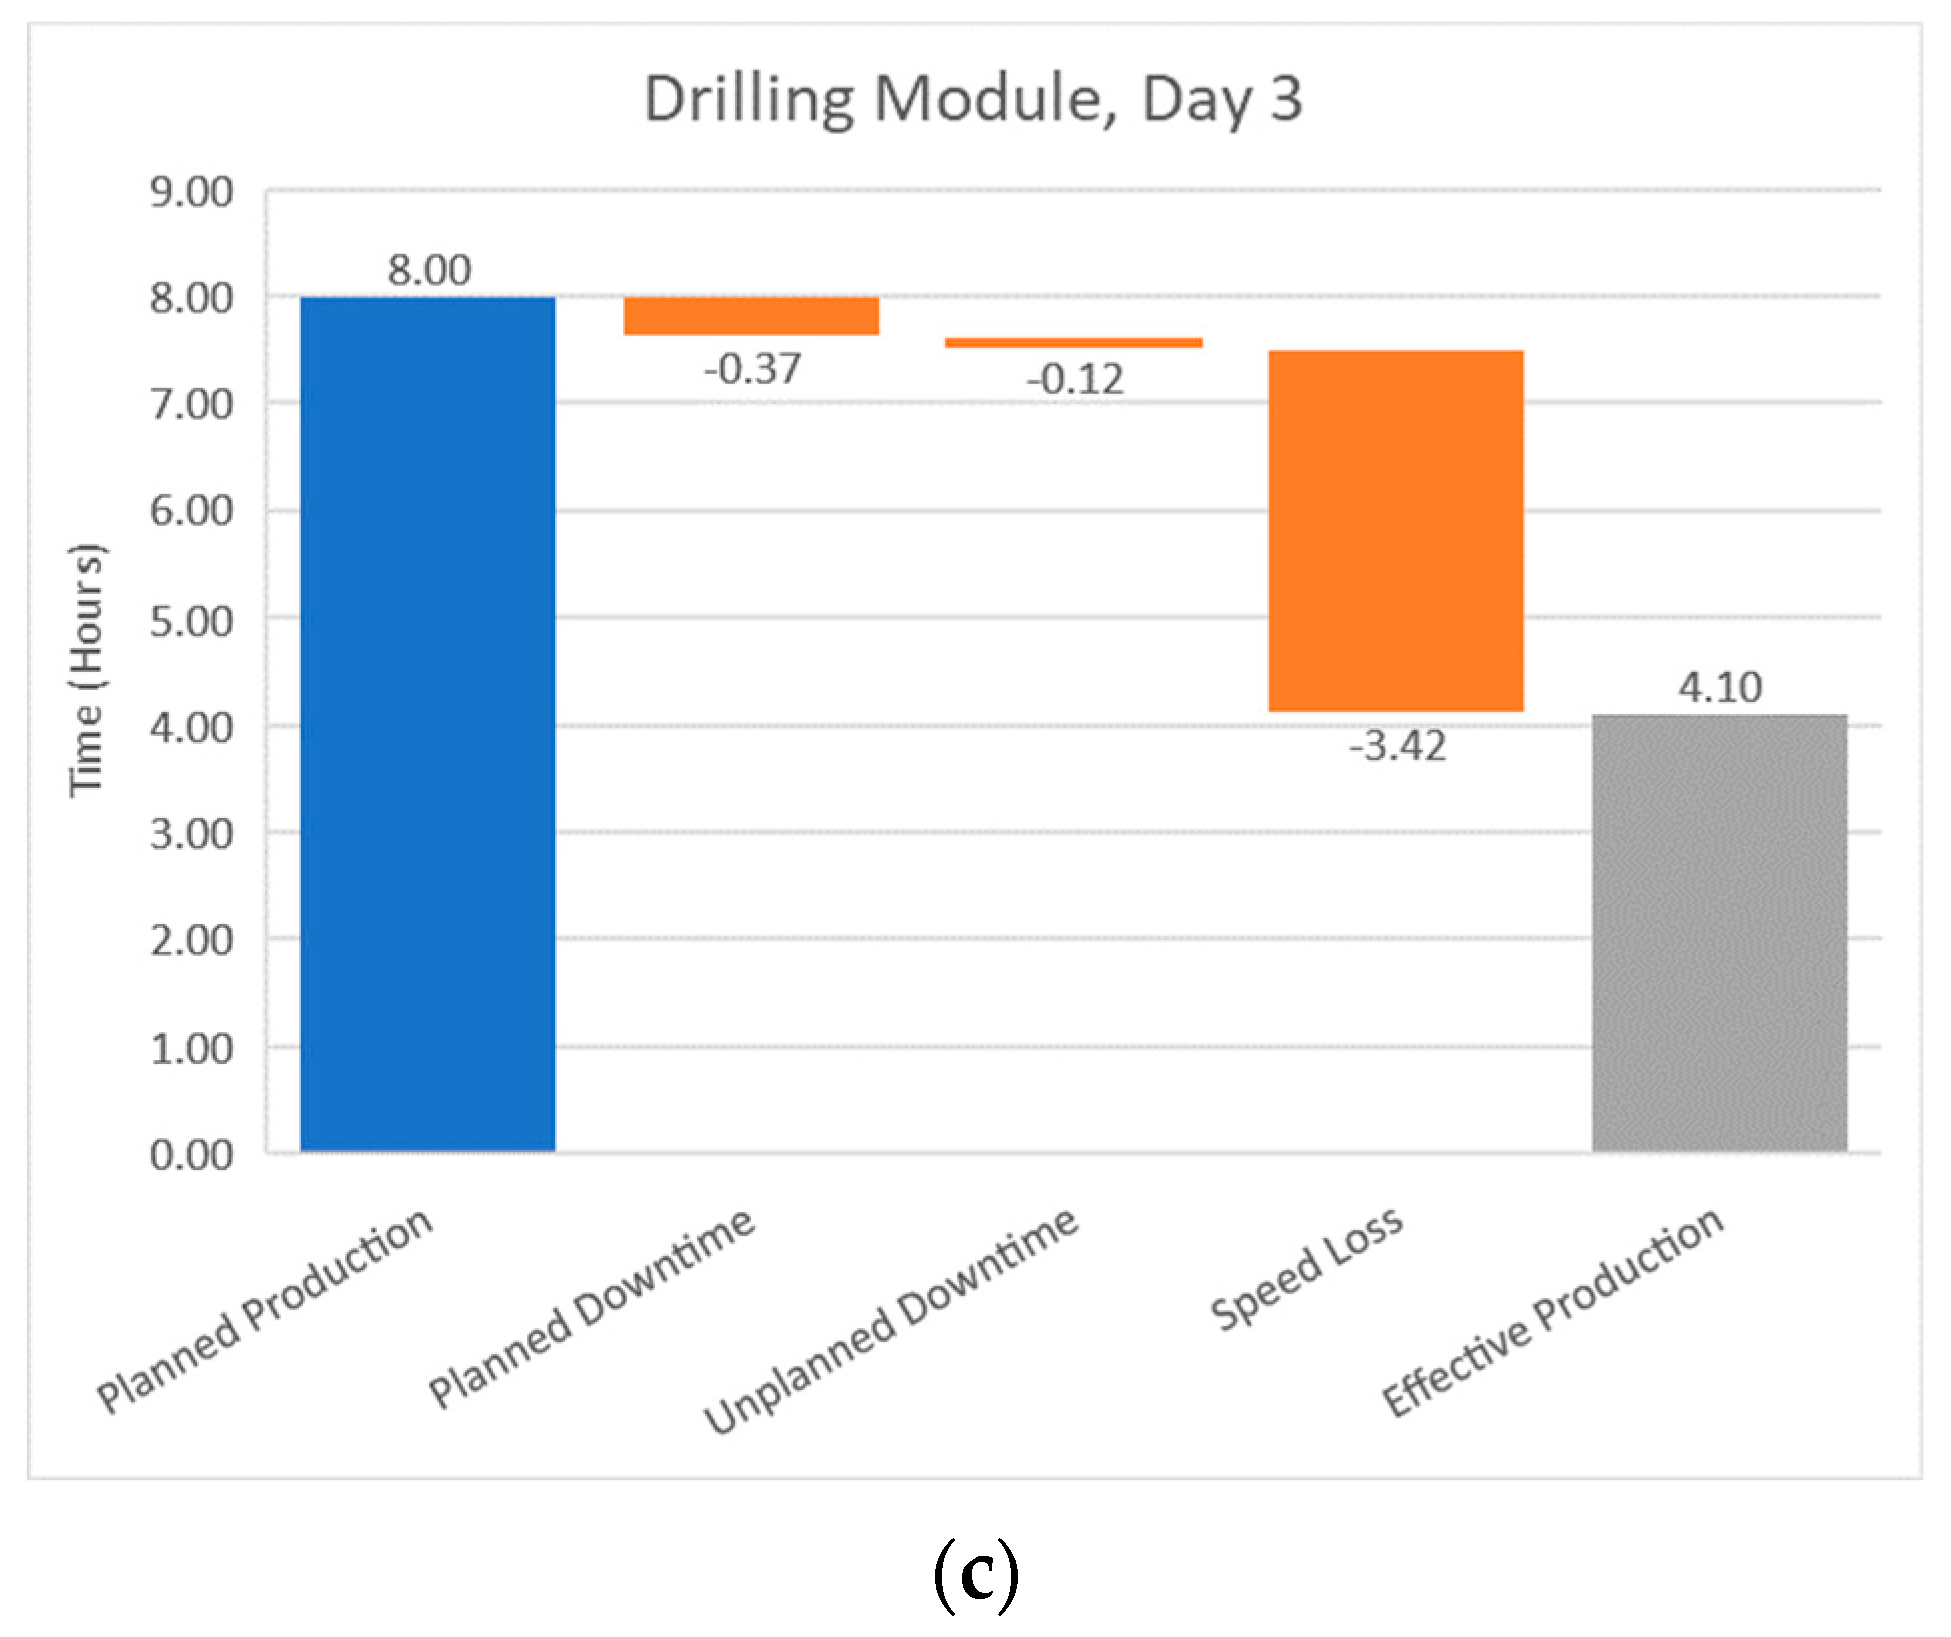
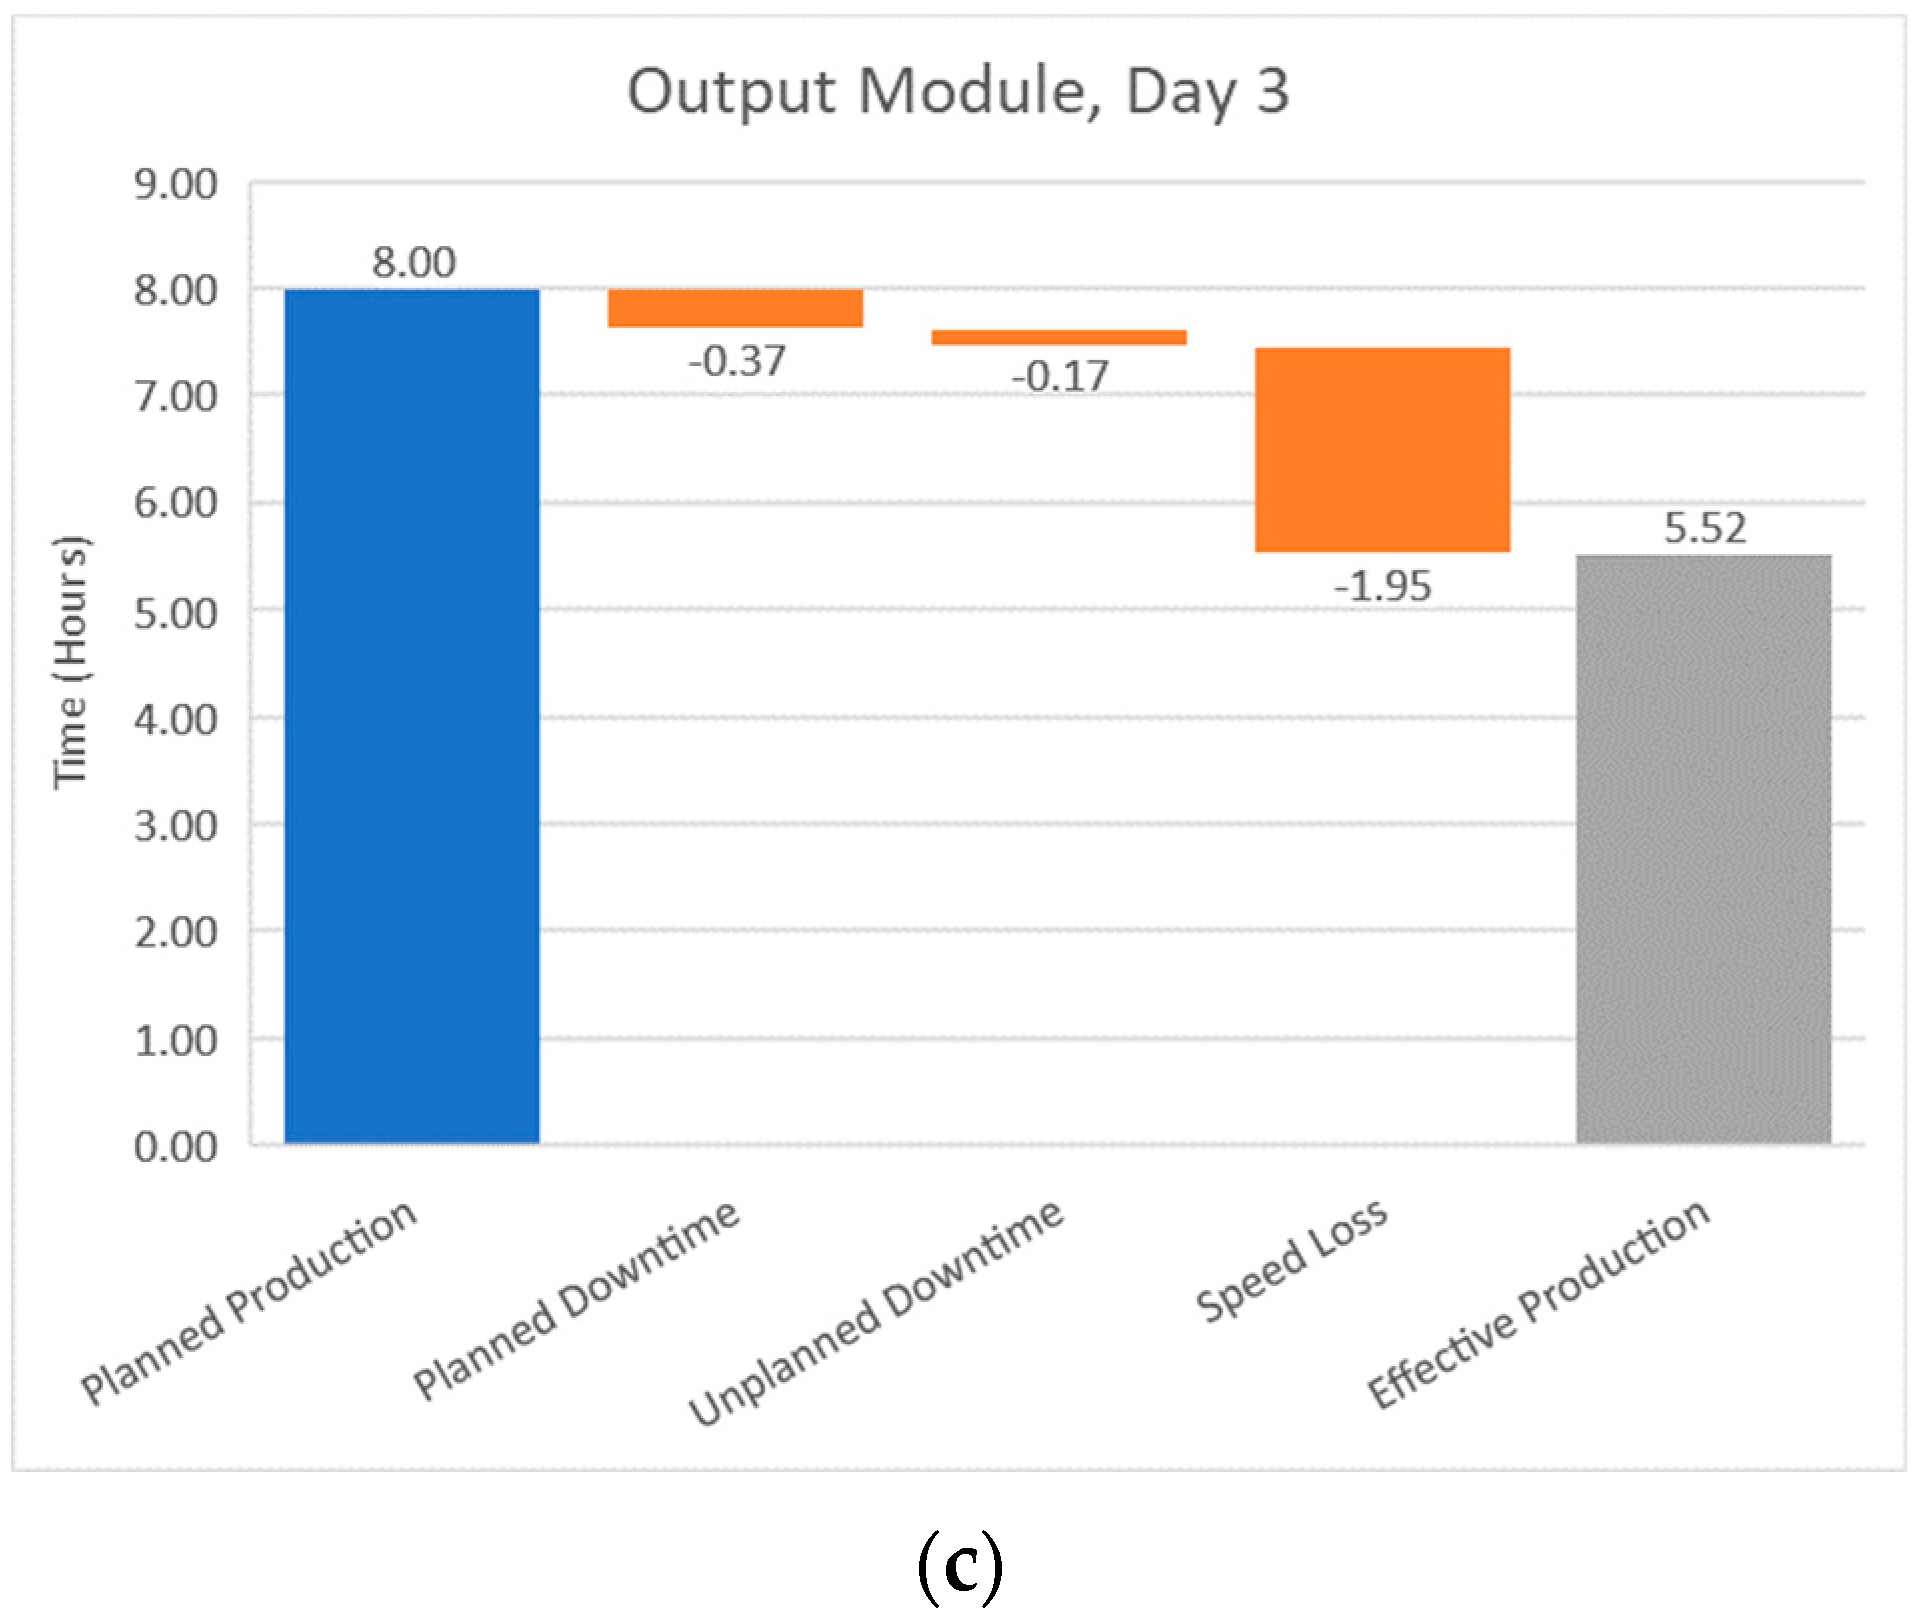
When viewing the stations individually over the testing period, totaling 24 h of planned production from the single station’s three 8 h shifts (see
Figure 21,
Figure 22,
Figure 23,
Figure 24 and
Figure 25), a correlation between the bottleneck station and effective time becomes apparent. In similar fashion to the highest OEE and bottleneck station relation, the greatest amount of effective time was held by the bottleneck station. This strong correlation between high effective time and the bottleneck station occurred for the same reason, namely that the limited number of part carriers restricted in-process inventory and slowed all stations to the bottleneck pace, resulting in input starved stations and lengthened cycle times. These waterfall charts also show a change in effective production time between the first and last testing day for all stations, with the magazine and measuring stations increasing and the drilling and output stations decreasing their effective time. In a similar manner to the trend in OEE, the range of effective time also decreased over the testing period due to process improvements balancing the cycle times across the FCPL and increasing utilization.
The DPM visualizations and data provide the following insights:
Due to the nature of the process, the module with the greatest effective production time is identified as the bottleneck. Examining the daily waterfall charts, it is evident that the bottleneck changed from the drilling module to the output module between day one and two due to improvements between these days.
Over the course of the testing period, the effective production time at the magazine and measuring modules increased, while the effective production time at the drilling and output modules decreased.
The range of the four station’s effective production times decreased over the testing period due to the process improvements between phases, leading to more balanced cycle times across the FCPL.
The planned downtime pareto charts show that cleaning time roughly doubled between the first and second day, remaining at that value into the third day.
This increase in cleaning time, a short maintenance period, and a small increase in speed losses accounted for 90% of the additional lost time on day three as compared to day one.
A total of 1878 conveyor output jam events created 2.04 h of lost time. Overall, 1.90 h of this lost time came from 1746 events occurring at the drilling module on day two.
4.4. Performance Management Strategy Comparison
Comparison between traditional and digital performance management will be done in three parts. First, compare how each approach presents data to the user and how that data can be interpreted. Second, compare the insights provided by both solutions. And lastly, compare the granularity and fidelity provided by each of the performance management strategies.
A key concept in Industry 4.0 is the visualization of data and how different users will require different data depending on their role in the enterprise. For example, a machine operator may be interested in the specific loss reasons being recorded by their equipment and the impact and severity of those events. Such a view is readily available in the DPM toolset, containing live data showcasing the recorded events and measuring how well current production is meeting the demand on the machine. Custom solutions taking the DPM approach will also have the data to create such operator-oriented views. From another point of view, a production supervisor may not be interested in the details of each machine at any given moment but might instead require a general summary of how multiple machines are performing at any point throughout the day. These views for end of day performance analysis have been presented in this research, though there is value in being able to view such waterfall charts at any point during a day or shift to monitor production health live and spot potential problems as they are forming and accumulating lost time. These different views allow for direct informed action on the factory floor and appropriate resource allocation higher up the enterprise. In contrast to the available visualizations in the DPM solution, a traditional performance management approach has only one set of views, that being the OEE measure and its components. To an operator, such a view has little to no value as it does not provide ready insights that can help them understand underlying problems with their equipment. While there can be some appropriate use of the OEE metric over time for a supervisor, such as spotting downtime events as they happen or falling utilization over several days or more, actionable insights are still absent.
The primary difference in how traditional performance management and digital performance management present their data is in their units of measurement. Traditional performance management uses percentages in its primary measure of OEE and its component measures of availability, performance efficiency, and quality rate. OEE has no context on its own as a percentage. Historical data can help contextualize OEE, as trends of change can indicate possible issues or improvements. However, no further information can be gleaned from it without additional information. Additional context is added when OEE is viewed with its components as any obvious similarities between the parent measure and the constituent parts will indicate the driving component, as was seen in the testing data with performance efficiency. However, the OEE components themselves are percentages and suffer from lack of context as well, though to a lesser degree. Drops in availability or performance efficiency may hint at downtime or speed loss issues but fail to help further pinpoint problem origins. Contrasting those measures is quality rate, which can succinctly summarize the rate of good parts produced without full production numbers.
The measures of digital performance management use time as their sole unit. Time measurements can be immediately understood in the fundamental context of a finite resource. With only so many hours in a day, week, month, or year, a measure of how much of that time was either wasted or effective in making a product becomes invaluable. At a level deeper, having the component data break down easily into specific categories and loss reasons aids in pinpointing where the greatest issues are and how much they are affecting production. Additionally, the presentation of more than one metric as the default high level output of this strategy forces the user to view key values and their impact on production, rather than gloss over a single metric.
This comparison of context can also be applied to how that data is interpreted by the user. In traditional performance management, an operator will know that OEE should be at or above some seemingly arbitrary number, while a supervisor might give special attention to the equipment with the lowest OEE attempting to improve the number. At a higher level, dissimilar machines performing a variety of tasks may compete for resources based on a single metric. Contrasting this, under a digital performance management approach an operator will be able to see how much of their shift is spent effectively making product and where their equipment is losing time. Managers will see and direct attention toward specific loss reasons to gain productive time back from them.
These differences in data presentation and interpretation can be best seen by comparing the insights gained from testing. Two specific insights that resulted concurrently in the two performance management solutions can be expounded on to see this difference, namely the drops in effectiveness on the last testing day and the performance and speed loss issues at the drilling module on day two. Both approaches agreed that effectiveness on the last day was reduced from that observed on the first day. Traditional performance management showed this with an 8.1% drop in OEE at the bottleneck output module, which could be attributed to a similar drop in performance efficiency. In comparison, digital performance management showed an additional 1.48 h of lost time between the first and last day, which could be attributed to an increase in planned downtime from additional cleaning time, increased unplanned downtime from a short maintenance event, and a small increase in speed losses. In this example, the digital approach pinpoints and quantifies the impact of specific reasons for the drop in effectiveness, while the traditional approach only hints at a performance efficiency issue.
The second pair of insights to compare is the availability drop and speed loss issue at the drilling module on day two. Traditional performance management showed that the availability of the drilling module on day two was reduced to roughly 80%. From viewing the reported downtime, the reason for this availability drop was a steady accumulation of an additional 1.19 h of downtime (compared to the next highest downtime) during the duration of that testing day. The digital performance management solution instead showed an increase to losses from 1746 conveyor output jam events totaling 1.90 h. While both solutions pointed to an accumulation of loss occurring over the course of the day, the specificity of the loss reason, its frequency, and the quantified impact from the digital approach gives actionable insight to the cause, while the traditional approach would require further inquiry to determine the cause.
This example also highlights comparisons to be made regarding data granularity. The traditional performance management solution provides a cumulative downtime figure at its most detailed level, while the digital performance management approach segregates downtime losses into specific loss reasons. The lack of granular data in the traditional approach hinders problem resolution as further investigation into the general causes of the downtime is required before root cause analysis can continue. On the other hand, a digital approach will give specific insight as to the general cause of a downtime event and can lead immediately into root cause analysis. Additionally, the frequency of when these performance management insights are updated and available can be quite different. As designed, a traditional approach will take measurements periodically and via manual means whereas a digital approach will constantly gather data at high refresh rates. With electronically gathered data, a traditional approach can achieve these high frequency measurements, but insights are only valuable after a sufficient data population has been gathered to produce a stable baseline for comparison. Digital approaches, however, will have insights available at any time as the measurements taken do not need this baseline comparison but instead are an accounting of how time was being utilized over the period observed.
The fidelity of the data composing and presented by the two performance management solutions is also apparent in the granularity of their data and methods of accounting. By nature, DPM will have equal or better fidelity than traditional, manually gathered performance metrics. Using units of time, a finite resource, requires that all time be accounted for. It is important to acknowledge that manually entered values in a DPM system may reduce the fidelity and granularity of the data as rounding times and summarization of events can occur in such situations. These accounting errors can be mitigated with increased data gathering automation, relieving operator reporting responsibility. Electronically enabled traditional performance management can aid in increasing the fidelity of its data, but the approach still suffers from the limitations of a single summary measure wherein the calculation of that measure can obfuscate data and blur insights available from the raw measurements. Furthermore, the many proposed variations of the OEE metric also suffer from the same drawbacks, even when data for those calculations are gathered by electronic or computerized means. The availability of these variations also lends itself to possible manipulation of the data, picking and choosing the metric that may make production look best rather than reflect its actual state.
