Abstract
The operating conditions of the production process significantly influence the resulting dimensional and form accuracy of the workpiece. The operating conditions include the position of the workpiece location, with internal and external heat sources influenced not only by the machine location but also by its operation. In addition, there are the cutting conditions and the feed rate requirements of CNC machine tools. These changes, such as workpiece position, feed rates, and machine heat load, are further reflected in the ability of the machine to run at the position required and interpolate within the given tolerances of circularity. For the accuracy and repeatability of positioning, the machine was set up according to ISO 230-2 and for the circular interpolation tests according to ISO 230-4. The obtained results show the importance of attention to the appropriate setting of the operating conditions of the production process, where the knowledge of the geometric accuracy of the CNC machine tool in its working space can systematically increase the manufacturing accuracy itself or be another tool suitable for predicting the dimensional and form accuracy of workpieces.
1. Introduction
Nowadays, industry is placing more and more emphasis on precision and production quality. This requirement also applies to the machining process, where the perfection of material processing depends on many factors that influence the resulting accuracy of the circularity and positioning of the machining centre. One of these factors is operating conditions, which play a key role in the machining process and affect the overall accuracy of production.
Machining centre accuracy is a fundamental requirement for the production of precision workpieces. Insufficient machine accuracy results in the production of poor-quality parts and a significant increase in waste, which increases costs and reduces production efficiency [1]. A precision machining centre, on the other hand, can produce workpieces of the required dimensions with minimal waste. Such production is not only economically efficient but also environmentally sustainable, so research into the impact of operating conditions on machining centre accuracy is very important not only from a technical but also from an environmental point of view.
One way to maintain and improve performance is to make mechanical adjustments or software error compensation. This process is known as machine tool calibration [2]. The basic point of machine tool calibration is the measurement and compensation of positioning errors. To measure these errors directly, they are usually measured with a laser interferometer aligned with the measured axis. Calibrated artefacts are also used for these measurements [3]. Several commercial instruments have been successfully developed for measuring geometric errors of linear axes. A very commonly used laser interferometer is XL-80 (Renishaw, Wotton-under-Edge, UK). The software from XL-80 then calculates and plots graphs of positioning errors depending on the position of the measured axis according to, for example, ISO 230-2 [4]. However, these devices can only measure a single geometric error, depending on the settings of the optical components. The principle of setup and measurement is described by Zhang [5].
The circular interpolation test according to ISO 230-4 [6] is often used to verify the machine condition. For example, the Ballbar equipment developed in the early 1980s is used for these measurements [7]. DBB tests are used to test the accuracy of machine tool errors because they are time-saving, easy to set up, and use the principle of dynamic measurement. Based on the measured data, information on geometric errors such as squareness, reversal error, backlash, positioning error, circularity, scaling mismatch, etc. can be obtained using the appropriate software. Using the data from the various circular tests, machine behaviour can be analysed in more detail [8].
The aim of this research is to analyse the effect of different operating conditions on the accuracy of the circularity (according to ISO 230-4) and positioning of the machining centre (according to ISO 230-2) when using a three-axis milling machine [4,6]. Proving the correlation between the position of the workpiece in the working space of the machine by the feed rate will be the next step in the field of predicting the dimensional and form accuracy of workpieces. In the publication [9], the correlation between geometric accuracy and working accuracy of CNC machine tools for milling technology was proven. The publication first assesses the current state of knowledge on the subject and then identifies individual influences that are not only measurable and assessable but also relatively easy to reduce. In the next section, a method for testing the machine tool itself is planned. The last section analyses and discusses the results carried out.
2. Materials and Methods
2.1. State of the Art and Research Approach
A machine tool is a complex and intricate piece of equipment with high accuracy demands. Accuracy is understood as the ability to achieve long-term conformity between desired and achieved parameters. The accuracy of machine tools (MT) is classified according to the factors that influence it. There are several types of accuracy [10,11,12,13]:
- -
- Geometric accuracy
- -
- Positioning accuracy
- -
- Circular interpolation accuracy
- -
- Volumetric accuracy
- -
- Machining accuracy
- -
- Production accuracy
Positioning accuracy determines the accuracy and repeatability of ramp-ups to the desired position for linear and rotary axes. It is defined, among others, by ISO 230-2; VDI/DGQ 3441 [14]. Positioning accuracy is significantly influenced by the drive system and the type of assembly. The concept of positioning accuracy is often associated with the concept of repeatability, which is defined as the difference between the desired and actual value at n times the number of cycle repetitions. In practice, these two terms are often combined into the single word ‘accuracy’, although repeatability is more important, since it depends on the accuracy and mechanical unit of the machine, while accuracy can be ‘fine-tuned’ by corrections [9]. The laser interferometer measures the actual position of the milling machine table (Figure 1). The position of the table is measured using an optical sensor. The program processes these signals to calculate the deviation between the target position and the actual position.
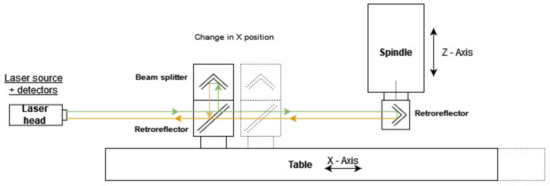
Figure 1.
Schematic arrangement for evaluating positioning accuracy.
- Accuracy of circular interpolation
Ideally, on a perfectly accurate CNC machine, the resulting circular path produced by interpolation would match the programmed command. However, it is affected by several geometric and dynamic errors (encoder, straightness, temperature change, friction, etc.), and the resulting path does not have the same radius around the circumference. If the actual trajectory is accurately measured, it can be compared to the ideal trajectory and a measure of the accuracy of the MT can be developed based on this measurement. This measurement is described in detail in ISO 230-4. Figure 2 shows a schematic representation of the measurement with the DBB QC20-w (Renishaw, UK), (Figure 2).
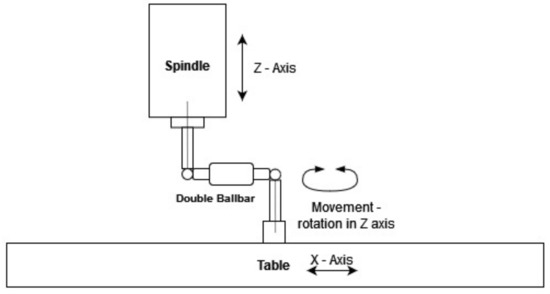
Figure 2.
Schematic arrangement for evaluating circularity.
- Machining tools errors
These errors can be understood as the deviation of the TCP position from the theoretically desired value relative to the workpiece. The error range of the machine indicates the degree of its accuracy (geometric, working, manufacturing). For example, in terms of volumetric accuracy, it is the maximum magnitude of the error vector between the working volume of the machine. There are several types of factors influencing machine accuracy [13,15,16]:
- -
- Geometric and kinematic errors
- -
- Machine assembly-induced errors
- -
- Errors induced by thermal distortions
- -
- Dynamic errors
- -
- Cutting force-induced errors
- -
- Fixture dependent errors
Errors due to geometric inaccuracy are errors in the machine tool caused by its actual manufacture and assembly (mechanical errors in its construction and incorrect initial tooling setup). Over time, these errors deteriorate due to mechanical wear. There are 21 geometric errors on the three-axis machine tool (Figure 3). They are divided into translational (3 × 3), angular (3 × 3), and linear axis squareness errors (3). All these errors can have a negative effect on the resulting positioning accuracy of the machine and hence on the accuracy of the machined part. The probability of error occurrence increases with dynamic axis interpolation. The squareness errors are in A0Z (squareness in the Y-Z plane), B0Z (squareness in the Z-X plane), and C0Z (squareness in the X-Y plane) [15,17].
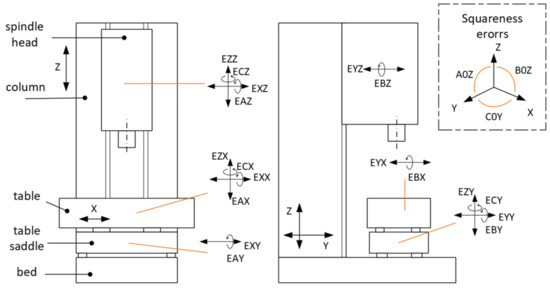
Figure 3.
Geometric errors of three-axis vertical machining centre.
A significant number of scientific contributions focus on the influence of working conditions related to the temperature influence of TCP. Paper [18] describes the influence of the thermal behaviour of the machine on the test workpiece. The results demonstrate the correlation between the results of the performed R-test and the results measured on the test workpiece. The authors also present the possibility of including additional position-dependent thermal errors. Another group of scientific papers is concerned with the development of compensation methods, which are subsequently verified on a test workpiece [19]. The results demonstrate a reduction in thermal-induced error in the range of 56–73% compared to the uncompensated MT.
The correlation between machine geometric accuracy and machine working accuracy is the focus of [20]. The results show that the geometric accuracy condition affects the working accuracy of the machine in a certain way, and this information can be further used to predict deviations in the workpiece.
The paper [21] focuses on predicting and improving the accuracy of motion control in machine tool feed systems. Validation measurements according to ISO 230-2 or ISO 230-4 standards, which are part of the submitted paper, were not performed in this work. In the publication [22], the authors present the procedures of a new proposed measurement method, which may be suitable in the future for the assessment of selected operating conditions of machine tools. Verification measurements were performed according to ISO 230-2 and ISO 230-4.
In the present paper, the results of measurements according to the proposed method with subsequent analysis of the measured data are already presented. The measurement plan is based on a systematic analysis of the task. Measurements were carried out according to ISO 230-2 and ISO 230-4 at different feed rates and measurement positions at defined points in the machine working space. At the same time, the temperature load of the machine was monitored at selected points. The results of the data obtained from the measurements show that the parameters considered are influenced by the operating conditions of the machine tool.
2.2. Experimental Setup
This section describes the design of the experiment. The tests include tests of circularity measured by the DBB and positioning accuracy measured by the laser interferometer. The effect of operating conditions at different measurement and machine settings will be monitored. The test procedure is shown systematically in the form of a flow chart in Figure 4.
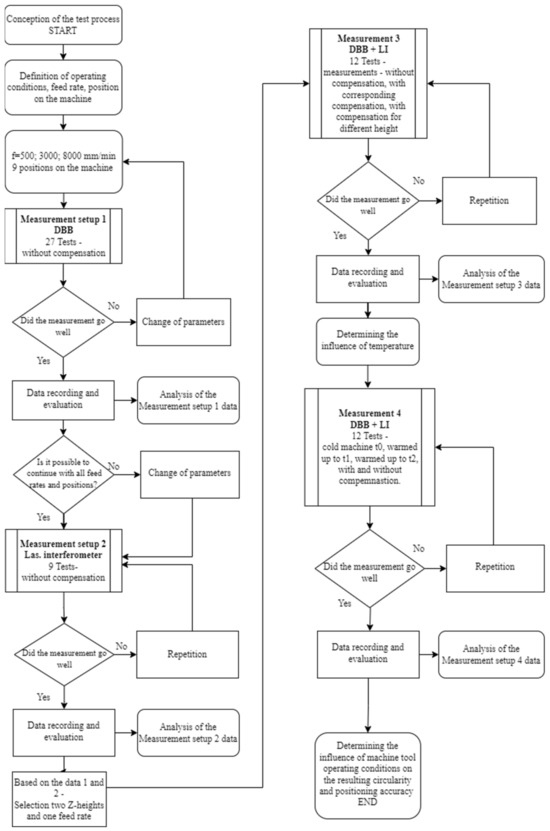
Figure 4.
Flow chart of measuring process.
The experiment is aimed at assessing the effect of operating conditions on the positioning error and the resulting circularity error. The factors influencing these variables were chosen to be the position in the machine, by changing the Z axis coordinate that represents the position of the workpiece. The ISO 230-2 test was then set up for the X axis, i.e., the EXX error. For the roundness test, the change of the workpiece position was set by the X and Z coordinates. The machine coordinate of the Y axis was kept for all tests. The following compensation was set for the EXX error only. If the Y (EYY) and Z (EZZ) axis positioning compensations were to be applied, the results represented by the circularity error would be affected.
2.2.1. Measurement Setup 1
Measurement 1 assesses the influence of the feed rate and the position of the measurement (T1–T9) in the working space (Figure 5) of the machine on the resulting circularity error according to the circular interpolation test of two linear axes. The machine was set up without geometric compensation. A total of 27 tests were run (three different feed rates: 500, 3000, 8000 mm/min in 9 positions).
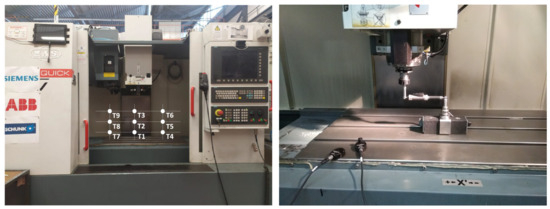
Figure 5.
Positioning of control positions in the machine workspace—left, ballbar test T1 position—right.
Figure 6 shows the three positions of the DBB in the machine workspace.
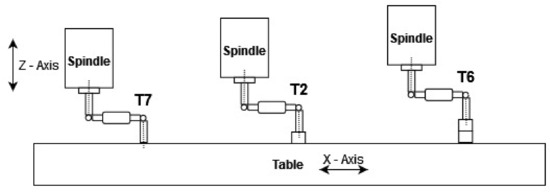
Figure 6.
Position of the DBB in the workspace of the machine for measured points T7, T2, and T6.
2.2.2. Measurement Setup 2
Measurement 2 assesses the effect of feed rate and measurement position in the machine workspace on the measurement of the accuracy and repeatability of X axis positioning (Figure 7). The machine was set up without geometric compensation. A total of 9 tests were run.
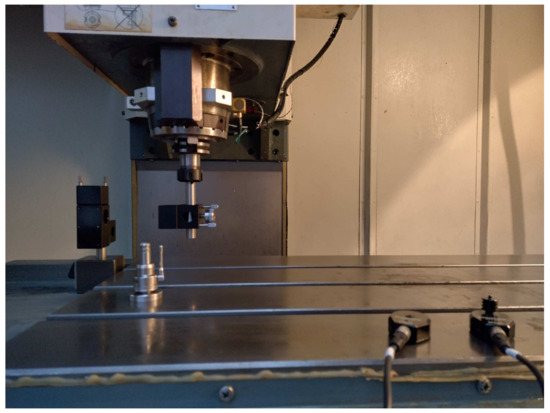
Figure 7.
Laser interferometer measurement, position 1, z1, z = −460 mm.
Figure 8 shows the three positions of the laser interferometer in the workspace of the machine. Only the Z coordinate changes when the laser interferometer position is modified. The measurement of the positioning error (EXX) is measured on the X axis.
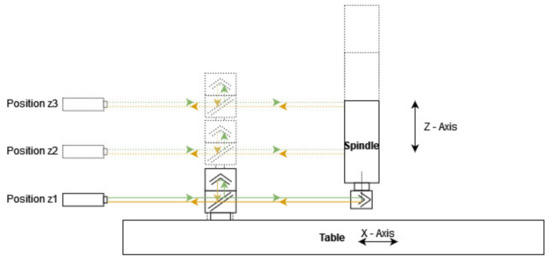
Figure 8.
Laser interferometer measurement, position 3, z3, z = −350 mm.
2.2.3. Measurement Setup 3
Measurement 3 describes the influence of the activation of the X axis positioning error compensation on the feed rate and the position of the measurement in the working space of the machine tool (Figure 9). A total of 12 tests were run.
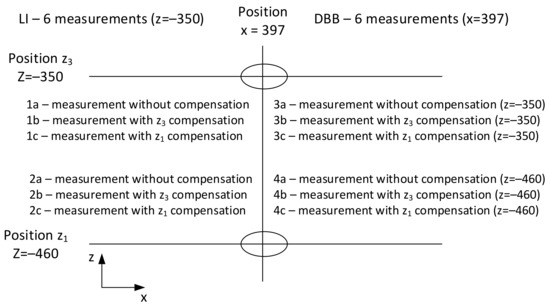
Figure 9.
Measurement setting for laser interferometer and ballbar.
2.2.4. Measurement Setup 4
Measurement setup 4 is aimed at assessing the influence of temperature on the results according to ISO 230-2 and ISO 230-4. The measurements were carried out in three temperature modes. The first mode with Meas. t0 corresponds to the state of the machine before machine tempering. The second mode Meas. t1 is after a warm-up cycle of 40 min. The third mode Meas. t2 was after another warm-up cycle of 60 min. A total of 12 tests were run.
2.3. Demonstrator
All positioning accuracy and circularity measurements were performed on the MCV 754 QUICK (Kovosvit MAS, Czech Republic) (Figure 10 and Table 1). This is a three-axis milling machining centre with a C-frame, equipped with direct measurement, automatic tool change, and high-pressure cooling.
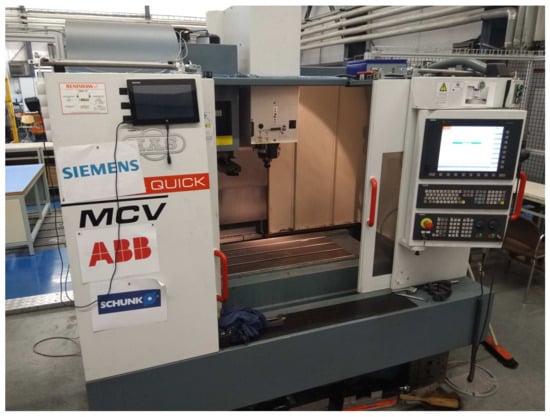
Figure 10.
Three-axis vertical machine centre MCV 754 QUICK.

Table 1.
MCV 754 parameters.
SINUMERIK 840Dsl (Siemens, Munich, Germany) was used as a machine control system. The technical parameters of this vertical machining tool are given in Table 1.
2.4. Measurement Devices
An XL-80 laser interferometer with an XC-80 compensator and a double ballbar QC20-w (Renishaw, UK) were used as the measuring equipment to check the geometric accuracy of the CNC machine tool.
The XL80 laser interferometer has a resolution of 1 nm and an accuracy of 0.5 ppm (Table 2). The measurement uncertainty can be estimated according to the following equation [23]:
U(k=2) = 0.2 µm + 0.3 × L µm/m,

Table 2.
Laser interferometer parameters.
The accuracy of the DBB QC20-w measuring system is ±1.25 µm (Table 3).

Table 3.
Ballbar parameters.
The measurement uncertainty can be estimated according to the following equation [24]:
U(k=2) = 0.70 µm + 0.30% L (µm),
3. Results
The results are further compared according to the individual measurement setups 1–4. The following measurements were carried out according to the recommended methodological procedures according to ISO 230-2 and ISO 230-4. The encoder compensation option was used to introduce corrections in the Siemens control system.
3.1. Measurement Setup 1
The results of measurement setup 1 based on the circular interpolation test of two linear axes according to ISO 230-4 are shown in Table 4. The setting of the measurement parameter variables corresponds to the scheme shown in Figure 4. An example of the results of the ISO 230-4 analysis is shown in Figure 11. The graph on the left shows the results of the circularity error in the measured X-Y plane. The plots have a resolution of 2 µm/div and show the deformation of the circle corresponding to the change in scaling mismatch from 8.8 µm to 13.1 µm and the squareness error from 9.6 µm/m to −2.4 µm/m. These effects are then reflected in an increase in the circularity error from 9.7 µm to 11.3 µm. The setting for Test 1 is at a feed rate of 8000 mm/min. The graph on the right shows the results for Test 6 with the same feed rate of 8000 mm/min.

Table 4.
Results of Measurement Setup 1.

Figure 11.
Results of circularity deviation for Test 1/8000 mm/min −left and Test 6/8000 mm/min—right.
The results show that by changing only the position in the working space of the machine and by changing the feed rate, significant changes in the assessed parameters are observed. For positioning tolerance, the difference was up to 10.7 µm; for circularity error, 4 µm and scaling mismatch 5.6 µm; and for squareness error, the difference was up to 22.7 µm.
The temperature at selected points on the machine tool was also monitored. Specifically, these were linear encoders’ X and Y axis measurements where two temperature sensors were placed on each linear encoder’s measurement. The measurement process of setup 1 took 5 h. The horizontal axis of the graph in Figure 12 shows the number of measurements. The temperature difference during the measurement did not exceed 0.8 °C. From this point of view, the measurement is considered to be temperature-stable.
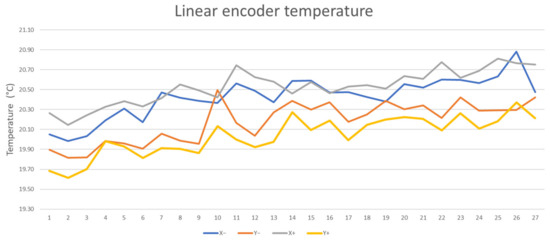
Figure 12.
Temperature profile on encoders for Measurement Setup 1.
3.2. Measurement Setup 2
Measurement setup 2 was aimed at evaluating the positioning error using a laser interferometer and monitoring the effect of the change in machine position and feed rate. A demonstration of the results analysed according to ISO 230-2 is shown in Figure 13. The graph above shows the test setup for position 1 (z1) and a feed rate of 3000 mm/min. The positioning accuracy in this case is equal to 23.6 µm. The bottom graph shows the results for position 3 (z3) at the same feed rate of 3000 mm/min. The positioning accuracy in this case is equal to 31.0 µm.
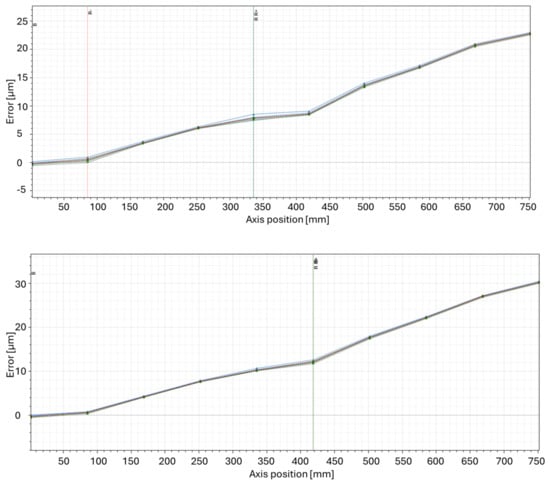
Figure 13.
The positioning error path for z1 3000 mm/min—up and z3 3000 mm/min—down.
A complete overview of the results from measurement setup 2 is shown in Table 5.

Table 5.
Results of measurement setup 2.
The results show that the feed rate f has no significant effect in the case of positioning error evaluation. The resulting error A is within 1.1 µm (Figure 14), which falls within the bias of measurement uncertainty and environmental change. Only in the measurement of the position of Position 3 was the measured value offset. This can be attributed to the high unloading of the beam splitter located on the milling machine table. With the high dynamics, a divergence occurs that fails to stabilize within the given time window. It can be observed in the repeatability parameter (Figure 15).

Figure 14.
Results of accuracy of positioning, measurement setup 2.
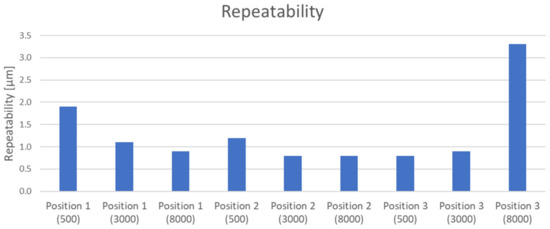
Figure 15.
Results of repeatability, measurement setup 2.
On the other hand, the measurement height (Z axis position) at a difference of 110 mm gives an error of 8 µm for A and E (Figure 9), which is approximately 34% of the error at the −460 mm position. For the other evaluated parameters (R, B, M), it can be concluded that neither the measurement position nor the feed rate has an effect.
The temperature at selected points on the machine tool was also monitored for setup 2. The temperature gradient was 0.7 °C.
3.3. Measurement Setup 3
Measurement setup 3 monitored the effect of setting the X axis positioning compensation strategy. A feed rate of 3000 mm/min was set to eliminate measurement time and the possible influence of changing ambient conditions and dynamic effects on the interferometer reflection on the results. In addition, two extreme positions in the Z axis were selected where differences from the previous setup were evident when evaluating the ISO 230-2 parameter A. The results are analysed from both the ISO 230-2 (Table 6) and ISO 230-4 (Table 7) tests.

Table 6.
Results of measurement setup 3, data from laser interferometer according to ISO 230-2.

Table 7.
Results of measurement setup 3, data from ballbar according to ISO 230-4.
From the results shown in Table 3, the accuracy of positioning A and systematic positioning deviation E are dependent on the compensated position (z1 or z3). It can also be seen that the chocking of the compensation value, which varies with the position in the Z axis, is maintained. The R, B, and M parameters do not show any dependence on the compensation and Z axis position.
The results presented in Table 4 show that the observed parameters are not significantly dependent on the change of the Z axis position. The values are within 3 µm. The differences are only noticeable when the compensation is off or on. In the case of the circularity analysis, there is only a difference of 4 um in all measurements (Figure 16). In measurement setup 3, the measurement according to ISO 230-2 is more evident than the ISO 230-4 measurement. Of course, the ISO 230-4 test gives us more information about the machine tool in significantly less time.
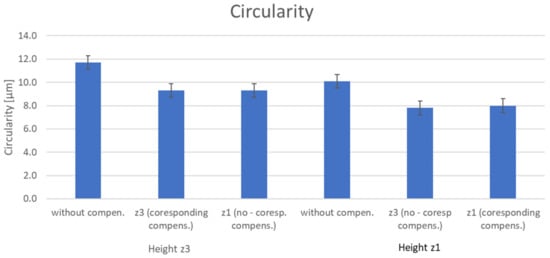
Figure 16.
Results of circularity according to ISO 230-4, measurement setup 3.
The temperature at selected points on the machine tool was also monitored for setup 3. The temperature gradient was 0.4 °C.
3.4. Measurement Setup 4
Measurement setup 4 is implemented for three machine temperature conditions, t0, t1, t2 (Figure 17), and compensation settings (on and off). The temperature profile for the conditions Meas. t0, Meas. t1, and Meas. t2 is shown in Figure 5 and Figure 6. The maximum temperature difference at the point of measurement on the linear encoders was 1.5 °C. The results are analysed from both the ISO 230-2 (Table 8) and ISO 230-4 (Table 9) tests.
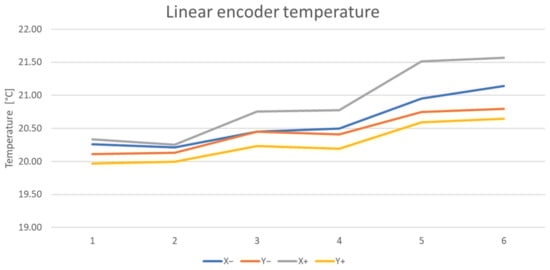
Figure 17.
Temperature profile for measurement setup 4.

Table 8.
Results of measurement setup 4, data from a laser interferometer.

Table 9.
Results of measurement setup 4, data from ballbar.
The results show that the ballbar measurement system responded better to the temperature change, with an increase in position tolerance of 4.2 µm and a scaling mismatch of 0.5 µm for the uncompensated condition. When the compensation was then activated, the tempered state variant of the machine was more effective by 3 µm. For the laser interferometer measurement, there was a shortening of the axis by 1.2 µm for parameter A, with an expected effect similar to the ballbar result. After activation of the compensation, the values for the states t0 to t2 were in the range of 1.3 to 1.7 µm, which can be considered stable. The same effect was exhibited by parameter E. To investigate this behaviour more effectively would have required a higher temperature gradient to be achieved at the instant on the linear encoders of the machine.
3.5. Prediction of Geometric Accuracy
Based on the collected data under defined operating conditions (Figure 4), it is possible to estimate the change in position error in a given axis based on selected errors according to ISO 230-2 and ISO 230-4. The magnitude of the X axis positioning error for the machine without compensation ranged from 20.5 to 33.1 µm and for the XY-plane squareness error from −2.4 to 20.3 µm/m. For the proposed measurement procedure, the X axis position error and Z axis position error can be expressed according to Equation (3):
where Exxp is the positioning error obtained from the laser interferometer, Exxsq is the squareness error from the circularity test calculated for the change of position in the X axis, and zn is the position of the spindle in the Z axis. For position z1, which is defined by Test 7, Test 1, Test 4 for f = 500 mm/min (Table 4) and Position 1, f = 500 mm/min (Table 5), Equation (4) corresponds to the calculation of the position error:
where x corresponds to the traveling range of the machine in the X axis (0–750 mm), y corresponds to the traveling range of the machine in the Y axis (0–500 mm) and z1 corresponds to the position −460 mm.
Exx, zn = Exxp, zn (x,y) + Exxsq, zn (x,y),
Exx, z1 (x,y) = −0.3125 + 0.0138x + 0.00002x2 + (22.973 − 0.0216x − 0.00003x2)/(1000/y),
For position z2, which is refined by Test 5, Test 2, Test 8 for f = 500 mm/min (Table 4) and Position 2, f = 500 mm/min (Table 5), Equation (5):
where z2 corresponds to position −405 mm.
Exx, z2 (x,y) = −0.7002 + 0.0225x + 0.00002x2 + (18.407 − 0.0092x − 0.00007x2)/(1000/y),
For Position z3, which is defined by Test 6, Test 3, Test 9 for f = 500 mm/min (Table 4) and Position 3, f = 500 mm/min (Table 5), Equation (6):
where z3 corresponds to position −350 mm.
Exx, z3 (x,y) = −0.0821 + 0.0231x + 0.00003x2 + (23.9 − 0.018x − 0.00004x2)/(1000/y),
The interpretation of the results for the Z axis positions, z1 = −460 mm, z2 = −405 mm and z3 = −350 mm is shown in the following figures (Figure 18, Figure 19 and Figure 20).
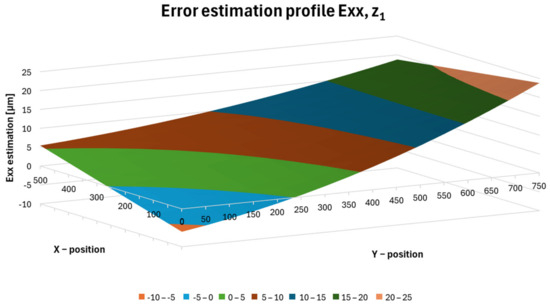
Figure 18.
Error estimation profile Exx,z1.
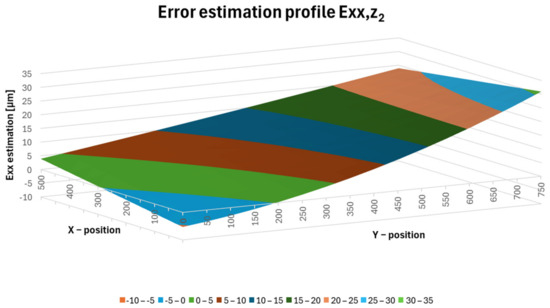
Figure 19.
Error estimation profile Exx,z2.
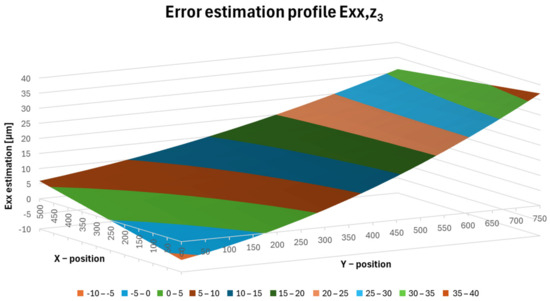
Figure 20.
Error estimation profile Exx,z3.
Figure 18 shows the Exx error at the z1 position, where the variance of the resulting Exx,z1 error ranges from −6.1 to 23.8 µm.
Figure 19 shows a plot of the Exx error at the z2 position, where the variance of the resulting Exx,z2 error ranges from −5.3 to 30.9 µm.
Figure 20 shows a plot of the Exx error at position z3, where the variance of the resulting Exx,z3 error ranges from −6.1 to 37.1 µm.
Figure 21 shows the dimensional changes in the X axis direction on a workpiece that is placed in the x = 100 mm, y = 100 mm position with dimensions 300 × 300 mm. An estimate of the resulting form of the workpiece loaded under operating conditions is then illustrated in the figure below.
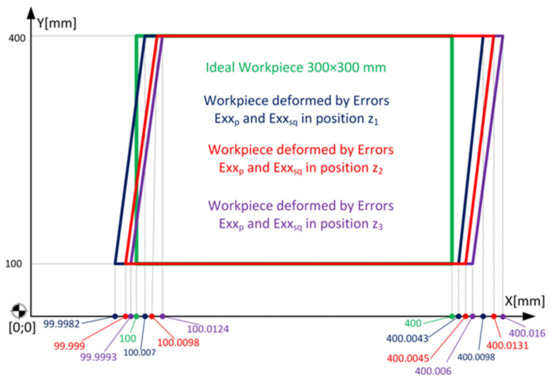
Figure 21.
Estimation of the form error on the defined profile.
4. Discussion
The results show that the machine setup in terms of accuracy is very important for the choice of positioning and compensation settings. It is also important to consider the magnitude of the linear axis displacements.
From the results of the measurement setup 1, the factors influencing the observed parameters, namely the position in the workspace and the feed rate, became apparent. The value of circularity increases with increasing velocity, which is due to the dynamic error namely reverse spikes. On the other hand, large changes are observed for the squareness parameter, which is strongly dependent on the position in the workspace. Furthermore, a difference of approximately 2 µm can be observed for the position tolerance parameter between feed rates of 500–8000 mm/min at each measured position in the machine. Figure 22 shows the display of the results from the circular interpolation test according to the measurement position in the machine workspace. There is a large variance in the position tolerance (PT) and individual tests that differ in X and Z axis positions. These results correspond to the measurements obtained with the laser interferometer. A second marked variance is then seen in the squareness errors (SQ) for tests 7, 8, and 9, which are located at position x = 152 mm and positions 1, 2, and 3 corresponding to x = 397 mm (Figure 23). The squareness error is therefore mainly dependent on the position of the x axis. The error of measurement (SM) is independent of the individual changes in the feed rate.
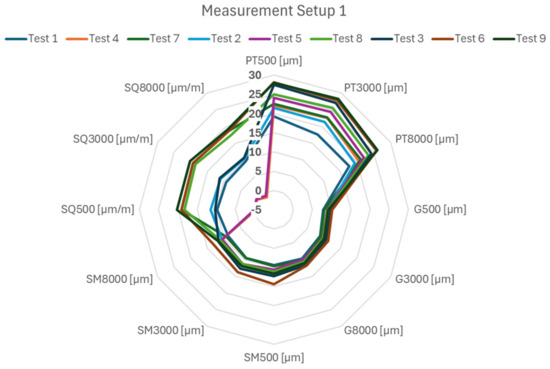
Figure 22.
DBB results displayed by measurement position.
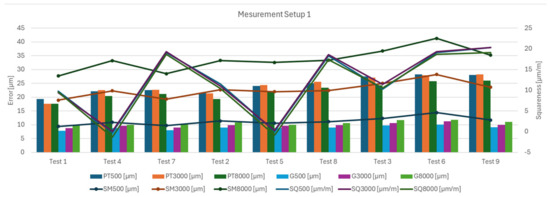
Figure 23.
DBB results depending on the tests.
The stability of the laser reflector holder must be taken into account when measuring with a change in Z axis position and combined with a high feed rate. For measurement setup 2, the high reflector unloading, and 8000 mm/min speed affected the result by 2 µm. However, a trend can be observed that the magnitude of the positioning error increases with a higher feed rate. In contrast, the ballbar plots show approximately the same values for the parameter’s positioning tolerances and scaling mismatch.
From the results of measurement setup 3, it is possible to think systematically about how compensations are applied. In the case of serial production and clamping the workpieces in a sub-machine position, it is advisable to compensate as close as possible to the clamping position of the workpiece. In case we do not know what will be machined on the turret, we should choose the position for measurements and compensation in the middle of the stroke of the machine axis (Figure 24). The error will then be symmetrical on both sides, even with the effect on the workpiece itself.
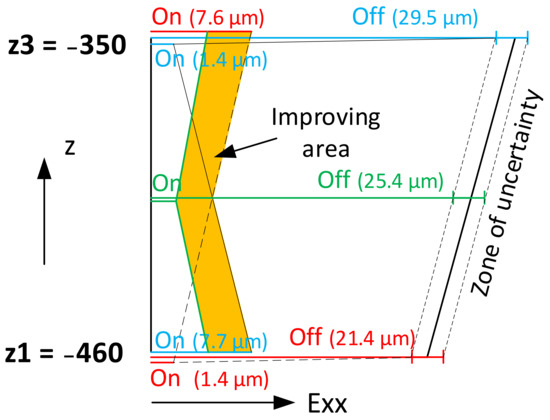
Figure 24.
Estimation of X axis positioning parameter improvements.
For future measurements of the effect of temperature on the geometric errors of the machine tool, the experiment conducted favours a measurement based on circular interpolation, which appears to be more sensitive to smaller changes in temperature. This result will be further verified by testing circular interpolation with a high number of repetitive measurements. For measurement setup 2, the temperature change on the rulers was too small for the geometric errors of the machine tools to be apparent.
Given these findings, it is possible to predict future dimensional and form accuracy of workpieces and to direct further research in this direction. Other influences that will need attention are the magnitude of the forces from machining and the static stiffness of the machine tools.
5. Conclusions
The practical part of the work consisted of the measurement and analysis of the measurement results. The procedure followed the proposed plan. In the first measurement, the errors in the working space of the machine were determined for 9 different positions (when changing the X and Z coordinates) and at different feed rates. The measurement results showed that, for example, the positioning tolerance deteriorates from the centre of the table to the edges (by 14%) even when the Z coordinate is increased (by 22%). From the second measurement carried out by LI, which was carried out at 3 different Z—heights using different speeds, it was found, for example, that the feed rate is not as significant as the position at which the measurement is carried out. Measurement number 3 demonstrated the importance of positioning compensation. Here, the two-way positioning error parameter improved by up to a factor of 20 when compensation was used. However, it was also shown that using the positioning compensation at a height other than the measured height leads to the opposite positioning error. Measurement task 4 was to assess the effect of ambient and machine temperature variations. The ambient temperature could not be varied, and the machine temperature varied by only 1.5 °C. However, even this small increase showed an elongation of the machine components. As a result of this change, the machine ‘self-compensated’ and improved the error parameters.
In conclusion, based on the results, it can be said that:
- -
- operating conditions such as feed rate, workpiece position, and machine setup influence the final behaviour of the CNC machine tool;
- -
- the modifications were monitored on the parameters set by the ISO 230-2 and ISO 230-4 procedures;
- -
- the influence of temperature (heat sources) was also observed in the results;
- -
- the results can be further used to predict the dimensional and form accuracy of workpieces under finishing machining conditions.
Author Contributions
Methodology, M.S.; formal analysis, M.S.; validation, M.S., writing—original draft, M.S.; conceptualization, M.H.; investigation, M.H.; methodology, M.H.; supervision, M.H.; writing—original draft, M.H.; formal analysis, T.M.; writing—review and editing, J.P.; writing—review and editing, F.B.; project administration, F.B.; formal analysis, P.B. All authors have read and agreed to the published version of the manuscript.
Funding
This research was funded with the financial support of the Faculty of Mechanical Engineering, Brno University of Technology, grant number FSI-S-23-8260.
Data Availability Statement
Data are contained within the article.
Conflicts of Interest
The authors declare no conflicts of interest. The funders had no role in the design of this study; in the collection, analyses, or interpretation of data; in the writing of the manuscript; or in the decision to publish the results.
References
- Dostal, P.; Sadilek, M.; Dubsky, J.; Szkandera, P. Accuracy of Machine Tools. MM Sci. J. 2020, 2020, 3832–3836. [Google Scholar] [CrossRef]
- Gao, W.; Ibaraki, S.; Donmez, M.A.; Kono, D.; Mayer, J.R.R.; Chen, Y.L.; Szipka, K.; Archenti, A.; Linares, J.M.; Suzuki, N. Machine Tool Calibration: Measurement, Modeling, and Compensation of Machine Tool Errors. Int. J. Mach. Tools Manuf. 2023, 187, 104017. [Google Scholar] [CrossRef]
- Schwenke, H.; Knapp, W.; Haitjema, H.; Weckenmann, A.; Schmitt, R.; Delbressine, F. Geometric Error Measurement and Compensation of Machines—An Update. CIRP Ann. 2008, 57, 660–675. [Google Scholar] [CrossRef]
- ISO 230-2; Test Code for Machine Tools—Part 2: Determination of Accuracy and Repeatability of Positioning of Numerically Controlled Axes. International Organization for Standardization: Geneva, Switzerland, 2014.
- Zhang, Z.; Jiang, F.; Luo, M.; Wu, B.; Zhang, D.; Tang, K. Geometric Error Measuring, Modeling, and Compensation for CNC Machine Tools: A Review. Chin. J. Aeronaut. 2024, 37, 163–198. [Google Scholar] [CrossRef]
- ISO 230-4; Test Code for Machine Tools—Part 4: Circular Tests for Numerically Controlled Machine Tools. International Organization for Standardization: Geneva, Switzerland, 2005.
- Bryan, J.B. A Simple Method for Testing Measuring Machines and Machine Tools Part 1: Principles and Applications. Precis. Eng. 1982, 4, 61–69. [Google Scholar] [CrossRef]
- Wang, Z.; Wang, D.; Yu, S.; Li, X.; Dong, H. A Reconfigurable Mechanism Model for Error Identification in the Double Ball Bar Tests of Machine Tools. Int. J. Mach. Tools Manuf. 2021, 165, 103737. [Google Scholar] [CrossRef]
- Holub, M.; Jankovych, R.; Vetiska, J.; Sramek, J.; Blecha, P.; Smolik, J.; Heinrich, P. Experimental Study of the Volumetric Error Effect on the Resulting Working Accuracy—Roundness. Appl. Sci. 2020, 10, 6233. [Google Scholar] [CrossRef]
- Zheng, F.; Zhang, B.; Zhao, Y.; Li, J.; Long, F.; Feng, Q. Efficient Method for Identifying Key Errors Based on 21-Geometric-Error Measurement of Three Linear Axes of Machine Tools. Appl. Sci. 2024, 14, 2982. [Google Scholar] [CrossRef]
- Wang, W.; Yue, S.; Yang, H.; Xu, K.; Sun, T.; Lu, K.; Chen, Z.; Wang, C.; Cui, X.; Ju, B. Fast Detection of Geometric Errors for Three-Axis Machine Tools with Combined Double-Ball Bars Based on Spatial Circle Detection. Meas. Sci. Technol. 2024, 35, 035003. [Google Scholar] [CrossRef]
- Archenti, A. Prediction of Machined Part Accuracy from Machining System Capability. CIRP Ann. 2014, 63, 505–508. [Google Scholar] [CrossRef]
- Ramesh, R.; Mannan, M.A.; Poo, A.N. Error Compensation in Machine Tools—A Review: Part I: Geometric, Cutting-Force Induced and Fixture-Dependent Errors. Int. J. Mach. Tools Manufact. 2000, 40, 1235–1256. [Google Scholar] [CrossRef]
- VDI/DGQ 3441; Statistical Testing of the Operational and Positional Accuracy of Machine Tools. Verein Deutscher Ingenieure (VDI): Dusseldorf, Germany, 1982.
- Okafor, A.C.; Ertekin, Y.M. Derivation of Machine Tool Error Models and Error Compensation Procedure for Three Axes Vertical Machining Center Using Rigid Body Kinematics. Int. J. Mach. Tools Manuf. 2000, 40, 1199–1213. [Google Scholar] [CrossRef]
- Peterka, J.; Kuruc, M.; Kolesnyk, V.; Dehtiarov, I.; Moravcikova, J.; Vopat, T.; Pokorny, P.; Jurina, F.; Simna, V. Selected Aspects of Precision Machining on CNC Machine Tools. Machines 2023, 11, 946. [Google Scholar] [CrossRef]
- Holub, M.; Blecha, P.; Bradac, F.; Kana, R. Volumetric Compensation of Three-Axis Vertical Machining Centre. MM Sci. J. 2015, 2015, 677–681. [Google Scholar] [CrossRef]
- Wiessner, M.; Blaser, P.; Böhl, S.; Mayr, J.; Knapp, W.; Wegener, K. Thermal Test Piece for 5-Axis Machine Tools. Precis. Eng. 2018, 52, 407–417. [Google Scholar] [CrossRef]
- Mareš, M.; Horejš, O.; Havlík, L. Thermal Error Compensation of a 5-Axis Machine Tool Using Indigenous Temperature Sensors and CNC Integrated Python Code Validated with a Machined Test Piece. Precis. Eng. 2020, 66, 21–30. [Google Scholar] [CrossRef]
- Usop, Z.; Sarhan, A.A.D.; Mardi, N.A.; Wahab, M.N.A. Measuring of Positioning, Circularity and Static Errors of a CNC Vertical Machining Centre for Validating the Machining Accuracy. Measurement 2015, 61, 39–50. [Google Scholar] [CrossRef]
- Quan, L.; Zhao, W. A Review on Positioning Uncertainty in Motion Control for Machine Tool Feed Drives. Precis. Eng. 2024, 88, 428–448. [Google Scholar] [CrossRef]
- Paweł, M.; Bartosz, P. Rapid Method to Determine Accuracy and Repeatability of Positioning of Numerically Controlled Axes. Int. J. Mach. Tools Manuf. 2019, 137, 1–12. [Google Scholar] [CrossRef]
- Renishaw. XL-80 and XC-80 Error Budget and Uncertainty Calculations; Renishaw: Wotton-under-Edge, UK, 2013. [Google Scholar]
- Renishaw. QC20-W Error Budget & Uncertainty Calculations; Renishaw: Wotton-under-Edge, UK, 2013. [Google Scholar]
Disclaimer/Publisher’s Note: The statements, opinions and data contained in all publications are solely those of the individual author(s) and contributor(s) and not of MDPI and/or the editor(s). MDPI and/or the editor(s) disclaim responsibility for any injury to people or property resulting from any ideas, methods, instructions or products referred to in the content. |
© 2024 by the authors. Licensee MDPI, Basel, Switzerland. This article is an open access article distributed under the terms and conditions of the Creative Commons Attribution (CC BY) license (https://creativecommons.org/licenses/by/4.0/).