Figure 1.
Thermal expansion coefficient of super invar at different temperatures.
Figure 1.
Thermal expansion coefficient of super invar at different temperatures.
Figure 2.
The structure of the mirror of the James Webb Space Telescope [
15].
Figure 2.
The structure of the mirror of the James Webb Space Telescope [
15].
Figure 3.
The structure of the mirror substrate.
Figure 3.
The structure of the mirror substrate.
Figure 4.
Maximum deformation of the mirror due to gravity.
Figure 4.
Maximum deformation of the mirror due to gravity.
Figure 5.
Six types of honeycomb structures.
Figure 5.
Six types of honeycomb structures.
Figure 6.
Definitions of the dimensions of the honeycomb structure.
Figure 6.
Definitions of the dimensions of the honeycomb structure.
Figure 7.
The structure of the two-layer composite plate.
Figure 7.
The structure of the two-layer composite plate.
Figure 8.
The dimension of the two-layer composite plate.
Figure 8.
The dimension of the two-layer composite plate.
Figure 9.
The gravity displacement of the plate.
Figure 9.
The gravity displacement of the plate.
Figure 10.
Three-layer composite plate.
Figure 10.
Three-layer composite plate.
Figure 11.
Five-layer composite plate.
Figure 11.
Five-layer composite plate.
Figure 12.
Comparison of the gravity deformation for different honeycomb plates.
Figure 12.
Comparison of the gravity deformation for different honeycomb plates.
Figure 13.
Three-layer plate with holes on one side.
Figure 13.
Three-layer plate with holes on one side.
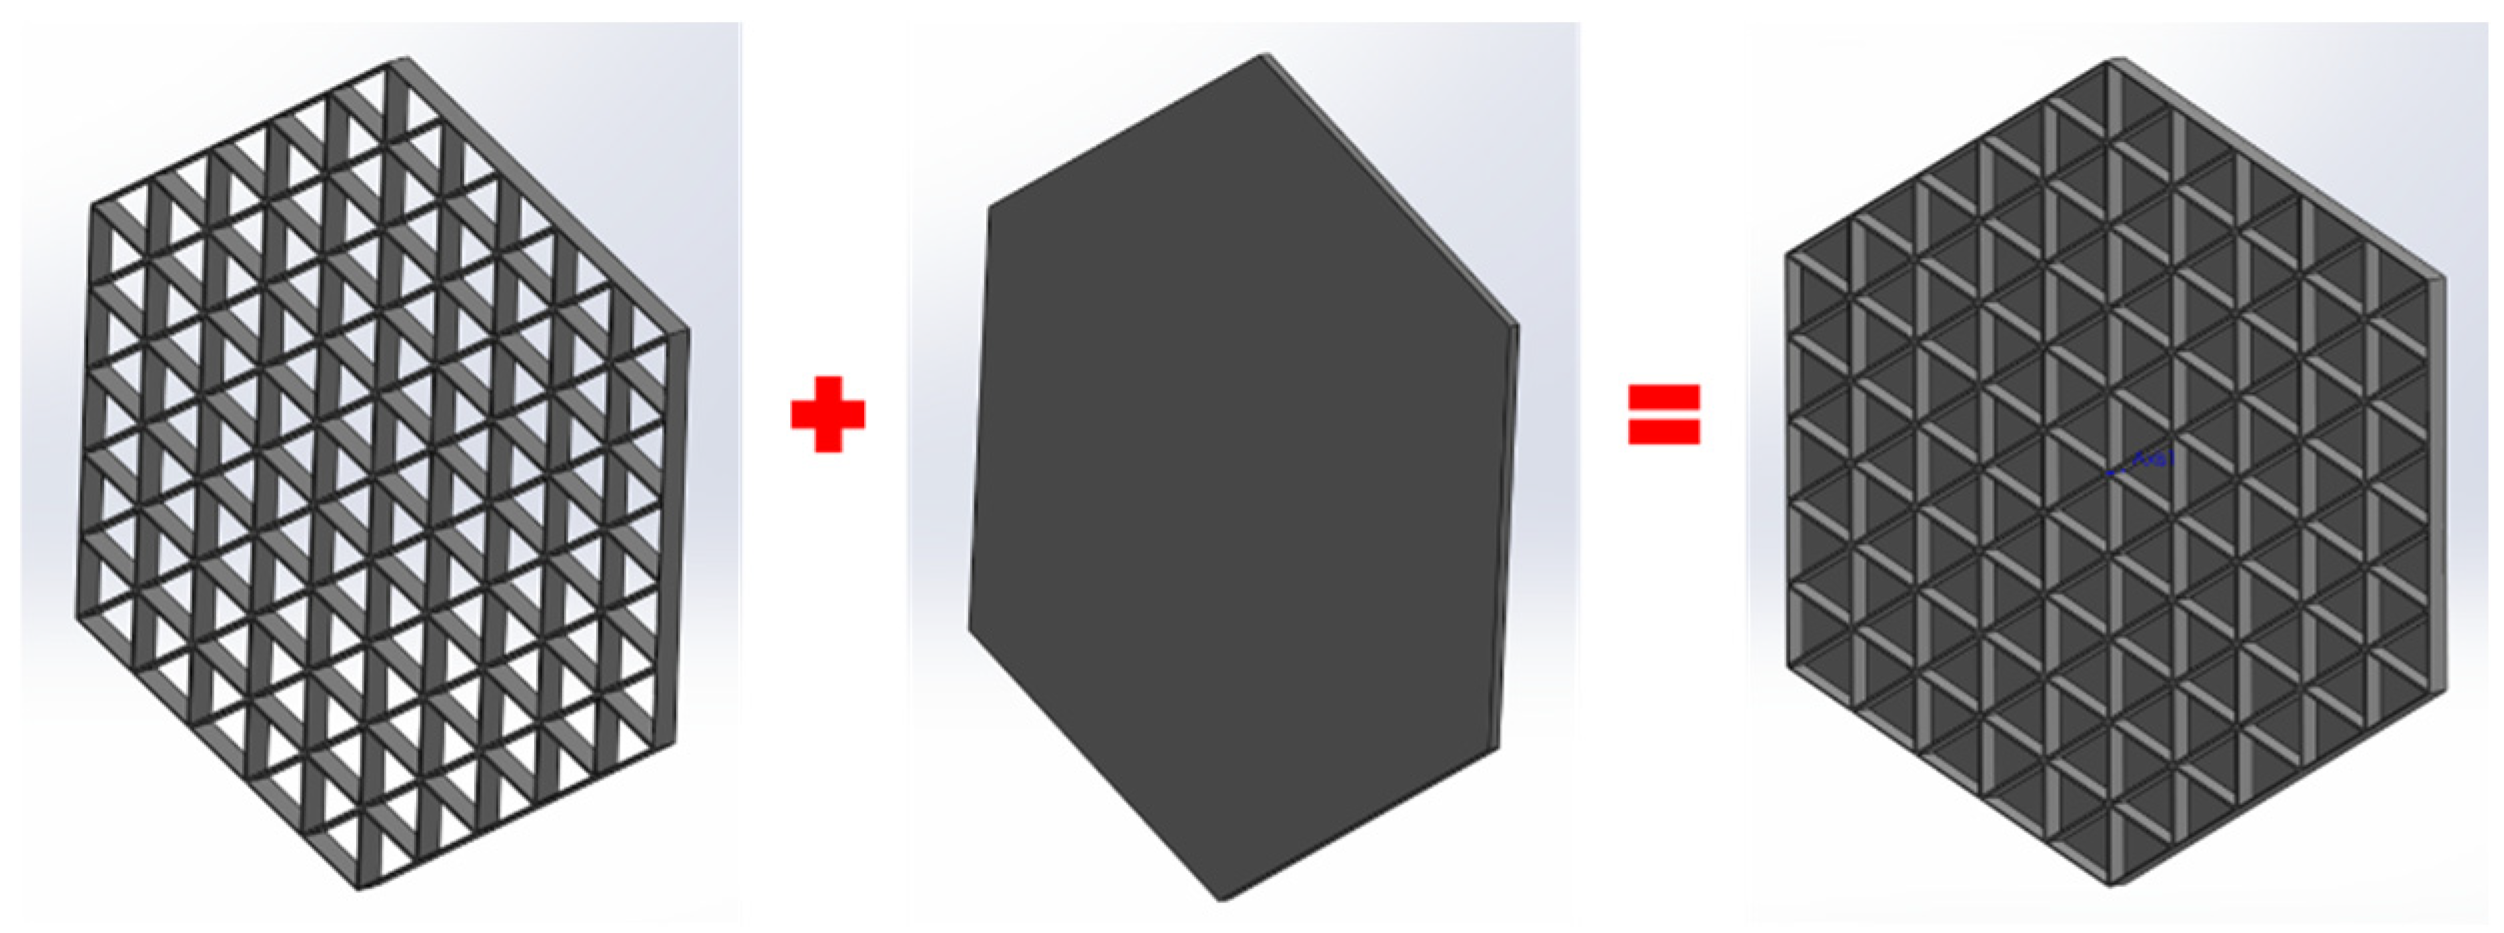
Figure 14.
Flow chart for the design and modeling of the TPMS optical structures or components.
Figure 14.
Flow chart for the design and modeling of the TPMS optical structures or components.
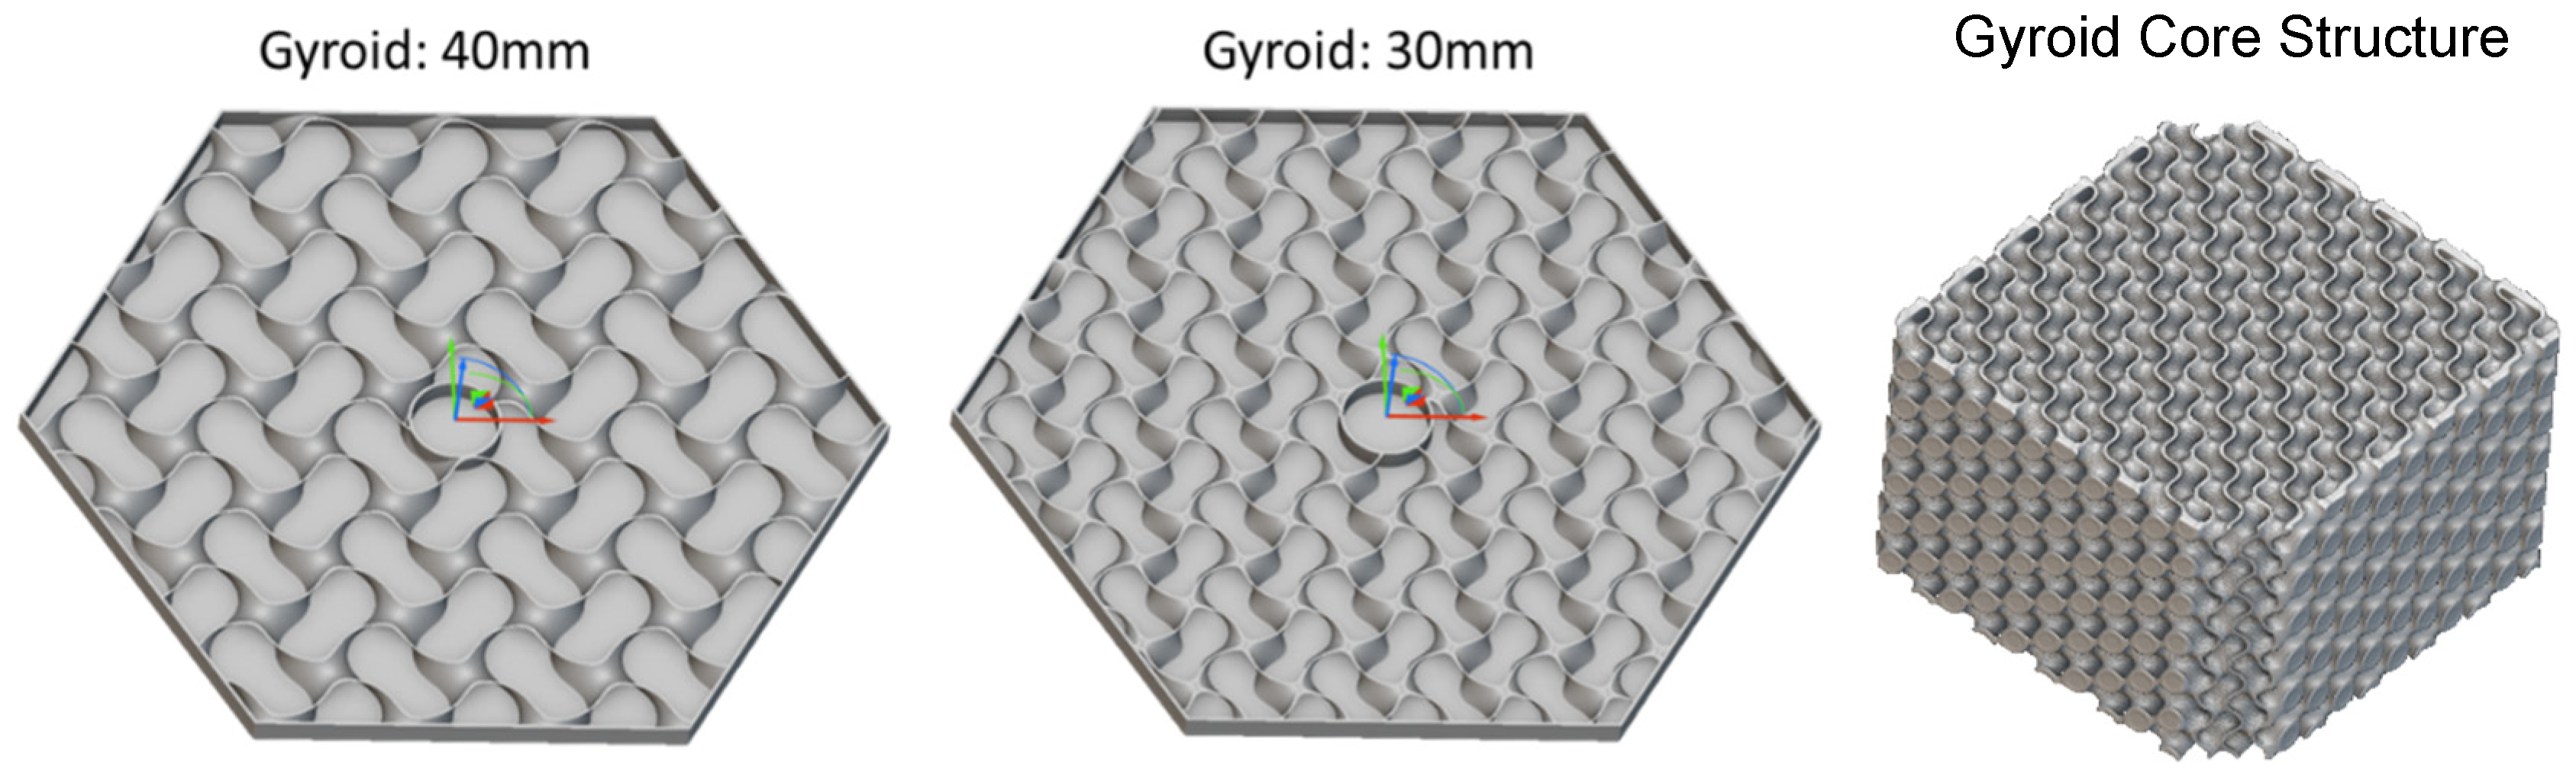
Figure 15.
Two examples of three-layered sandwiched gyroid mirror substrates with 30 mm and 40 mm lattice lengths.
Figure 15.
Two examples of three-layered sandwiched gyroid mirror substrates with 30 mm and 40 mm lattice lengths.
Figure 16.
Comparison of the gravity deformation for different designs of mirror substrates (super invar). The three-layered sandwiched structure shows the best performance on stiffness- and temperature-induced deformation.
Figure 16.
Comparison of the gravity deformation for different designs of mirror substrates (super invar). The three-layered sandwiched structure shows the best performance on stiffness- and temperature-induced deformation.
Figure 17.
Static simulation result for a three-layer composite plate.
Figure 17.
Static simulation result for a three-layer composite plate.
Figure 18.
Printed CTE samples with orientation marks. For each group, there are four samples divided into the following two comparison groups: two without the HIP treatment (A1 and A2) and two with the HIP treatment (A3 and A4).
Figure 18.
Printed CTE samples with orientation marks. For each group, there are four samples divided into the following two comparison groups: two without the HIP treatment (A1 and A2) and two with the HIP treatment (A3 and A4).
Figure 19.
CTE test for super invar coupons with different printing orientations with the HIP treatment.
Figure 19.
CTE test for super invar coupons with different printing orientations with the HIP treatment.
Figure 20.
CTE tests for samples with and without the HIP treatment. For each group, there are four samples divided into the following two comparison groups: two without the HIP treatment (A1 and A2) and two with the HIP treatment (A3 and A4). The groups are labeled as 20221011 (horizontal X) and 20221012 (horizontal Y).
Figure 21.
Printed 1/6th portion of the mirror substrates with 1″, 1.5″, and 2″ sizes.
Figure 21.
Printed 1/6th portion of the mirror substrates with 1″, 1.5″, and 2″ sizes.
Figure 22.
Complete mirror substrate (base, honeycomb, and top structure).
Figure 22.
Complete mirror substrate (base, honeycomb, and top structure).
Figure 23.
Design of the 3-inch optical structure.
Figure 23.
Design of the 3-inch optical structure.
Figure 24.
Printed 3-inch optical structure.
Figure 24.
Printed 3-inch optical structure.
Figure 25.
Density characterization of a 3-inch optical mirror substrate at three different locations.
Figure 25.
Density characterization of a 3-inch optical mirror substrate at three different locations.
Figure 26.
Three super invar specimens at different view angles.
Figure 26.
Three super invar specimens at different view angles.
Figure 27.
Three-point bending stiffness test.
Figure 27.
Three-point bending stiffness test.
Figure 28.
Comparison of the test results of the plate bending stiffness with the simulation results.
Figure 28.
Comparison of the test results of the plate bending stiffness with the simulation results.
Table 1.
Mechanical property of super invar.
Table 1.
Mechanical property of super invar.
| Super Invar |
|---|
| Elastic Modulus | 145,000 | N/mm2 |
| Poisson’s Ratio | 0.23 | N/A |
| Mass Density | 8150 | kg/m3 |
| Tensile Strength | 483 | N/mm2 |
| Yield Strength | 276 | N/mm2 |
| Thermal Conductivity | 10 | W/(m·K) |
| Specific Heat | 500 | J/(kg·K) |
Table 2.
Convergence study of the static model.
Table 2.
Convergence study of the static model.
| | Element Size | Total Nodes | Total Elements | Displacement Under Gravity |
|---|
| | mm | - | - | µm |
|---|
| #1 | 5 | 103,579 | 52,205 | 0.85 |
| #2 | 3 | 145,295 | 73,771 | 0.86 |
| #3 | 2 | 440,636 | 222,433 | 0.89 |
| #4 | 1 | 2,411,576 | 1,400,054 | 0.89 |
Table 3.
The dimensions and the gravity displacements of the plates.
Table 3.
The dimensions and the gravity displacements of the plates.
| | L | d3 | d2 | Gravity Displacement | Total Mass | Equivalent Density | Displacement × Density |
|---|
| | mm | mm | mm | μm | g | kg/m3 | μkg/m2 |
|---|
| Case 1 | 25.4 | 2 | 10 | 1.452 | 868 | 1726.2 | 2506 |
| Case 2 | 12.7 | 2 | 10 | 1.556 | 1609 | 3199.7 | 4979 |
| Case 3 | 6.35 | 2 | 10 | 1.265 | 2709 | 5387.3 | 6815 |
| Case 4 | 25.4 | 1 | 10 | 1.444 | 450 | 894.9 | 1292 |
| Case 5 | 12.7 | 1 | 10 | 1.611 | 868 | 1726.2 | 2781 |
| Case 6 | 6.35 | 1 | 10 | 1.634 | 1609 | 3199.7 | 5228 |
| Solid Plate | - | - | 10 | 0.9926 | 3415.2 | 8149.5 | 8089 |
Table 4.
Gravity displacement of the two-layer composite plates.
Table 4.
Gravity displacement of the two-layer composite plates.
| Honeycomb Thickness | Solid Plate Thickness | Total Thickness | Gravity Displacement | Total Mass | Equivalent Density | Displacement × Density |
|---|
| mm | mm | mm | μm | g | Kg/m3 | μkg/m2 |
|---|
| 0 | 12 | 12 | 0.6997 | 4098 | 8149.5 | 5702 |
| 1 | 11 | 12 | 0.7788 | 3802 | 7560.9 | 5888 |
| 3 | 9 | 12 | 1.017 | 3208 | 6379.6 | 6488 |
| 6 | 6 | 12 | 1.385 | 2319 | 4611.7 | 6387 |
| 9 | 3 | 12 | 1.155 | 1429 | 2841.8 | 3282 |
| 10 | 2 | 12 | 0.9497 | 1133 | 2253.1 | 2140 |
| 11 | 1 | 12 | 0.7368 | 836 | 1662.5 | 1225 |
Table 5.
Gravity displacement of the three-layer composite plates.
Table 5.
Gravity displacement of the three-layer composite plates.
| Solid Plate Thickness—d1 | Honeycomb Thickness—d2 | Solid Plate Thickness—d1 | Total Thickness | Gravity Displacement | Total Mass | Equivalent Density | Displacement × Density |
|---|
| mm | mm | mm | mm | μm | g | kg/m3 | μkg/m2 |
|---|
| 1 | 10 | 1 | 12 | 0.4315 | 1133 | 2253.1 | 972 |
| 1 | 8 | 1 | 10 | 0.5923 | 1043 | 2489.0 | 1474 |
| 1 | 6 | 1 | 8 | 0.8979 | 953 | 2842.8 | 2552 |
| 1 | 4 | 1 | 6 | 1.592 | 863 | 3432.4 | 5464 |
| 1 | 2 | 1 | 4 | 3.9 | 773 | 4611.7 | 17,985 |
Table 6.
Gravity displacement of the five-layer composite plate.
Table 6.
Gravity displacement of the five-layer composite plate.
| Solid Plate Thickness1 | Honeycomb Thickness1 | Solid Plate Thickness2 | Honeycomb Thickness2 | Solid Plate Thickness3 | Total Thickness | Gravity Displacement | Total Mass | Equivalent Density | Displacement × Density |
|---|
| mm | mm | mm | mm | mm | mm | μm | g | Kg/m3 | μkg/m2 |
|---|
| 1 | 4.5 | 1 | 4.5 | 1 | 12 | 0.5207 | 1429.4 | 2841.8 | 1480 |
Table 7.
Comparison of different plate designs.
Table 7.
Comparison of different plate designs.
| | Total Thickness | Gravity Deformation | Total Mass | Equivalent Density | Displacement × Density |
|---|
| | mm | μm | g | kg/m3 | μkg/m2 |
|---|
| One layer | 12 | 0.6997 | 4098 | 8150 | 5703 |
| Two layers | 12(11-1) | 0.7368 | 836 | 1663 | 1225 |
| Three layers | 12(1-10-1) | 0.4315 | 1133 | 2253 | 972 |
| Five Layers | 12(1-4.5-1-4.5-1) | 0.5207 | 1429 | 2843 | 1480 |
Table 8.
Simulation results of the plate with different dimensions.
Table 8.
Simulation results of the plate with different dimensions.
| 10 Inches | Total Height | Gravity Deformation | Mass | Equivalent Volume | Equivalent Density | Displacement × Density |
|---|
| d1-d2-d1 |
|---|
| | mm | μm | g | mm3 | kg/m3 | μkg/m2 |
|---|
| Three layers | 12(1-10-1) | 0.4315 | 1133 | 512,028 | 2253 | 972 |
| Three layers—A | 22(1-20-1) | 0.1588 | 1546 | 892,760 | 1732 | 275 |
| Three layers—B | 42(1-40-1) | 0.0735 | 2431 | 1,704,360 | 1426 | 104 |
| Solid beryllium | 24 | 0.02385 | 1860 | 1,005,704 | 1850 | 44 |
Table 9.
Gravity displacement of the three-layer composite plate with holes on one side.
Table 9.
Gravity displacement of the three-layer composite plate with holes on one side.
| | Solid Plate Thickness—1 | Honeycomb Thickness | Solid Plate Thickness—2 | Total Thickness | Gravity Deformation | Total Mass |
|---|
| | mm | mm | mm | mm | μm | g |
|---|
| Three layers | 1 | 10 | 1 | 12 | 0.4315 | 1133 |
| Three layers—one surface with holes | 1 | 10 | 1 | 12 | 0.4366 | 1126 |
Table 10.
Performance comparison of the 10-inch gyroid mirror substrates.
Table 10.
Performance comparison of the 10-inch gyroid mirror substrates.
| Materials | 10 inches | Lattice Length | Total Height
d1-d2-d1 | Wall Thickness
d3 | Gravity Deformation | Total Mass | Equivalent Density |
|---|
| | | mm | mm | mm | μm | g | g/cm3 |
|---|
| Beryllium | Three layers
Gyroid infill | 30 | 12(1-10-1) | 1 | 0.4315 | 313 | 0.511 |
| Beryllium | Three layers
Gyroid infill | 40 | 12(1-10-1) | 1 | 0.3758 | 272 | 0.476 |
| Super Invar | Three layers
Gyroid infill | 30 | 12(1-10-1) | 1 | 0.472 | 950 | 1.89 |
| Super Invar | Three layers
Gyroid infill | 40 | 12(1-10-1) | 1 | 0.485 | 904 | 1.79 |
Table 11.
Thermal deformations at various temperature variation ranges.
Table 11.
Thermal deformations at various temperature variation ranges.
| Maximum Thermal Deformation of 10-Inch Plate over ΔT | | 10 °C | 20 °C | 30 °C |
|---|
| Super Invar—Gyroid | μm | 0.08525 | 0.9237 | 2.644 |
| Beryllium—Gyroid | μm | 42.6 | 85.8 | 129.1 |
| Beryllium—Solid | μm | 44.2 | 83.44 | 124.5 |
Table 12.
Simulation results of different designs.
Table 12.
Simulation results of different designs.
| | Dimensions | Lattice Type | Lattice unit Length | Lattice Wall Thickness | Surface Wall Thickness | Displacement | Equivalent Density | Frequency |
|---|
| | Inch | | mm | mm | mm | µm | kg/m3 | Hz |
|---|
| 1 | 4 × 10 × 1 | Gyroid | 28 × 28 × 28 | 0.28 | 2 | 26.22 | 1833 | 357 |
| 2 | 4 × 10 × 1 | Gyroid | 28 × 28 × 28 | 0.56 | 1.765 | 23.54 | 1833 | 350 |
| 3 | 4 × 10 × 1 | Gyroid | 14 × 14 × 14 | 0.28 | 1.765 | 24.27 | 1833 | 342 |
| 4 | 4 × 10 × 1 | Honeycomb | - | 0.26 | 2 | 29.93 | 1811 | 346 |
Table 13.
Test results of the surface roughness and relative density of the printed mirror substrates.
Table 13.
Test results of the surface roughness and relative density of the printed mirror substrates.
| Serial Number | Surface Roughness (µm) | Relative Density %
(Microscopic Image) |
|---|
| 1 inch | 20.5 | 98.2% |
| 1.5 inches | 22.9 | 96.5% |
| 2 inches | 23.4 | 96.3% |
Table 14.
AM parameters for printing the three-layer mirror substrate.
Table 14.
AM parameters for printing the three-layer mirror substrate.
| | Layer Height | Hatch Mode | Hatch Space | Laser Power | Laser Scan Speed |
|---|
| | mm | - | mm | W | mm/s |
|---|
| Mirror plate | 0.05 | Lines | 0.06 | 120 | 90 |
Table 15.
Comparison of the test results with the simulation results.
Table 15.
Comparison of the test results with the simulation results.
| Specimens | Lattice Size | Mean Lattice Wall Thickness | Side Wall Thickness | Equivalent Density | Stiffness-Test | Stiffness/Density Test | Stiffness Simulation | Stiffness/Density Simulation |
|---|
| | mm | mm | mm | kg/m3 | N/mm | | N/mm | |
|---|
| #1 | 14 × 14 × 14 | 0.607 | 2.2 | 3402 | 7767 | 2.28 | 7812 | 2.30 |
| #2 | 9 × 9 × 9 | 0.524 | 2.1 | 3637 | 10,256 | 2.82 | 9596 | 2.64 |
| #3 | 14 × 14 × 14 | 0.79 | 1.9 | 3436 | 9302 | 2.71 | 8620 | 2.51 |


