Abstract
The paper presents a redesign of the custom disc-on-disc-type tribometer intended for the experimental characterization of the friction and wear of automotive dry clutch friction lining. The redesign is aimed at expanding the operating range at which the machine is not sensitive to shudder vibrations. This is achieved through a set of hardware and software upgrade measures. First, the natural frequency of the normal load-generation linear axis of the machine is increased by enlarging its bending stiffness and reducing the suspended mass. The former is realized by replacing the single, two-axial force/torque piezoelectric sensor with a set of three three-axial piezoelectric force sensors, adding a set of stiff linear guides, and reducing the lengths of the cantilevers of lateral forces acting on the linear axis guide system. The latter is accomplished by reducing the overall dimensions of the cooling disc and redesigning the thermal insulation components. The shudder sensitivity resistance is further reduced through individual normal force-readings-based adjustment of parallelism between friction contact surfaces and the increase in the stiffness of eccentrically positioned water-cooling pipes. Finally, the stability of the coefficient of friction and, consequently, the wear process are boosted by adjusting the control routines to minimize the circumferential and/or radial temperature gradients. These adjustments include the introduction of a clutch lock-up interval at the end of the clutch closing cycle, a minimum cooling delay inserted between two closing cycles, and maximum normal force demand of the clutch torque controller. The performance gain of the upgraded tribometer is demonstrated through a study of the dry clutch friction plate static wear experimental characterization for a wide range of operating conditions.
1. Introduction
Dry clutches are traditionally associated with manual transmissions (MT), where they are a major contributor to cost efficiency and fuel economy [1] at the expense of a smaller thermal capacity and stability of the coefficient of friction when compared to wet clutches [2]. The automation of dry clutches brings the combination of cost and energy efficiency advantages with the driving comfort of traditional automatic transmissions [3], while mitigating the thermal and friction uncertainty disadvantages through proper control actions [2]. Hence, dry clutches are considered for various transmission architectures including clutch-by-wire (i.e., E-clutch) systems [4], automated manual transmissions (AMT) [5,6], dual clutch transmissions (DCT) [5,6], continuously variable transmission (CVT) systems [7], as well as different hybrid electric [5,6] and fully electric [8] vehicles. The development of clutch/transmission control and monitoring strategies requires accurate clutch models, particularly those related to two friction lining material features: coefficient of friction (COF) [9,10] and wear [11]. Both features are typically experimentally characterized [9,10] due to their complex physical background. The experimental characterization typically relies on generic pin-on-disc-type machines [12], which are relatively inexpensive due to downscaled friction samples and, accordingly, reduced force/torque and power requirements. However, the geometry of the sliding system significantly differs from that of a real clutch, which can affect the accuracy, i.e., representativeness of the characterization results.
Wear relates to various physical processes such as abrasion, which results in the removal of material from two bodies in dry sliding contact [13]. Dry wear is typically modeled using the Archard’s law of wear [14], which states that the worn volume Vw is proportional to the wear rate parameter w that is dominantly affected by the temperature T [14] and the energy dissipated in the friction interface Edis:
Vw = w(T) Edis → w(T) = Vw/Edis
Additional influential parameters include slip speed [13,15], normal load [13,15], and travelled distance [16], i.e., closing time.
A fully automated (CNC) disc-on-disc type tribometer, which utilizes the entire dry clutch friction plate as a sample, was developed in [17] to provide a basis for experimental characterization of the wear process for a variety of the operating parameters. The characterization results were used for parametrization of a wear rate model [17]. The normal load influence to wear rate was not initially investigated, partly due to the negligible influence of the normal force preliminary observed by using a pin-on-disc tribometer [17], and mostly due to strong shudder vibrations that occurred at mid–high normal load/torque levels. It is worth mentioning that the shudder excitation is characteristic for many dry clutch friction materials in specific operating parameter regions, because of the negative friction force/torque vs. slip speed characteristic, i.e., negative damping coefficient [17,18]. This paper presents a redesign of the disc-on-disc tribometer machine, which is aimed at suppressing the shudder vibrations and, thus, extending its operating range for comprehensive wear and friction characterization.
The disc-on-disc tribometer redesign involves the improvement of its mechanical design and the proper upgrade and adjustment of control routines. The mechanical design was improved by (i) increasing the bending stiffness of the vertical axis through replacement of the single piezoelectric torque/normal force sensor with a set of three three-axial piezoelectric force sensors, which also enabled the balancing of normal forces around the circumference for a regular, plane-parallel friction disc interface; (ii) implementing a system of stiff linear guides, which reduced the bending torque by reducing the force cantilevers; and (iii) reducing the mass of the suspended components. The control routines were adjusted with the goal of mimicking more closely the actual clutch operation through (iv) maintaining a closed clutch during the cooling phase between two clutch closing cycles, (v) implementing a minimum cooling delay for regular temperature gradient conditions, and (vi) implementing a normal force demand upper limit to avoid local thermal instability during the clutch heat-up periods.
The remaining part of the paper is organized as follows. The initial design of the dry clutch disc-on-disc tribometer is presented in Section 2. The redesign of the machine is overviewed in Section 3. Mechanical and control routine adjustments with the goal of reducing the shudder sensitivity and improving the wear and friction process stability are described in Section 4 and Section 5, respectively. Section 6 presents wear characterization and modeling results for a wide range of operating parameters to demonstrate the full functionality of the redesigned tribometer. The concluding remarks are included in Section 7.
2. Current Tribometer Design
2.1. Design Outline
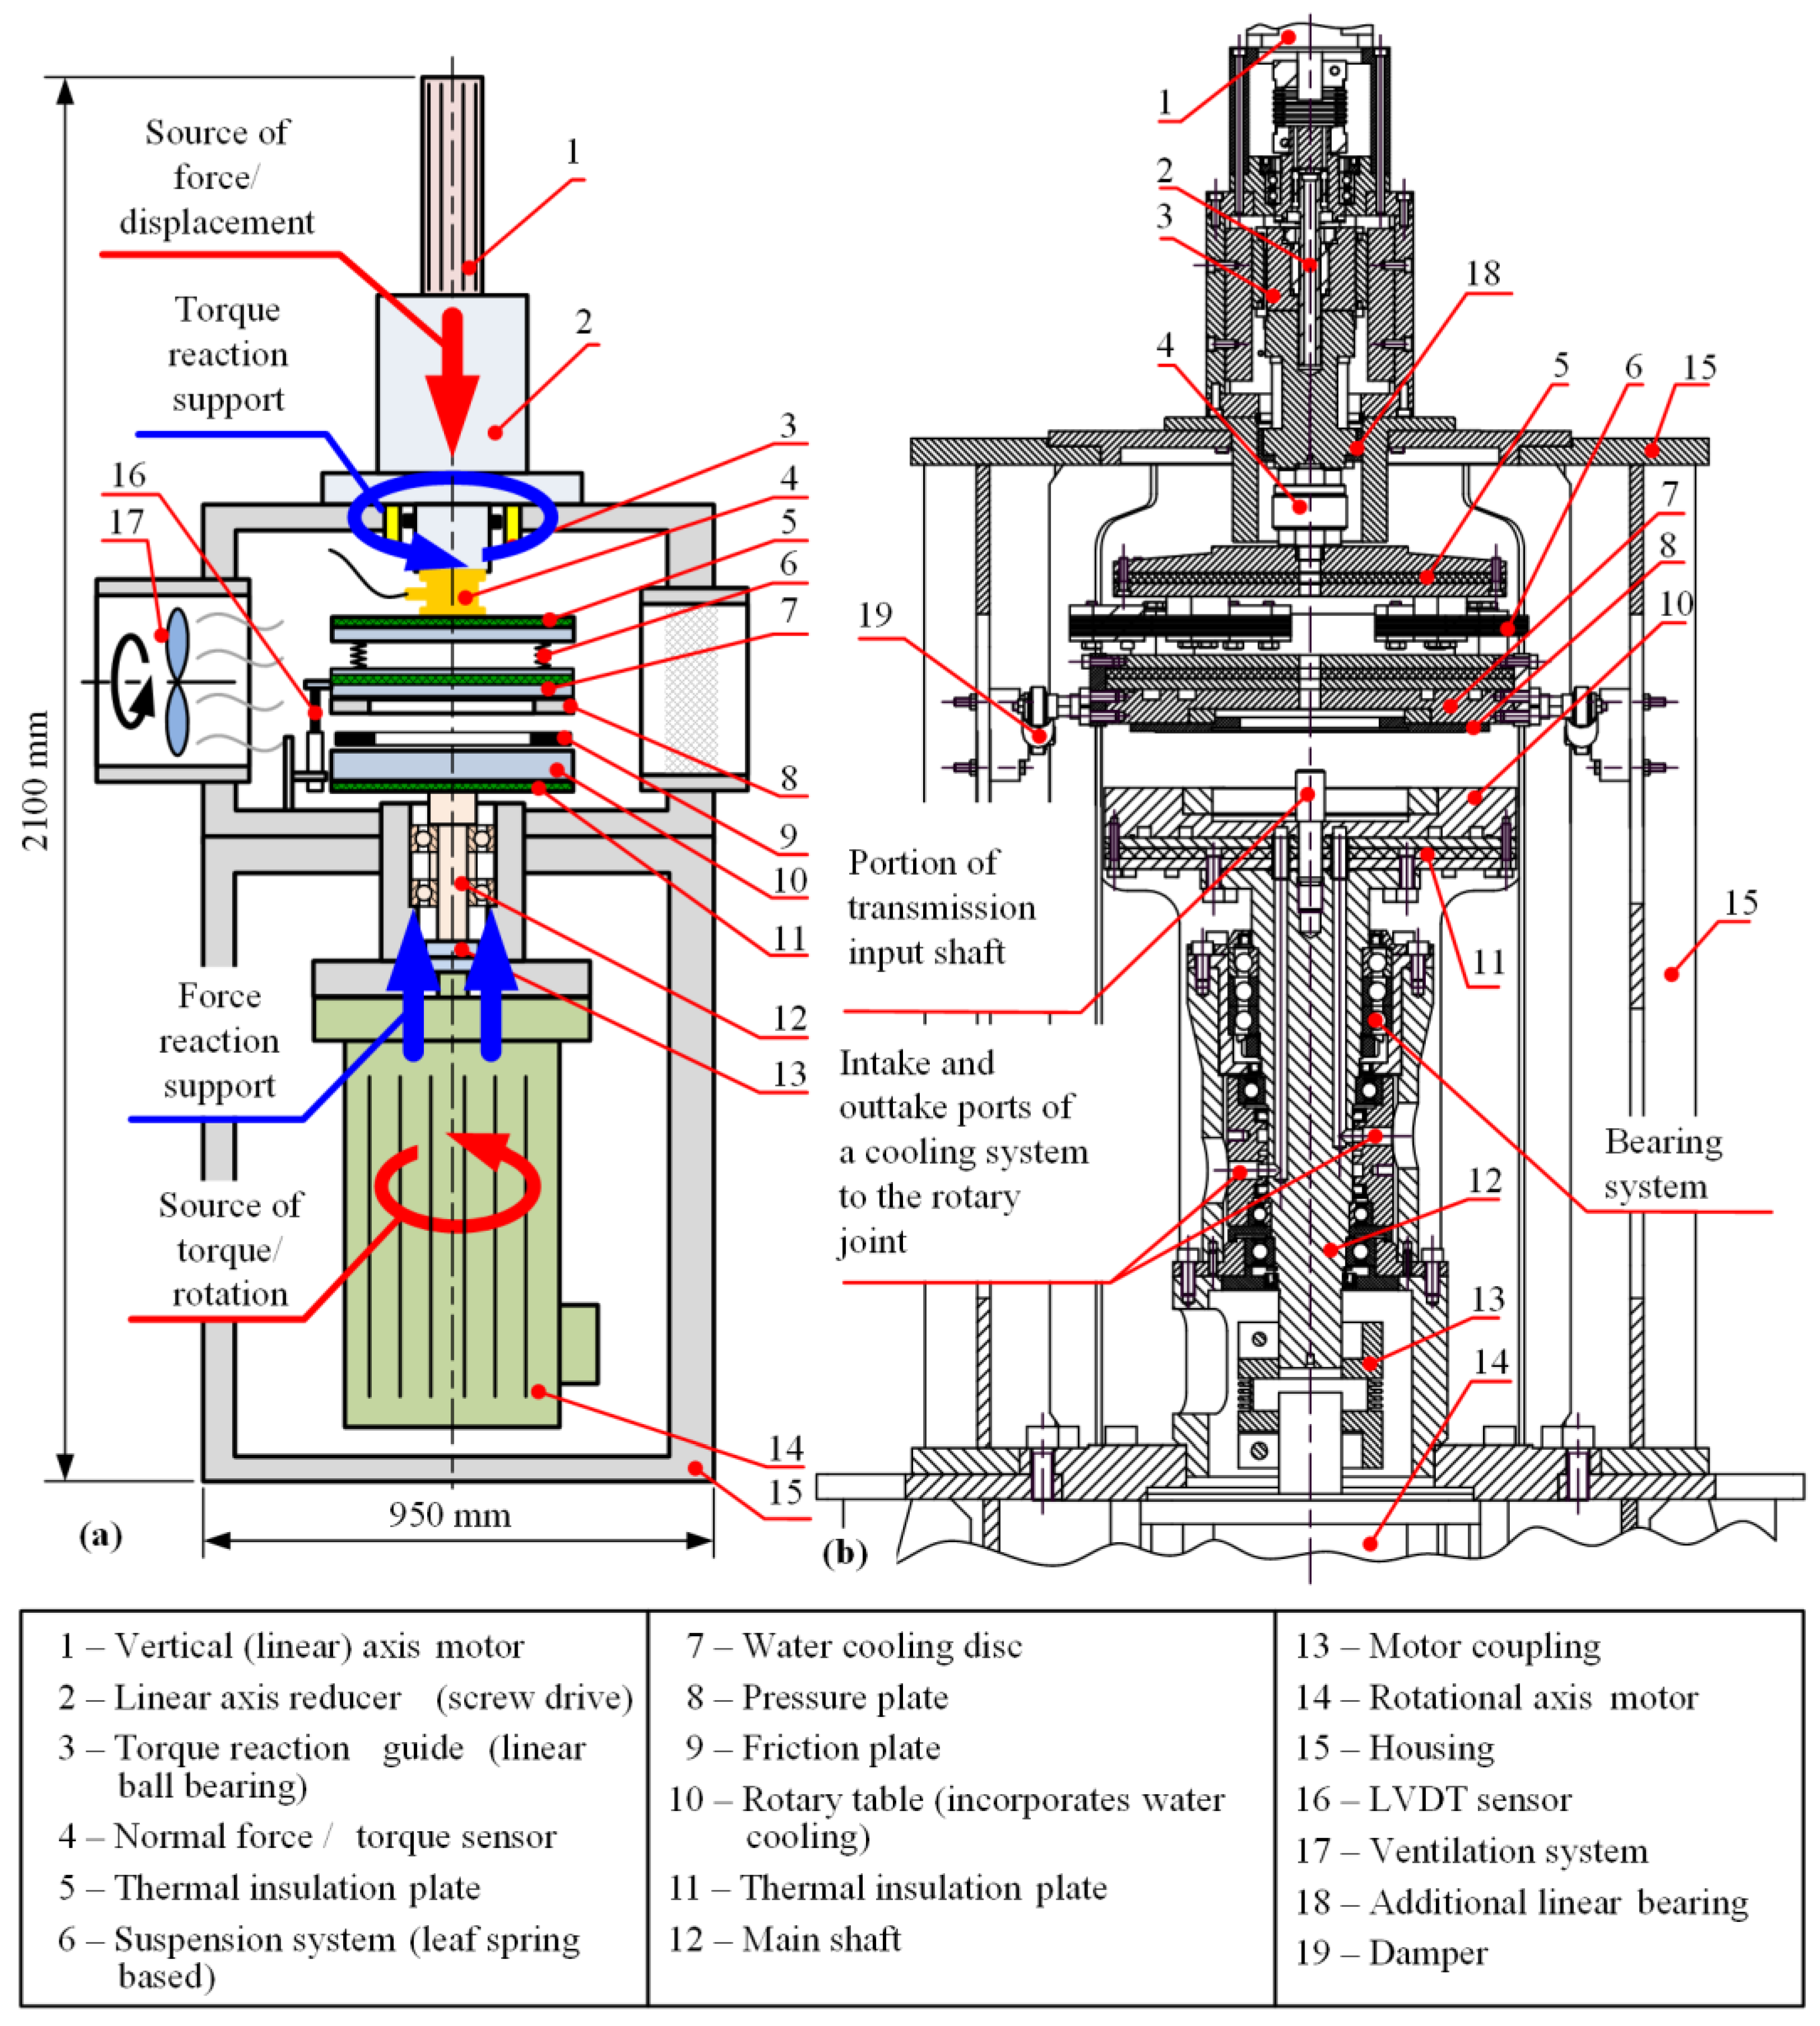
In the current disc-on-disc tribometer design (see Figure 1), the entire friction plate is placed on a rotating table driven directly by an electric servomotor. The pressure plate is cut from the real clutch flywheel and mounted on the tribometer vertical assembly driven by another electric servomotor via a planetary screw drive. Hence, a single friction surface is realized, which means that the friction torque is half of that generated on the real clutch for the same normal load. Placing the friction plate on the rotating table enables the centrifugal force to remove the worn particles similarly as in the real clutch, while mounting the pressure plate on the non-rotating, linear axis simplifies the design of the pressure plate temperature sensing and water-cooling system. More details on the tribometer mechanical, measurement, and control system design can be found in [17], while the basic information is provided in the following subsections.
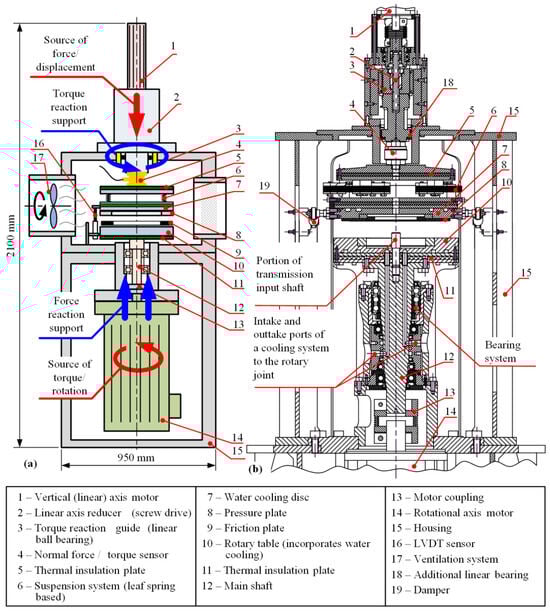
Figure 1.
Functional schematic of the current disc-on-disc tribometer design (a) and an excerpt from the technical documentation (b).
2.2. Design of Mechanical Subsystem
As outlined in Section 2.1, the tribometer comprises two servo axes: rotating and linear ones (see Figure 1). The pressure plate (8) is carried by the vertical axis as a source of variable normal load. The connection is realized directly through a precise, stiff, and compact normal force and torque piezoelectric sensor (4), thus, preventing any parallel (typically friction loss) force/torque transfer paths that would affect the measurement accuracy. The friction interface temperature is measured by a Pt100 sensor probe installed into the pressure plate (8) at its effective radius and the axial distance from the friction contact surface of 4 mm. The vertical axis is driven by a servomotor (1) (2.15 Nm @ 3000 rpm, max. 10 Nm) and a high-ratio screw-drive reducer (2) (1 mm/rev). The friction forces generated between the pressure plate (8) and the friction plate (9) act via a cantilever on the screw drive generating both the torsional and bending torque load. The torque reaction support system (3) (a linear ball bearing) is incorporated as an integral part of the vertical servo-axis (Figure 1b), and an additional linear bearing (18) is placed above the force/torque sensor to prevent transfer of the bending torque loads to the screw drive.
The suspension system (6) of the vertical axis consists of three packages of custom-designed symmetrical leaf springs (see Section 3.1 below). The water-cooling disc (7) and the thermal insulation disc (5) are connected to the leaf springs in the middle of the longer slides of their rectangular frames. This suspension design facilitates a uniform contact between the sliding surfaces and provides torque transfer towards the normal force/torque sensor (4).
The rotational axis is based on a high-power servomotor (14) (110 Nm @ 3000 rpm, max. 270 Nm), which drives the rotating table (10) over a servo coupling (13) and the main shaft (12). The friction plate (9) is placed on the rotating table. Proper torque transfer from the main shaft onto the friction plate is achieved over a cut portion of the corresponding dry clutch transmission input shaft. The excessive heat generated in the friction plate (9) is prevented from reaching the rotational axis bearing system by means of a water-cooled rotary table (10) and a thermal-insulation-material-based plate (11). The coolant intake and outtake ports are designed as custom rotary joints based on dynamic seals. The cooling fluid transfers the friction-dissipated heat from both vertical axis cooling disc (7) and the rotary table (10) towards a cooling unit (6 kW of cooling power), where the fluid is cooled down by a heat exchanger through air cooling. Particles and odor from the tribometer chamber are removed by utilizing an industrial ventilation system (1100 m3/h) equipped with adequate filters.
To protect the torque sensor (and overall machine) from shudder vibrations, the machine can optionally be equipped with a set of four dampers (19) installed between the cooling disc (7) and the housing (15). The dampers are arranged in two opposing pairs attached on the opposite side of the cooling disc, which are placed in the horizontal plane and connected to the housing via rotary joints. The parasitic torque and normal force transfer paths established via dampers affect the torque measurement accuracy to some extent. These effects were compensated for through a data post-processing mapping calibrated based on the correlation of the measured torque for the cases with and without the installed dampers and the same normal force level for shudder-neutral friction material (see [17] for details]).
2.3. Design of Control Subsystem
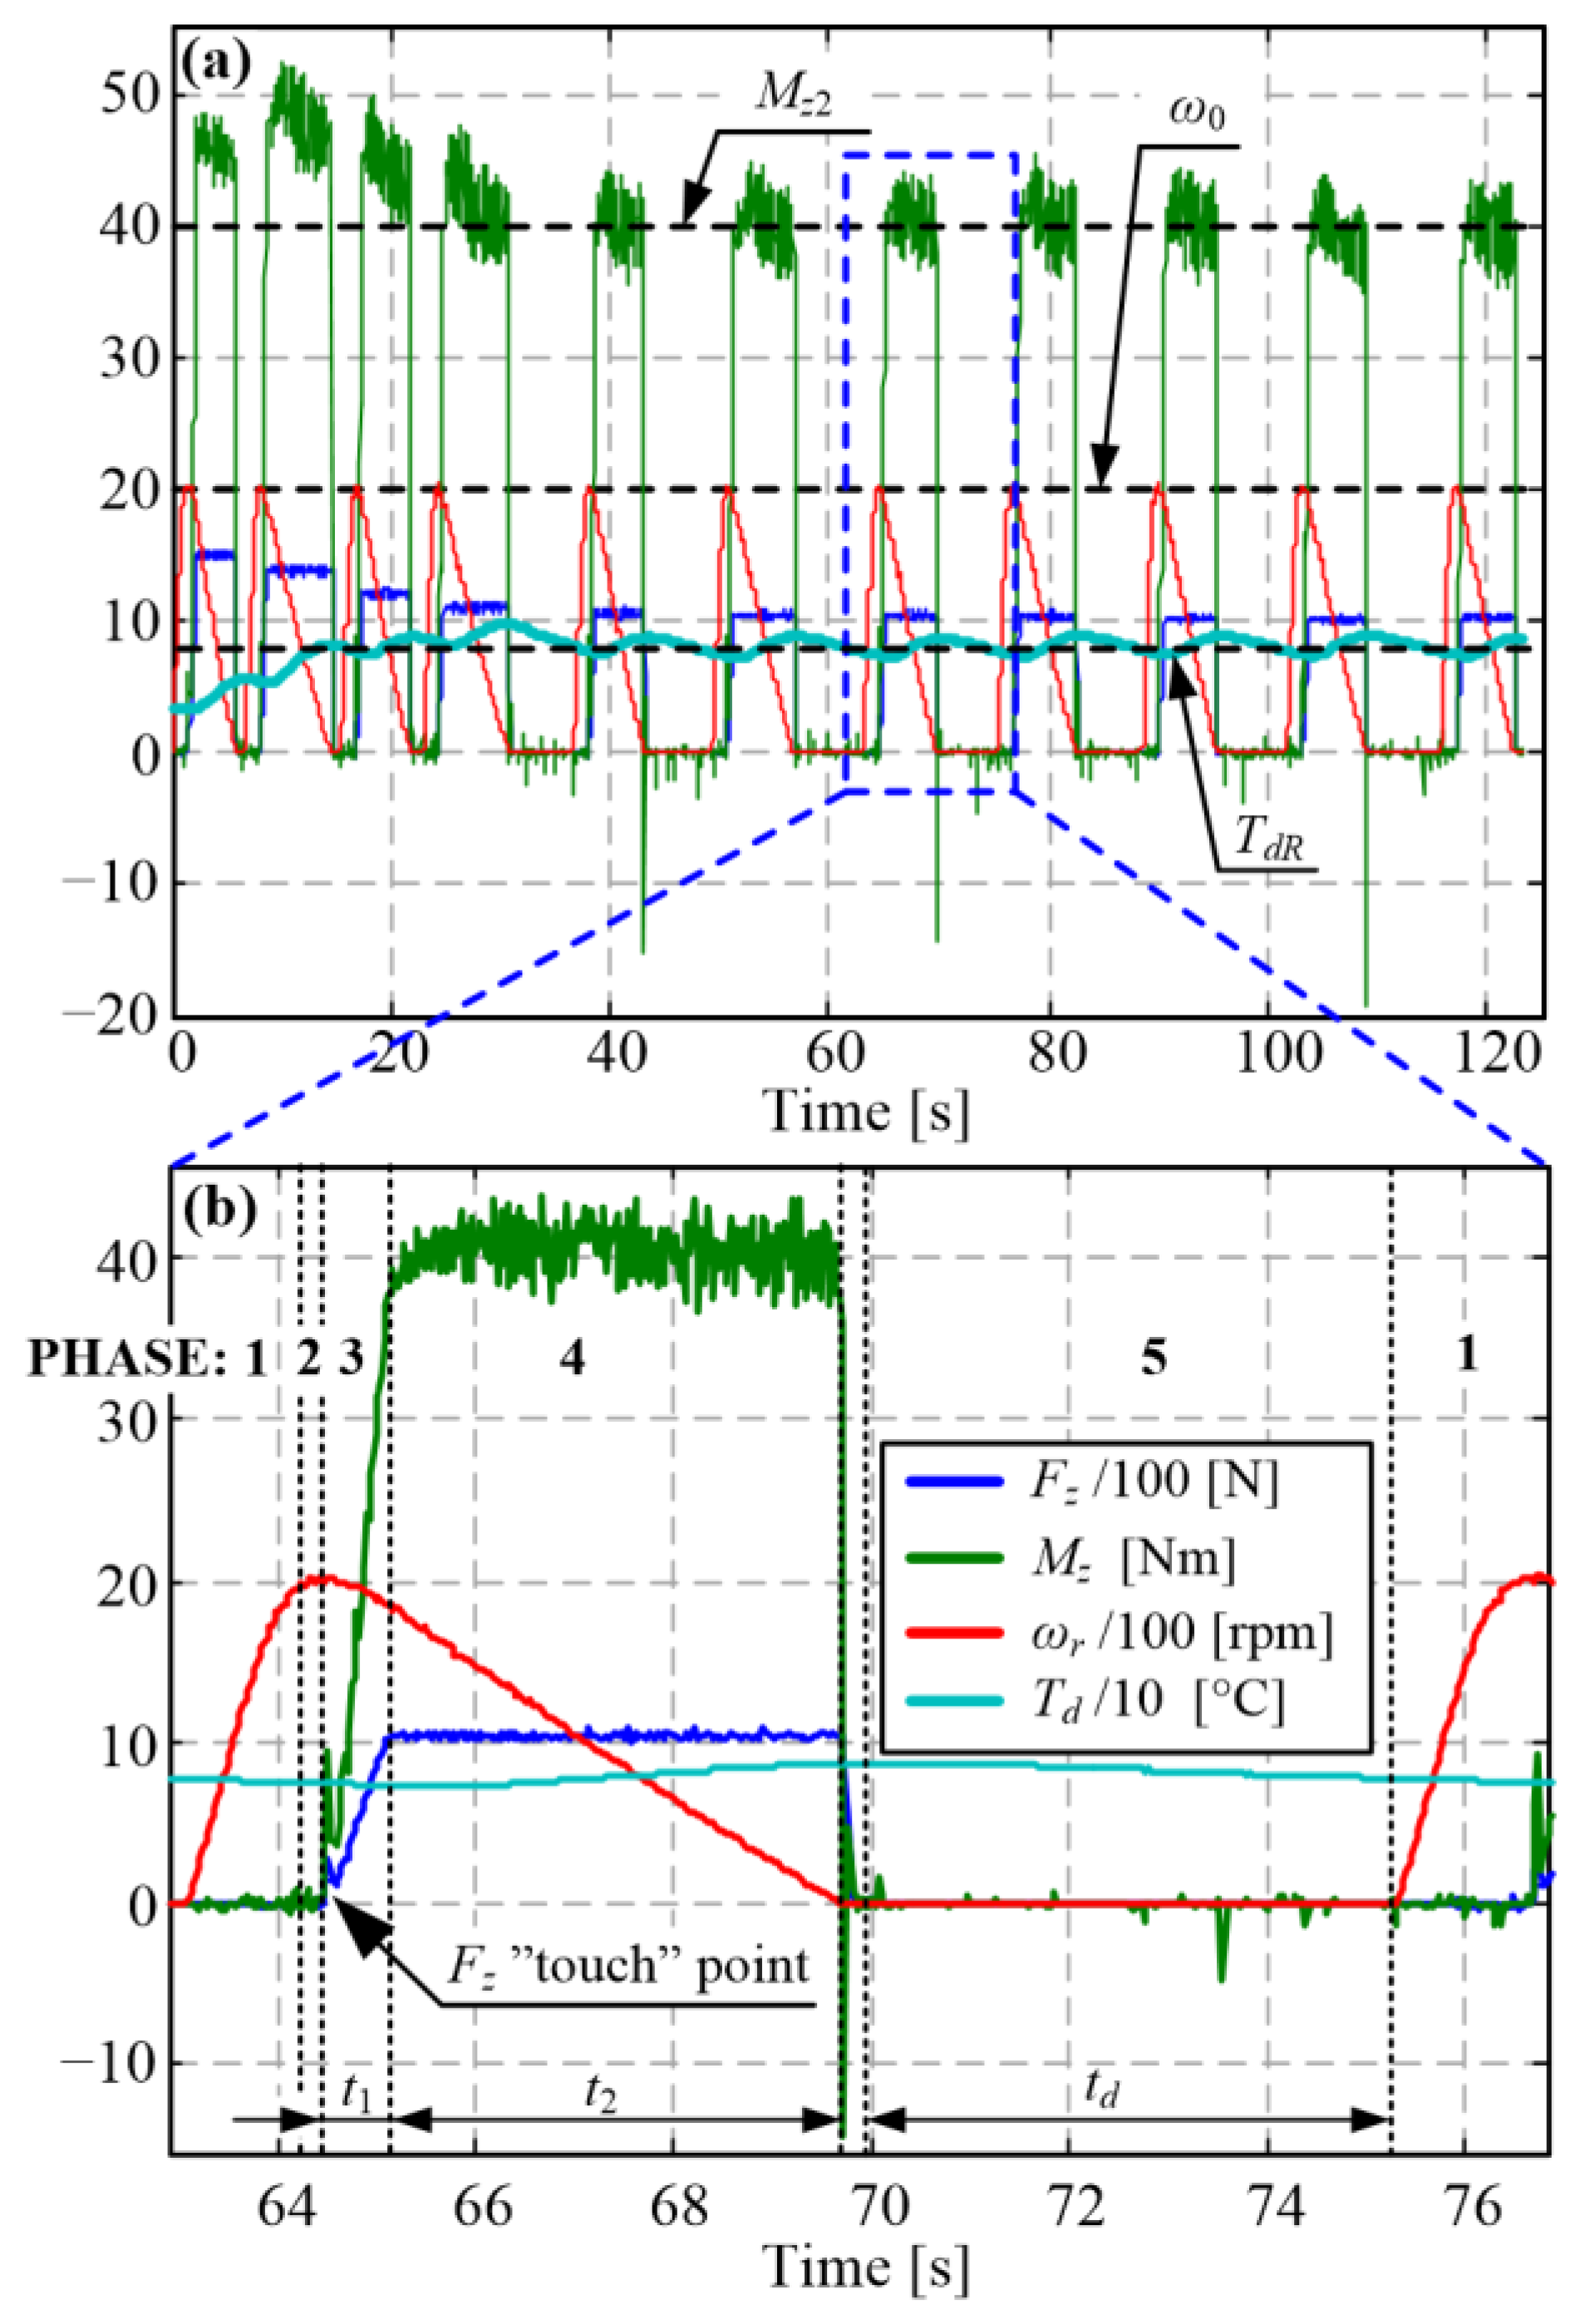
The wear tests are organized to mimic the real manual transmission clutch operation through clutch closing cycles. Each closing cycle consists of the following phases (Figure 2): (1) ramping up the slip speed to the target level under idling operation (i.e., without friction load), (2) lowering the vertical axis, (3) linearly increasing the normal force (interval t1), (4) maintaining the normal force at the target level Fz2 until the slip speed drops to zero (interval t2), and (5) lifting up the vertical axis and imposing the cooling delay needed to control the friction interface temperature at the target level (interval td).
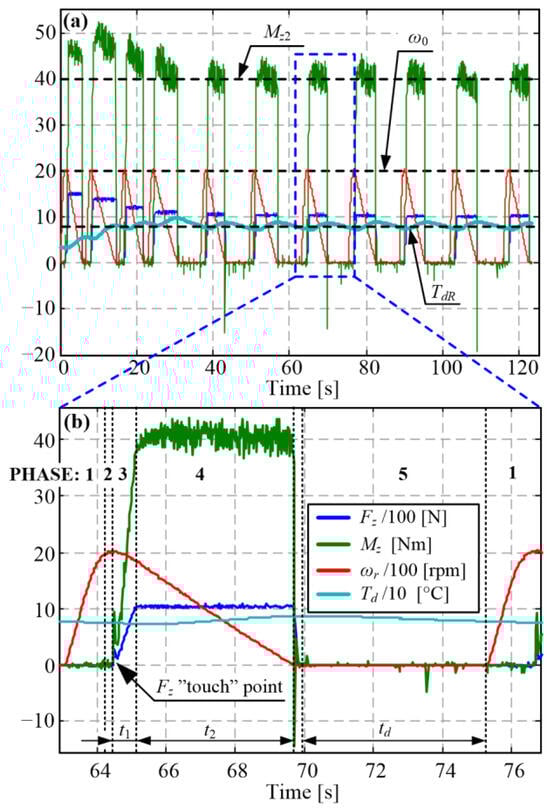
Figure 2.
Time responses of slip speed, torque, closing time, and temperature control systems for the target values: initial slip speed ω0 = 2000 rpm, average torque in closing interval Mz2 = 40 Nm, closing interval t2 = 5 s, pressure plate temperature reference TdR = 80 °C during several closing cycles (a) including zoom-in detail of single closing cycle (b).
The torque Mz (or normal force Fz), slip speed (ωr), temperature (Td), and closing time (t2) are accurately controlled via feedback regulators acting through rotational- and vertical-axis servodrives and the water-cooling system (see Table 1 and time responses in Figure 2). Apart from imposing a delay (td) between two consecutive clutch closing cycles, the pressure plate temperature is controlled by varying the cooling pump speed and manipulating an on/off valve that can bypass the coolant flow around the pressure plate. The torque control system is realized in a cascade structure comprising a superimposed integral (I)-type torque controller, an inner proportional (P)-type normal force controller, and a most-inner proportional-integral (PI) vertical axis motor speed controller. The closing time is controlled by means of “electrical inertia”, implemented through an integral type closing time controller, which commands the electric inertia ratio used to calculate the rotational axis servomotor torque reference from the measured friction interface torque. A detailed elaboration on the control system design is given in [17].

Table 1.
Overview of control system design.
2.4. Limitations on Stable Machine Operation
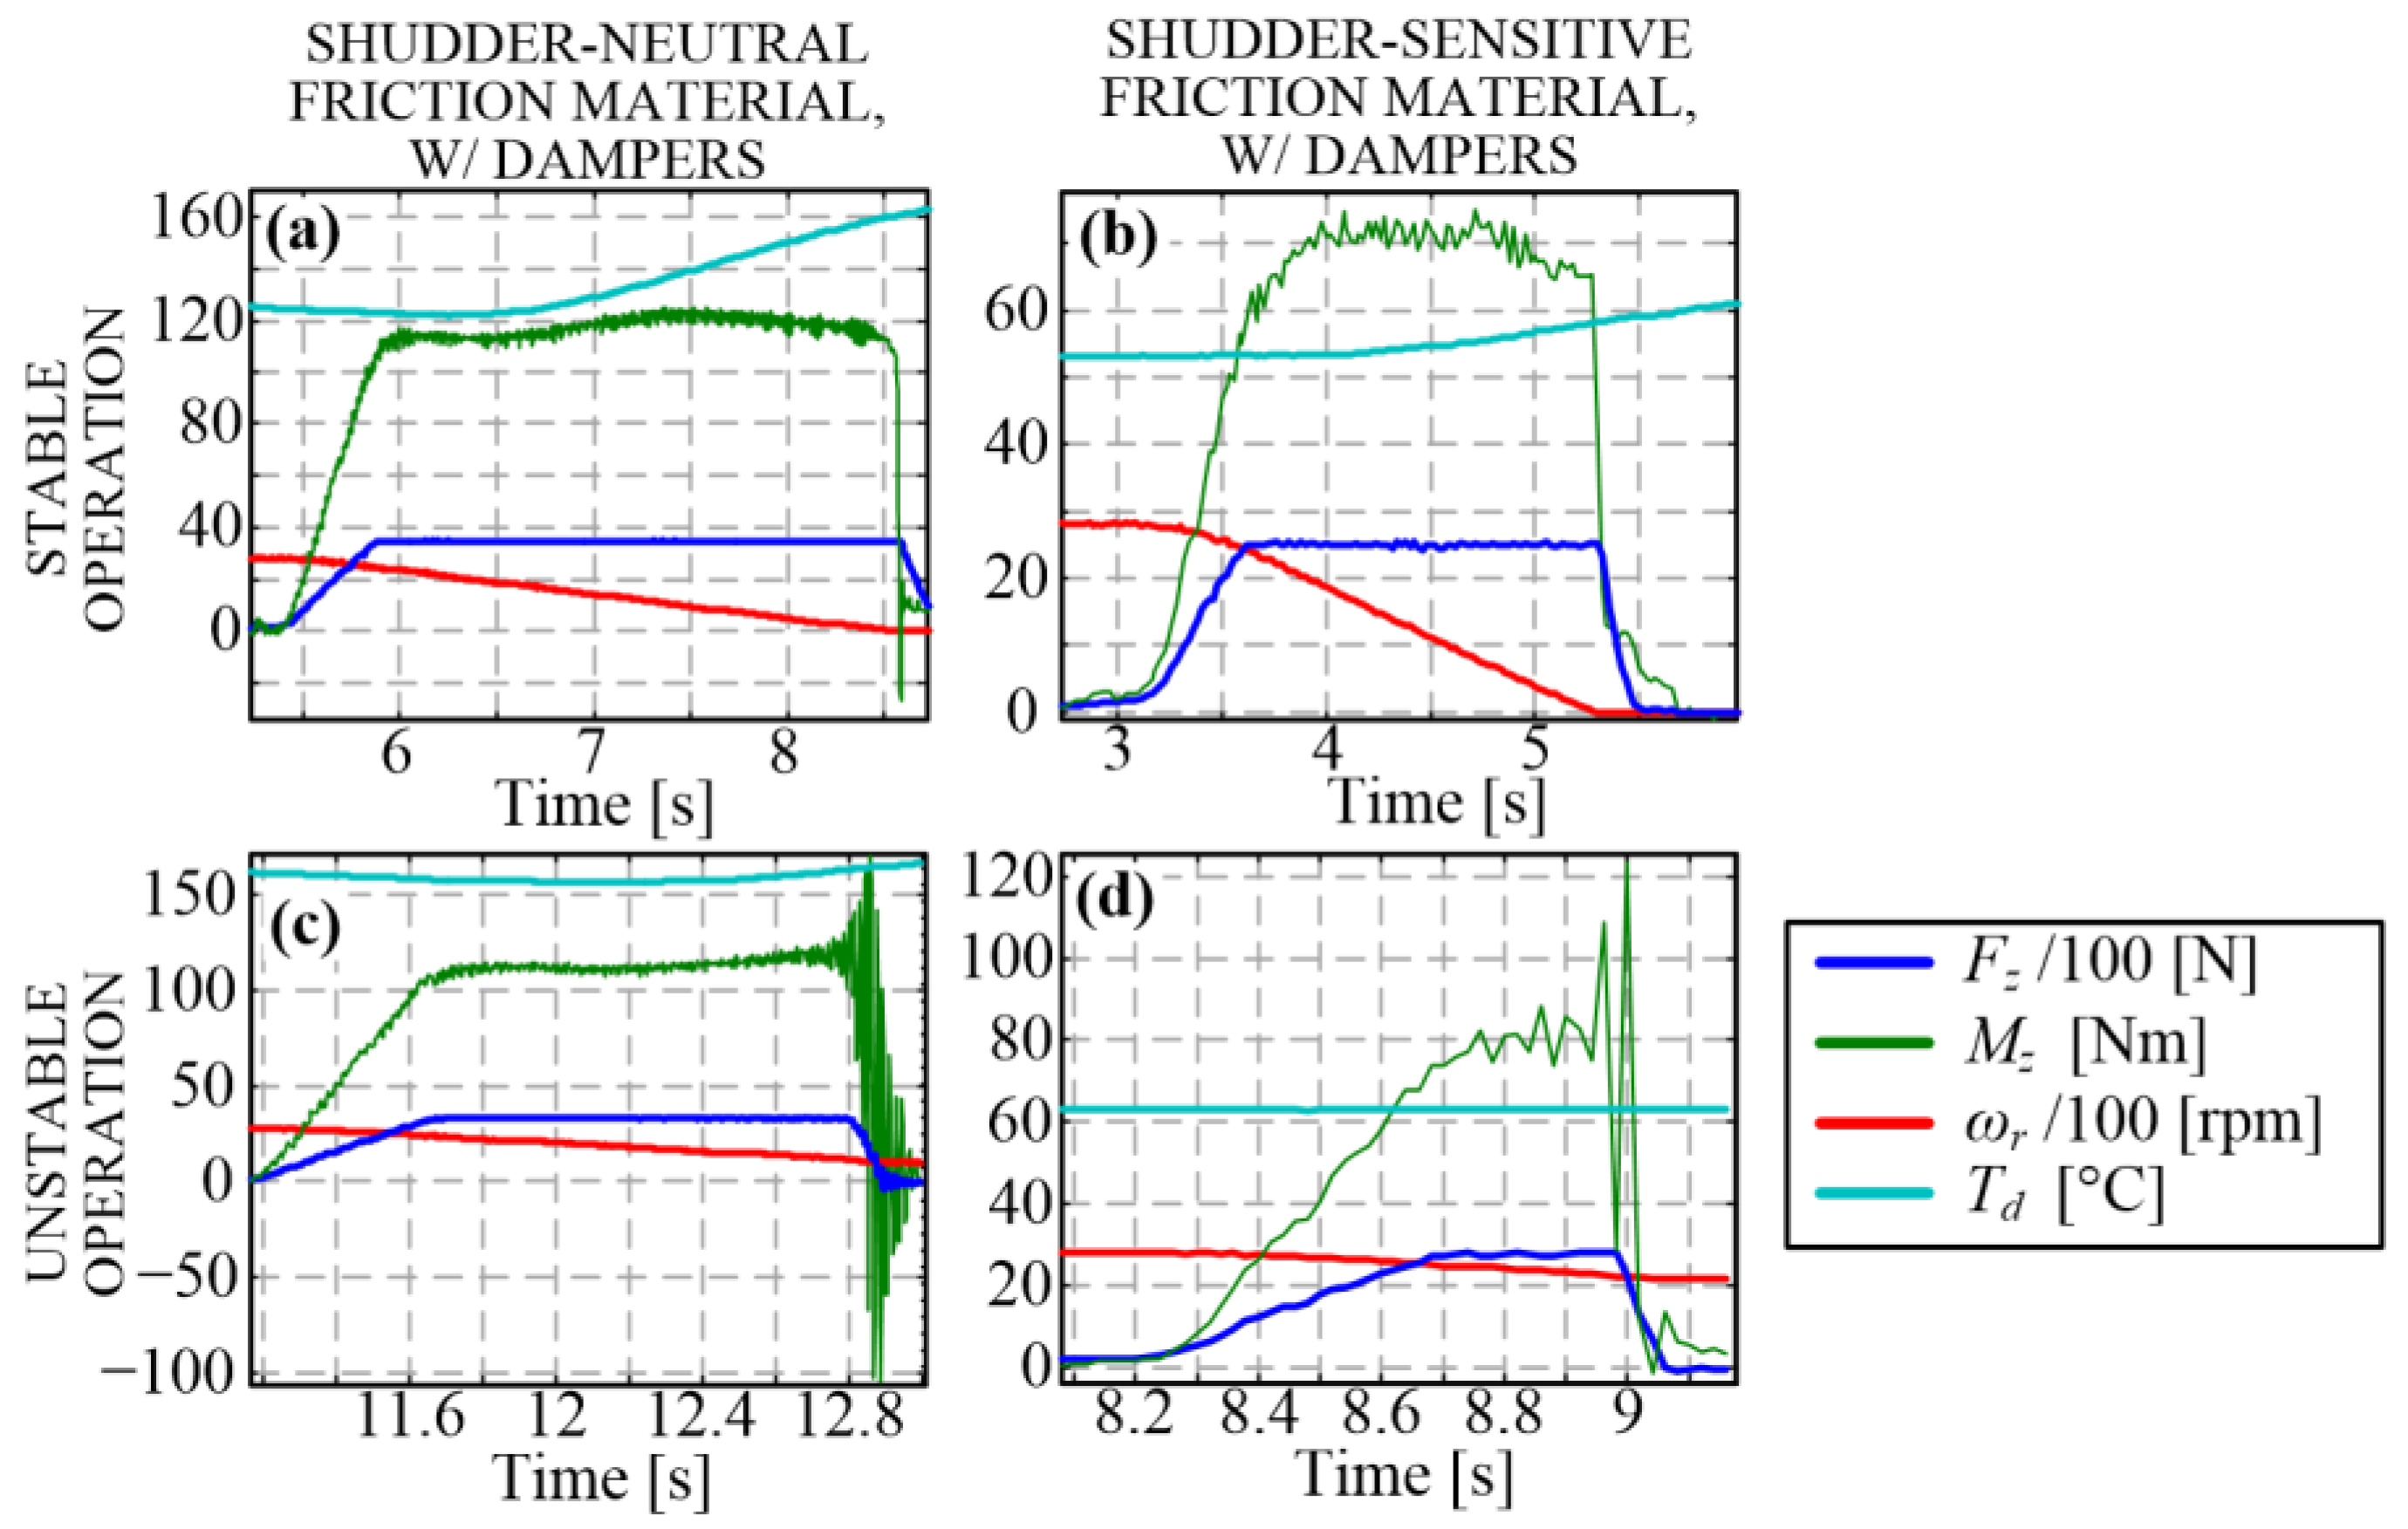
Implementation of the pressure plate/cooling disc assembly dampers (Section 2.2) enabled stable long-term operation of the tribometer in the case of shudder-sensitive material for a wide range of slip speeds, temperatures, and closing times, and for the torque, lower than half a rated torque (50 Nm, corresponding to the normal force and contact pressure in the range [1200, 1700] N and [0.05, 0.07] N/mm2, respectively, depending on the friction coefficient and for the friction plate active area of 23,046 mm2; [17]). Although higher values of torque were feasible in some occurrences (Figure 3a,b), the shudder vibration appearance was frequent in those conditions (Figure 3c,d).
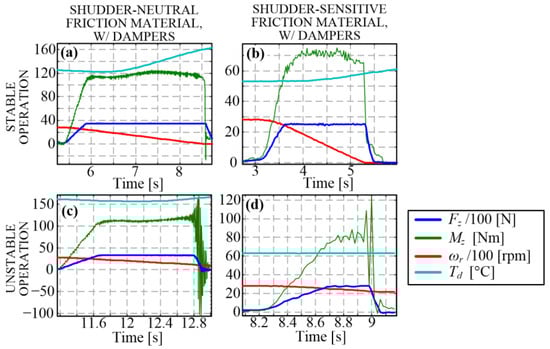
Figure 3.
Examples of stable and unstable operation of tribometer with installed dampers for shudder-neutral (a,c) and shudder-sensitive friction materials (b,d) under high-torque and high-speed conditions.
The shudder appearance was usually unstable (Figure 3c,d) and triggered the control system to shut down the machine to prevent sensor damage. Even if sustained, the shudder vibrations were supposed to affect the wear process and, consequently, the test results. Therefore, redesigning the machine that would enable the execution of experiments for shudder-sensitive materials and full torque range was needed. This goal should be accomplished without the use of dampers for ultimate measurement precision. Redesigning is the main objective of this work, and it is presented in Section 3, Section 4 and Section 5.
2.5. Analysis of Vertical Axis Vibration Model
It has been hypothesized that the link between the axial and torsional vibrations observed in the torque and normal force signals in Figure 3 relates to the bending of the vertical axis caused by the non-parallelism between the contact surfaces. Namely, variations in the normal force around the circumference of the non-parallel surfaces results in the generation of lateral friction force components, which causes the bending torque on the vertical axis, including the two-axial (force/torque) sensor. The hypothesis was initially verified based on the improved vibration suppression performance after introducing the linear bearing above the two-axial sensor (component (3) in Figure 1; [17]), i.e., stiffening the vertical axis in the bending direction Since the two-axial sensor does not enable measurement of these individual forces and torques, the following analysis is used to further support the proposed hypothesis.
A simplified static model of the vertical axis is shown in Figure 4. In the case of the occurrence of eccentric normal force (Fz), the corresponding eccentric lateral friction forces occur, which depends on the eccentric normal force and the coefficient of friction (μ), i.e., Ft = μ ∙ Fz. The installed two-axial sensor is subjected to the normal force and the friction torque (Mz) acting on the central axis:
where reff is the clutch effective radius [17]. Due to the eccentricity of both normal (Fz) and friction forces (Ft), the two-axial sensor, as well as the entirety of the vertical axis, is also subjected to the bending moment:
Mz = μFz reff
Mb = √[(FtH)2 + (FzR)2]
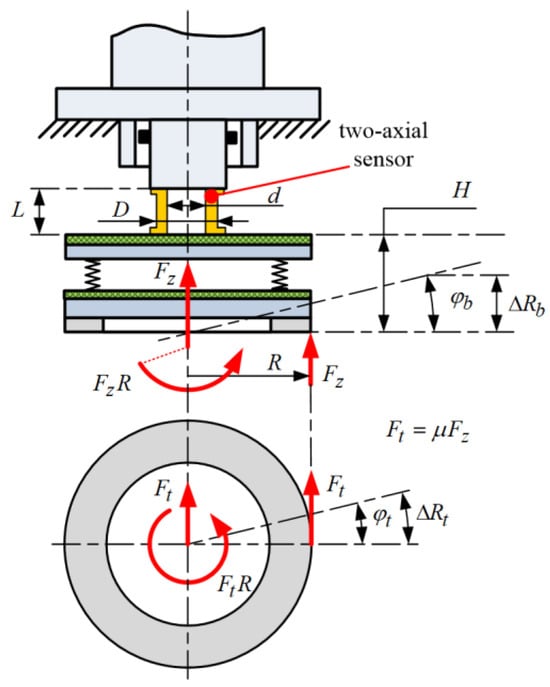
Figure 4.
Simplified model of vertical axis used in shudder-vibration analysis.
The two-axial sensor has a general cylindrical shape and is composed of an outer and inner protective shell, which encompasses the actual force-sensitive quartz components, electronics, wiring, and signal connectors. In the absence of information on individual material properties, the sensor is approximated by a hollow steel shaft with the actual dimensions: length L = 60 mm, inner diameter d = 56.4 mm, and outer diameter D = 64.8 mm. The axial, bending, and torsional stiffness of the simplified-shape components equal
where A is the cross-section surface, I is the bending momentum, and Ip is the polar/torsional momentum, while E = 210 kN/mm2 and G = 80 kN/mm2 are Youngs bending and torsional modulus for steel, respectively. The comparison with the two-axial sensor catalogue [19] shows that the above-determined values of the axial (ca) and torsional stiffnesses (ct) differ slightly from the declared sensor values. This agreement implies that the determined value of bending stiffness (cb) should also be an accurate representative of the true sensor value, which is not declared in [19].
ca = AE/L = 2.80 ∙ 109 N/m; A = π (D2 − d2)/4 = 799.6 ∙ 10−5 m2
cb = IE/L = 1.29 ∙ 106 Nm/rad; I = π (D4 − d4)/64 = 0.37 ∙ 10−6 m4
ct = IpG/L = 0.98 ∙ 106 Nm/rad; Ip = π (D4 − d4)/32 = 0.74 ∙ 10−6 m4
The bending and torsional stiffness can be recalculated into equivalent axial (ca,eq) and shear stiffnesses (cs,eq), respectively, for a point positioned at the outer radius of the friction plate (R = 119.75 mm, [17], Figure 4):
where a small-angle assumption sinφ ≈ φ is used, the friction coefficient is set to μ = 0.4 [17]. Both equivalent bending and torsional stiffness values ct,eq and cb,eq are approximately two orders of magnitude lower compared to the axial stiffness ca. However, it should be noted that the custom-designed leaf springs are positioned in a serial connection with the two-axial force sensor. The leaf springs are designed to enable vertical compliance while maintaining high lateral stiffness, i.e., the overall axial stiffness of the vertical axis is lower compared to the torsional stiffness. Hence, the relative amplitudes of torsional vibrations are significantly higher compared to the relative amplitudes of axial vibrations, as evidenced by the responses of Mz and Fz in Figure 3.
cb = Mb/φb = √[(FtH)2 + (FzR)2]/(ΔRb/R) = Fz R √[(μH)2 + R2]/ΔRb = ca,eq R √[(μH)2 + R2] → ca,eq = 8.39 ∙ 107 N/m
ct = Mt/φt = Ft R/(ΔRt/R) → cs,eq = 6.86 ∙ 107 N/m
The above analysis implies that the obtained relatively low values of the equivalent bending stiffness of the two-axial force sensor result in noticeable bending when subjected to eccentric forces, which may be normal forces due to the non-parallelism of friction surfaces and/or tangential due to the non-consistent coefficient of friction around the circumference of the friction plate. This deformation, in turn, results in a further increase in the non-parallelism and a subsequent further increase in the eccentric forces, thus, forming a positive feedback path between the axial force/torque and the bending deformation and ending in strong, even unstable vibrations, as observed in Figure 3b,d.
Based on the presented analysis, it may be concluded that reducing the excitation of bending vibrations would be beneficial from the standpoint of shudder suppression. This can be achieved by increasing the sensor bending stiffness and reducing the non-parallelism of the contact surfaces.
3. Tribometer Redesign
3.1. Redesign Concept
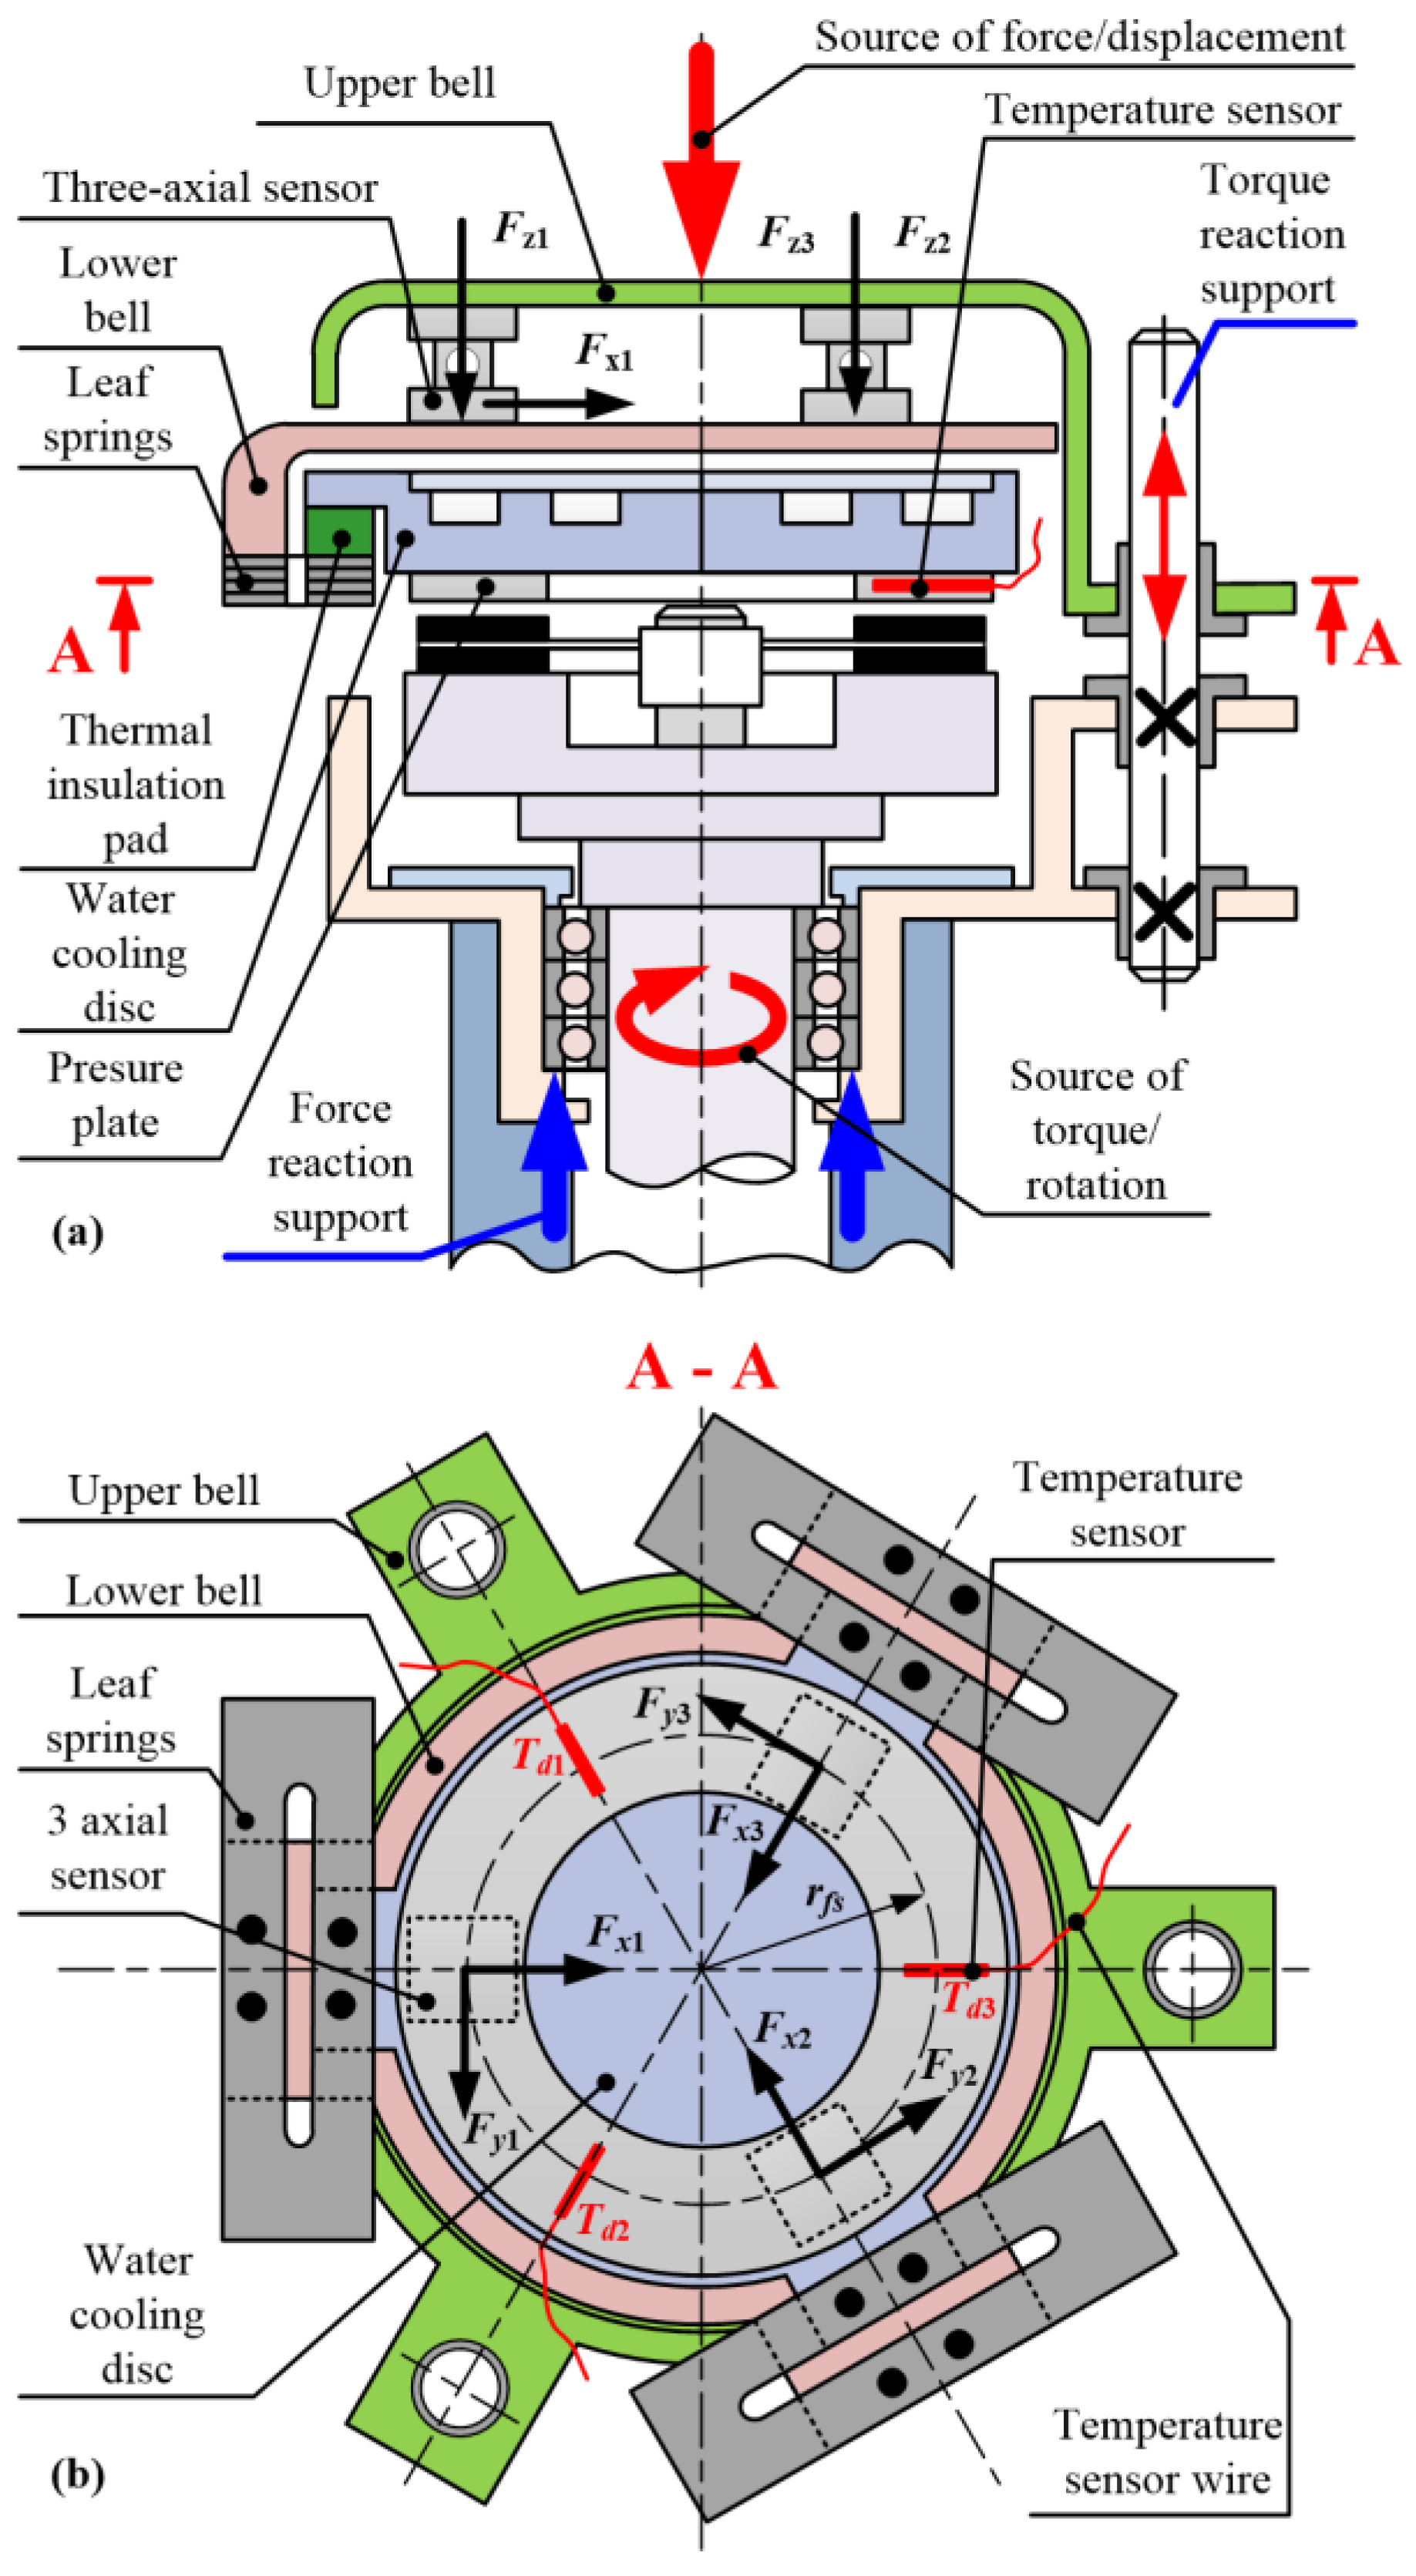
A functional schematic of the redesigned tribometer machine is shown in Figure 5. All the proposed changes are implemented without changing the key aspects of the original design. In particular, the cooling disc is still mechanically connected solely to the lower bell via leaf springs. The lower bell is then connected to the upper bell via the torque/force measurement system. Thus, all forces occurring in the friction contact are transferred and measured by the sensor, i.e., a parasitic parallel transfer of force does not exist (note that the dampers to the housing are not installed anymore).
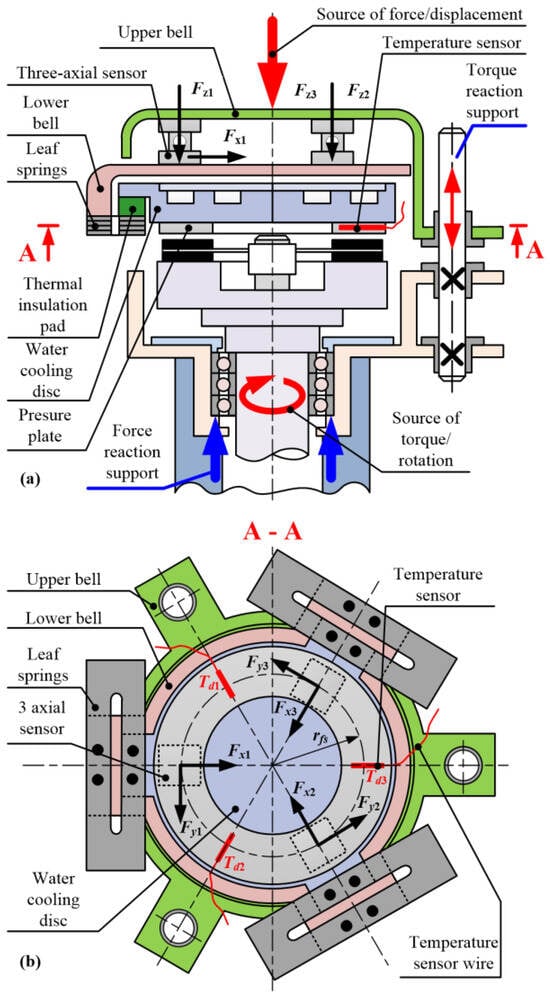
Figure 5.
Functional schematic of the redesigned disc-on-disc tribometer machine (a) and cross-section (b).
Based on the analysis of the simplified static model of the tribometer vertical axis (Section 2), it is concluded that the main source of the vibrations is related to the effect of two-axial (force/torque) sensor bending, i.e., that the low stiffness of the system in the lateral plane results in the primary propagation of vibrations in the lateral direction, and their subsequent transfer to the torsional axis. Therefore, the main emphasis of tribometer design has been on the increase in lateral stiffness. Decreasing the masses carried by the two-axial sensor would also be beneficial since the natural frequency of the vertical axis vibrations would be further increased.
The following redesign measures have been recognized to be beneficial from the standpoint of lateral stiffness increase:
- Applying three circumferentially equidistantly positioned three-axial piezoelectric force sensors instead of a single two-axial force/torque sensor positioned in the central vertical axis;
- Implementing three radially distanced linear guides instead of one placed in the main axis of the machine;
- Reducing the bending torque of lateral forces on the linear axis guides and the leaf springs by reducing the length of the force cantilever through placing the linear guides and the leaf springs in the same horizontal plane with the friction contact surface (albeit at a greater radius).
The mass reduction has been achieved through:
- Reduction of the cooling disc radius and thickness at the expense of somewhat lowered thermal inertia;
- Redesign of the thermal insulation to go from full disc to small pads, which also increases thermal resistances by means of a small contact surface between the cooling disc and vertical axis.
The three three-axial sensors (model 9317C by Kistler [20]) are positioned circumferentially and equidistantly, which forms a three-point connection structure. Compared to the single, central-axis-positioned two-axial sensor, the eccentric normal and/or lateral force predominantly results in the axial load of the new sensor instead of its bending, while the torsional load results in linear instead of torsional shear. The axial and shear stiffness of an individual three-axial sensor equals 8.8 ∙ 108 N/m and 1.9 ∙ 108 N/m, respectively [20], and the overall axial and shear stiffness for the entire set of sensors is higher by the factor of three, i.e., ca,set = 2.7 ∙ 109 N/m and cs,set = 5.7 ∙ 108 N/m. When compared with the results of Equations (7) and (8), it may be concluded that the lateral and torsional stiffness are increased by the factors of 32 and 8, respectively.
Fixtures of the linear guides are linked to the mounting of the main rotational axis bearings. This arrangement minimizes the cantilever length of the lateral forces on the linear guides when the linear axis reaches its lowest position corresponding to the maximum normal and, consequently, the maximum lateral forces (unlike large distance from the contact surface to the single linear bearing for the current design, cf. Figure 1 and Figure 5). In addition, placing both the main bearings and the linear guide on the same mechanical components maximizes alignment of the rotational and vertical axes, thus, reducing the eccentricity of lateral forces and, thus, the shudder excitation.
The leaf springs and the newly installed linear guides are positioned in an alternate order and as close to the contact surface plane as possible (plane A-A, Figure 5a) in order to reduce the bending torque of the lateral forces on both the leaf springs and the linear guides. The three three-axial force sensors are positioned close to the leaf springs to minimize the deformation of the lower bell and, thus, further increase the stiffness of linear axis. The upper bell is connected to the source of the normal force and to the linear guides, which act as a torque reaction support.
The overall dimensions and mass of the cooling disc are reduced by approximately 35% compared to the original solution. The radius and thickness of the actual cooling disc are reduced to enable positioning of the leaf springs and the linear guides within the same housing, thus, resulting in the reduction of mass by approximately 10%. Most of the mass reduction relates to removal of the additional steel plate and thermal insulation disc on top of the cooling disc assembly. Instead, small thermal insulation pads are placed as connectors between the cooling disc and the leaf spring, which are now positioned at the side of the cooling disc (see Figure 5a). The mass of the cooling disc section between the friction contacts and the thermal insulation remains almost the same, thus, preserving the thermal mass of the cooling disc for favorable thermal/cooling properties.
Three temperature sensors are placed in the pressure plate at equidistant circumferential positions to enable insight into temperature distribution in the circumferential direction. The temperature sensors are placed at the locations coinciding with the linear guides because these positions facilitate the safe guiding of temperature sensor wires.
3.2. Redesign of Mechanical Components
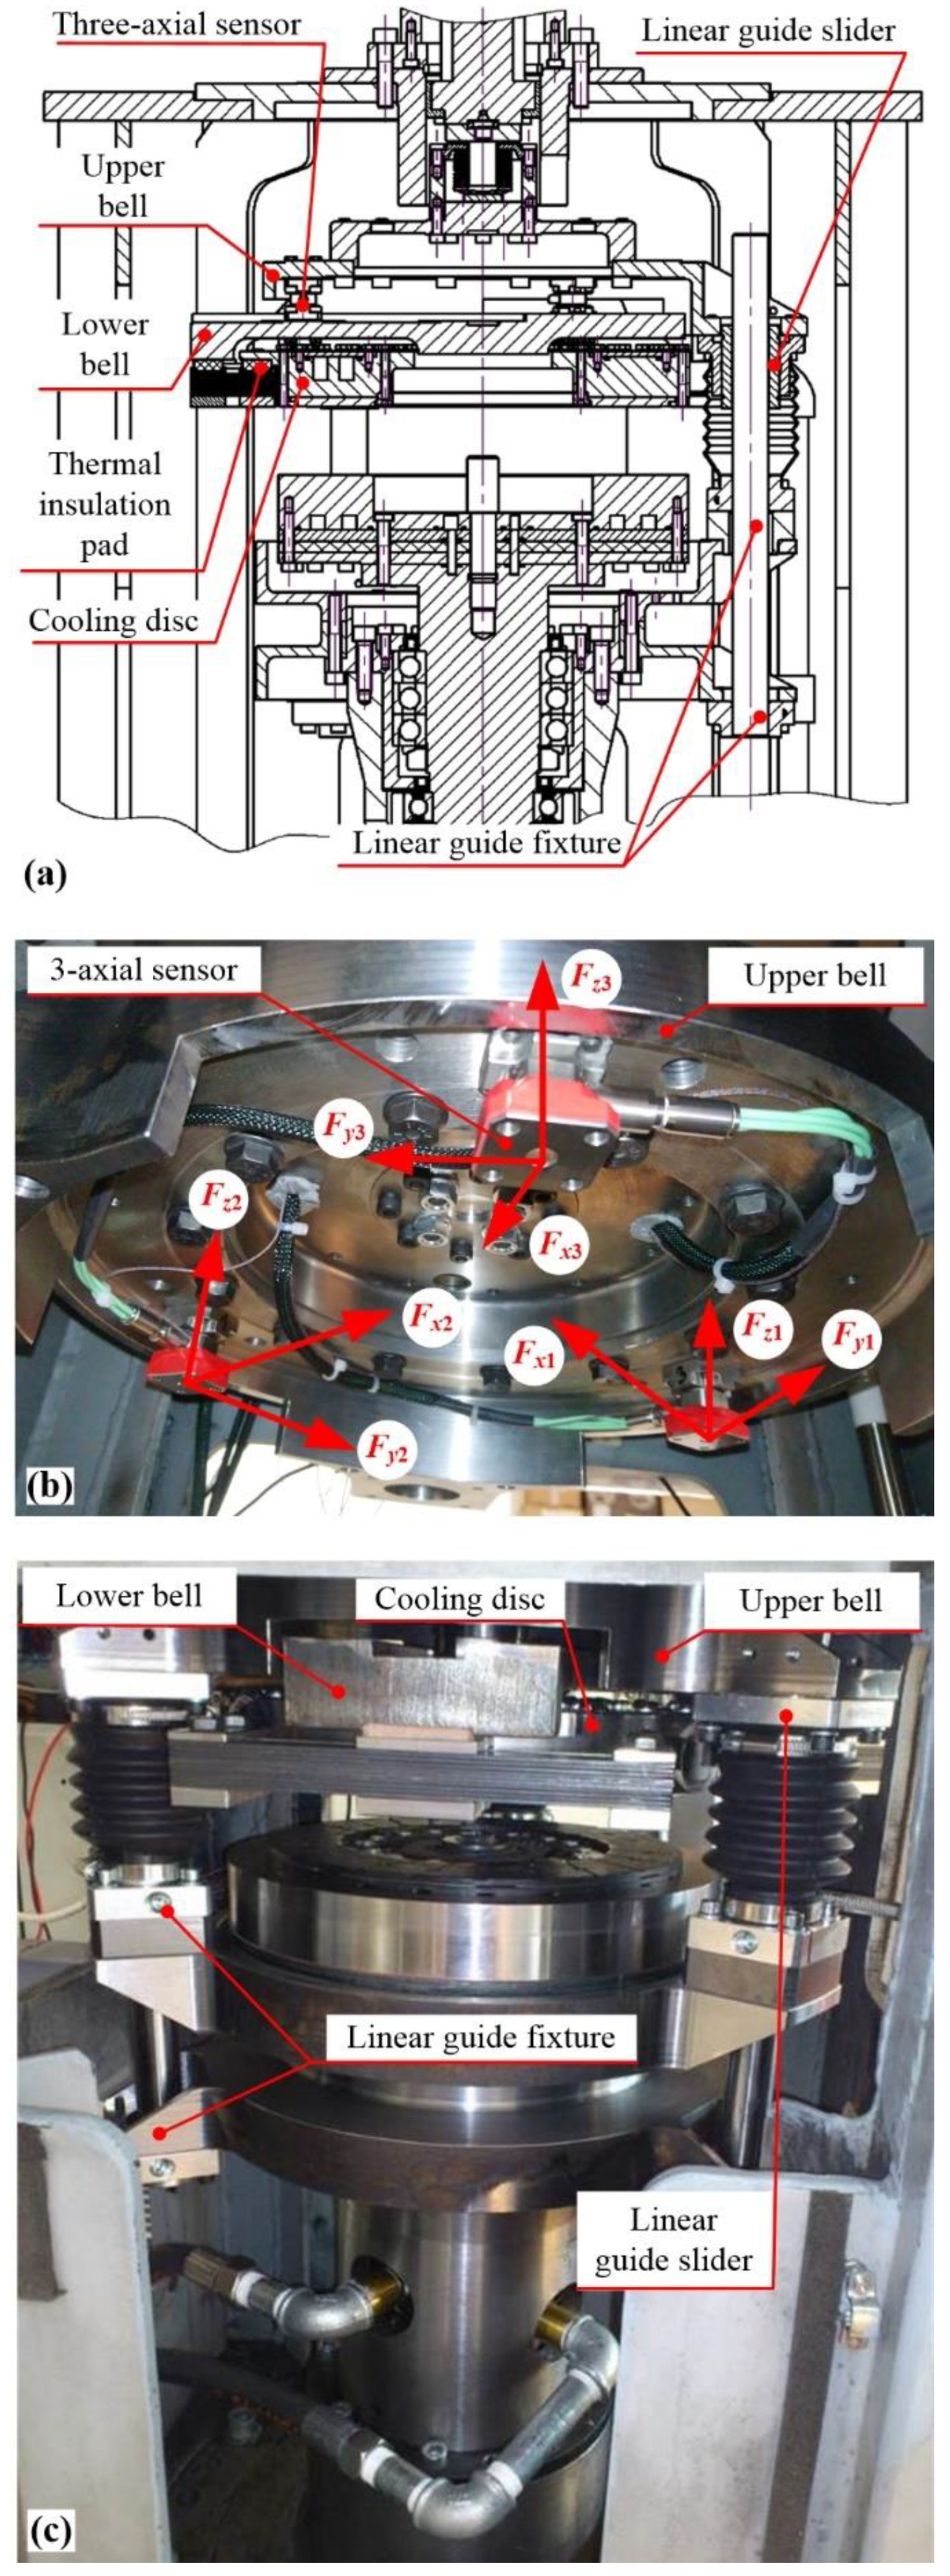
A detailed drawing of the redesigned mechanical subsystem is shown in Figure 6a, with the corresponding photographs given in Figure 6b,c. The solution is placed within the existing housing. A majority of the vertical axis is redesigned in accordance with the concept elaborated in Section 3.1, with only the leaf springs and the linear axis servomotor assembly transferred from the original design The vertical axis linear guides are placed around the rotary table and protected from wear particle debris by means of a rubber shielding. The rotation axis remains mostly unaltered except for the addition of the linear guide fixtures.

Figure 6.
Excerpt from technical documentation of the redesigned vertical axis subsystem (a) and photographs of the related assembled portion of the redesigned vertical axis subsystem (b,c).
3.3. Normal Force and Torque Measurement System
The total normal force to the friction plate (Fz) is determined as the sum of normal forces measured by the individual three-axial force sensors (Fz1, Fz2, Fz3; Figure 6b), i.e.,
Fz = Fz1 + Fz2 + Fz3
The friction torque (Mz) is reconstructed as the sum of tangential forces measured by the three-axial force sensors (Fy1, Fy2, Fy3; Figure 6b) multiplied by the radius at which the sensors are placed from the main vertical axis (rfs):
Mz = (Fy1 + Fy2 + Fy3) rfs
The sensors also measure the radial forces (Fx1, Fx2, Fx3; Figure 6b). Since the radial forces do not contribute to either normal force or torque, they are not used in the reconstruction of measurement signals.
The three-axial force sensors were factory calibrated. Nevertheless, the overall sensing system was verified with respect to the previously used, compact two-axial normal force/torque sensor. The verification was conducted by placing the three-axial sensor system assembly and the existing two-axial sensor onto a manual press test rig (Figure 7a). Figure 7b,c show the comparison between the normal force and torque readings obtained by using the two sensor systems. The relative difference between the two measurement systems is lower than 1% of the full-scale output (4700 N and 105 Nm). Hence, the redesigned sensor system was confirmed to operate as intended.
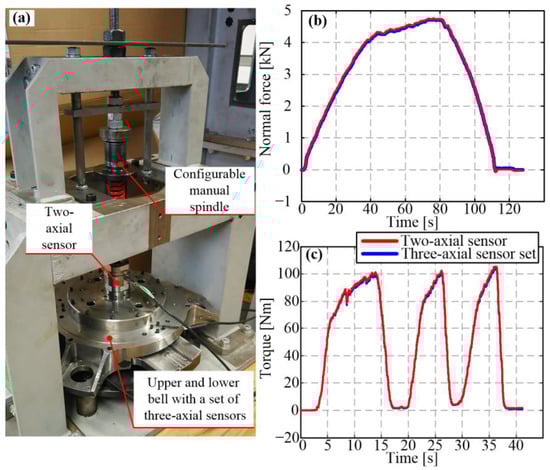
Figure 7.
Normal force and torque sensor system test setup (a) and related verification results for normal force (b) and torque readings (c).
The pressure plate temperature (Td) is obtained as the average values of individual temperature sensor readings (Td1, Td2, Td3):
Td = (Td1 + Td2 + Td3)/3
4. Mechanical Adjustments
As a part of the tribometer redesign outlined in Section 3, the following mechanical adjustments were carried out: (i) adjustments of parallelism between the rotary table and the pressure plate, (ii) increase in stiffness of the cooling fluid pipelines, and (iii) decreasing the leaf spring stiffness.
4.1. Adjustments of Parallelism between Rotary Table and Pressure Plate
The rotary table-to-pressure plate parallelism was achieved by equalizing the normal force/pressure around the circumference of the friction plane. This is feasible for the redesigned tribometer since it provides the measurement of the individual circumferential normal forces (Figure 8b). Based on the analysis presented in Section 2, achieving the parallelism of friction surfaces is one of the key measures towards suppressing the shudder vibrations, because (i) the eccentric normal force and, thus, the eccentric lateral forces and the bending torque would be minimized, and (ii) the hot spots in the friction interface would be suppressed, thus, minimizing the variation in friction coefficient and generation of the corresponding lateral forces. The latter is also beneficial from the perspective of achieving regular, uniform wear conditions.
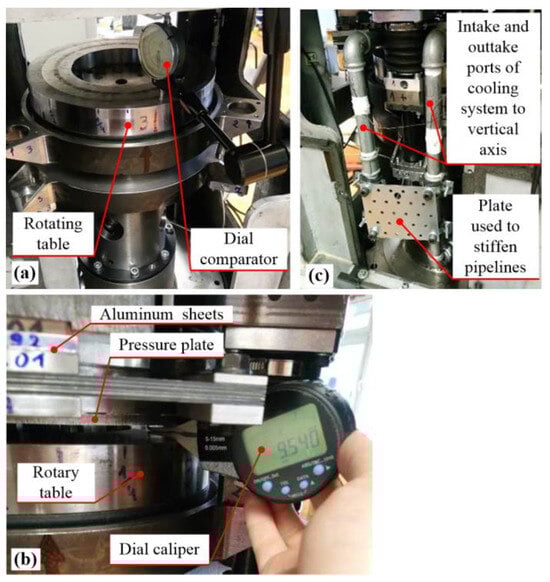
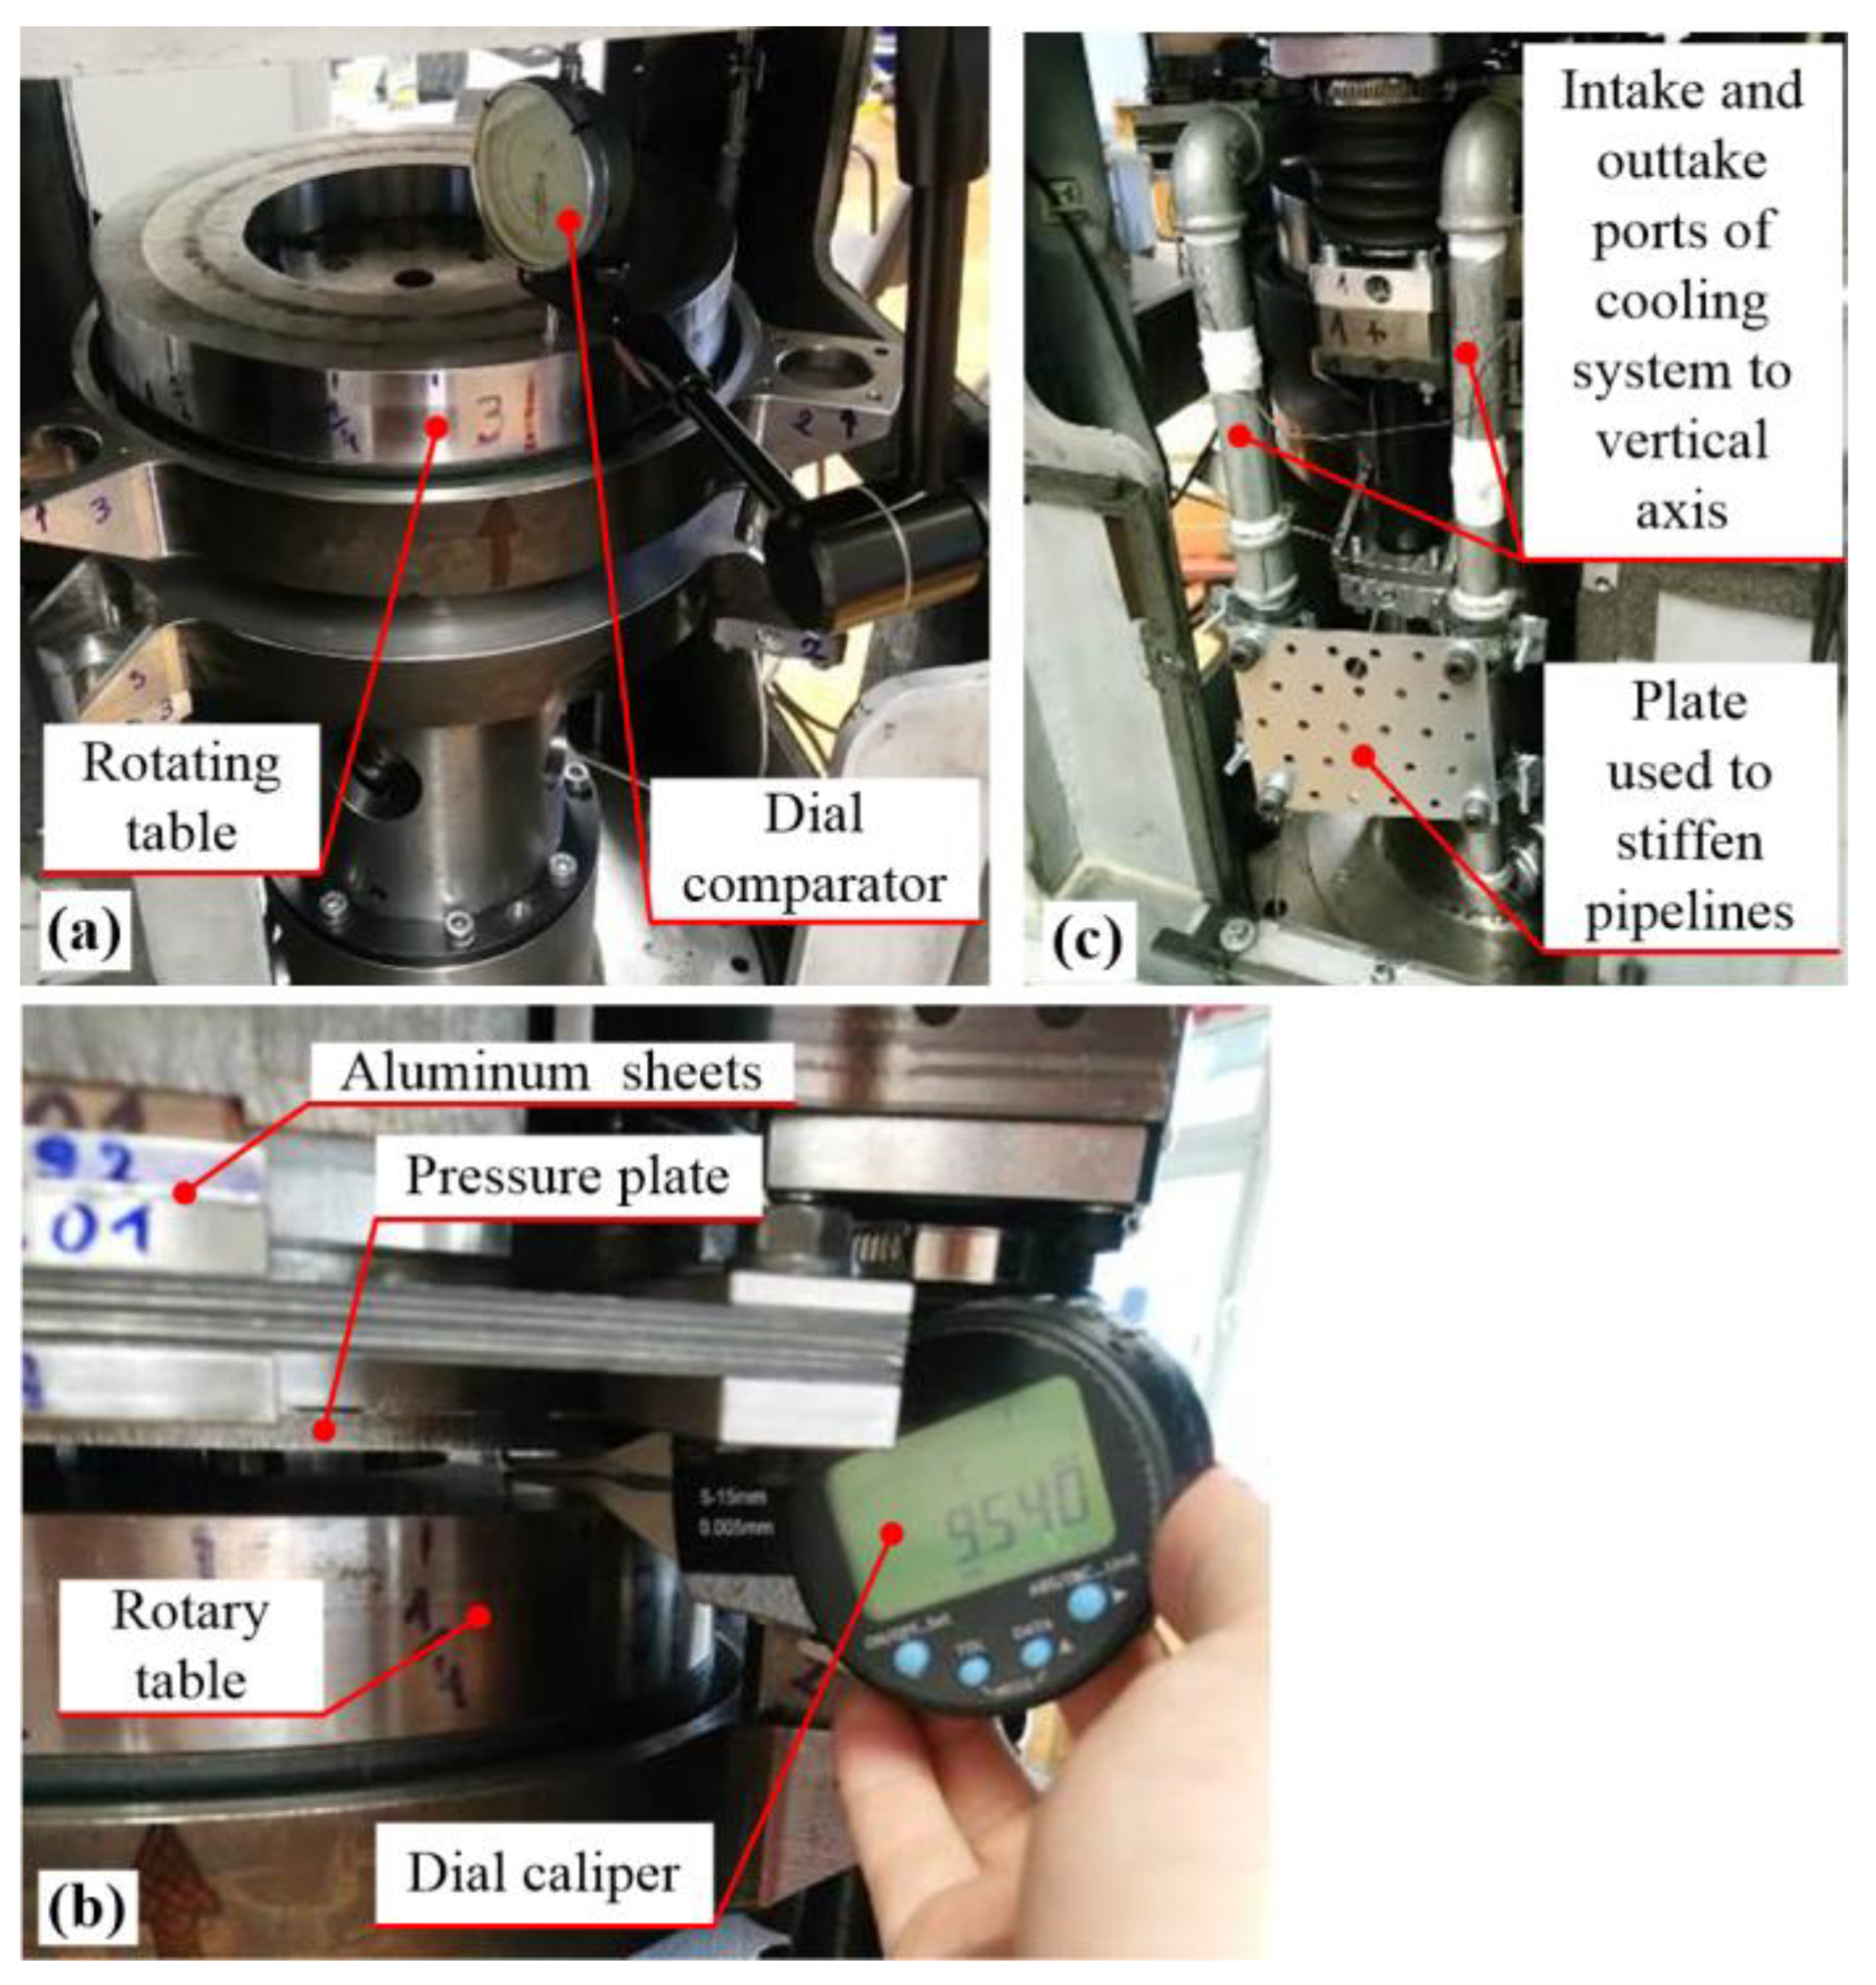
Figure 8.
Illustration of the adjustments of the orthogonality of the rotary table vertical axis to its top surface (a) and rotary table-to-pressure plate parallelism (b), and increase in stiffness of cooling fluid pipelines (c).
The first step of adjustments in the rotary table–pressure plate parallelism relates to achieving orthogonality between the main axis of the rotary table and its top surface. Oscillations in the axial position of the top surface of the manually rotated table were measured by the dial comparator (Figure 8a). The adjustments were conducted by placing thin sheets of aluminum between the rotational table and the main shaft on the lowest-peak measured point. It resulted in reducing the initial oscillations for the assembled rotary table from ±70 μm to ±30 μm. Note that this step was conducted before assembling the vertical axis.
The second step of adjustment relates to the rotary table–pressure plate parallelism itself. Initially, the goal was to make the rotary table–pressure plate distance uniform around the circumference. A dial caliper was, thus, used to measure the distances at three equidistant points around the circumference. The observed differences were reduced by inserting aluminum sheets at the contact of leaf springs towards the lower bell.
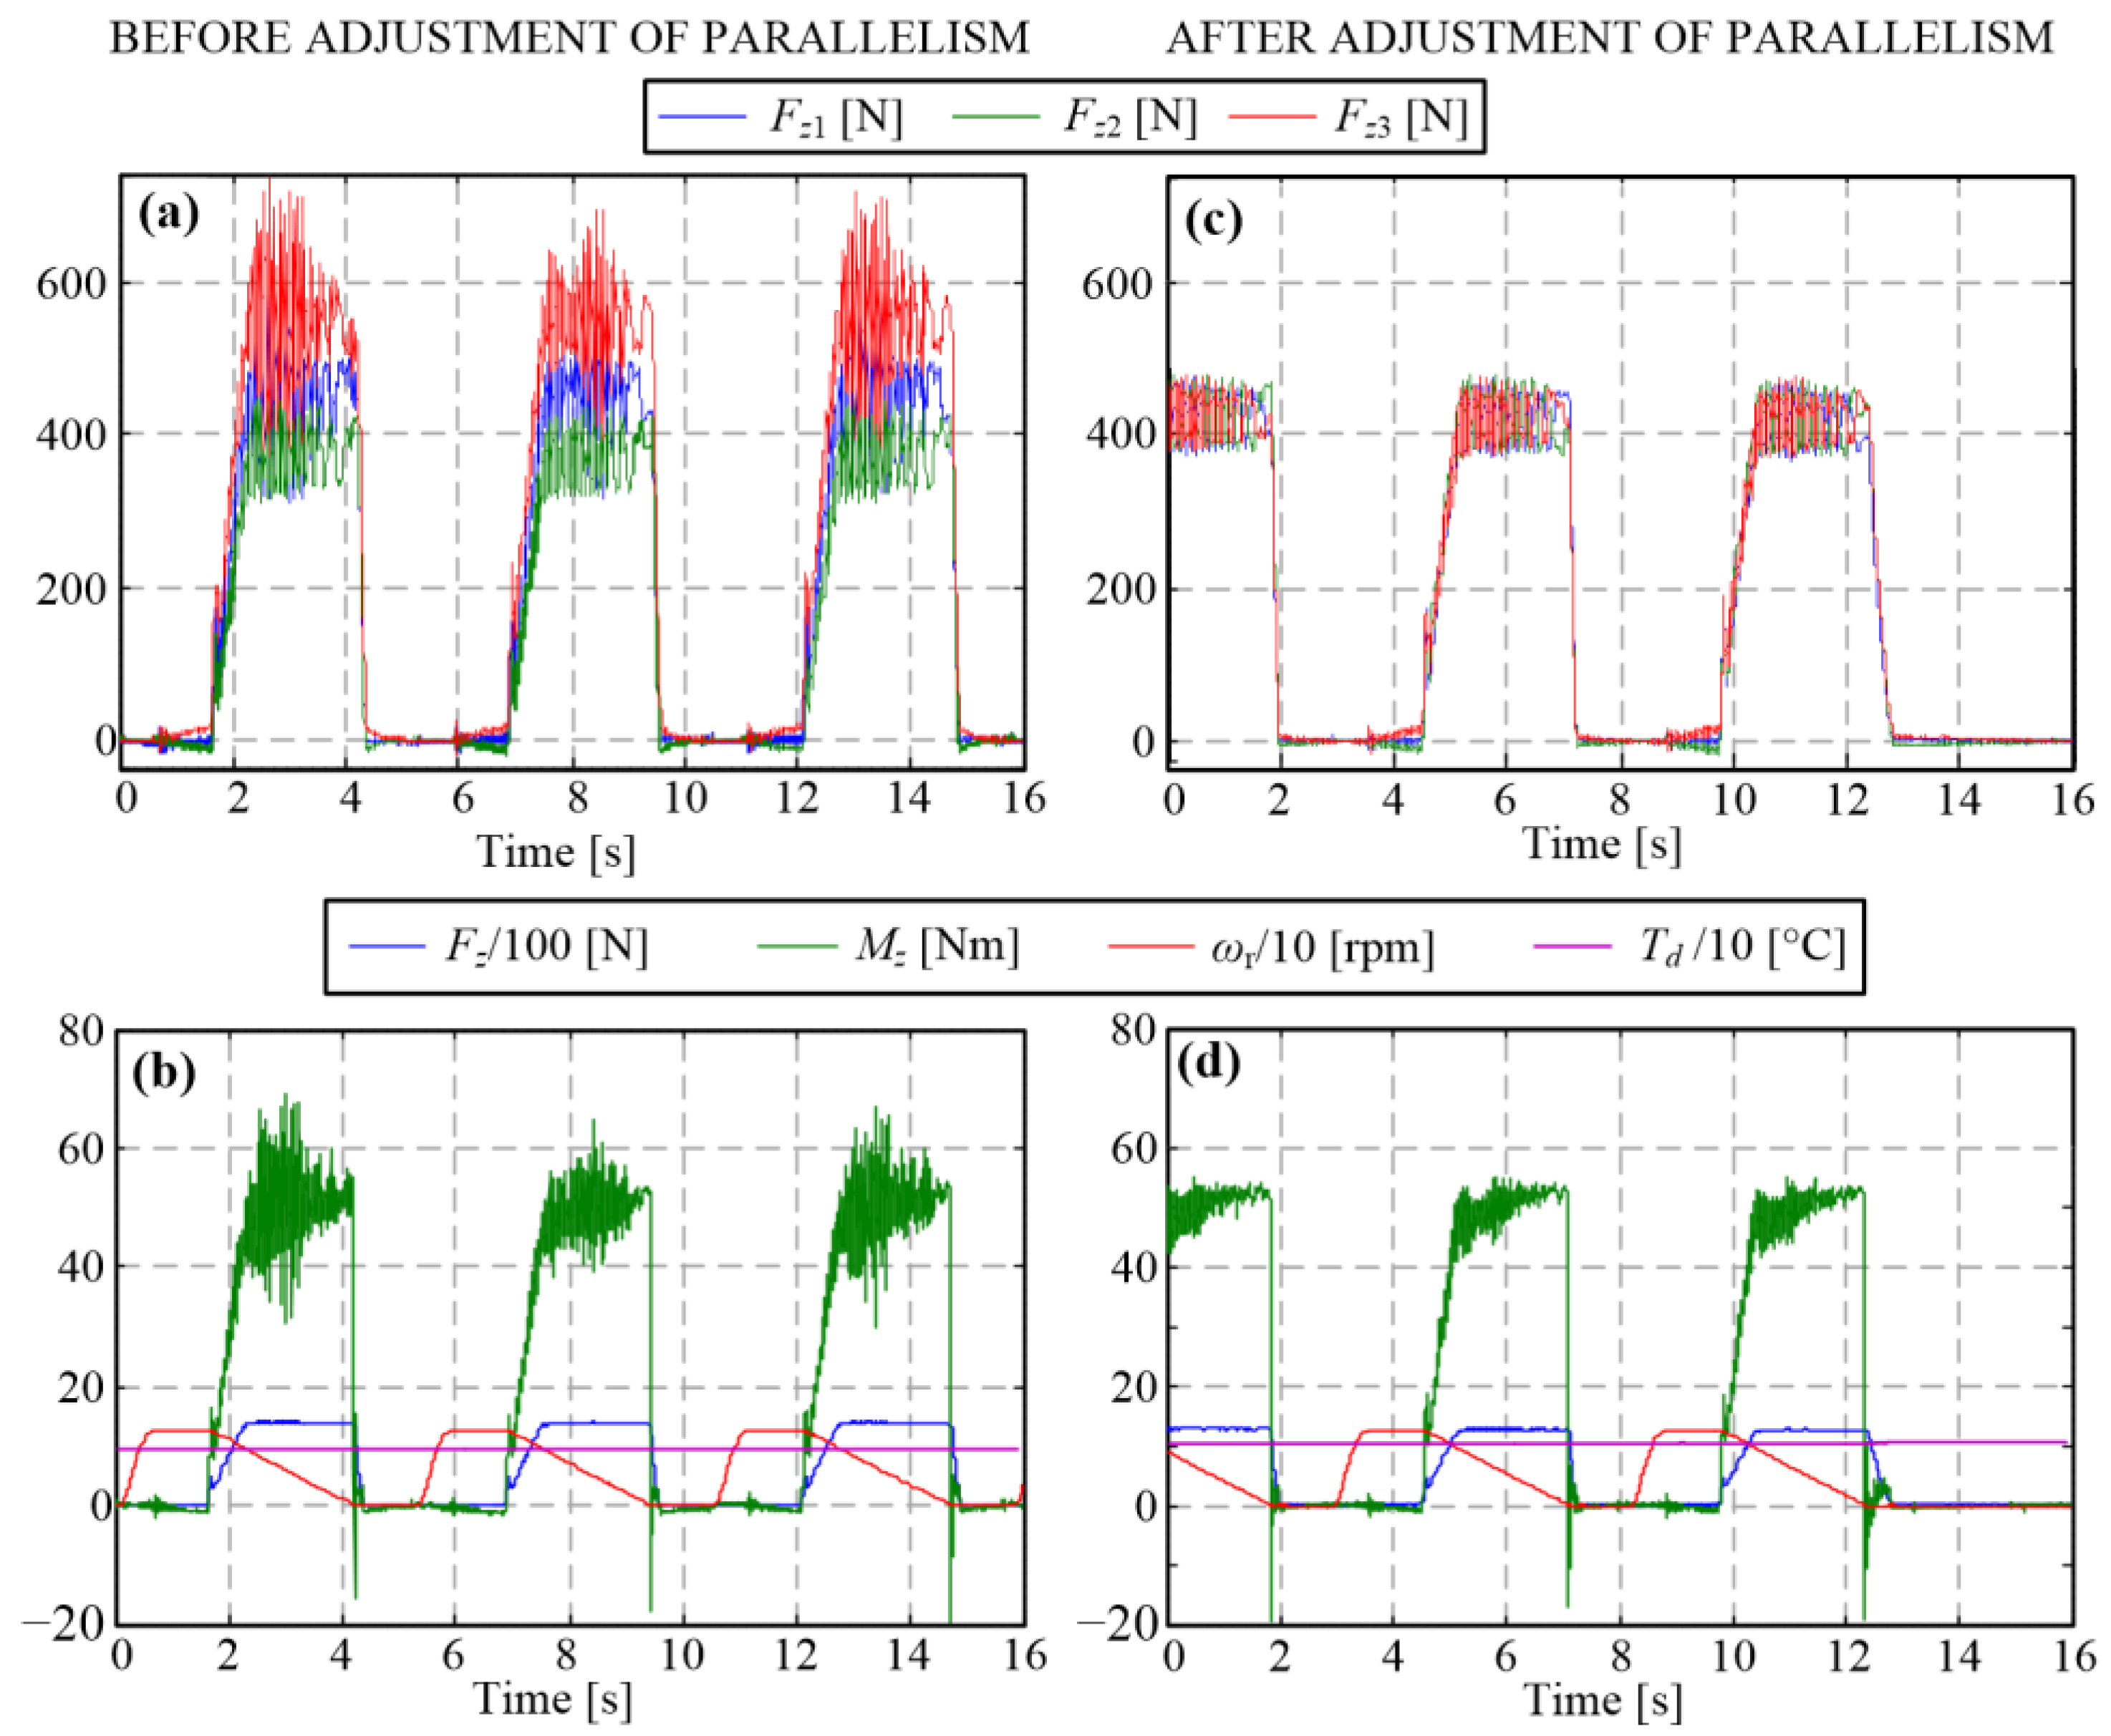
After assembling the redesigned and initially adjusted tribometer, a noticeable difference in the measured individual normal forces around the circumference was observed (Figure 9a). Furthermore, a noticeable shudder for the medium values of the initial slip speed and the torque level of 50 Nm (a half of clutch nominal torque) occurred for the shudder-sensitive material (Figure 9b). Therefore, the final, third step of the parallelism adjustment was conducted with the goal of equalizing the measured individual normal forces (Figure 9c) by adding additional aluminum sheets at the leaf spring point corresponding to minimum normal force. This resulted in diminishing shudder, as evidenced in Figure 9d and by audible inspection.
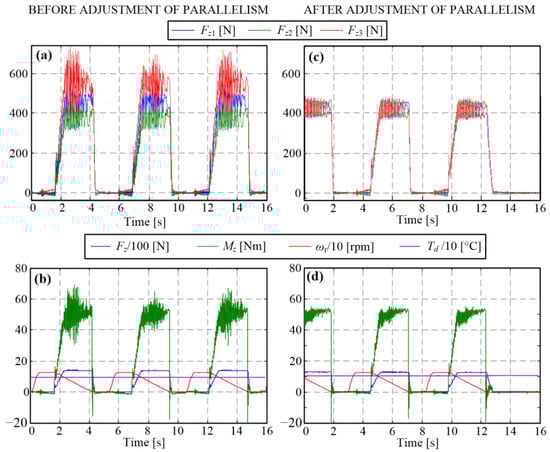
Figure 9.
Time responses before (a,b) and after adjustments of the rotary table-to-pressure plate parallelism (c,d).
4.2. Increase in Stiffness of Cooling Fluid Pipelines
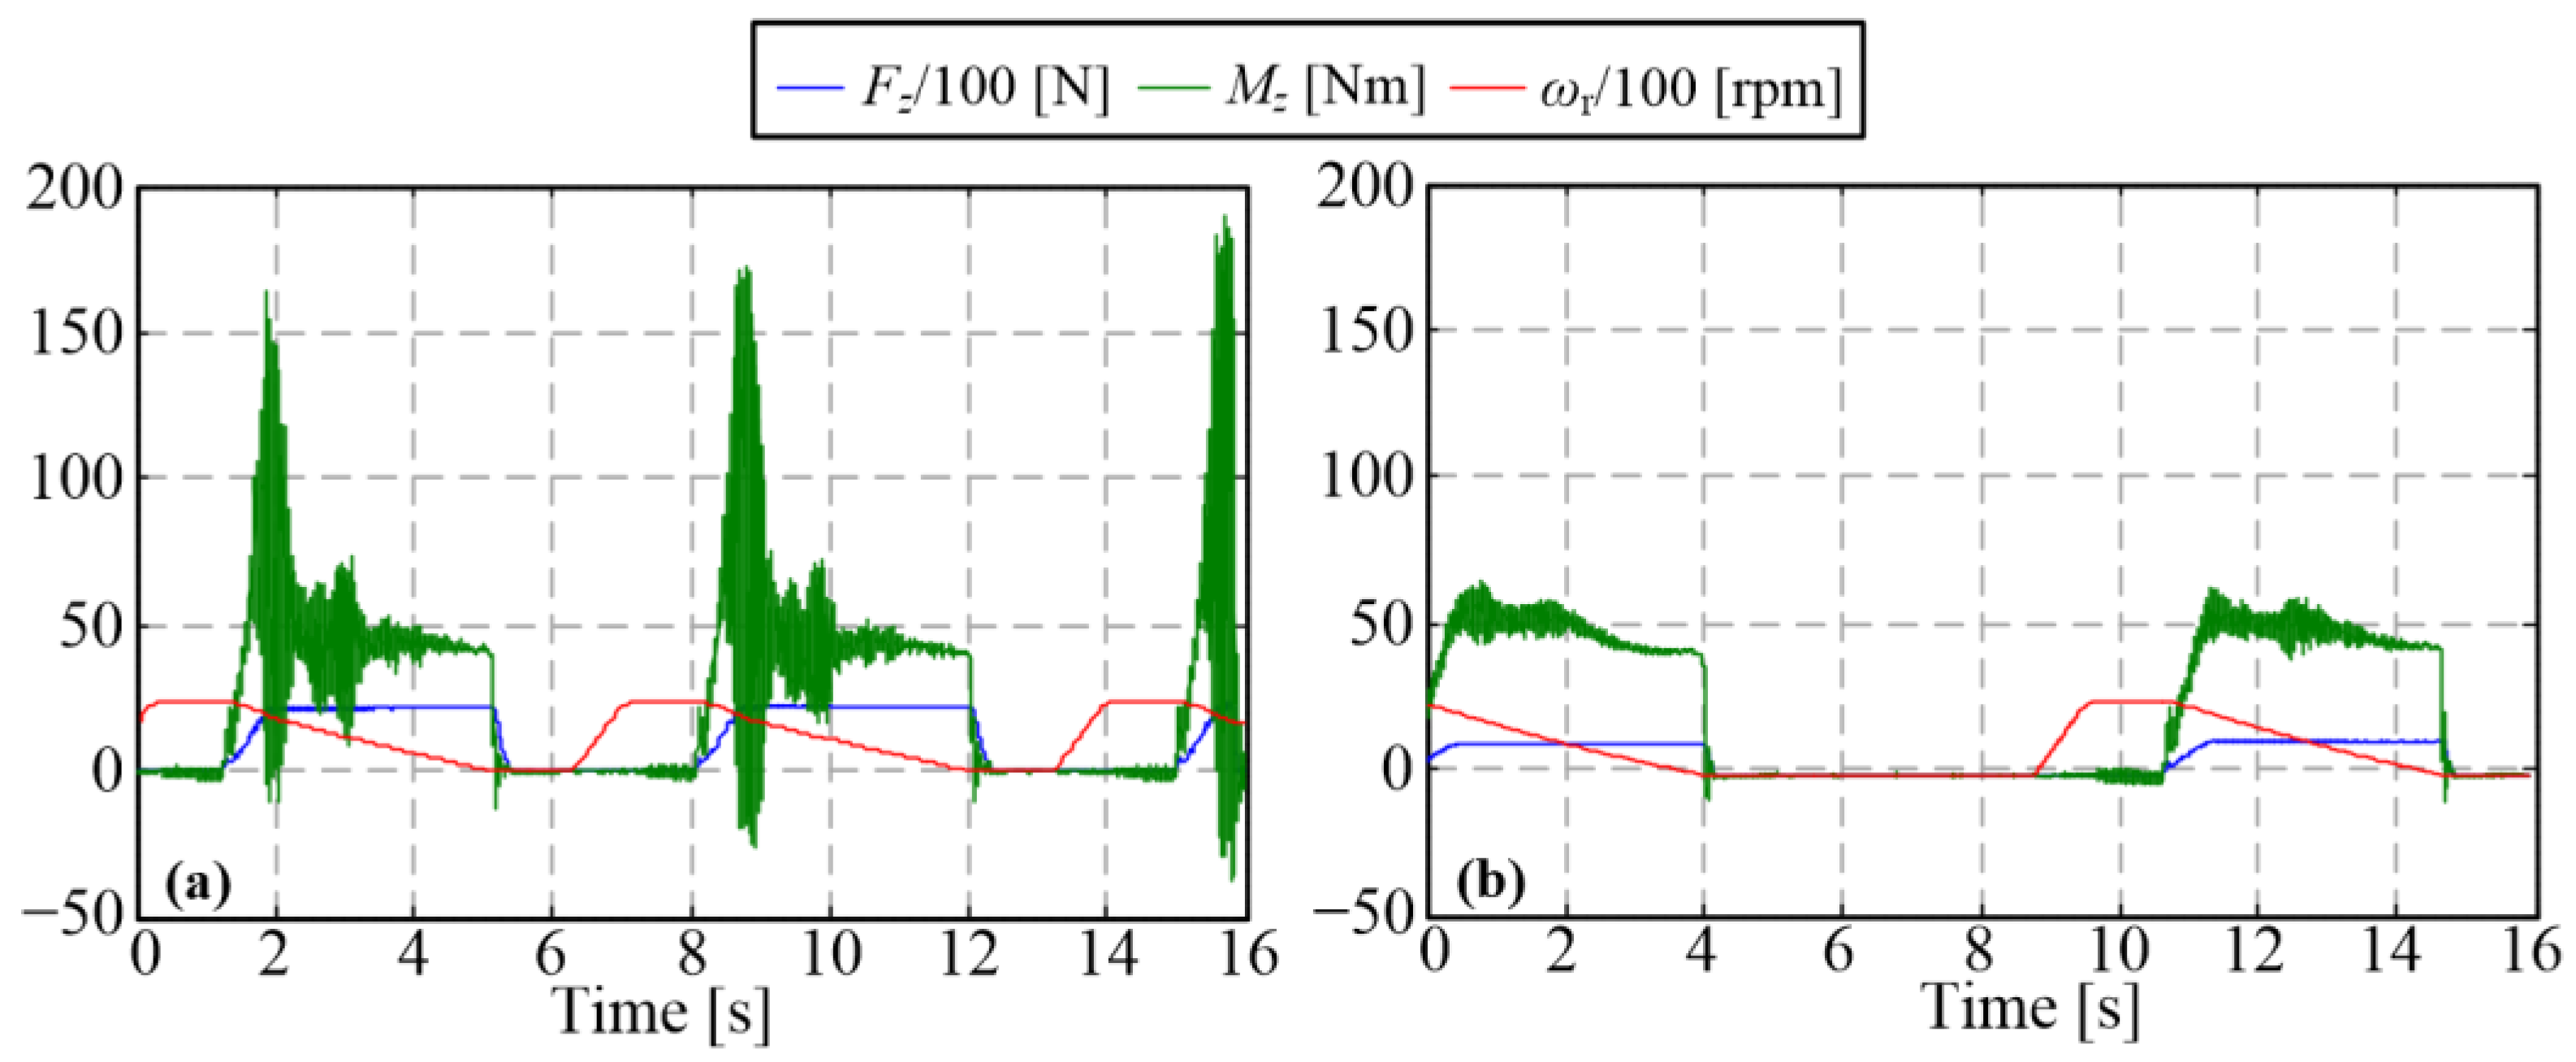
For higher initial slip speed and the same torque level of 50 Nm, shudder vibrations still occurred frequently and with substantial amplitudes (Figure 10a). It was noticed that vibrations were typically diminishing audibly in the cases when the target temperature would be reached and, thus, the cooling activated (by switching the valve to enable the coolant flow through the cooling disc, Table 1). It was reasoned that the increase in cooling fluid pressure following the valve opening made the cooling pipes stiffer, which resulted in the overall higher shudder resistance. To permanently increase the stiffness of pipelines and, thus, suppress their vibration and mitigate shudder, a plate was added to connect the intake and outtake pipelines one to the other (see Figure 8c). This simple intervention significantly suppressed the shudder vibrations, as evidenced by the comparative responses in Figure 10.
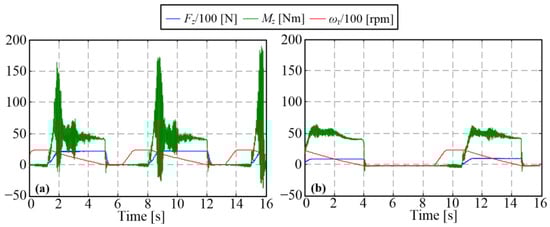
Figure 10.
Time responses before (a) and after (b) the increase in stiffness of the cooling fluid pipelines.
4.3. Reduction in Leaf Spring Stiffness
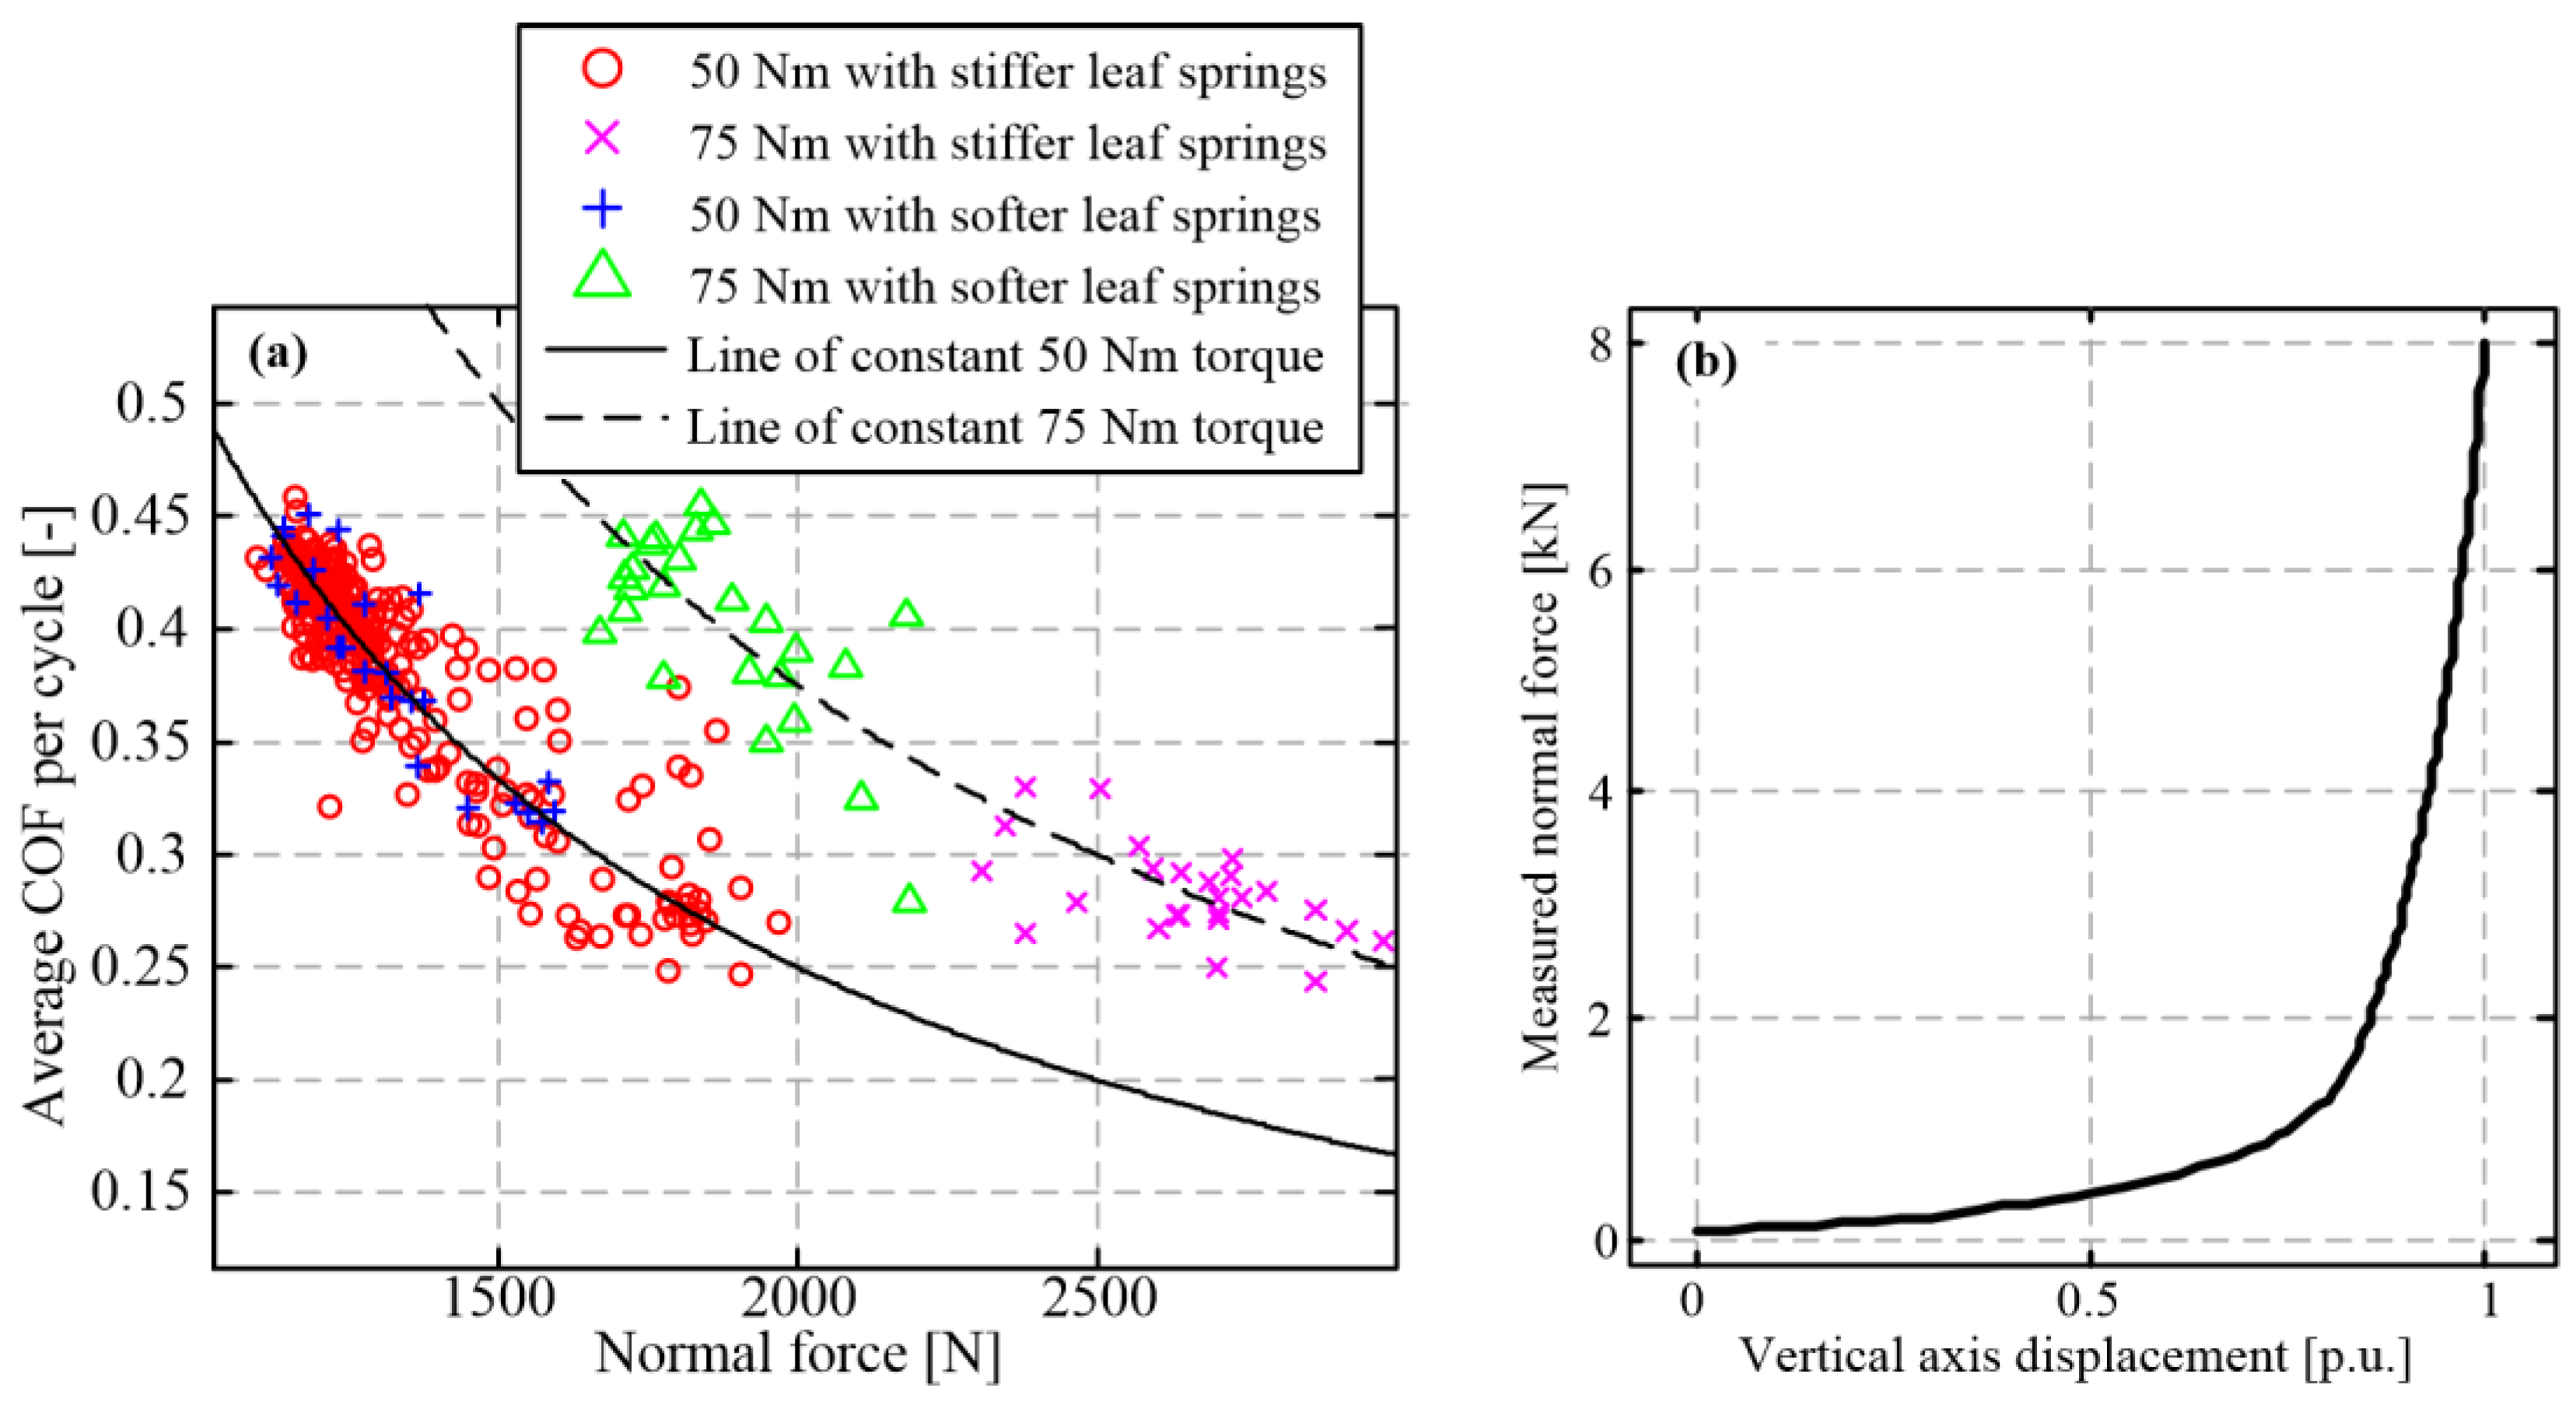
For high levels of torque (closer to the nominal value of 100 Nm) and high initial slip speed (2800 rpm), the shudder effect still occurred sporadically. It was observed that in addition to shudder occurrence, a significant (approx. 30%) decrease in the closing cycle-average coefficient of friction (COF) was observed at the high torque/normal force levels when compared to the medium torque/normal force levels (75 Nm vs. 50 Nm; cf. magenta crosses and red circles in Figure 11a).
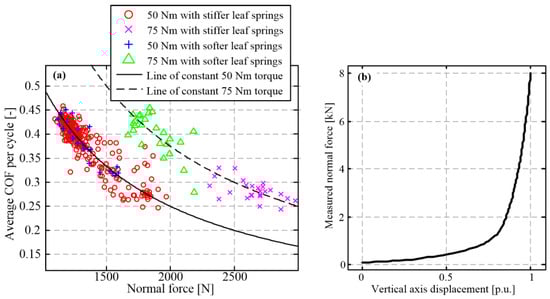
Figure 11.
Closing cycle-average COF vs. normal force for two torque levels, initial slip speed of 2800 rpm and two leaf spring stiffness values (a), and friction plate wave spring stress–strain characteristic (b).
The results in Figure 11a suggest that the COF drop occurs in the region of normal forces higher than 2000 N, which correlates with the region of high stiffness of the friction plate wave spring (Figure 11b, [17]), as the main source of the overall clutch axial compliance. The role of the wave spring is to increase the uniformity of the friction contact pressure distribution during the clutch engagement until the clutch is locked under the high normal forces [21]. Thus, it has been reasoned that in the high normal force region, the non-uniformity of the surface pressure occurs and affects the friction plate–pressure plate parallelism. Unlike the non-uniformity in the axial position of the rotary table over the circumference, which was successfully suppressed by the interventions described in Section 4.1, in this case, it apparently occurred in radial direction due to bending deformation of the cooling disc and the upper/lower bell under high normal load. Consequently, the friction contact surface became greatly reduced, thus, resulting in the COF drop under significantly higher local pressure and expectedly unrealistic wear conditions.
It can be expected that the reduction in the leaf spring stiffness could compensate for the loss of wave spring compliance at the high normal force levels and, thus, improve the COF stability. On the other hand, this measure would result in lowering the natural frequency of the cooling disc assembly, thus, counteracting the effect of improving the parallelism to shudder resistance to some extent. Moreover, the possibility of leaf spring stiffness reduction is limited by the material (leaf) stress limits. As a trade-off of the above requirements, the leaf stiffness was reduced by introducing thinner leaves while maintaining their number. This approach was conceived to be better than only reducing the number of leaves, because it avoids reducing the level of vibration damping produced by friction between the leaves. Figure 11a shows that the reduction in leaf spring stiffness results in regular (unreduced) COF values in both high- and low-normal force regions (cf. green triangles and blue pluses).
After the full set of mechanical adjustment measures was implemented, the stable operation of the tribometer with a largely suppressed shudder was observed for high torque/power conditions, as demonstrated by the response shown in Figure 12. It is worth mentioning that the results presented in Figure 12 relate to a relatively small number of closing cycles and that a noticeable level of shudder vibrations is still present. This may indicate that the uniformity of friction contact is still not fully established. Furthermore, the remaining contact pressure and temperature non-uniformity may accumulate over many closing cycles and consequently affect the wear process consistency. Therefore, additional measures related to control routines were taken, as elaborated in the next section.
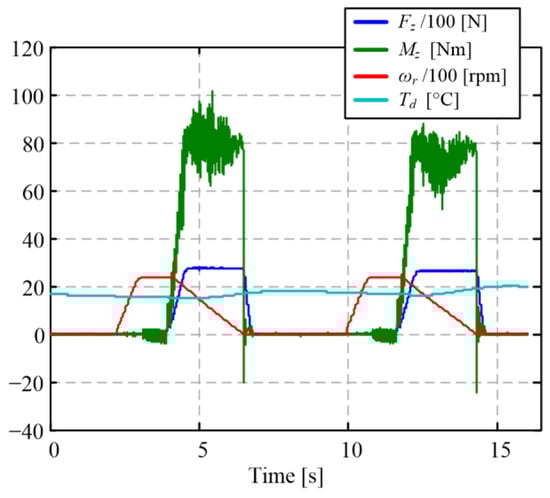
Figure 12.
Illustration of shudder-suppressed operation in the worst case of high toque/power conditions after implementing all mechanical adjustment measures.
5. Control System Adjustments
The control routine adjustments include implementation of the following measures: (i) locking the clutch during the cooling delay interval, (ii) realizing a non-zero lower cooling delay limit, and (iii) realizing an upper normal force demand limit. These measures have been motivated by an experimental analysis of wear and COF stability under the high torque/power conditions and long-term tests associated with wear characterization.
5.1. Initial Wear Characterization Experiments at High Torque/Power Level
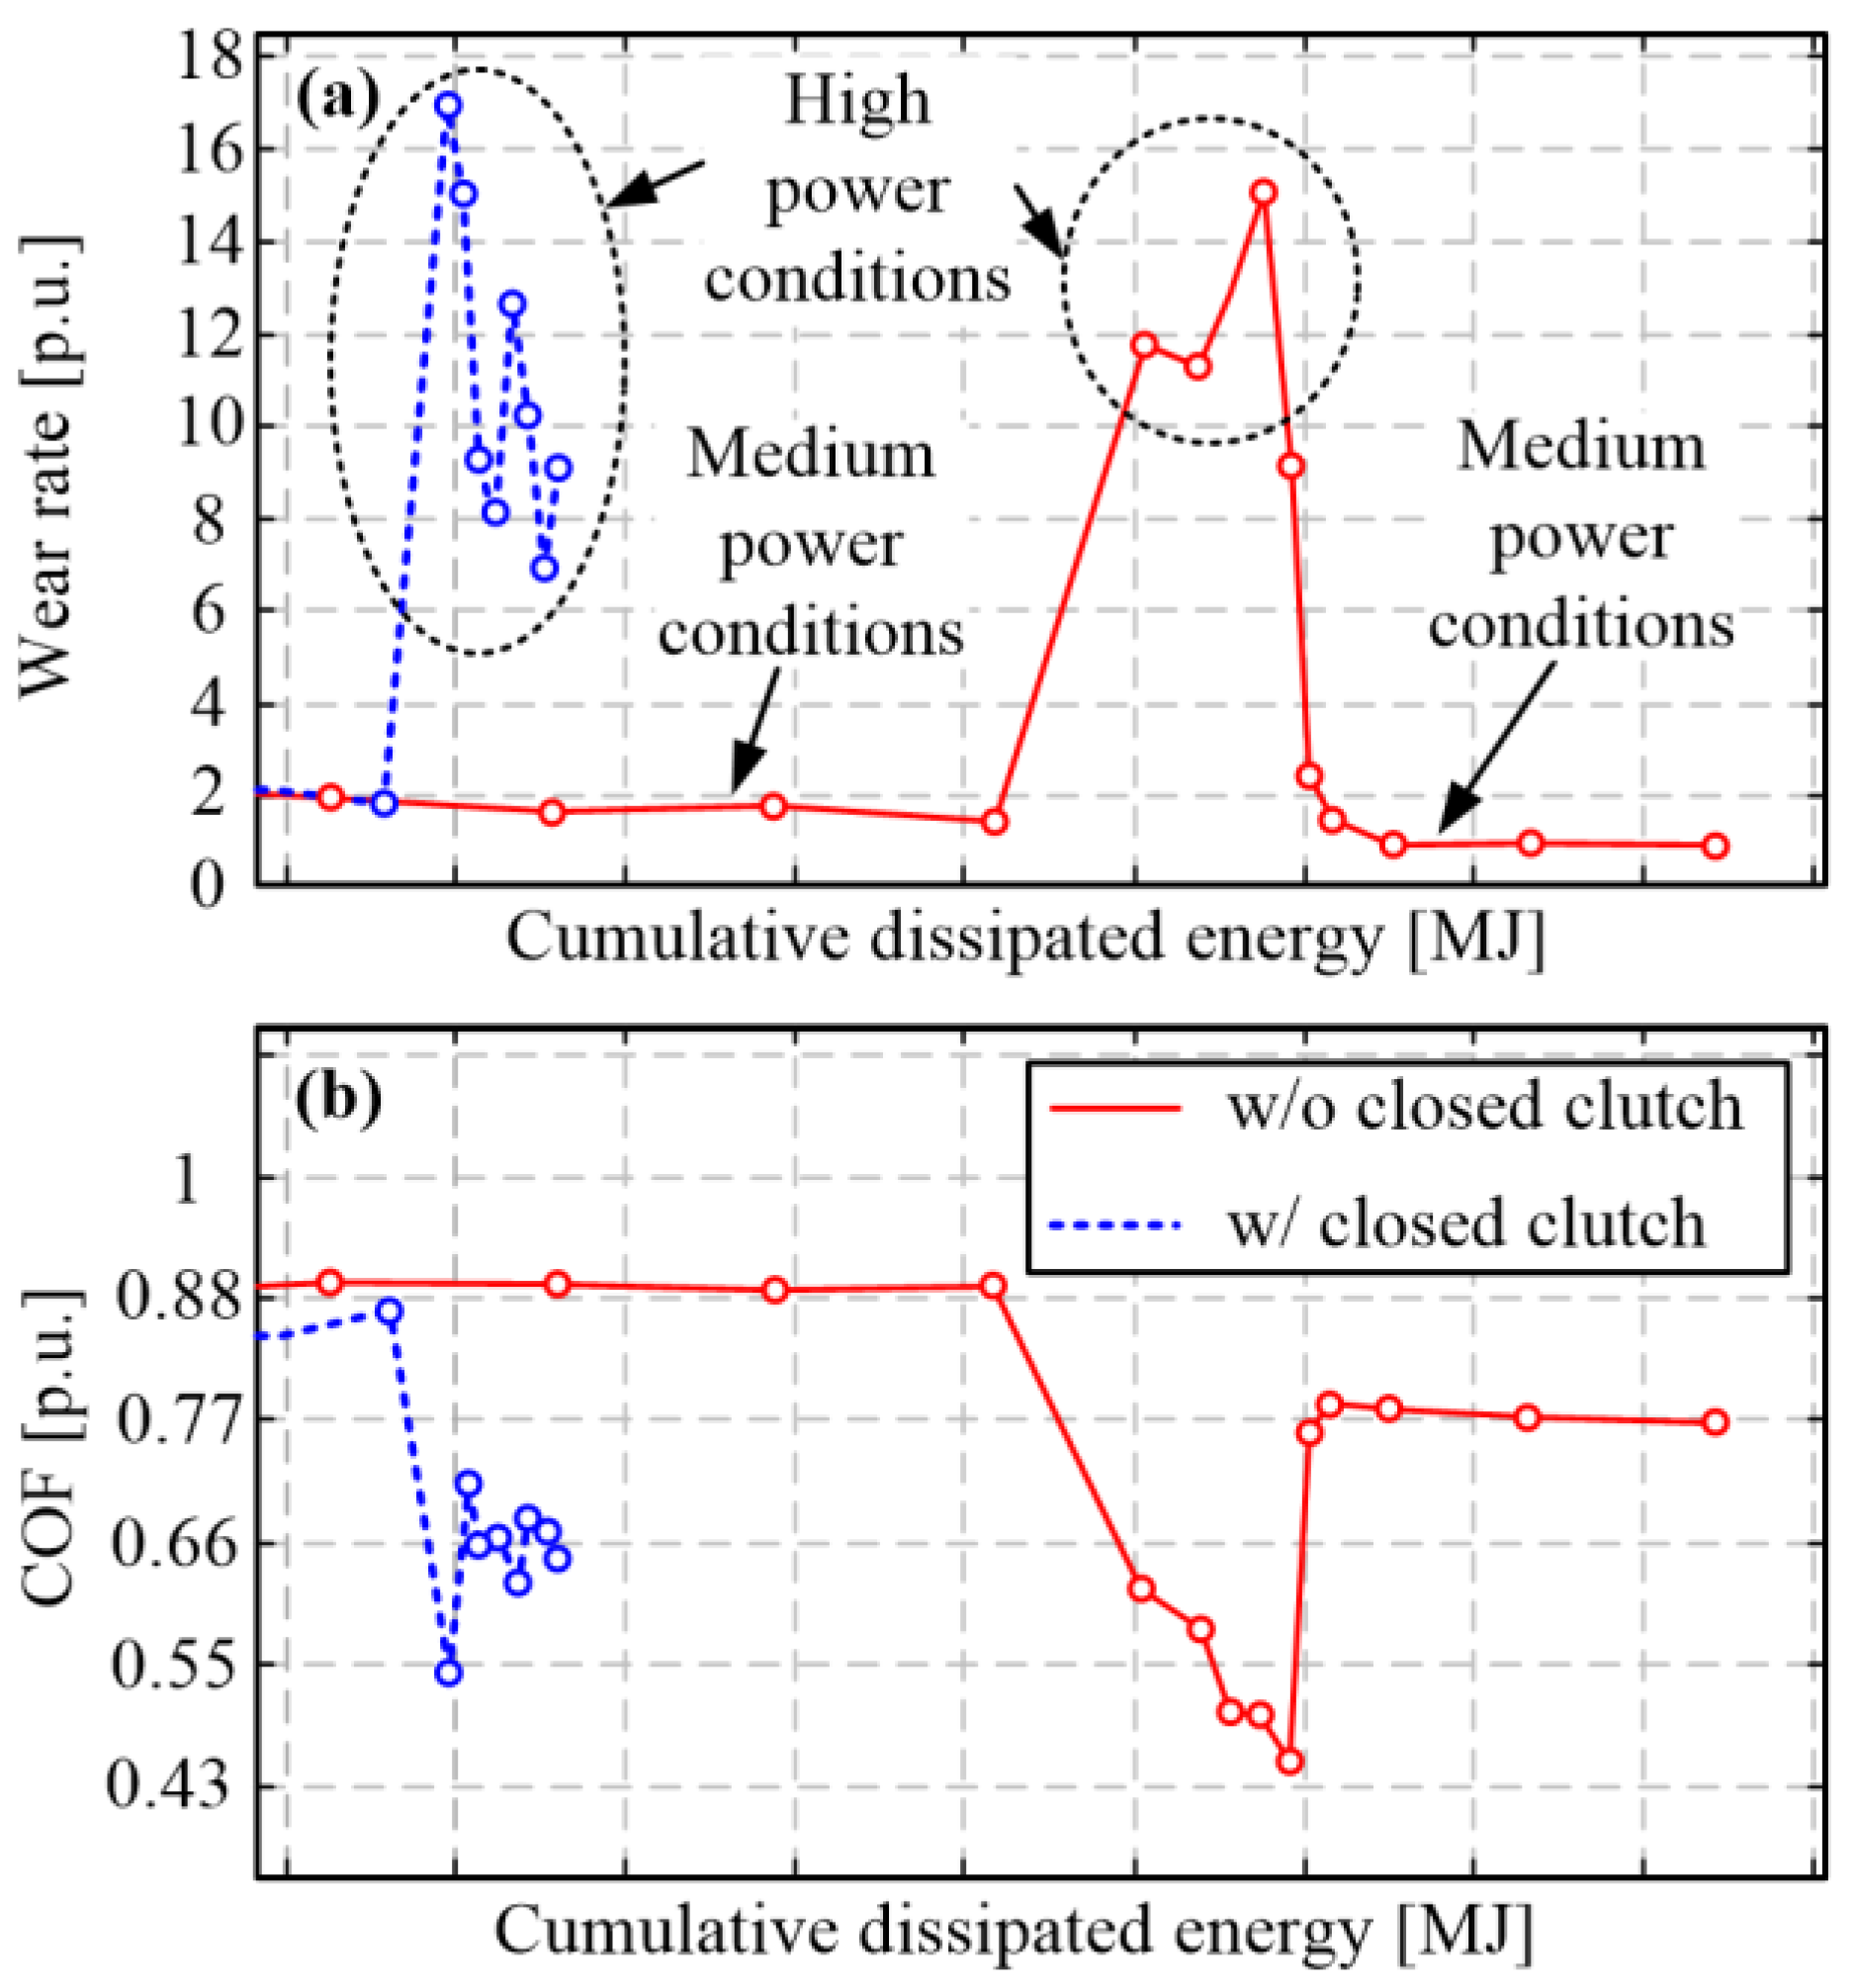
After confirming the stable tribometer operation for the full operating range as the consequence of mechanical adjustments (Section 4), the next step was to record the initial wear characterization experiments at high torque/power levels to verify both the long-term stability of machine operation and the stability of the wear process. The wear characterization experiments were initially conducted for the mid torque/high speed operating parameter set (50 Nm, 2800 rpm, resulting in 0.05 to 0.07 N/mm2 of surface pressure), which was regularly used in the run-in phase of wear tests in [17]. After the expected stabilized wear rate (and COF) value was confirmed (see the initial part of the response given in red in Figure 13), the characterization was performed at the higher torque level of 75 Nm (corresponding to the contact pressure range [0.075, 0.105] N/mm2). The observed wear rate increased by a factor of approximately 7 (mid part of response given in red in Figure 13). At the same time, the (average) COF significantly dropped. After the torque level was lowered back to the medium level, the wear rate dropped to the previously seen, expected value and the COF lifted to its regular values. The observed values of both wear rate and COF at the high torque level are deemed to be unrealistic for the given temperature level based on real clutch experience and test results. The effect is apparently connected with non-realistic contact conditions at high torque/power levels. The restoration of the regular values after switching back to the medium torque level indicates that the observed effect does not permanently change the friction material properties.
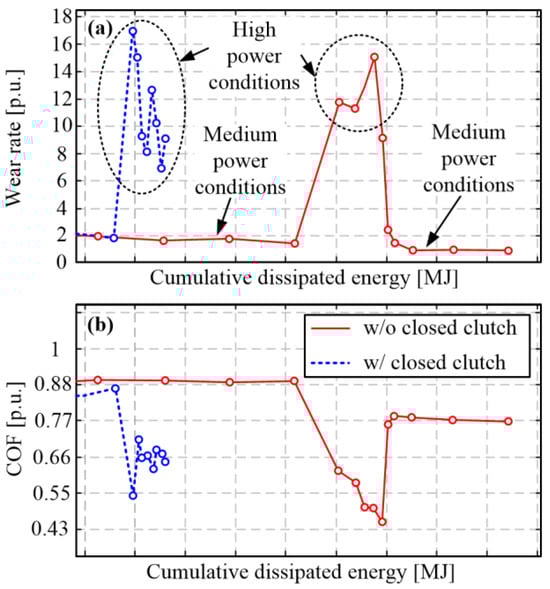
Figure 13.
Illustration of the fading-like effect on wear rate (a) and coefficient of friction (b) occurring during high-power wear characterization experiments (red plots) and its mitigation by keeping the clutch locked during cooling delay interval (blue plots).
The significant drop in COF and the corresponding substantial increase in wear rate typically occur during fading conditions, which are linked to high temperatures (300 °C in [22] or even above 450 °C according to [23], depending on friction material). The temperature level used in the characterization experiment in Figure 13 equals 0.7 Td,high, where Td,high denotes the maximum temperature expected during regular clutch exploitation and is used in [24] as a basis for test-result normalization. It is worth mentioning that the fading effect for the given friction material was detected at the temperature level of 1.8 Td,high [24]. Therefore, it was reasoned, based on the connection between COF and the leaf spring stiffness observed in Figure 11a, that the remaining friction plate–pressure plate non-parallelism under the rush conditions of numerous consecutive high-power closing cycles may result in the local high-pressure regions, i.e., local high temperatures and corresponding local fading-like effects, which are non-detectable by the corresponding measurement equipment. Under the circumstances of exhausted mechanical adjustment measures, the control routines were further adjusted in order to make the thermal conditions more uniform over the whole friction surface area, thus, avoiding the friction surfaces non-parallelism under severe dynamic conditions and the corresponding local fading-like effects (see next subsections).
5.2. Implementation of Clutch Locking during Cooling Delay Interval
The initial tribometer design was such that the vertical axis was lifted up after the active phase t2 [17], i.e., the clutch was kept open until the next closing cycle (i.e., during the cooling delay interval) to facilitate the pressure plate cooling (see response of normal load Fz in Figure 2). However, the real dry clutches, e.g., those of manual and automated manual transmissions, are normally closed, i.e., they stay closed when not being engaged. It was anticipated that the temperature distribution and the corresponding thermal expansion of friction material would be more equally distributed for a normally closed clutch. Thus, the control routines have been modified to keep the clutch closed (locked) during the clutch cooling interval and open it only immediately before a new closing cycle starts, i.e., before the slip speed is to be lifted to its initial value.
The comparative responses shown in Figure 13 indicate that the peak wear rate values are somewhat lower/narrower and COF higher under the high torque/power conditions when the control routines are adjusted for keeping the clutch locked during the cooling interval. It has been, thus, concluded that the control adjustment has positive influence and represents a part of the overall tribometer redesign. However, the obtained results are still non-consistent, thus, calling for the additional control adjustment measures described in the Section 5.3 and Section 5.4.
5.3. Implementation of Non-Zero Lower Cooling Delay Limit
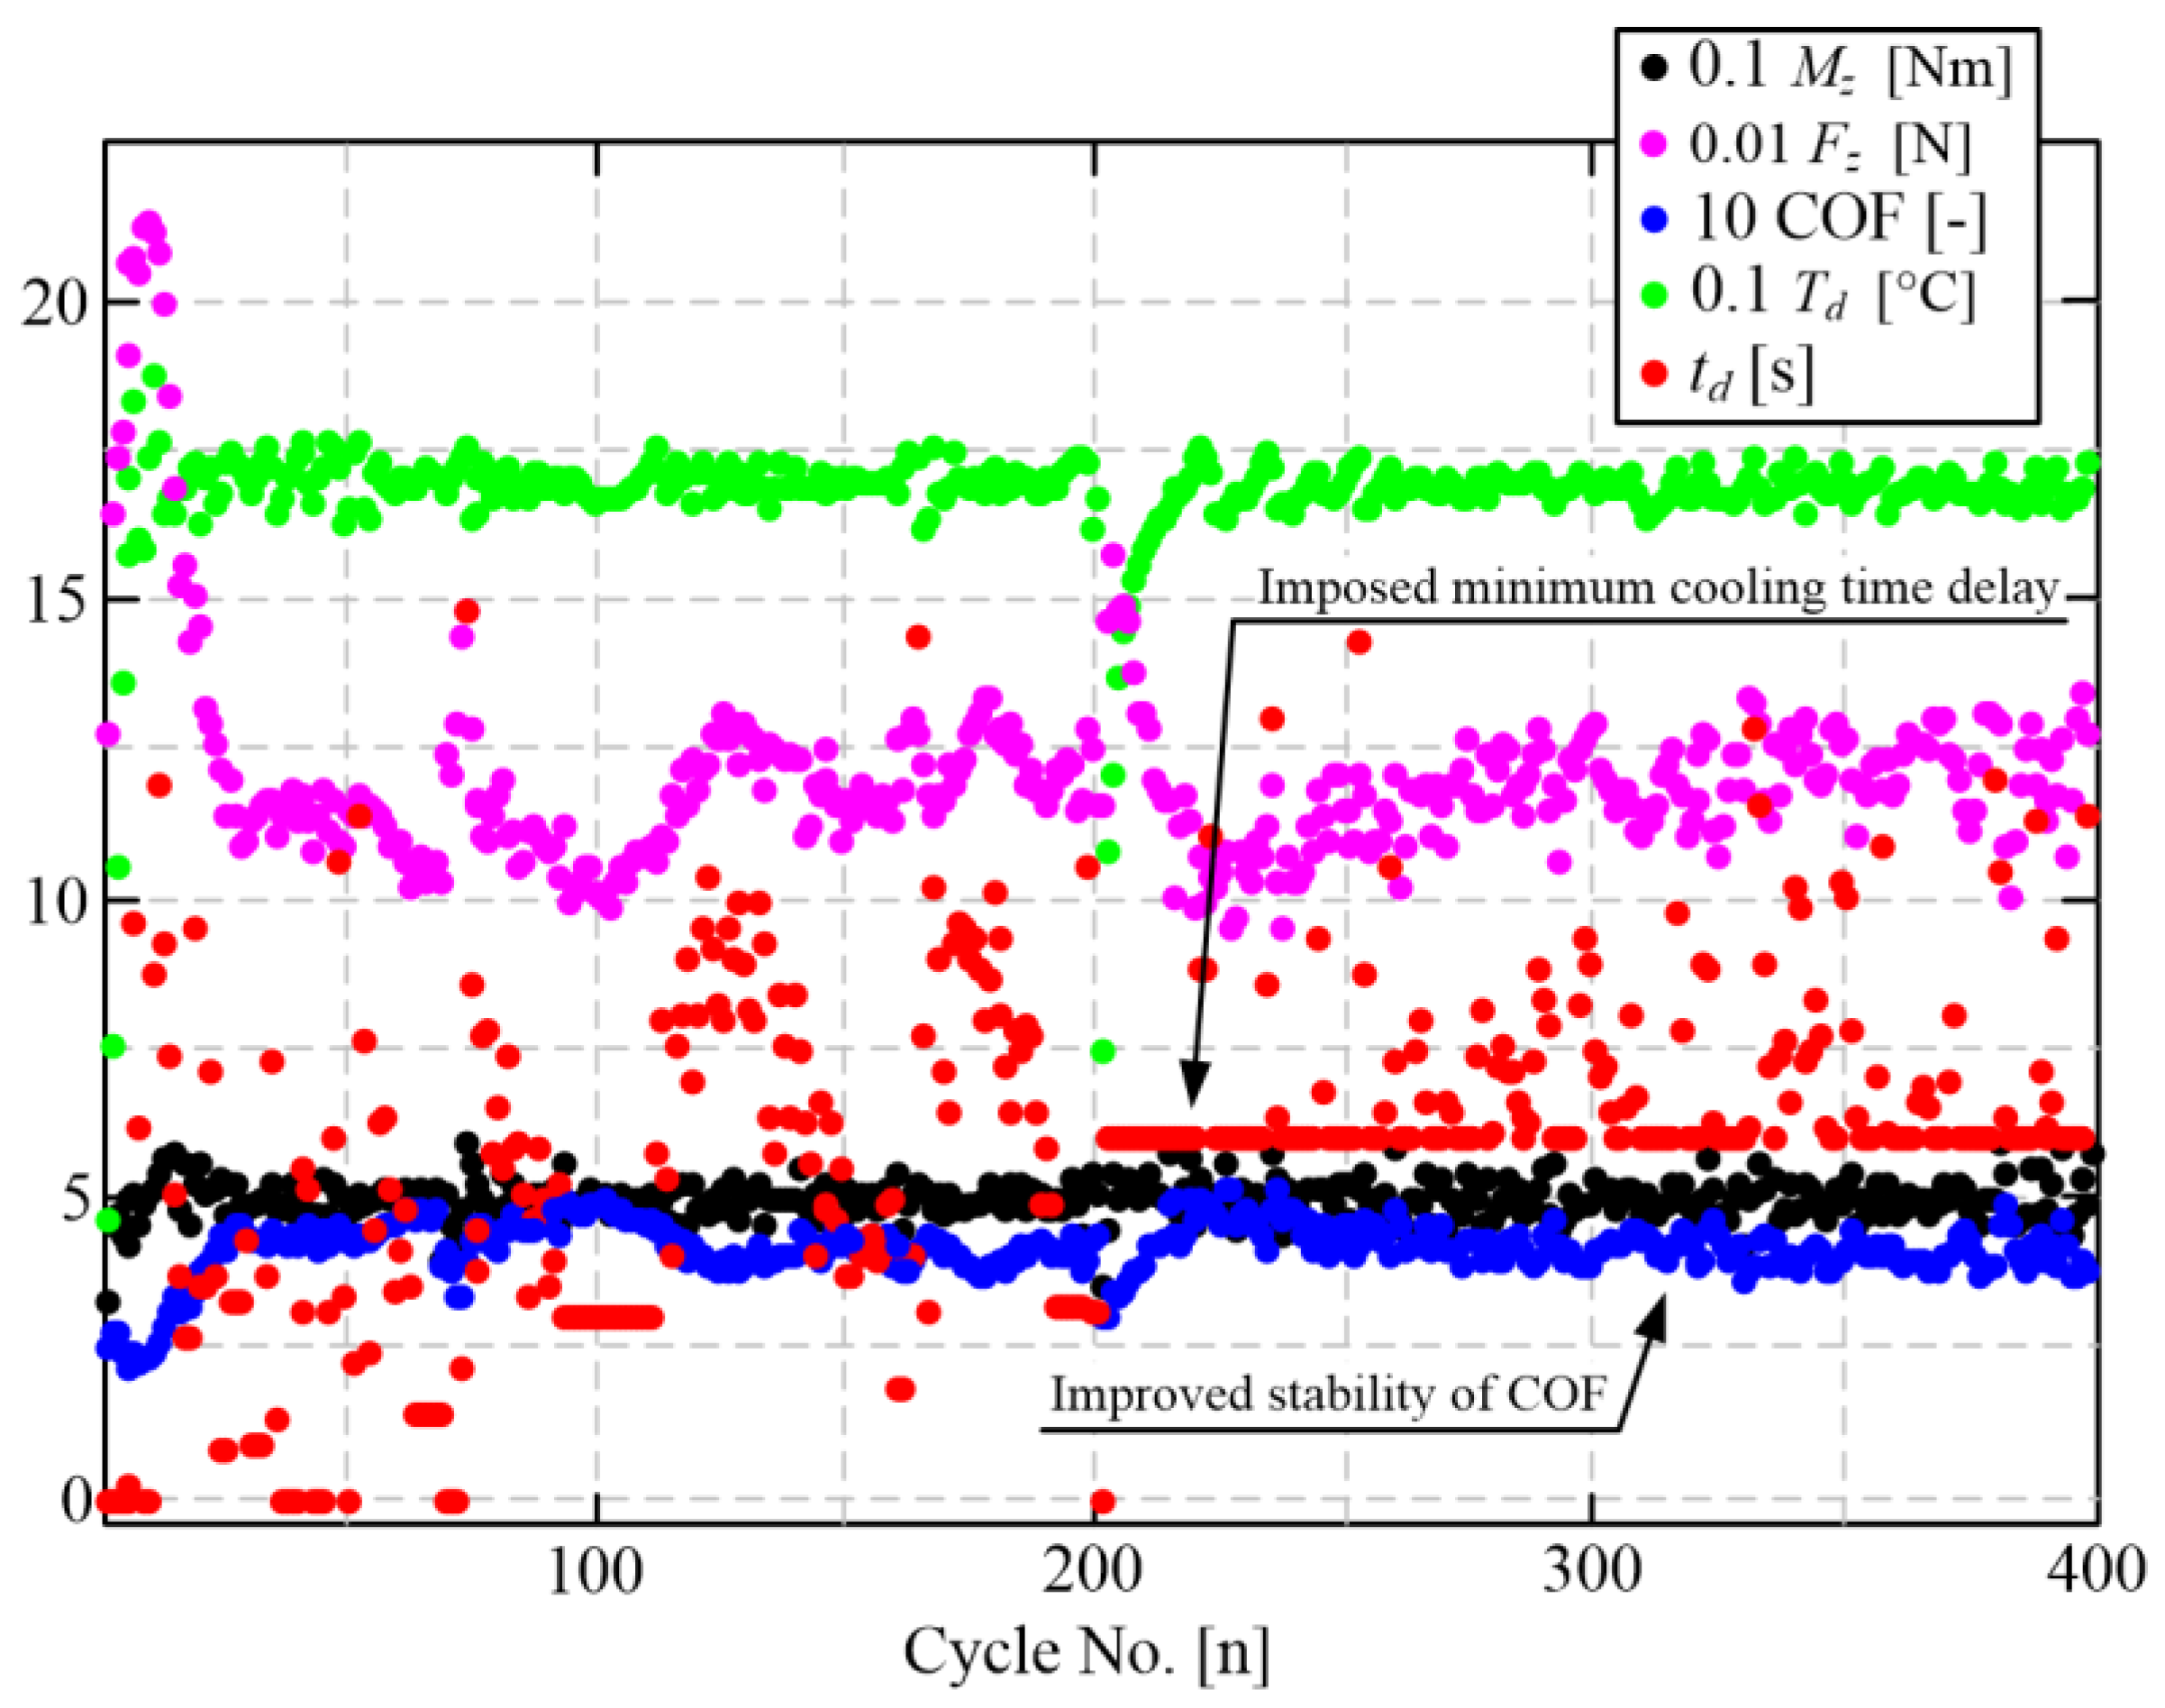
The cooling delay td is used as the main commanded signal of the temperature feedback controller (see Table 1). When the average temperature within a clutch closing cycle is lower than the target level, the temperature controller tends to set the cooling delay to zero to speed up the heating process and lower the temperature control error.
It has been noticed that the COF drops (Figure 14, blue dots) correlate with instances in which the cooling delay is set to zero (Figure 14, red dots). It is hypothesized that running the high-power closing cycles without any cooling delay (typically during the long warm up periods) results in non-uniform temperature distribution in the friction surface, i.e., the appearance of hot spots that can cause local fading-like effects. The temperature distribution becomes more uniform once the cooling delay is applied upon achieving the target temperature, thus, resulting in the restoration of COF (see the response sections immediately after n = 0 and n = 200 in Figure 14).
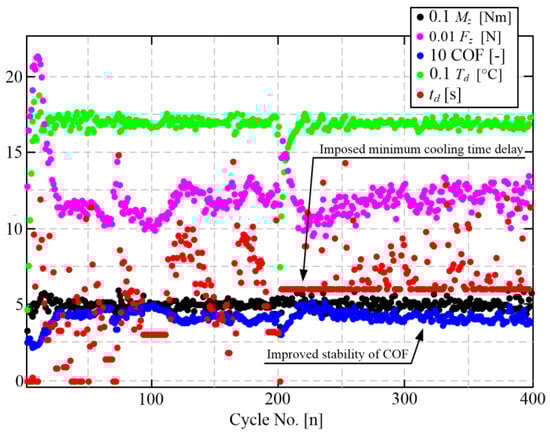
Figure 14.
Illustration of the effect of imposing a non-zero minimum cooling delay for n ≥ 200 on stability of COF (averaged over the active closing phase t2).
Based on the above hypothesis, the control routine was adjusted to impose a minimum cooling delay larger than zero, where the value of the lower cooling delay limit is set dependent on the operating point parameters (higher value for higher power; [24]). The second part of the response shown in Figure 14 (n ≥ 200), which corresponds to the application of a lower cooling delay of 7 s, points to a significantly more stable (stiffer) COF response compared to that of the original, unconstrained case (n < 200). It is worth mentioning that applying the non-zero minimum cooling delay prolongs the total closing cycle duration and, thus, the wear test duration. However, as the effect is predominantly connected with the initial heating (warm-up) phase, the overall duration of wear tests was found to be increased by only 5 to 10% compared to the original tests from [17].
5.4. Implementation of Upper Normal Force Demand Limit
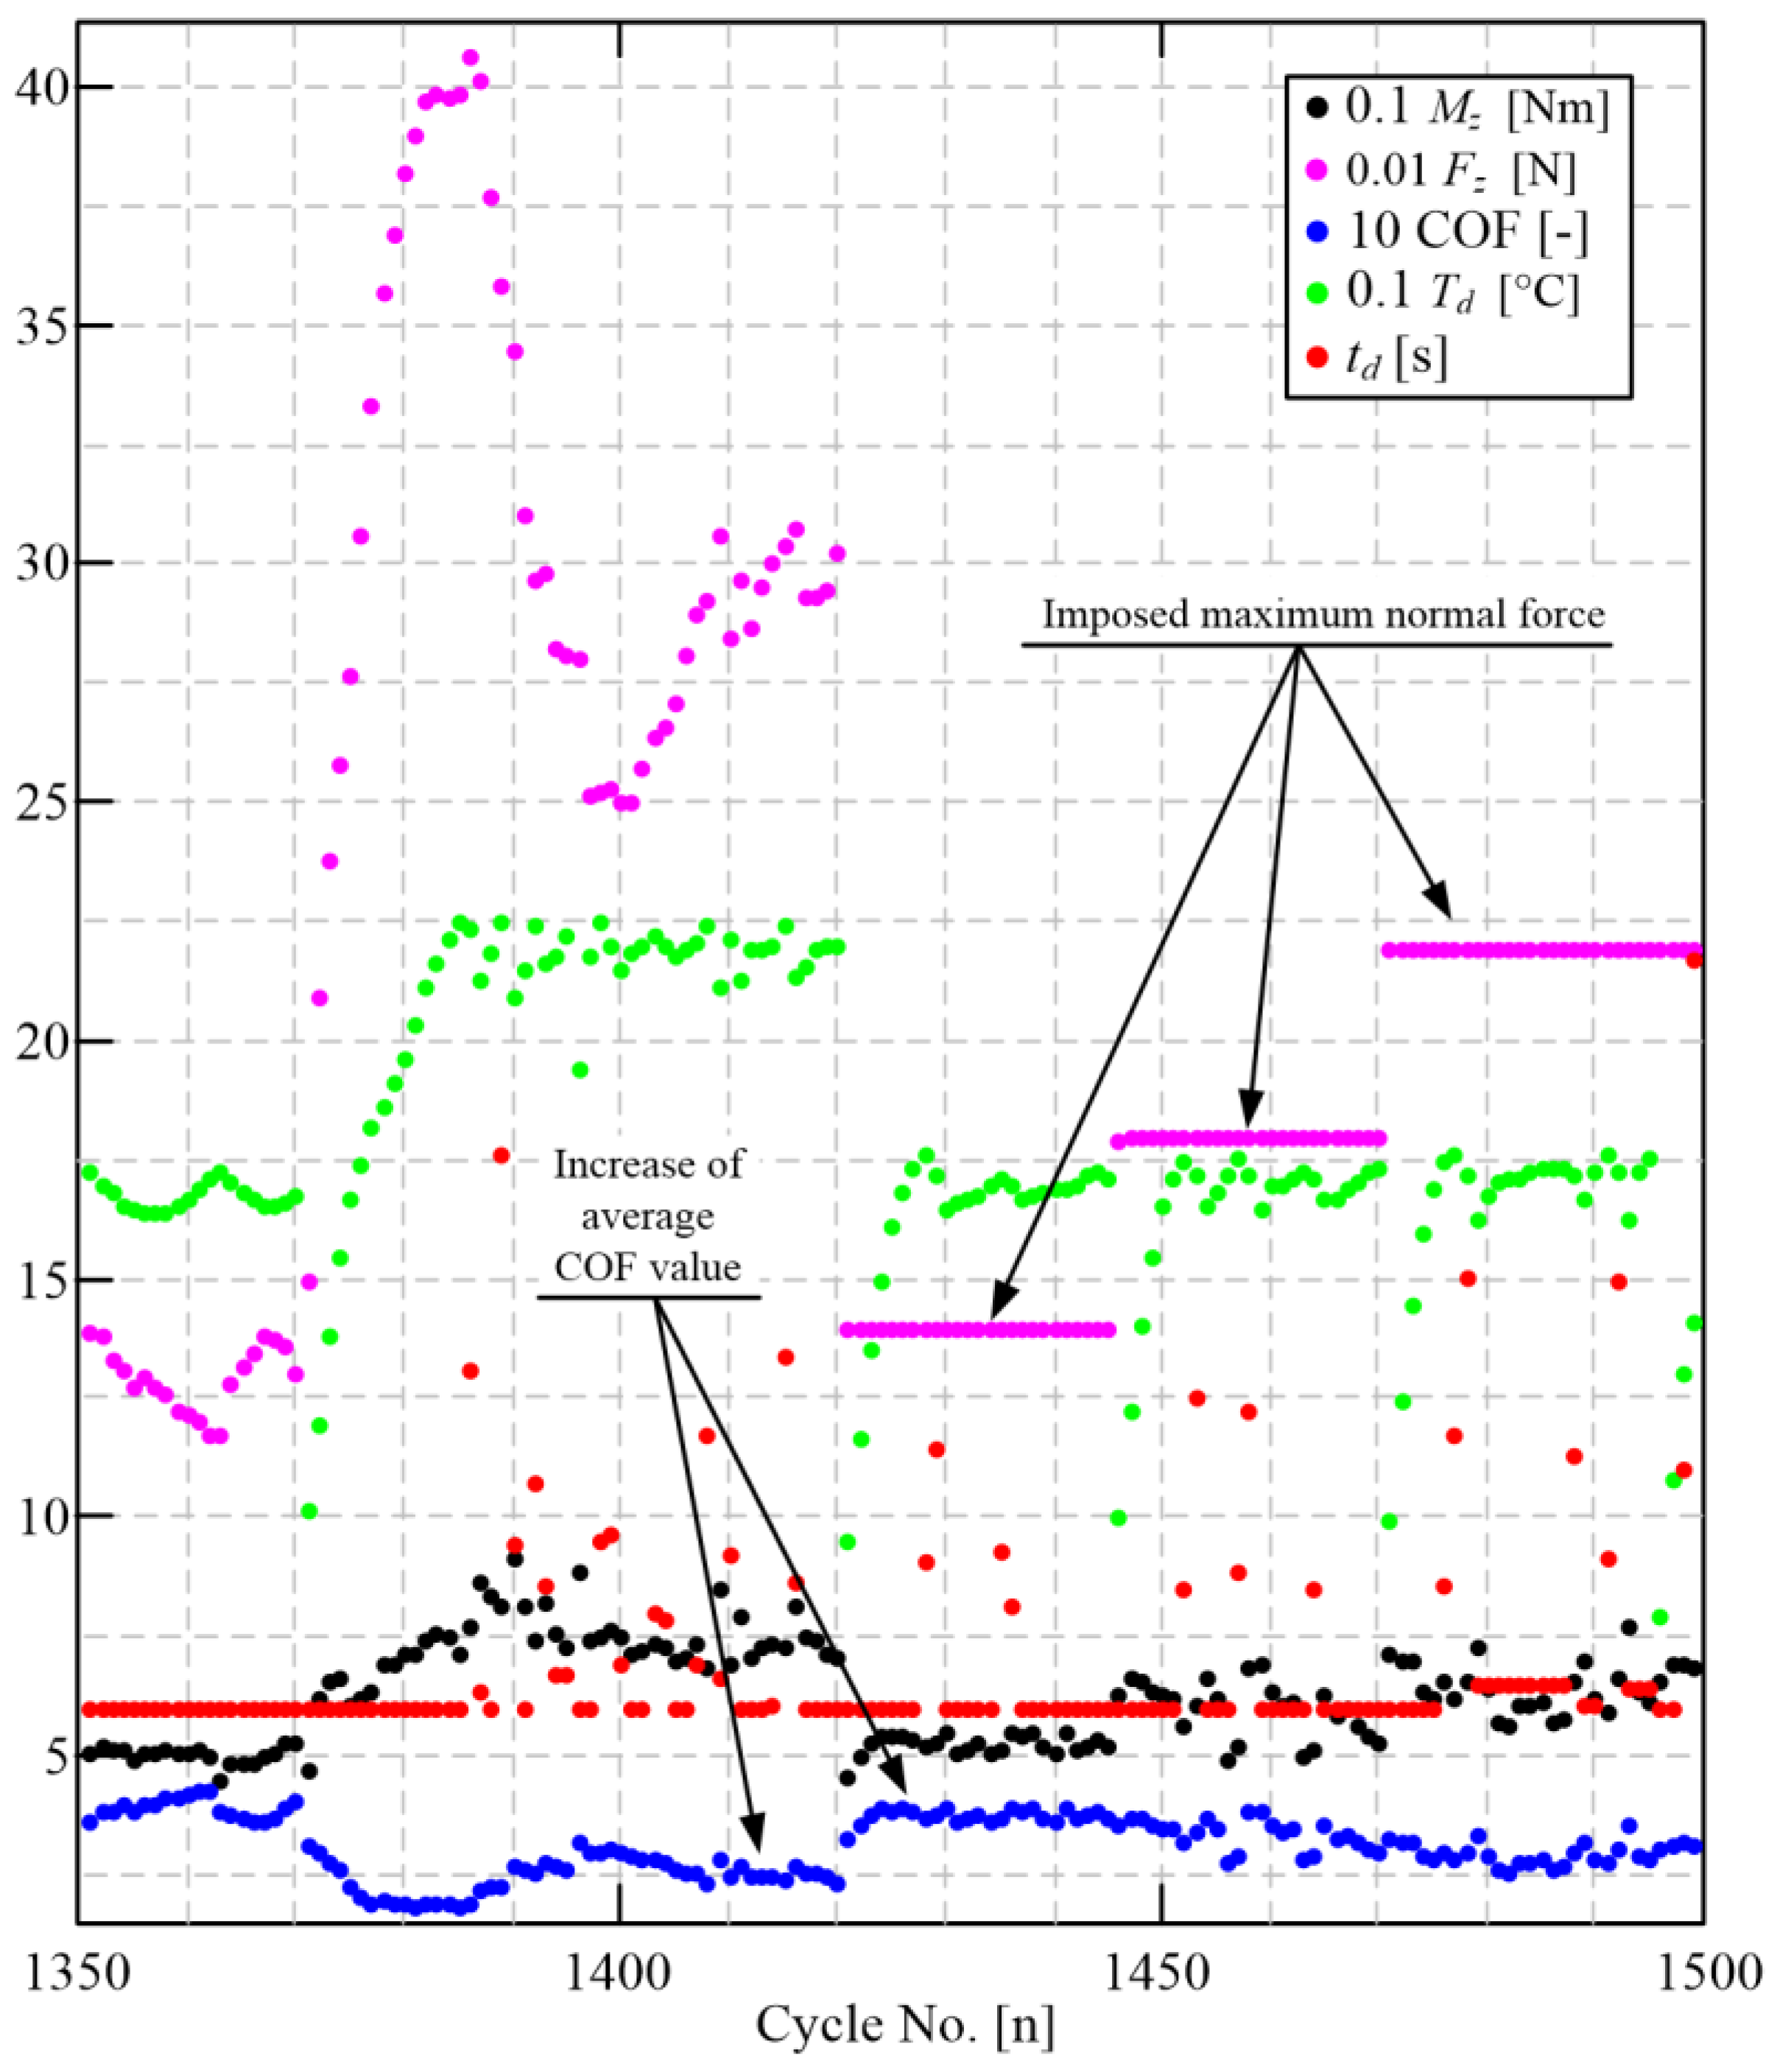
The torque feedback controller manipulates the normal force to keep the torque at the target level. During the transient of torque Mz (see the interval 1700 < n < 1900 in Figure 15), the commanded normal force Fz can reach very high values (4000 N in Figure 15, i.e., 0.17 N/mm2). Based on the mechanisms described in Section 5.1, this causes a fading-like drop in COF (blue dots in Figure 15), thus, leading to a loss of torque capacity (see Equation (2) and a further increase in Fz. In this way, a positive feedback path is established through the torque controller, which destabilizes the COF and, consequently, wear process.
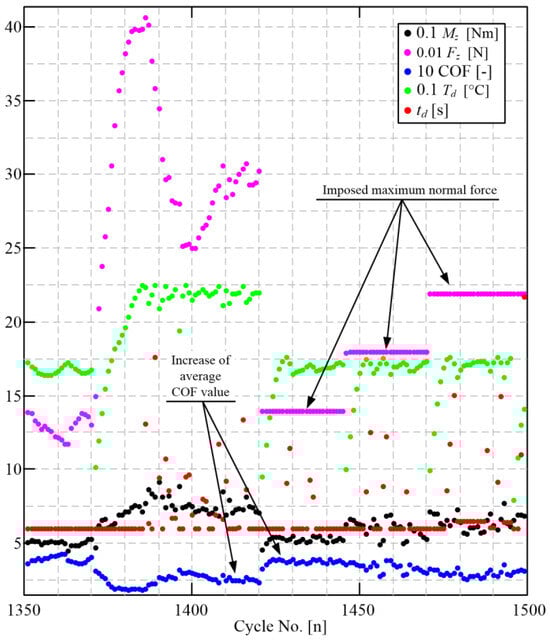
Figure 15.
Illustration of the effect of imposing a maximum normal force on the stability of COF (averaged over the active closing phase t2).
To avoid the above-described transient destabilization effect, an upper limit on the torque controller-generated normal force demand is introduced. The second half of the response in Figure 15 confirms that this simple intervention stabilizes the COF response. It should be noted that the limit has to be high enough to enable the system to achieve the target torque level. For low-to-medium torque levels (up to 50 Nm), the maximum normal force is set to 2 kN (i.e., 0.09 N/mm2), which gives the torque controller ample flexibility for precise torque control even for low COF values. For high torque levels, the maximum normal force is set to 2.4 kN, (i.e., 0.1 N/mm2) as a good compromise between COF stability and torque control authority.
6. Wear Characterization Results
The initially designed disc-on-disc tribometer was successfully used in [17] to investigate the influence of temperature, slip speed, and closing time on the wear rate, while a single torque level of 50 Nm was considered. The tribometer redesign has facilitated and investigation of the influence of all the four inputs in a wide range of their variation, which is demonstrated in the Section 6.1, Section 6.2 and Section 6.3 through the full set of wear rate characterization results. A sample of wear-rate modeling results is presented, as well.
6.1. Organization of Experiments
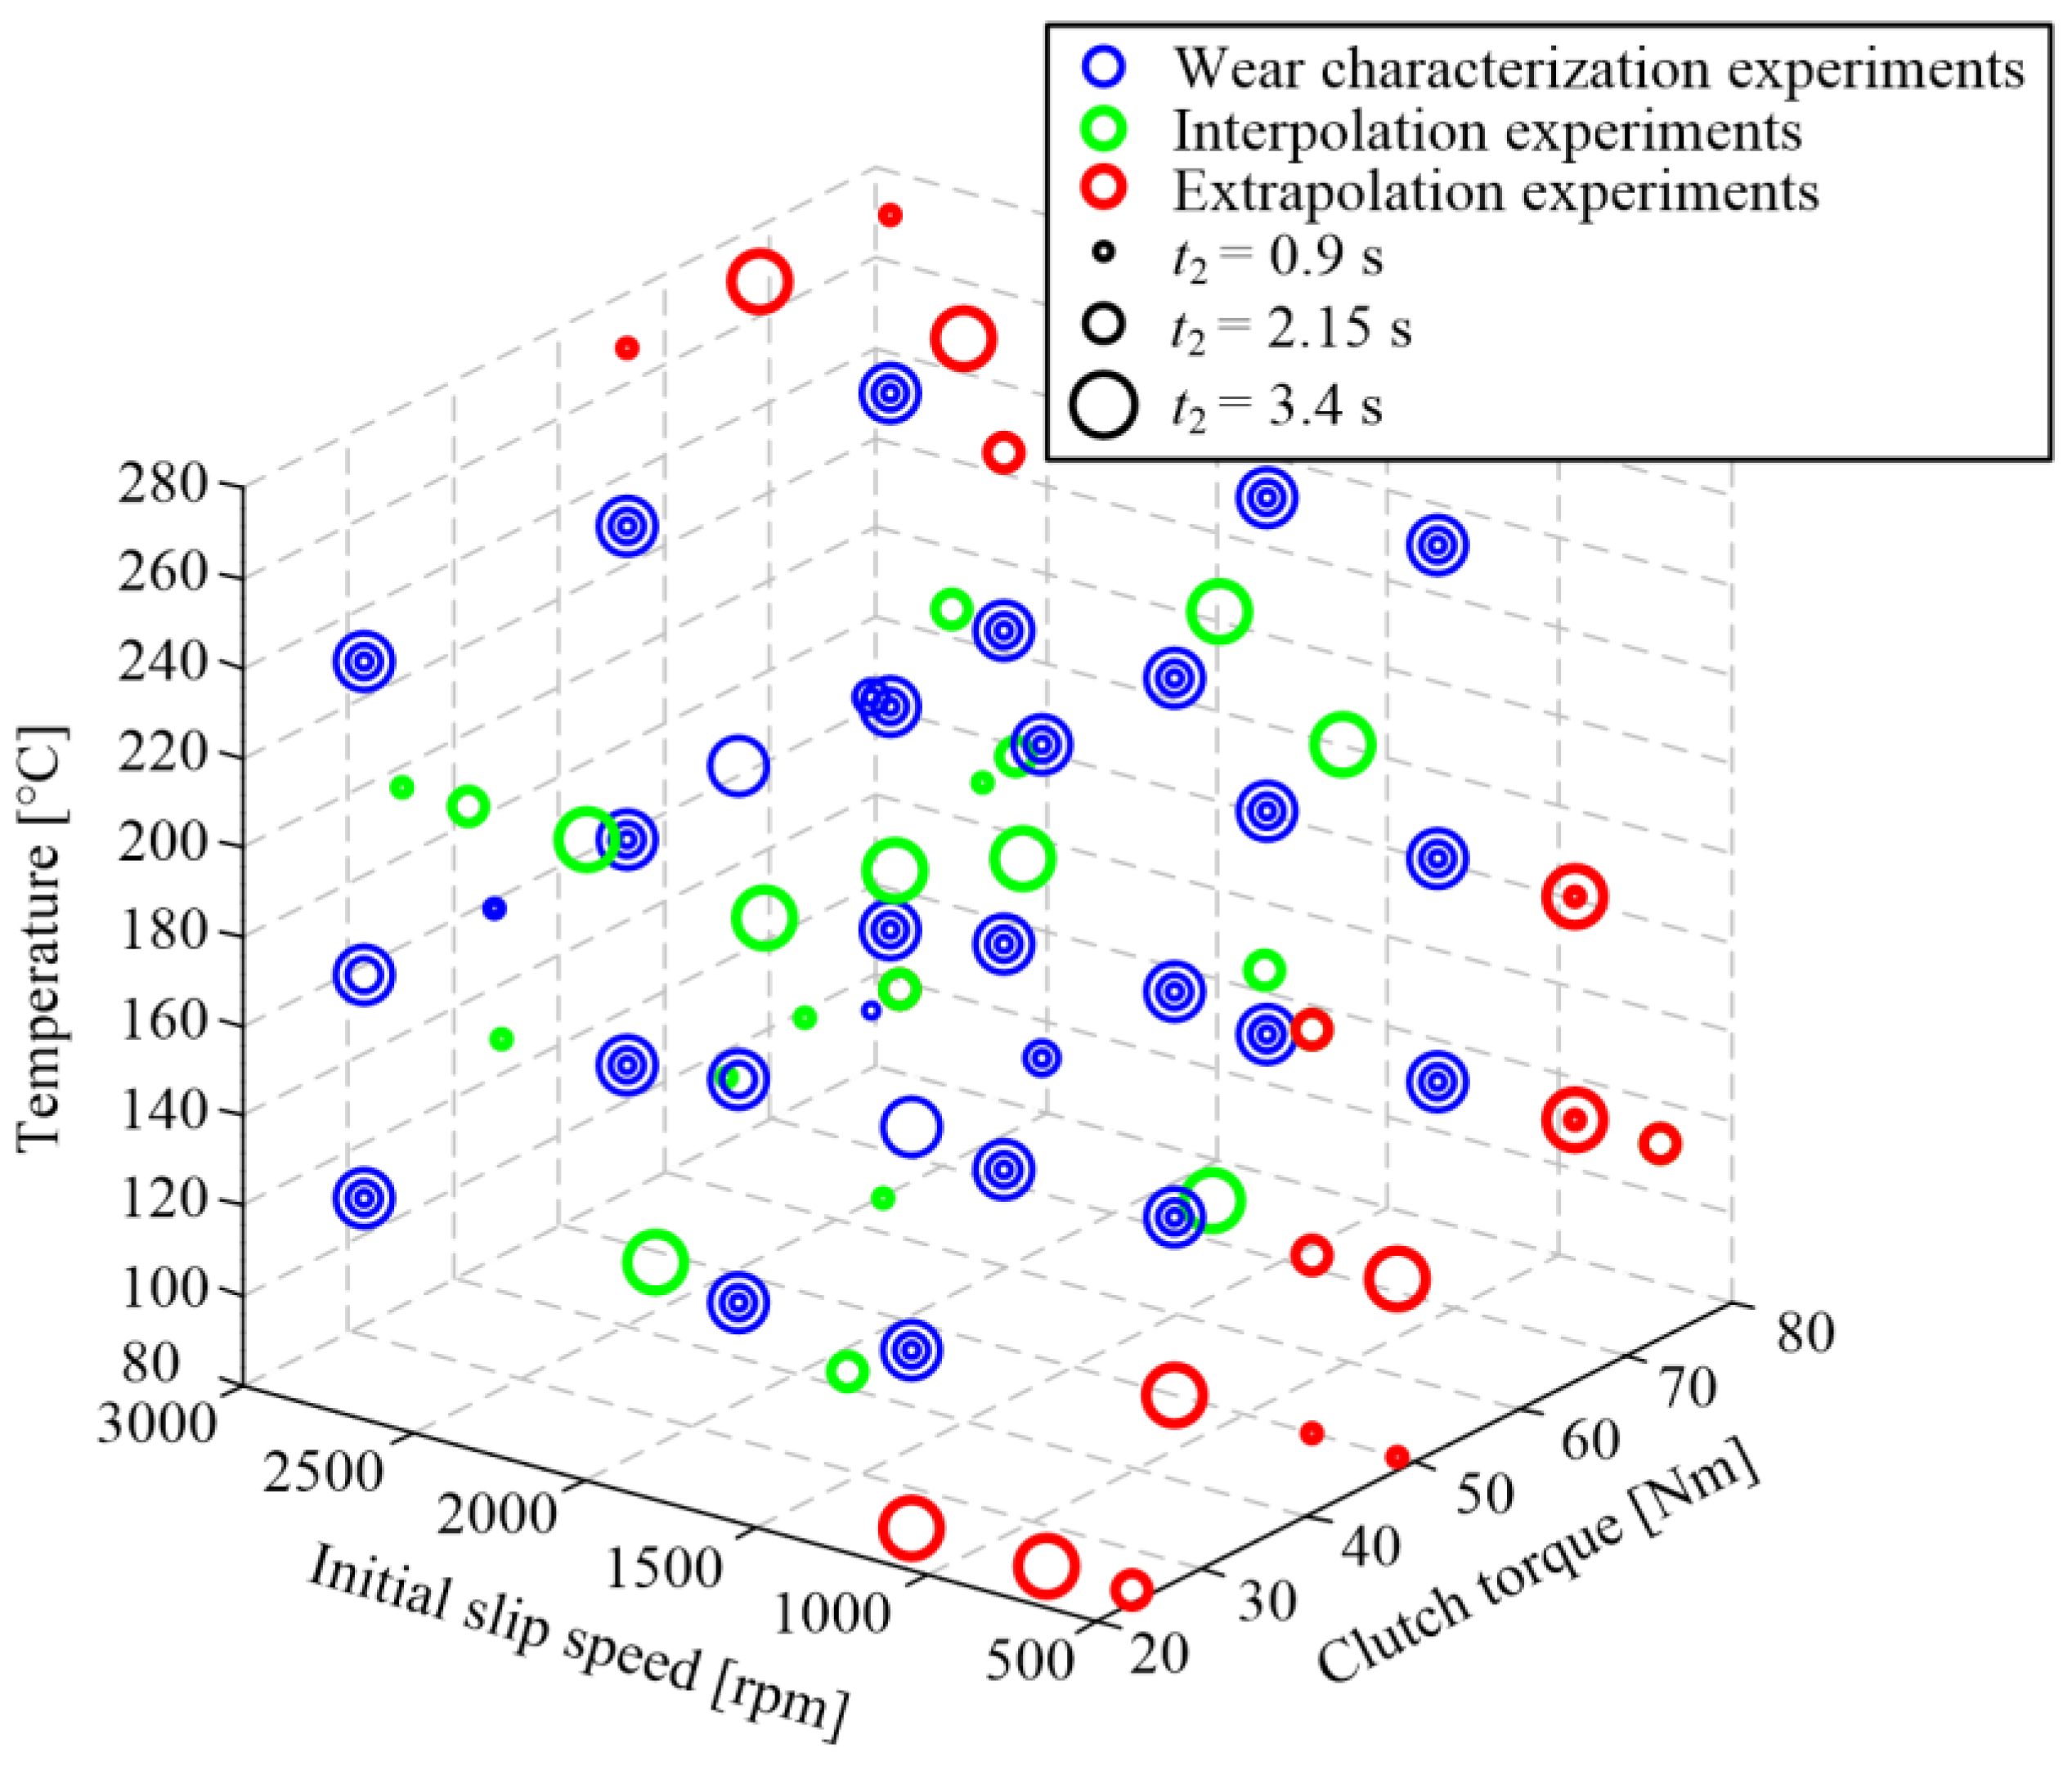
Three main groups of wear characterization experiments were conducted (Figure 16). The first group (blue in Figure 16) includes 81 experiments (i.e., operating points), organized in the way that there are three levels of each of the four inputs, which span over the target operating range. The second group (red) contains 20 operating points, which are placed within the range of the first group points based on the criterion to be as far away from them as possible while avoiding the orthogonal distribution used for the first group. The third group (green) includes 20 points placed close to the edges of the feasible operating range. The first and third groups of points are used for model parameterization, while the second group is employed for model validation.
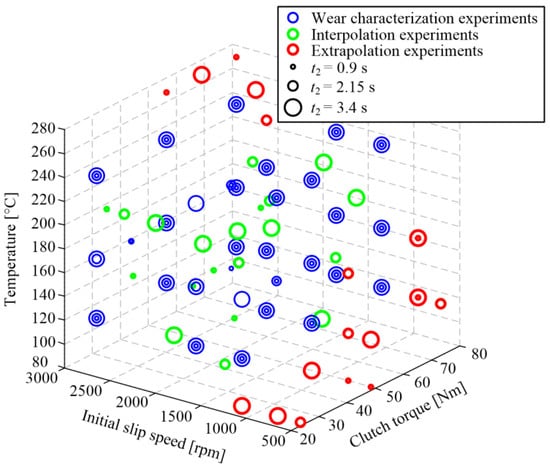
Figure 16.
Illustration of the design of experiments.
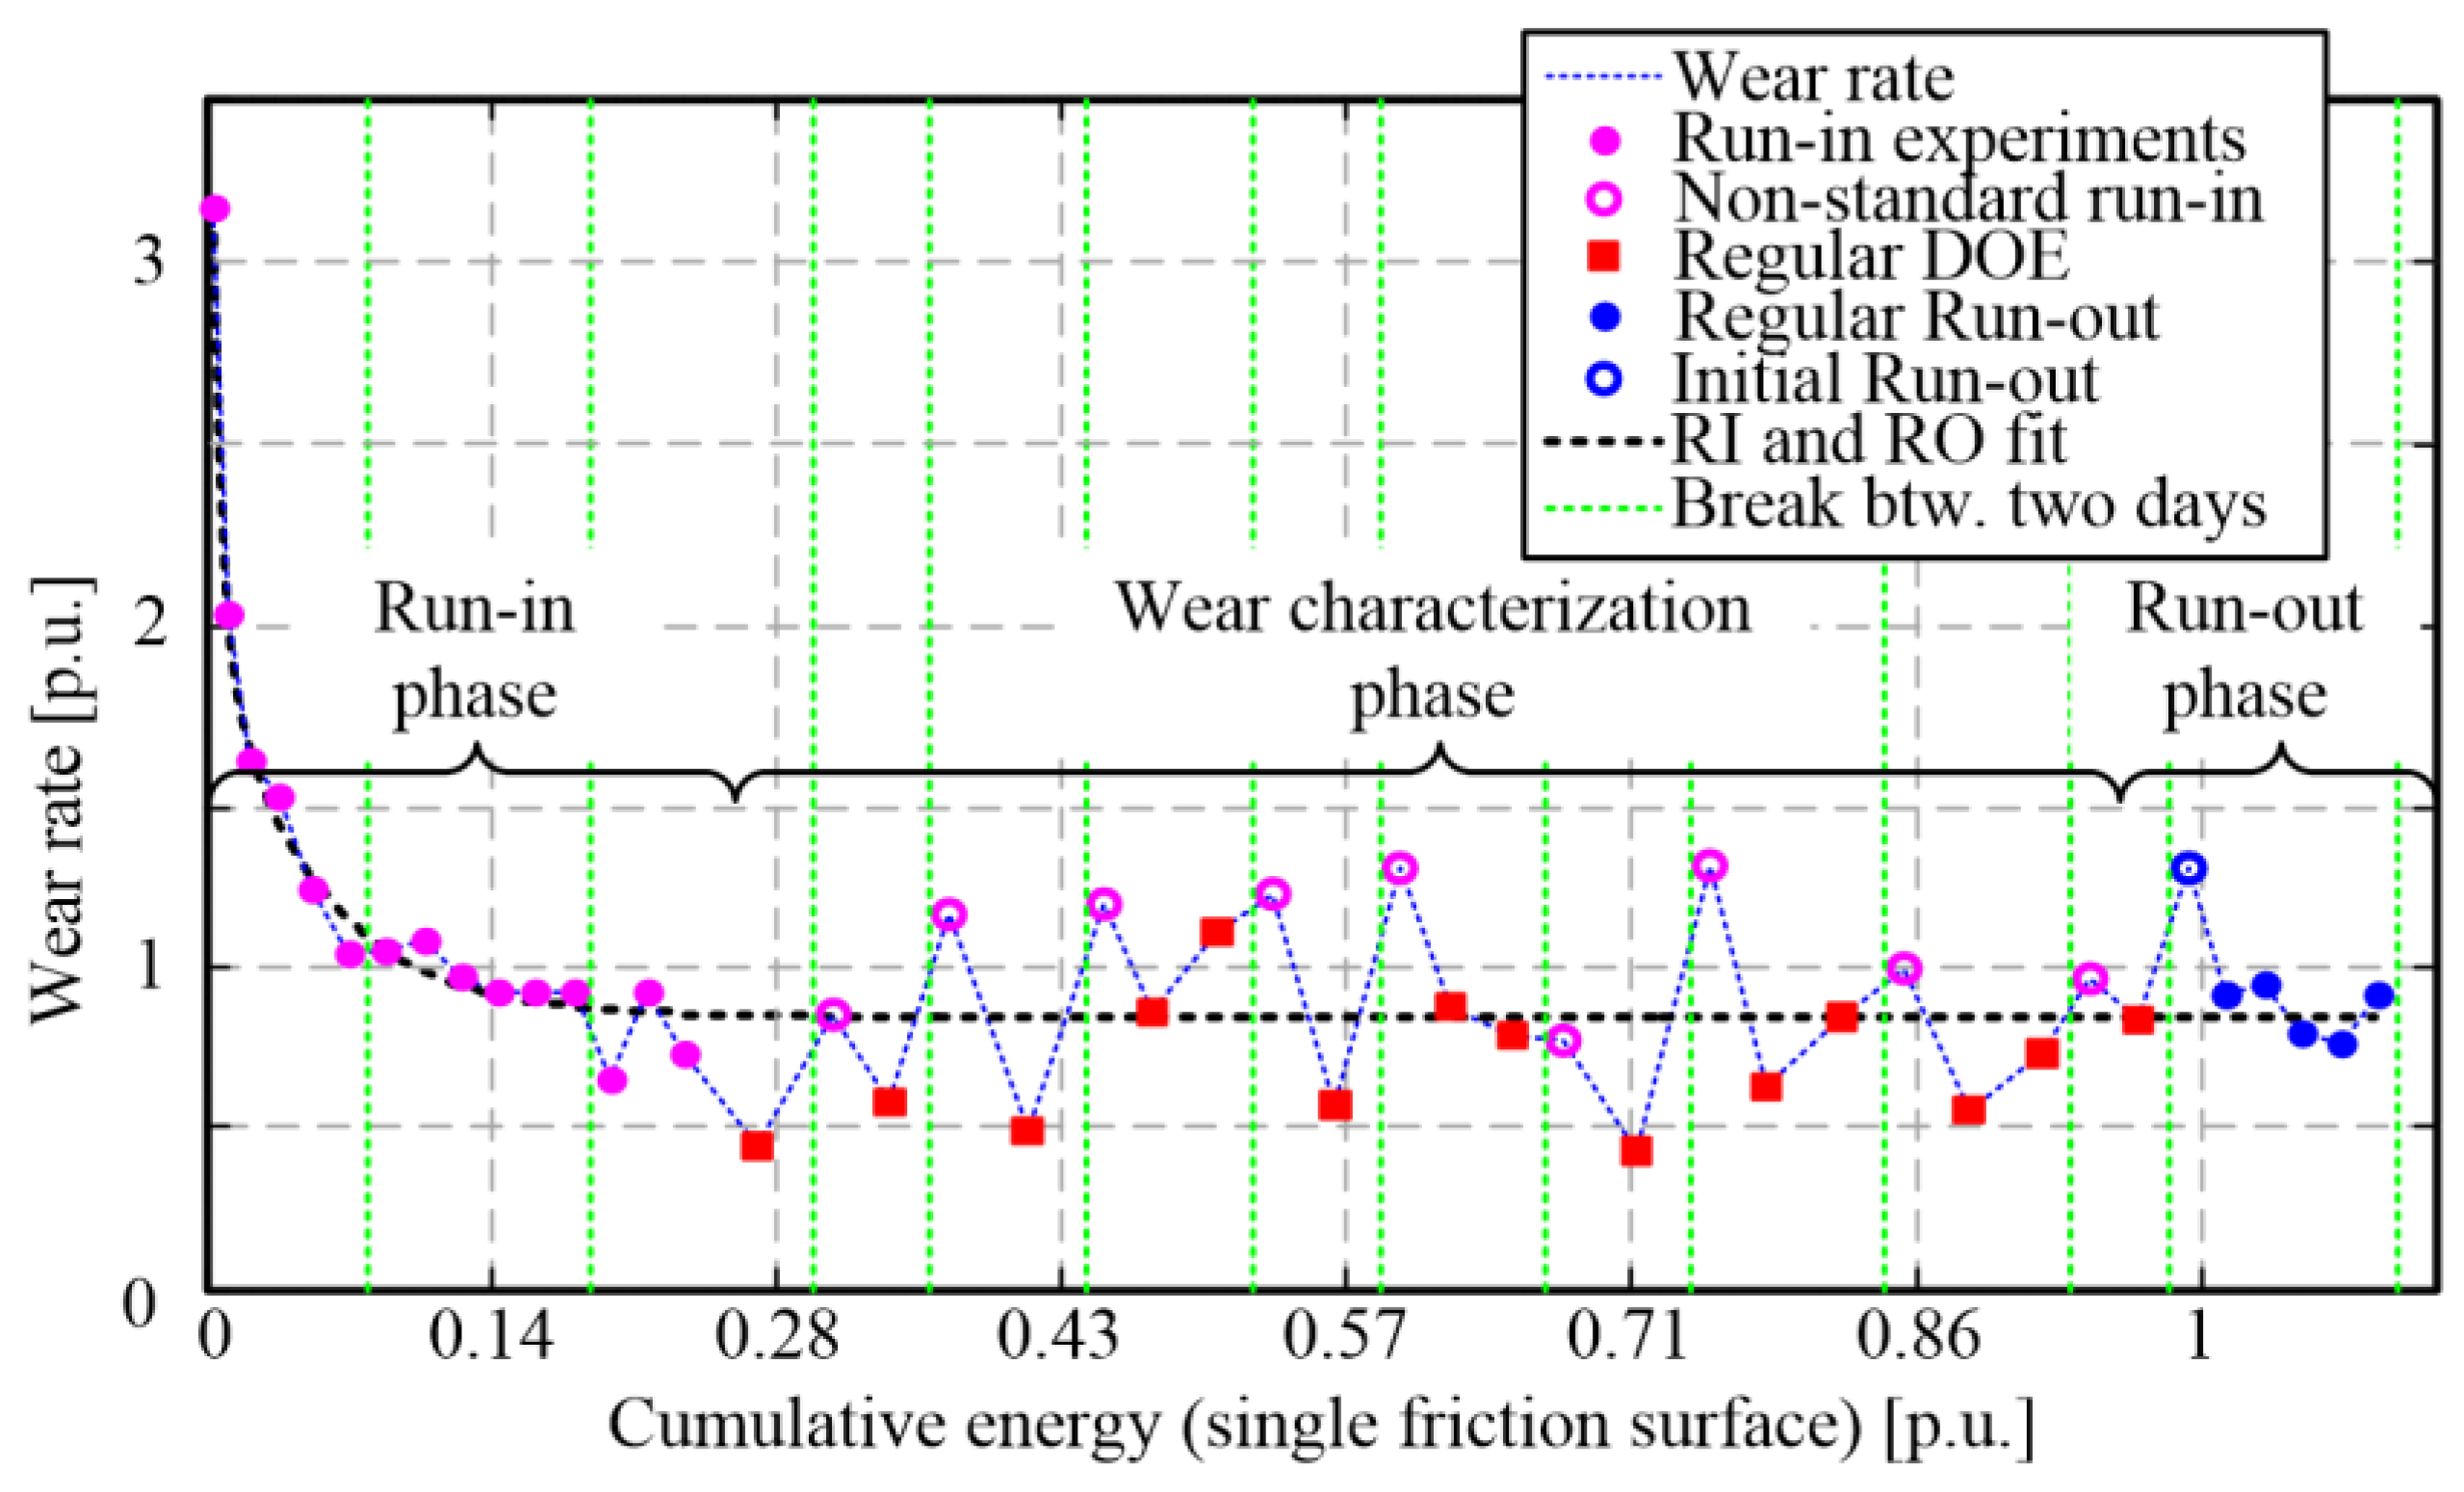
For each new friction plate involved in the tests, a run-in phase of experiments is first recorded for a single operating point (ω0 = 2800 rpm, Mz2 = 50 Nm, t2 = 3.4 s, TdR = 170 °C). In this phase, the wear rate stabilizes from the initially high values (see filled magenta points in Figure 17 and [17]). Once the friction lining is close to being worn out, a set of run-out experiments (blue circles in Figure 17) is recorded for the same operating point as with the run-in experiments. The run-out results are used to compensate for the friction plate piece-to-piece wear-rate variation [17]. The wear characterization experiments were recorded between the run-in and run-out phases (red squares in Figure 17). In total, 14 friction plates were worn out to record all 121 experiments denoted in Figure 16.
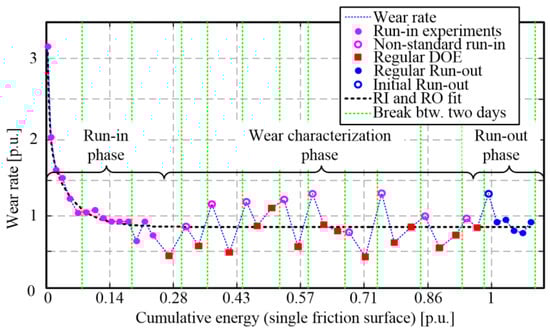
Figure 17.
Wear rate characterization results for a single friction plate.
Based on Equation (1), the wear rate is calculated from the difference in volume Vw, obtained from the difference in mass before and after the wear characterization experiment, and the energy dissipated during the experiment Edis [17]. According to the procedure described in [17], the experiment duration is determined by the condition that the mass difference is of at least 0.3 g and that at least 750 recorded clutch closing cycles are made. Since the friction material is hydroscopic [17], the moisture content can affect the friction material mass difference sensing and, thus, the wear-rate measurement accuracy. To suppress the moisture effect, the examined friction plate was being stored overnight in a sealed container with a silica gel and dried in an electric oven for 1 h at 100 °C at the start of each workday. Furthermore, based on the recommendations gained in [24], the following additional measures were applied: (i) all experiments conducted on a single friction plate correspond to a single temperature level; (ii) prior to recording the first characterization experiment (i.e., after the oven drying), a one-hour preparatory experiment is carried out at the target temperature level to heat up the machine and thermally precondition the friction plate (other inputs are set to their run-in values); and (iii) the first weight difference in the workday is determined from the weight measurements recorded after the preparatory experiment and the subsequent wear characterization experiment (empty magenta circles in Figure 17).
6.2. Wear Rate Characterization Results
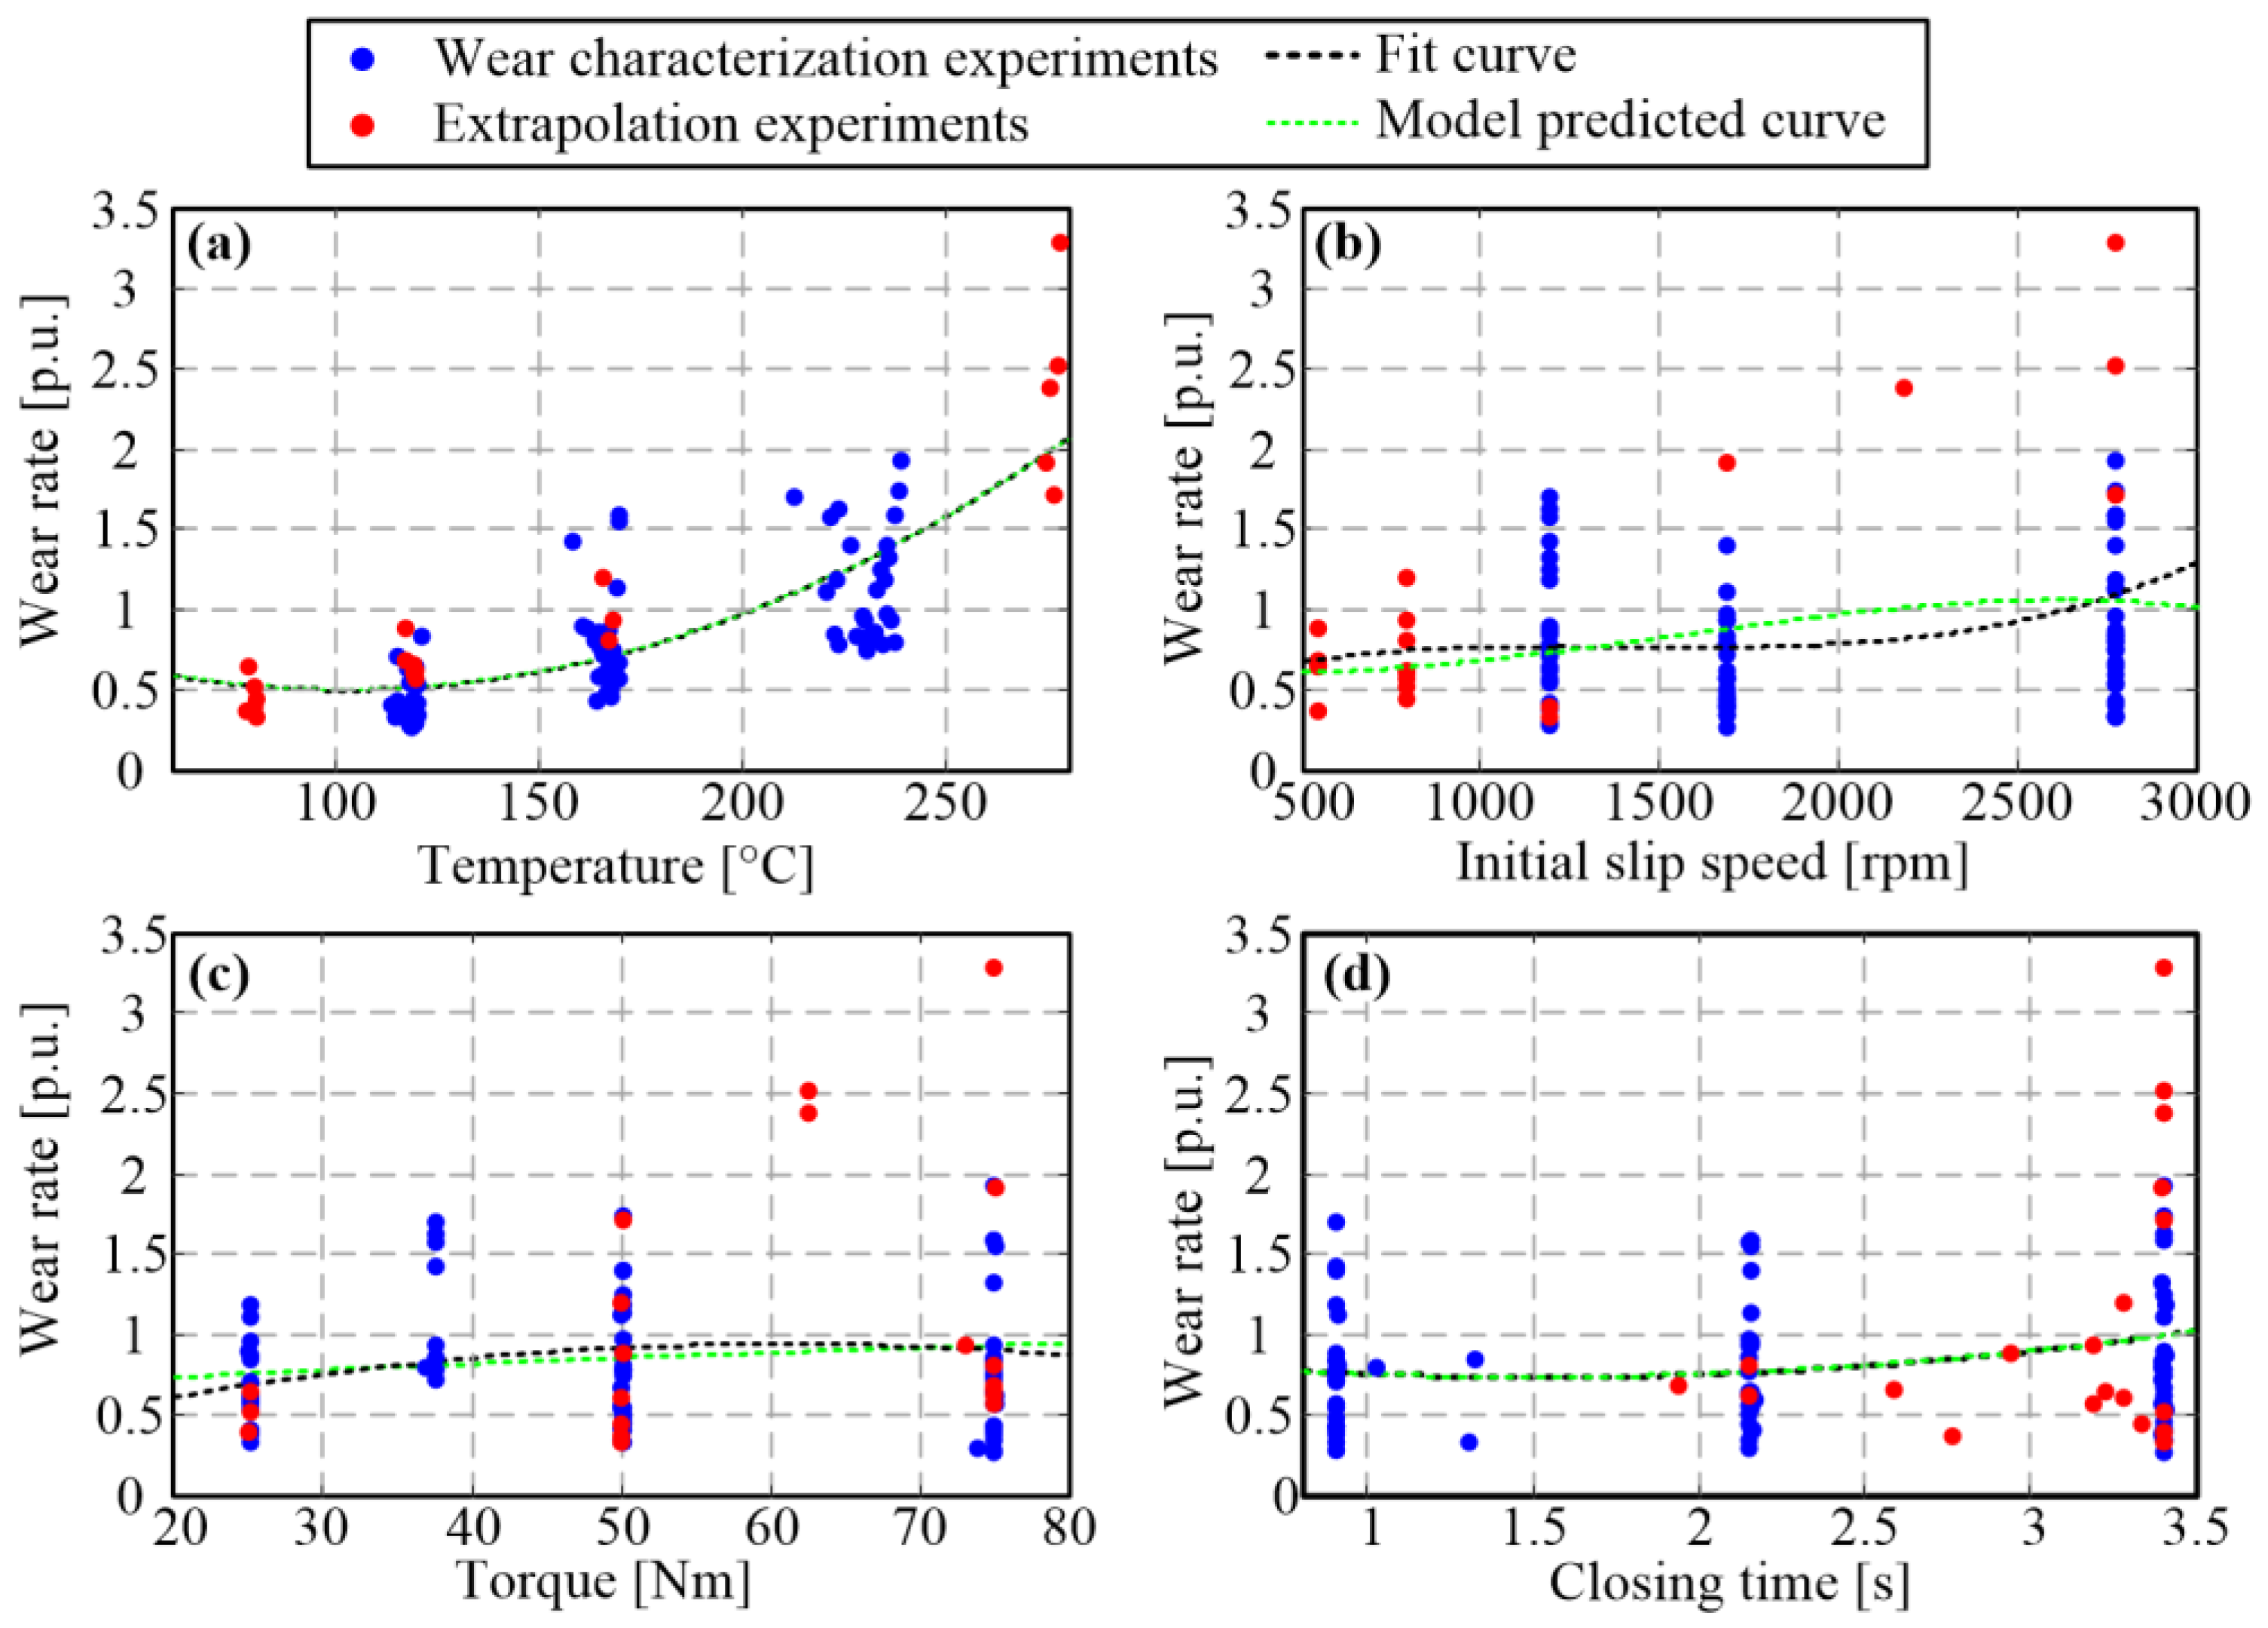
Figure 18 shows the 1D plots correlating to the wear rate and the individual model inputs for characterization (red) and extrapolation points (blue; 101 points in total). The same plots show the low-order polynomial fit lines (dashed black lines). Evidently, the clutch interface temperature has the most dominant influence on the wear rate (Figure 18a), which is captured by the standard wear model (1). The second most-influential input is the initial slip speed (Figure 18b). Although the plots with respect to two remaining inputs (clutch torque and closing time; Figure 18c,d) appear to be relatively flat, these inputs may have considerable influence to wear rate when combined with another parameter (i.e., when a multi-dimensional plot is considered, Section 6.3).
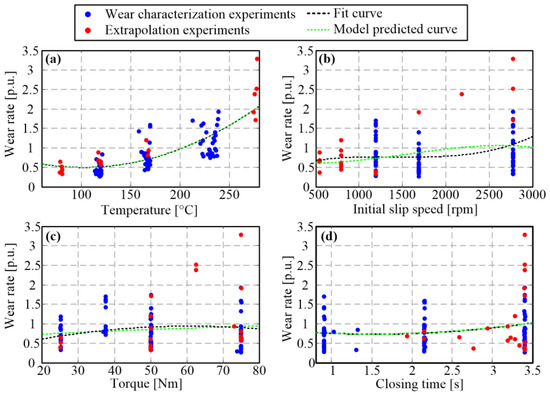
Figure 18.
True (circles) and interpolated wear-rate values (dashed lines) plotted vs. individual model inputs ((a)—Temperature, (b)—Initial Slip Speed, (c)—Torque, (d)—Closing Time) for categorization and extrapolation points from Figure 16.
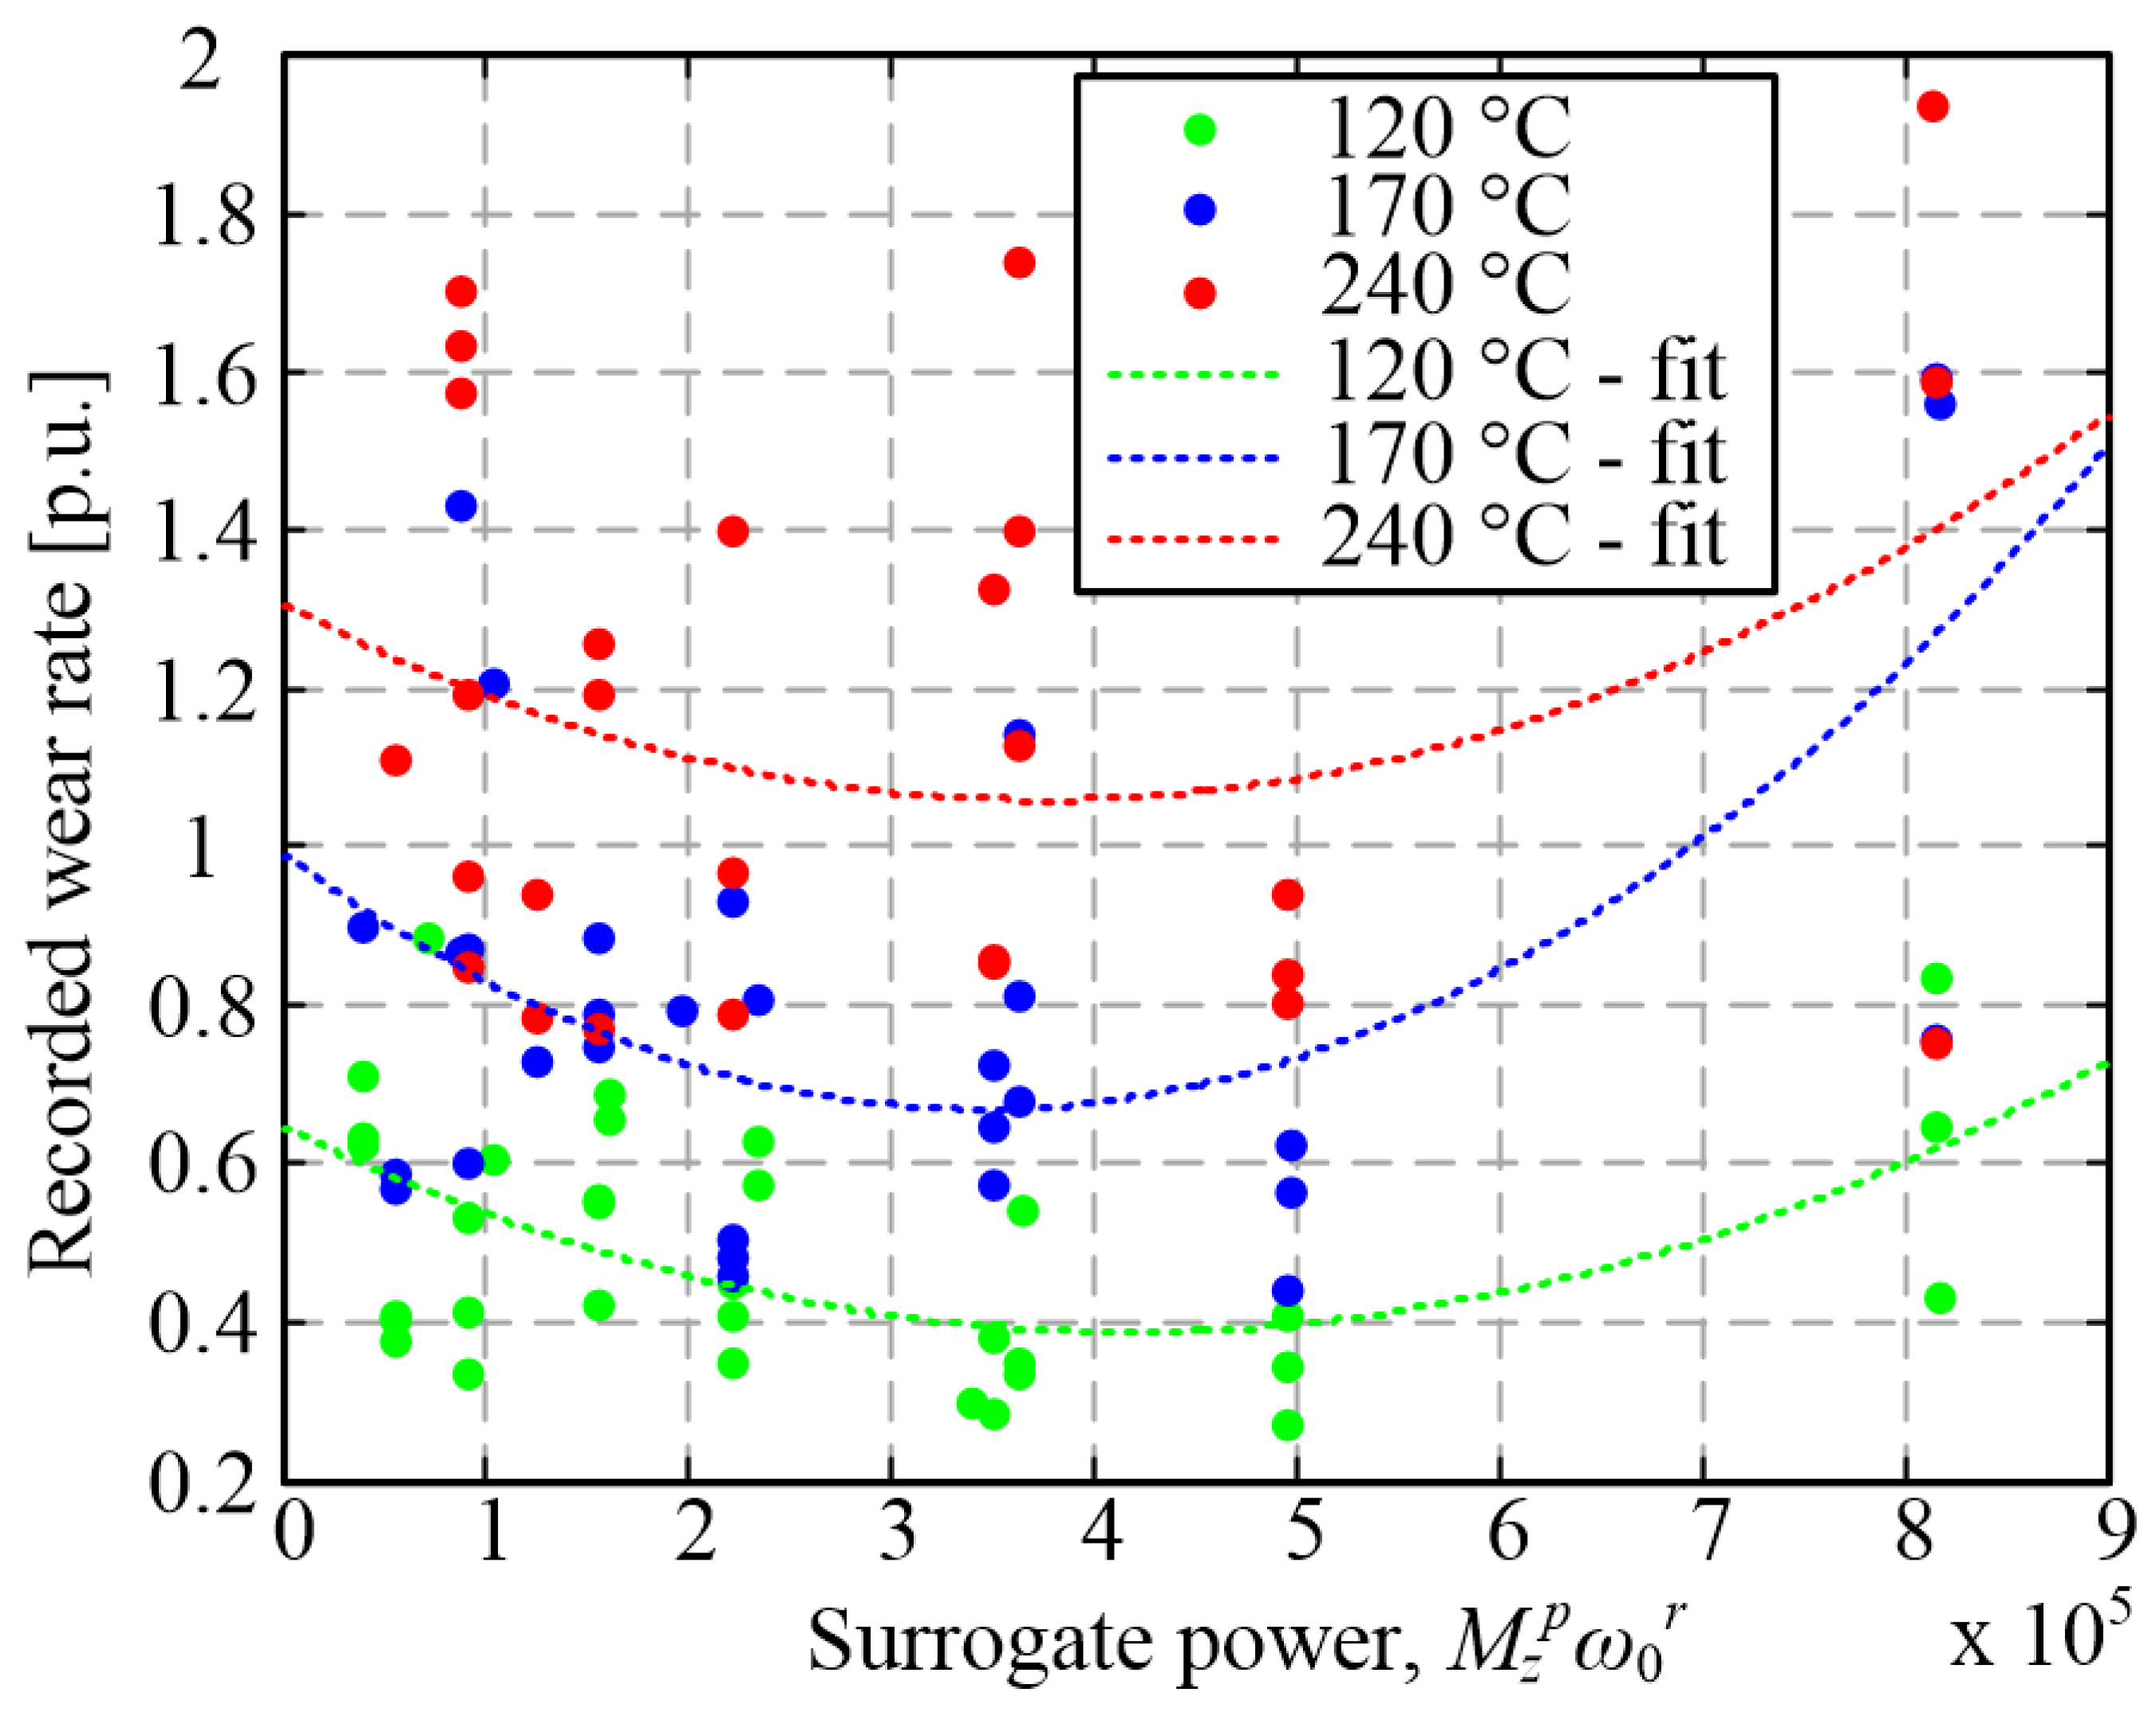
Figure 19 shows the wear rate plots in the dependence of surrogate dissipated power Mz22ω0 for different temperatures. The wear rate points group well around the interpolation curves (particularly for low wear rates, i.e., low temperatures), thus, meaning that the surrogate power may be used as a lumped model input instead of two individual inputs. This reduces the model dimensionality from four to three inputs and allows for the use of the ultimate best subset method of cubic model parameterization (Section 6.3).
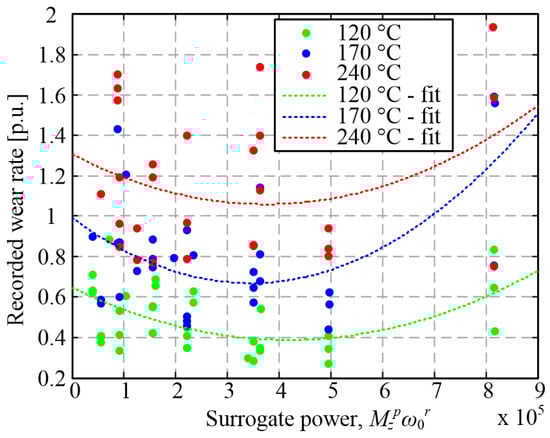
Figure 19.
True and interpolated wear rate values plotted against the surrogate power input for different temperatures and categorization points from Figure 16.
6.3. Model with Surrogate Power as Input
The considered three-input full cubic model is described by the following expression [25]:
where y^ is the normalized model-predicted wear rate; x1, x2, and x3 are normalized inputs (clutch temperature, surrogate power, and closing time); and β(.) are the model parameters. The model contains 20 terms including the intercept β0, meaning that the maximum number of parameters (i.e., degrees of freedom, DOF) is 20. Since the model is linear in parameters, the parameters can be determined by using the standard least-square method [25]. By setting some of the parameters to zero, the model order is reduced for simpler implementation and potentially lower sensitivity to data not used in model parameterization (training). There are 220 − 1 = 1,048,575 submodels of reduced order depending on which parameters are set to zero. The best subset method identifies the parameters of all the submodels by using the least square method and selects the one that has the highest validation index. The validation index used herein is Rt2, and it is calculated as the coefficient of determination R2 [25] applied to model residuals that are obtained in the following way: (i) 1 out of 101 points is excluded from the data set; (ii) the model is trained on the remaining100 points; (iii) the model residual is calculated for the unseen, excluded (101th) point; (iv) the procedure is repeated for the other 100 points to be excluded one by one; and (v) the index Rt2 is calculated as R2 of the obtained 101 model residuals.
y^ = β0 + β1 x1 + β2 x2 + β3 x3 + β12 x1 x2 + β13 x1 x3 + β23 x2 x3 + β11 x12 + β22 x22
+ β33 x32 + β123 x1 x2 x3 + β112 x12 x2 + β113 x12 x3 + β122 x1 x22 + β133 x1 x32
+ β223 x22 x3 + β233 x2 x32 + β111 x13 + β222 x23 + β333 x33
+ β33 x32 + β123 x1 x2 x3 + β112 x12 x2 + β113 x12 x3 + β122 x1 x22 + β133 x1 x32
+ β223 x22 x3 + β233 x2 x32 + β111 x13 + β222 x23 + β333 x33
The surrogate power is defined in the more general form Ms2p ω0r when compared to the initial (rough) form used in Figure 19, where p = 2 and r = 1 held. Before applying the best subset method, a sequential selection feature method was employed with the three-input model with varying model coefficients (exponents) p and r to find their optimal value. The subsequently conducted best subset method resulted in the 15 DOF model. The simpler 9 DOF model was, however, selected since its Rt2 = 0.78 was very close to that of the 15 DOF model. The Rt2 value of 0.78 means that 78% of the variance in the recorded wear-rate data can be explained by the model, which is deemed to be good accuracy when considering the complexity and uncertainty of the wear-rate process, particularly for the wide range of operating points (including the high power/wear points of the extrapolation group; red in Figure 16).
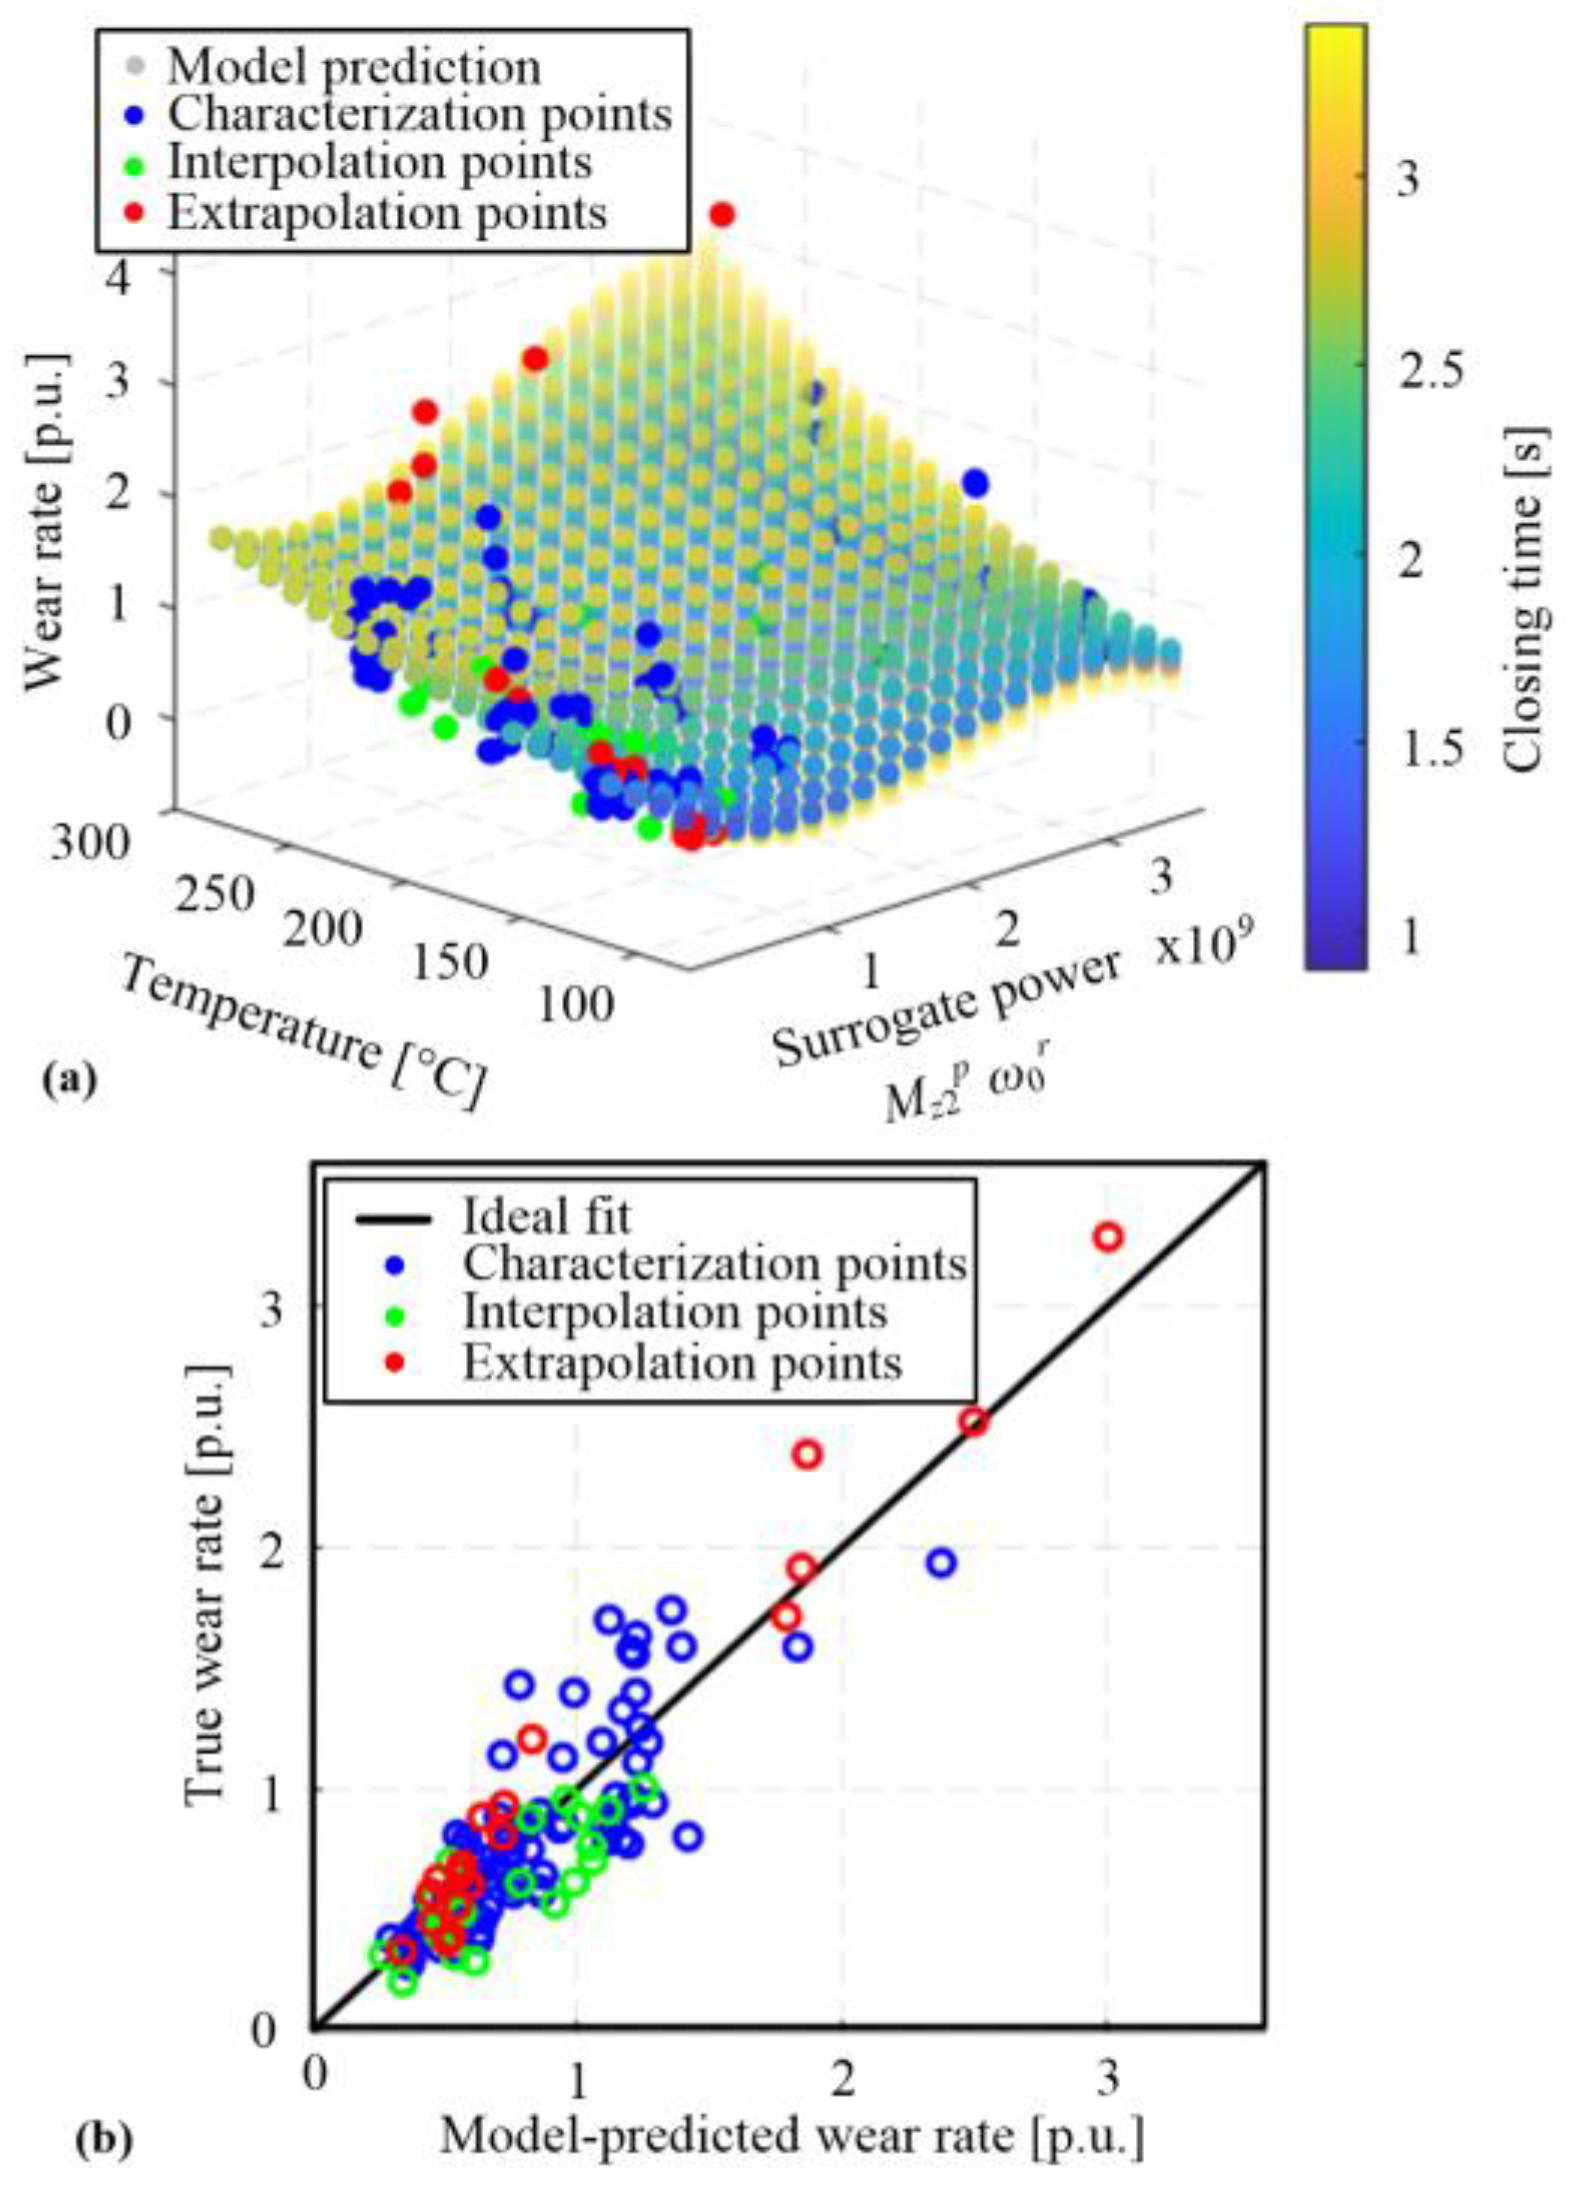
The model response surface is shown in Figure 20a together with the individual, recorded wear-rate points. The response surface confirms the dominant influence of temperature, the second-dominant influence of surrogate power (connected with the initial slip speed influence in Figure 18), and the least, but still considerable, influence of closing time. The 2D plot of true vs. model-predicted wear rate, shown in Figure 20b, confirms a good modeling accuracy not only for categorization and extrapolation points used for model training but also for unseen interpolation points. The modeling accuracy is better, i.e., the wear-rate process uncertainty is lower for lower wear rates (e.g., lower temperatures), which agrees with the preliminary results shown in Figure 19. The good modeling accuracy is reflected in a very good alignment of the fit (black) and model-predicted (green) lines in Figure 18.
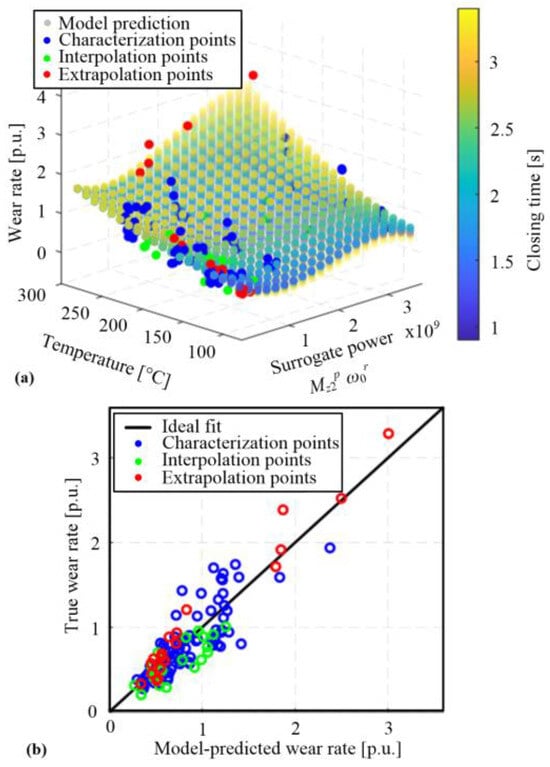
Figure 20.
Surface response of the 9 DOF wear-rate model along with true wear-rate points (a) and a true vs. recorded wear-rate plot (b).
7. Conclusions
A redesign of the custom dry clutch lining CNC tribometer is presented with the aim to extend the shudder-resilient operation to the full operating range (including high torque/high power operation). The redesign involved a set of measures on both the mechanical and control system sides. An analysis of the original tribometer vertical axis dynamics has pointed out that the main source of compliance of the vertical axis, as a shudder-vibration root cause, is related to the small lateral stiffness, particularly that of the two-axis normal load/torque sensor. Hence, the mechanical system redesign was aimed at increasing the natural frequency of the vertical axis, which included the following measures: (i) increase in the lateral stiffness through replacement of the single two-axial sensor with a set of three three-axial force sensors, (ii) incorporating three radially-distant linear guides, (iii) reduction in the lengths of cantilevers of the lateral force acting on the linear guides, and (iv) reduction in the mass of the suspended vertical axis assembly. Furthermore, mechanical adjustments were conducted to improve the parallelism between the friction contact surfaces and increase the stiffness of the eccentrically positioned cooling pipes. Finally, the tribometer control routines were adjusted to make the contact surface heat distribution more uniform and, thus, reduce the temperature gradients and thermal expansion non-uniformity. These adjustments included keeping the friction surfaces (i.e., the clutch) locked during the cooling delay inserted at the end of the closing cycle and imposing a minimum cooling delay and maximum normal force limits.
The full functionality of the redesigned tribometer machine was demonstrated through conducting the wear characterization tests in the full range of clutch operating parameters (the torque, in particular) with no disturbing shudder vibrations excited. This enabled the collection of the full set of wear characterization data for successful wear-rate modeling with respect to four input variables (temperature, initial slip speed, torque, and closing time). To make the model simpler and its parameterization more straightforward through the best subset method, the torque and initial slip speed inputs were lumped into a lumped, surrogate power input.
Future publications will be focused on using the recorded wear rate and coefficient of friction (COF) data for a more comprehensive modeling of wear and COF expectation and variability, with application to automotive transmissions modeling, monitoring, and control.
Author Contributions
Conceptualization, M.H. (Matija Hoić), M.H. (Mario Hrgetić), N.K., J.D. and A.T.; methodology, M.H. (Matija Hoić), M.H. (Mario Hrgetić), N.K. J.D. and A.T.; software, J.D.; validation, M.H. (Matija Hoić) and M.H. (Mario Hrgetić); formal analysis, M.H. (Matija Hoić) and J.D.; investigation, M.H. (Matija Hoić), M.H. (Mario Hrgetić) and J.D.; writing—original draft preparation, M.H. (Matija Hoić) and M.H. (Mario Hrgetić); writing—review and editing, M.H. (Matija Hoić) and J.D.; supervision, J.D.; project administration, J.D.; funding acquisition, J.D. and A.T. All authors have read and agreed to the published version of the manuscript.
Funding
This research was funded by the Ford Motor Company under the internal funding program number DEPT2019-J075.6.
Institutional Review Board Statement
Not applicable.
Informed Consent Statement
Not applicable.
Data Availability Statement
Data are contained within the article.
Acknowledgments
We gratefully acknowledge that this work was supported by the Ford Motor Company. The authors would also like to recognize the contributions of Zvonko Herold, Branimir Škugor, Ivana Mijić, Valentino Štahan, and Krunoslav Haramina to the collective body of knowledge and effort needed to produce this paper.
Conflicts of Interest
The Ford Motor Company supported the study including parts and data support, and approved the paper publication. A.T. was a Ford employee and he directly contributed to the study performed.
References
- Tripathi, K. A Novel Approach for Enhancement of Automobile Clutch Engagement Quality Using Mechatronics Based Automated Clutch System. J. Inst. Eng. (India) Ser. C 2013, 94, 9–20. [Google Scholar] [CrossRef]
- Della Gatta, A.; Iannelli, L.; Pisaturo, M.; Senatore, A.; Vasca, F. A survey on modeling and engagement control for automotive dry clutch. Mechatronics 2018, 55, 63–75. [Google Scholar] [CrossRef]
- Cappetti, N.; Pisaturo, M.; Senatore, A. Modelling the cushion spring characteristic to enhance the automated dry-clutch performance: The temperature effect. Proc. Inst. Mech. Eng. Part D J. Automob. Eng. 2012, 226, 1472–1482. [Google Scholar] [CrossRef]
- Haggag, S.A.; Ibrahim, F. Dual Mode Control of an Automotive Clutch-BY-Wire System; 2013-01-0484; SAE: Warrendale, PA, USA, 2013. [Google Scholar]
- Chen, Y.; Wang, X.; He, K.; Yang, C. Model reference self-learning fuzzy control method for automated mechanical clutch. Int. J. Adv. Manuf. Technol. 2018, 94, 3163–3172. [Google Scholar] [CrossRef]
- Jialei, S.; Liang, L.; Xiangyu, W.; Congzhi, L. Robust output feedback controller with high-gain observer for automatic clutch. Mech. Syst. Signal Process. 2019, 132, 806–822. [Google Scholar]
- Che Kob, M.S.; Supriyo, B.; Tawi, K.B.; Mazali, I.I. Engagement slip controller development based on actuator displacement for an electro-mechanical friction clutch system. Int. J. Automot. Mech. Eng. (IJAME) 2015, 11, 2664–2674. [Google Scholar] [CrossRef]
- Liauw, Y.D.S.; Roozegar, M.; Zou, T.; Morozov, A.; Angeles, J. A topology-change model of multi-speed transmissions in electric vehicles during gear-shifting. Mechatronics 2018, 55, 151–161. [Google Scholar] [CrossRef]
- Foulard, S.; Rinderknecht, S.; Ichchou, M.; Perret-Liaudet, J. Automotive drivetrain model for transmission damage prediction. Mechatronics 2015, 30, 27–54. [Google Scholar] [CrossRef]
- Bachinger, M.; Stolz, M.; Horn, M. A novel drive train modelling approach for real-time simulation. Mechatronics 2015, 32, 67–78. [Google Scholar] [CrossRef]
- Deur, J.; Ivanović, V. Clutch actuation. In Encyclopedia of Automotive Engineering; Crolla, D., Foster, D.E., Kobayashi, T., Vaughan, N., Eds.; John Wiley & Sons, Ltd.: New York, NY, USA, 2014. [Google Scholar]
- Egala, R.; Jagadeesh, G.V.; Setti, S.G. Experimental investigation and prediction of tribological behavior of unidirectional short castor oil fiber reinforced epoxy composites. Friction 2021, 9, 250–272. [Google Scholar] [CrossRef]
- Findik, F. Latest progress on tribological properties of industrial materials. Mater. Des. 2014, 57, 218–244. [Google Scholar] [CrossRef]
- Ramalhoa, A.; Miranda, J.C. The relationship between wear and dissipated energy in sliding systems. Wear 2006, 260, 361–367. [Google Scholar] [CrossRef]
- Satapathy, B.K.; Bijwe, J. Comparison of Friction and Wear Behavior between C/C, C/C-SiC and Metallic Composite Materials, Part II. Optimisation by balancing and ranking using multiple criteria decision model (MCDM). Tribol. Lett. 2015, 60, 15. [Google Scholar] [CrossRef]
- Biczó, R.; Kalácska, G. Effects of Automotive Test Parameters on Dry Friction Fiber-Reinforced Clutch Facing Surface Microgeometry and Wear—Part 2. Polymers 2022, 14, 1757. [Google Scholar] [CrossRef] [PubMed]
- Hoić, M.; Hrgetić, M.; Kranjčević, N.; Kostelac, M.; Deur, J.; Tissot, A. Design of a disc-on-disc-type CNC tribometer targeted at dry clutch friction plate wear characterization. Int. J. Automot. Technol. 2022, 23, 55–71. [Google Scholar] [CrossRef]
- Yuan, R.; Wu, G.; Shao, C.; Su, S. Mechanism-oriented control for suppressing start-up judder of vehicle with automatic dry clutch: Experiment and simulation analysis. Proc. Inst. Mech. Eng. Part D J. Automob. Eng. 2021, 235, 744–758. [Google Scholar] [CrossRef]
- Available online: https://kistler.cdn.celum.cloud/SAPCommerce_Download_original/000-630e.pdf (accessed on 12 September 2023).
- Available online: https://kistler.cdn.celum.cloud/SAPCommerce_Download_original/003-531e.pdf (accessed on 12 September 2023).
- Ray Shaver, F. Manual Transmission Clutch Systems; SAE International: Warrendale, PA, USA, 1997; ISBN 978-1-56091-984-1. [Google Scholar]
- Klotz, T.; Ott, S.; Albers, A. Eine Methode zur Ermittlung der anwendungsspezifischen Leistungsgrenze trockenlaufender Friktionspaarungen. Forsch Ingenieurwes 2019, 83, 11–20. [Google Scholar] [CrossRef]
- Satapathy, B.K.; Bijwe, J. Performance of friction materials based on variation in nature of organic fibres Part I. Fade and recovery behaviour. Wear 2004, 257, 573–584. [Google Scholar] [CrossRef]
- Hoić, M.; Miklik, A.; Kostelac, M.; Deur, J.; Tissot, A. Analysis of the Accuracy of Mass Difference-Based Measurement of Dry Clutch Friction Material Wear. Materials 2021, 14, 5356. [Google Scholar] [CrossRef] [PubMed]
- Johnson, R.A.; Wicher, D.W. Applied Multivariate Statistical Analysis, 6th ed.; Pearson Education. Inc.: London, UK, 2007. [Google Scholar]


Disclaimer/Publisher’s Note: The statements, opinions and data contained in all publications are solely those of the individual author(s) and contributor(s) and not of MDPI and/or the editor(s). MDPI and/or the editor(s) disclaim responsibility for any injury to people or property resulting from any ideas, methods, instructions or products referred to in the content. |
© 2023 by the authors. Licensee MDPI, Basel, Switzerland. This article is an open access article distributed under the terms and conditions of the Creative Commons Attribution (CC BY) license (https://creativecommons.org/licenses/by/4.0/).