1. Introduction
According to the European Agency for Safety and Health at Work (EU-OSHA), musculoskeletal disorders (MSDs) are one of the most common work-related health problems in the European Union (EU) [
1]. In 2018, the German Federal Institute for Occupational Safety and Health (BAuA) estimated a production loss of EUR 17.2 billion and a loss of gross value added of EUR 30.4 billion in Germany for the year 2016 due to musculoskeletal disorders [
2]. In the 28 member states of the European Union, 66% of plant and machine operators and assemblers reported one or more MSD-related health problems in 2015, while 61% of all workers reported that they are exposed to repetitive hand or arm movements and 43% are exposed to tiring and painful positions [
1]. To reduce the load on workers in assembly lines, support systems such as exoskeletons can be used e.g. when being exposed to peak loads [
3] or for motion assistance when working in ergonomic demanding postures [
3,
4,
5,
6,
7] such as overhead work. Recent studies show a reduction in muscle activity when working with an exoskeleton above shoulder height [
8,
9,
10,
11,
12].
To ensure a well-user-centered product, technical systems need to be developed and validated considering the physical human-exoskeleton interaction [
13]. In the past, this involved expensive and time-consuming studies, while in recent years a shift from checklists and questionnaires to the integration of digital human factor such as virtual/augmented reality or digital human solutions can be observed [
14]. The integration of human factors helps in designing a user-centered product, e.g., by predicting the load on the user [
15] or by enhancing the user’s well-being by improving the workspace and reducing the complexity of performed tasks [
16]. One possibility to ensure the integration of digital human factors is using digital human models (DHM) [
17].
Biomechanical DHM, e.g., musculoskeletal human models (MHM) such as
Anybody or
OpenSim [
18,
19], can be used to estimate the strain on humans for specific tasks, when the motion of the human and the external loads on the human are known [
20,
21,
22]. Model-based optimization approaches exist for the development of exoskeletons in which the parameters of the exoskeleton are iteratively adjusted e.g., Jensen et al., varied the spring stiffness of a passive upper limb orthosis to reduce muscle activity of the shoulder [
23,
24]. A challenge with these MHMs is to model the interaction with technical systems as these interactions usually cause loads on the human. However, the accuracy of these models in representing the real interaction between the human and the support system can vary [
25]. Designing user-centered support systems for e.g., assembly lines require a holistic approach where the human, assembly tool, task, and support system are taken into consideration and the interactions between them are appropriately modelled. This kind of modelling comes with several challenges which have not been entirely solved yet. Often in MHM, the loads to determine the stress on the user are modelled in a simple way by using a generic load profile [
26] e.g., Molz et al., 2022 modeled the load acting on the hand of the MHM as a constant process force during an overhead screw-in task [
27,
28]. Uchida et al., 2016 added a massless technical system to the MHM to evaluate the effect of a running support system, they did not consider the load on the human due to the mass of the technical system [
29]. Moreover, the spatial dimensions of the technical system are often not considered [
9,
24], as well as the motion of the user [
17], thus overlooking the loads on the human due to mass and inertia forces. As a result, the forces and torques acting on the human are often not modelled in a sufficient way, since in reality the physical load on the user varies over time when performing a task and the dynamic forces must be taken into account.
When, for example, using handheld power tools such as cordless screwdrivers, the torque induced by the screwdriver motor and the push force induced by the user are not constant during the work process [
30,
31]. Therefore, there is a research gap in application-oriented load models that describe the load on the human during manual tasks with support systems that are not available. To customize exoskeleton support for manual tasks, the process forces and torques need to be modelled application oriented.
In literature, several approaches for measuring human process forces are presented. Kalra et al., 2015 presented a flexible resistive sensor-based measurement system to measure the hand-handle interaction forces under static and dynamic conditions [
32]. Furthermore, Landry et al., 2021 propose an algorithm to isolate the push and grip force distribution from force measurement foils during the use of an electric nut runner [
33]. Komi et al., 2007 evaluated a flexible sensor for grip force measurements during golf shots [
34]. Other approaches derive push or pull forces from ground reaction forces (GRF) in costly and time-consuming experimental studies with prototypes [
24,
31]. Simulation models of the work tasks provide a reliable and cheaper way to determine these forces and torques.
Another important aspect of the development of support systems is the varying external loads for different users performing the same task which are caused by their individual handling of the power tool [
31]. Support systems will then have to be optimized for each user individually, which is expensive and time-consuming. Simulations provide an alternative as they can be used to design robust systems, which are insensitive to noise factors [
35]. The workload on the user is then only determined by the task and the technical system itself and not by the individual usage of the system by the user.
In the simulation-based development of strain-optimized human-machine systems, the consideration of application-oriented loads is relevant. To provide more realistic loads on DHM, the inertial forces must be taken into consideration, thus realistic motion data, the mass, mass distribution and spatial dimensions have to be provided. In addition, external loads such as the process torque and the push force must be taken into consideration.
This paper therefore presents a simulation model that fulfills all these requirements. The aim of this model is to provide realistic interaction forces and torques between the handheld power tool and the hand of a musculoskeletal human model (DHM) for an overhead assembly task performed by [
31].
The model consists of three sub-models to determine the load onto the user based on the user’s motion and interaction forces and torques. For the verification of the simulation model, two separate steps are taken. First, the simulation results are compared to a mathematical model secondly a simulative parameter study is conducted. With this model, it is possible for the first time to give an accurate estimation of user loads for DHMs for real use cases which enables efficient research on support structures such as exoskeletons.
Following, the model structure, individual sub-models, and combined ApOL model will be explained in detail. In addition, the validation method, validation results, and limitations of the ApOL model will be presented and discussed in the subsequent sections of this paper.
2. Materials and Methods
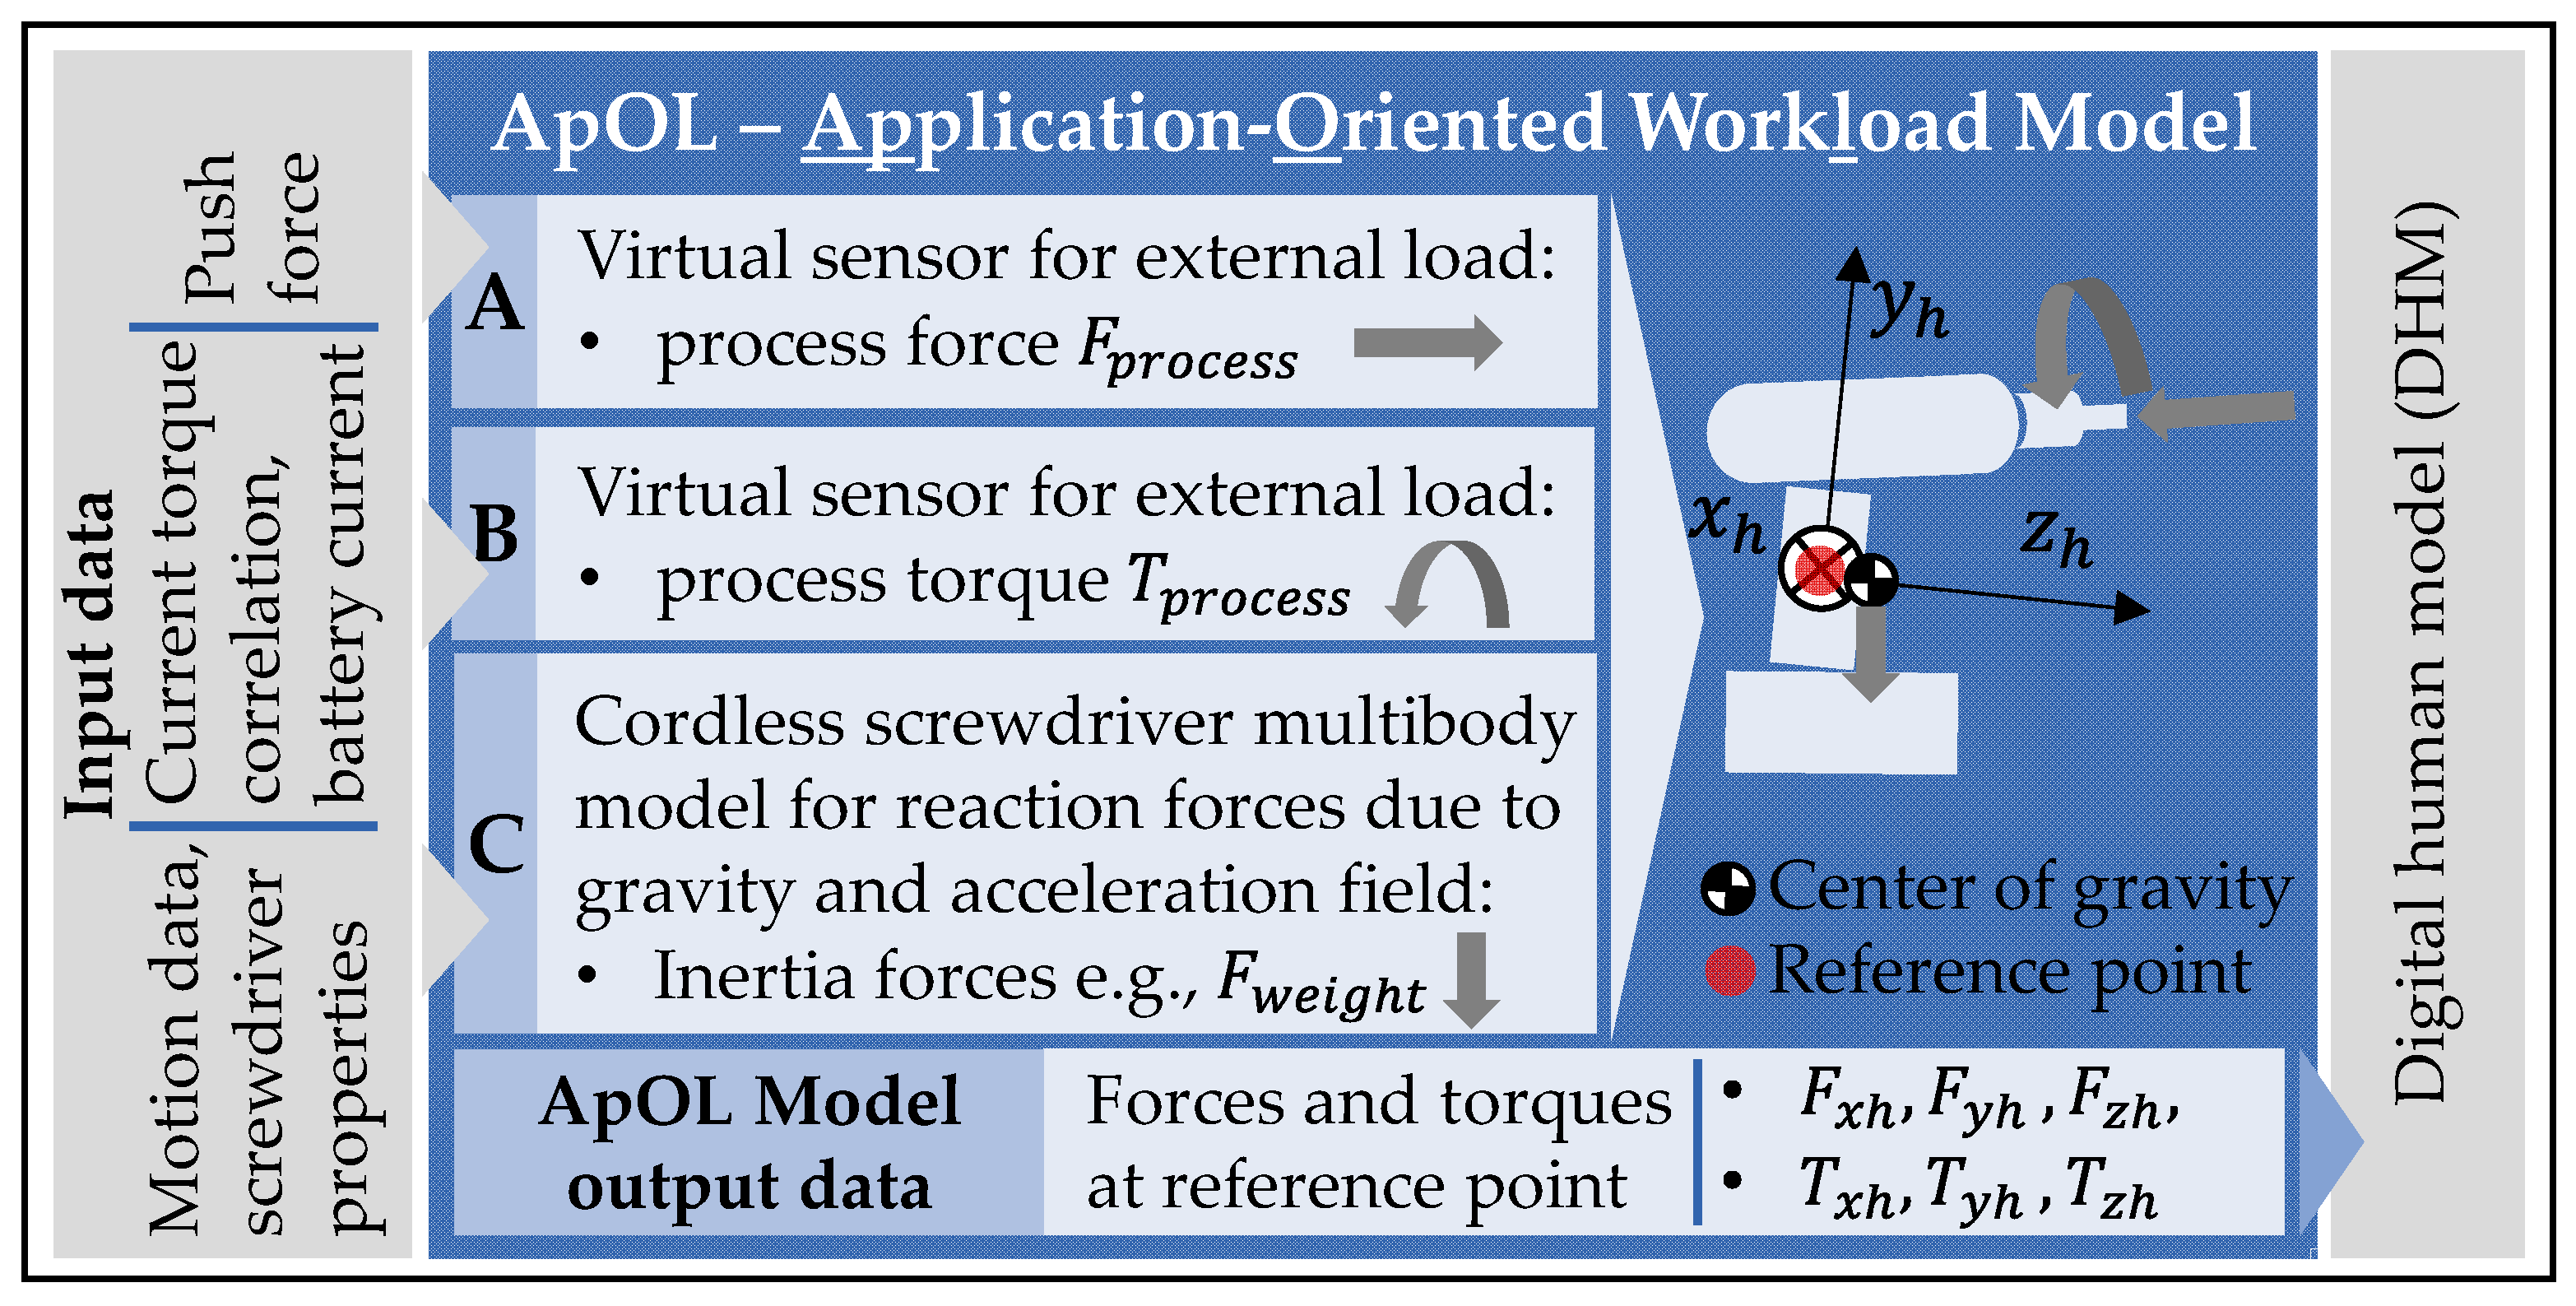
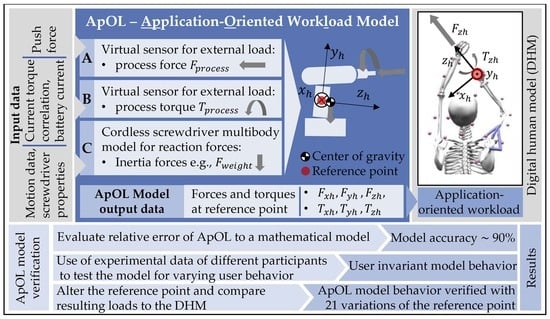
In this paper the application-oriented workload (ApOL) model is developed on the exemplary use case of a cordless screwdriver. The ApOL model combines sub-models A, B, and C to determine the interaction forces and torques onto the DHM based on the process force and torque as well as the motion of the user (see
Figure 1). The results of the respective sub-models are forces and torques which represent the loads that act on the screwdriver during application. The workload model uses experimental data from the study described by Sänger et al., 2022 [
31] and [
30] to determine the reaction forces (
) and torques (
) for the DHM while working with a screwdriver in an overhead screw-in task. To do so, the ApOL model is implemented in MATLAB Simulink and is built up as a rigid body model of the screwdriver where the resulting forces and torques from the three sub-models are applied (see
Figure 1). The input data consists of motion data captured by a Vicon motion capture system, GRF, and the battery current of a cordless screwdriver.
Sub-model A determines the external process three-dimensional force vector
based on experimentally determined push forces (calculated from the GRF).
Sub-model B uses the battery current from the experimental studies of Sänger et al., 2022 [
31] and [
30] to estimate the external process torque
acting onto the screwdriver during the screw-in process.
Sub-model C uses the human and screwdriver motion data provided by Sänger et al., 2022 [
31] to determine the load onto the DHM based on the screwdriver motion. For this purpose, a model of the screwdriver is built in MATLAB Simulink using the Simscape multibody package.
2.1. Sub-Model A: Virtual Sensor to Determine the External Process Force Based on the Experimental Users Push Force
Sub-model A aims at estimating the external process force during a work task. In our example, we chose the case of an electric screwdriver for fastening woodscrews. Here, this process force, origins from the interaction of the screwdriver with the workpiece and is necessary for function fulfillment (e.g., force for keeping a drill bit in the screw head).
The data for this sub-model is taken from Sänger et al. 2022 [
31], where the push force was investigated on three participants.
The push force
acting between the handle and the hand for all participants was calculated indirectly from the ground reaction forces of the overhead screw-in task performed by Sänger et al., 2022 [
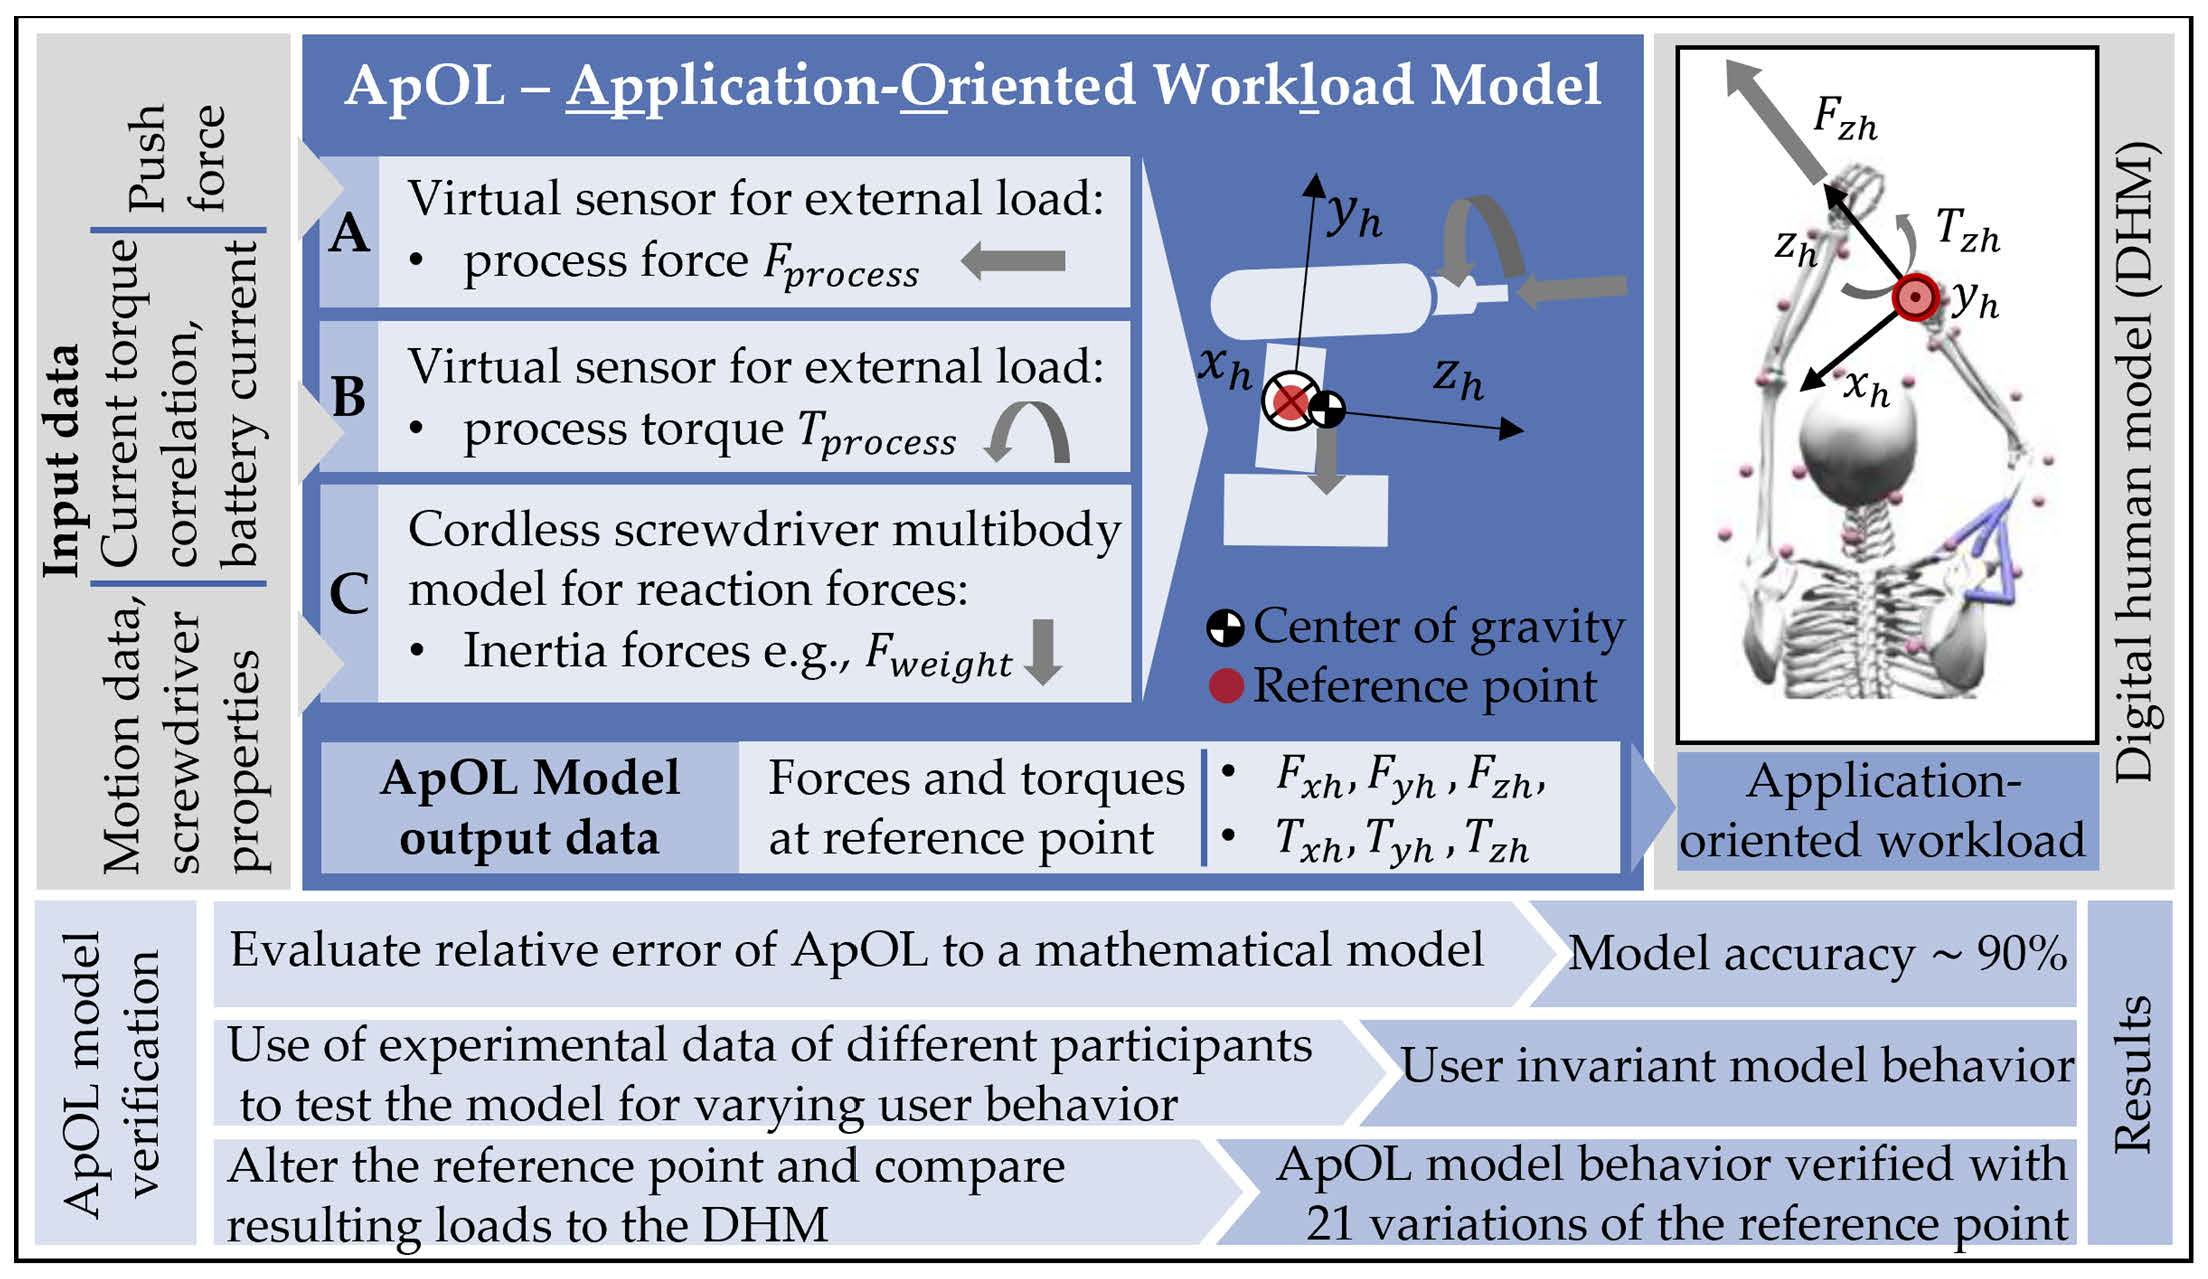
31]. Based on the data the process force acting on the bit of the screwdriver was determined using the following equation:
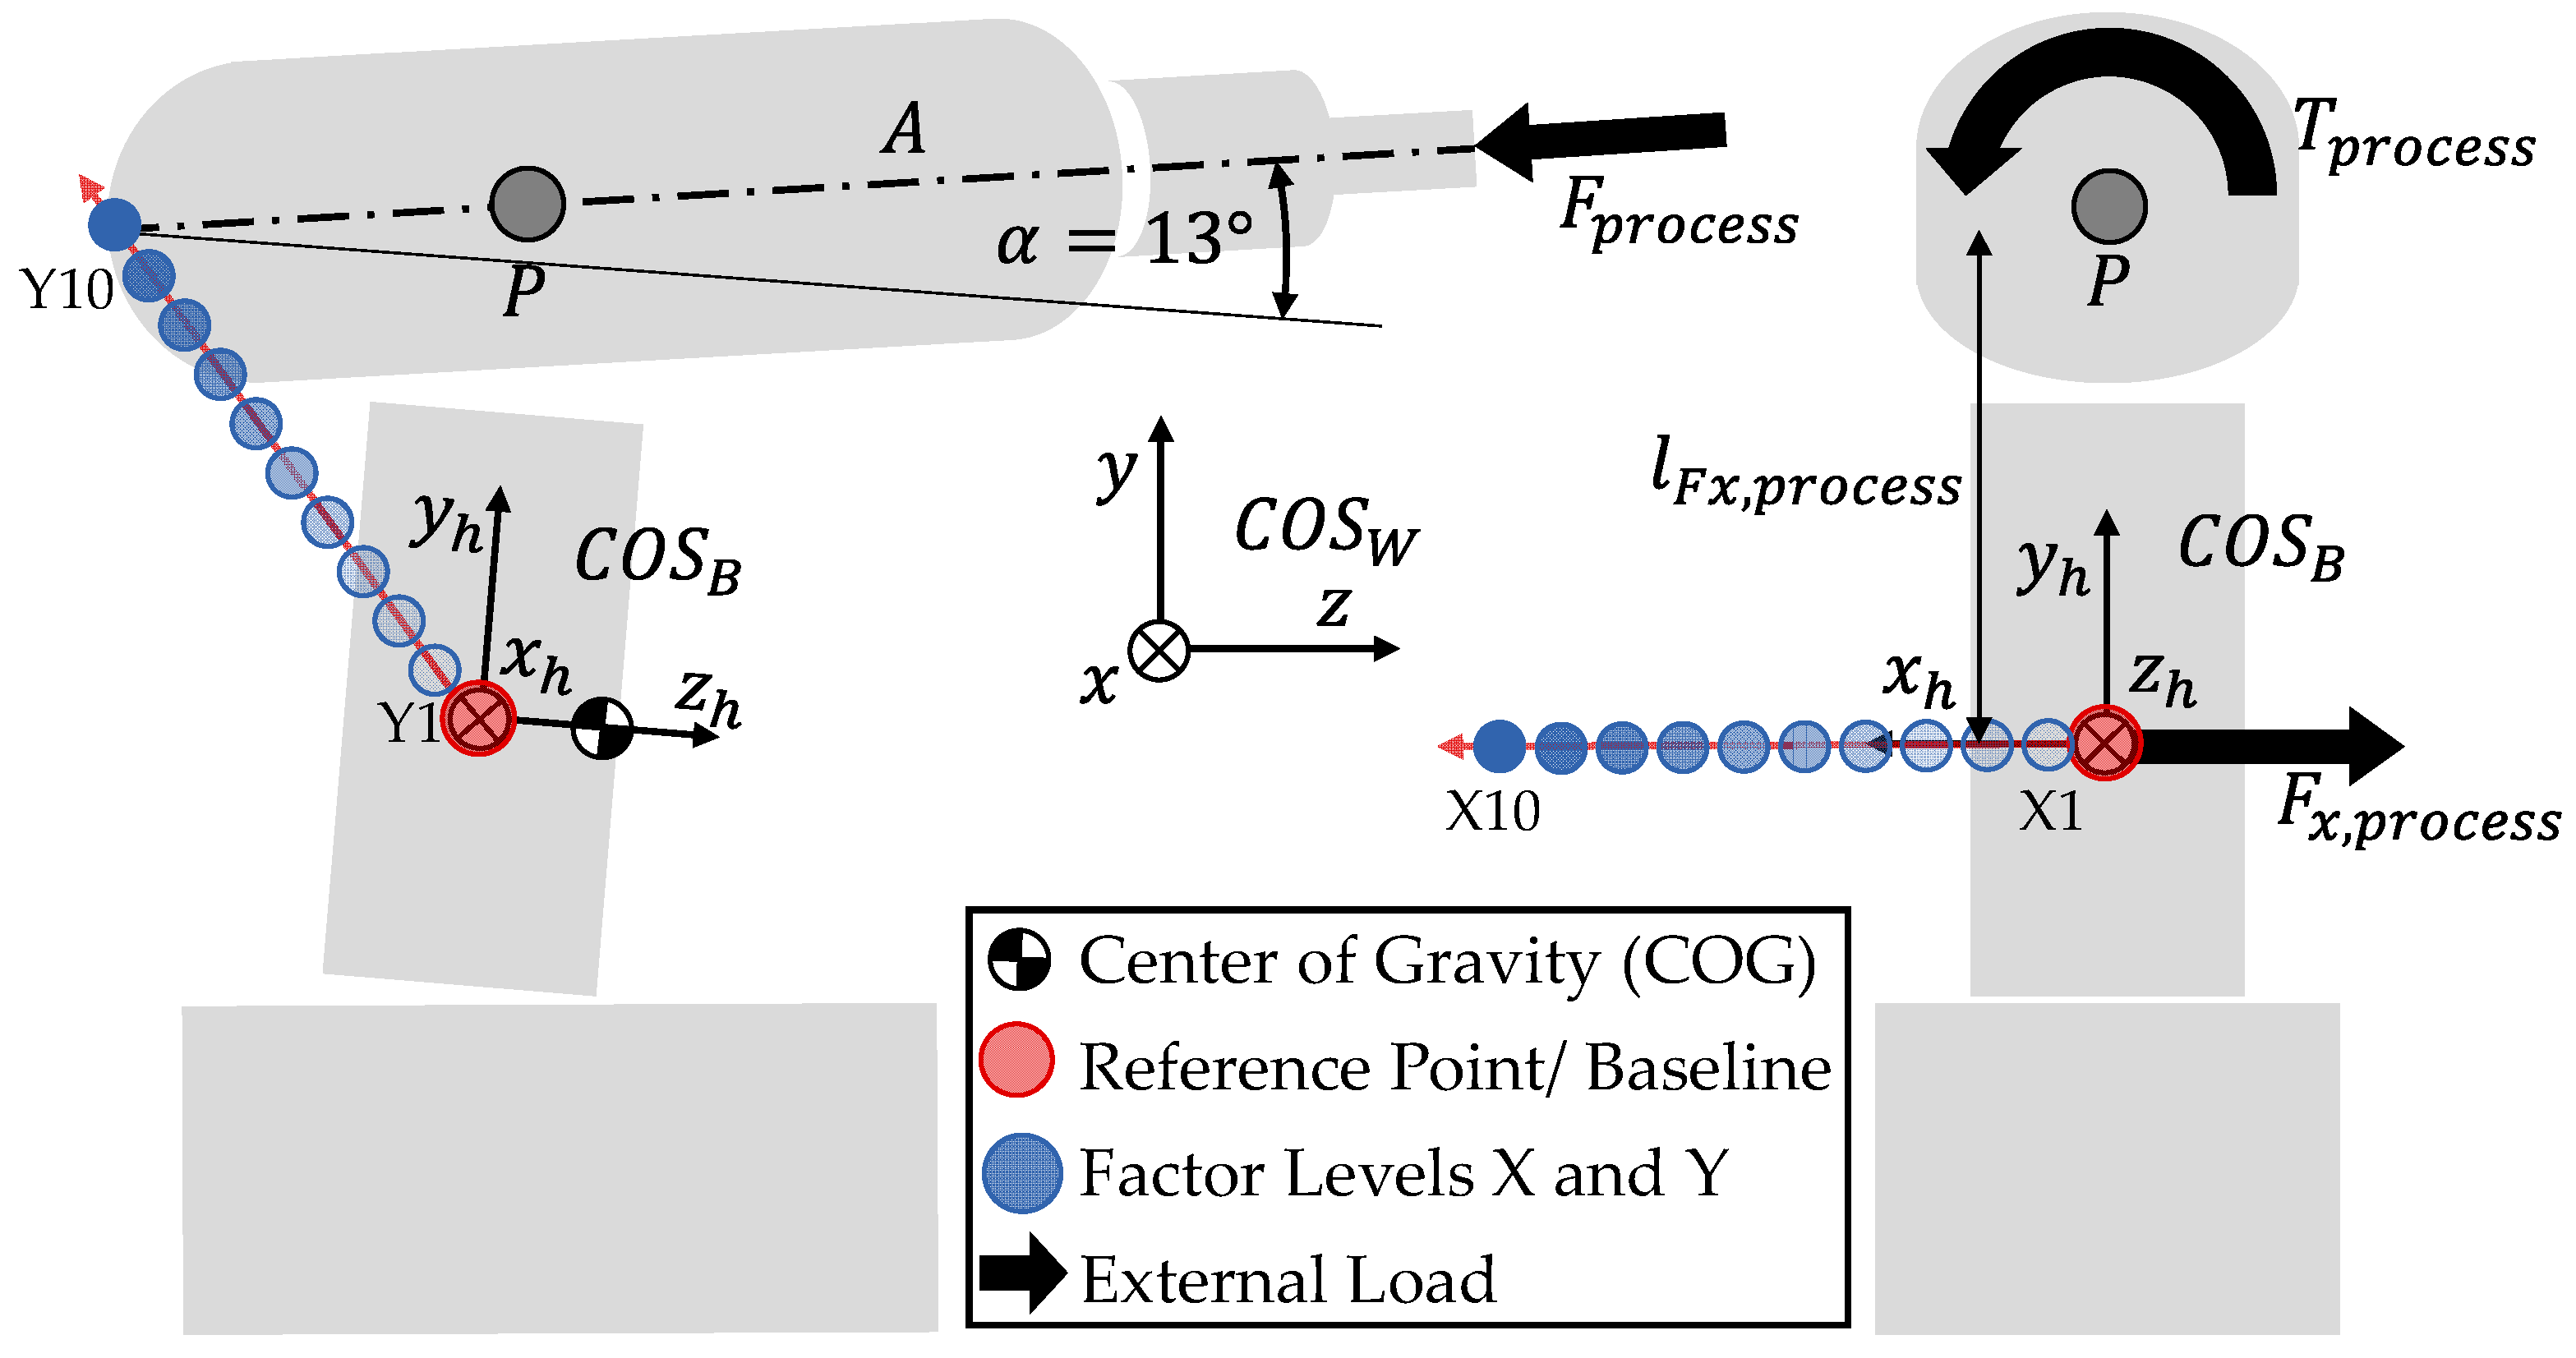
This formula assumes a close fit of the directions of the push-force and gravity-force vector. In
Figure 2a the relevant forces for determining the user load during the screw-in process are illustrated on which Equation (1) is based on. The result of the sub-model A is the process force
acting on the bit of the screwdriver during the screw-in process (see
Figure 1 and
Figure 2a).
2.2. Sub-Model B: Virtual Sensor for Determining the External Process Torque Based on the Battery Current from Experimental Data
To determine the process torque
from the experimental battery current data in the study by Sänger et al., 2022 [
31] the correlation between the process torque and the battery current of the screwdriver must be determined. In the study by Sänger et al., 2023 [
30] ten consecutive screw-in processes with the same screwdriver, screw, and wood used by Sänger et al. [
31] were performed on a custom build test bench. The screw-in torque and the battery current of the screwdriver, as well as the screw-in depth of the screw, were measured.
After interpolating all torque and battery current data to the same data length, the mean of the battery current and the torque from all ten repetitions was calculated and a correlation analysis using the least squares method was performed.
2.3. Sub-Model C: Virtual Sensor to Determine Interaction Forces on the DHM from Experimental Motion Data
As mentioned above, when determining loads of technical systems onto the user, the force of inertia and the moment of inertia as well as the mass distribution of the technical system and the external loads must be modelled.
To model the influence of the inertia as realistic as possible, real motion data captured by Sänger et al., 2022 [
31] during their experiments was used as an input. A detailed demonstration of a movement cycle for the overhead screw-in task is given in [
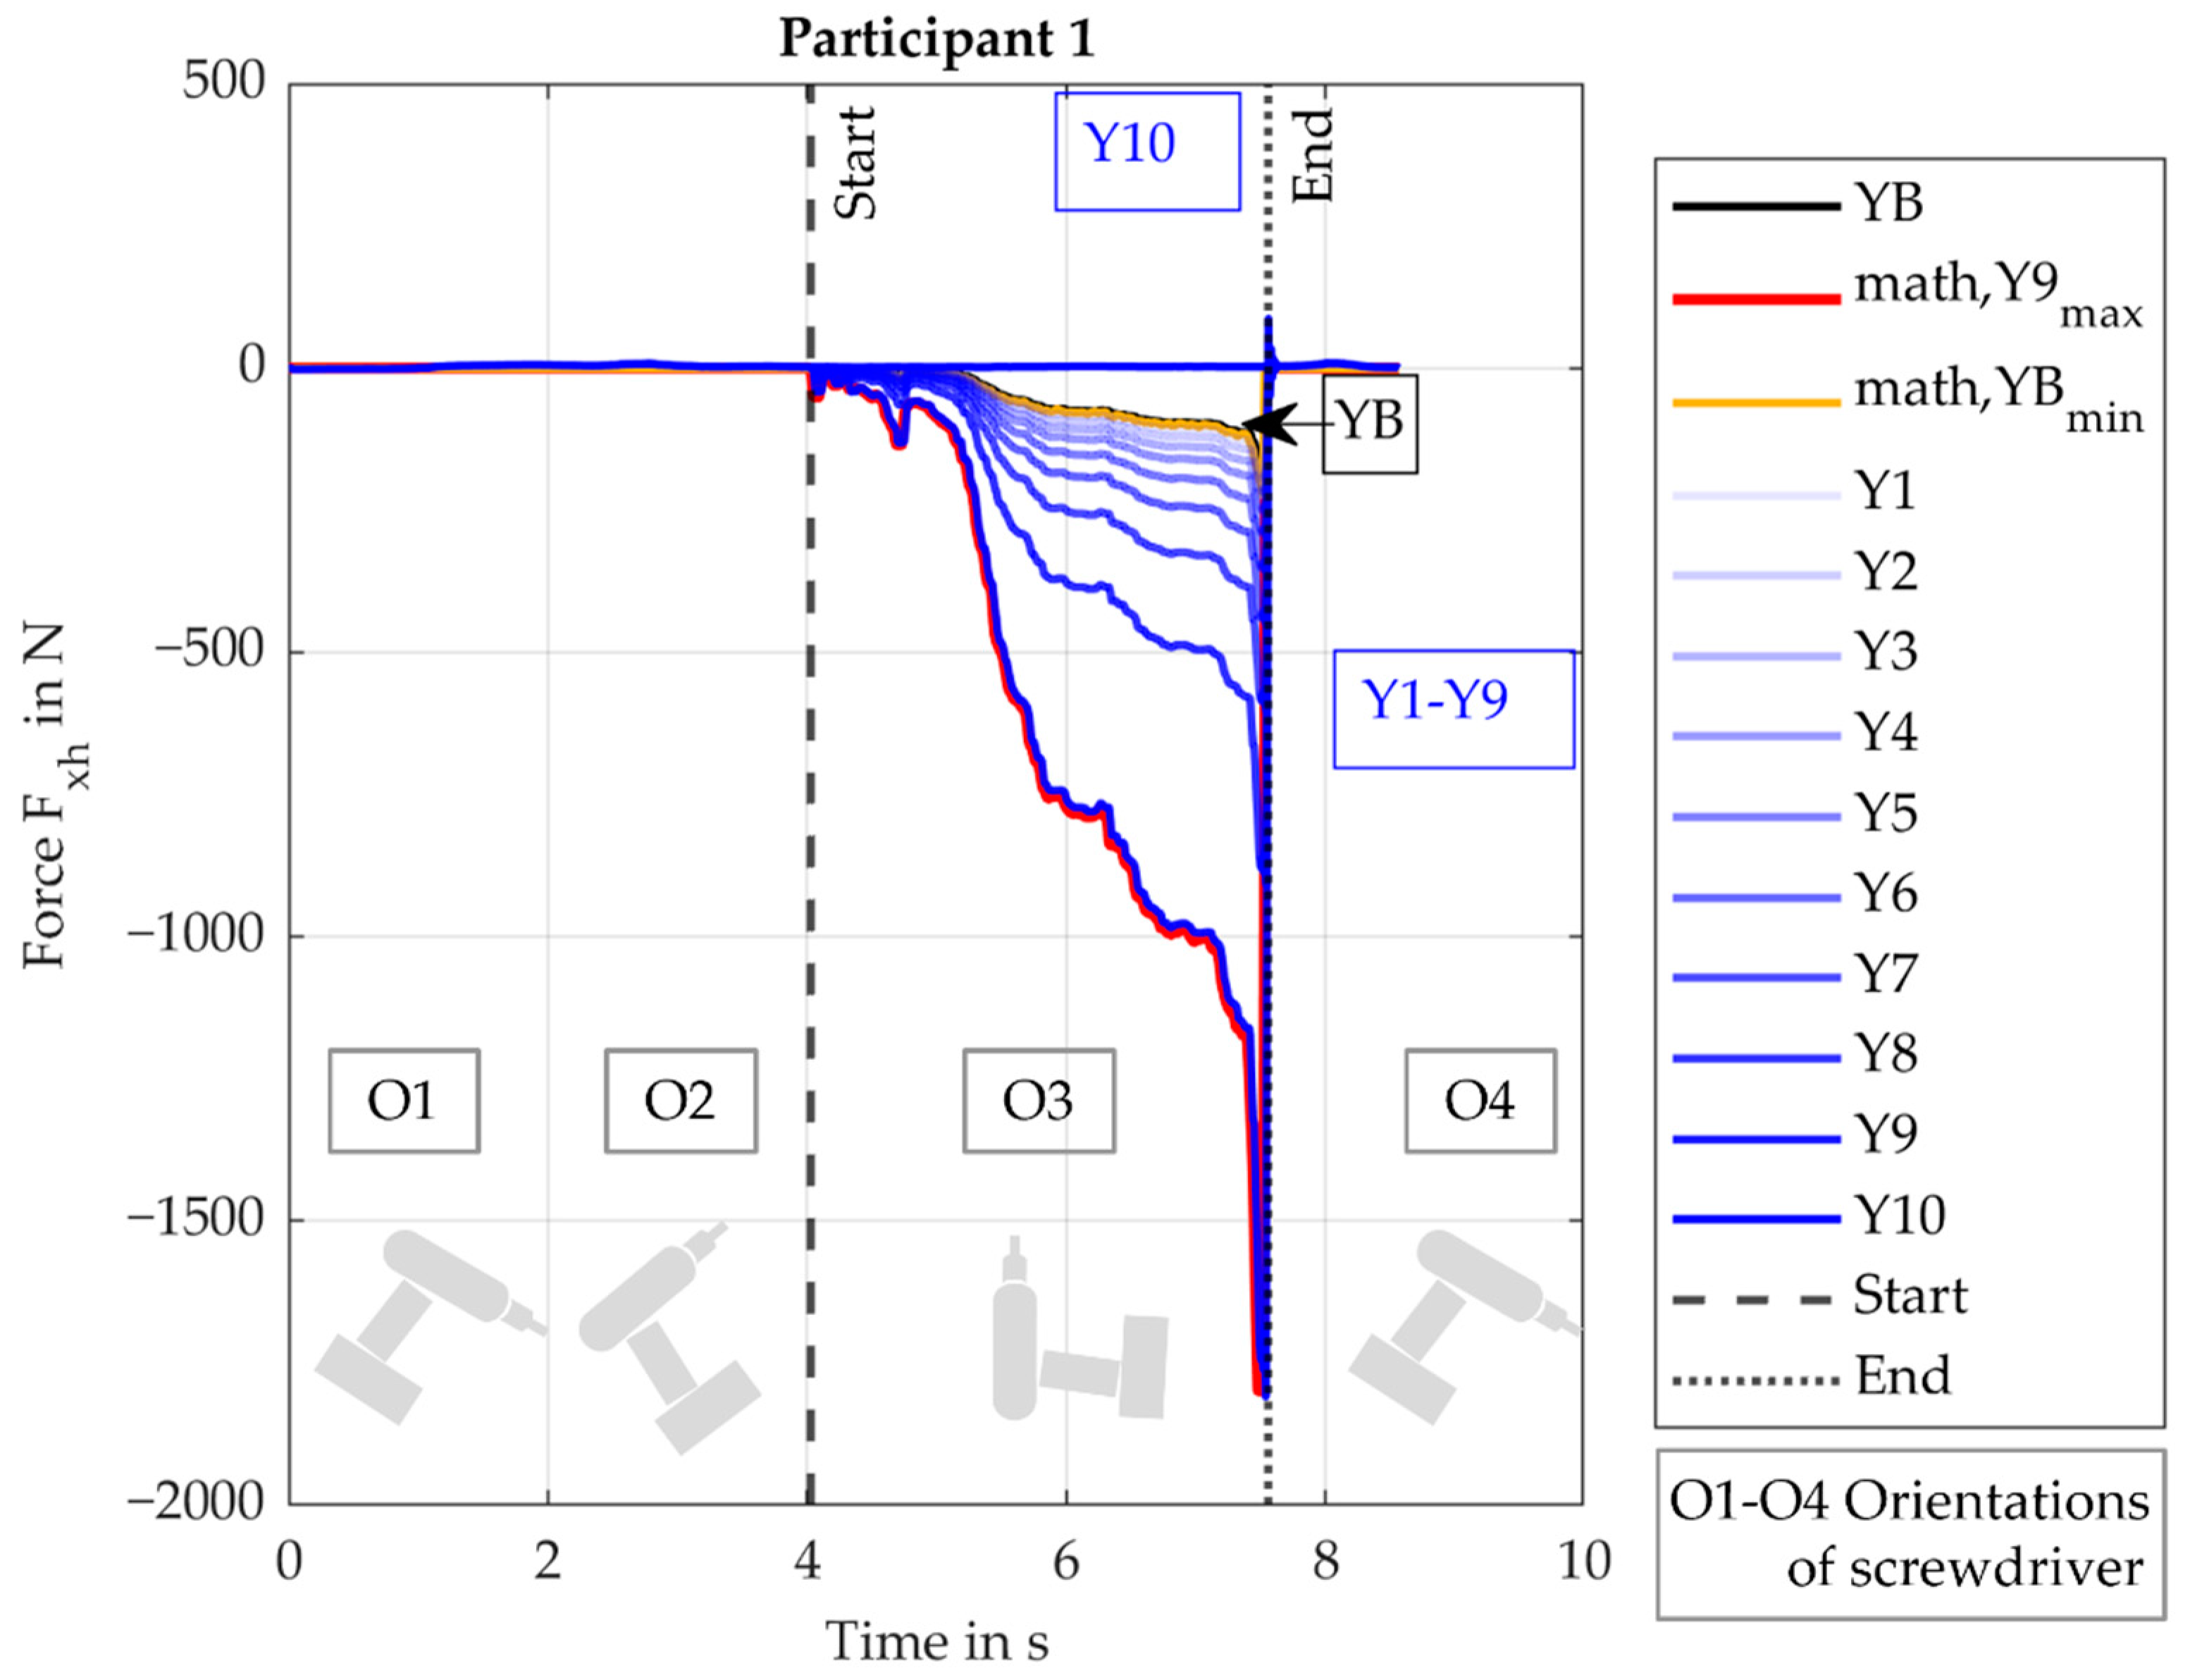
25]. During the movement cycle of the performed overhead task, there are four screwdriver orientations. The initial position is referred to as (O1) holding the screwdriver, while the orientation of the screwdriver while being rotated upwards is referred to as (O2). During the screw-in process, the drilling axle of the screwdriver faces directly upwards (O3). After the screw-in process, the screwdriver is brought to its final position (O4), which is similar to its initial position (O1).
The experimental motion data of the participant and the screwdriver (in total six markers were used for the screwdriver, three on each side) was used as an input for this musculoskeletal human model [
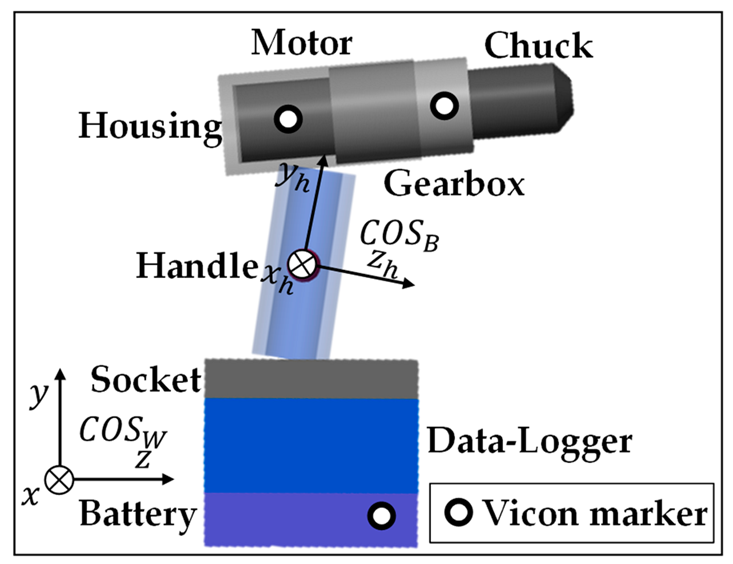
36] to determine the three translational degrees of freedom (DoF) and the three rotational DoF of the screwdriver for each motion cycle. The output motion data of the DHM describes the translation and rotation of the body-fixed
at the reference point of the screwdriver in relation to the world-fixed
(see
Figure 2a,b and
Table 1). The experimental data for three participants P3, P4, and P5 from the study by Sänger et al., 2022 [
31] were used. In this paper, these participants are labeled as P1, P2, and P3.
The Festool PDC 18/4 screwdriver was modelled in Simscape Multibody using its real geometric parameters and mass (-distribution). Therefore, the components of the screwdriver were disassembled and weighted separately. A list of the modelled components with their weight can be found in
Table 1. The visual representation of the model created in MATLAB Simulink as well as the dimensions of the components can be found in
Appendix A.
2.4. Application-Oriented Workload Model-ApOL Model
The ApOL model combines sub-models A, B, and C to determine the interaction forces and torques onto the DHM based on the process force and torque as well as the motion of the user (see
Figure 1). The ApOL model is implemented in MATLAB Simulink.
The external torque onto the screwdriver were determined by the virtual sensor and the external force was provided indirectly by the push force, as described above. These two results from the sub-models A and B were used together with sub-model C to build up the ApOL model.
The loads on the human (forces (
) and torques (
)) are calculated in one point, called the reference point, located at the middle of the handle in the MATLAB Simulink model (see
Figure 3). The motion data is also passed into the model at this reference point. The external loads (
) are added to the screwdriver at the point of applied load. The process force
is applied at the tip of the screwdriver along the drilling axis
while the process torque
acts around the drilling axis
. Since the drilling axis is not parallel to the
-axis and has an offset of
,
and
has components in the
- and
-axis. During a screw-in process, the user must withstand the process torque
from the motor by applying a counteraction force at the handle resulting in a counteracting torque. Thus,
is converted to a force
using the lever
between point
on the drilling axis
and reference point. This force acts along the
-axis of body-fixed coordinate system (
) of the screwdriver. The body-fixed
is implemented according to ISO 10068 [
37] (see
Figure 3). The
-axis is collinear to the forearm of the user-facing away from him. The
-axis is colinear to the centerline of the handle, thus the
-axis is perpendicular to the handle centerline (see
Figure 3).
The load on the human (forces and torques) is calculated by MATLAB Simulink in the body-fixed coordinate system . To eliminate the noise, a 50th-order one-dimensional median filter was applied using the “medfilt1”-function built into MATLAB.
2.5. Verification of the ApOL Model
For the verification of the ApOL model two separate steps were taken: First the simulation results of the forces () and torques () are compared to basic analytical considerations of the mathematical model. Second, a parameter study was conducted which shows the influence of the location of the reference point (handle position) on the user load.
Considering the first part of the verification, the comparison between the ApOL simulation model and the
mathematical model, the mathematical model consists of the process forces and torques as well as the mass of the screwdriver. Since the direction of the weight force vector changes in the body fixed
when the screwdriver is moved around, the calculated values for
and
were only determined for the duration of the screw-in process as the screwdriver’s position is fixed upwards (see
Section 2.3 motion phase O3). Outside of the screw-in phase, the process force and torque values were set to zero. This is also due to the fact, that the process forces and torques only occur during the screw-in process. The mathematical model calculates the maximum and minimum force (
) and torque (
) values only during the screw-in process. The formulas for the maximum and minimum force and torque values can be found in
Appendix A in
Table A2.
The ApOL model is verified by comparing the forces ) and torques of the mathematical model and the ApOL model. The mean-absolute-error (MAE) is calculated since the value of the force/torque is important for the load on the user. In addition, the relative MAE (rMAE) is calculated by dividing the MAE by the corresponding mean force or torque value. The rMAE is used to evaluate the deviation between the participants.
To show the importance of modelling the mass, for in the variation of X1–X10 (X variation), the maximum calculated force, , without the mass was also calculated.
The second part of the verification of the ApOL model is a
parameter study. The parameter study was conducted to further verify the ApOL model. In total 21 cases were analyzed. To verify the model’s behavior, the reference point was altered along the three coordinates axis and the change in the load was analyzed. The initial design of the screwdriver was used as the baseline of the model. Here, x, y, and z coordinates were equal to zero (origin of
). According to the sub-model C, the center of gravity (COG) is located slightly in front of the baseline point along the
-axis (see
Figure 3). The values of the x-, y-, and z-coordinates describe the displacement of the reference point in relation to the baseline in the body-fixed coordinate system
.
For the first set of parameters, the values of y- and z-coordinate were varied in ten steps from the baseline (YB) to the drill axis (see
Table 2 and
Table 3). The value for the x-coordinate was not changed for these cases. This variation of the reference point represents a successive relocation of the original handle of the screwdriver to the backside of the motor assembly, putting the forearm axis in line with the drilling axis.
For the second set of parameters, only the value of the x-coordinate was varied in ten equal steps from the baseline (XB) to a maximum X10 (see
Figure 3). The altered values for these setups can be found in
Table 3. The cases are named X1–X10.
4. Discussion
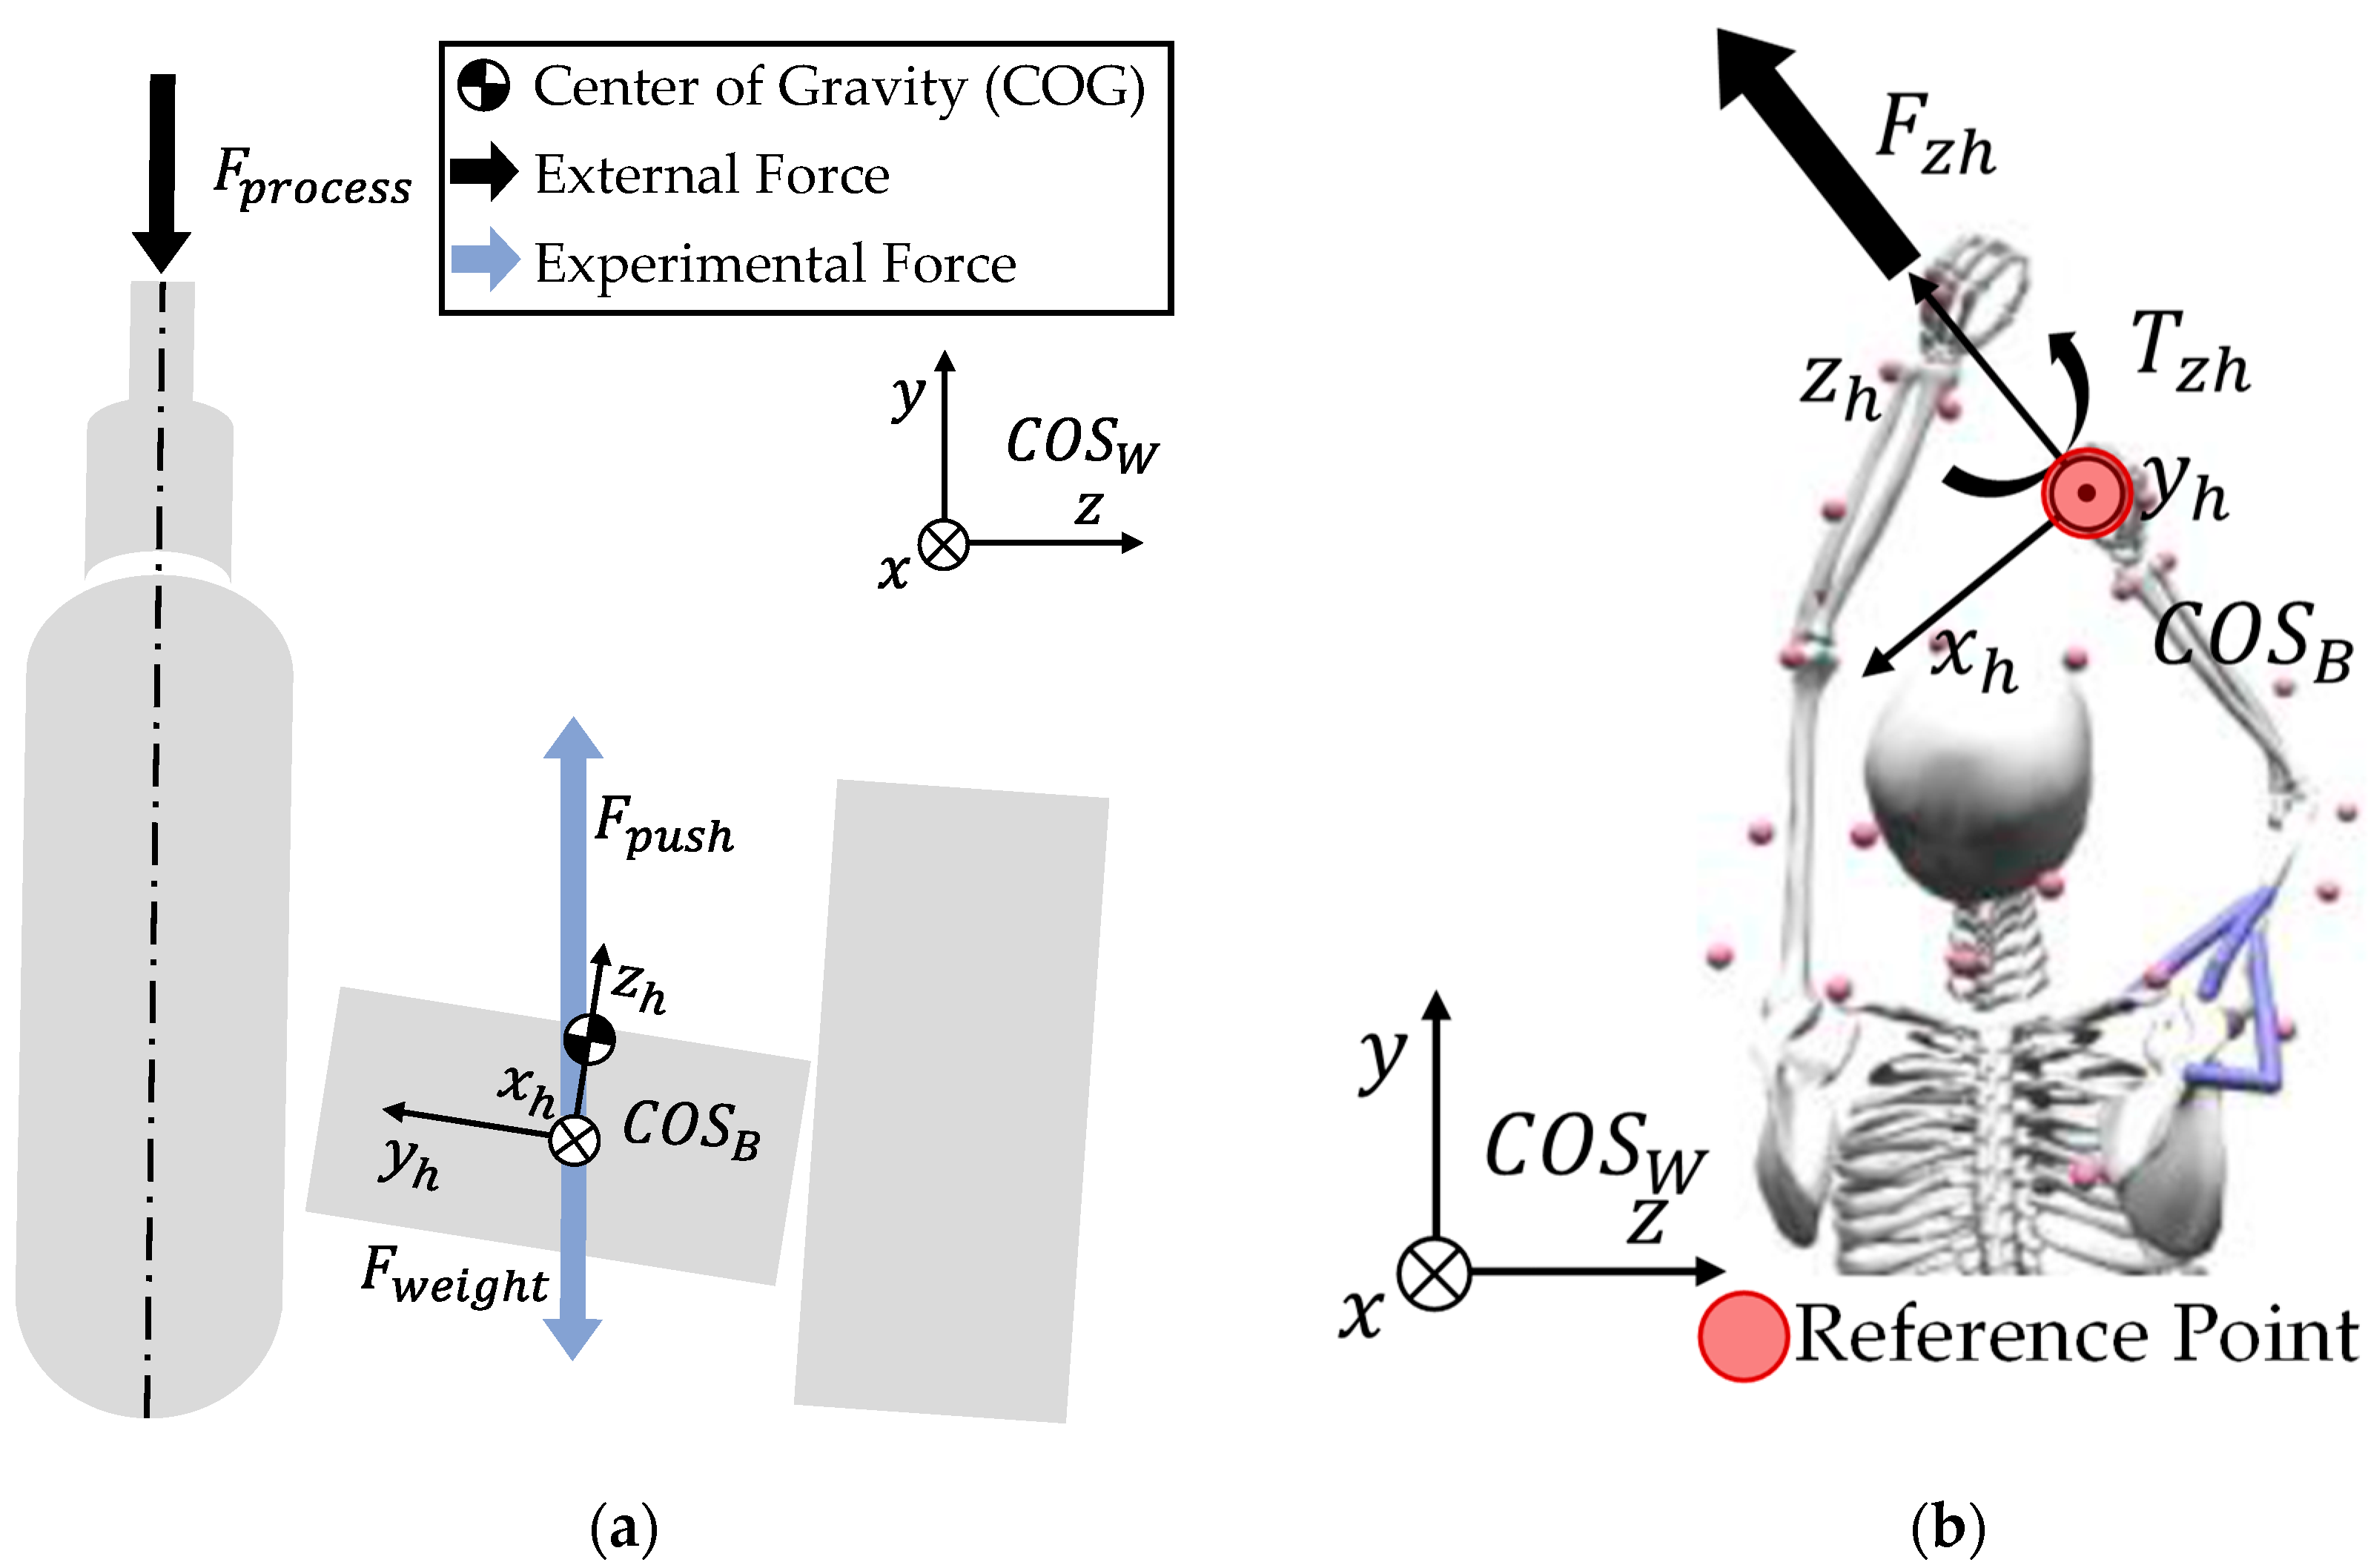
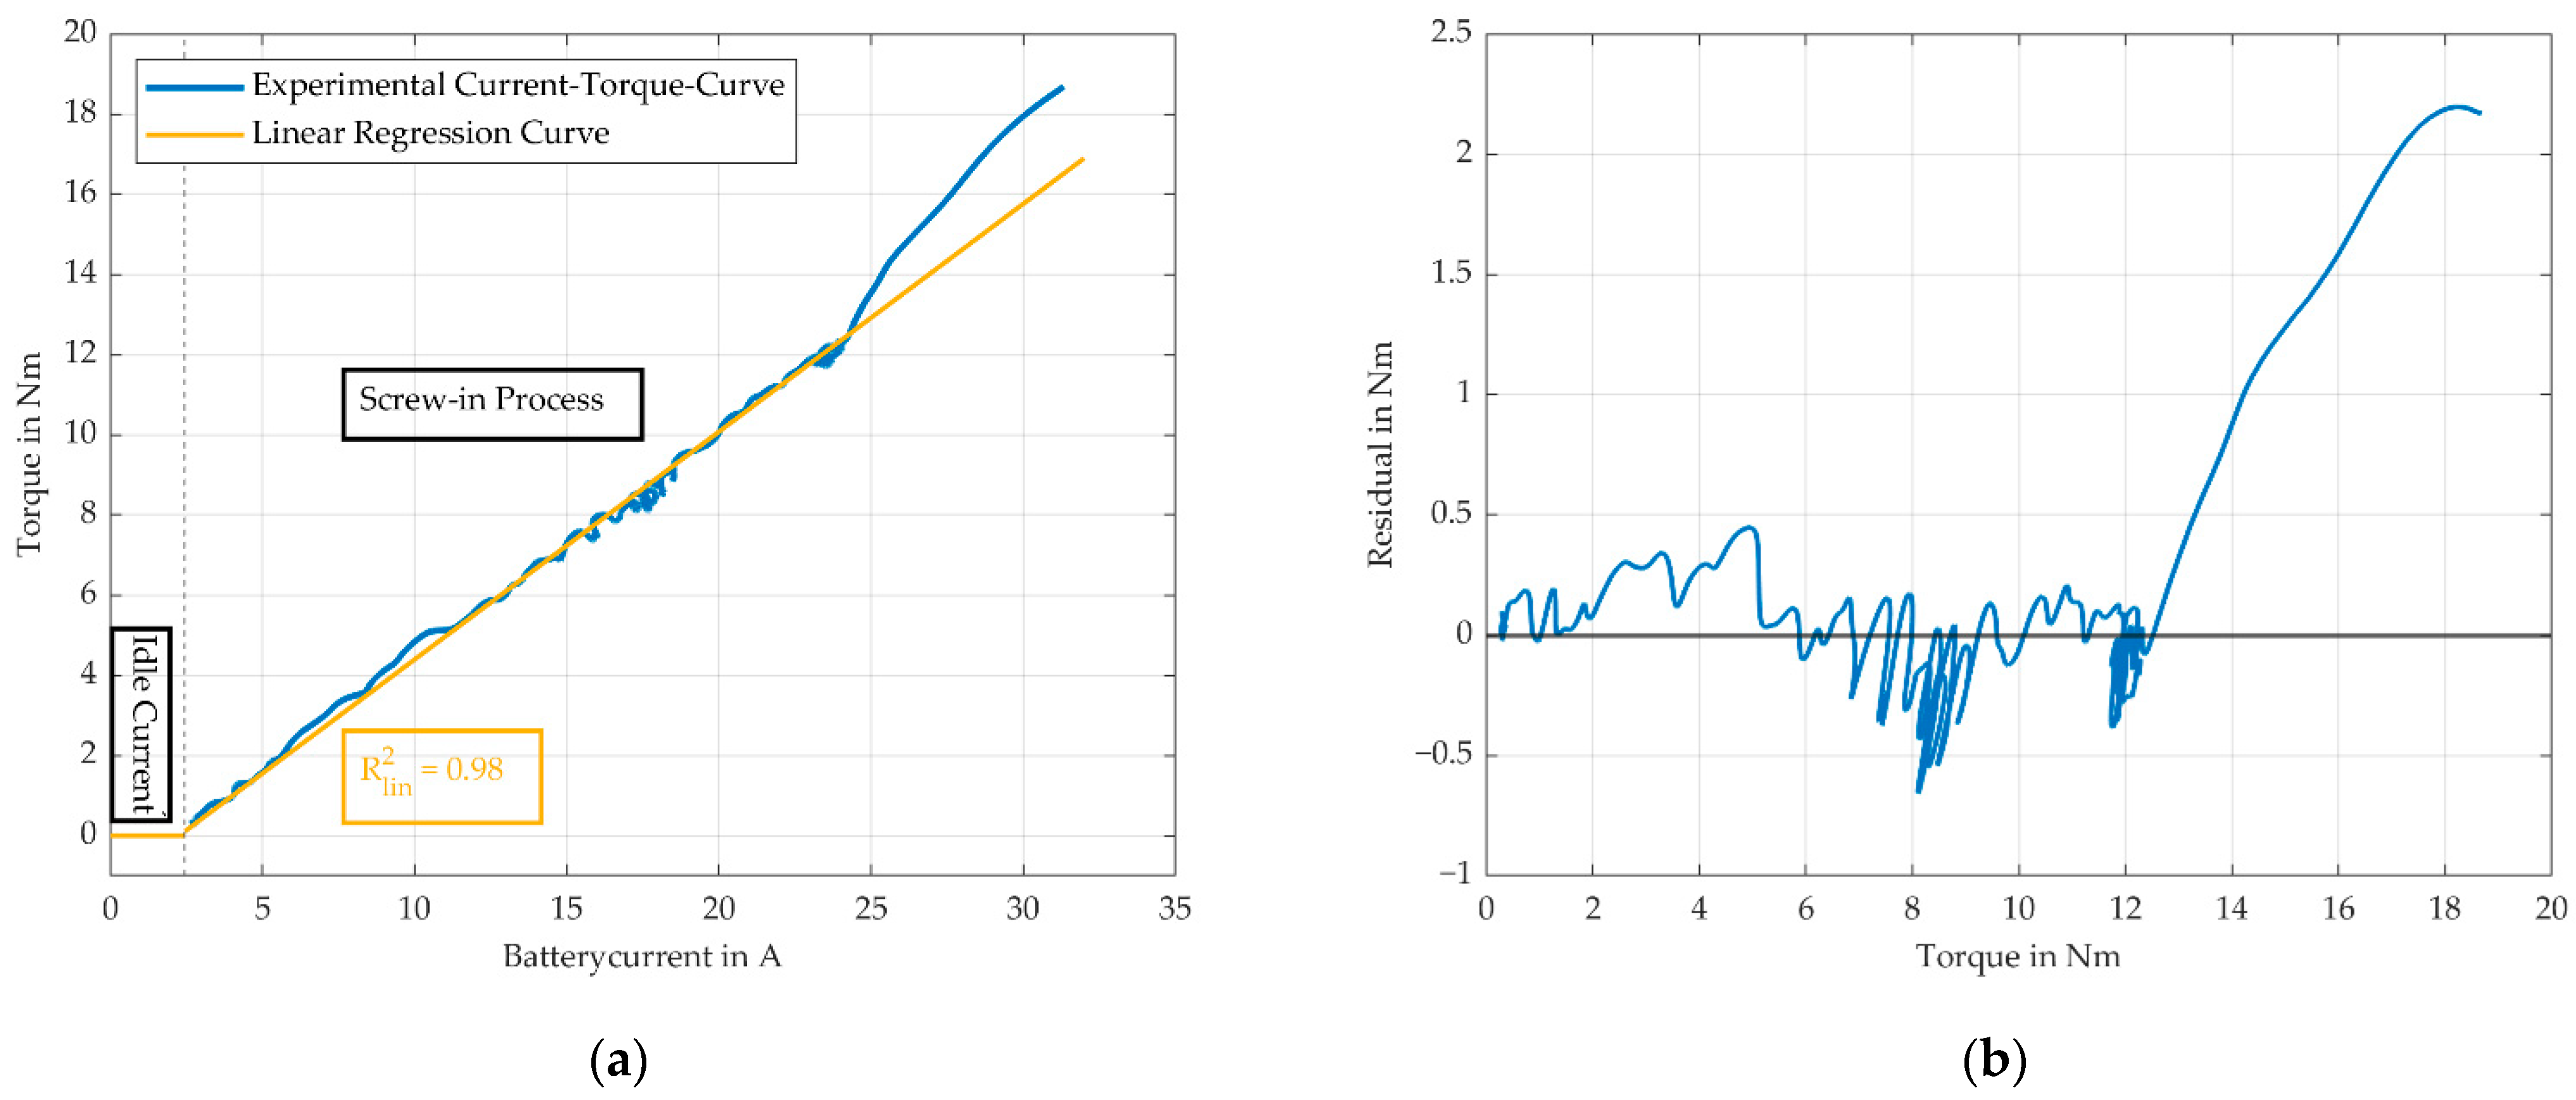
The correlation between the process torque and the battery current shows an acceptable coefficient of determination (R = 98%). Only for torque values higher than 12 Nm, a relative error of 15.2% can be seen, which is still reasonable since these torques only occur for a very short amount of time during the screw-in process.
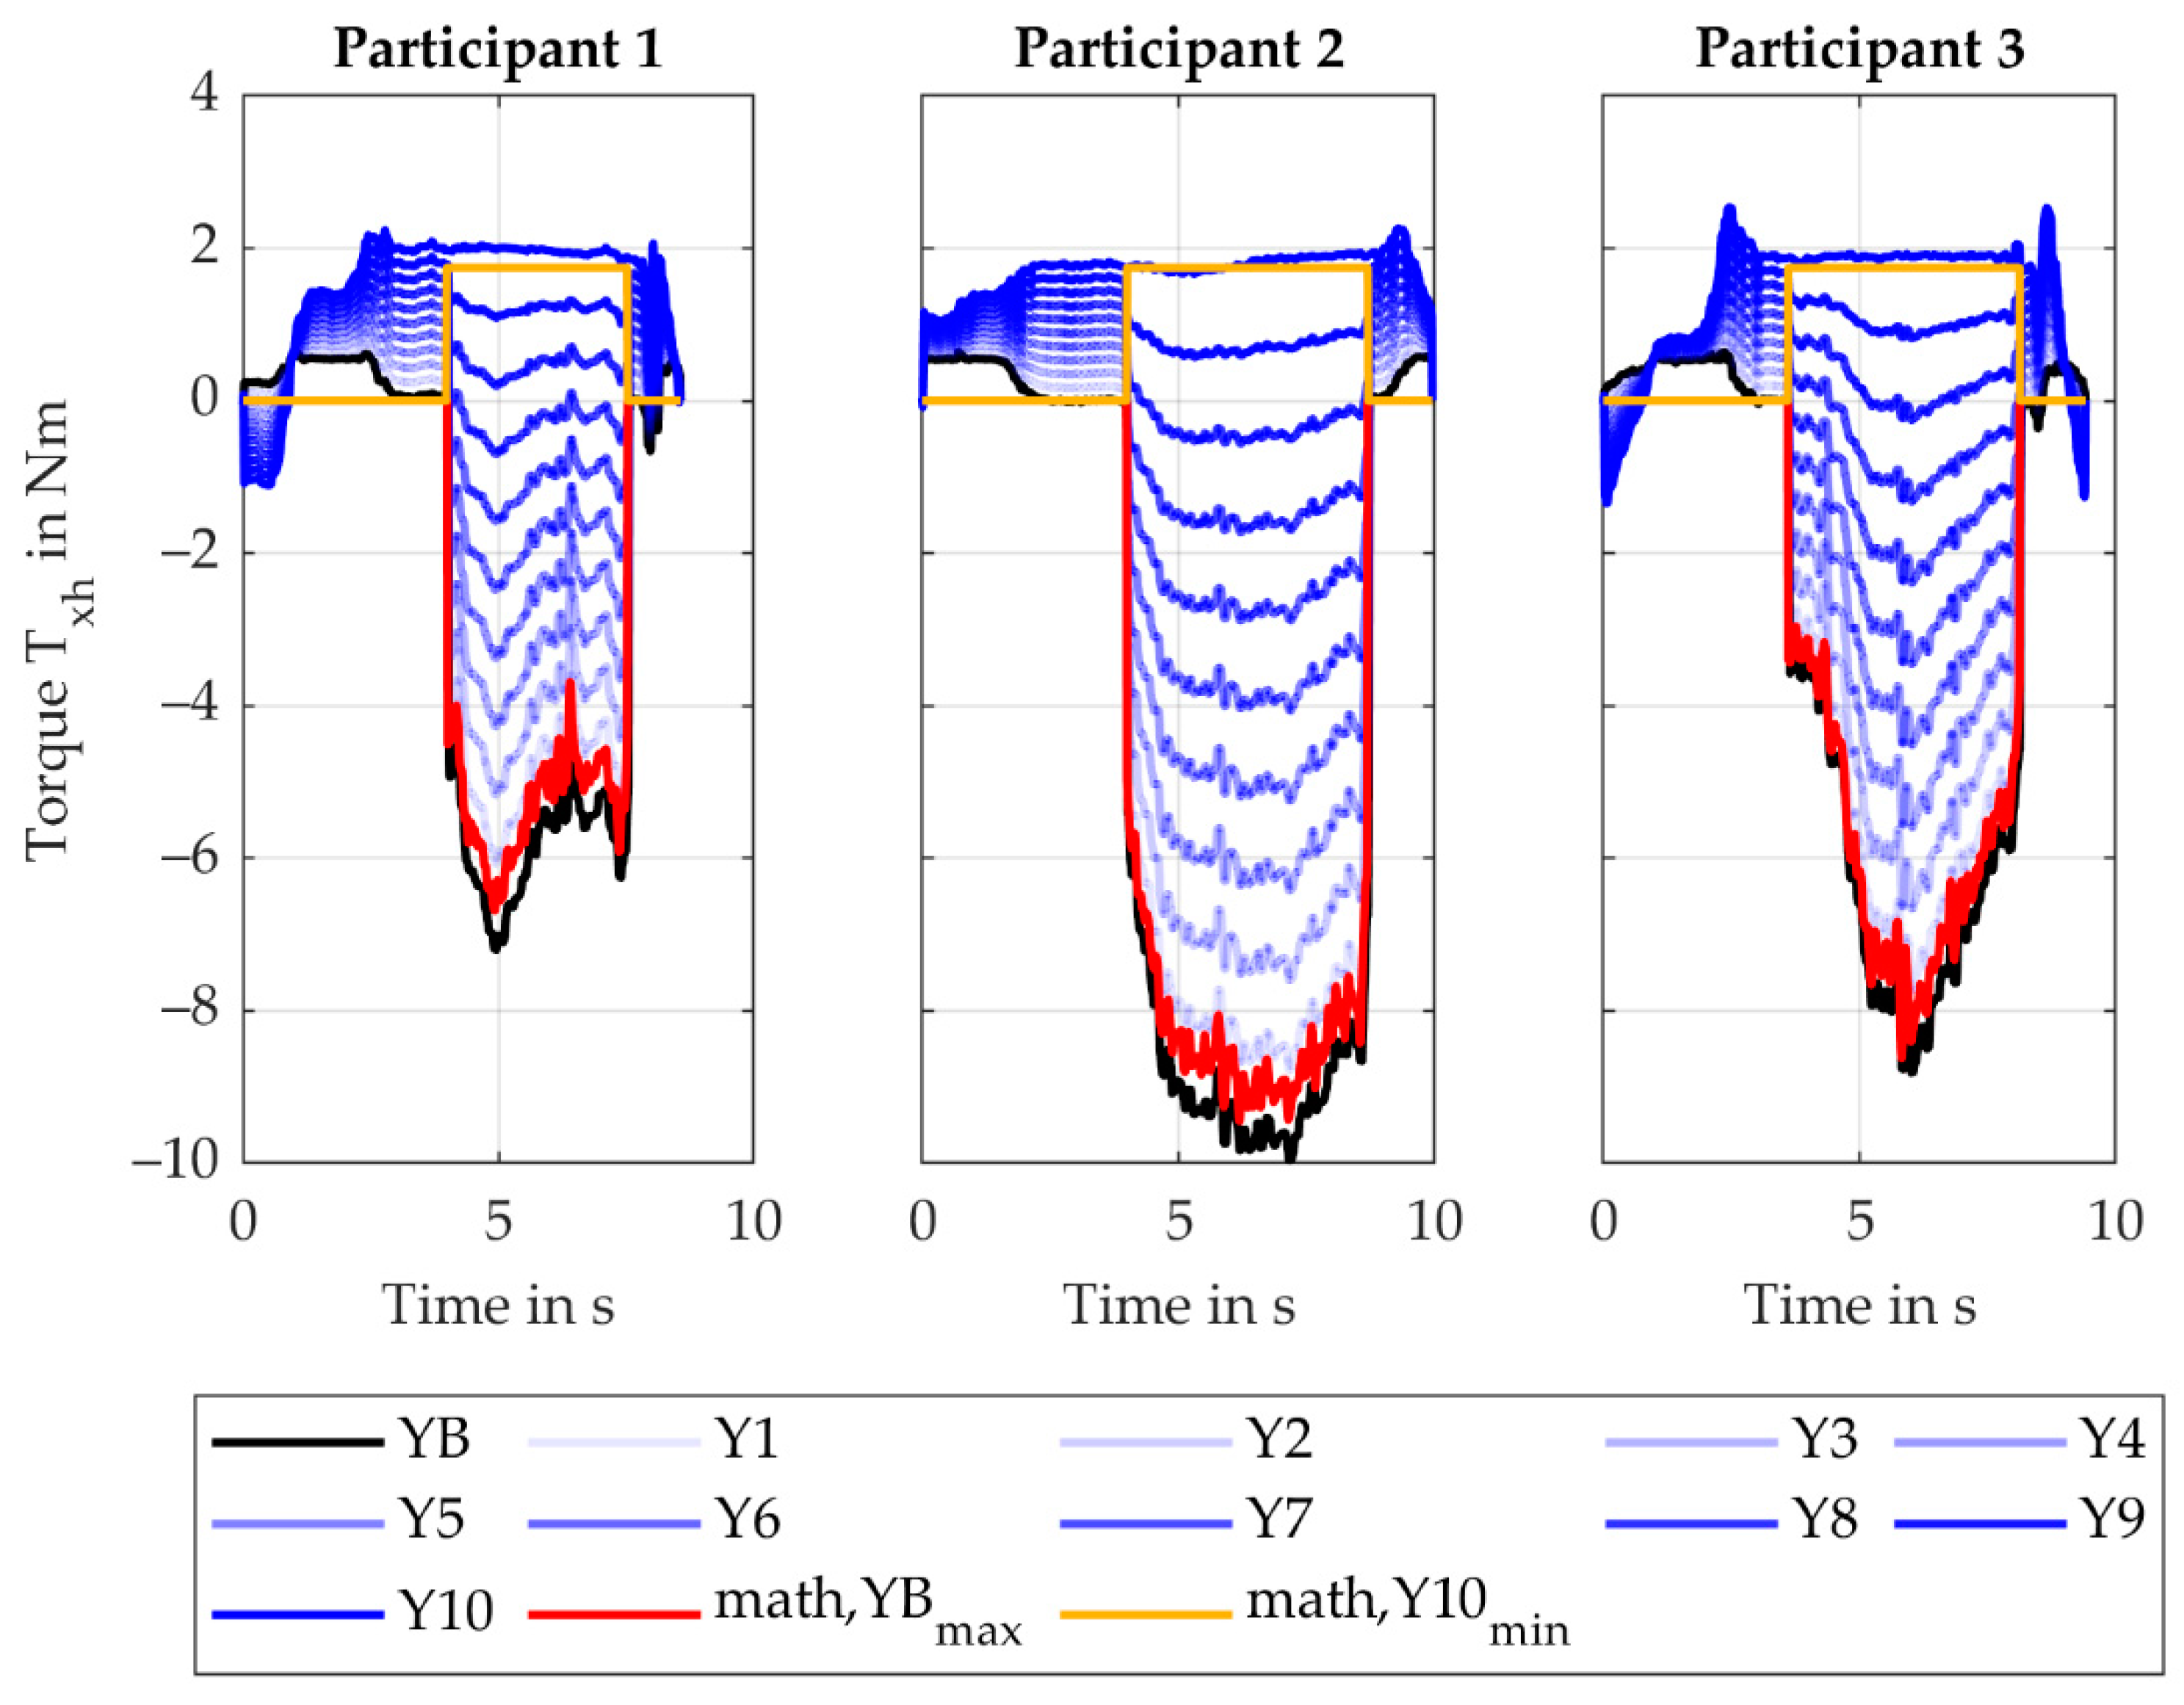
The force (force direction is perpendicular to handle- and drill-axis) for the Y-variation behaves as expected and is determined by the simulation model with a rMAE of 11.4% (SD 4.6%). An increase from the baseline (YB) to Y9 fits the assumption of inverse proportionality between and the lever.
Since the Torque (torque leads to radial/ulnar deviation of the wrist) for the Y-variation is mainly influenced by , decreasing the lever reduces the torque. This effect overlays with a torque induced by moving the reference point away from the COG. This results in an increasingly robust design moving from the baseline (YB) to Y10. The ApOL model is able to determine the torque with rMAE of 8.5% (SD 4.5%). However, the MAE of the torque is 0.5 Nm (SD 0.1 Nm).
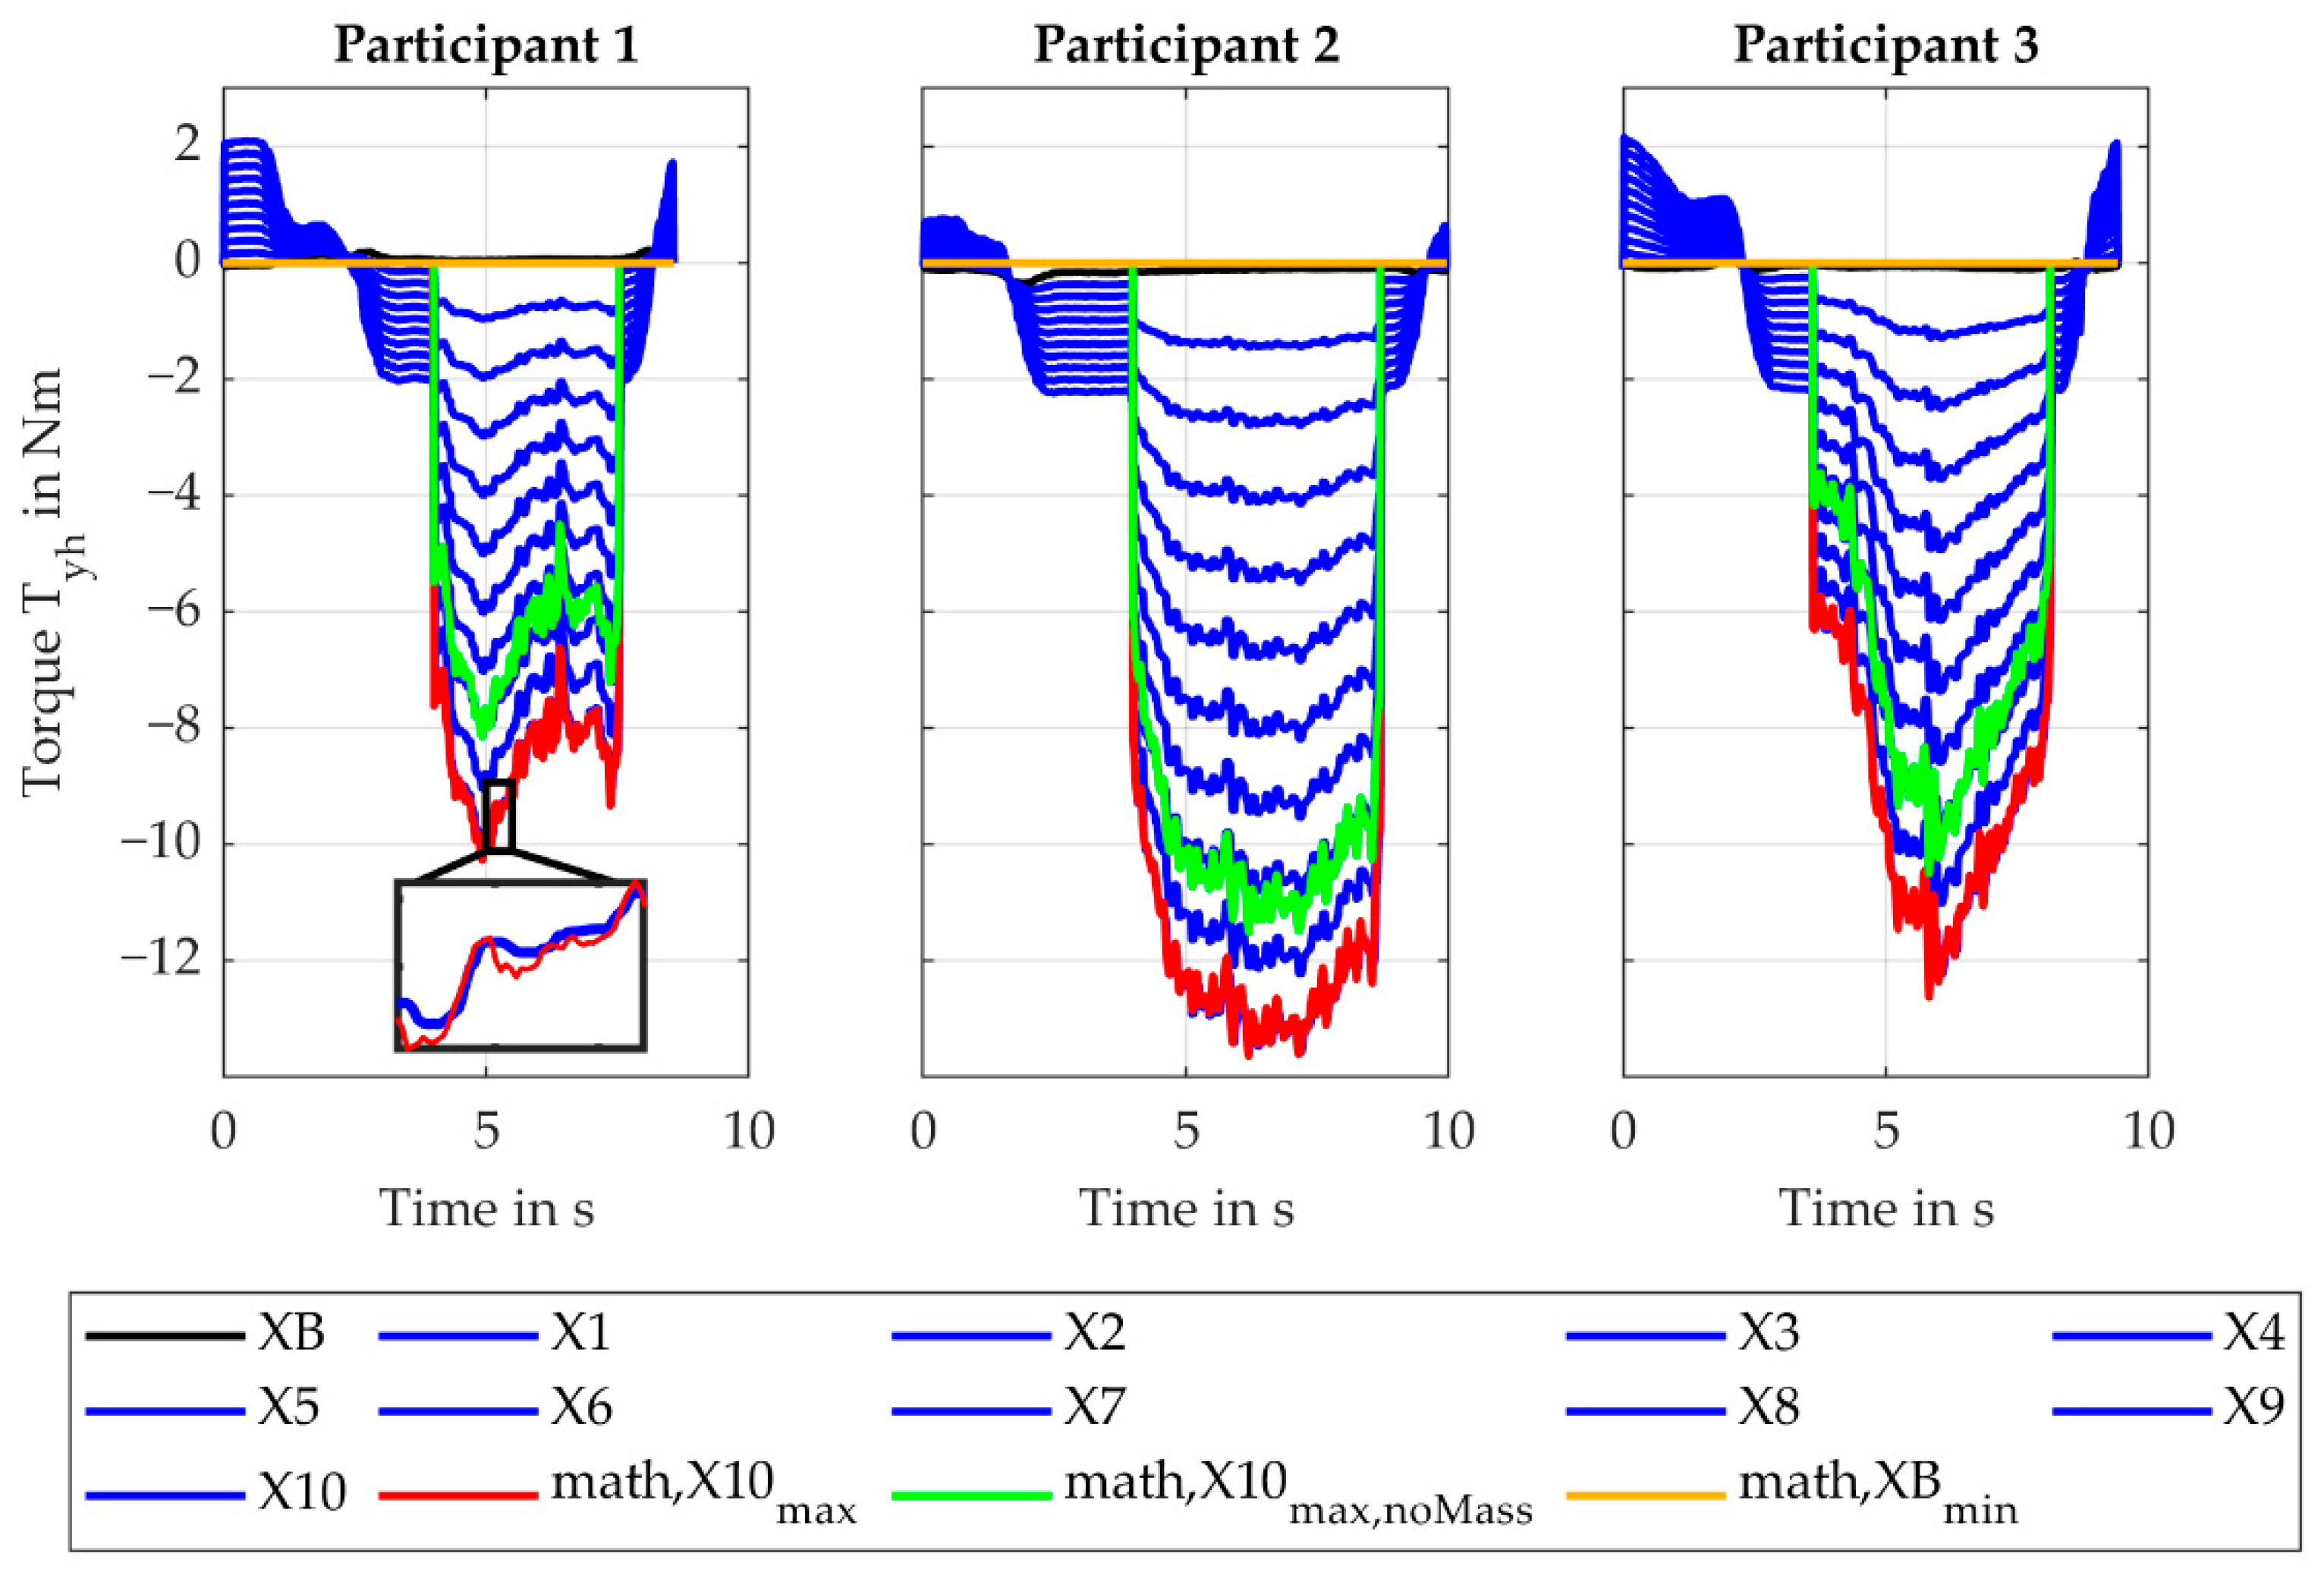
The increase in the torque (torque leads to extension/flexion of the wrist, torque along the handle axis) for the X-variation from the XB to X10 is caused by increasing the distance between the reference point and the drill axis. This causes the -component of to induce an increasing torque. The rMAE of is 1.7% (SD 0.6%).
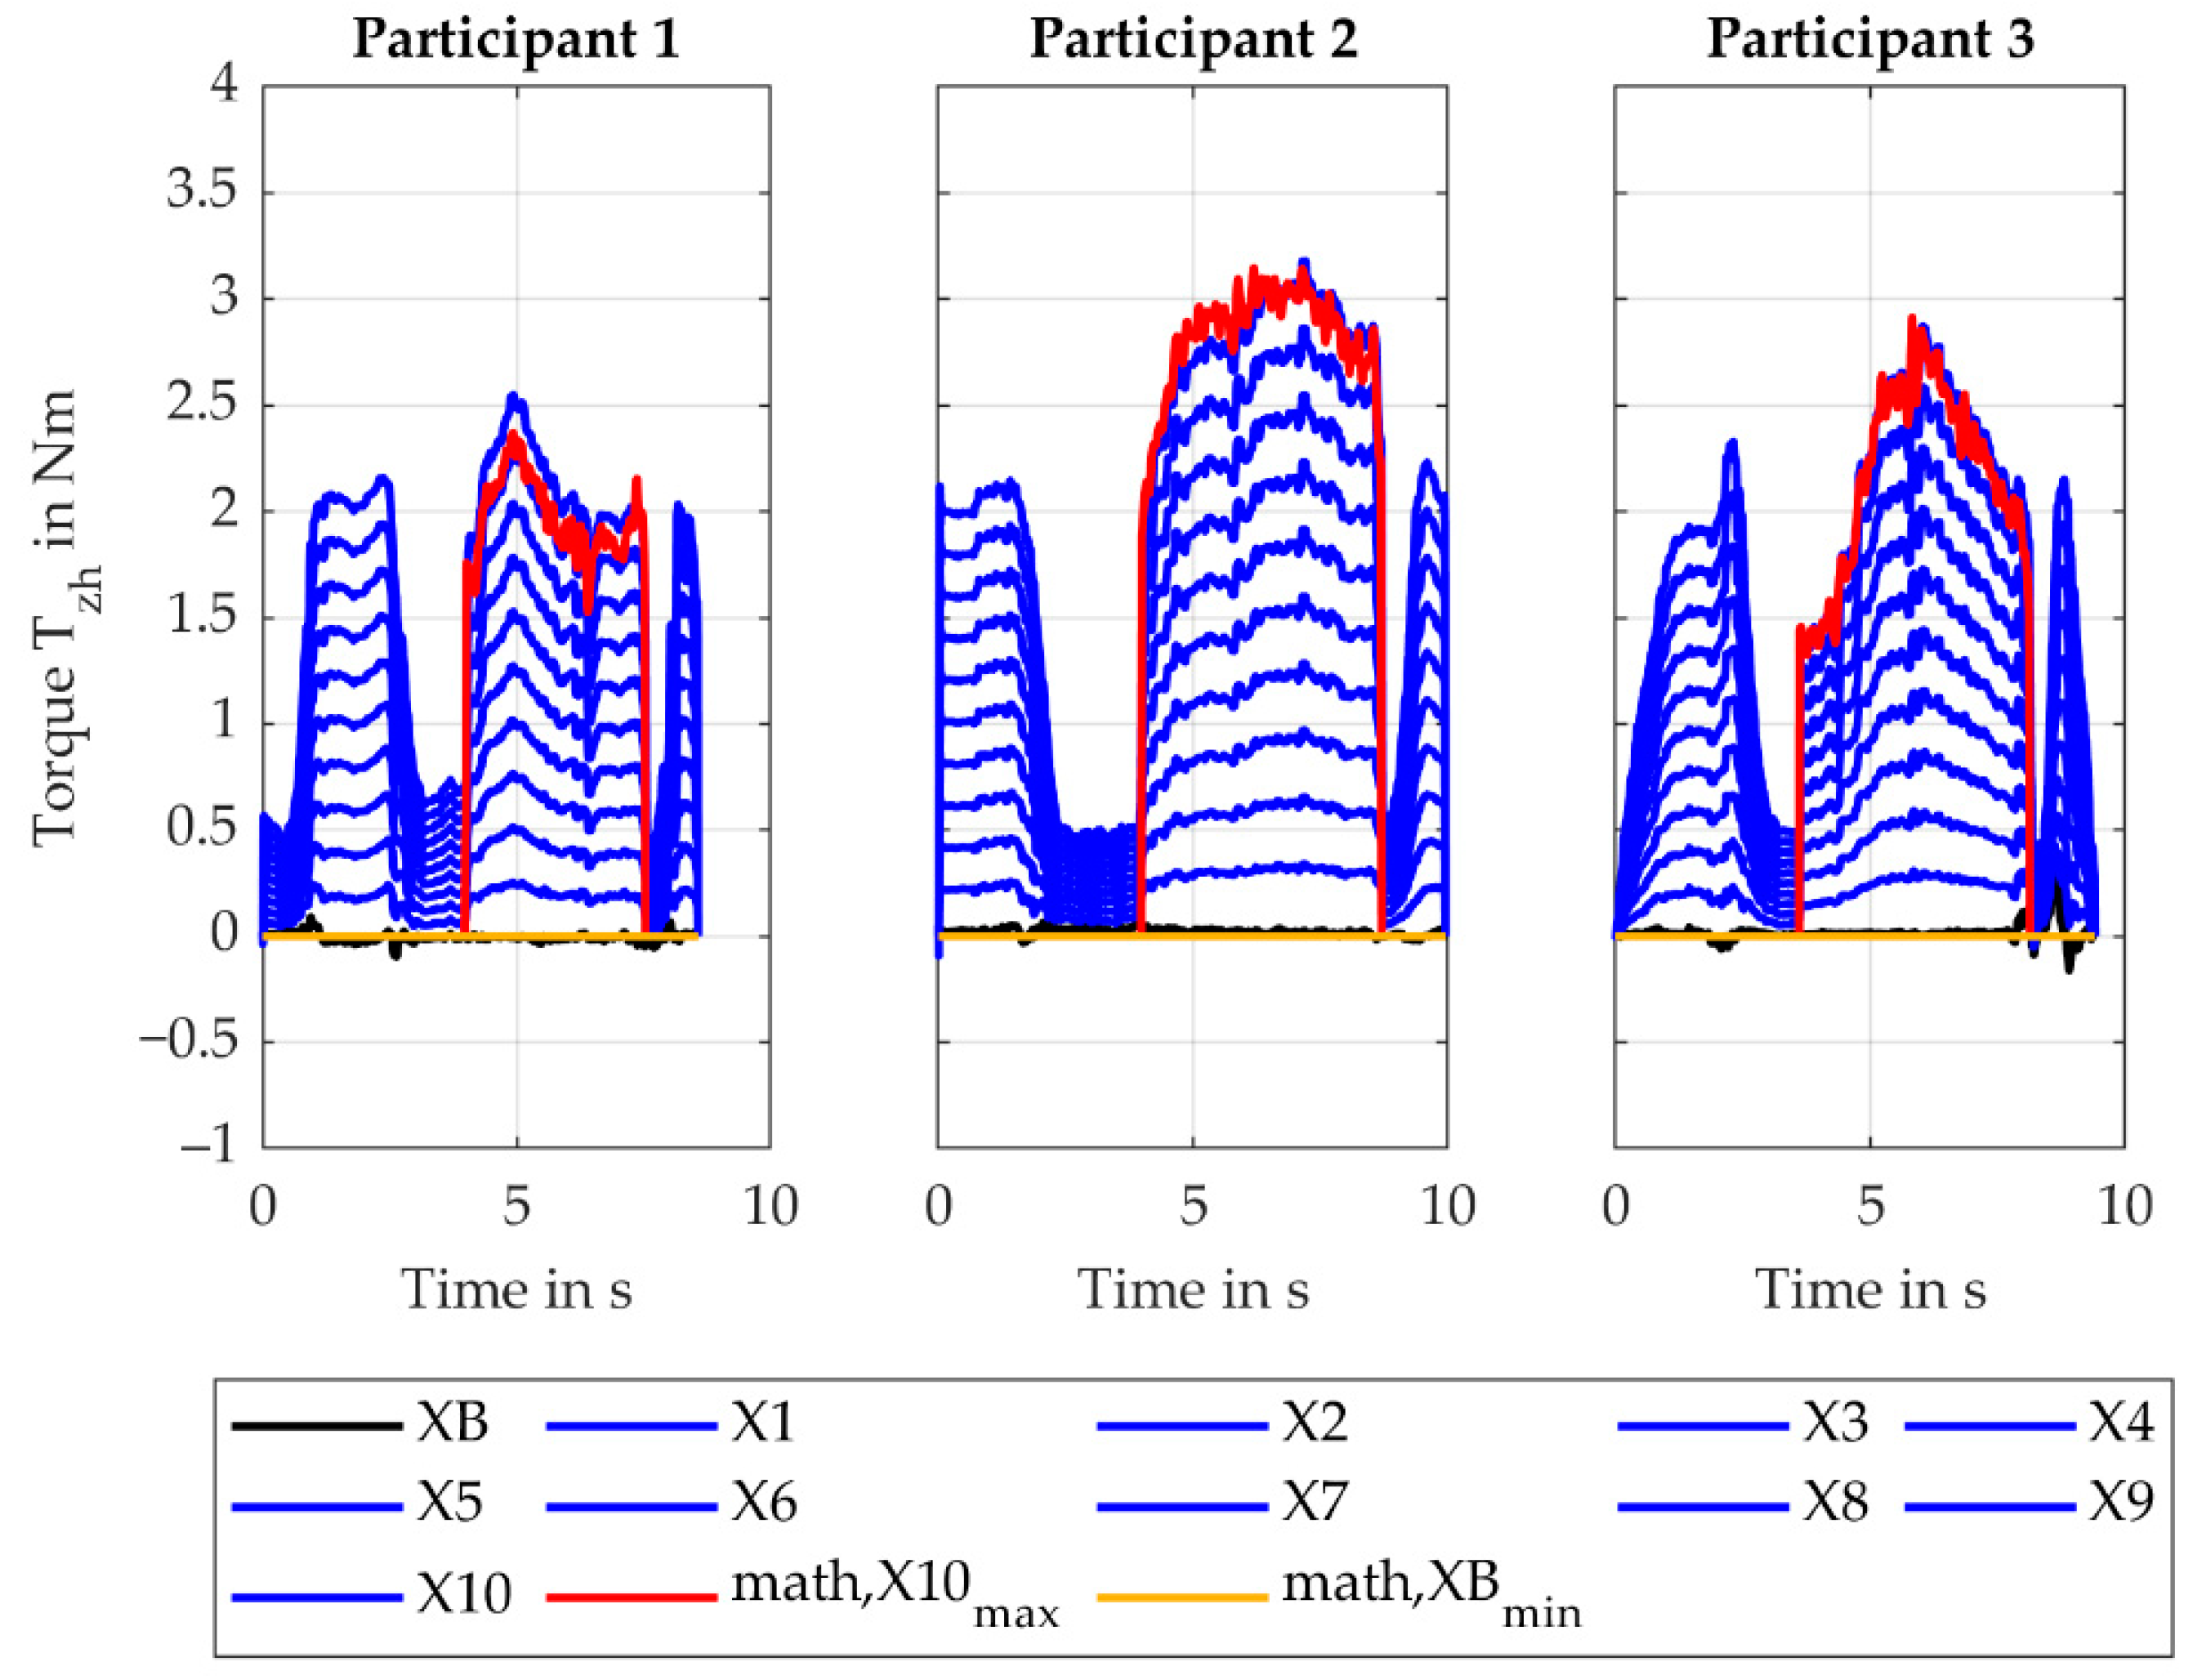
Considering the torque (torque leads to pronosupination forearm, torque along the forearm axis) for the X-variation, the increase in torque from the baseline to Y10 is caused by the same effect. Here, the -component of induces the torque causing the resulting absolute values to be smaller. The rMAE is 4.6% (SD 2.7%).
4.1. Virtual Sensor for External Load–Process Torque
For battery currents below 2.45 A, the screw does not bite into the wood [
30]. Up to this point, there is no torque that loads the human (see
Figure 4a
Idle Current). When the screw bites, the torque and the current increase as seen in
Figure 4a
Screw-in Process). With a R² of 98%, the linear correlation fits the reality on an acceptable level. It has to be taken into account, that higher residuals for the correlation (see
Figure 4b) in the high torque area indicate a lower quality of the model for this area. The residuals cause a maximum relative error of 5.1% for values lower than 12 Nm and a maximum relative error of 15.2% for values above 12 Nm. These errors are acceptable as these high torques are only reached for about 100 ms at the end of the screw-in process when the screw is fully sunk into the wood.
4.2. ApOL Model in MATLAB-Simulink
The ApOL model is verified by comparing the simulated values with the calculated ones from the mathematical model. The verification considers the influence of factor level (see
Section 2.5) on the forces and torques for the y- and z-coordinates and the x-coordinate separately.
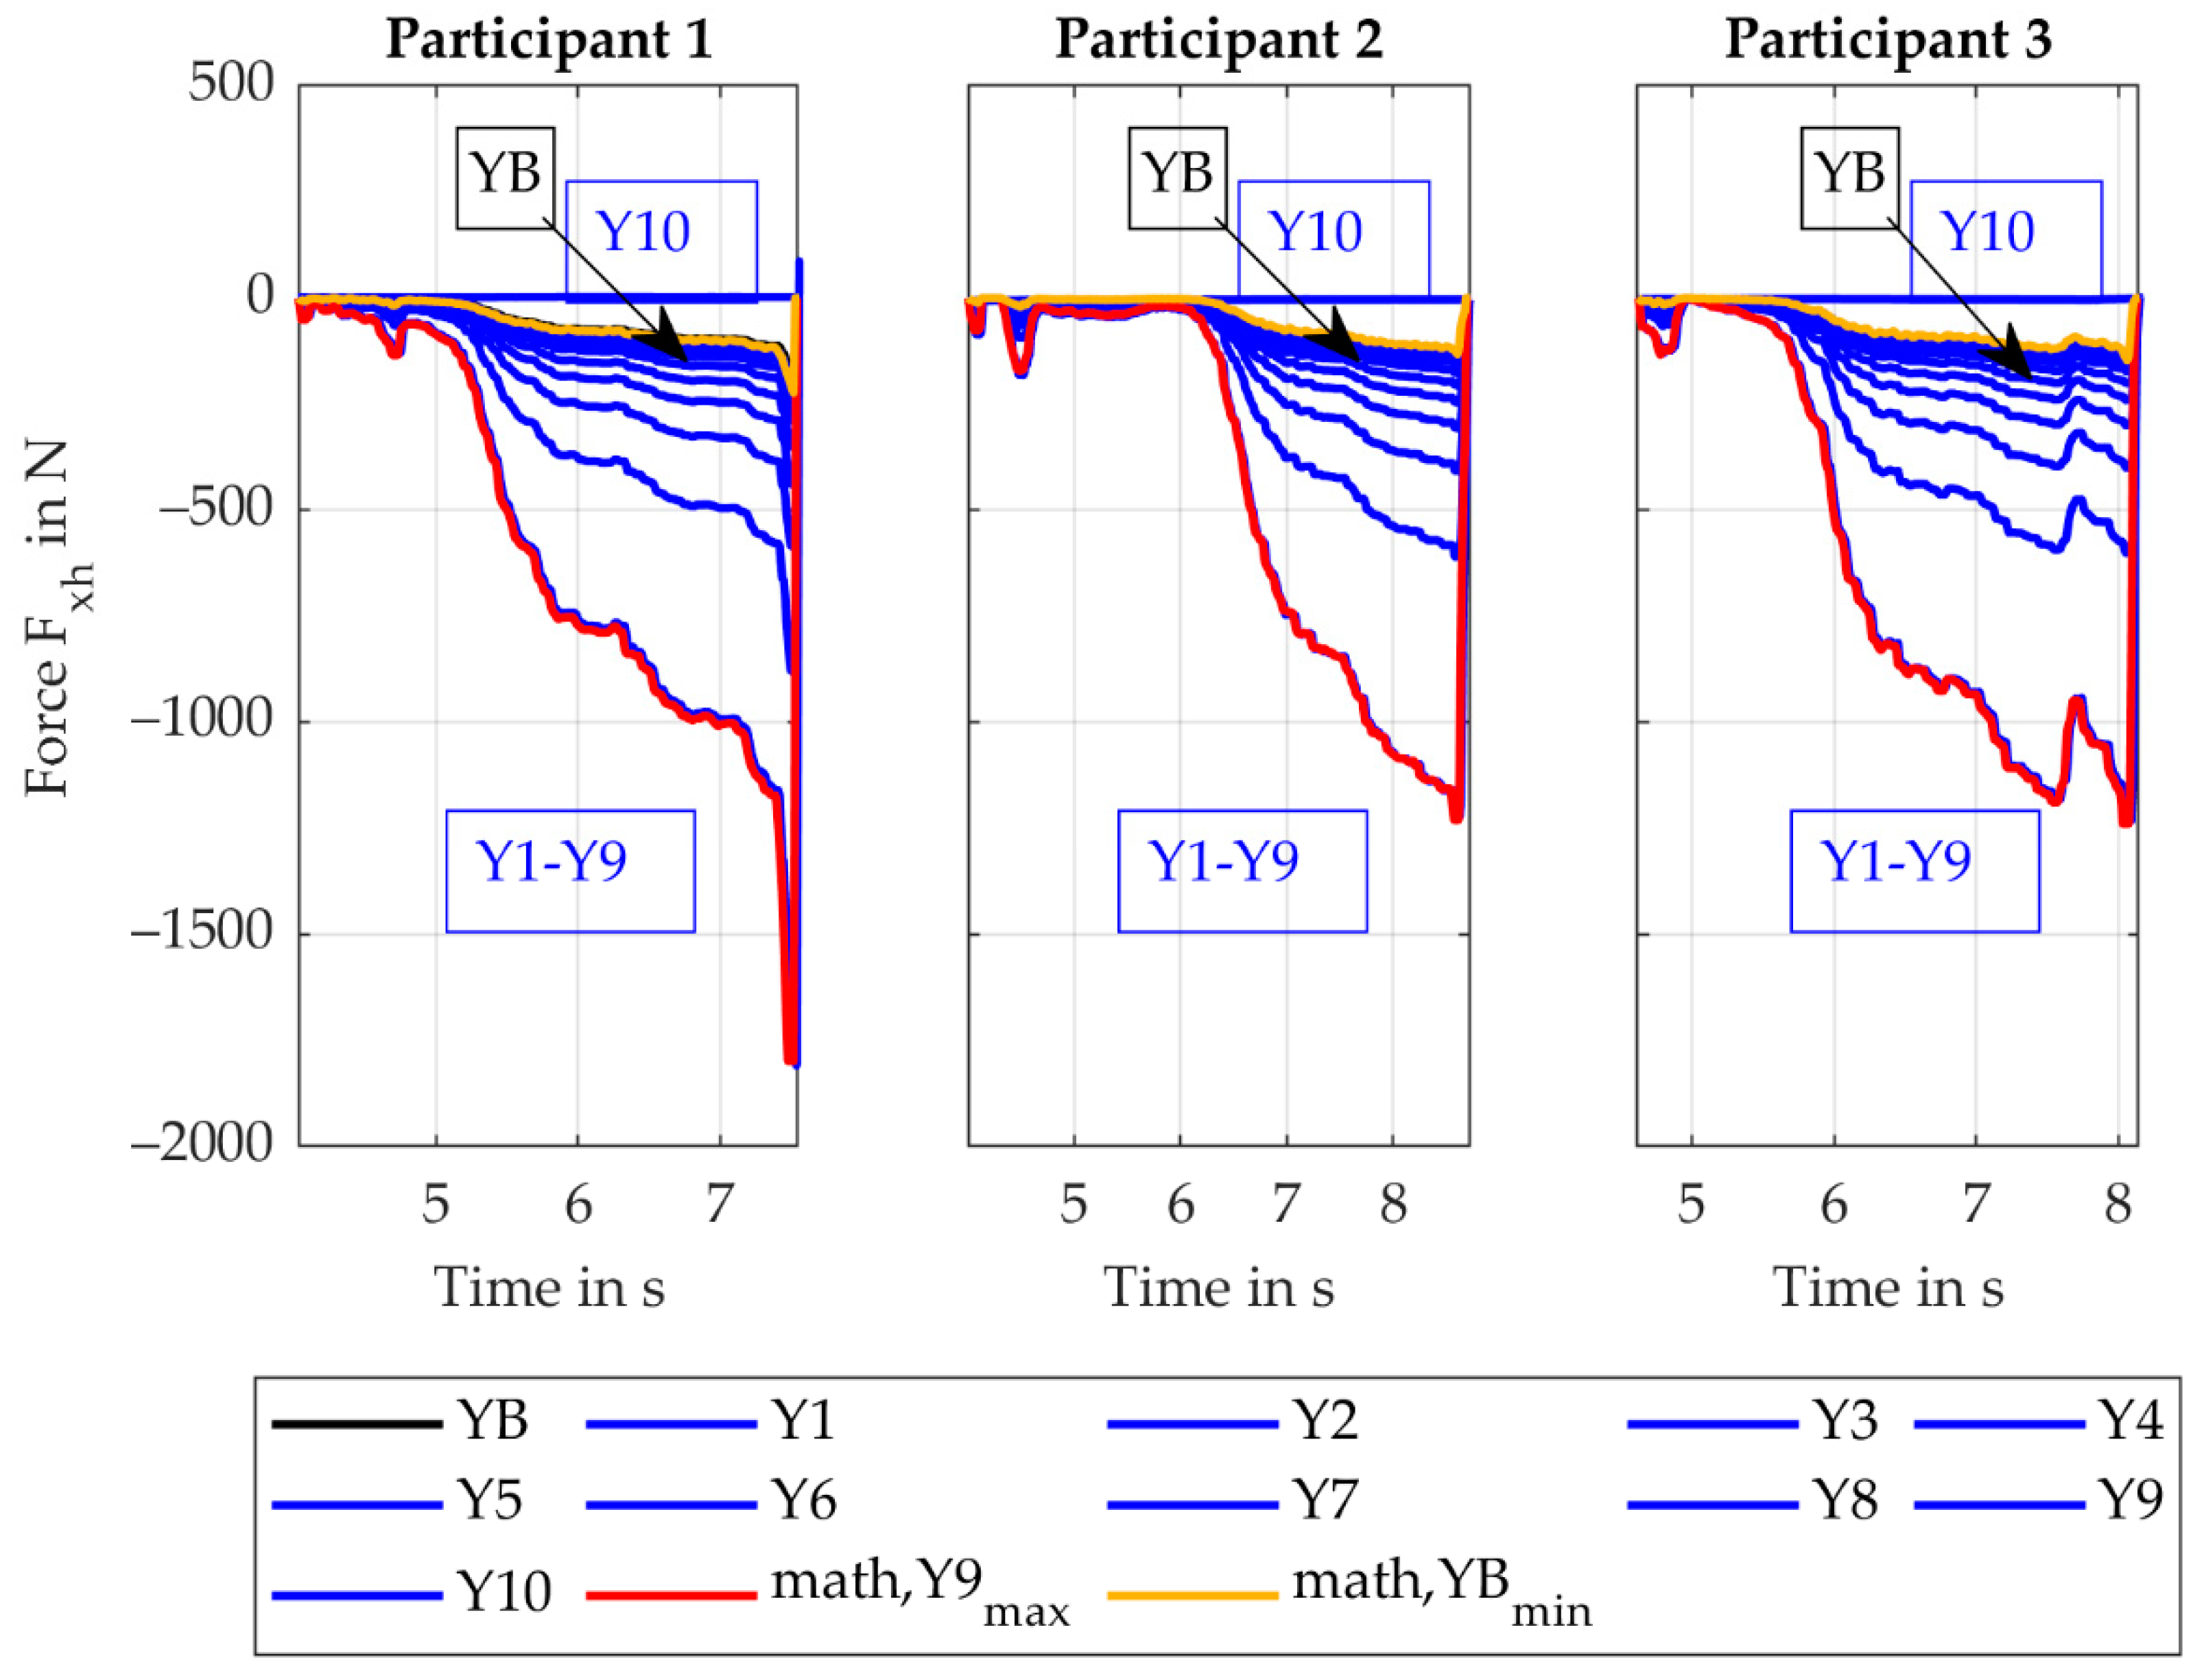
4.2.1. Influence of the Y- and Z-Coordinate of the Reference Point, Factor Levels Y1–Y10
For the variation of the y- and z-coordinates of the reference point, only the
force (force direction is perpendicular to handle- and drill-axis) and the
torque (torque leads to radial/ulnar deviation of the wrist) showed a considerable change. The remaining plots are presented in
Appendix B.
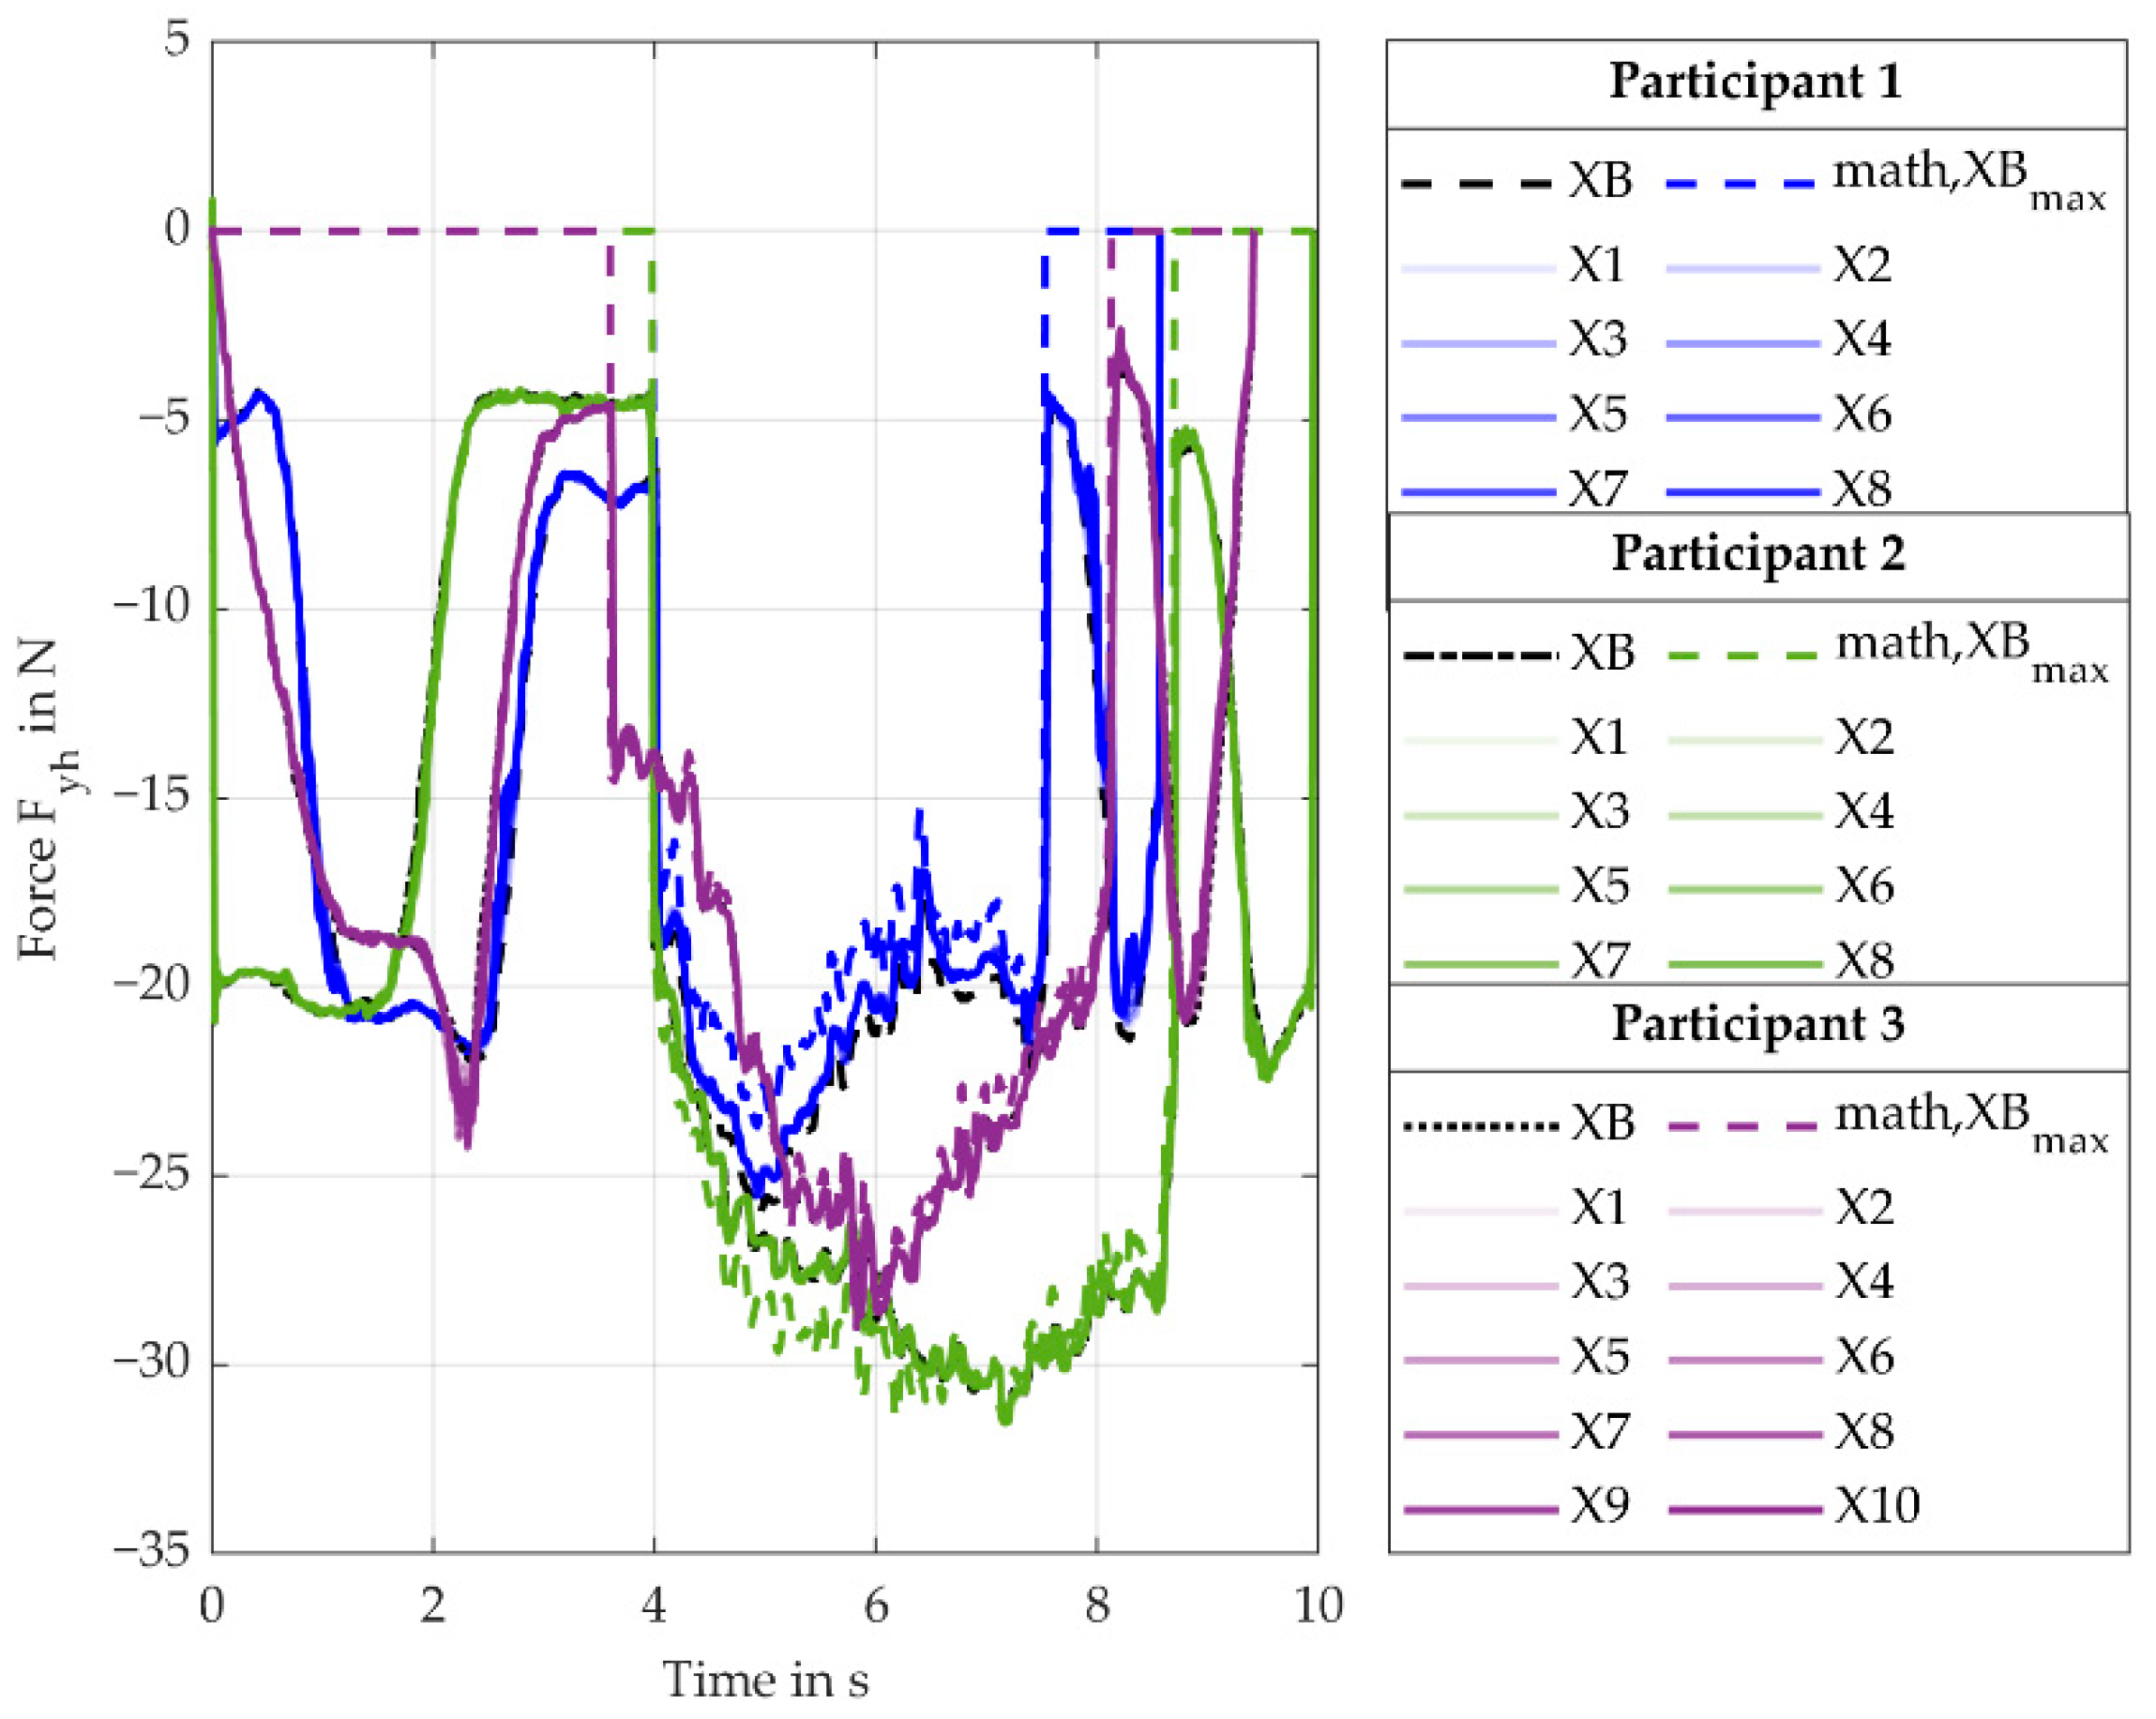
Considering the
force (force direction is perpendicular to handle- and drill-axis) in
Figure 6, the force behaves as expected. This component is mainly influenced by the process force
, which is inversely proportional to the lever, represented by the value of the y coordinate. With a decreasing lever, the force component increases. For Y10, the model assumes that the torque
is converted to
does not hold, resulting in a force that is approximately zero. Since the maximum (math, Y9
max) and minimum (math, YB
min) calculated values fit the simulated values pretty well, the inertia forces induced by the motion of the user do not influence the results in a considerable way for this setup.
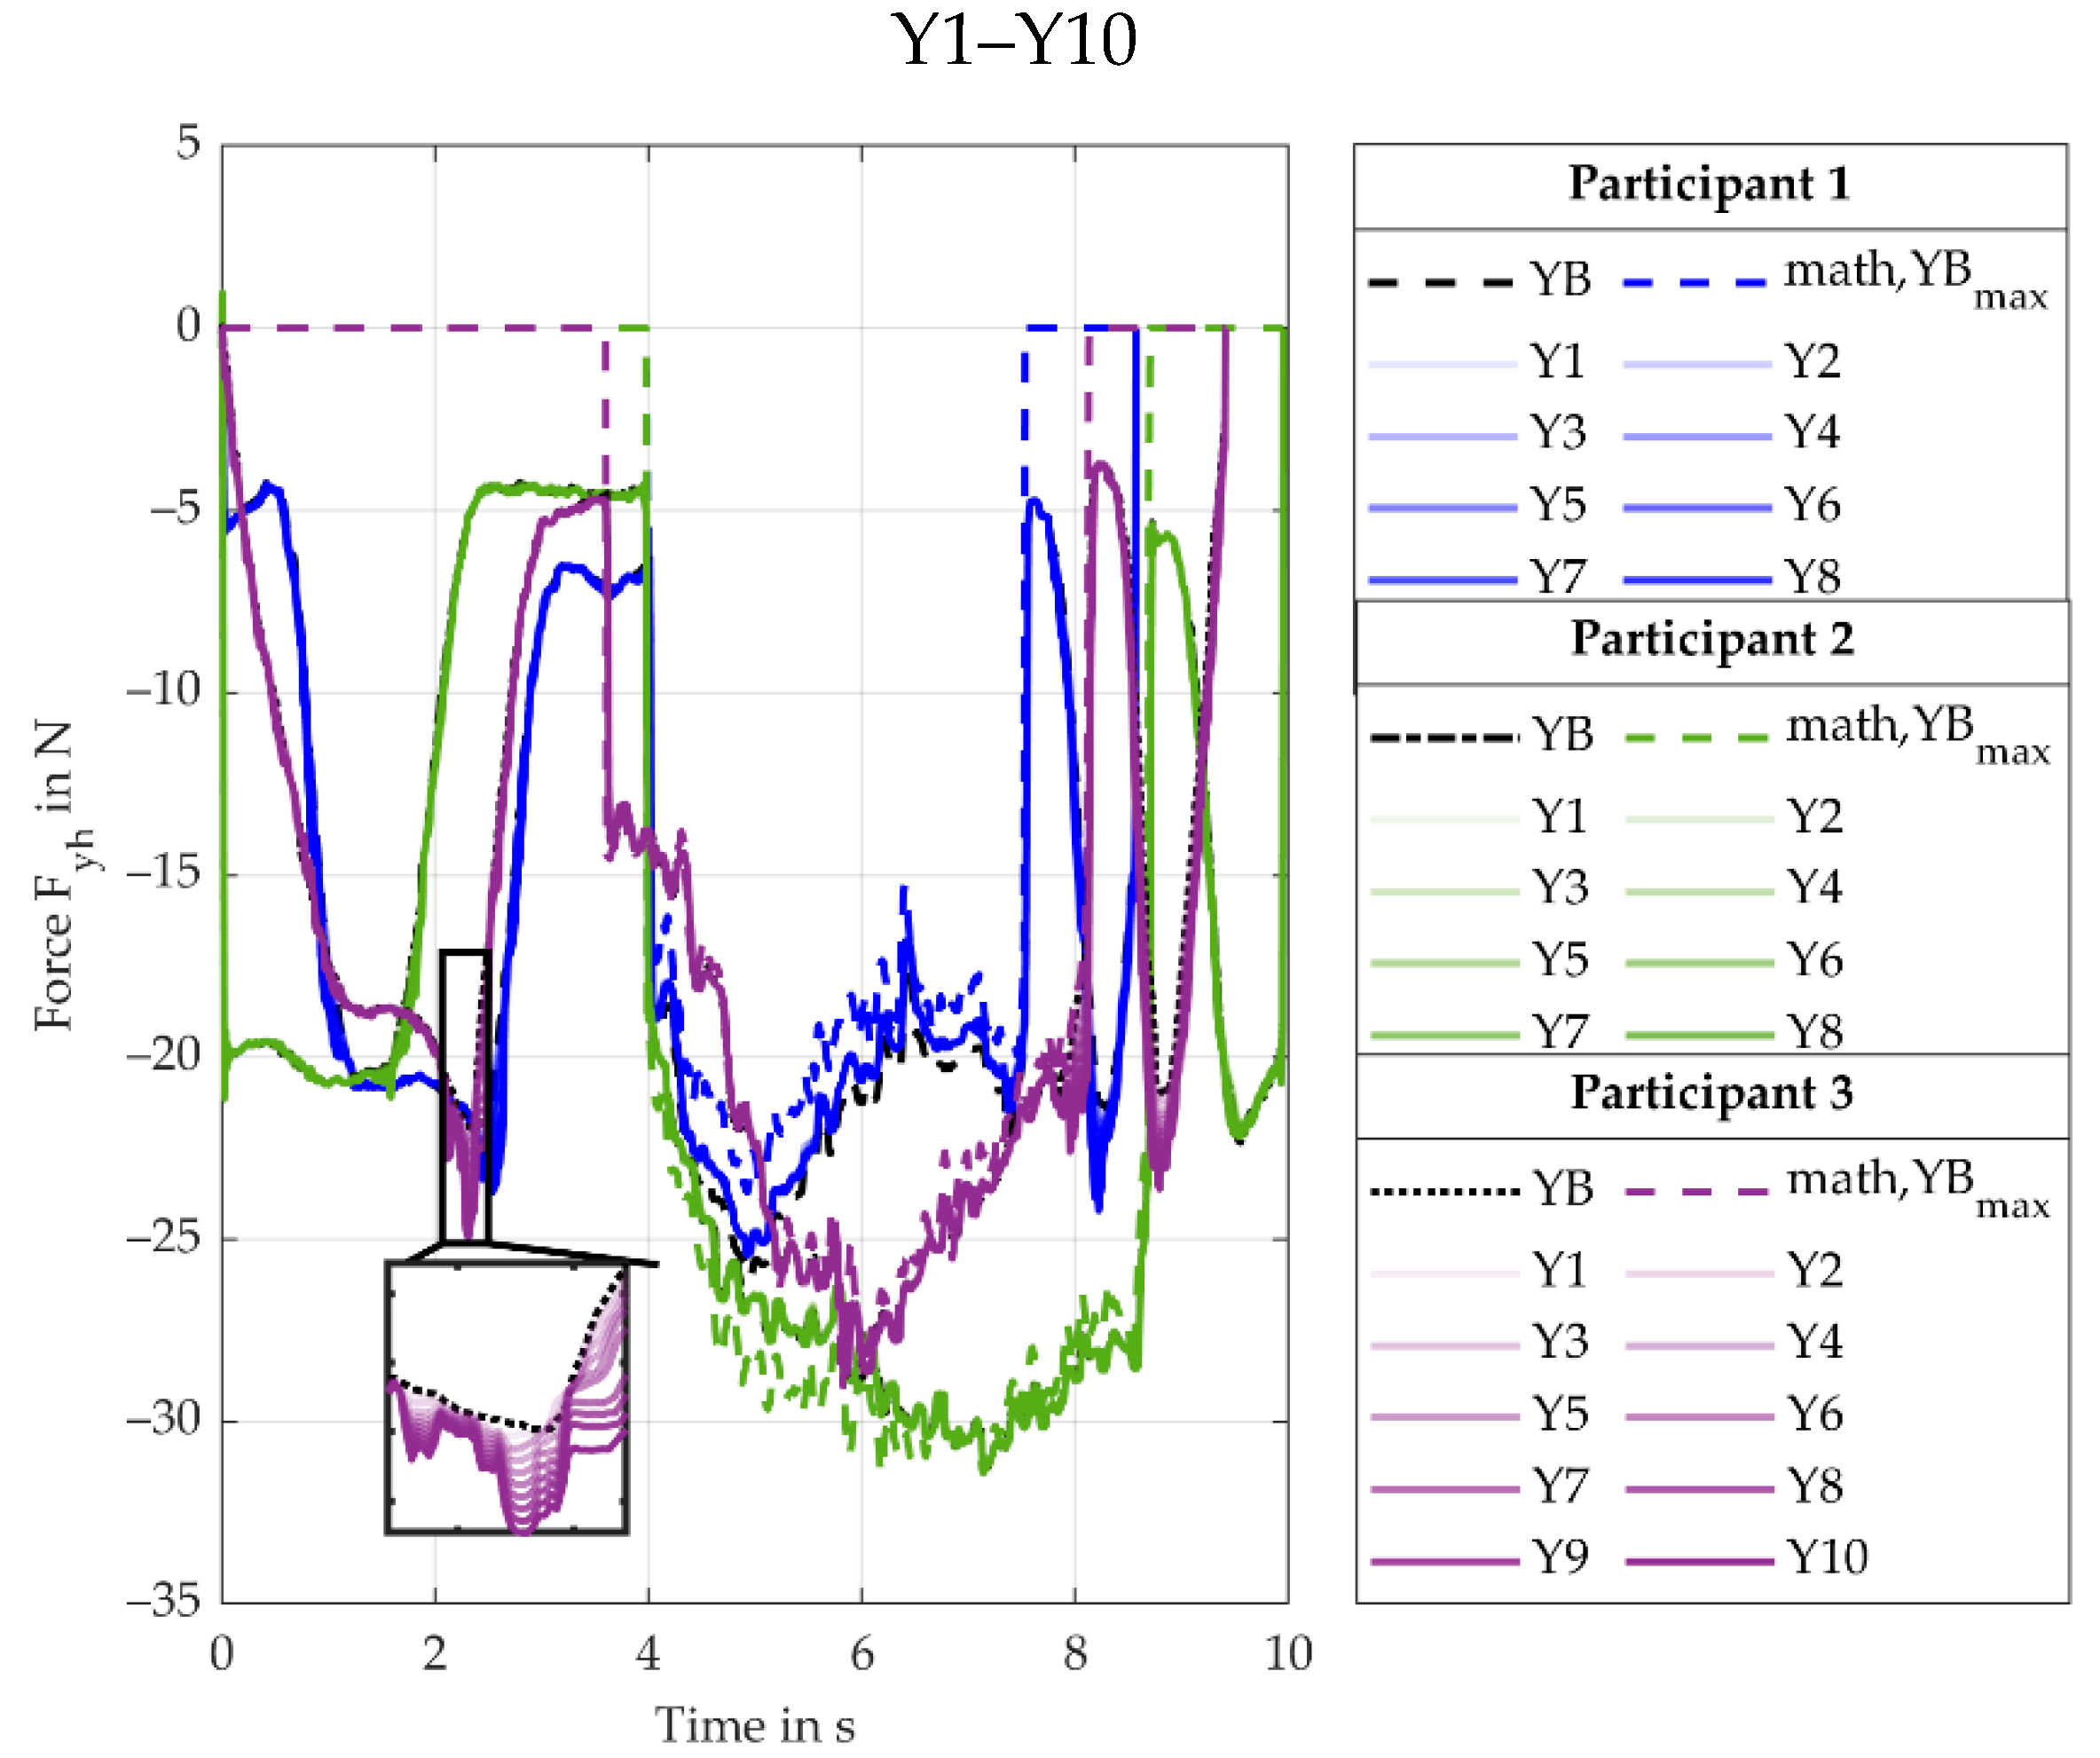
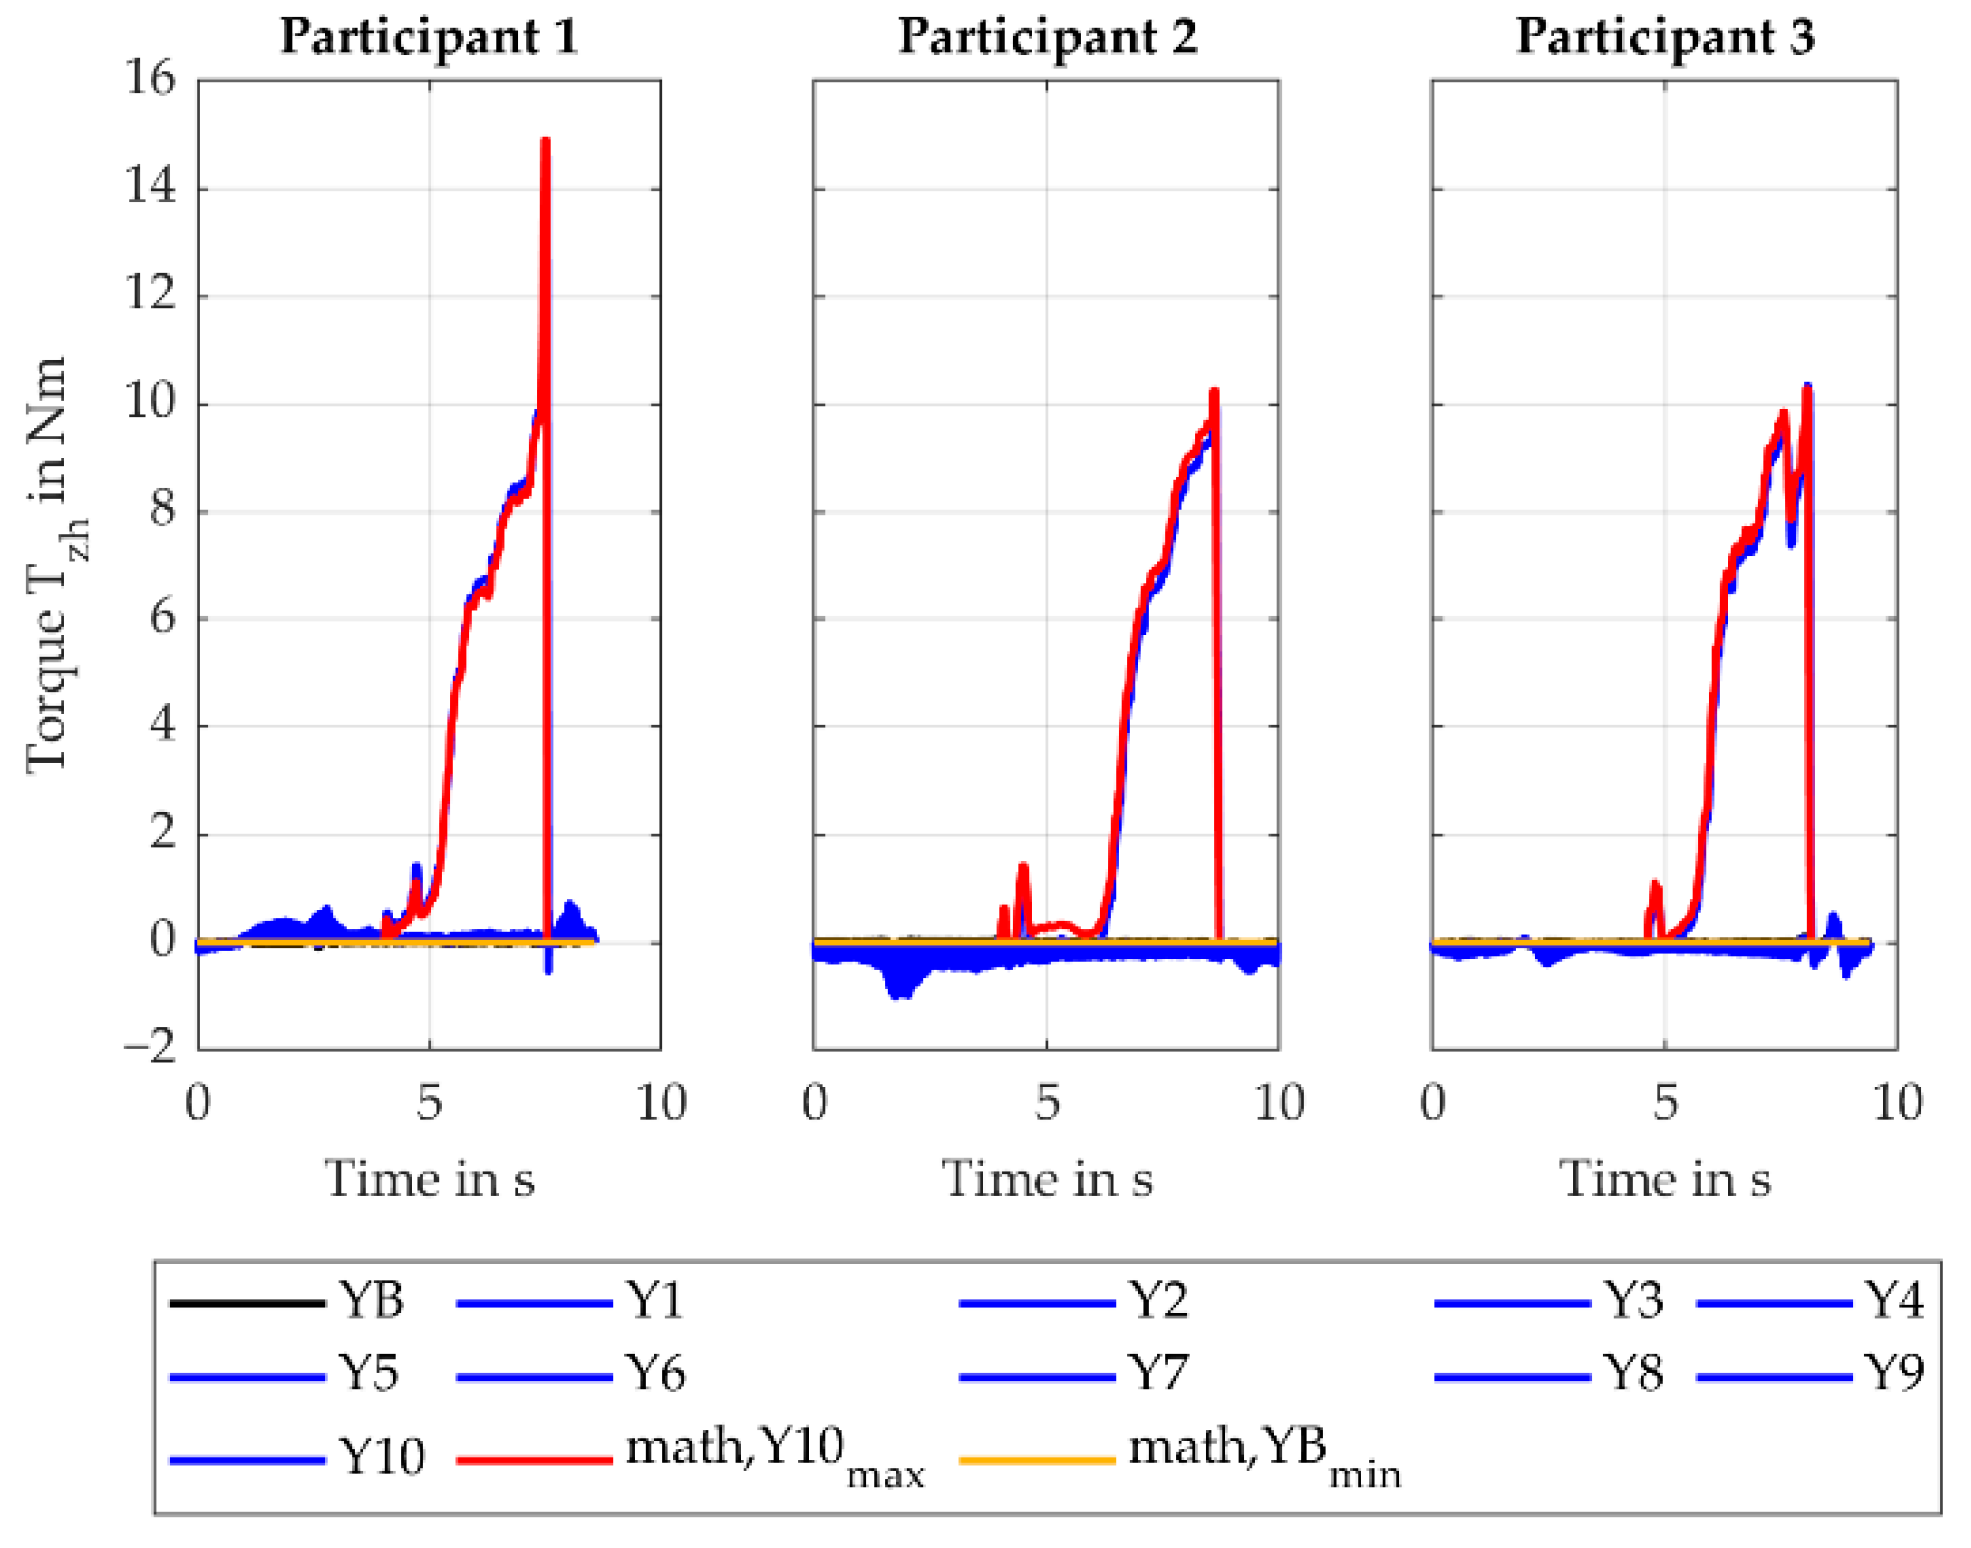
During the screw-in process, the
torque (torque leads to radial/ulnar deviation of the wrist) is mainly influenced by the process force
. When moving the reference point out of the baseline, the corresponding lever decreases, resulting in a lower torque. The second influence on
is the mass of the screwdriver, which induces an increasing torque when moving the reference point away from the baseline and the COG. The two phenomena overlay and result in the torque curves shown in
Figure 7. For the calculated minimum (math, Y10
min), only the mass is considered while the progression of the simulated values indicates an influence of
. This is caused by the fact that the screwdriver is not held perfectly upright in Position (C) during the screw-in process by the users, thus inducing an additional load component that is not considered in the mathematical model yet. Outside of the screw-in process, the mass of the screwdriver is mainly responsible for the torque curve. For the baseline, the
torque is always positive since the COG is located in front of the reference point. Moving the reference point up towards the drilling axle shifts the COG behind the reference point, thus the torque
is negative. When the screwdriver is rotated upwards, this changes and so does the torque
. The same effect occurs after the screw-in process when the screwdriver is lowered. Another characteristic seen in
Figure 7 is the robust design of the setup Y10. For the baseline (YB), the main load appears during the screw-in process, and it also varies between the users. Even though they all performed the same task, the load is dependent on the individual handling. For Y10, not only is the load approximately the same for all participants, it also only slightly increases during the screw-in process. This effect is very important, as a robust design eliminates noise factors and helps develop systems that are invariant from the user and the handling of the task. Finding robust designs helps significantly when optimizing support systems for humans.
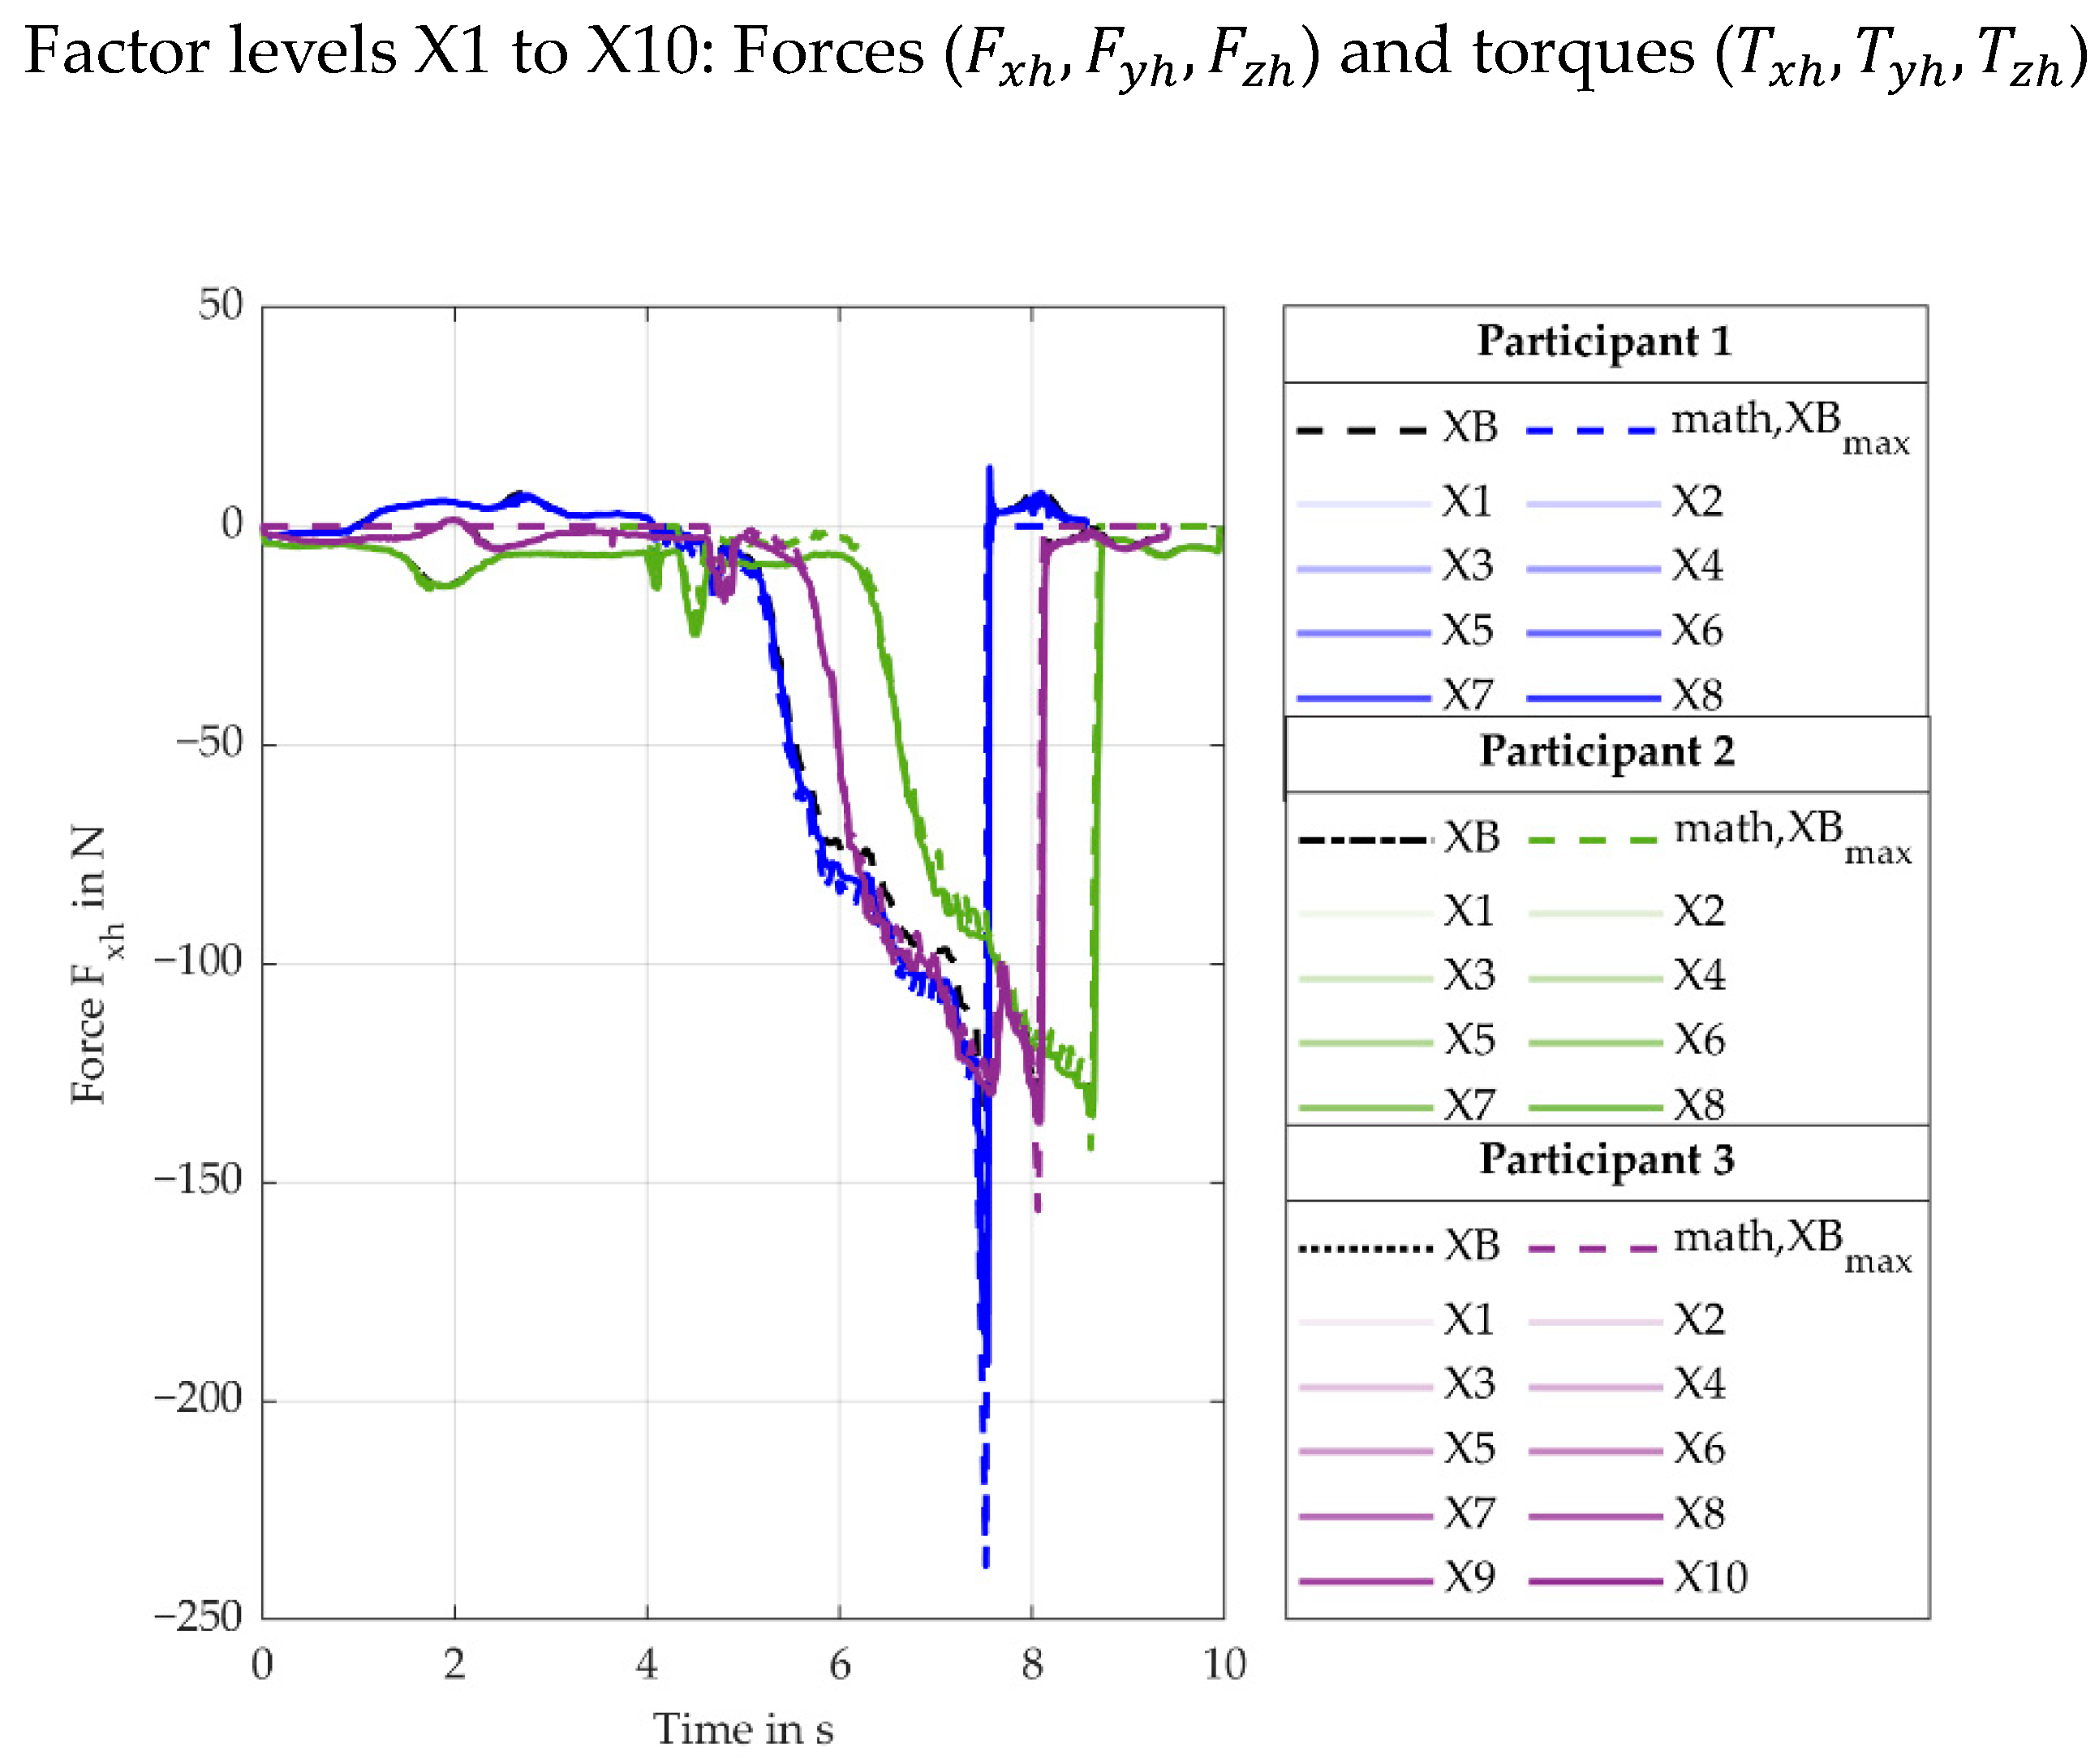
4.2.2. Influence of the X-Coordinate of the Reference Point, Factor Levels X1–X10
For the variation of the x-coordinate of the reference point, only the
torques (torque leads to extension/flexion of the wrist, torque along the handle axis) and
(torque leads to pronosupination forearm, torque along the forearm axis) showed a considerable change. The remaining plots are presented in
Appendix B.
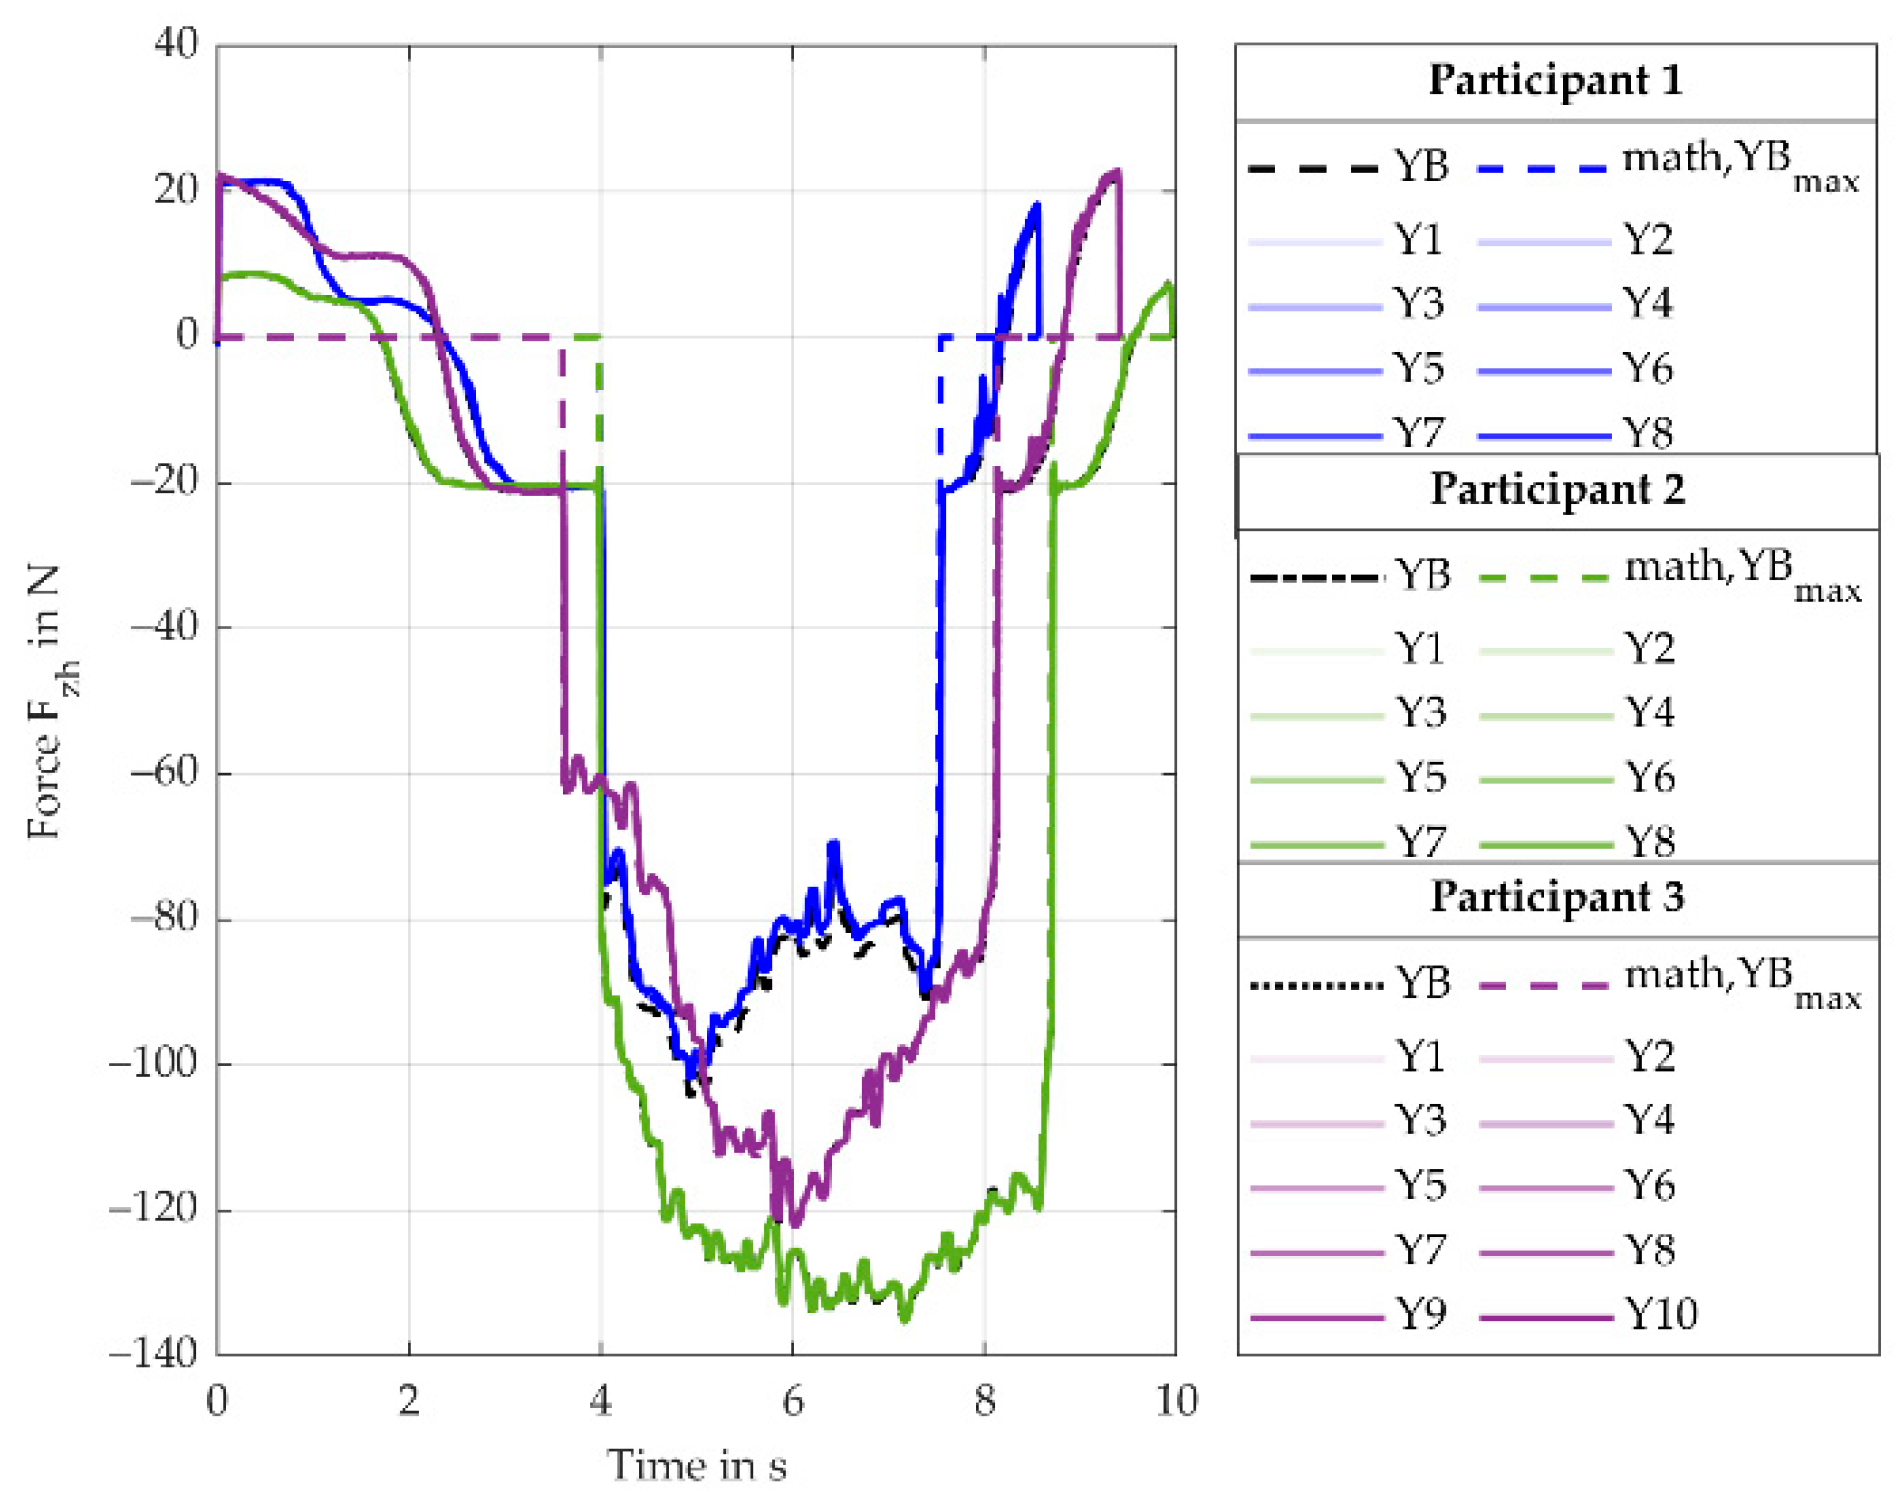
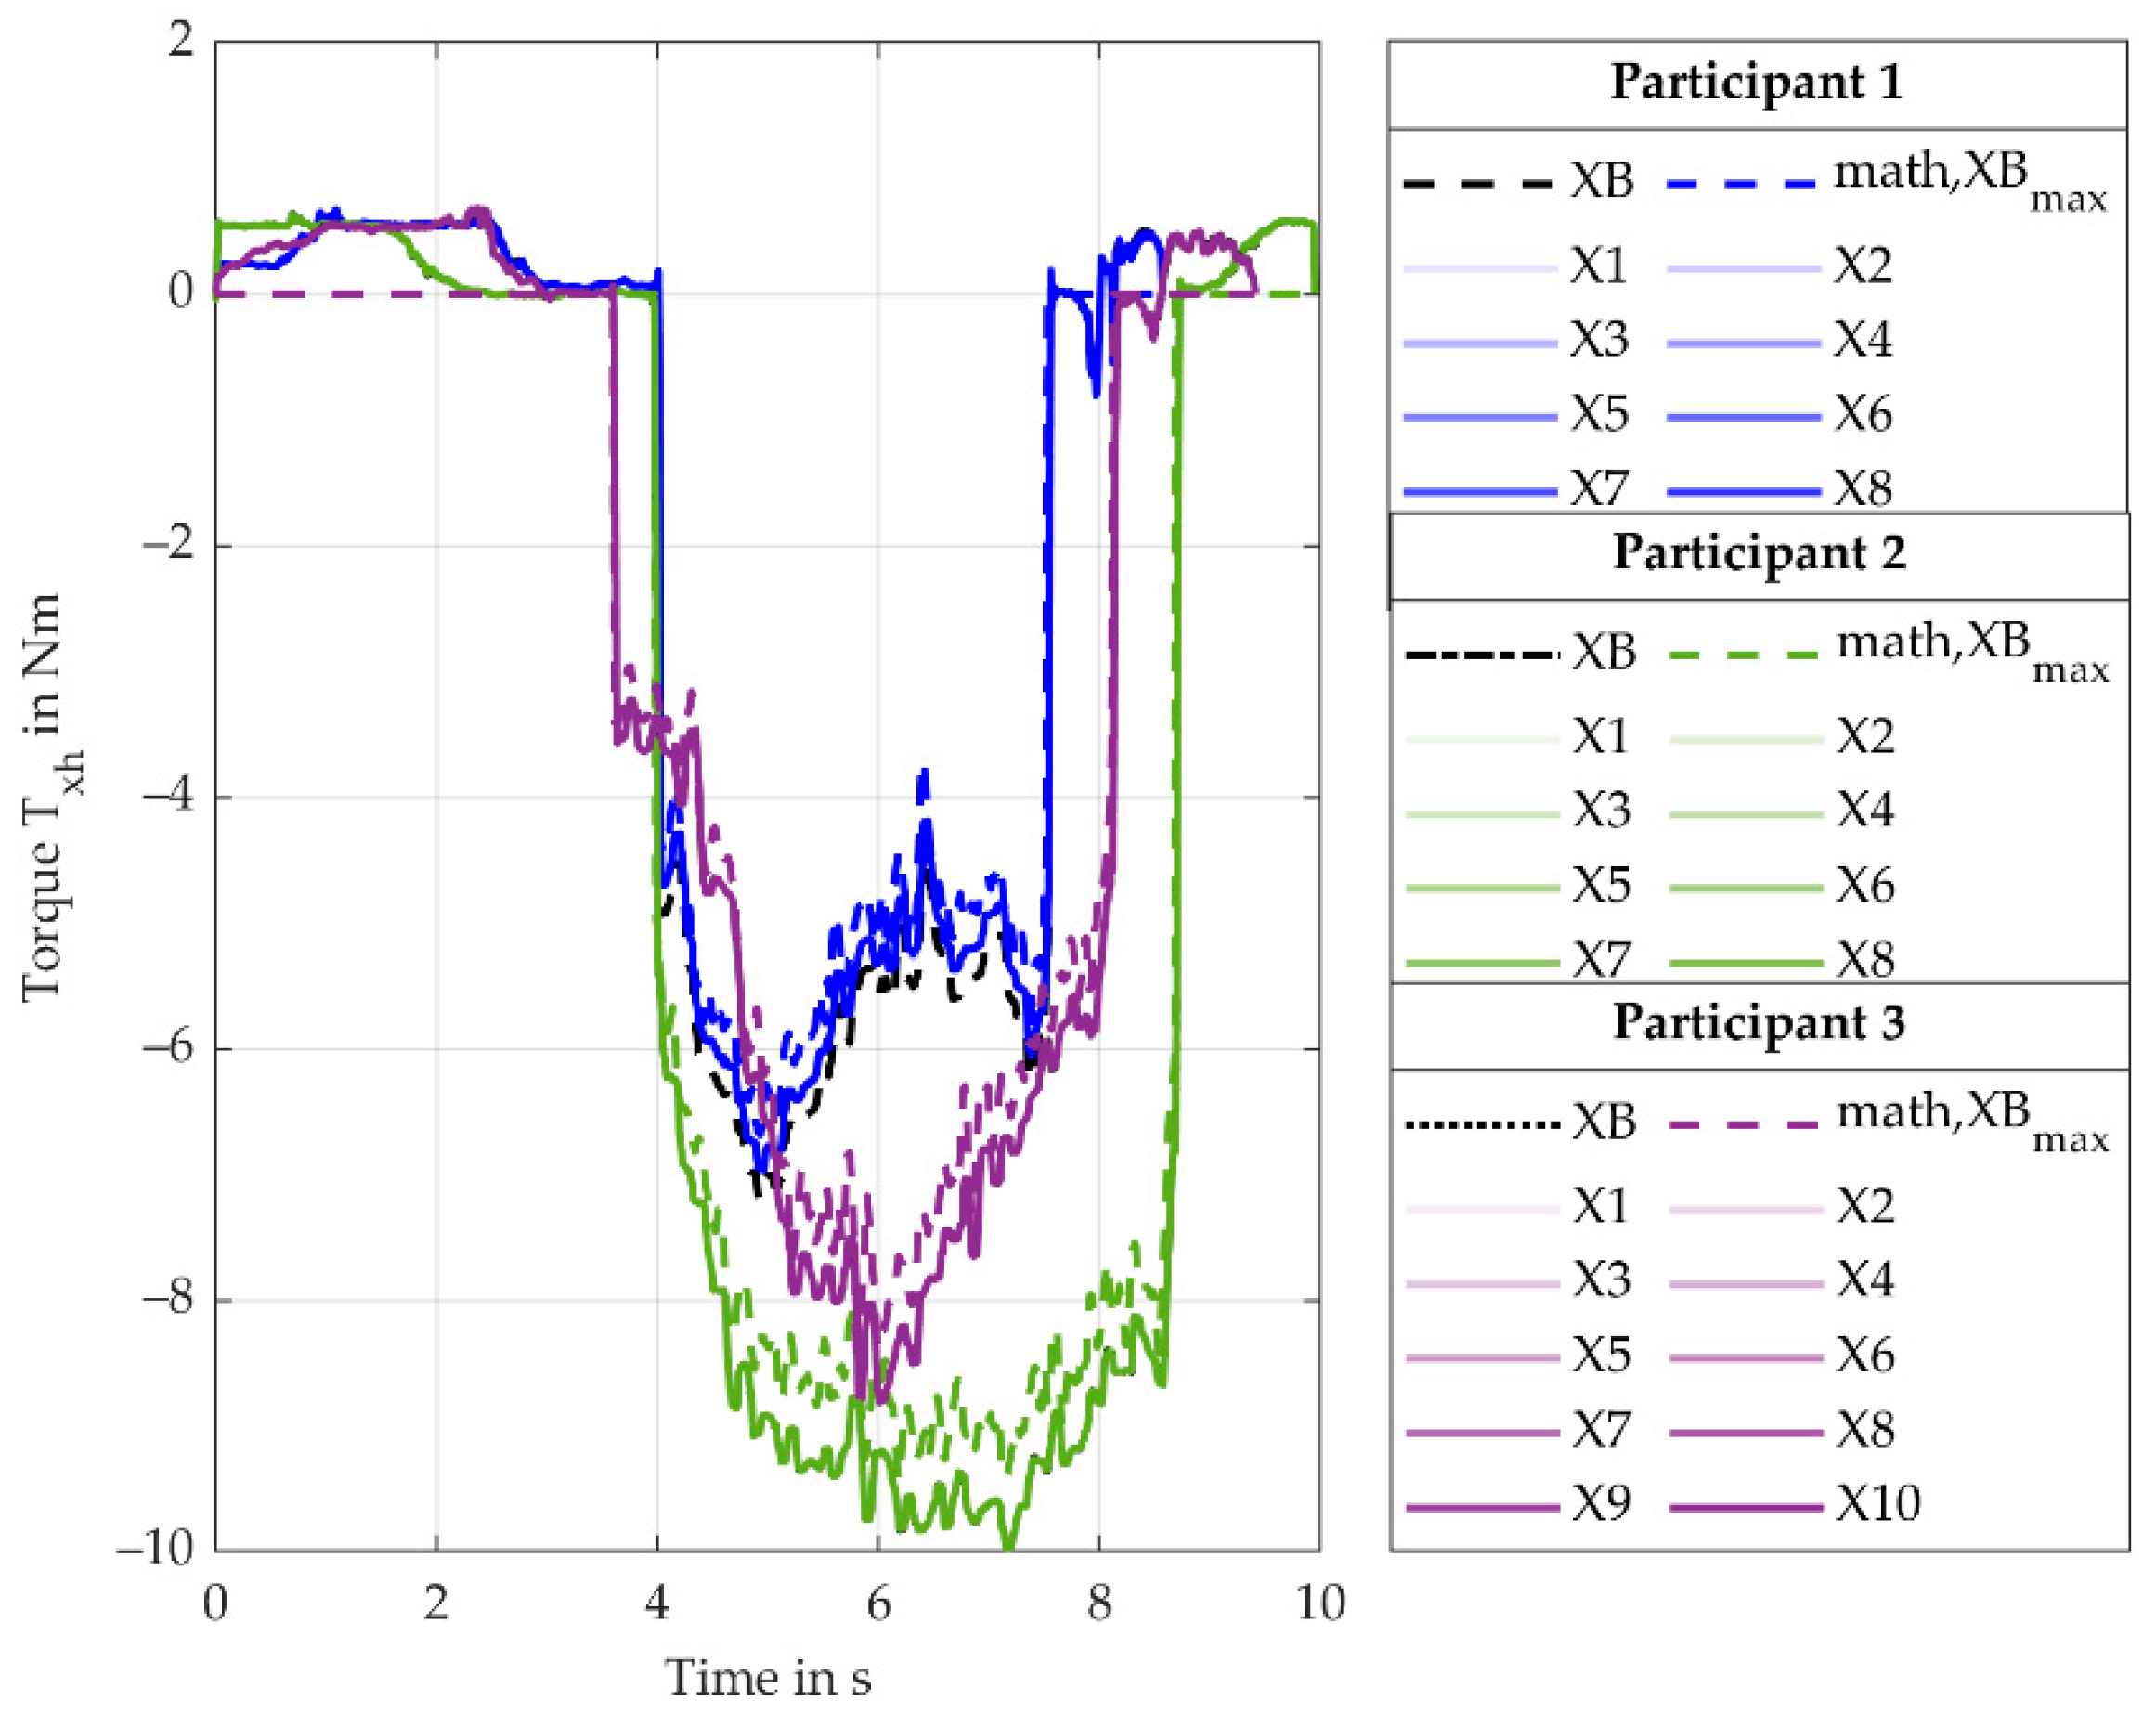
The torque (torque leads to extension/flexion of the wrist, torque along the handle axis) (see
Figure 8), is only induced due to the screwdriver’s mass outside of the screw-in process. Moving the reference point out of its initial position (XB), the lever towards the COG increases and so does the torque
. When rotating the screwdriver upwards, the orientation of the COG to the reference point in the space-fixed coordinate system changes, causing the gravity to flip the torque. The same effect in the opposite direction can be seen after the screw-in process. During the screw-in process, the main influence is the process force
and the weight force. An increase in the x coordinate also increases the lever for these forces, resulting in higher torques
. The maximum calculated values (math, X10
max) fit the simulated values (X10) with a rMAE of 1.7% (SD 0.6%). If the mass of the screwdriver were ignored, a rMAE of 15.4% (SD 2.9%) between the calculated values (math, X10
max, noMass) (green curve) and the simulated values (X10) would occur. This shows the importance of modelling the mass of the technical system. For the baseline (XB), the process force
and the weight force induces no torque around the
-axis. The values for the baseline setup are only influenced by the motion of the user. The minimum calculated values correspond to the baseline (XB) and are equal to zero. The maximum offset between these two curves is 0.4 Nm, thus the motion of the user has very little influence in this case.
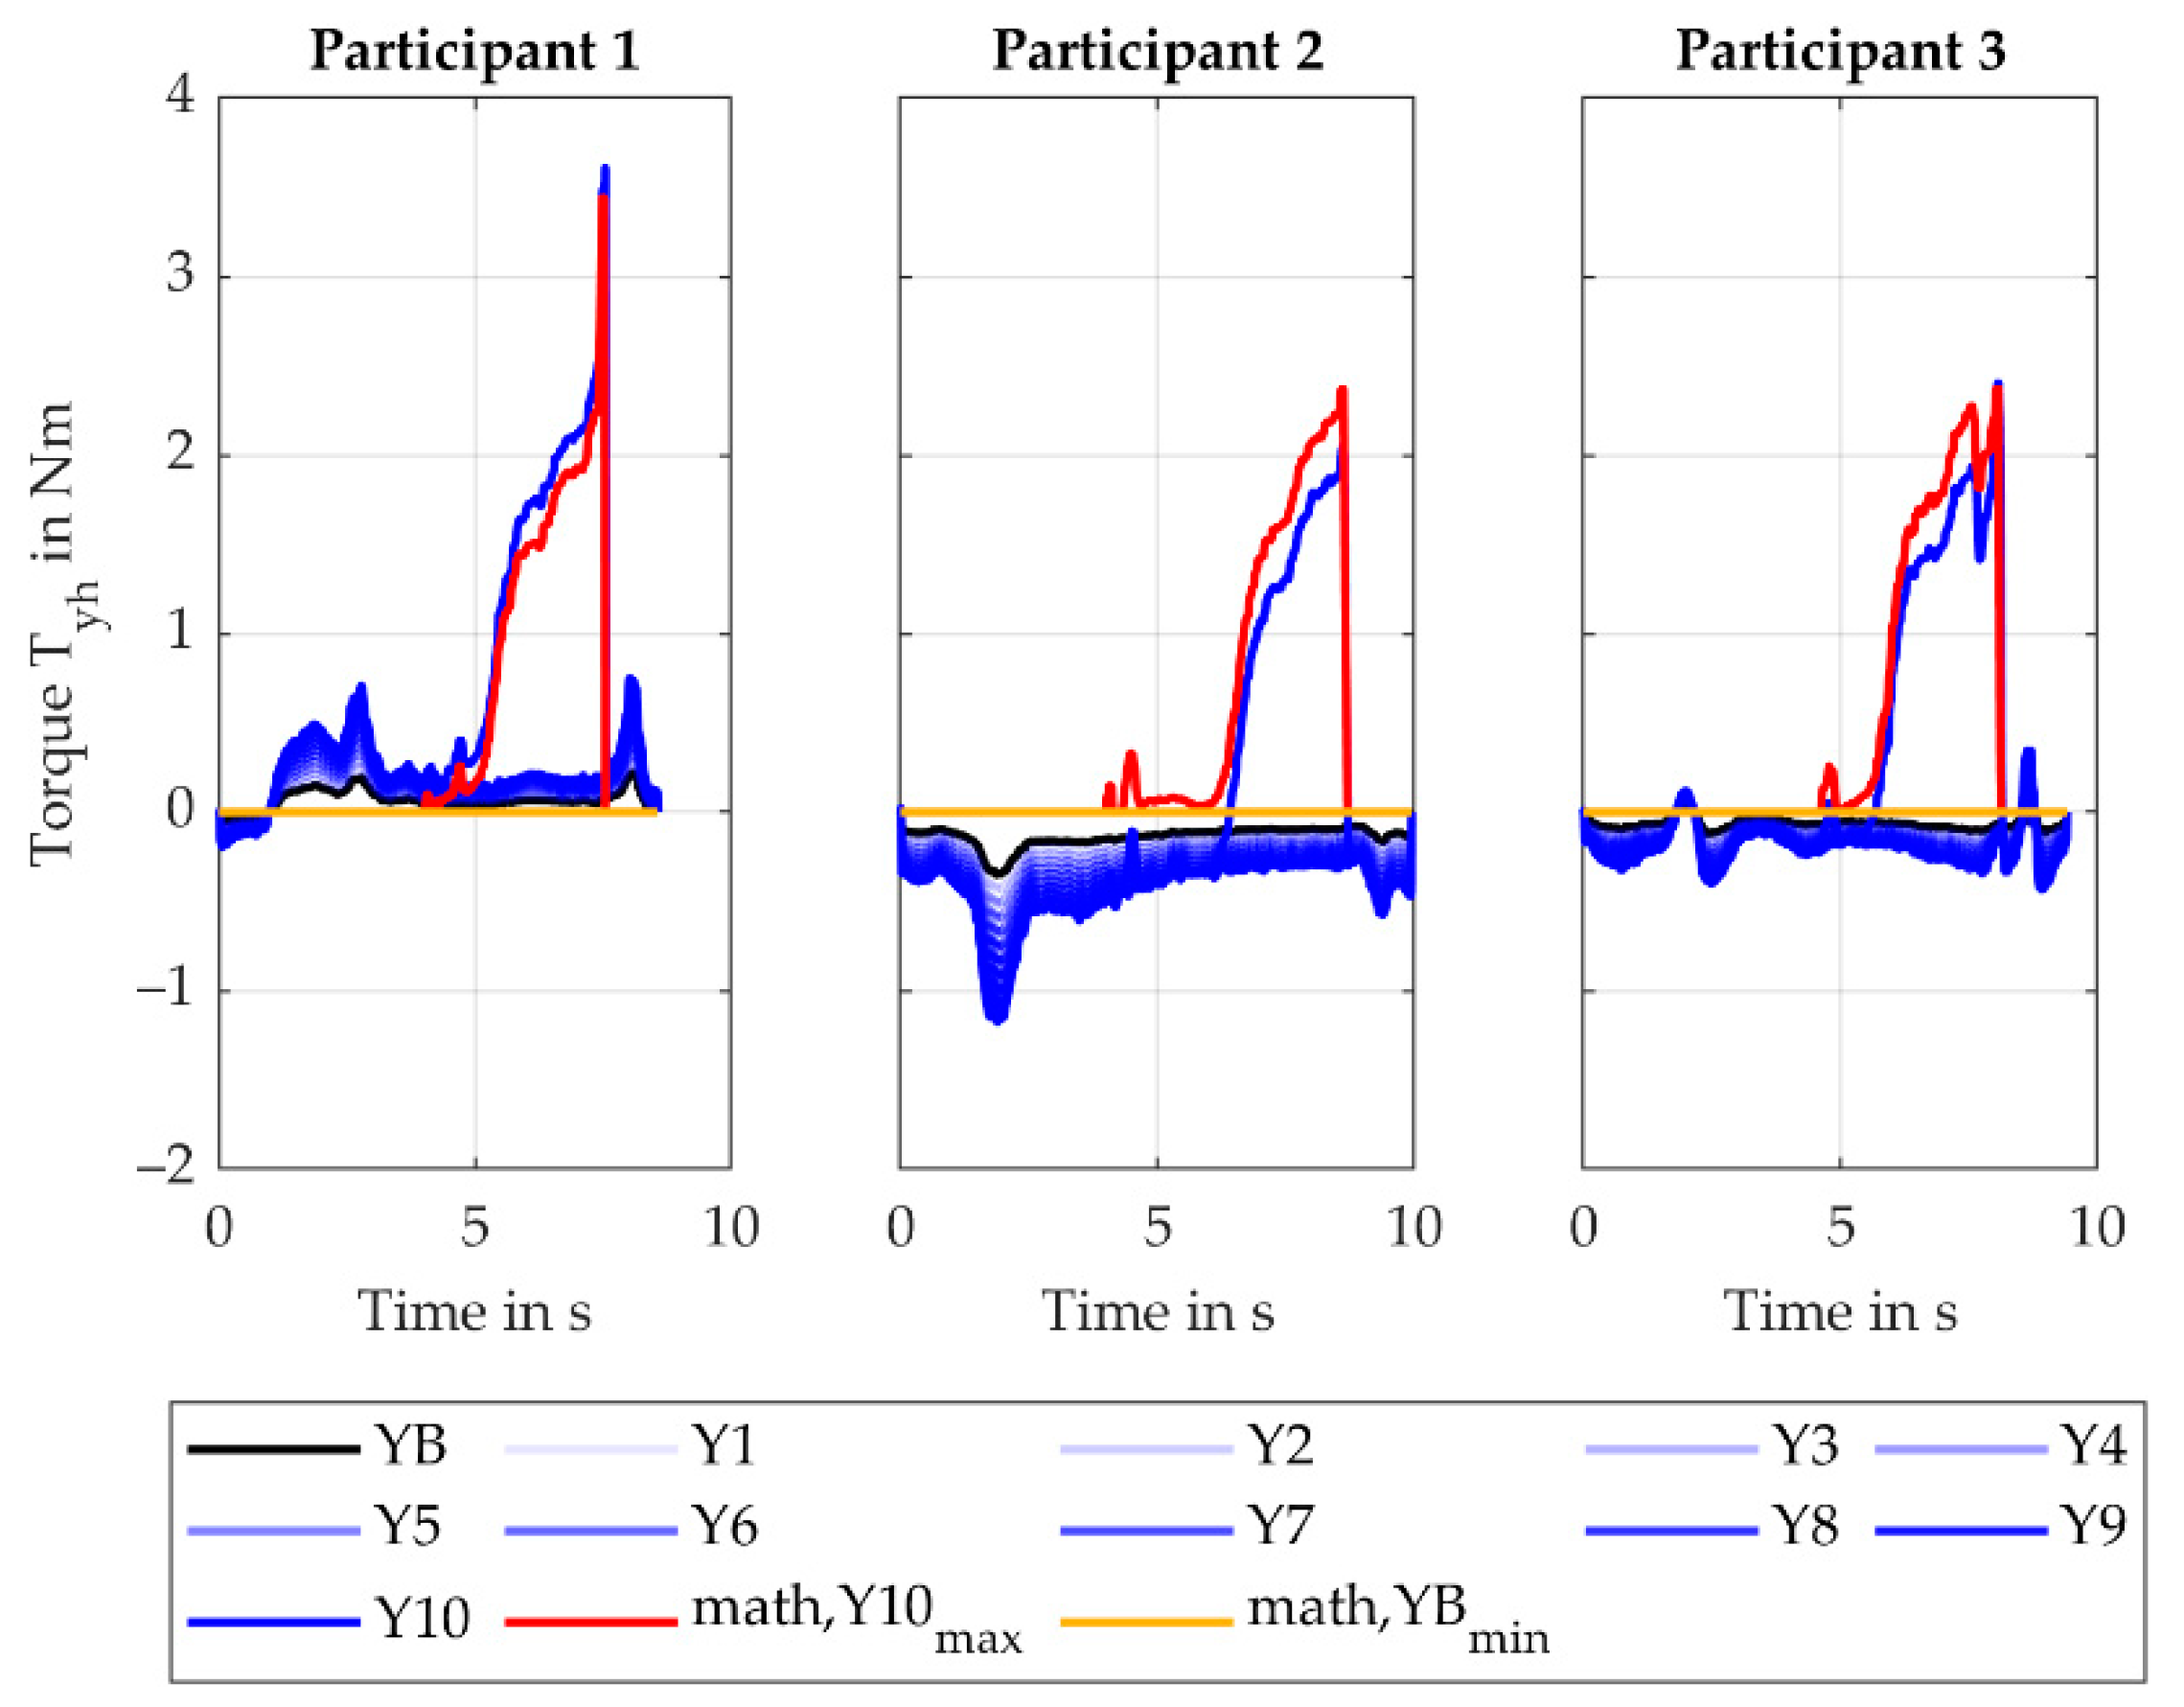
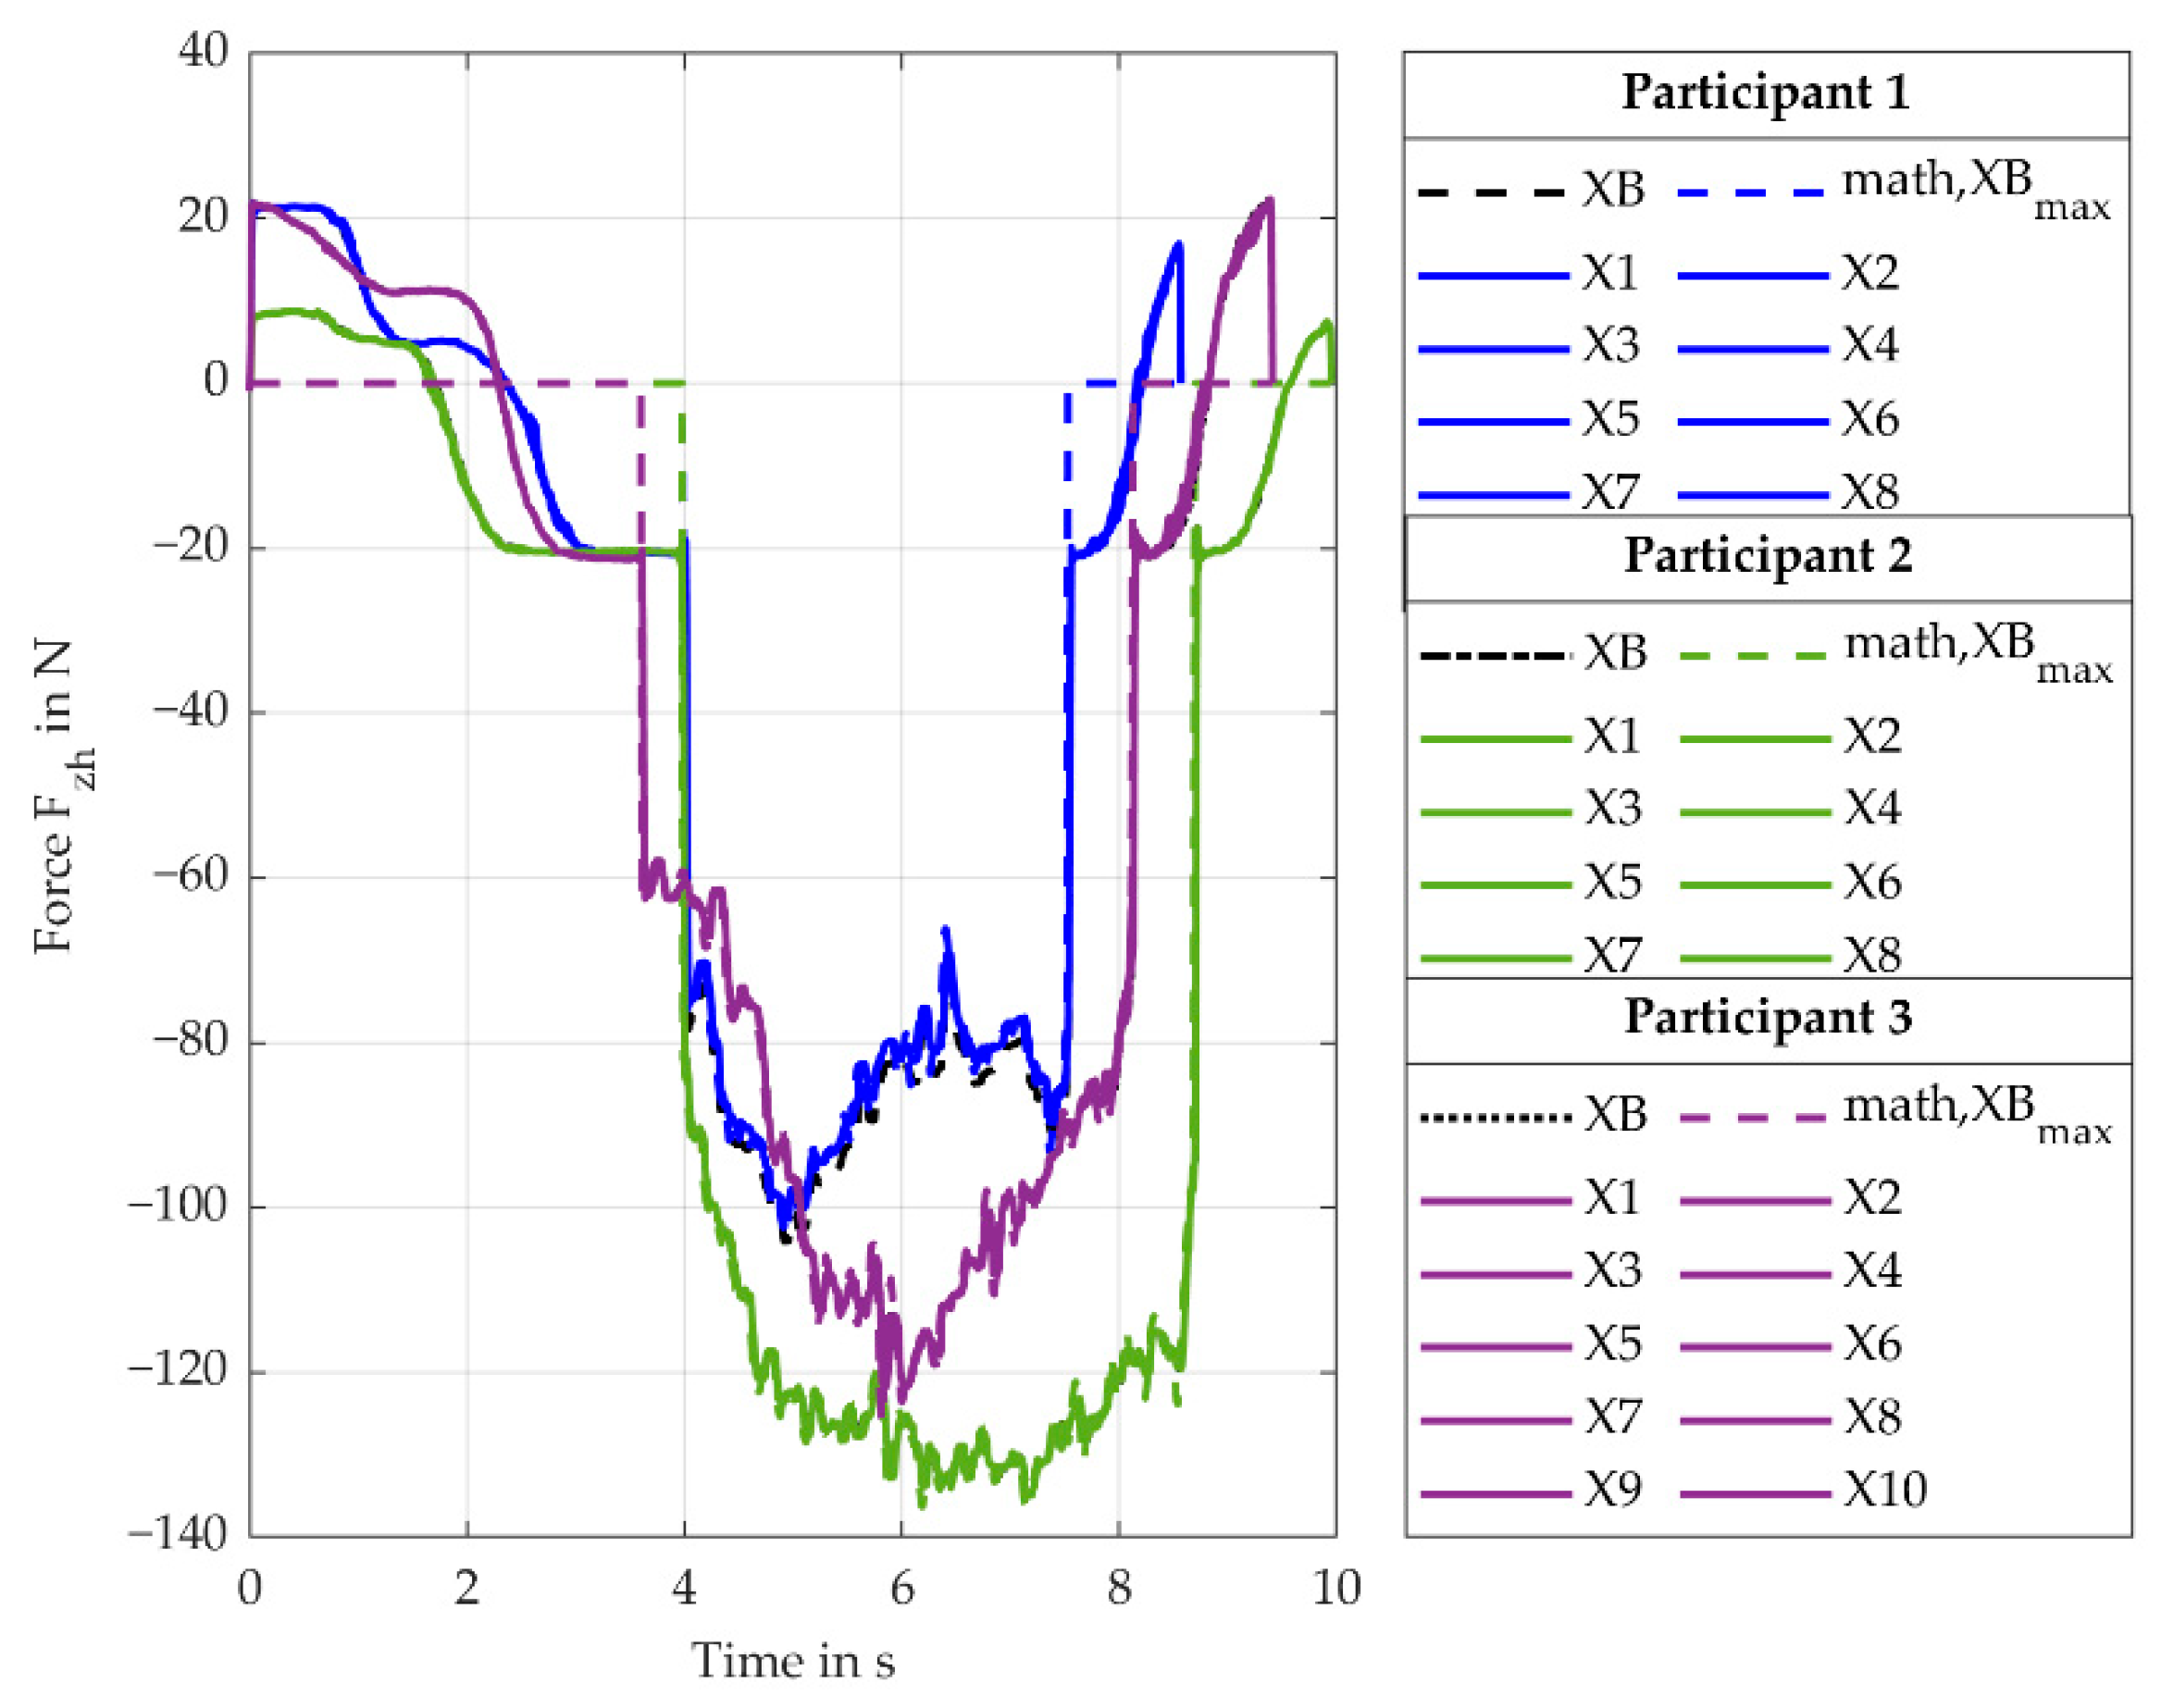
The torque (torque leads to pronosupination forearm, torque along the forearm axis) is mainly influenced by the process force during the screw-in process and by the weight force outside of the screw-in process. For the latter, the weight force induces a torque around the -axis. Since the axis are body-fixed, moving the screwdriver from its initial position (O1) to its upward position (O3) decreases this torque. After the screw-in process (O4), the screwdriver is again oriented vertically so the torque increases again. These torque values match the weight force times the corresponding lever. During the screw-in process, the torque increase from Y1 to Y10, as the -component of the process force induces a torque around the -axis. The maximum calculated values (math, X10max) fit the maximum simulated values of with a rMAE of 4.6% (SD 2.7%) showing again a successful verification. The minimum calculated values (math, XBmin) fit the baseline values with sufficient accuracy. The maximum offset is 0.4 Nm.
4.3. Limitations of the ApOL Model
The ApOL model allows us to determine interaction torques and forces between the screwdriver and the DHM. Nevertheless, some limitations exist, that have to be considered when looking at the results.
The process force
, the battery current, and the motion data used as input for the ApOL model are subject to inaccuracies and are based on studies performed by students and not professional workers as stated by [
31]. This should be taken into account in the product development of support systems for professionals. Since this data was determined based on an overhead task, the data is only valid for this specific use case.
Limiting the virtual sensor for the correlation of process torque and battery current is the constant push force of 100 N applied by the user during the experiment conducted by Sänger et al., 2023 [
30]. The authors showed that a constant push force on the test bench does not match reality. Moreover, the relative error discussed in
Section 4.1 induced by higher residuals for the linear approximation of the torque for torque values above 12 Nm has to be taken into consideration. This specific correlation is also only applicable to the specific screwdriver, the screws and the wood mentioned in Sänger et al., 2023 [
30].
The interaction forces and torques in sub-model C are calculated at the reference point. This sets some limitations to the accuracy of the determined values, since in real life, the loads are transferred on the surface of the handle onto the user. In addition, not considered in the multibody model is the drivetrain of the screwdriver, thus ignoring its inertia forces and torques. Even though the verification of the workload model was successful, a validation of the model is still missing. This could be achieved by measuring the interaction forces of the hand and screwdriver handle or by using this ApOL model for the determination of the user loads as input for musculoskeletal human models and comparing the muscular activities with surface electromyography (s-EMG) measurements from experimental studies.
In the modeling of the external torque
(resp.
, see
Figure 3) it was assumed that the process torque
is compensated by a lateral force
applied by the user. This represents a simplification of the human-machine interface between the hand of the DHM and the handle of the screwdriver.
Regarding the verification of the ApOL model, it must be taken into consideration that the analytical values were determined based on the assumption that the screwdriver is held perfectly upright in position (O3). This does not correspond to reality, making the analytical results only limited and comparable to the simulated ones as seen for the torque for the factor levels Y1–Y10.
5. Conclusions
This paper proposes an application-oriented workload (ApOL) model to evaluate interaction forces and torques between a cordless screwdriver and a DHM for an overhead drilling task. The model uses experimental data such as the battery current of the screwdriver, the push force of the user, as well as the motion of the user to determine external loads onto the user at the handle of the screwdriver. For the verification of the ApOL model, analytical results calculated from the process forces and the screwdriver mass during the screw-in process were compared to the simulated results. The verification was successful, as the rMAE between the simulated values and the calculated ones were all below 11.4% except for and . For the variation of the y- and z-coordinate (Y variation), the rMAE for all forces ( , ) is 11.4% (SD 4.6%) or smaller. For the torques (, ) the maximum rMAE 16.1% (SD 11.4%). However, the maximum MAE of the torques is 0.5 Nm (SD 0.1 Nm).
For the variation of the x-coordinate (X variation), the rMAE is comparable but occasionally lower. The maximum rMAE for the forces ( , ) is 9.4% (SD 4.6%) with a maximum MAE of 5.1 N (SD 3.4 N). The maximum rMAE of the toques (, , ) is 8.1% (SD 2.5%). Altering the screwdriver setup led to an expected change in the interaction torques and forces estimated at the handle of the screwdriver. For , , , , and , a noticeable portion of the load occurred outside of the screw-in process, showing the importance of modelling the mass of the technical system. To validate the workload model, the authors recommend a coupled DHM and ApOL model simulation to determine muscle activity and compare the calculated values to experimental surface EMG measurements.
In future work the proposed ApOL model can be used in the early stages of hand- or power tool- development to test different configurations of electric screwdrivers to estimate the load onto the user without the need for a physical prototype of the technical system. This allows the development of load-optimized power tools in a user-centered way, e.g., through optimal weight distribution of the power tool or individual optimization of the handle size. A challenge is the consideration of the anthropometry of the user e.g., hand size and finger length.
Considering the loads, the model can also be used to identify favorable setups for tasks supported by e.g., exoskeletons. This helps in the holistic development of support systems in combination with handheld power tools by modeling realistic interaction forces and torques. For example, setups can be found where the force distribution is shifted to increase the force components supported by the support system, while the force components acting on the user decrease. This helps further reduce stress on the human body and thus prevents musculoskeletal diseases.
The ApOL model can also be used to identify the influence of different drivetrain configurations and the motor controller by simply extending the sub-model C. Besides determining realistic loads, the model showed the ability to identify robust designs of the technical system, which eliminate noise factors and thus help develop systems, where the load is invariant from the user handling of the work task. This is important considering user-invariant loads reduce the cost and effort for the optimization procedure of the support system for each user.


 ,
, 
