Article

High-Performance Lightweight Fall Detection with an Improved YOLOv5s Algorithm

1
School of Computer, Electronics and Information, Guangxi University, Nanning 530004, China
2
School of Mechanical Engineering, Guangxi University, Nanning 530004, China
3
School of Engineering, RMIT University, Melbourne 3000, Australia
*
Authors to whom correspondence should be addressed.
These authors contributed equally to this work.
Machines 2023, 11(8), 818; https://doi.org/10.3390/machines11080818
Submission received: 22 May 2023 / Revised: 31 July 2023 / Accepted: 1 August 2023 / Published: 10 August 2023
(This article belongs to the Special Issue New Trends in Robotics and Automation)

Abstract

:
The aging population has drastically increased in the past two decades, stimulating the development of devices for healthcare and medical purposes. As one of the leading potential risks, the injuries caused by accidental falls at home are hazardous to the health (and even lifespan) of elderly people. In this paper, an improved YOLOv5s algorithm is proposed, aiming to improve the efficiency and accuracy of lightweight fall detection via the following modifications that elevate its accuracy and speed: first, a k-means++ clustering algorithm was applied to increase the accuracy of the anchor boxes; the backbone network was replaced with a lightweight ShuffleNetV2 network to embed simplified devices with limited computing ability; an SE attention mechanism module was added to the last layer of the backbone to improve the feature extraction capability; the GIOU loss function was replaced by a SIOU loss function to increase the accuracy of detection and the training speed. The results of testing show that the mAP of the improved algorithm was improved by 3.5%, the model size was reduced by 75%, and the time consumed for computation was reduced by 79.4% compared with the conventional YOLOv5s. The algorithm proposed in this paper has higher detection accuracy and detection speed. It is suitable for deployment in embedded devices with limited performance and with lower cost.

1. Introduction

The global population of individuals aged 65 and above is increasing rapidly [1]. Unattended falls can be a life-threatening risk to these individuals if they are unable to call for help. According to WHO’s global report on fall prevention among seniors, unintentional falls within the home environment rank as the second leading cause of accidental injuries and subsequent fatalities [2], and around half of this demographic are not able to stand up independently after they fall [3]. If the elderly lose consciousness due to the injury, they may miss the chance of timely treatment and face a higher risk of death [4]. However, if the elderly are equipped with fall detection devices, their physical conditions can be monitored and responded to in real time, and they can be rescued swiftly if their lives and health are threatened by a fatal injury caused by the accidental fall.
With the development of artificial intelligence, object detection algorithms are becoming more and more important to our lives and have been applied in many fields, such as security, healthcare, robotics [5], and autonomous driving [6,7,8]. Currently, there are two categories of fall detection methods: non-computer-vision-based detection methods, and computer-vision-based detection methods. The non-computer-vision-based methods detect fall movement via various sensors. For example, the elderly can wear wearable devices with built-in sensors (e.g., accelerometers) on the wrist, chest, or waist, and the fall movements can be detected by analyzing the human posture data (velocity, acceleration, etc.) obtained by these sensors. In a study of Mthie et al. [9], fall detection was implemented by analyzing the changes in acceleration signals of different movements, and falling and standing up movements were effectively distinguished. Lu et al. [10] analyzed the pressure signals to determine whether an accidental fall had occurred. However, these methods have the drawback of relying on the performance of the sensors, which increases the cost of the device. Furthermore, the installation/wearing of devices equipped with multiple sensors could reduce the comfort of the elderly in their daily lives. Fall detection via computer vision relies on figures and videos of the daily activities of elderly individuals recorded by cameras. When the person in the camera is detected to fall or to have fallen, the surveillance system can immediately send a distress message proactively so that they can be rescued in time. In the detection process, image processing, pattern recognition, and other related techniques are utilized to extract the information of human motion, and the human behavior detection model is constructed to identify the fall movement. Compared with the non-machine-vision methods, the machine vision methods have three main outstanding advantages: (1) they are non-intrusive, so the elderly are free from being inconvenienced by wearing the devices; (2) they are not affected by environmental noise, which prevents missed detection or misjudgment caused by the interference of wearable sensors; (3) they can monitor other abnormal emergencies at the same time.
With the advances in artificial intelligence, detection algorithms are becoming more and more important to our lives and have been applied in many fields, such as finance, medical treatment, robotics, and autonomous driving [6,11]. Currently, deep learning algorithms have become the mainstream in computer-vision-based fall detection and have been extensively investigated. Deep-learning-based fall detection algorithms can be categorized as either two-stage algorithms or one-stage algorithms. The two-stage detection algorithms, such as R-CNN [12], Fast R-CNN [13], and Faster R-CNN [14], initially generate a series of candidate frames as samples and then classify the samples via a convolutional neural network (CNN). Liu et al. [15] successfully used Faster R-CNN for the detection of the elderly falling off furniture. The algorithm detected and tracked human activity characteristics, measured the changes in these characteristics, and then determined whether the individual fell by analyzing the locations of the individual and the furniture in the Cartesian system. One obvious drawback of such algorithms is their slow detection speed. The one-stage algorithms predict the localization and classification of targets directly through the target detection network. The algorithms can implement the end-to-end prediction of target frames and target classes at once, making the detection faster and more efficient than that of the two-stage algorithms. The mainstream one-stage algorithms include SSD [16] and the YOLO [17,18,19] series algorithms. The YOLO series algorithms have the advantages of being fast and efficient, highly accurate, and easy to deploy and use. Among them, YOLOv5 is one of the leading target detection algorithms in the industry, with faster speed and higher accuracy than YOLOv3 and YOLOv4. Yin et al. [20] achieved real-time accurate fall detection using the improved YOLOv5s model, but the speed and volume of the algorithm were still deficient. This disadvantage led to an increase in cost in their study; that is, they needed to upload the video data to the cloud to judge whether a fall had taken place.
Although video monitoring systems are widely used in public places, this method still has limits in the detection of indoor falling. This is because the existing fall algorithms require a large net metering and bandwidth, whereas the slow speed of the home network limits the fall detection efficiency, making the algorithm difficult to deploy in embedded devices. In order to solve the problem of the efficiency and accuracy of detection, this paper proposes a lightweight fall detection algorithm based on YOLOv5s. The algorithm has the advantages of high detection accuracy, fast detection speed, less hardware requirement and computational burden, and is feasible for deployment in embedded devices. The structure of the paper is organized as follows: Section 2 illustrates the modelling of the lightweight YOLOv5s algorithm;. Section 3 describes the training and validation of the algorithm; Section 4 is the results and relevant discussions on the mechanisms of high-accuracy and high-efficiency detection achieved via the lightweight algorithm.

2. Methodology

2.1. The series of YOLOv5 Algorithms

Typically, there are four categories of YOLOv5 algorithm: YOLOv5s, YOLOv5m, YOLOv5l, and YOLOv5x; and these models differ in two parameters: the depth and the width of the network. The depth refers to the number of layers of the network, and the width refers to the number of channels output by the network layer.
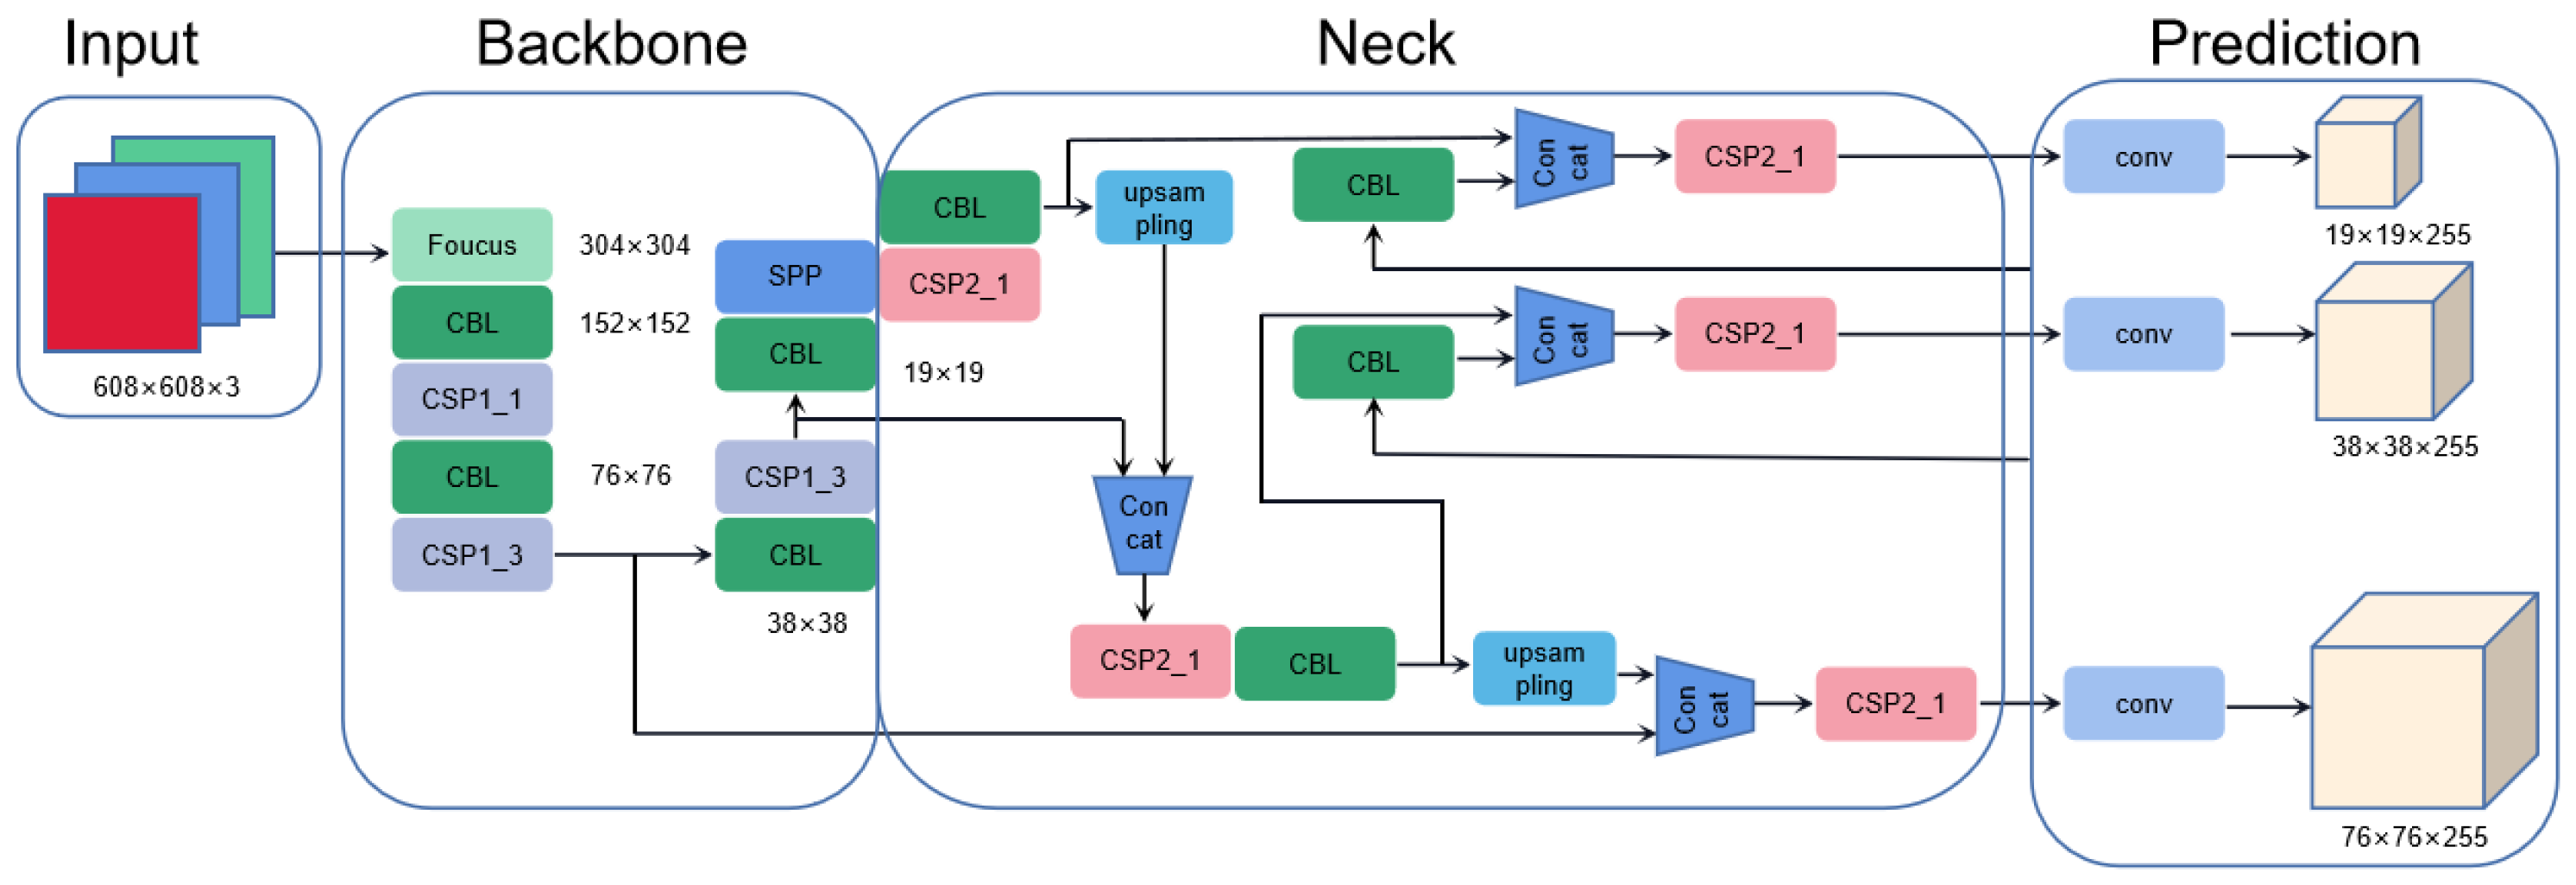
Increasing the width and depth of the model can improve the performance of detection; however, this also increases the computation time, consumes more memory, and increases the inference time. Among the algorithms, YOLOv5s has the smallest depth and width, and has fewer channels per layer of the output mapping networks, which significantly reduces the number of parameters and, eventually, computational tasks. The typical network structure of the YOLOv5s algorithm consists of four different parts: input, backbone, neck, and prediction (head), as shown in Figure 1.
The inputs of the YOLOv5 are images, which are processed via Mosaic-4 for data enhancement, including cropping, stitching, and scaling operations of the figures. This increases the training efficiency by enriching the detection dataset and enlarging the small-scale targets.
The Backbone part uses CSPDarknet53 as the feature extraction network. The network consists of Conv structure and C3 structure, which are used to extract the feature maps of the input images and provide the basis for the subsequent processing of the model. Then, the extracted feature maps are directly input to the spatial pyramid pooling module (SPP) and are transformed into feature vectors with fixed sizes.
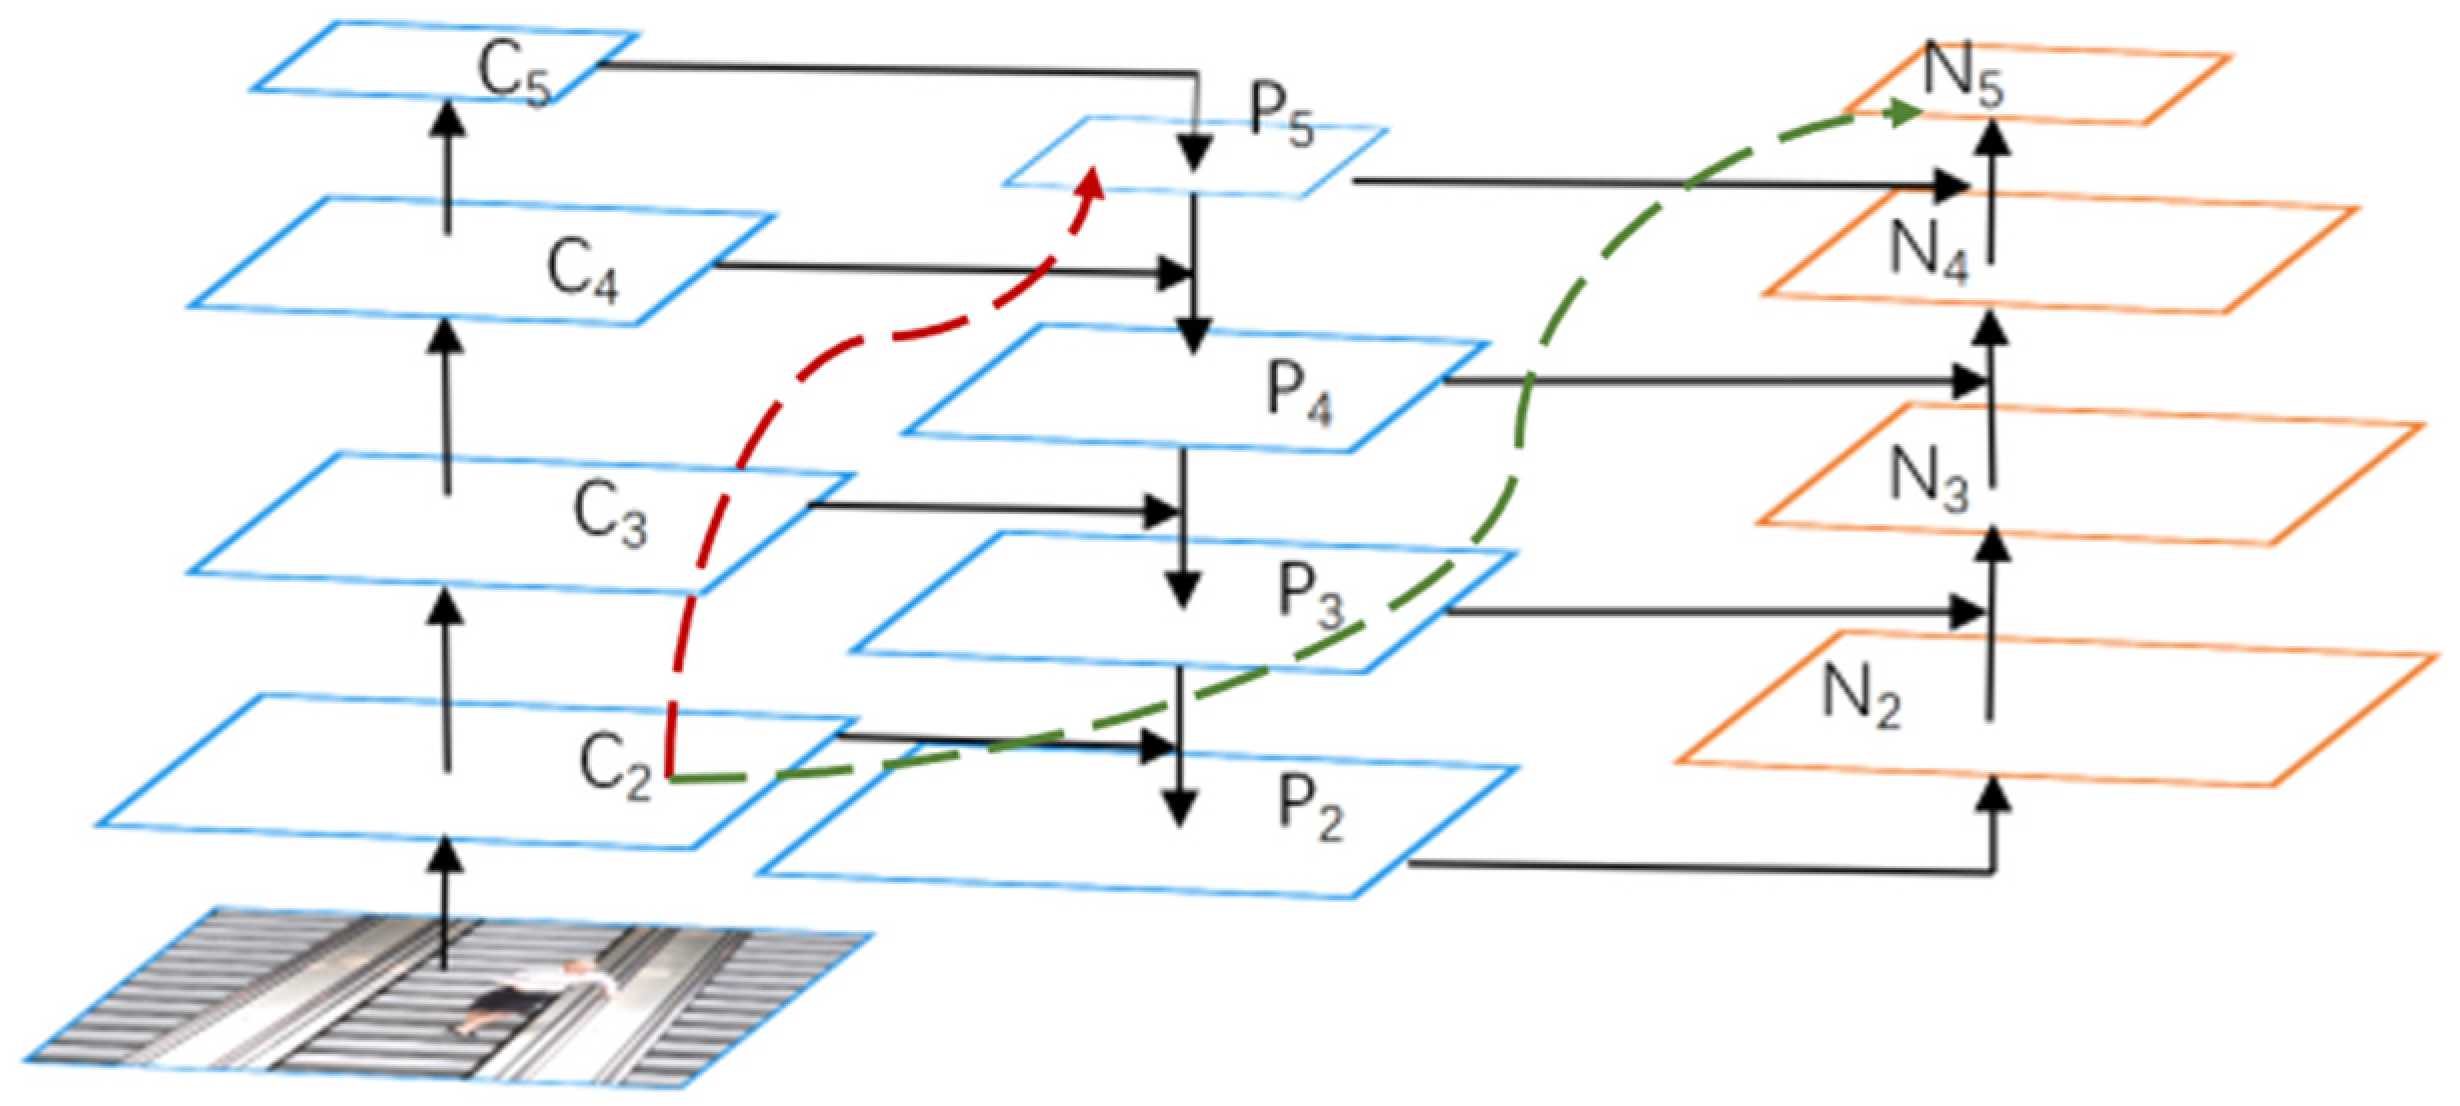
The neck network adopts a PANet+FPN [21] structure to achieve multi-scale feature fusion. FPN enhances the effect of target detection by fusing high underlying features, especially for small-sized targets; PANet [22] is the modified FPN with an additional bottom-up information flow path and the information delivery path is shortened, which enhances the accuracy of the underlying localization information to the entire feature extraction network. The structure of PANet is shown in Figure 2.
The head predicts the features of the target. Anchor boxes are applied on the targeted feature map to generate the final output vector with category probabilities and target boxes.

2.2. Improved YOLOv5s Network

Although YOLOv5s is relatively small in size among different versions of YOLOv5, it is still a challenge to deploy the YOLOv5s model directly into embedded devices due to the following potential issues: (1) real-time inference may be slow; (2) the model size may exceed the available memory of the embedded device, resulting in the model not being able to be loaded or run; (3) the device may overheat during inference, which affects the inference performance and lifespan of the device. Thus, further lightweight processing of the YOLOv5s algorithm is needed to reduce the computational task of the model.
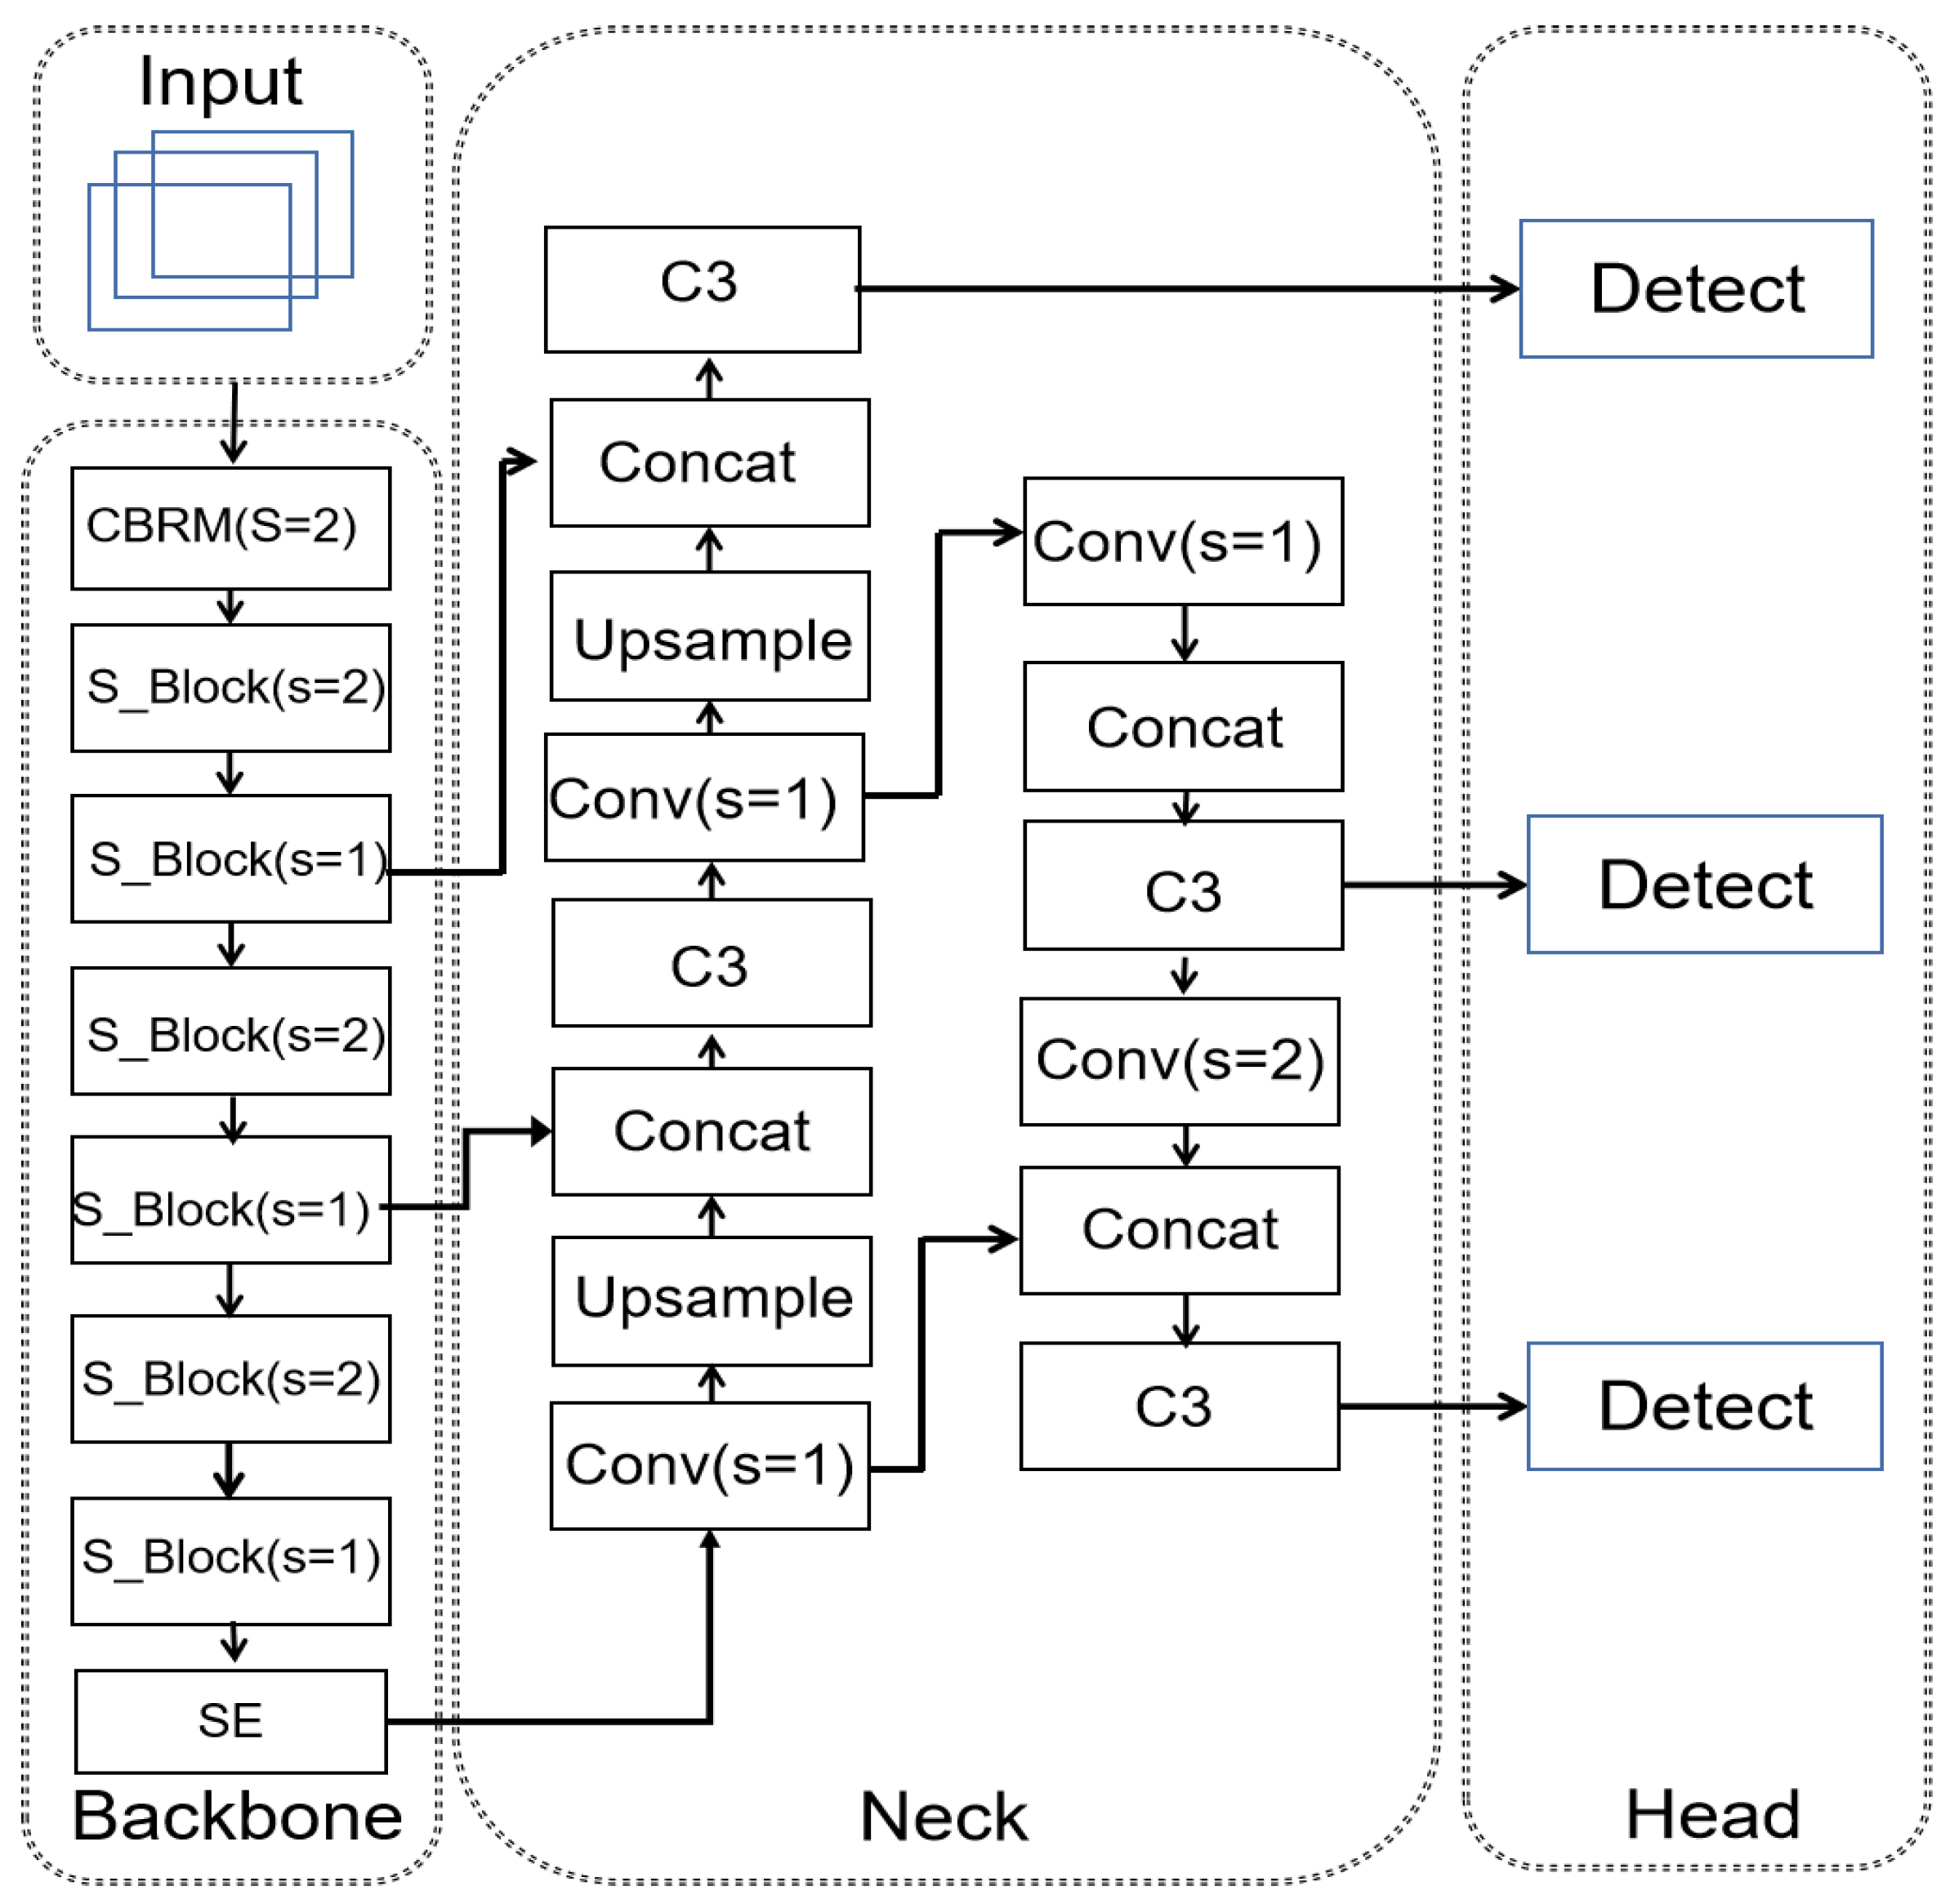
To optimize the algorithm by avoiding the issues, the K-means++ algorithm is used on the fall dataset to optimize the scale of predefined anchors, which improves the matching degree between anchor points and real samples. The backbone is replaced by the lightweight ShuffleNetV2 network to simplify the fall detection model. Then, the SE attention module is embedded at the end of the backbone to make up for the loss of accuracy caused by model simplification. Finally, the SIOU loss function is introduced to improve the detection accuracy of the model and accelerate the convergence speed. The structure of the improved YOLOv5s network is shown in Figure 3.

2.2.1. K-Means++ Algorithm

The anchor boxes in YOLOv5 are conventionally clustered using the K-means algorithm. However, this algorithm randomly assigns initial cluster centers, which could deviate from the optimal cluster centers, lead to local optimum solution, and impact the efficacy of the clustering. Therefore, the K-means++ clustering approach is applied to generate more proper anchor values, aiming to improve the training convergence without additional parameters and computation. The mechanism of K-means++ can be expressed as follows:
Firstly, a sample is randomly selected from the sample data set as the initial cluster center. The shortest distances between the samples and the selected clustering center are then calculated, and the samples are assigned to the category corresponding to its closest cluster center. The probability of each sample to be selected as the next cluster center is calculated according to Equation (1).
p = D ( n ) 2 n N D ( n ) 2
where D(n) represents the shortest distance from the sample to the cluster center. When a new sample is assigned into the cluster, the clustering center is recalculated based on the updated clustering samples. This process is repeated to select all the clusters to obtain the K clustering center set.
Table 1 shows the default and optimized sizes of the priori anchor boxes. The K-means++ algorithm selects the initial clustering centers using a smarter initialization, which avoids the instability of random initialization and avoids falling into local optimal solutions. Additionally, the K-means++ converges quickly after selecting the appropriate cluster centers, which plays a role in the training convergence of the fall detection dataset.
In Table 1, 80 × 80 represents the size of the shallow feature map (P3), which contains more low-level information and is suitable for the detection of small-sized targets. In contrast, 20 × 20 represents the size of the deep feature map (P5), which contains more high-level information, such as contour, structure, and other information, and it is suitable for the detection of large-sized targets. The other 40 × 40 is the size of the mesoscale feature map (P4), which uses an anchor size between the two mentioned above and is used for detecting medium-sized targets. The second column indicates the preset anchor box size for the three scales, and the two numbers in parentheses indicate the width and height of the anchor box. The third column shows the optimized anchor box size.

2.2.2. Lightweight ShuffleNetV2 Backbone Network

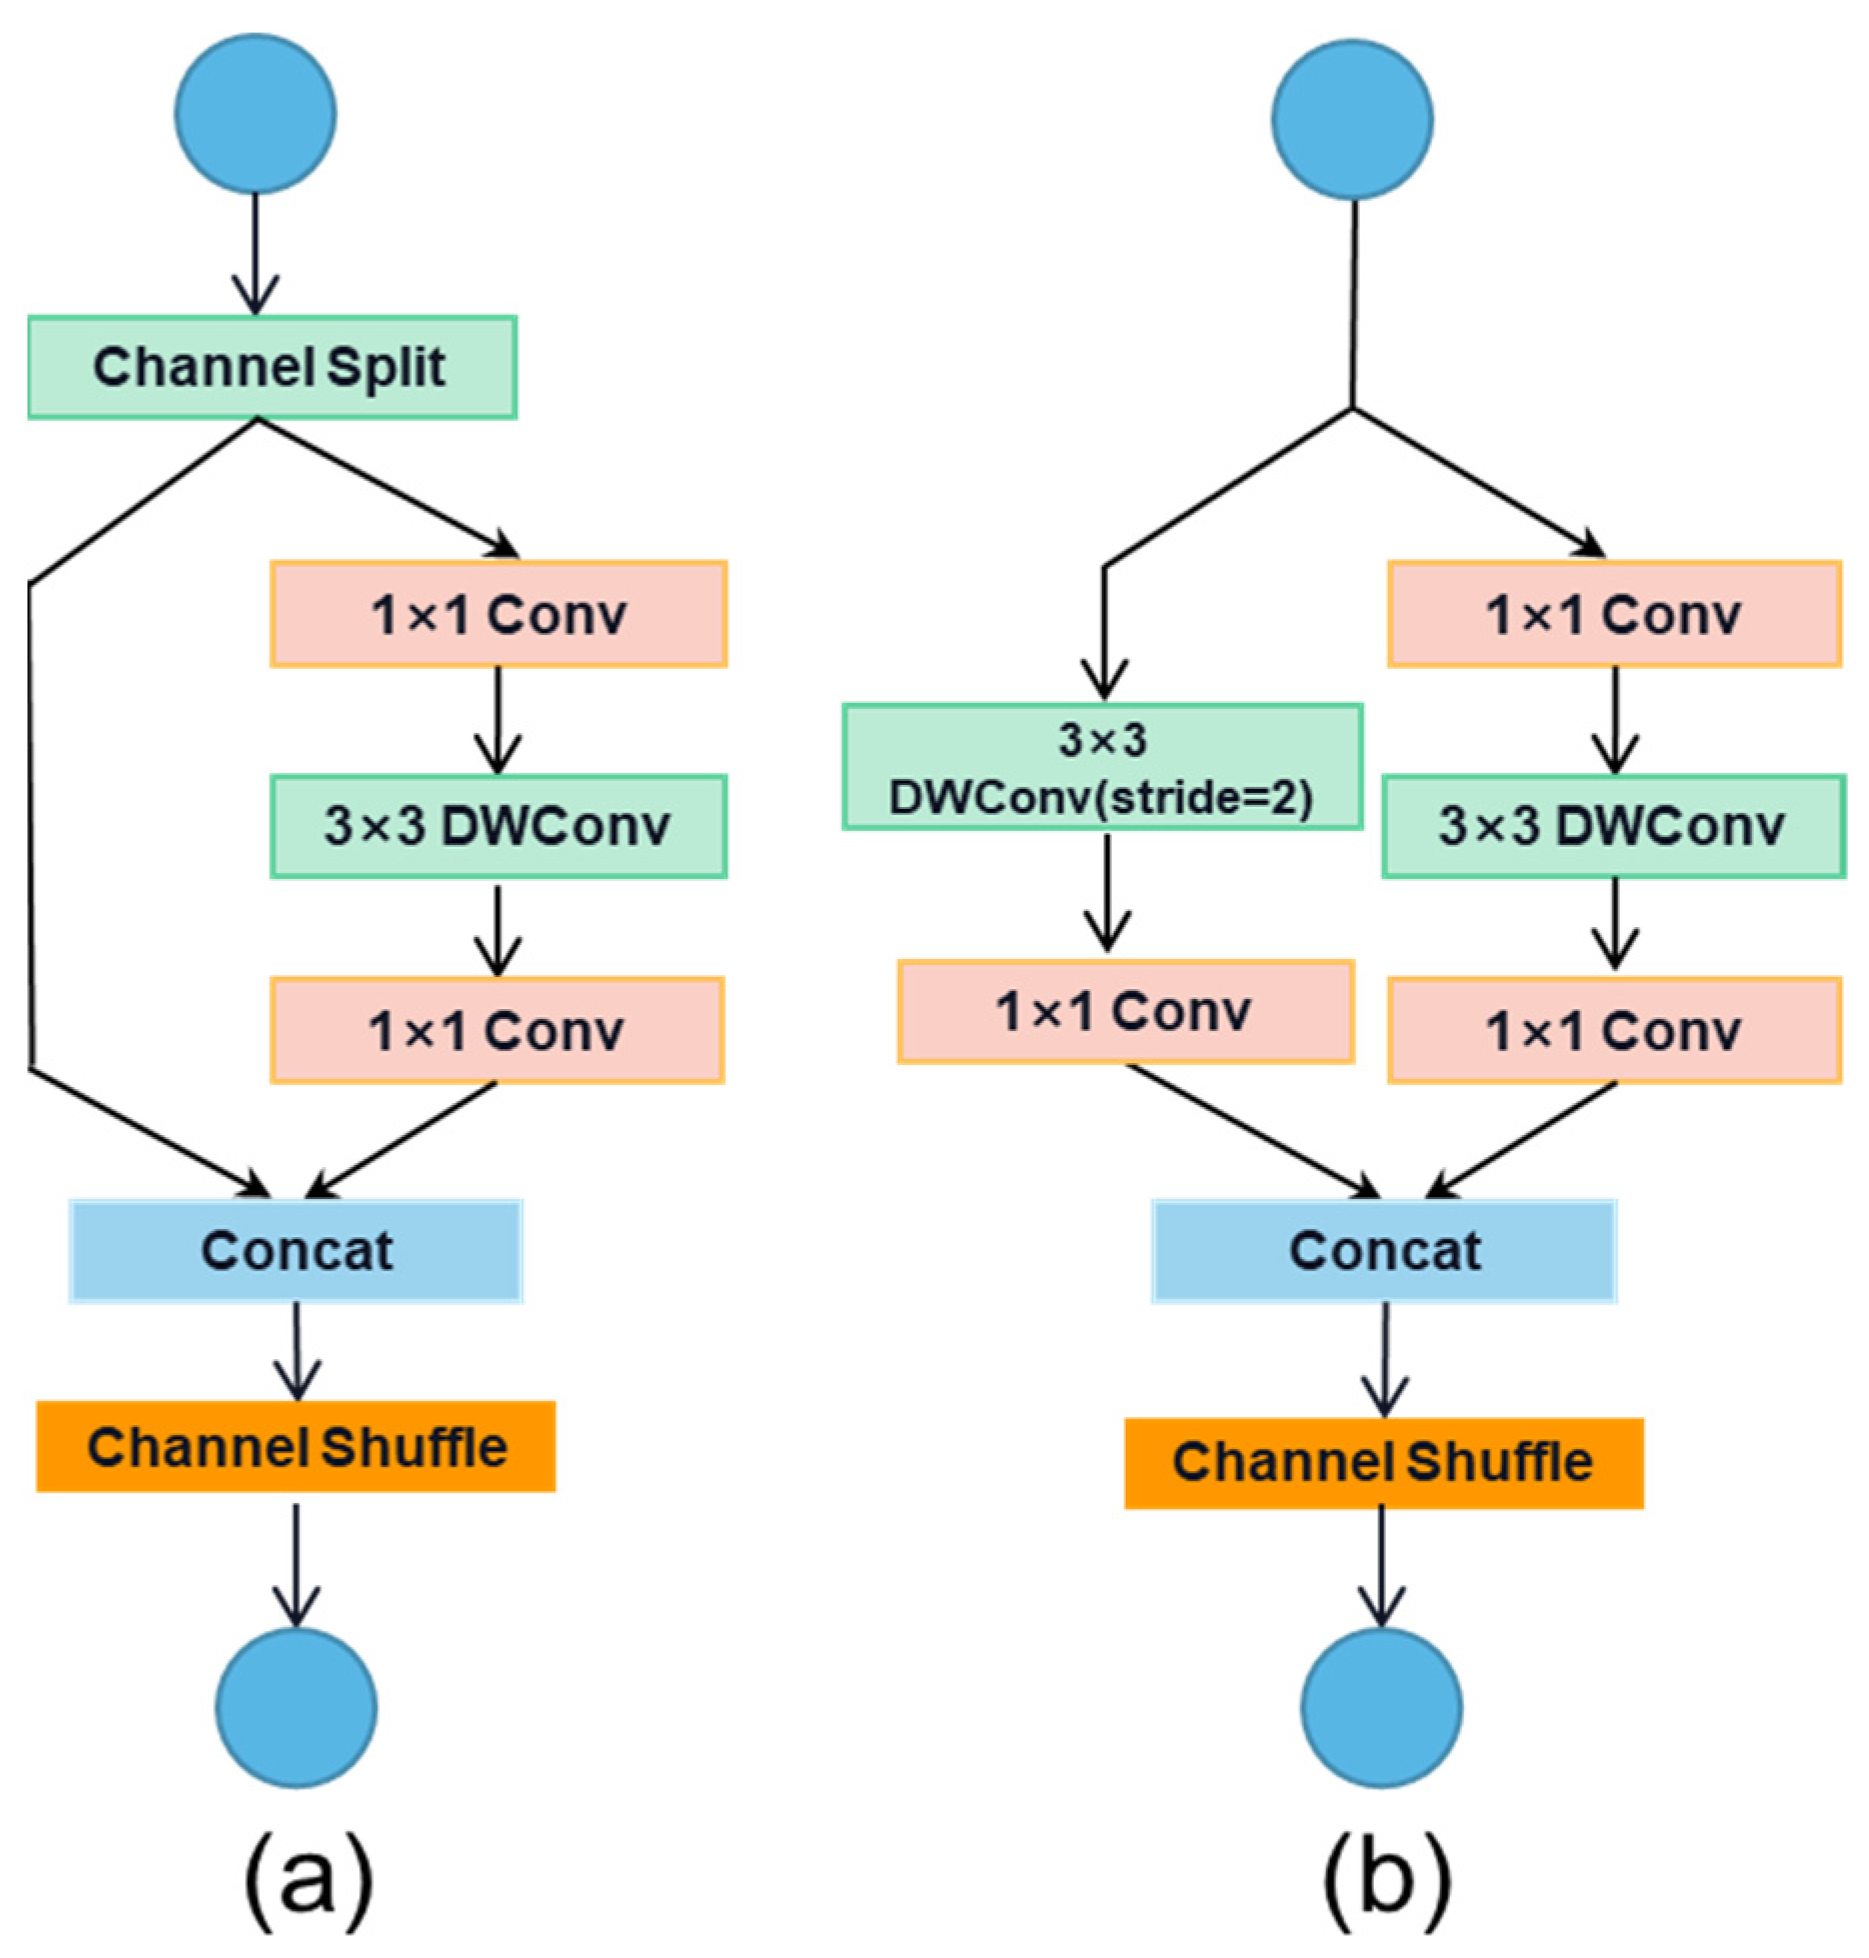
The CSPDarknet53 feature extraction network is commonly used in YOLOv5s. Although the features extraction is efficient, it is difficult to deploy the algorithm into the embedded devices due to its heavy computational duties. In this study, the ShuffleNetv2 [23] network was used in the improved algorithm to replace the original backbone of YOLOv5s, which met the requirements of being lightweight and highly accurate. ShuffleNetV2 inherits the deep separable convolution [24] and channel shuffle from ShuffleNetV1 [25], and can split the channel. The two basic units of ShuffleNetV2 are shown in Figure 4. It can be seen that the channels of the units are divided into two branches because the channel splits before concatenation (Figure 4a), which can effectively reduce the redundant features and increase the network computational efficiency. Adding the channel shuffle module after shortcut connections avoids the problem that the output of a channel only comes from a small part of the original feature map, which realizes the exchange of feature information between different branches and improves the detection accuracy. The application of channel split and channel shuffle compresses the computation and memory usage of the model, significantly simplifying the model.
For S_Block1, the left branch constantly maps through shortcut connections to increase the network structural depth, which reduces the fragmentation and accelerates the training speed. The right branch performs convolution through multiple layers to ensure the equal channel numbers of input and output. This minimizes the memory access to improve the modelling speed.
S_Block2 is a downsampling module where the two branches are introduced directly into the input without the splitting operation. It adjusts the number of channels using 1 × 1 convolution and downsamples of the depth convolution in steps of 2. The two branches are concatenated together to halve the size of the feature map and double the number of channels.

2.2.3. SE Attention Module

Inspired by the way that human eyes can naturally and efficiently find important areas in complex scenes, the “attention mechanism” has been introduced into the field of computer vision [26]. Due to its excellent performance, the attention mechanism is widely used to solve various tasks in computer vision, such as image recognition, object detection, semantic segmentation, etc. Currently, most studies focus on the extraction of spatial features but lack attention to different channels. To enhance the network’s perception of character motion features in videos, the relationship among the channels should be considered.
The SE attention module [27] can automatically learn the importance of each channel through training, and assign different weights to the spatial and channel dimensions of the network. The more important the information about the channel, the larger the weighting factor. This module directs the network to focus on important features and ignore irrelevant features, which improves its ability to distinguish the features. The structure of the SE attention module is shown in Figure 5.
The SE attention module consists of three main operations: Squeeze, Excitation, and Rescale. The Squeeze operation transforms the input feature map into a global description vector through global averaging pooling. The fall usually involves changes in human posture and the surrounding environment. With the Squeeze operation, the network is able to capture the global features from inputs, which provides a more comprehensive contextual understanding, and improves the accuracy on distinguishing fall movement from other motions. While keeping the number of channels C unchanged, the size of the input feature map is compressed from (H,W) to (1,1), and then global pooling is used to encode the overall spatial feature of one channel into a global feature. The value indicating the cth channel after the squeezing operation can be calculated via Equation (2).
z c = F s q ( u c ) = 1 H × W i = 1 H j = 1 W u c ( i , j )
where z c represents the one-dimensional vector of the cth feature. H represents the height of the feature map and W represents the width of the feature map. u c ( i , j ) denotes the cth global feature.
The Excitation operation emphasizes the attention of features related to the fall movement by learning the relationships among feature map channels. The features of the fall movement involve overall body movements and posture changes, which are often transferred via specific channels. Through the excitation operation, the network is able to self-adaptively learn the weights of each channel to highlight the focus on fall movement features, which enhances the network’s response to the channels related to fall movement, improving the accuracy and sensitivity of detection. The weights can be calculated via Equation (3).
s = F e x ( z , W ) = σ ( g ( z , W ) ) = σ ( W 2 δ ( W 2 δ ( W 1 z ) )
where σ refers to the Sigmoid function, δ refers to the ReLU function, and g ( z , W ) refers to the bottleneck structure consists of two fully connected layers, W 1 R C R × C and W 2 R C × C R .
The Rescale operation re-weights the feature map based on the learned excitation vectors. The detection of fall movement is usually disturbed by the complex background interference. By re-weighting the feature map, the rescale operation highlights important features and suppresses interference with less important features, which improves the localization and detection of fall movement and enhances the network’s ability to perceive key actions of falling. The rescaling the weights of the channels can be calculated via Equation (4).
x c ~ = F s c a l e ( u c , s c ) = s c u c
where x c ~ indicates the output result. F s c a l e ( u c , s c ) denotes the product of the feature map u c and channel weights s c .

2.2.4. Improvement of the Loss Function

In the YOLOv5s network, the loss function consists of three components: the rectangular frame loss, the classification loss, and the confidence loss. The rectangular box loss uses GIOU loss [28], which adds the smallest rectangular box surrounded by the real and predicted boxes in the calculation of the loss based on IOU. This solves the problem of gradient vanish when there is no overlapping area between the two boxes. Assuming that A represents the ground truth, B represents the prediction frame, and C is the smallest bounding box that can cover them, the GIOU loss can be calculated by the following equations:
I O U = A B A B
G I O U = I O U C A B C
L G I O U = 1 G I O U
However, GIOU could degenerate to IOU when the predicting box contains the ground truth. Additionally, slower convergence and less-accurate regression are the major drawback of the GIOU. Therefore, the improved algorithm uses SIOU loss [29] to replace the original GIOU loss function in this study. SIOU loss considers the vector angle between the desired regressions and the redefined penalty indicator. The SIOU loss function consists of four losses: angular loss, distance loss, shape loss, and IOU loss.
For the angle loss, SIOU loss adds the angle perception between the center of the real frame B g t and the predicted frame B, which reduces the distance-related extra variables. The angle loss can be calculated with the following equations:
d = ( b x g t b c x ) 2 + ( b c y g t b c y ) 2
B h = m a x ( b c y g t , b c y ) m i n ( b c y g t , b c y )
x = B h d = sin ( α )
Λ = 1 2 × s i n 2 ( arcsin ( x ) π 4 )
where Λ is the final calculation result of the angular loss. x is the sine of the angle α between the center points of the real and predicted frames in the figure; d is the distance between them; and B h is the relative height difference between the two points.
The distance loss of SIOU (Δ) is different from that of GIOU due to the new addition of the angle calculation, which is expressed as follows:
ρ x = ( b c x g t b c x c w ) 2 , ρ y = ( b c y g t b c y c h ) , γ = 2 Λ
= t = x , y ( 1 e γ ρ t )
where ρ x and ρ y are the squared ratios of the relative distances of the centroids of the real and predicted boxes in the X and Y directions to the width and height of the smallest outer rectangles. e is the Euler constant.
The formula for calculating shape loss is shown in Equations (14) and (15).
W w = w w g t m a x ( w , w g t ) , W h = h h g t m a x ( h , h g t )
Ω = t = w , h ( 1 e w t ) θ
where w , h and ( w g t , h g t ) are the widths and heights of the prediction frame and the real frame, respectively; θ is the attention coefficient in the shape loss calculation formula, and the values were defined between 2 and 6 for different data sets.
The final SIOU loss can be calculated via Equation (16).
L S I O U = 1 I O U + Δ + Ω 2
The SIOU loss function effectively increases the convergence speed of the model and improves the performance of the fall detection model.
3. Training and Testing of the Algorithm

3.1. Training Environment

In this study, the training of the lightweight algorithm was implemented on a commercial desktop, and the specifications of the hardware are listed in Table 2. The major parameters of the improved YOLOv5s in the training process were set as follows: the epoch was 300, the batch size was 16, the learning rate was 0.01, the cosine annealing hyperparameter was 0.15, the stochastic gradient descent optimizer SGD (Stochastic Gradient Descent) was used, the learning rate momentum of the optimizer was 0.937, and the weight decay coefficient was 0.0003.

3.2. Testing Environment

In order to facilitate the deployment of deep learning models into the right edge development hardware, NVIDIA has launched a number of miniature AI development kits, such as Jetson AGX Orin, Jetson Orin NX, Jetson AGX Xavier series, Jetson Xavier NX series, Jetson TX2 series, Jetson Nano, etc. Jetson Nano is cost-effective, and the power consumption is lower among these development kits. It was used as the embedded device for deployment in this study. Table 3 shows the configuration details of the Jetson Nano used in the testing experiments.

3.3. Dataset

The fall detection dataset, which was the set of images of falling-down figures, was used to simulate falls in different circumstances. To enhance the robustness and generalization ability of the training algorithm, and the fall detection performance under different conditions, we used a data augmentation method on the dataset. As shown in Figure 6, the data enhancement operations, such as darkening, brightening, flipping, Gaussian noise addition, salt and pepper noise addition, and equalization, were used to simulate various situations that may occur in the real world, including different indoor lighting levels and different viewing angles. After data augmentation, the final dataset contained 9,834 images, which were made up of 7,984 training images and 1,850 testing images (Table 4).
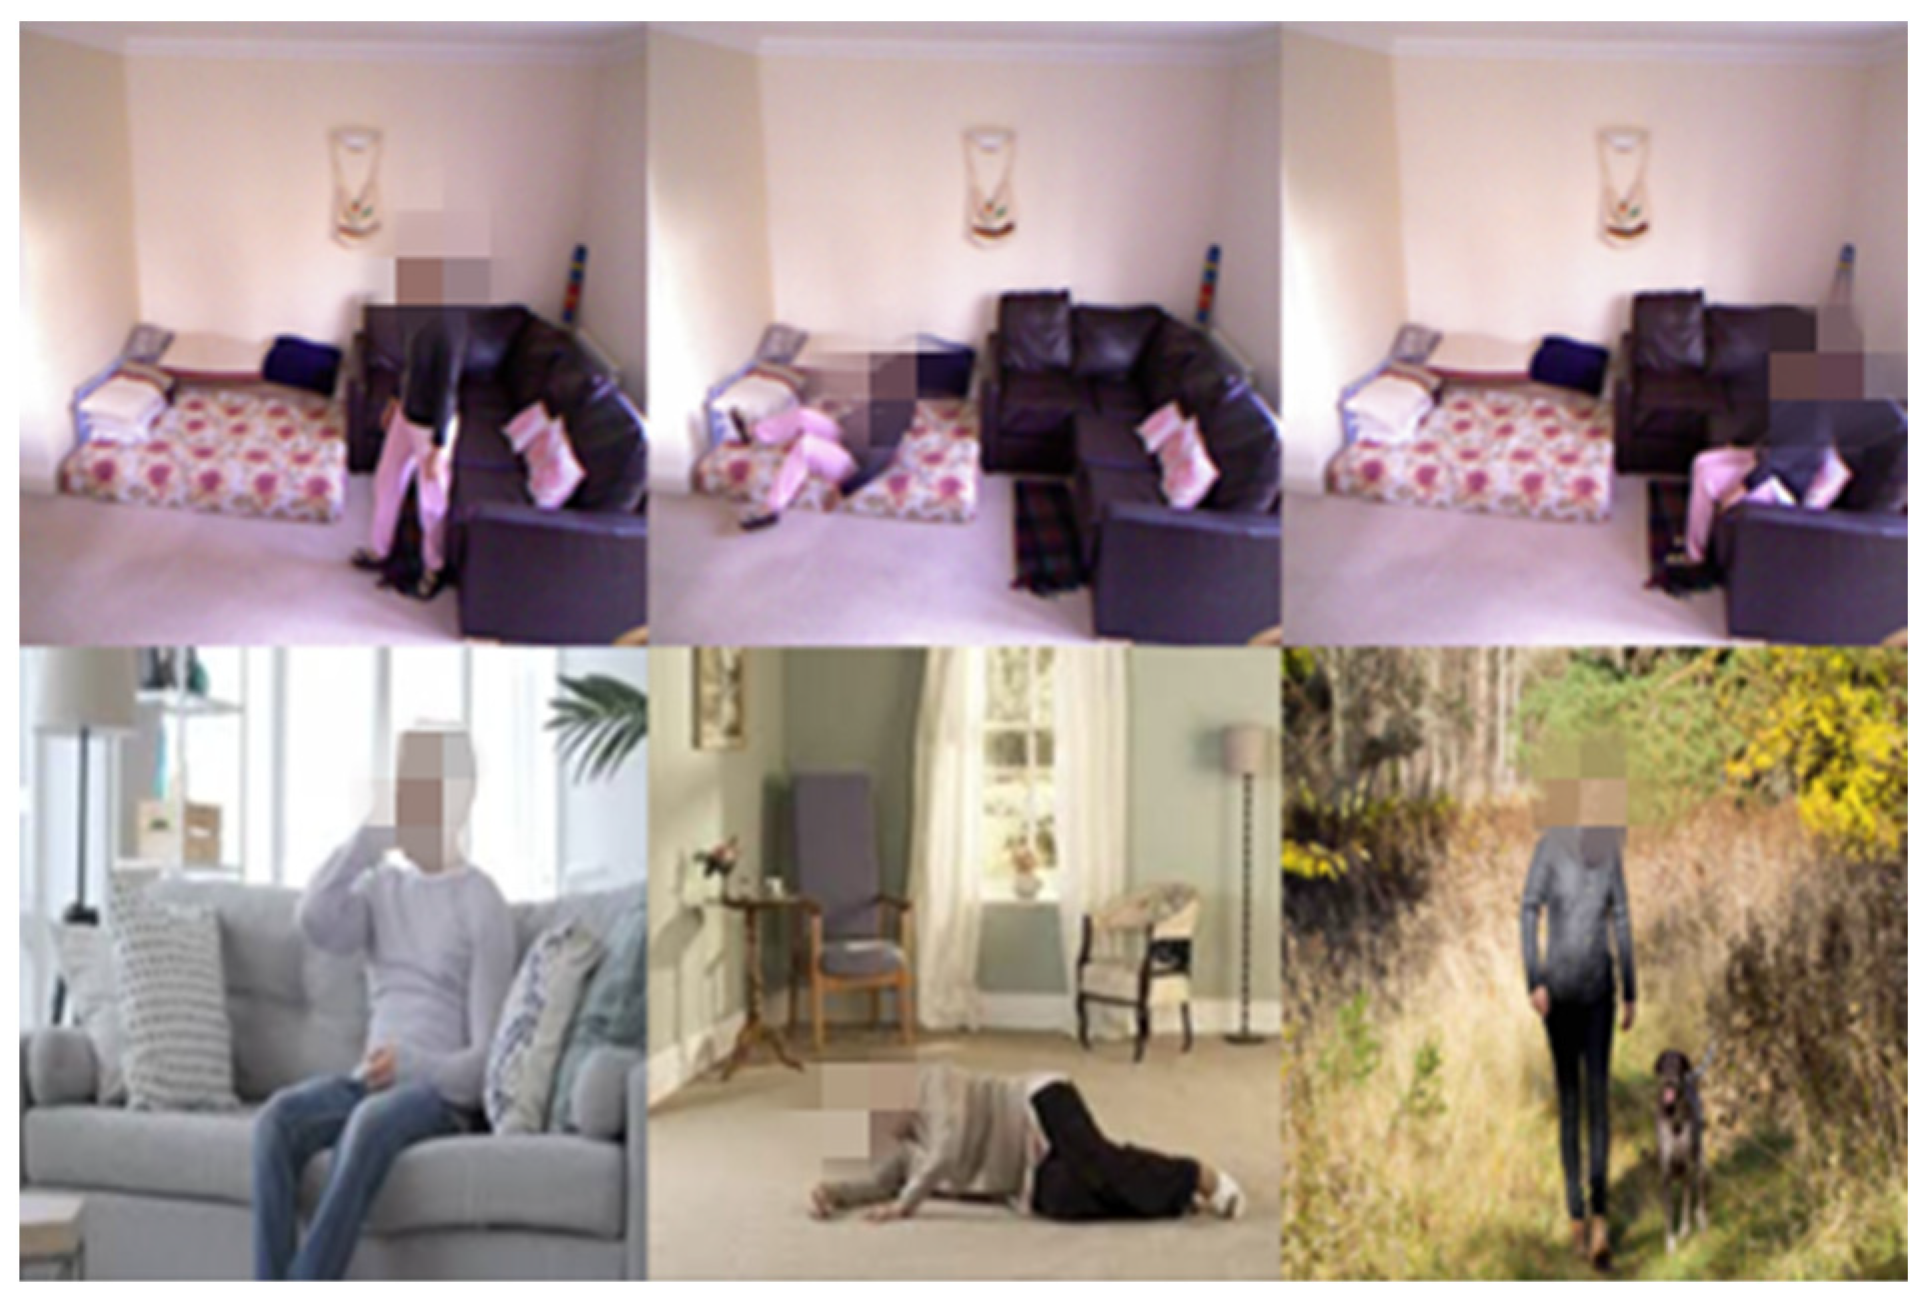
The dataset contained three categories, “Fall detected”, “Walking”, and “Sitting”. Figure 7 shows some images from this dataset. The sample distributions of the above three categories are shown in Table 4.

4. Results and Discussion

4.1. Evaluation of the Improved Yolov5s Algorithm

In this study, ablation experiments were conducted using the self-built fall detection dataset to test the validity of the algorithm, and the performance of the algorithm was evaluated via the following parameters: the number of parameters (Param), floating-point operations per second (FLOPs), and the size of the model weight files (Weights) were used to evaluate whether a model is lightweight. Specifically, the Param is the sum of the parameters in a model, which is an important indicator of memory usage and the initialization time of the program. The computational volume, also known as FLOPs, is the sum of the number of multiplications and additions when performing forward inference, which reflects the requirement of the hardware due to the computational units and the size of the model. The model weight file (Weights) is required for the final deployment. For devices with limited space resources, it is necessary to keep the model weight file as small as possible.
In addition, the detection effect was evaluated using Precision (P), Recall (R), mean Average Precision (mAP), and forward pass time (FP). Precision is the proportion of true positive examples in the prediction result; Recall is the proportion of all positive examples that are correctly predicted; mAP is the average precision value for each class; FP time is the time that is required for data to pass through the neural network, from input to output. The four indicators can be quantified via the following equations:
P = T P T P + F P
R = T P T P + F N
A P = 0 1 P d R
m A P = i N A P i N
where T P is the number of targets detected correctly by the model, F P is the number of targets detected incorrectly by the model, and F N is the number of correct targets missed by the model. Therefore, the FP time is the sum of preprocessing time, inference time, and NMS time.

4.2. The results of Ablation Experiment

To validate the model, ablation experiments were conducted using the self-built fall detection dataset in this study. The specific results of the ablation experiments are shown in Table 5. The “√” indicates that the corresponding method was used to improve the model, and the “-” denotes that the corresponding method was not applied in the fall detection model.
According to Table 5, compared with the conventional YOLOv5s model, the detection accuracy of the improved algorithm is improved with the application of the K-means++ clustering algorithm which generated anchor frames. By replacing the original CSPDarknet53 feature extraction network with the lightweight ShuffleNetV2 network, the model lost some accuracy and the mAP decreased by 2.8%, compared with the original YOLOv5s model. Table 5 also shows the results of different modified YOLOv5s models. It can be found that the value of Param of the model is reduced by 66.2% and the Weight is reduced by 74%. This significantly reduces the complexity and computational task of the algorithm and boosts the detection speed while maintaining the light weight. With the addition of the SE attention module, the mAP is improved by 1.2% with a minimum influence on the size and complexity of the model; this verifies the effectiveness of adding the SE attention module, which trades a small amount of computation for a large improvement in detection performance. By replacing the original GIOU loss function with the SIOU loss function, the change in mAP is insignificant (1.4%), thus verifying the effectiveness of the SIOU loss function. Furthermore, the improved model improves detection accuracy by 3.5%, reduces weight by 75%, reduces number of parameters by 66.2%, and reduces computation by 79.4%, compared with the YOLOv5s model. The detection speed was boosted, and the weight was significantly reduced, while ensuring accuracy, which reflects the feasibility of deploying the improved real-time fall detection algorithm in embedded devices with limited computational resources.

4.3. Comparison with Different Algorithms

To further evaluate the performance of the improved algorithm, a variety of current mainstream target detection algorithms, including Faster R-CNN, YOLOv3, YOLOv4, and YOLOv5, were used as comparisons in an in-house fall detection dataset, and the results of the various detection models are shown in Table 6.
Among the listed models, the faster R-CNN cannot meet the requirements of high accuracy and high speed of fall detection because the algorithm requires two stages to complete the inference task, making the calculation too complex to perform real-time reasoning tasks. Although YOLOv3 and YOLOv4 algorithms have higher detecting accuracy, they are not appropriate for the deployment in embedded devices with limited computing resources due to the larger size of their models, number of parameters, and higher computation burden. By comparing the performance of the YOLOv5 and the improved-YOLOv5m models, it can be found that the overall performance of the improved model, Improved-YOLOv5, is better; it outperforms the base model YOLOv5s, which is the base model of those listed in Table 6.
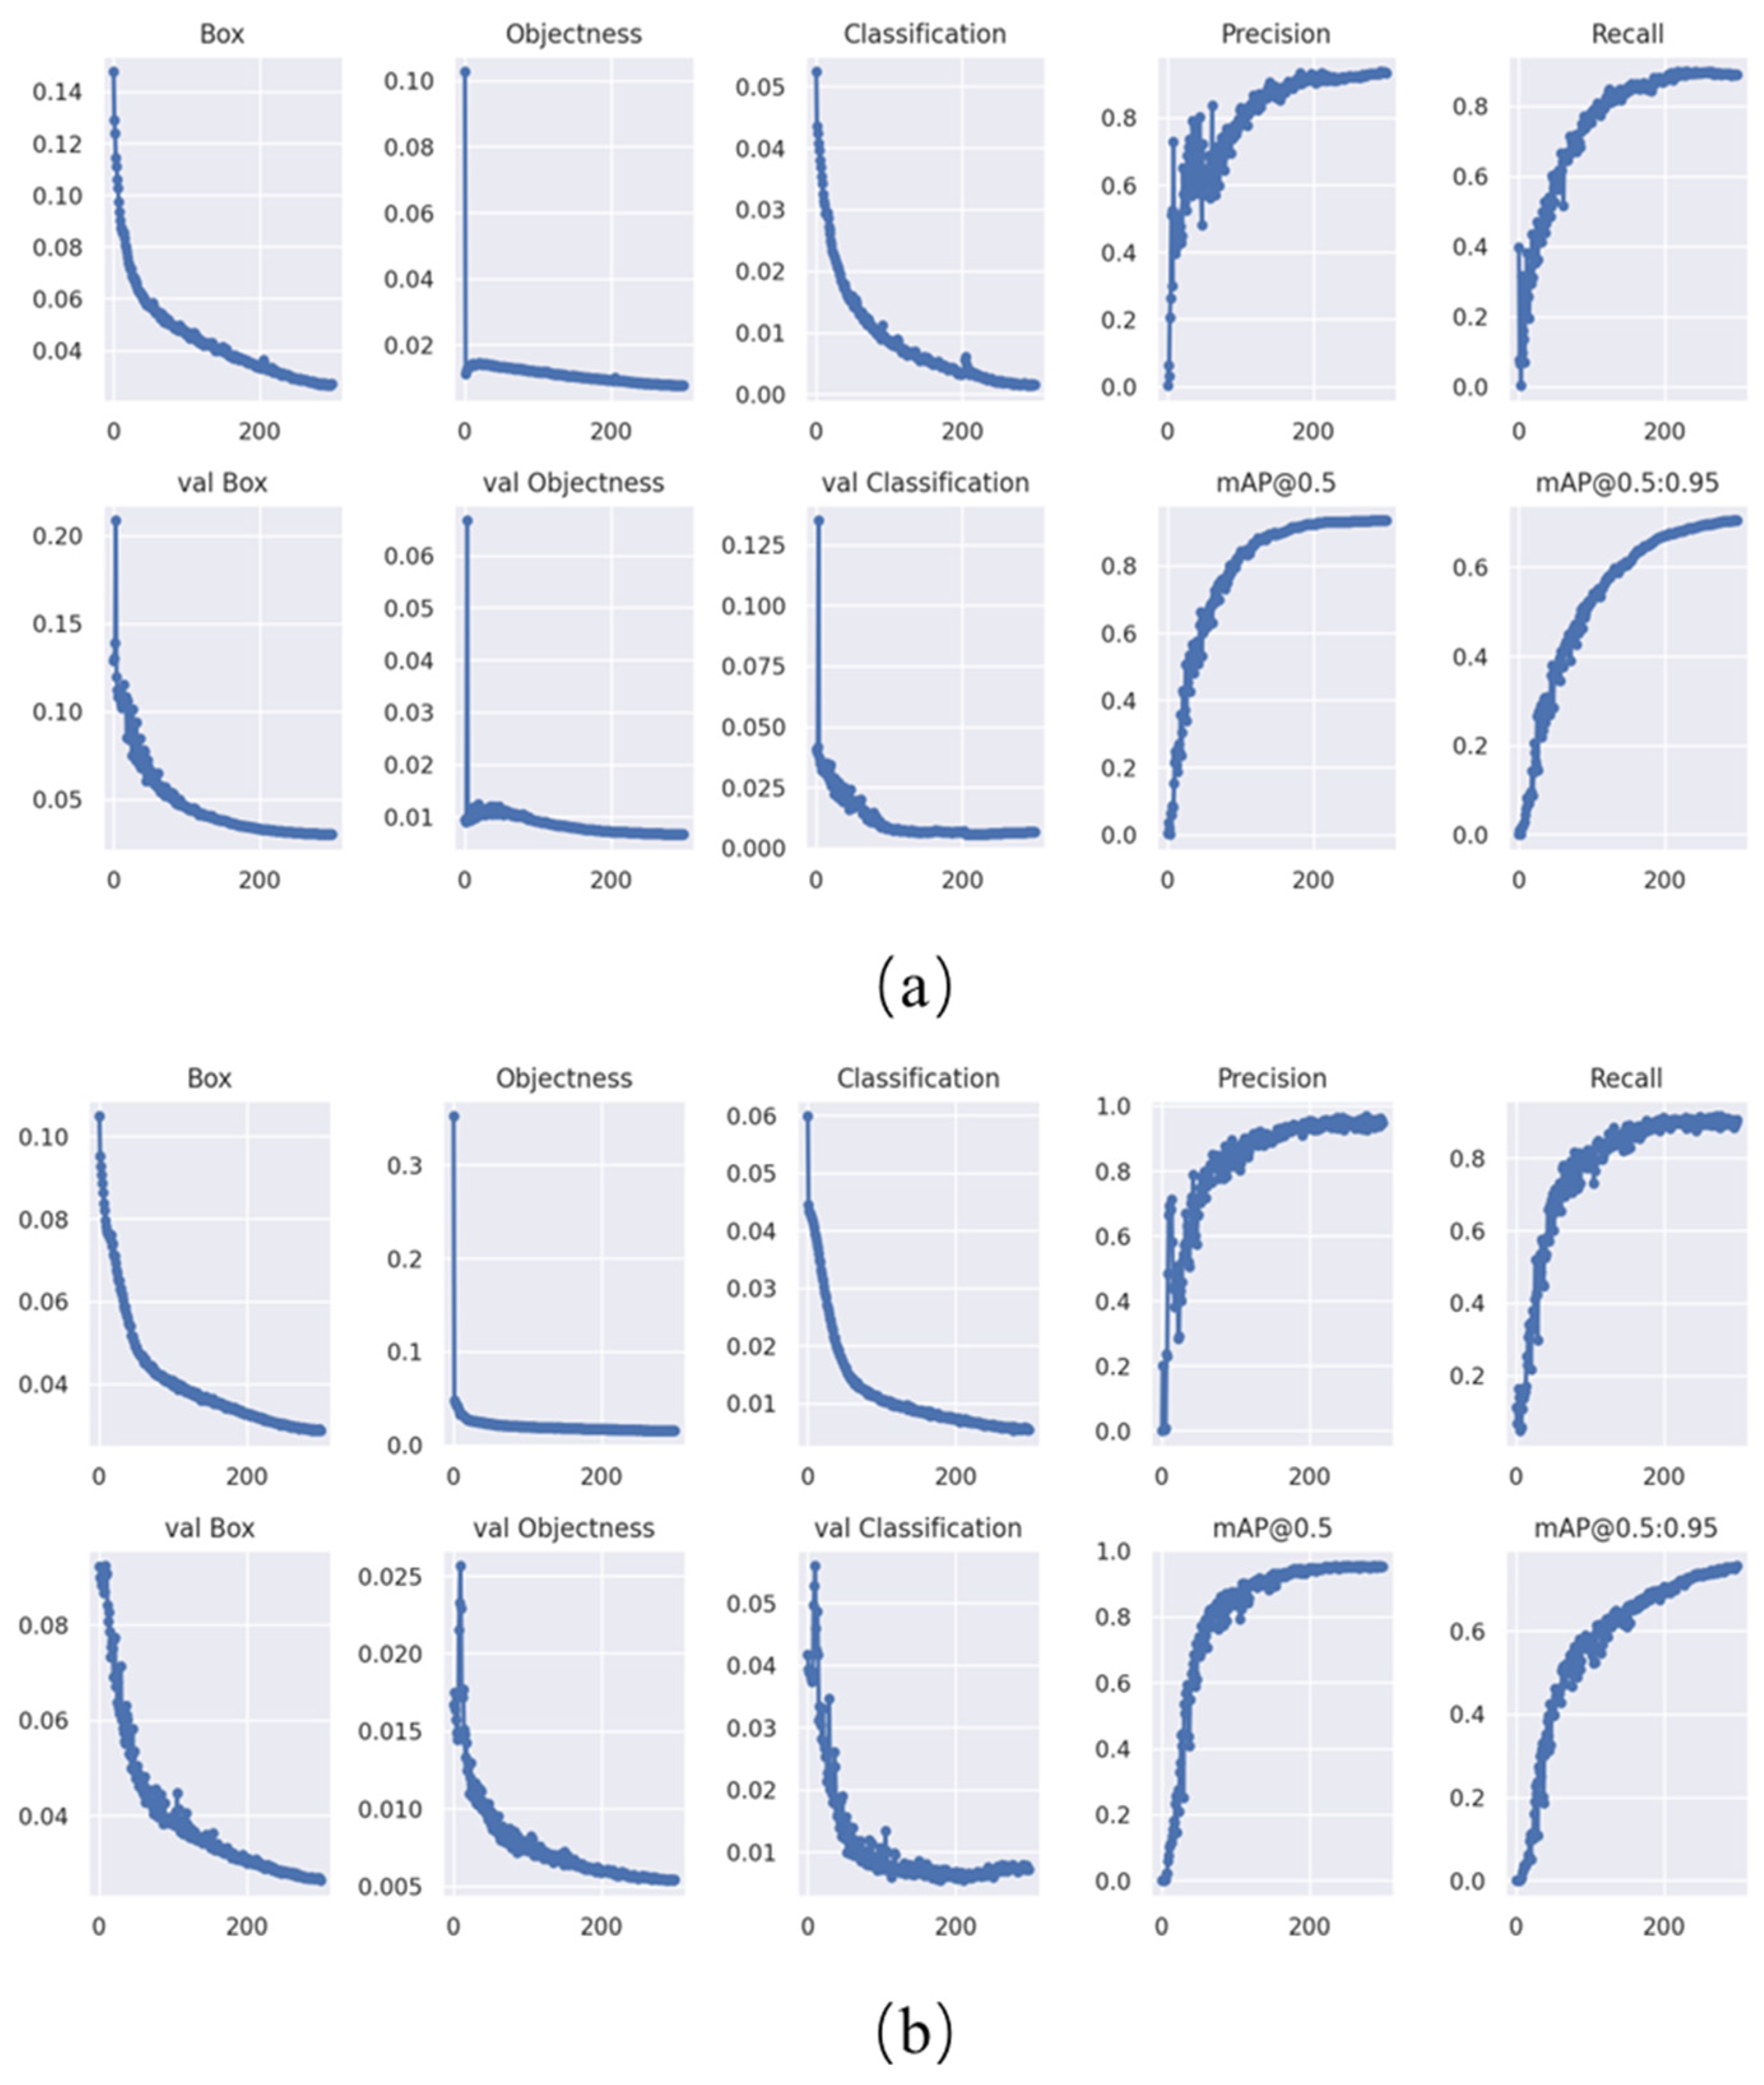
The experimental results shown in Figure 8 demonstrate the parametric performance curves of the model before and after improvement. The figure not only shows performance curves such as accuracy, recall rate, and mAP, but also presents the loss curve of model parameter optimization. The Box curve represents the boundary box loss, with a smaller value indicating the target with higher accuracy. The Objectness curve represents the inferred average loss of the target; the smaller the value, the more accurate the target detection. The classification curve is the inferred average loss for classification. The smaller the value, the more accurate the target classification. From the results before and after optimization, it can be seen that the optimized model has better overall loss and detection performance.
Figure 9 shows the visualization of the above model tested on randomly selected images in the test set. According to the results of the comparative experiments in Table 5 and the results of the visualization tests in Figure 9, the Improved-YOLOv5 model has higher detection accuracy than other mainstream detection models. Additionally, according to the three metrics of Param, FLOPs, and Weight, it can be seen that the Improved-YOLOv5 model has lower complexity which reduced the computational tasks. This means the improved-YOLOv5s algorithm meets the lightweight design requirements. The fall detection can be conducted both quickly and accurately, and it is suitable for deployment in embedded devices.

4.4. Embedded Device Deployment Experiment

The experiments in this section are designed to evaluate the detecting speed of the improved model on an embedded device in practice. Jetson Nano was used as the hardware for deploying the model (Figure 10). Both YOLOv5s model and the improved YOLOv5s model were deployed on the device, and their inference speed was evaluated using the FP time. The shorter the forward pass time, the faster the model’s inference.
The main factors affecting FP time include: (1) the size of the input image. The larger the size of the input image, the more pixel points needed to be processed, and the more pre-propagation time is needed; (2) the complexity of the model and the number of parameters. Larger models usually require more computational resources and time; (3) hardware devices. The speed of forward pass is affected by hardware devices. The use of GPU can significantly improve the forward pass speed of the model. In general, the better the performance of the GPU, the shorter the time required for forward pass; (4) batch size, which is the number of images input at one time. Larger batch sizes usually result in higher parallelism and increase the speed of forward propagation. However, the batch size is also limited by the size of the available graphic memory.
In the experiments, the YOLOv5s model and the Improved-YOLOv5 model were deployed into the same Jetson Nano, and the sizes of the testing images were 640 × 640, 512 × 512, and 320 × 320. The comparative results of the detecting speeds of the two models are shown in Table 7. It can be seen that, when the size of the input image is 640 × 640, the FP time of the improved model is reduced by 22.3% compared to the YOLOv5s model. When the size of the input image is 512 × 512, the FP time of the improved model is reduced by 14.9% compared to the YOLOv5s model. When the size of the input image is 320 × 320, the FP time of the improved model is reduced by 14.0% compared with the YOLOv5s model. With the reduction of the input image size, the FP time of both models decreases. It is also verified that the FP time is affected by the input image size. The experimental results show that the model Improved-YOLOv5 has faster detection speed than YOLOv5s. The improved model achieves a well-balanced detection speed and accuracy.

5. Conclusions

An effective lightweight fall detection algorithm based on YOLOv5s, which is feasible for the deployment in an embedded device, the Jetson Nano, is proposed in this study. The model used the K-means++ algorithm on a fall dataset, and optimized the scale of predefined anchors and improved the matching degree between anchor points and real samples. The backbone was replaced by the lightweight ShuffleNetV2 network to simplify the fall detection model. The SE attention module was embedded in the end of the backbone to make up for the loss of accuracy caused by model simplification. The SIOU loss function was applied to improve the detection accuracy of the model and to accelerate the convergence speed. The experiment results of testing showed that the mAP of the improved algorithm was improved by 3.5%, the model size was reduced by 75%, and the time consumption of computation was reduced by 79.4% compared with the conventional YOLOv5s. The improved model has a higher accuracy and faster detection speed, and is appropriate for deployment in embedded devices such as Jetson Nano. It can detect the activity status of the elderly at home in real time and can quickly detect a fall, so that the fallen person can be helped as soon as possible.

Author Contributions

Conceptualization, Z.C. and Y.W.; Methodology, Z.C. and Y.W.; Validation, M.L. and G.L.; Investigation, Z.C. and Y.W.; Resources, Y.W. and Z.C.; Data curation, M.L.; Writing—original draft, Z.C. and Y.W.; Writing—review and editing, G.L. and S.D.; Visualization, M.L. and G.L.; Supervision, G.L. and S.D. All authors have read and agreed to the published version of the manuscript.

Funding

This research received no external funding.

Data Availability Statement

No new data were created or analyzed in this study. Data sharing is not applicable to this article.

Conflicts of Interest

The authors declare no conflict of interest.

Abbreviations

SymbolDefinition
D ( n ) The shortest distance from the sample to the cluster center
z c Global eigenvalues of channel c
H Height of the feature map
W Width of the feature map
u c ( i , j ) Eigenvalues of channel c at point (i,j)
δ ReLU function
σ Sigmoid function
W 1 Weight matrix of the first fully connected layer
W 2 Weight matrix of the second fully connected layer
s Weight vectors
F s q ( ) Squeeze function
F e x ( ) Excitation function
F s c a l e ( ) Recalibration function
B g t Center of the real frame
B Predicted frame
B h Relative height difference
Λ Angular loss
x Sine of the angle α between the center points of the real and predicted frames
ρ x Squared ratios of the relative distances of the centroids of the real and predicted boxes on the X direction to the width and height of their smallest outer rectangles
ρ y Squared ratios of the relative distances of the centroids of the real and predicted boxes on the Y direction to the width and height of their smallest outer rectangles
( w , h ) Width and height of the prediction frame
( w g t , h g t ) Width and height of the real frame
Ω Shape loss
θ Attention coefficient in the shape loss

References

  1. Raza, A.; Yousaf, M.H.; Velastin, S.A. Human Fall Detection using YOLO: A Real-Time and AI-on-the-Edge Perspective. In Proceedings of the 2022 12th International Conference on Pattern Recognition Systems (ICPRS), Saint-Etienne, France, 7–10 June 2022; pp. 1–6. [Google Scholar]
  2. Kong, Y.; Huang, J.; Huang, S.; Wei, Z.; Wang, S. Learning Spatiotemporal Representations for Human Fall Detection in Surveillance Video. J. Vis. Commun. Image Represent. 2019, 59, 215–230. [Google Scholar] [CrossRef]
  3. Roush, R.E.; Teasdale, T.A.; Murphy, J.N.; Kirk, M.S. Impact of a personal emergency response system on hospital utilization by community-residing elders. South. Med. J. 1995, 88, 917–922. [Google Scholar] [CrossRef] [PubMed]
  4. West, J.; Hippisley-Cox, J.; Coupland, C.A.; Price, G.M.; Groom, L.M.; Kendrick, D.; Webber, E. Do rates of hospital admission for falls and hip fracture in elderly people vary. Public Health 2004, 118, 576–581. [Google Scholar] [CrossRef] [PubMed]
  5. Hu, Z.; Zhang, Y.; Lv, C. Affine Layer-Enabled Transfer Learning for Eye Tracking with Facial Feature Detection in Human–Machine Interactions. Machines 2022, 10, 853. [Google Scholar] [CrossRef]
  6. He, X.; Lou, B.; Yang, H.; Lv, C. Robust Decision Making for Autonomous Vehicles at Highway On-Ramps: A Constrained Adversarial Reinforcement Learning Approach. IEEE Trans. Intell. Transp. Syst. 2023, 24, 4103–4113. [Google Scholar] [CrossRef]
  7. He, X.; Yang, H.; Hu, Z.; Lv, C. Robust Lane Change Decision Making for Autonomous Vehicles: An Observation Adversarial Reinforcement Learning Approach. IEEE Trans. Intell. Veh. 2023, 8, 184–193. [Google Scholar] [CrossRef]
  8. He, X.; Liu, Y.; Lv, C.; Ji, X.; Liu, Y. Emergency steering control of autonomous vehicle for collision avoidance and stabilisation. Veh. Syst. Dyn. 2019, 57, 1163–1187. [Google Scholar] [CrossRef]
  9. Mathie, M.J.; Coster, A.C.F.; Lovell, N.H.; Celler, B.G. Accelerometry: Providing an integrated, practical method for long-term, ambulatory monitoring of human movement. Physiol. Meas. 2004, 25, R1. [Google Scholar] [CrossRef] [PubMed] [Green Version]
  10. Lu, W.; Wang, C.; Stevens, M.C.; Redmond, S.J.; Lovell, N.H. Low-power operation of a barometric pressure sensor for use in an automatic fall detector. In Proceedings of the 2016 38th Annual International Conference of the IEEE Engineering in Medicine and Biology Society (EMBC), Orlando, FL, USA, 16–20 August 2016. [Google Scholar]
  11. He, X.; Lv, C. Towards Energy-Efficient Autonomous Driving: A Multi-Objective Reinforcement Learning Approach. IEEE/CAA J. Autom. Sin. 2023, 10, 2–10. [Google Scholar] [CrossRef]
  12. Girshick, R.; Donahue, J.; Darrell, T.; Malik, J. Rich feature hierarchies for accurate object detection and semantic segmentation. In Proceedings of the 27th IEEE Conference on Computer Vision and Pattern Recognition (CVPR), Columbus, OH, USA, 23–28 June 2014; pp. 580–587. [Google Scholar]
  13. Girshick, R. Fast R-CNN. In Proceedings of the IEEE International Conference on Computer Vision, Santiago, Chile, 11–18 December 2015; pp. 1440–1448. [Google Scholar]
  14. Ren, S.Q.; He, K.M.; Girshick, R.; Sun, J. Faster R-CNN: Towards Real-Time Object Detection with Region Proposal Networks. IEEE Trans. Pattern Anal. Mach. Intell. 2017, 39, 1137–1149. [Google Scholar] [CrossRef] [PubMed] [Green Version]
  15. Min, W.; Cui, H.; Rao, H.; Li, Z.; Yao, L. Detection of Human Falls on Furniture Using Scene Analysis Based on Deep Learning and Activity Characteristics. IEEE Access 2018, 6, 9324–9335. [Google Scholar] [CrossRef]
  16. Liu, W.; Anguelov, D.; Erhan, D.; Szegedy, C.; Reed, S.; Fu, C.Y.; Berg, A.C. SSD: Single Shot MultiBox Detector. In Proceedings of the 14th European Conference on Computer Vision (ECCV), Amsterdam, The Netherlands, 8–16 October 2016; pp. 21–37. [Google Scholar]
  17. Redmon, J.; Divvala, S.; Girshick, R.; Farhadi, A. You Only Look Once: Unified, Real-Time Object Detection. In Proceedings of the 2016 IEEE Conference on Computer Vision and Pattern Recognition (CVPR), Seattle, WA, USA, 27–30 June 2016; pp. 779–788. [Google Scholar]
  18. Redmon, J.; Farhadi, A. YOLO9000: Better, Faster, Stronger. In Proceedings of the 30th IEEE/CVF Conference on Computer Vision and Pattern Recognition (CVPR), Honolulu, HI, USA, 21–26 July 2017; pp. 6517–6525. [Google Scholar]
  19. Redmon, J.; Farhadi, A. YOLOv3: An Incremental Improvement. arXiv 2018, arXiv:1804.02767. [Google Scholar]
  20. Yin, Y.; Lei, L.; Liang, M.; Li, X.; He, Y.; Qin, L. Research on Fall Detection Algorithm for the Elderly Living Alone Based on YOLO. In Proceedings of the 2021 IEEE International Conference on Emergency Science and Information Technology (ICESIT), Chongqing, China, 22–24 November 2021; pp. 403–408. [Google Scholar]
  21. Rezatofighi, H.; Tsoi, N.; Gwak, J.; Sadeghian, A.; Reid, I.; Savarese, S. Generalized Intersection Over Union: A Metric and a Loss for Bounding Box Regression. In Proceedings of the IEEE/CVF Conference on Computer Vision and Pattern Recognition, Long Beach, CA, USA, 15 –20 June 2019; pp. 658–666. [Google Scholar]
  22. Al-Smadi, Y.; Alauthman, M.; Al-Qerem, A.; Aldweesh, A.; Quaddoura, R.; Aburub, F.; Mansour, K.; Alhmiedat, T. Early Wildfire Smoke Detection Using Different YOLO Models. Machines 2023, 11, 246. [Google Scholar] [CrossRef]
  23. Ma, N.N.; Zhang, X.Y.; Zheng, H.T.; Sun, J. ShuffleNet V2: Practical Guidelines for Efficient CNN Architecture Design. In Proceedings of the 15th European Conference on Computer Vision (ECCV), Munich, Germany, 8–14 September 2018; pp. 122–138. [Google Scholar]
  24. Gao, H.; Zhang, Y.; Lv, W.; Yin, J.; Qasim, T.; Wang, D. A Deep Convolutional Generative Adversarial Networks-Based Method for Defect Detection in Small Sample Industrial Parts Images. Appl. Sci. 2022, 12, 6569. [Google Scholar] [CrossRef]
  25. Zhang, X.; Zhou, X.Y.; Lin, M.X.; Sun, R. ShuffleNet: An Extremely Efficient Convolutional Neural Network for Mobile Devices. In Proceedings of the 31st IEEE/CVF Conference on Computer Vision and Pattern Recognition (CVPR), Salt Lake City, UT, USA, 18–23 June 2018; pp. 6848–6856. [Google Scholar]
  26. Hu, Z.; Zhang, Y.; Li, Q.; Lv, C. A Novel Heterogeneous Network for Modeling Driver Attention With Multi-Level Visual Content. IEEE Trans. Intell. Transp. Syst. 2022, 23, 24343–24354. [Google Scholar] [CrossRef]
  27. Hu, J.; Shen, L.; Sun, G. Squeeze-and-Excitation Networks. IEEE Trans. Pattern Anal. Mach. Intell. 2020, 42, 2011–2023. [Google Scholar] [CrossRef] [PubMed] [Green Version]
  28. Belmont, J.W.; Gibbs, R.A. Genome-wide linkage disequilibrium and haplotype maps. Am. J. Pharmacogenom. Genom.-Relat. Res. Drug Dev. Clin. Pract. 2004, 4, 253–262. [Google Scholar] [CrossRef]
  29. Gevorgyan, Z. SIoU Loss: More Powerful Learning for Bounding Box Regression. arXiv 2022, arXiv:2205.12740. [Google Scholar]
Figure 1. The network structure of YOLOv5s.
Machines 11 00818 g001
Figure 2. Network structure of PANet.
Machines 11 00818 g002
Figure 3. Network structure of improved YOLOv5s.
Machines 11 00818 g003
Figure 4. Basic unit of ShuffleNetv2. (a) S_Block1 (b) S_Block2.
Machines 11 00818 g004
Figure 5. SE net structure.
Machines 11 00818 g005
Figure 6. Data augmentation methods for self-made dataset.
Machines 11 00818 g006
Figure 7. Some images from the dataset.
Machines 11 00818 g007
Figure 8. Comparison of training metrics. (a) The training metrics of YOLOv5s; (b) The training metrics of Improved-YOLOv5.
Machines 11 00818 g008
Figure 9. The detection performance of different models.
Machines 11 00818 g009
Figure 10. Jetson Nano embedded device.
Machines 11 00818 g010
Table 1. Prior anchor frame size before and after improvement.
Feature Map ScaleDefault Anchor Box SizeOptimized Anchor Box Size
Small scale (P3, 80 × 80)(10,13) (16,30) (33,23)(23,58) (44,125) (113,278)
Mesoscale (P4, 40 × 40)(30,61) (62,45) (59,119)(191,468) (238,257) (356,204)
Large scale (P5, 20 × 20)(116,90) (156,198) (373,326)(367,518) (479,359) (561,539)
Table 2. Training environment configuration.
ConfigurationParameter
CPUAMD Ryzen7 5800H
GPU6GB NVIDIA RTX 3600 Laptop
Accelerated environmentCUDA 11.4 CUDNN 8.2.4
Development languagePython 3.8
Operating systemWindows 11
Table 3. Testing environment configuration.
ConfigurationParameter
CPU4-core ARM® Cortex®-A57 MPCore
GPUNVIDIA Maxwell™ with 128 NVIDIA CUDA® core
Memory4 GB 64 bit LPDDR4
CUDAPytorch
Programming LanguagePython3.6
Table 4. The training dataset: categories of movement and the amount of training/test data.
SortTrainingTesting
Fall detected3234854
Walking2401506
Siting2349490
Total79841850
Table 5. The results of the ablation experiments.
K-Means++ShuffleNetV2SESIOUP/%RmAP/%Param/106FLOPs/109Weight/MB
----93.291.5927.116.513.6
---94.291.993.27.116.513.6
---90.288.789.42.43.33.5
---93.891.793.17.216.613.7
---94.392.193.37.116.513.6
96.594.395.22.43.43.4
Table 6. Comparison of the detection performance of several models on the test set.
ModelmAP/%Param/106FLOPs/109Weight/MB
Faster R-CNN79.628.4304.1108
YOLOv384.561.5154.5234
YOLOv490.464.3132.6244
YOLOv595.67.116.513.6
Improved-YOLOv596.52.43.43.4
Table 7. Deployment experiment results.
Image SizeModelPreprocessing/msInference/msNMS/msFP Time/ms
640 × 640YOLOv5s1.6192.312.1206.0
Improved-YOLOv5s1.4150.28.6160.2
512 × 512YOLOv5s1.2131.210.2142.6
Improved-YOLOv5s1.1110.89.3121.2
320 × 320YOLOv5s0.765.97.574.1
Improved-YOLOv5s0.756.26.863.7
Disclaimer/Publisher’s Note: The statements, opinions and data contained in all publications are solely those of the individual author(s) and contributor(s) and not of MDPI and/or the editor(s). MDPI and/or the editor(s) disclaim responsibility for any injury to people or property resulting from any ideas, methods, instructions or products referred to in the content.