Article

Experimental Study and 3D Optimization of Small-Scale Solar-Powered Radial Turbine Using 3D Printing Technology

1
Mining Engineering Department, College of Petroleum and Mining Engineering, The University of Mosul, Mosul 41200, Iraq
2
School of Computing, Engineering and Digital Technologies, Teesside University, Middlesbrough TS1 3BX, UK
3
Department of Engineering, Roma Tre University, Via Della Vasca Navale 79, 00146 Rome, Italy
4
Department of Mechanical Engineering, Mirpur University of Science & Technology (MUST), Mirpur 10250, AJK, Pakistan
5
Aeronautical Technical Engineering Department, Technical College, Al-Kitab University, Kirkuk 36001, Iraq
6
Mechanical Power Engineering Department, Cairo University, Giza 12613, Egypt
7
School of Engineering, The University of Birmingham, Edgbaston, Birmingham B15 2TT, UK
*
Authors to whom correspondence should be addressed.
Machines 2023, 11(8), 817; https://doi.org/10.3390/machines11080817
Submission received: 29 June 2023 / Revised: 4 August 2023 / Accepted: 8 August 2023 / Published: 9 August 2023
(This article belongs to the Special Issue High Performance and Hybrid Manufacturing Processes)

Abstract

:
Small-Scale Turbines (SSTs) are among the most important energy-extraction-enabling technologies in domestic power production systems. However, owing to centrifugal forces, the high rotating speed of SSTs causes excessive strains in the aerofoil portions of the turbine blades. In this paper, a structural performance analysis is provided by combining Finite Element Methods (FEM) with Computational Fluid Dynamics (CFD). The primary objective was to examine the mechanical stresses of a Small-Scale Radial Turbine (SSRT) constructed utilizing 3D printing technology and a novel plastic material, RGD 525, to construct a SSRT model experimentally. After introducing a suitable turbine aerodynamics model, the turbine assembly and related loads were translated to a structural model. Subsequently, a structural analysis was conducted under various loading situations to determine the influence of different rotational speed values and blade shapes on the stress distribution and displacement. Maximum von Mises and maximum main stresses are significantly affected by both the rotor rotational speed and the working fluid input temperature, according to the findings of this research. The maximum permitted deformation, on the other hand, was more influenced by rotational speed, while the maximum allowable fatigue life was more influenced by rotating speed and fluid intake temperature. Also, the region of the tip shroud in the rotor had greater deflection values of 21% of the blade tip width.

1. Introduction

The increasing request for electric power and, at the same time, the strict environmental restrictions on thermal pollution have increased the necessity for clean energy systems [1,2,3]. Small-scale turbines in Solar-Powered Brayton Cycle SPBC application offer a wide range of out power values suitable for relatively small scales systems to large scales [4]. Several authors [5,6] investigated in detail components like the thermal receiver and optimized the cycle performance, but they neglected the turbines’ performance. Others [7,8] studied the cycle effect of wake on the performance of turbines. Aerodynamically, several researchers [9,10] have improved the performance of SST; however, they neglected the structural analysis. Also, an attempt to aerodynamically optimize the rotor of an impulse axial turbine for oscillating water column was achieved by Gomes et al. [11]. Recently some studies regarding the structural analysis were conducted by some other researchers. Shanechi et al. [12] presented a CFD-FEM-coupled analysis of a relatively high pressure ratio radial inflow turbine where it was designed with some emphasis on blades geometry to enhance a turbine’s output power and efficiency. Their FEM analysis focused on blade enhancements in terms of its stresses and deformation. Barsi et al. [13] investigated enhancing the aerodynamic performance and reduction in thermal stresses of a micro gas radial turbine employing a multidisciplinary optimization technique. The camber and half thickness of the rotor blade were optimized to improve turbine efficiency by about 5% while maintaining the allowable material stresses level. Nevertheless, mechanical fatigue and modal analysis were not included in the aforementioned research, as well as the boundary conditions range and output power values being dissimilar to the current study.
Similar research efforts have been carried out [14,15,16,17]. Both mechanical and thermal loads, with their impact on the aerodynamic and deformation performance of the impeller for a micro gas radial turbine, have been analysed [14]. It was shown that the maximum deformation was achieved at the blade inducer tip, and that the aerodynamic performance and structural reliability of the impeller blade tip were degraded by its fluctuated deformation. Optimizing the profile of the impeller hub section reduced the deformation magnitude of the impeller; nonetheless, the aerodynamic performance was not under the researchers’ spotlight. Similarly, Feng et al. [17] enhanced the strength of the impeller hub by optimizing the blade shape of a 100 kW microturbine. It was shown that the aerodynamic and structural performances were affected by the inlet relative flow incident angle of the impeller with an optimum angle of −32°. The optimization of the micro-radial turbine was achieved using the inverse design method (via CFD and FEM) of two key parameters—the blade profile and the blade thickness—which resulted in in an effective improvement in the blade strength without a noticeable decrease in the turbine efficiency. Fu et al. [15] evaluated improving the aerodynamic performance, strength and weight of the wheel design of radial turbines, utilizing an integrated type of optimizing method. The results indicated that turbine wheel weight was decreased by about 50% and, at the same time, a satisfactory stress distribution and good aerodynamic performance were realized.
Aside from the current work linking the mean line, the 3D aerodynamic CFX, the structural and the thermal analyses, it also uses 3D printing technology to experimentally manufacture the designed SSRT with RGD 525 material. It is high-temperature opaque brittle plastic material which has been recently used in 3D printer technology, and as a model or support material as well [18]. Usually, this material needs to be treated thermally, following a specific procedure [19], in order to improve its properties by alternating it from orthotropic to isotropic material.
As a result, this work aims to optimize the performance of SSRT by taking into account all of the aforementioned concerns and determining the SSRT geometry. The 1D Vista RTD (part of ANSYS 2015) was used to determine the beginning dimensions and performance of each type for the turbine preliminary design. After that, it was combined with ANSYS CFX [20] to determine the 3D turbine shape and assess its performance. The baseline design was originally optimized utilizing the same authors’ prior work’s ANSYS®15 Design Exploration programme for 3D optimization purposes based on evolutionary algorithms. Following the achievement of an aerodynamically optimum design, structural calculations were carried out to determine the best structural specifications.

2. Methodology and Experimental Work

In the authors’ previous works [21,22], the aerodynamically optimum SSRT was achieved and, in the current work, the structural analysis will be further analysed to ensure a robust optimized turbine with a good performance for the required application. The optimum design point for both the stator and the rotor was extracted as a complete model and, then, by using the integrated CFX-FE Workbench in ANSYS®18, that optimum design was transferred in order to assess the stress values, the thermal analysis and the deflection and the fatigue analysis.
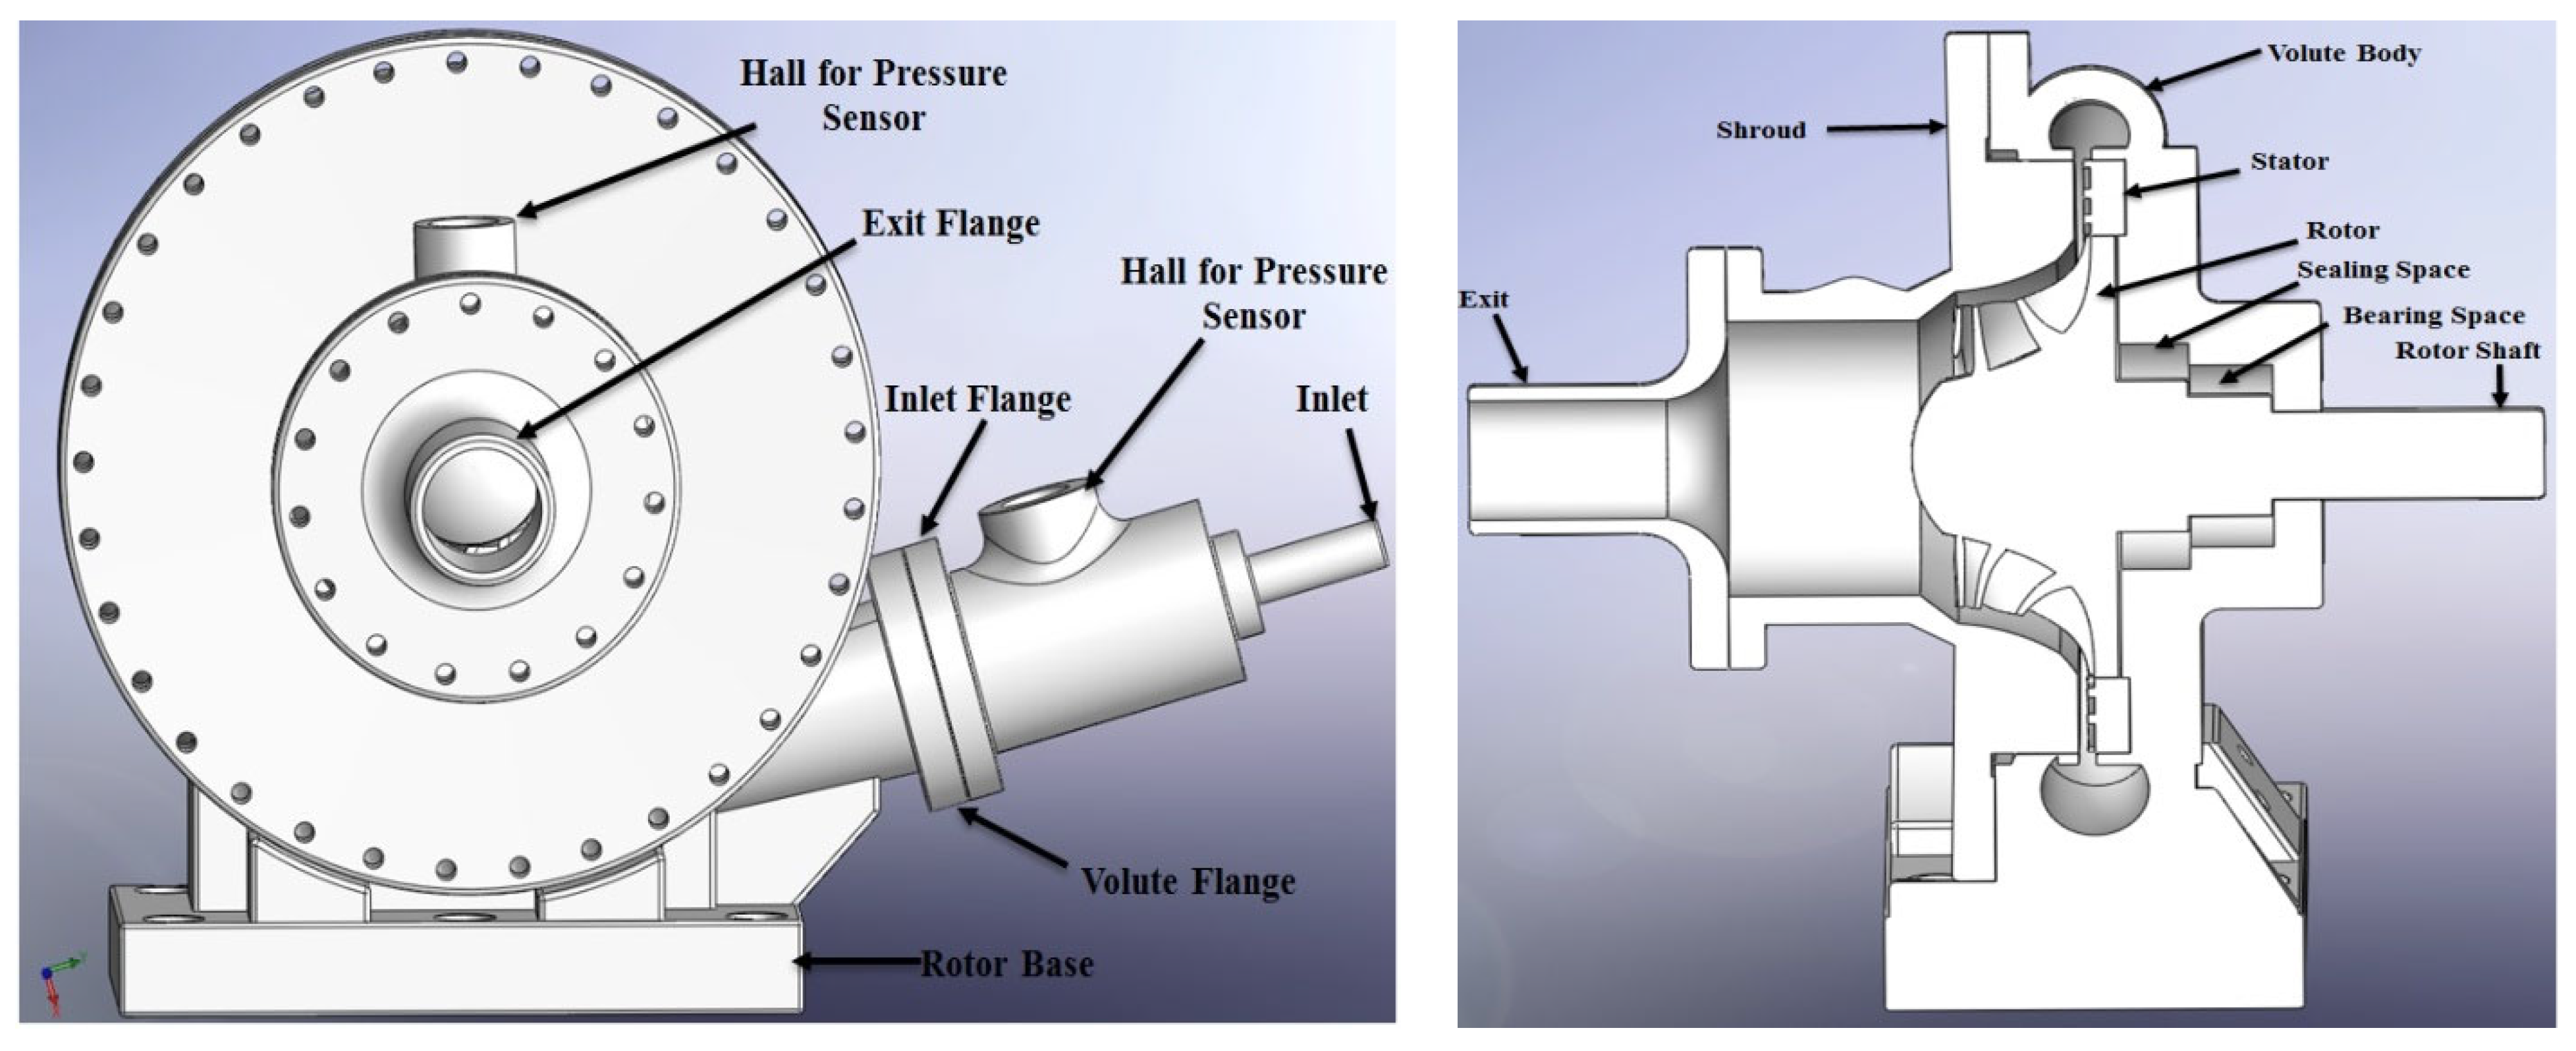
Figure 1 expresses the followed procedure during the current analysis. From this figure, it can be noticed that the object of this research is to concentrate on the last seven sets of the blocks as the first seven sets were already achieved in the authors’ previous publications regarding the SSRT. Once that was achieved, the complete design of all other relevant parts was established using CAD software SOLIDWORKS in order to include all of them in both the thermal and the structural analyses for the RGD 525 material. The complete model of the SSRT is given in Figure 2.
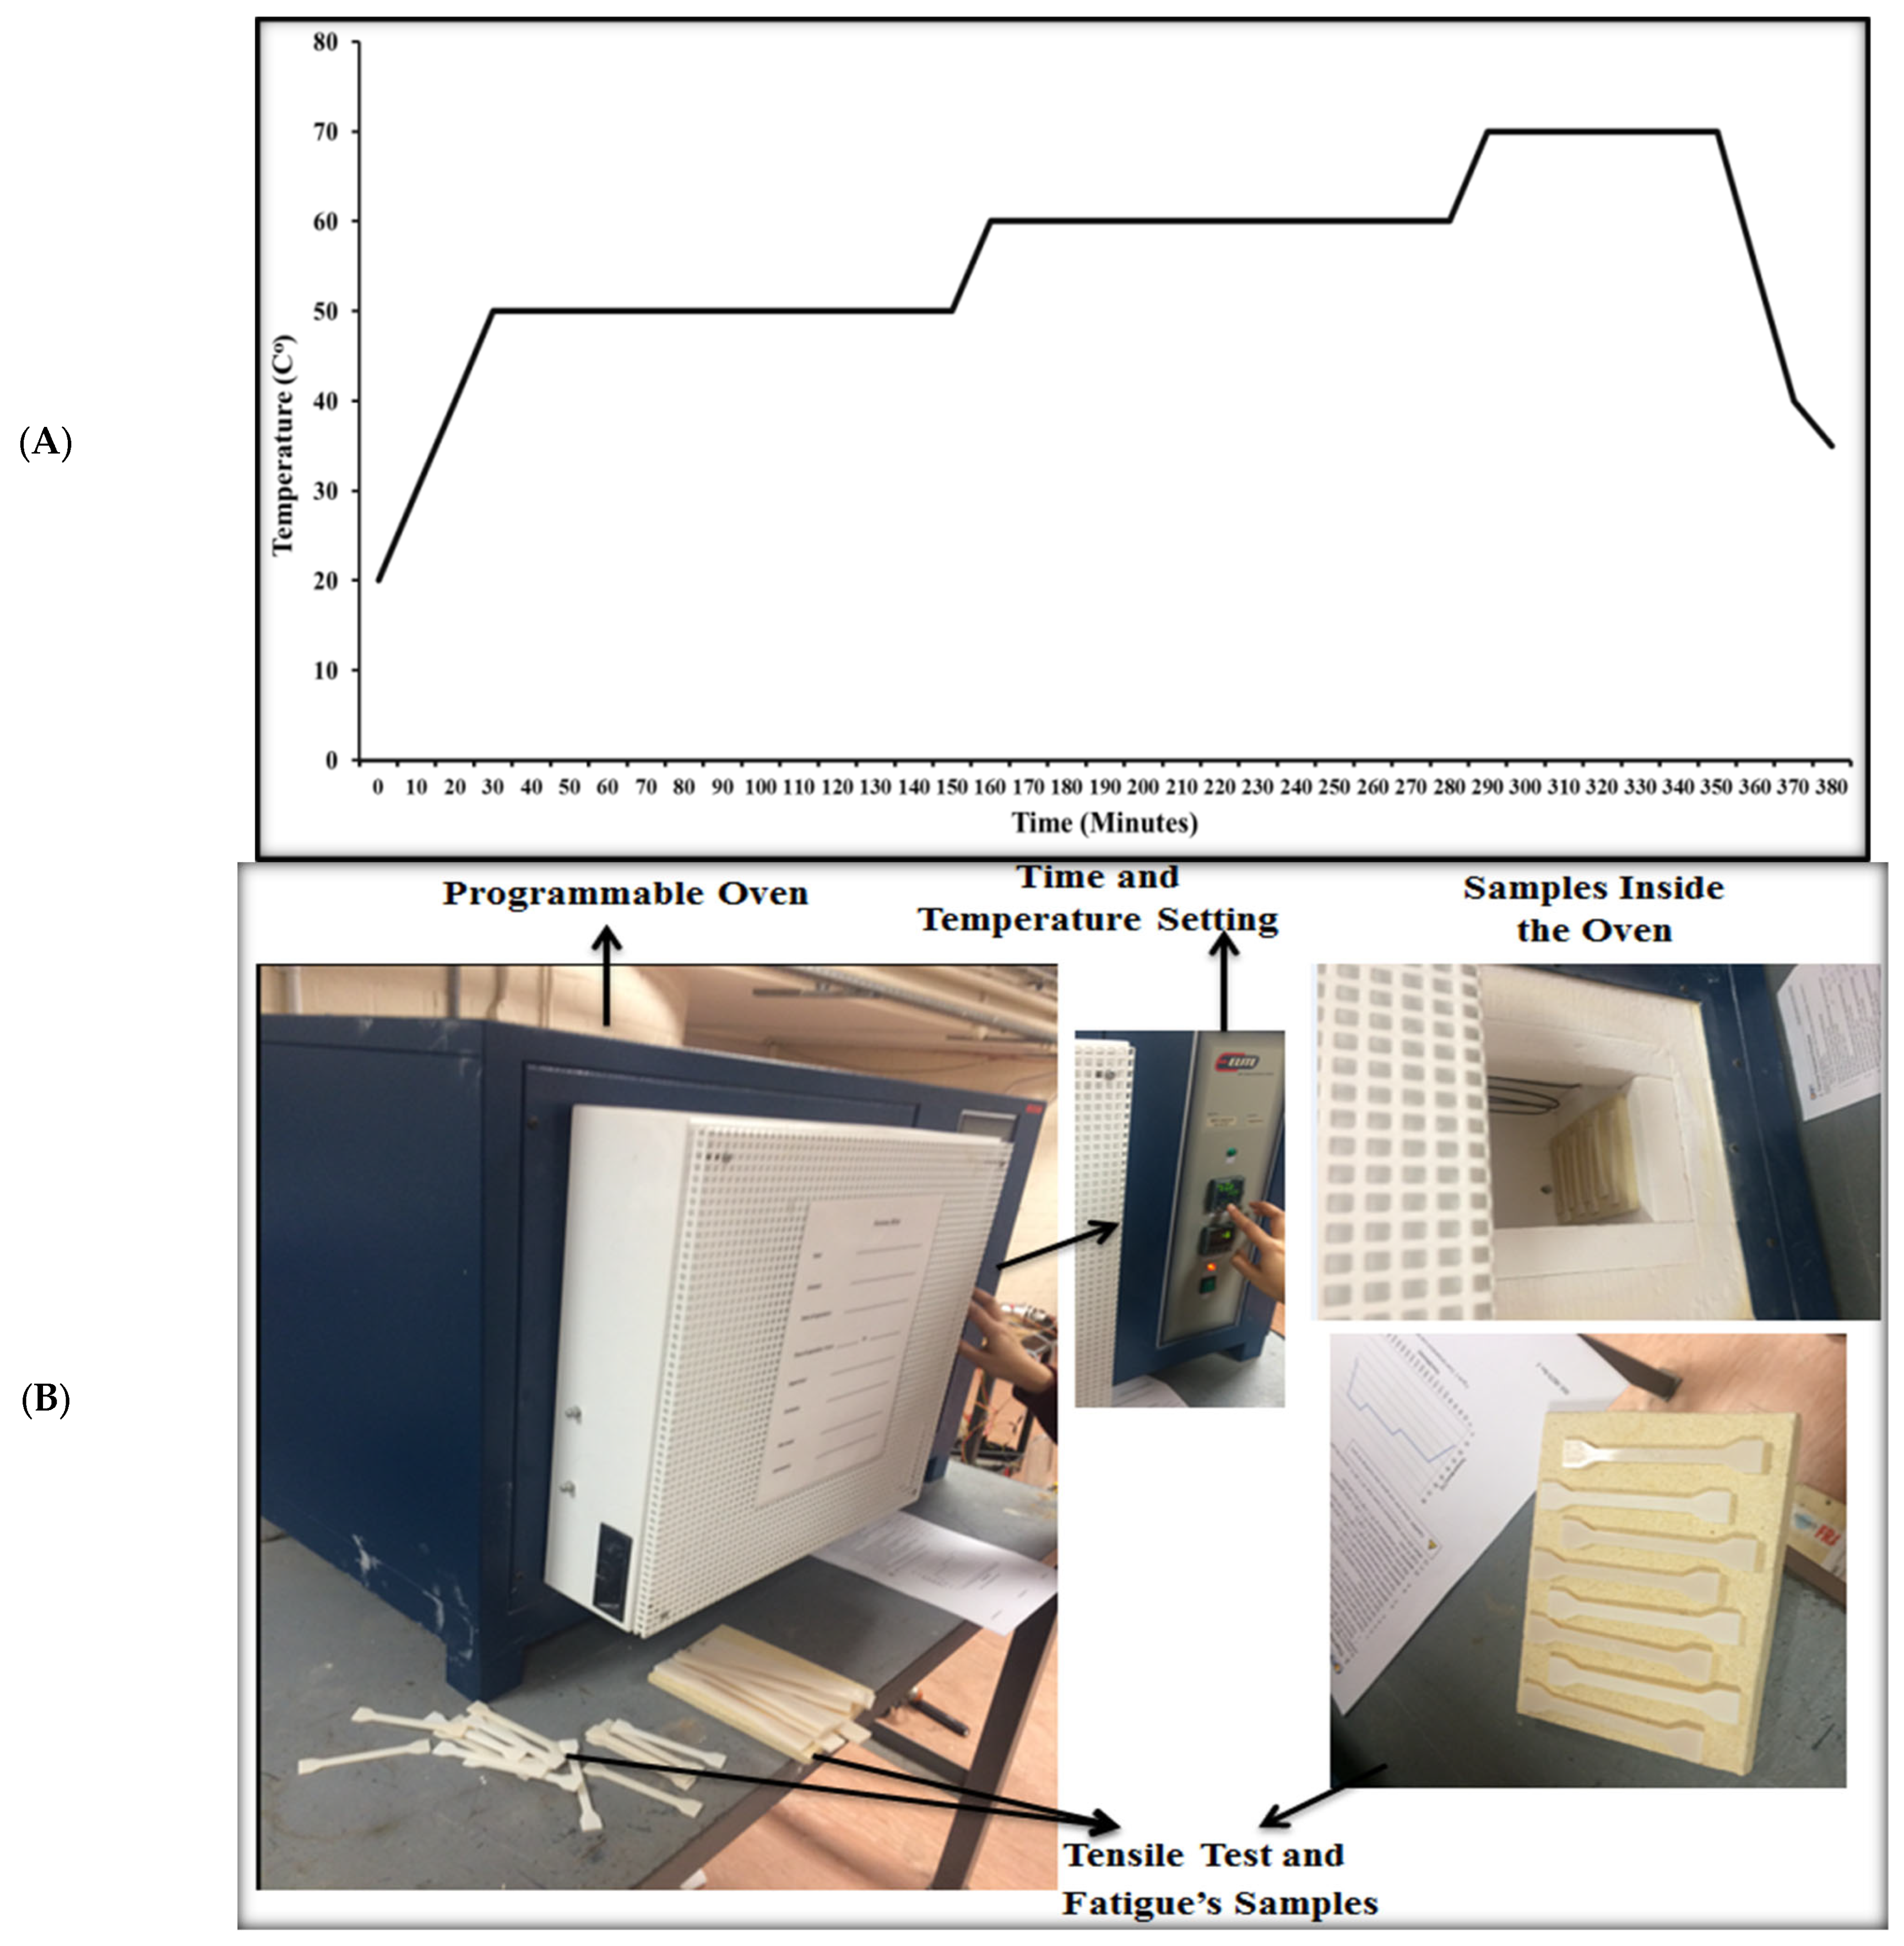
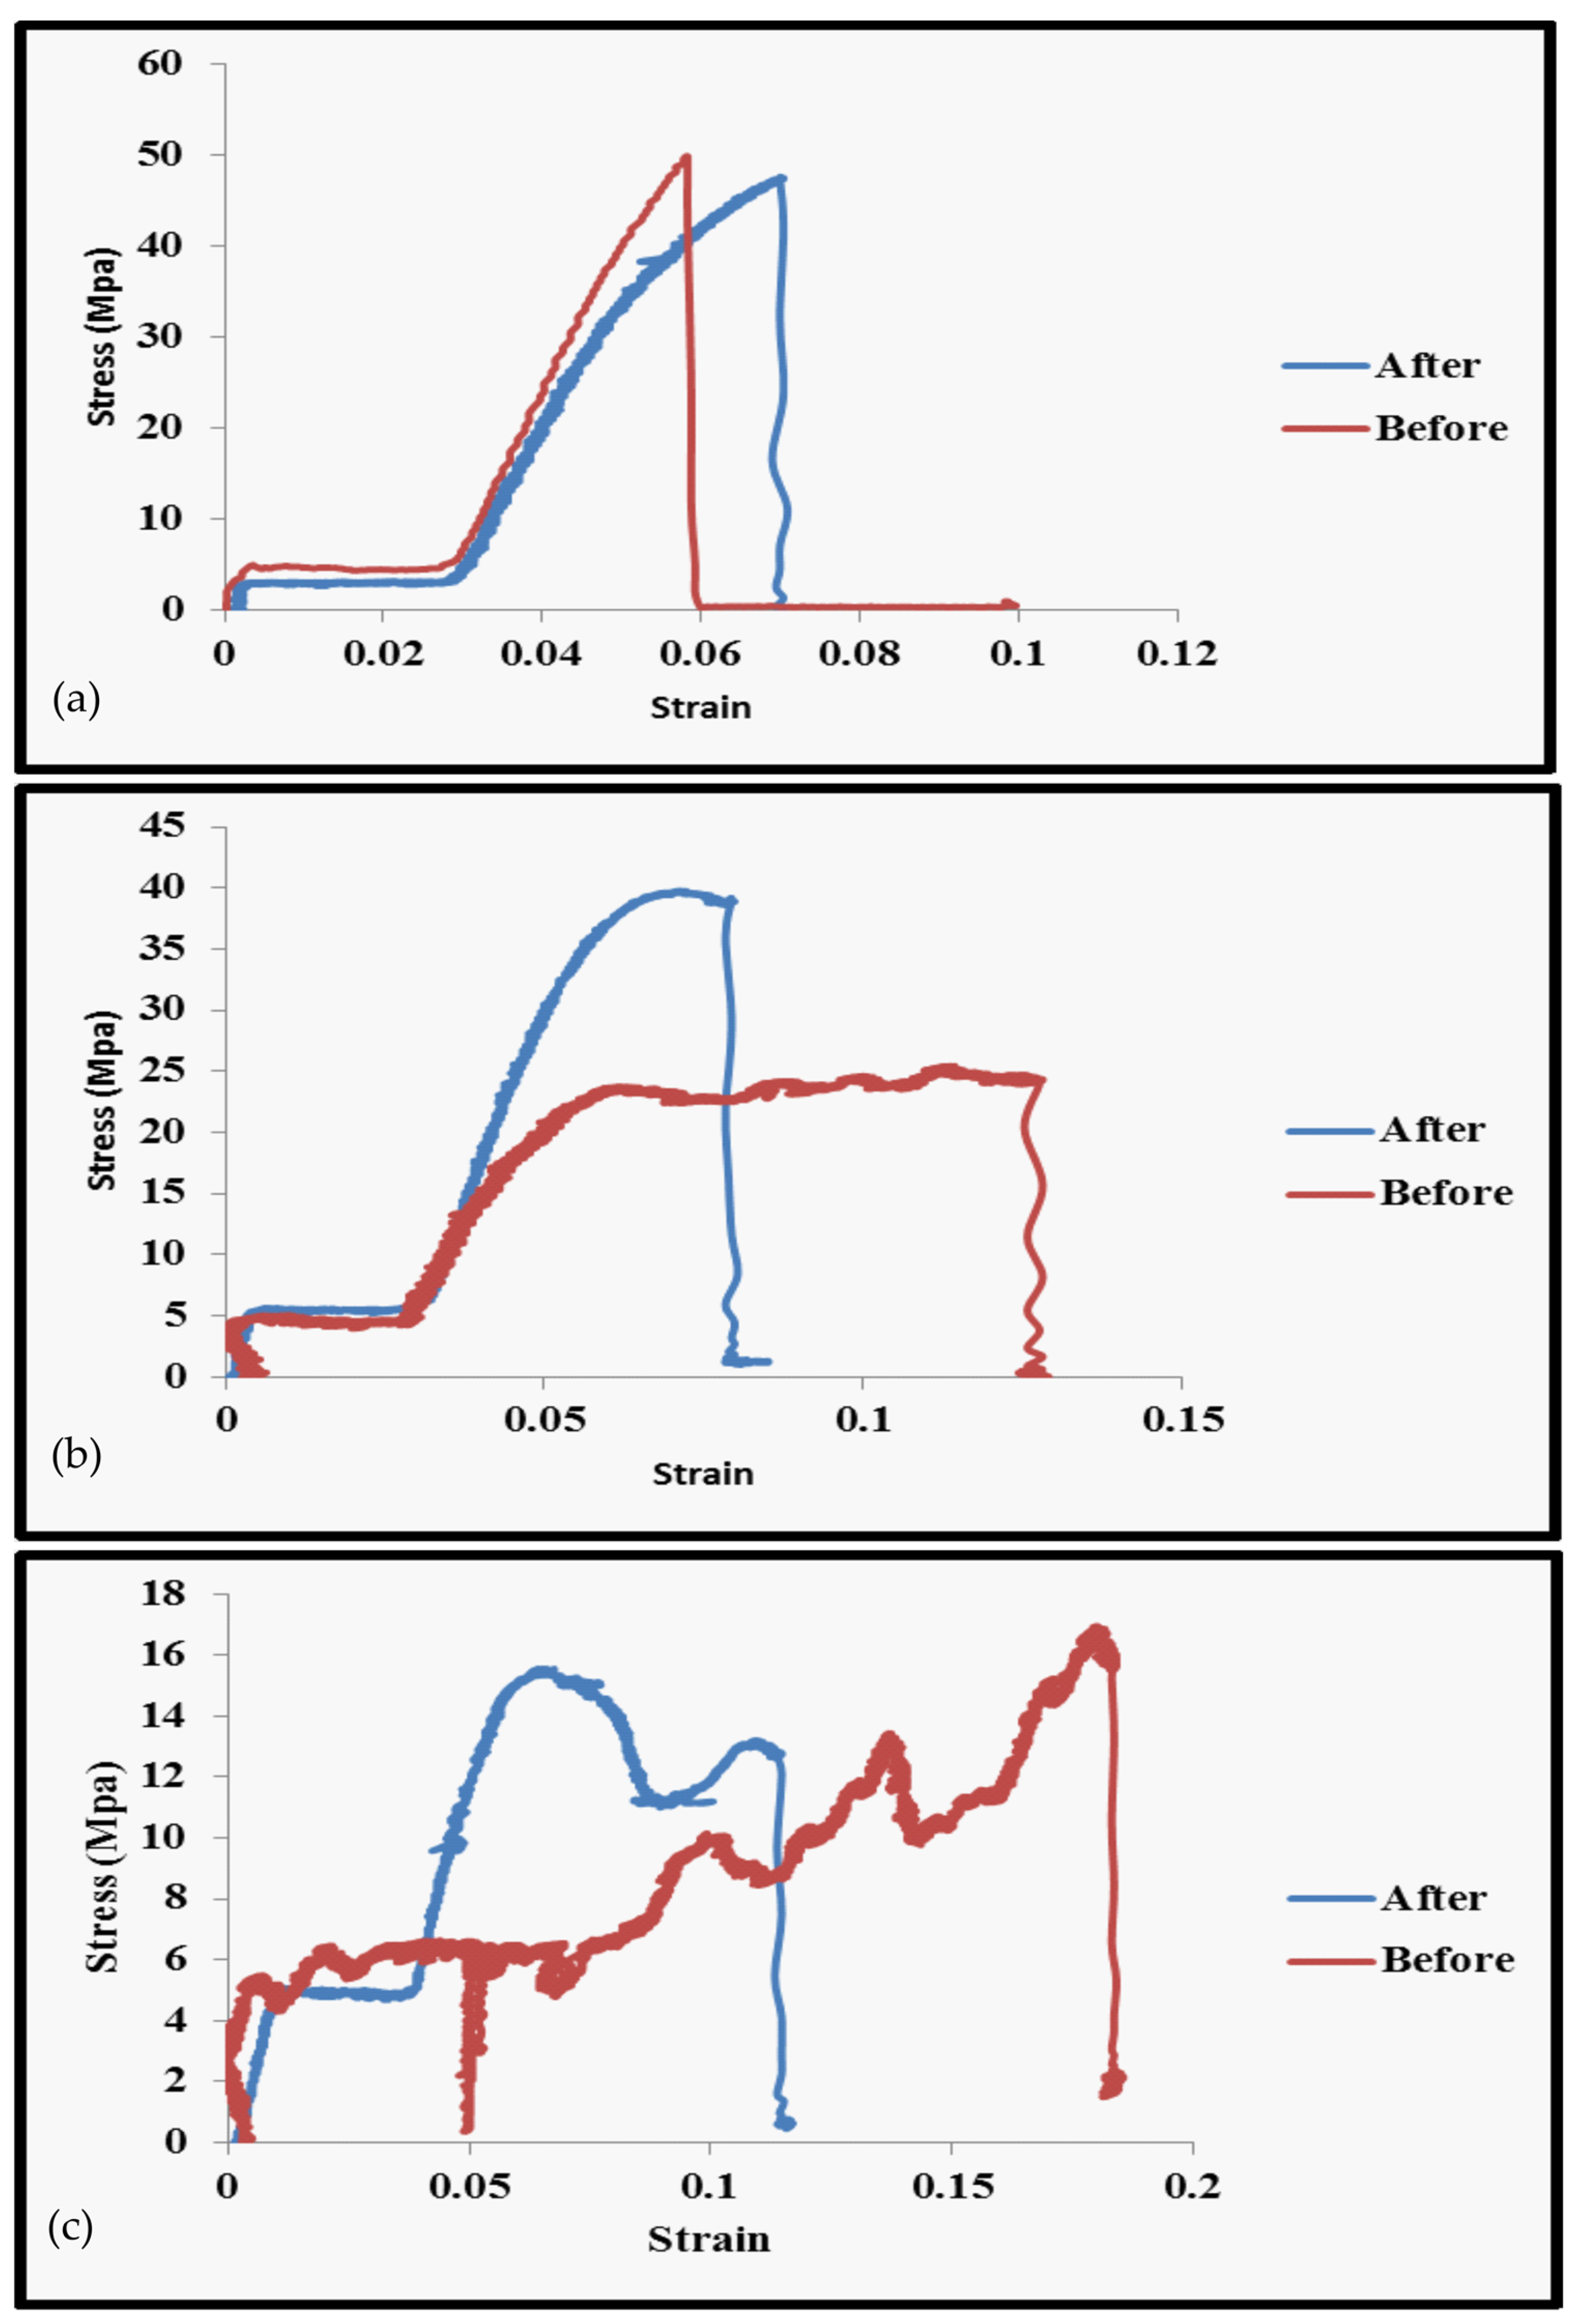
Using a programmable oven, and based on the requirement mentioned by the material manufacturer [19], a thermal treatment for the RGD 525 was carried out using thermal furnaces according to a specific cycle, as detailed in Figure 3. The tensile test results after the material had been thermally treated are shown in Figure 4. The tensile test results improved by roughly 37.5% at 35 °C, as can be seen in the first figure.
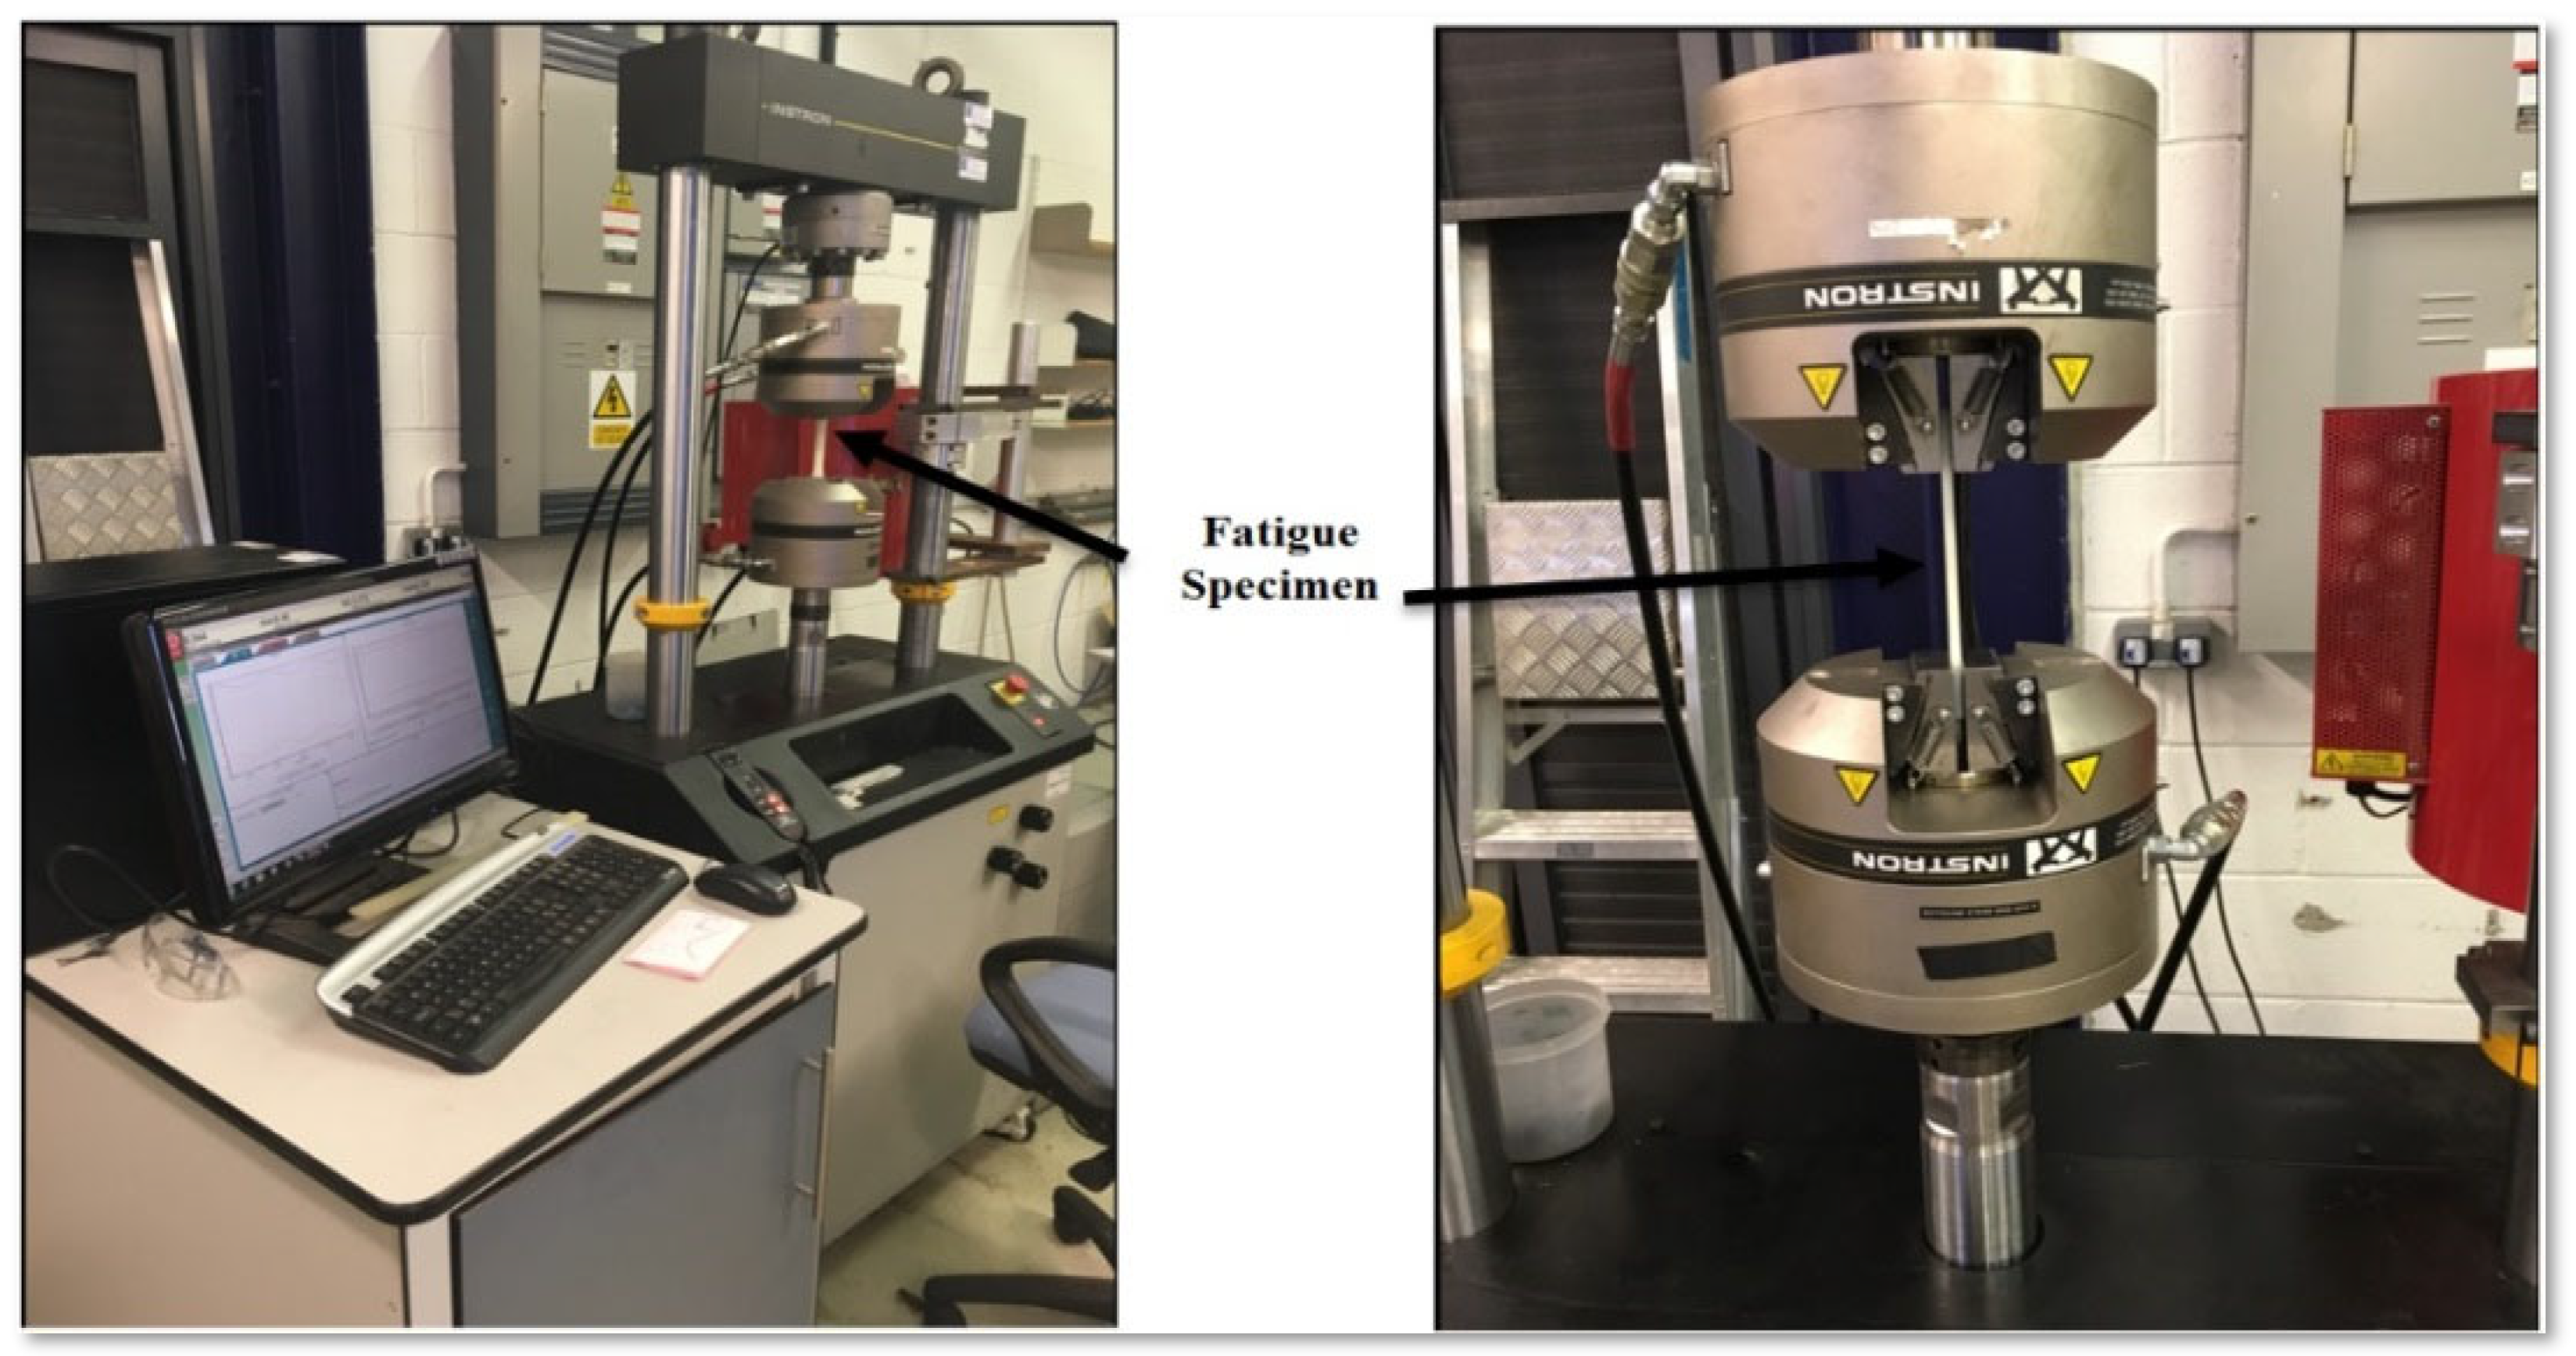
Fatigue tests were conducted using a servo hydraulic fatigue testing apparatus (INSTRON 8801) that was fitted with self-aligning hydraulic grips. The purpose of this test was to determine the material properties in relation to fatigue analysis, as depicted in Figure 5. The applied load exhibited a cyclic sine wave pattern with a loading ratio of 0.1 at a frequency of 3 Hz. The maximum load for each sample varied between 1.733 kN and 0.473 kN. Figure 6 displays the SSRT components that were produced using StraSys Alaris30 3D printer (PolyJet technology, Holtzman St. Science Park, Israel) at 30 μm layer thickness.

3. Governing Equations for Structural Analysis

3.1. Mechanical Stresses Analysis

The stresses that occur in the turbine structure are, in fact, a combination of the thermal gradient effect, static stresses, results from the fluid pressure and vibratory stress, initially from the centrifugal force as a result of rotor rotational velocity. The thermal stress ( σ ) can be analysed as follows:
σ = D   .     ε
The assessed material is anisotropic (see Table 1) and the elastic stress–strain relations can be written in Cartesian coordinates as follows:
ε x = 1 E σ x ν p σ y + σ z + α T x , y , z
ε y = 1 E σ y ν p σ x + σ z + α T x , y , z
ε z = 1 E σ z ν p σ x + σ y + α T x , y , z
The temperature gradient at a specific point, denoted by (x, y, z), is represented by ∆T(x, y, z). The temperature fields were interpolated directly using the computational fluid dynamics (CFD) results.
The steady mechanical stresses are generated by the fluid pressure acting on the blades and the centrifugal force exerted on the rotor. An investigation of the alternating stresses arising from turbulent fluid flow and resonance phenomena [21] is beyond the scope of this study.
The centrifugal force ( F c f ) can be calculated as follows:
F c f = m r ω s 2
Nevertheless, the determination of the precise magnitude of the centrifugal force was accomplished by taking into account a minute component of the blade section and subsequently integrating it to encompass the entire blade structure, as depicted in the illustration provided.
d f c f = d m . ω s 2 R r + z
where;
d m = ρ . A z d z
d f c f = ρ ω s 2 . A z . R r + z d z
F c f x = x l b ρ . ω s 2 . A z . R r + Z d z
By considering the blade as a cantilever with variable cross section area [22], this leads to:
A ( z ) A r l b = A t A r z
A ( z ) = A r . A t A r z / l b
The equation provided below can be utilized to ascertain the centrifugal force at any given location on the blade:
F c f ( x ) = ρ ω s 2 A r . ( A t A r ) z l b . R r . l b ln A t A r + A r . ( A t A r ) z l b . z . l b ln A t A r A r . ( A t A r ) z l b . l b 2 ln A t A r 2 x l b

3.2. Fatigue Analysis

Fatigue is among the most significant phenomenon that must be carefully evaluated in any rotating component. It refers to the failure of a material due to the repeated application of a load, even though the load is less than the material’s strength. In this part, a comprehensive assessment for the fatigue study of the SSRT utilizing the FEM programme ANSYS 18 was developed.
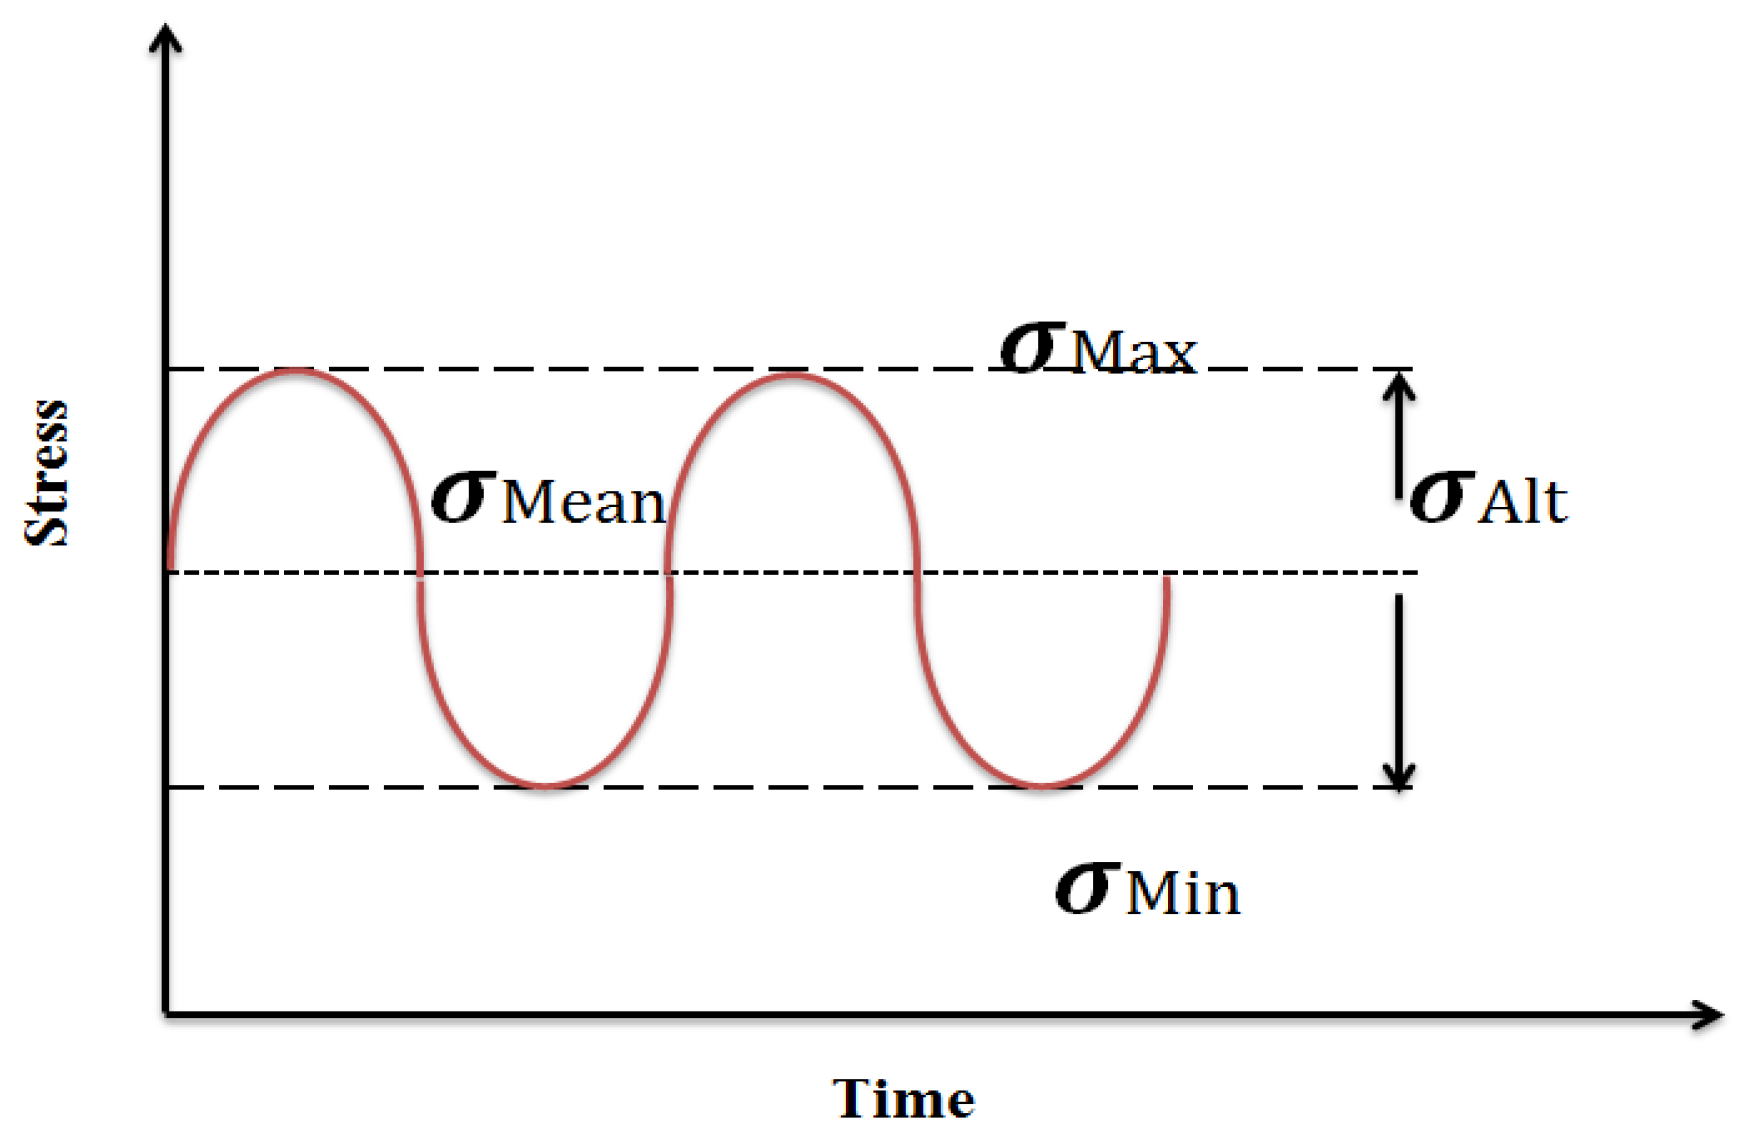
Figure 7 depicts a continuous, totally reversed loading cycle which is typically used for fatigue testing. Equation (13) depicts the Goodman relation that governs the endurance limit of a material as a function of the alternating stress, mean stress and ultimate tensile strength of the material. The fatigue loading cycle may be described in a variety of ways, with the most frequent being the usage of the alternating stress value σAlt and the stress ratio R = σMinMax.
σ A l t σ e + σ M e a n σ u = 1
However, the relation between the maximum stress used in fatigue loading and the number of cycles to failure can be described as follows [23,24]:
  σ M a x 1 R 2 = σ f ( 2 N f ) b
For temperatures (T) different from room temperature T 0 , where the fatigue testing is carried out, the maximum stress can be scaled for different temperatures based on the ultimate strength ratio at the associated temperatures as follows [25]:
σ M a x @ T = σ M a x @ T 0 . σ u @ T σ u @ T 0
Equation (15) is in agreement with the data detailed in reference [26], where the ratio of tensile strength at different temperatures is almost equal to the ratio of fatigue limits at the same temperatures for ABS material.
The fatigue damage for the material can be estimated using the following equation:
D f = n i N f  
To setup the model, the defining of the new material RGD 525 and the characterizing of the S-N curve obtained from experimental fatigue test were carried out.

4. Numerical Modelling

The structural, fatigue and modal analysis, together with the overall design assessment for the rotor part of the SSRT, were correspondingly carried out, as shown next.

4.1. CFD and Structural Modeling

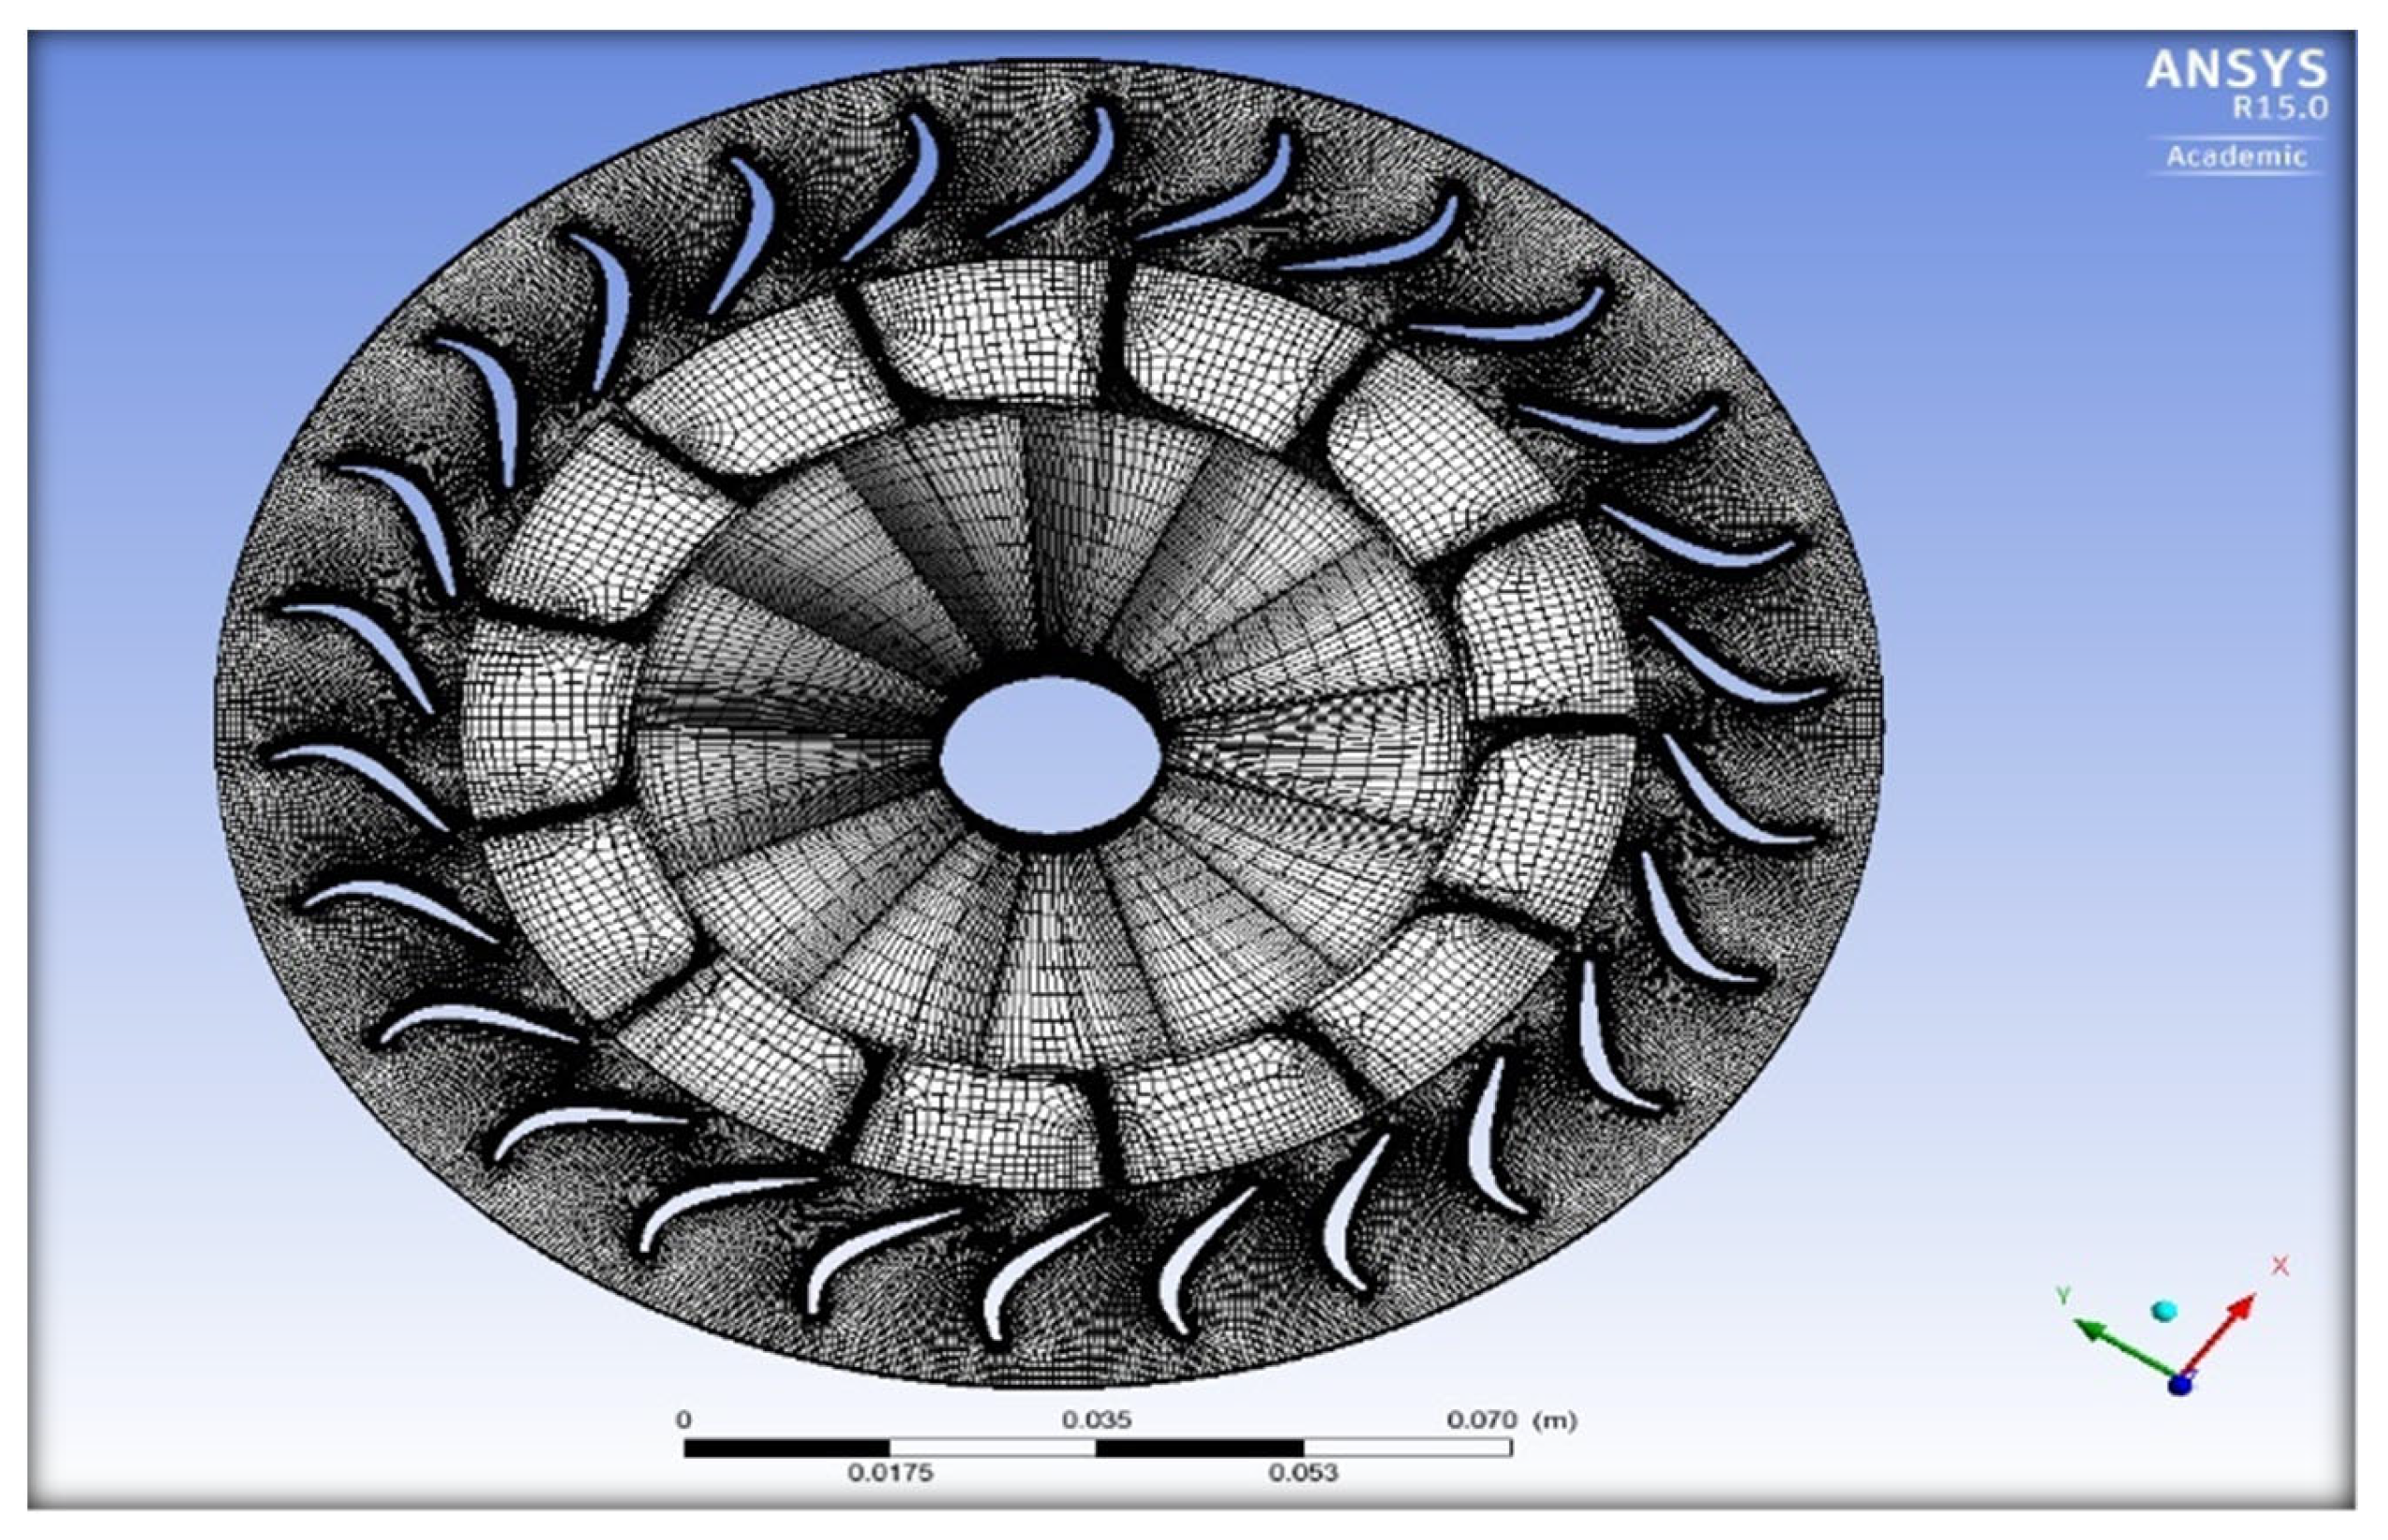
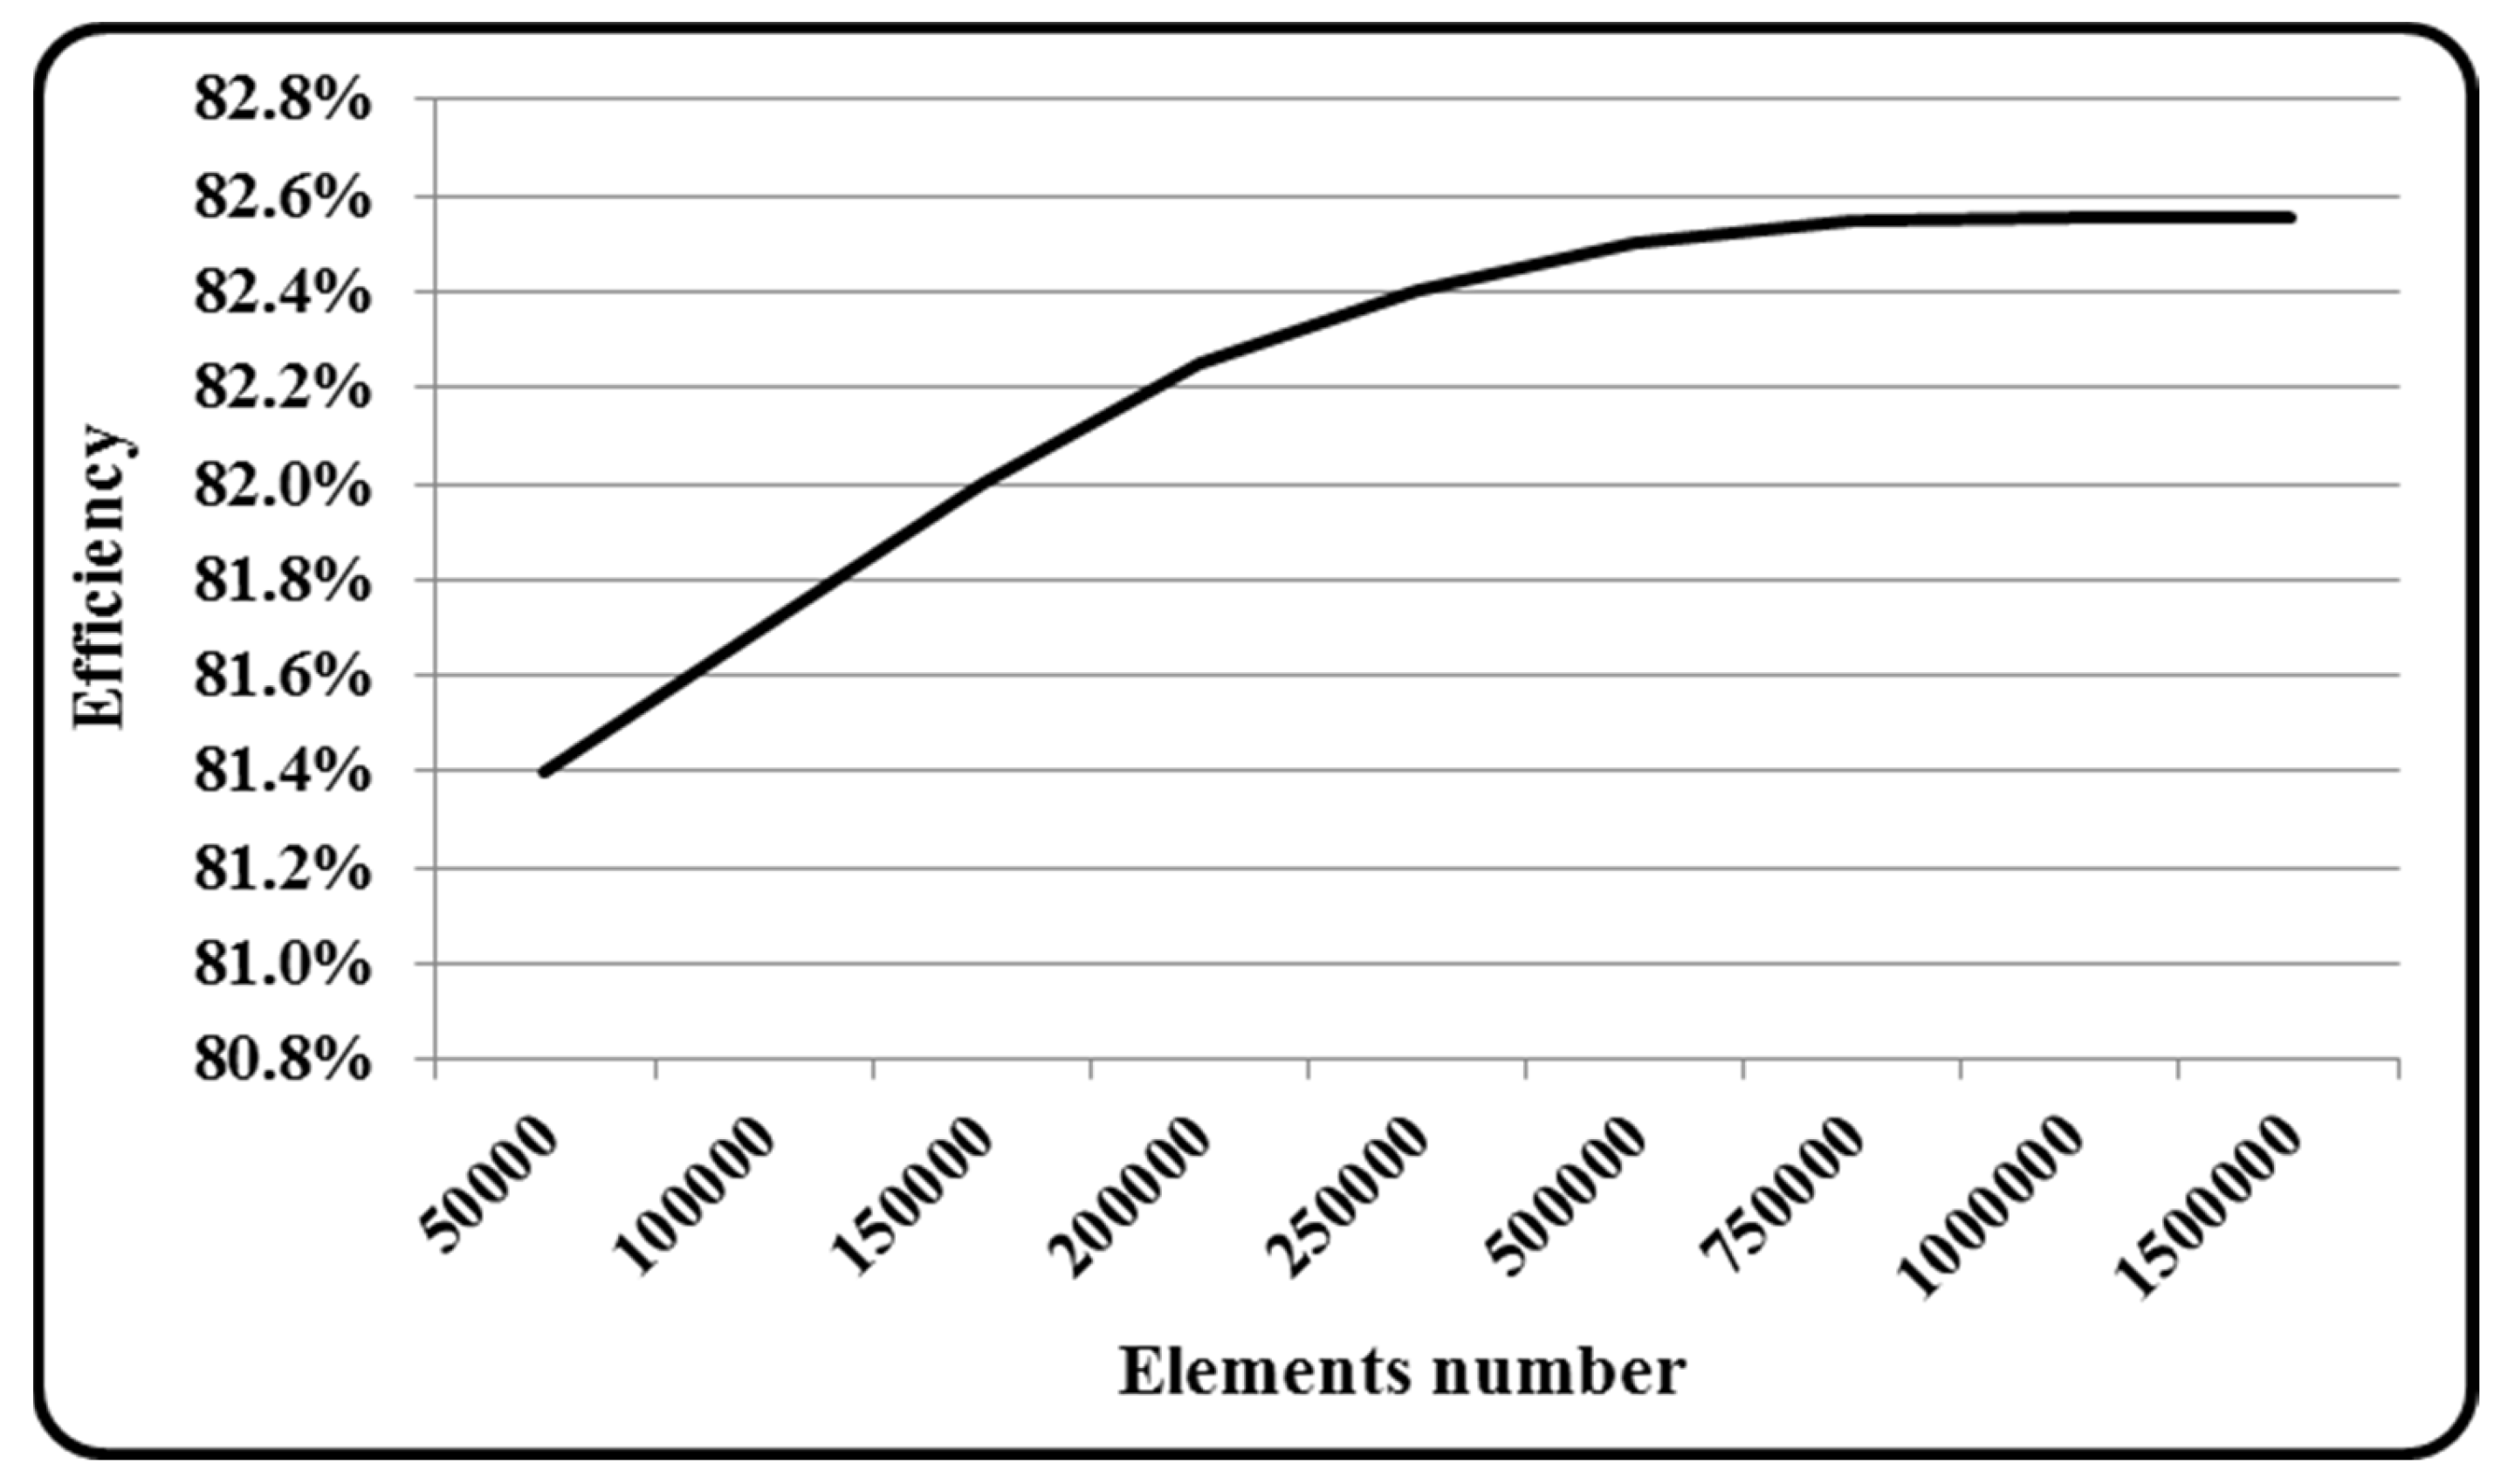
The design of the blade’s shape was created utilizing the Blade-Gen software, and subsequently meshed using the Turbo-Grid module found in ANSYS/Workbench. The structured 3D mesh generation for the complete (stator and rotor) 3D model of the small-scale radial turbine is shown in Figure 8. It should be noted that the grid was precisely refined in the vicinity of the blade’s surface to accurately simulate the fluid behaviour, including the viscous effects. The sensitivity analysis of the grid was based on the turbine efficiency and is shown in Figure 9. The results show that there is no change in the predicted efficiency with an increase in the number of elements above 75,000. This indicates that the mesh is adequately fine-tuned to accurately simulate the blade’s performance. In conclusion, the implemented grid sensitivity analysis proves that the mesh generated by the Turbo-Grid module is effective and efficient in simulating the blade’s behaviour.
The quality of the solution is one of the most important factors that directly affects both the results accuracy on the one hand and computational costs on the other [27,28]. Using the ANSYS®-CFX solver, an aerodynamic analysis of 3D turbulent viscous flow for the complete stator and rotor SSRT model was achieved. The utilized settings were chosen to be steady-state 3D viscous, single phase and compressible flow as the compressed air was the working fluid. As suggested by the authors of reference [29], the first order upwind advection scheme with topological equation was also selected during the settings as this helps with gaining a high stability in the analysis. Moreover, the stage interface was employed as the analysis and this study focused on the complete unit, stator and rotor and the coupling of shear stress turbulence model; the Navier–Stokes equations were selected. The CFX-Solver theory guide [6,30] recommended preserving the y+ average value regarding unity. Regarding the boundary conditions, the total temperature, total pressure, flow direction and the rotational speed were also selected and fed to the software as inlet boundary conditions and, at the same time, the static pressure was nominated to represent that of the output. Finally, a rotational and adiabatic wall were picked for the blade’s surface and the hub, respectively.
Based on the transport equations of k-ω, as depicted in Equations (17) and (18), the convergence conditions for the velocity and continuity were established at a magnitude of 10−5, whereas the energy equation was selected with an order of 10−6. Upon the fulfilment of the aforementioned criteria, the requisite solutions were attained.
The transport equations for the k-ω model are presented below:
t ρ k + x i ρ k u i = x j Γ k k x j + G k Y k + S K
t ρ ω + x i ρ ω u i = x j Γ k ω x j + G ω Y ω + S ω
Once the aerodynamic analysis was successfully achieved, the SSRT, including the designed volute, the stator and the rotor, were modelled using the Mechanical Workbench of ANSYS® in order to extract the solid model from their air domains. The second important step was designing the other required turbine parts such as the shroud and the inlet and exit flanges with the assistance of SOLIDWORKS (version 2016) software.
Then, the CFD model and the static-structural model were coupled with the purpose of evaluating the turbine’s stress and deformation values. This could be achieved when the aerodynamic pressure values, which were calculated in the CFD model, were transferred through system coupling to the structural model. Also, the temperature value, which the rotor design was initially based on, was coupled to the solid model to assess the turbine thermal analysis using ANSYS/Steady State Thermal section. An adequate 3D solid element distribution for the rotor blades and the hub was selected. In order to accurately complete the structural analysis, some areas of interest needed fine meshing.
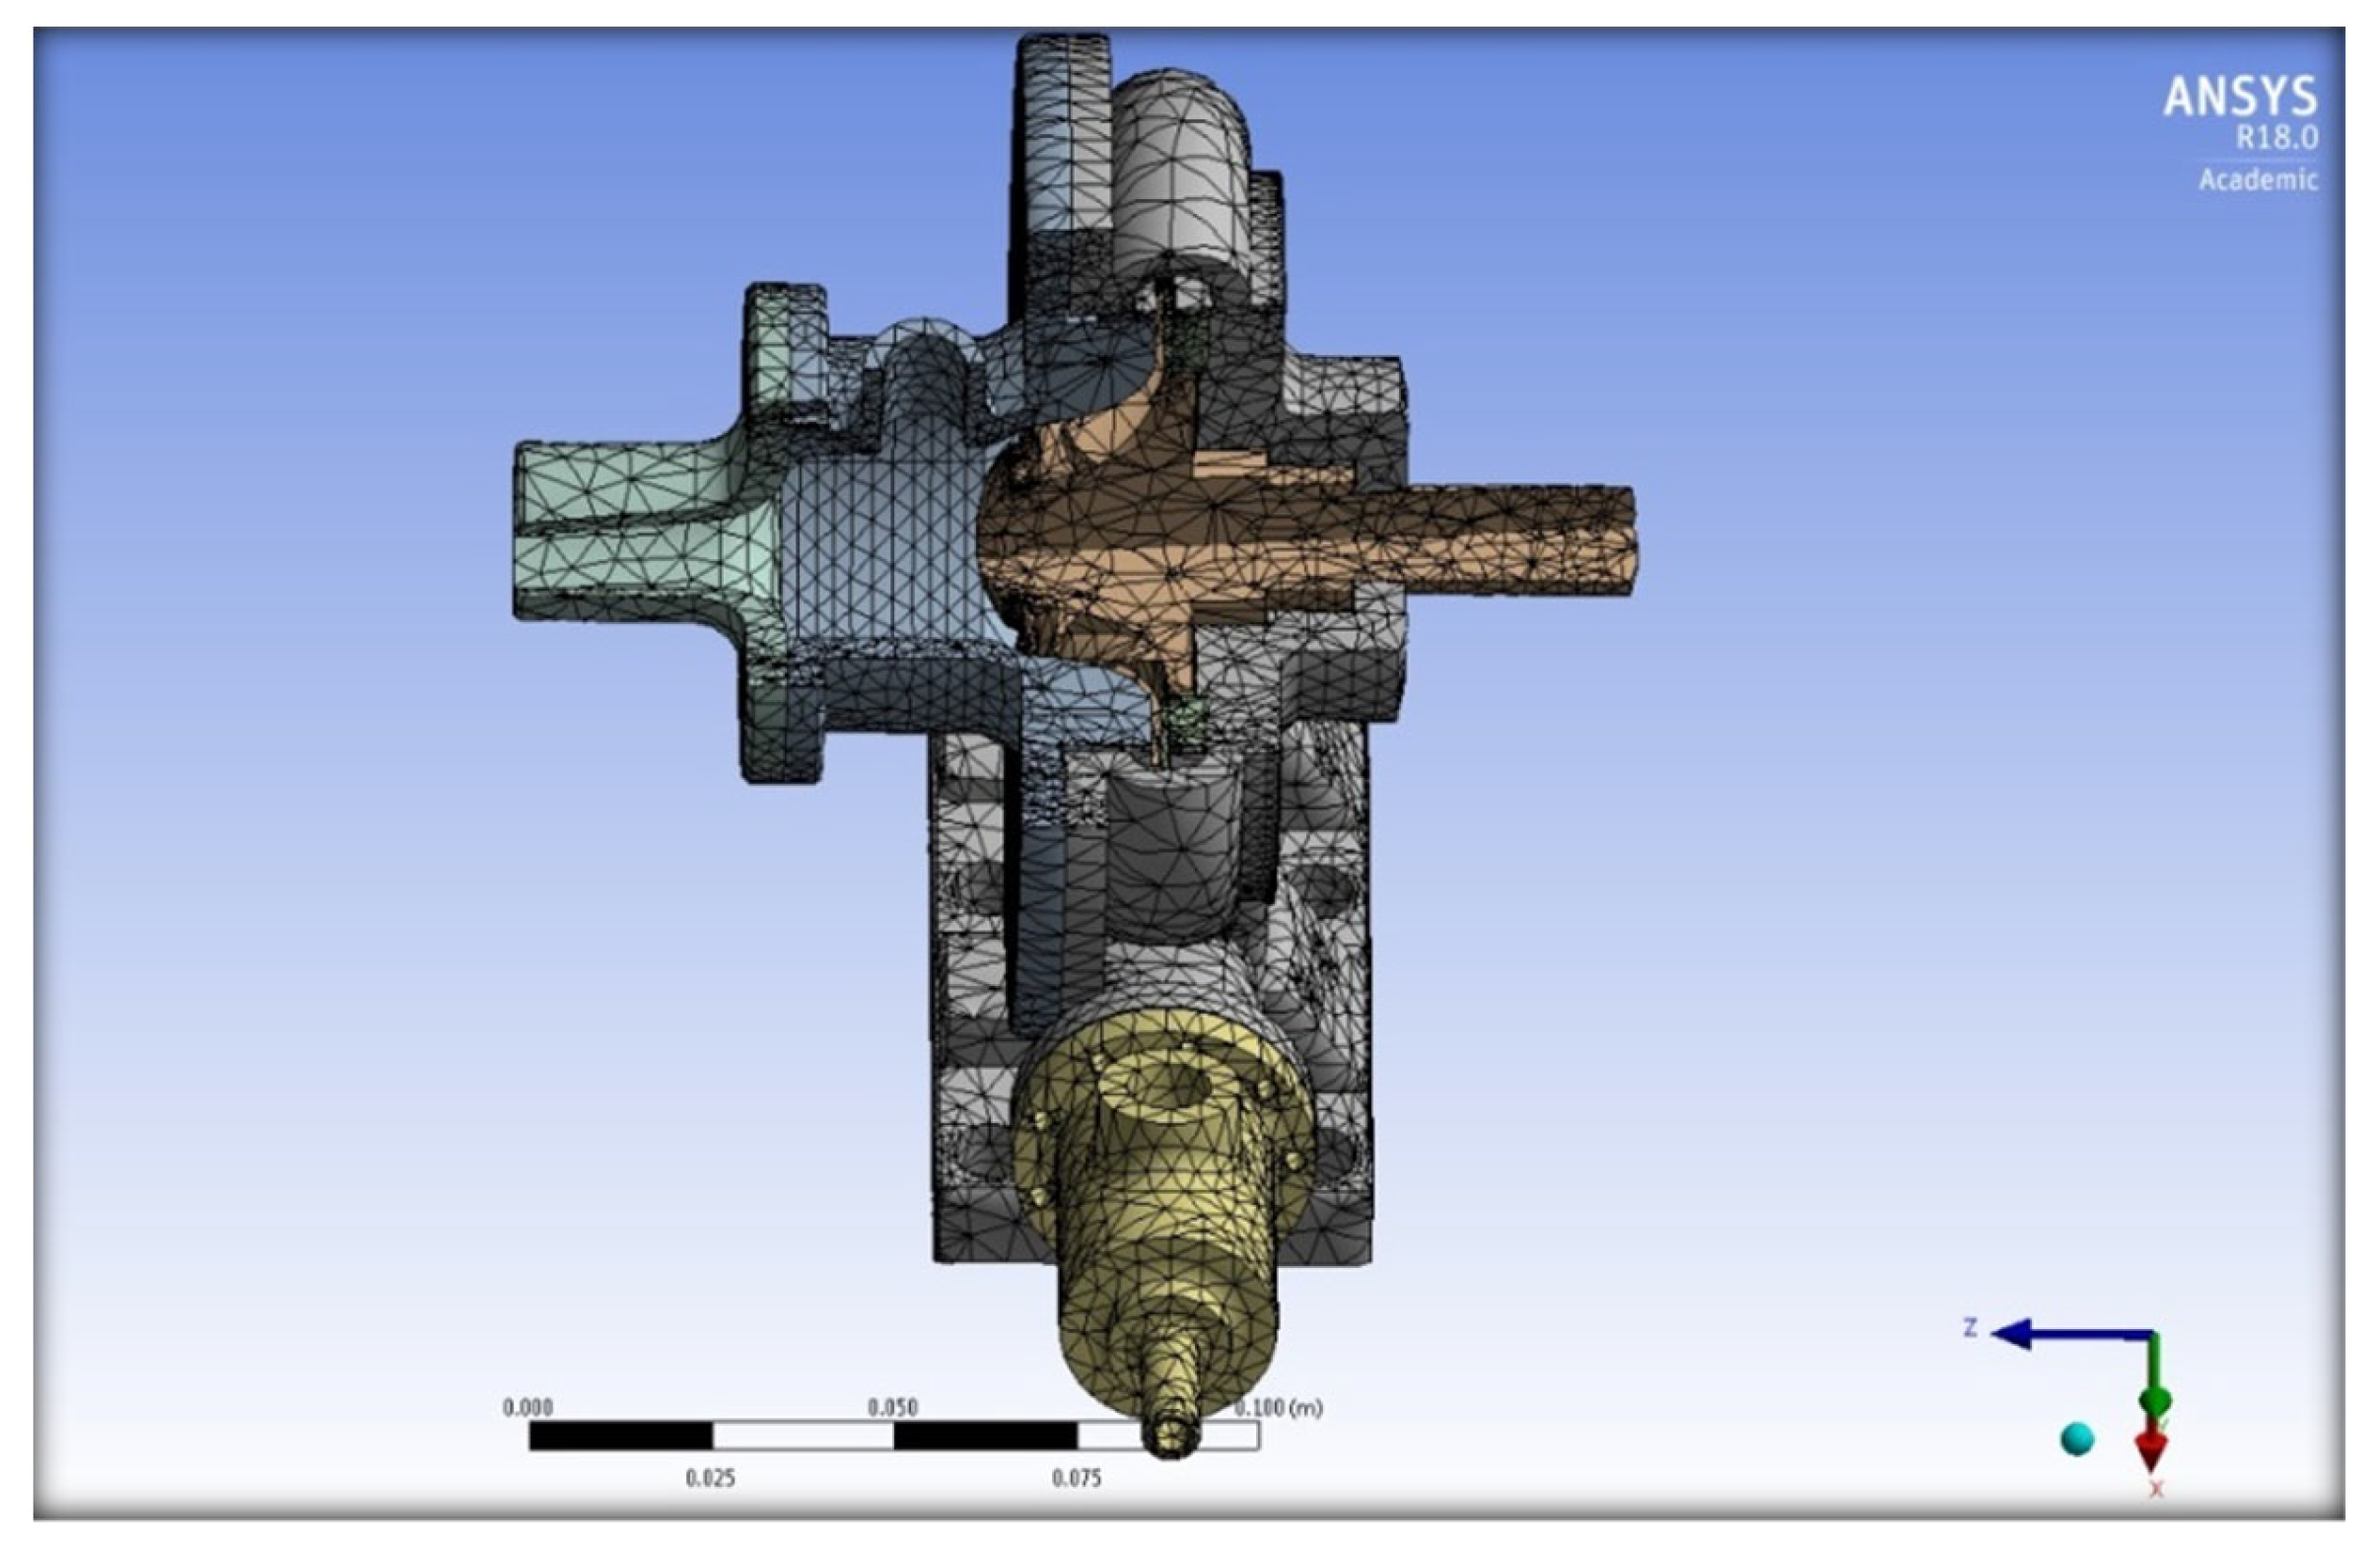
The other important issue at this stage was defining the related (Mechanical, Fatigue and Thermal) properties of the new material, RGD 525, and inserting them into the software [31]. Some of those properties were found in the supplier data sheet and others were obtained using some experimental tests, such as the fatigue and the tensile test at various temperature values. Another crucial factor is whether a complete mesh is needed for the whole rigid body or merely the surface contact mesh. This is controllable by stiff body behaviour. Clearly, the decision of a dimensionally decreased model has been made in this investigation to reduce the computational time required. The second essential aspect in mesh analysis pertains to the transition ratio, which can be defined as the governing factor that dictates the rate of expansion of adjacent elements, encompassing a numerical range from 0 to 1. The present investigation has chosen a value of 0.272, as stated by the authors of reference [29]. The appropriate regions of the hub and blade surfaces were subsequently chosen to prevent any displacement as the primary means of support for the structure. Additionally, the pressure side of the rotor blade was selected to apply centrifugal forces, taking into account the angular velocity derived from the initial aerodynamic analysis. It is imperative to acknowledge presently that the temperature of the working fluid, specifically the compressed air, was incorporated into the structural model. Table 2 provides the parameters for the specific structural mesh that was chosen, while Figure 10 depicts the distribution of element density across the SSRT model assembly.
The utilization of time stepping was not implemented in the analysis due to its static nature. However, the coupling setting procedure was enabled to facilitate the activation of the two-way coupling analysis technique. The present analysis utilizes a Computational Fluid Dynamics (CFD) model to evaluate the extraction of aerodynamic loads. This is achieved through the implementation of fluid–solid interfaces, which facilitate the transfer of these loads to the blades. The evaluation of the mechanical loads, deformations, material strains and fatigue properties will be performed following the selection of the requisite material attributes.
The following analysis, which needed to be evaluated, was the modal analysis utilizing FEM through the ANSYS software [30] and using 3D 8-nodes solid elements with linear interpolation [24]. The model had a total of 997,735 elements and 1,995,470 nodes. A cantilevered support type was applied in order to idealize the boundary condition of the model when the blade body was fixed on the rotor hub. In this type of analysis, the actual scales of the deformations and any resulting derived values, like strains and stresses, are meaningless because the solution in a modal analysis consists of a deformed shape that is arbitrarily scaled. So, only the relative magnitudes of such quantities will be measured as meaningful values using this model. Understanding this analysis, and how the structure will vibrate if it is excited, will, in fact, enable the designer to design better structures [24]. This occurs at or near the mode natural frequency when the overall vibration shape of a structure has a tendency to be dominated by the resonance mode shape [30].

4.2. SSRT Multidisciplinary Optimization

Even if the aerodynamic optimization across all stages of the SSRT was successfully accomplished and concluded in the previous chapter, the SSRT must be concurrently analysed from a structural viewpoint using the FEA approach in order to obtain its optimal design. As previously stated, the optimized rotor shape underwent structural analysis, during which several key parameters were parameterized to improve the structural integrity of the rotor. This resulted in reduced stresses, vibrations and deflection. The proposed optimization technique successfully combines computational fluid dynamics (CFD) modelling and finite element analysis (FEA) to achieve optimal results in terms of turbine efficiency, power output and stress and deflection limitations, without any compromise. The input components for this study included the blade thickness along the blade, the solid mass and the hub offset. The output parameters considered in the analysis were the turbine output power and efficiency, as determined through aerodynamic research. Additionally, the equivalent maximum stress and deflections were evaluated through structural analysis, along with the turbine’s estimated lifespan. The achievement of the final turbine form poses a significant challenge and necessitates a careful balance between the specified parameters. This can be effectively accomplished through the utilization of multi-objective interdisciplinary optimization techniques [32].

5. Results and Discussion

5.1. Experimental Validation of the CFD Model of SSRT

By manufacturing the Small-Scale Radial Turbine, SSRT, the complete test rig became ready to be used and investigates the model using a varied range of operating conditions, inlet temperature, inlet pressure and mass flow rate of the compressed air as a working fluid. To confirm the methodology employed to enhance SSRT performance, the complete developed turbine was designed, manufactured, as shown in last section, and then tested. With the aim of configuring a big map for the examined SSRT and taking into considerations the material and the lab limitations, the test was established at various operating conditions, inlet temperature, inlet pressure and flow rate values. The employed procedure in that test can be summarized as follows:
  • The compressed air was allowed to flow from its storage tank, at atmospheric temperature, to a pressure regulator, which is used to achieve the required value of the inlet pressure.
  • During its journey to the turbine, the compressed air was heated by passing through the thermal receiver. The required temperature value can be achieved using various levels between the light source and the thermal receiver, as shown in the previous section.
  • By doing so, the compressed air now has both thermal and kinetic energy, and is guided to the expander, representing by the SSRT, in order to extract that energy and convert it into useful energy. As a result, the turbine performance can be examined at different scenarios.
  • By changing the inlet total pressure and inlet mass flow rate, and keeping the inlet temperature of the SSRT fixed, the first one was carried out at different values of compressed air inlet temperature.
  • The second scenario was established by fixing both the inlet mass flow rate and pressure values and changing the SSRT inlet temperature. This was the case at different values of compressed air mass flow rate and inlet pressure.
Also, using the same conditions found in the rig, a three-dimensional numerical analysis, using ANSYS CFX, was simultaneously established to compare the two different types of results.
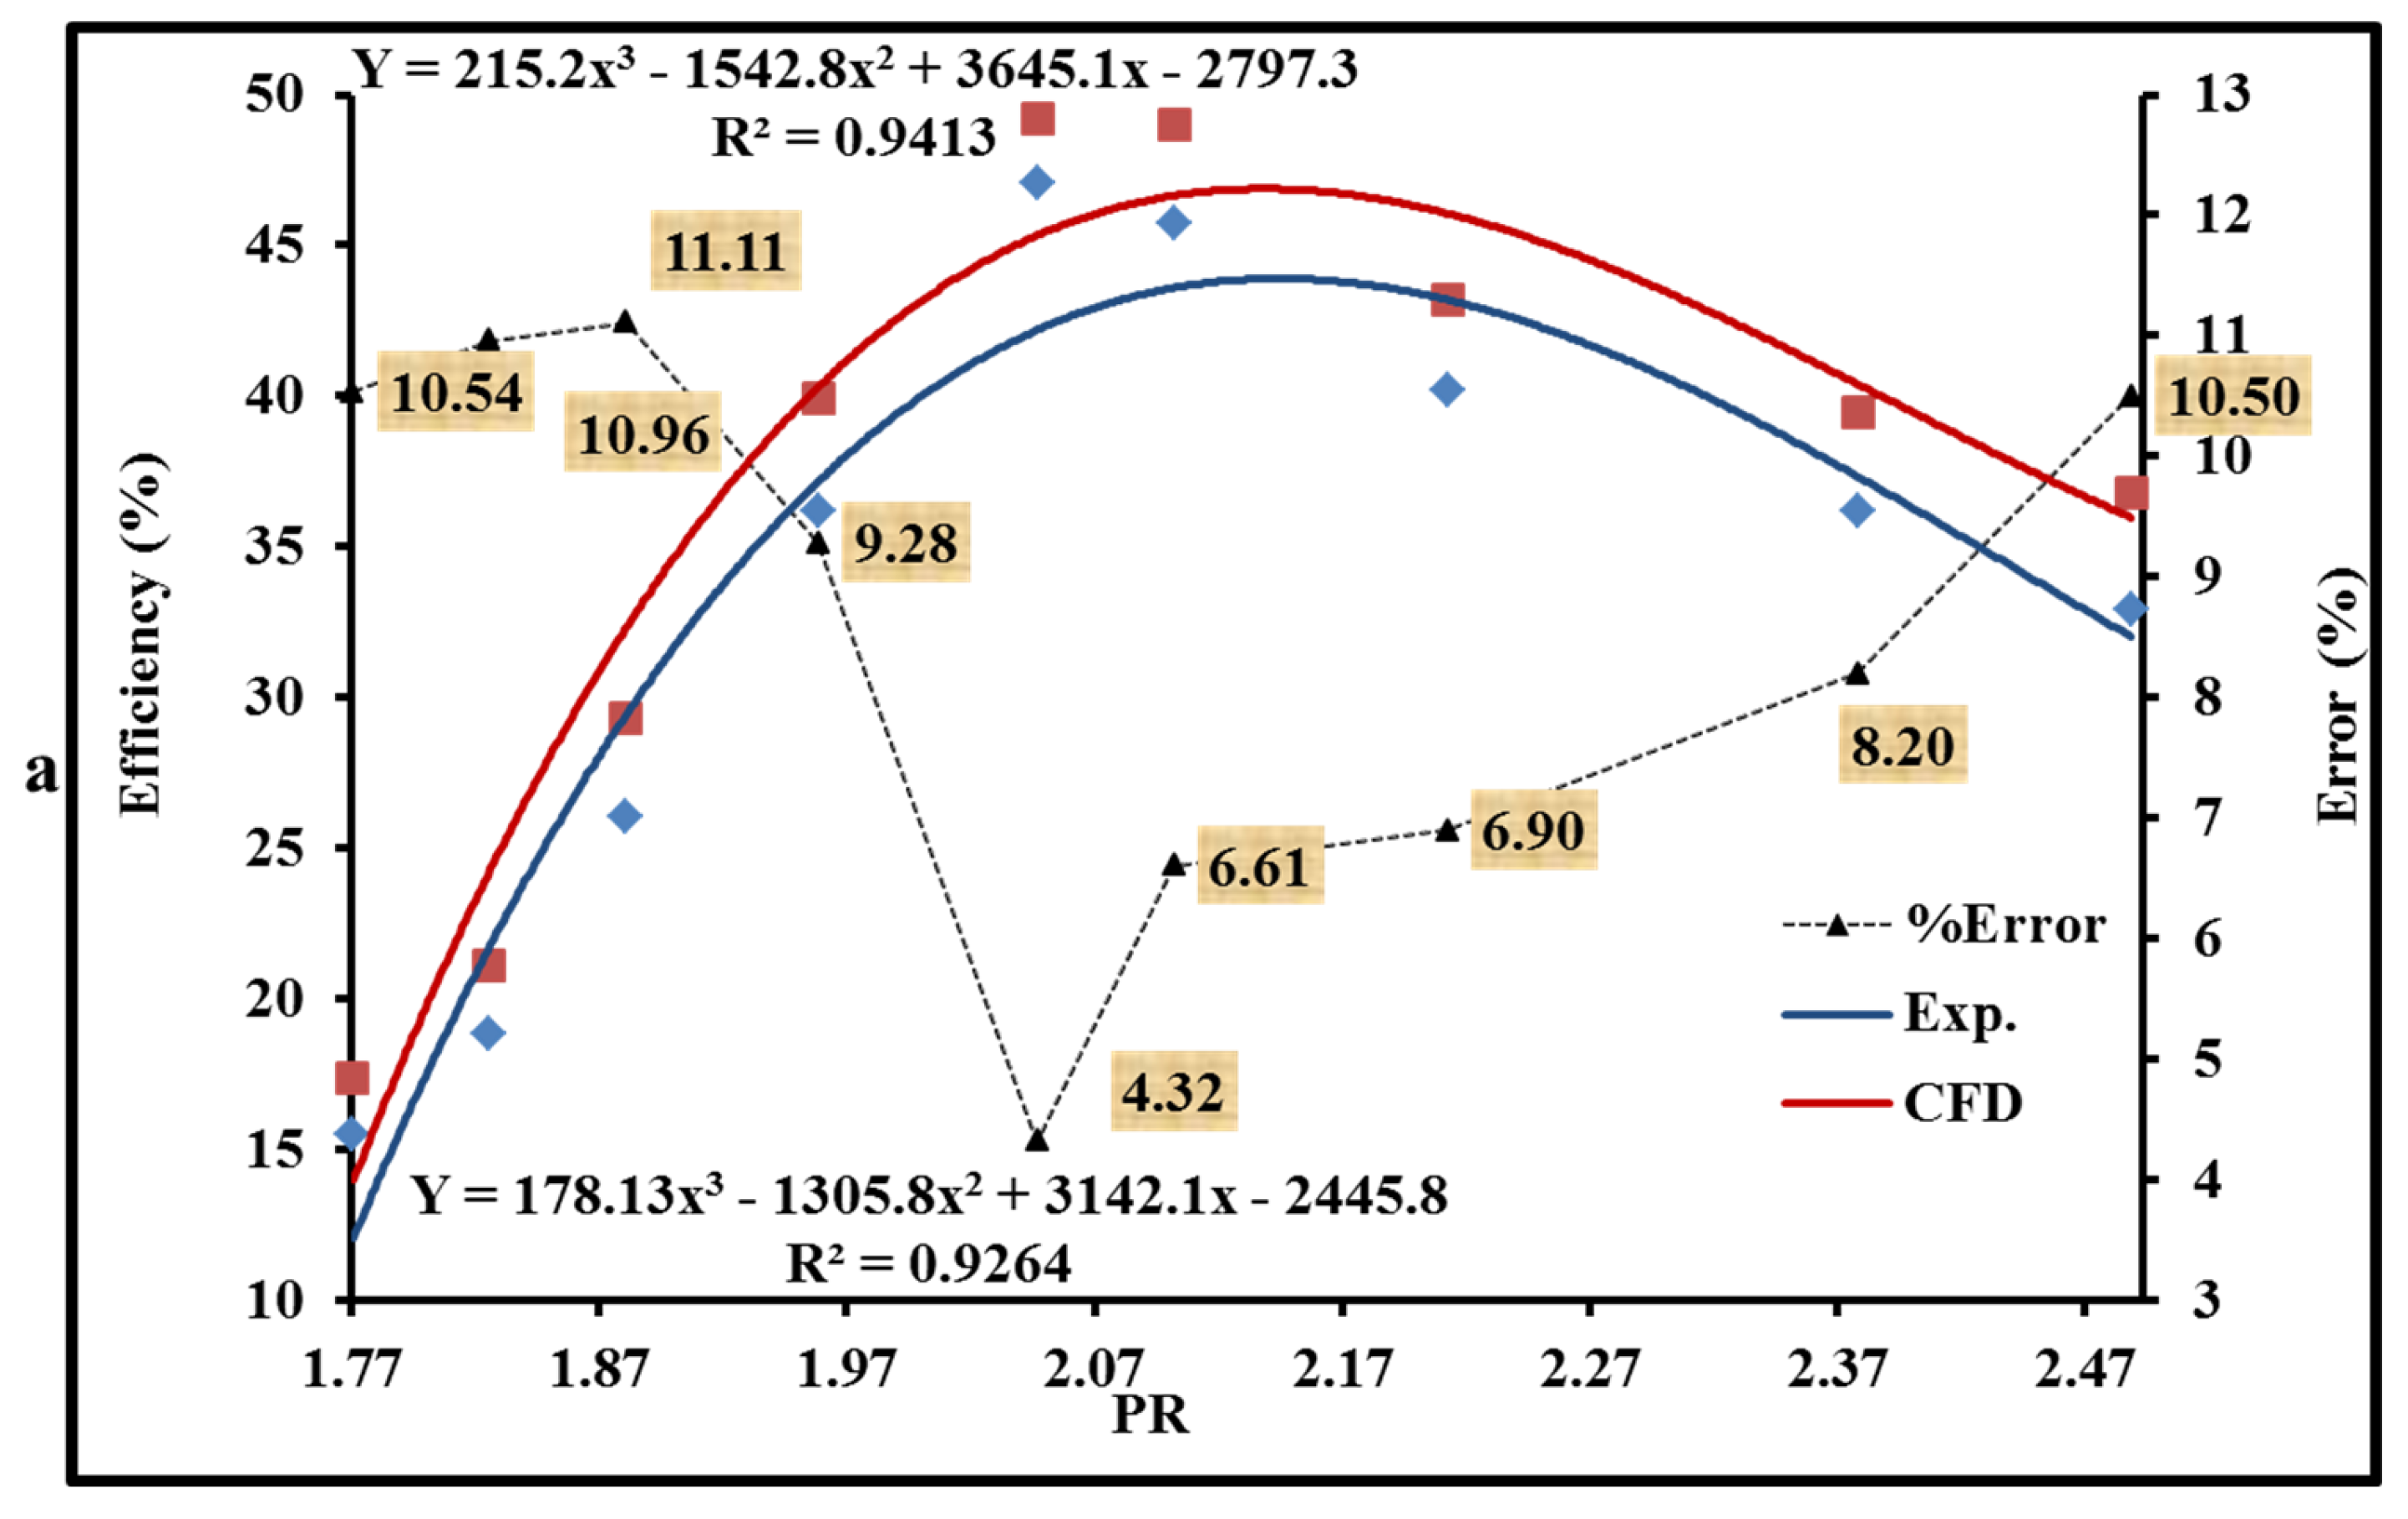
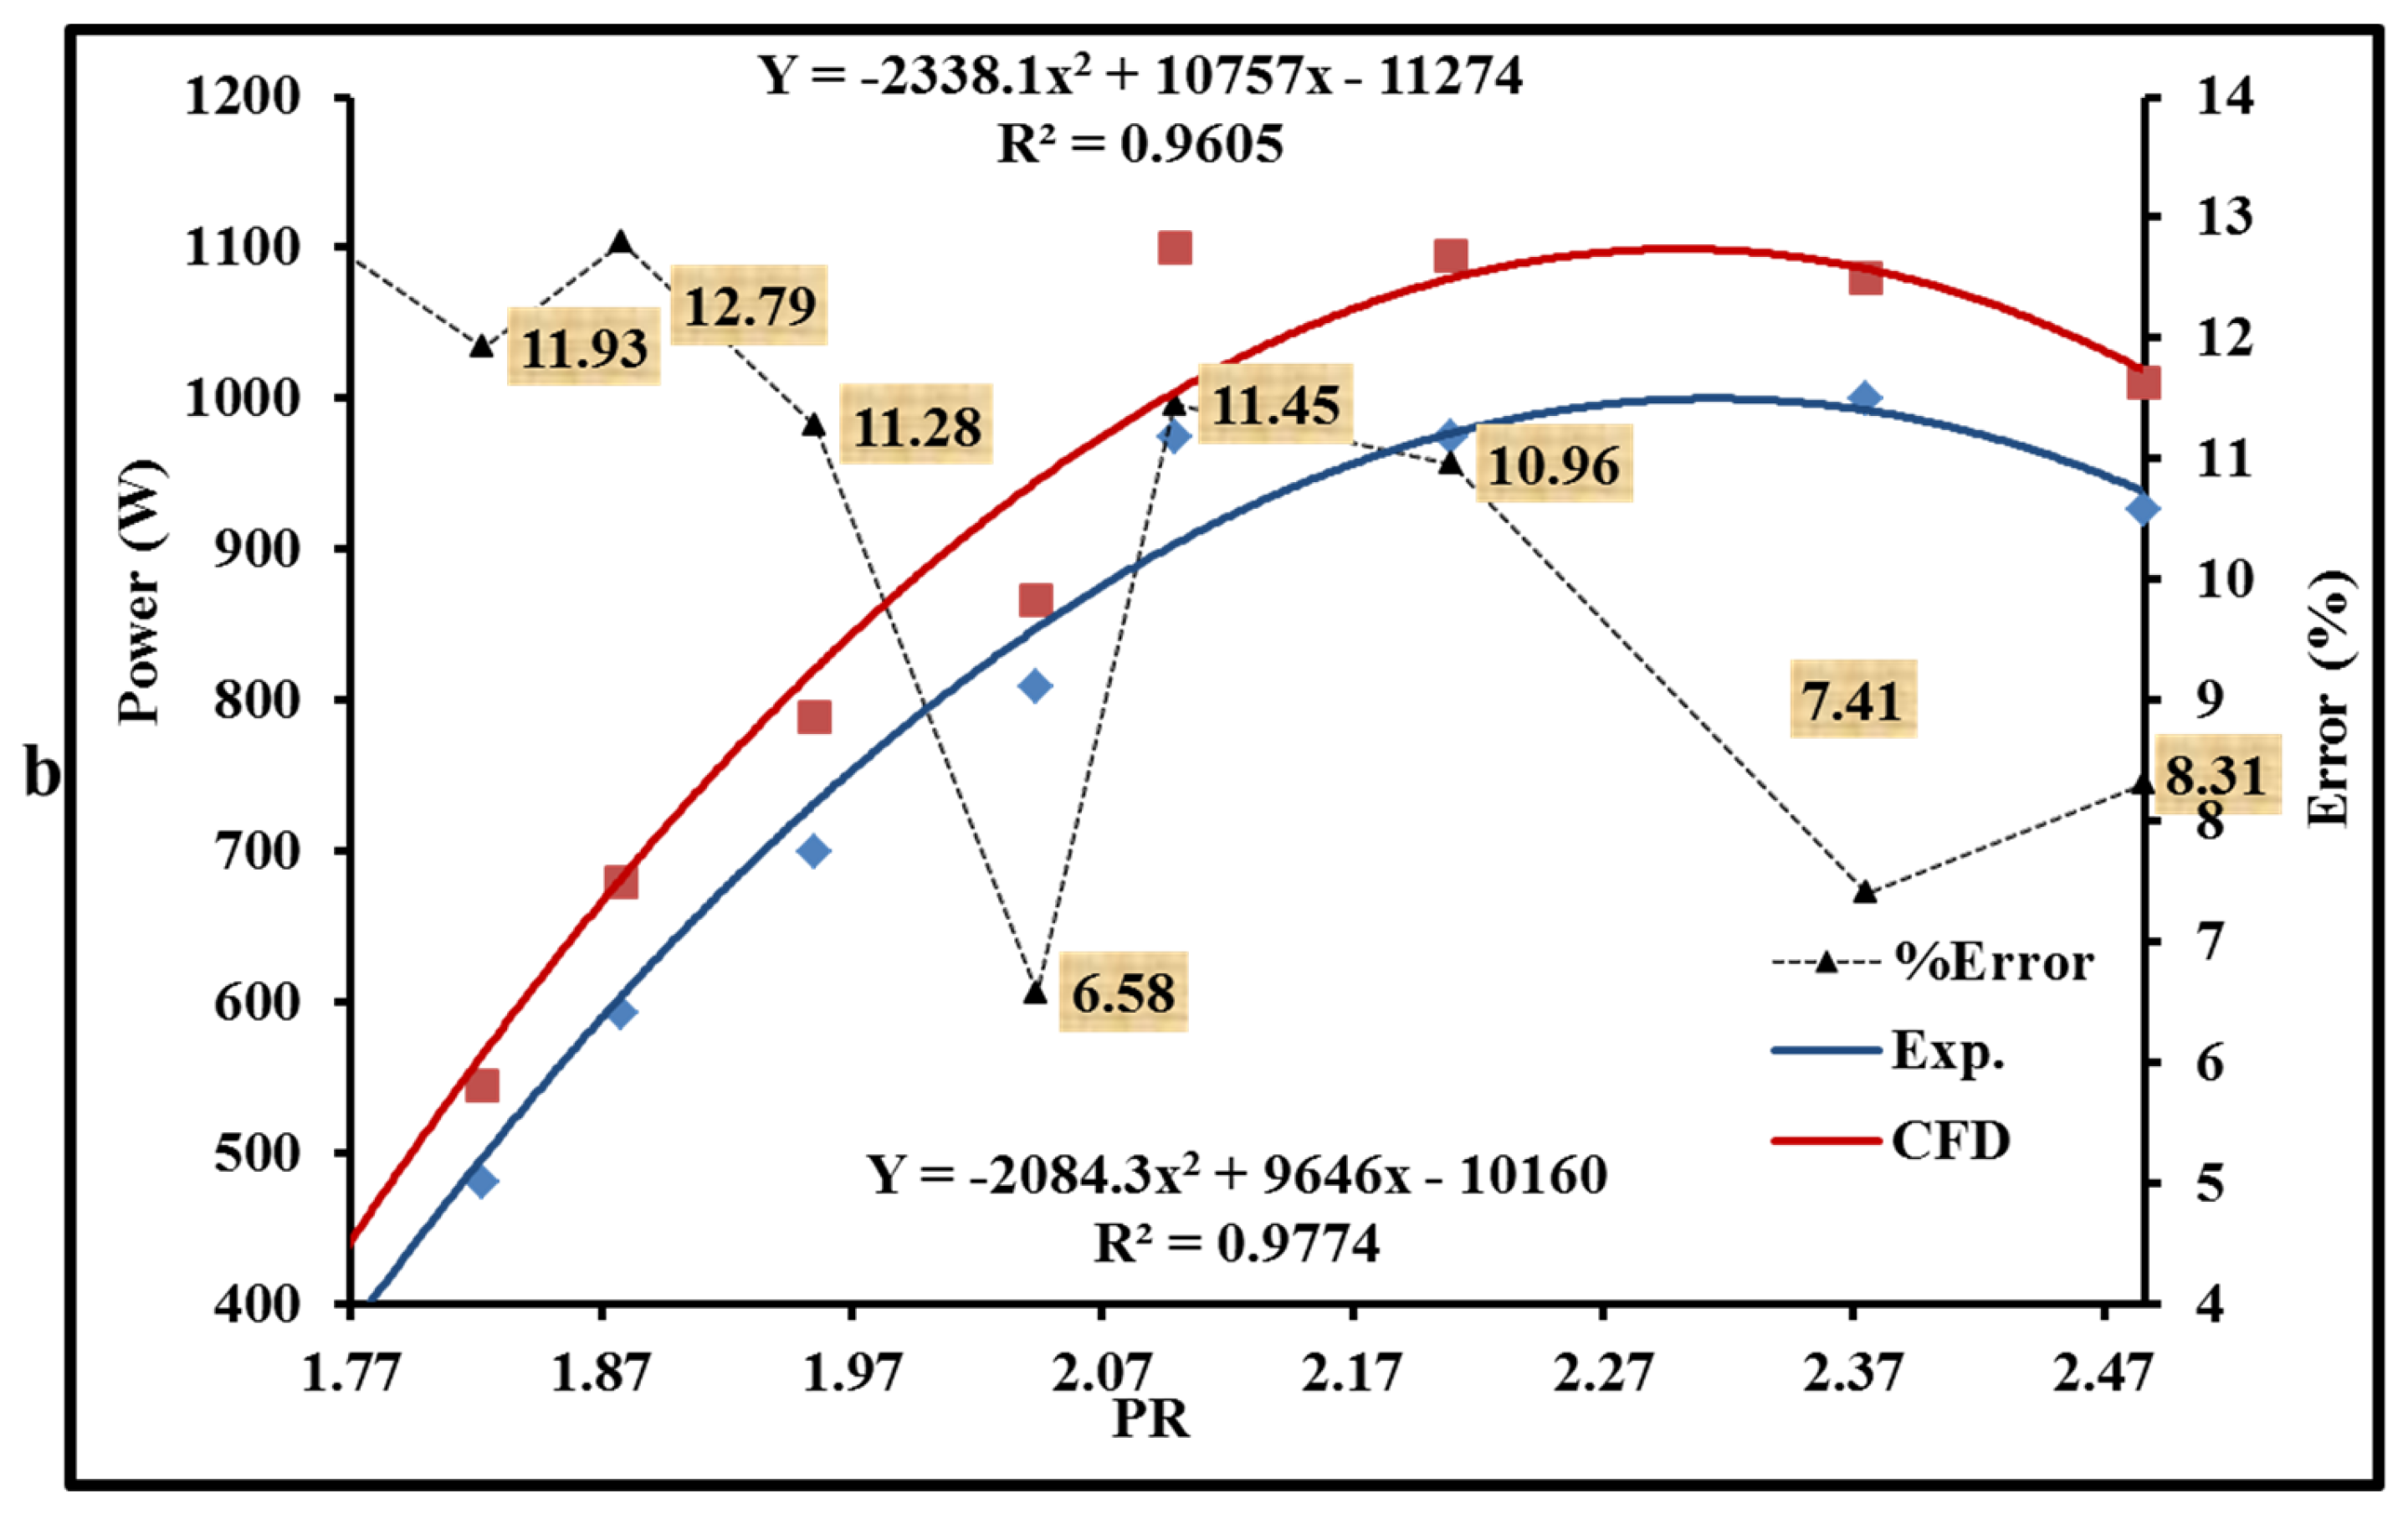
The graphical representation in Figure 11 illustrates the comprehensive static efficiency and power generation of the SSRT under specific operating conditions, namely with an intake temperature of 40 °C, a maximum rotor speed of approximately 20,000 rpm and various values of Pressure Ratio PR. A comparison is made between the theoretical predictions and the corresponding experimental results. It is important to acknowledge that the highest level of efficiency and power generation was achieved when the intake pressure reached approximately 3 bar and the inlet turbine temperature was maintained at 40 °C, resulting in respective values of 45 percent efficiency and 1.05 kW power output. The data presented in this figure suggest that the calculated efficiency and output power of the SSRT were overestimated, with a maximum value of 16% and less than 15%, respectively, in comparison to the results obtained from the testing process. This is relevant for the following reasons:
  • The numerical investigation was conducted under ideal boundary conditions, with a steady-state flow and negligible heat dissipation through the turbine structure. However, the real-world operating conditions differed significantly.
  • The measurements in the experimental study encompassed the surface roughness of the SSRT model, whereas the numerical analysis conducted with ANSYS CFX did not account for this aspect.
Another justification pertains to the mechanical losses occurring in the rotor section, which were not taken into consideration in the CFX analysis. This is because the existing model solely accounted for the stator and rotor, neglecting these losses.

5.2. Structural Analysis Results

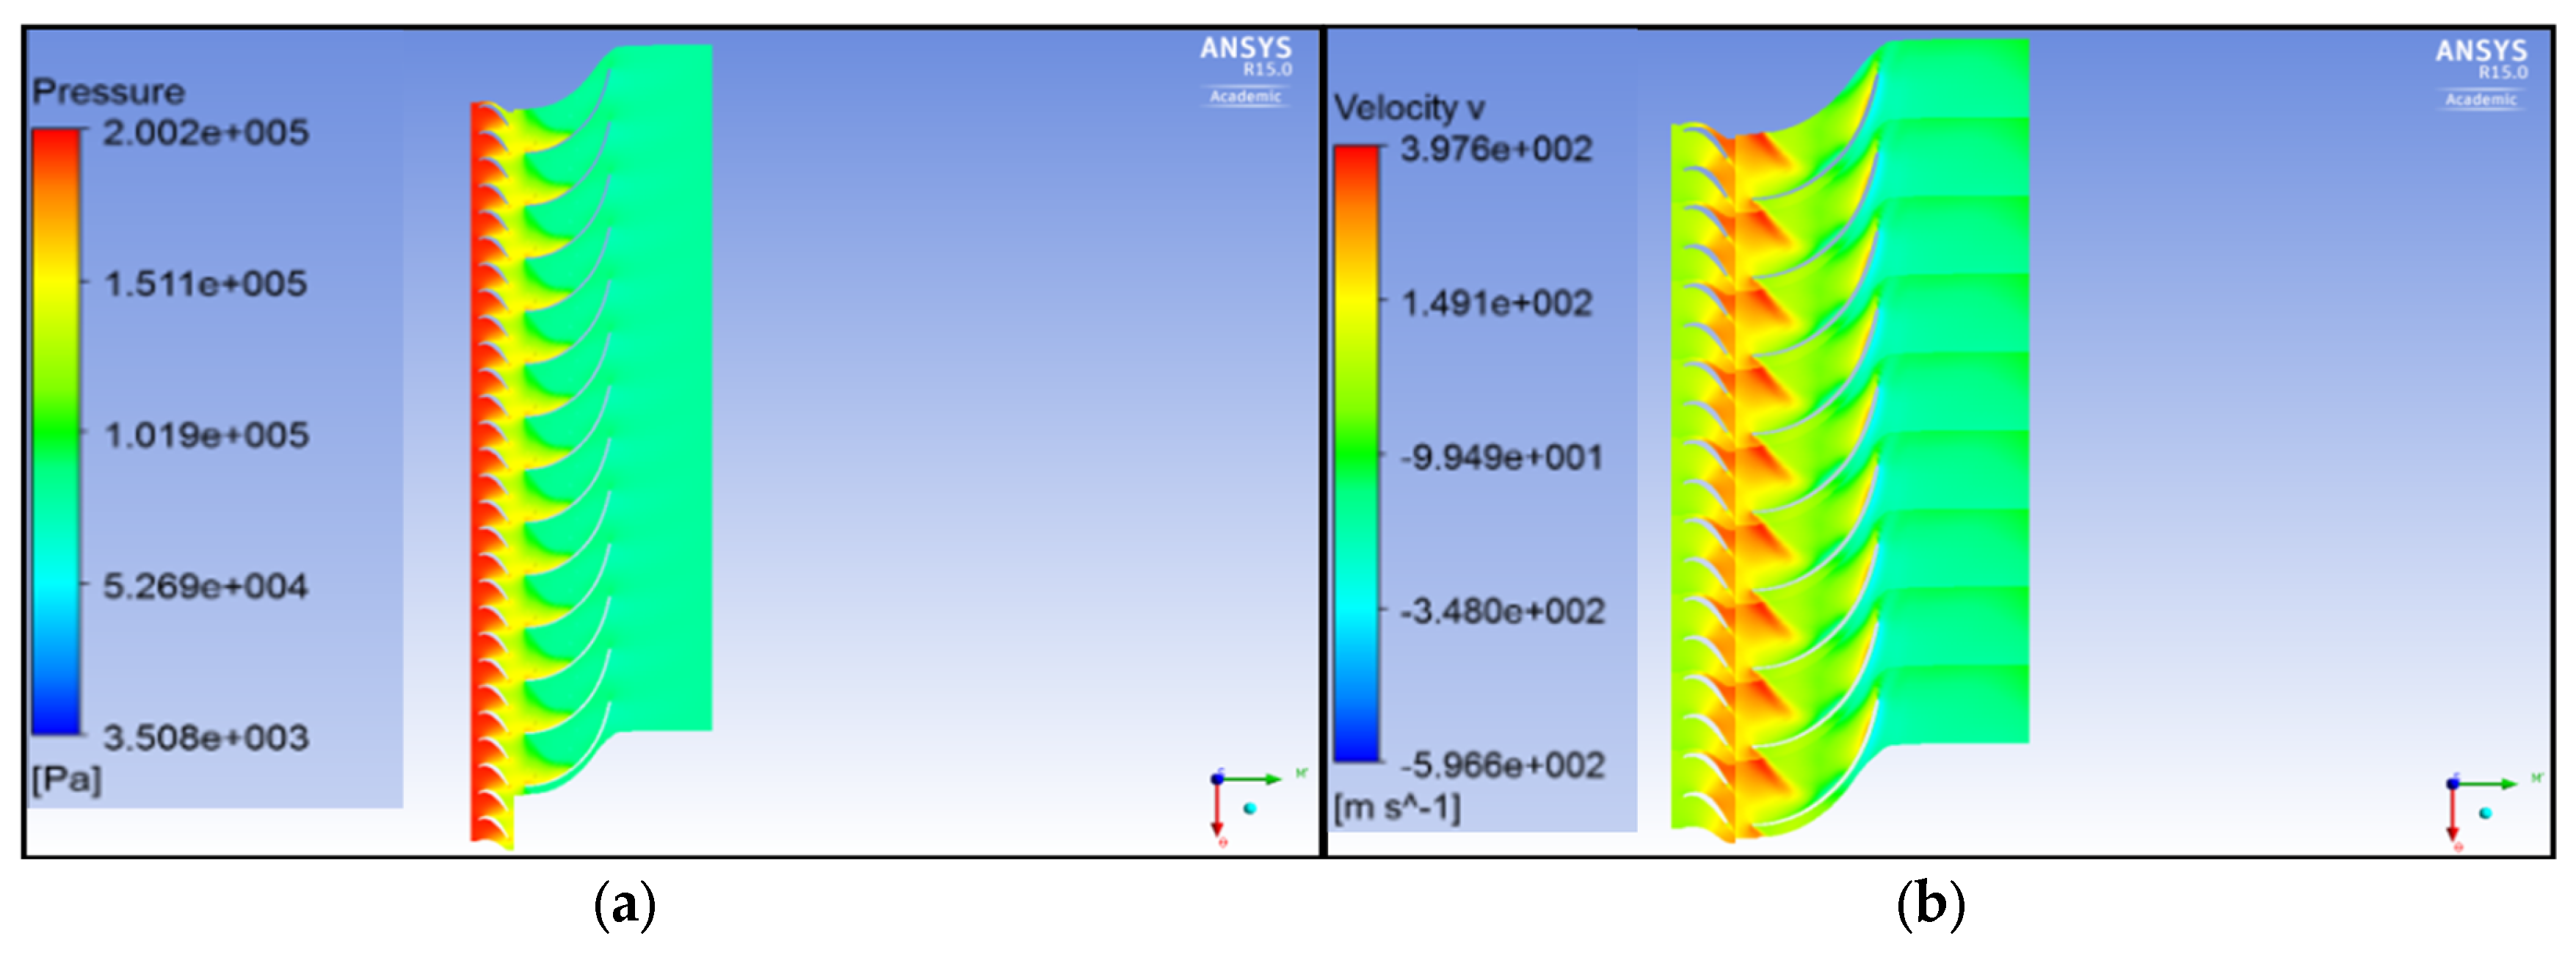
Figure 12 shows the pressure distribution and the velocity stream in a blade-to-blade view for the used blade-to-blade passage for the SSRT. It is clear from the figure how the pressure value decreases through each component of the SSRT, starting from the stator which has the highest value. As for Figure 13b, the velocity contours through the stator and the rotor are presented. From this contour, the maximum value of the compressed air velocity is located at the stator outlet when it is directed toward the rotor inlet, and then decreased gradually when it passes through the rotor to reach its minimum value at the rotor exit.
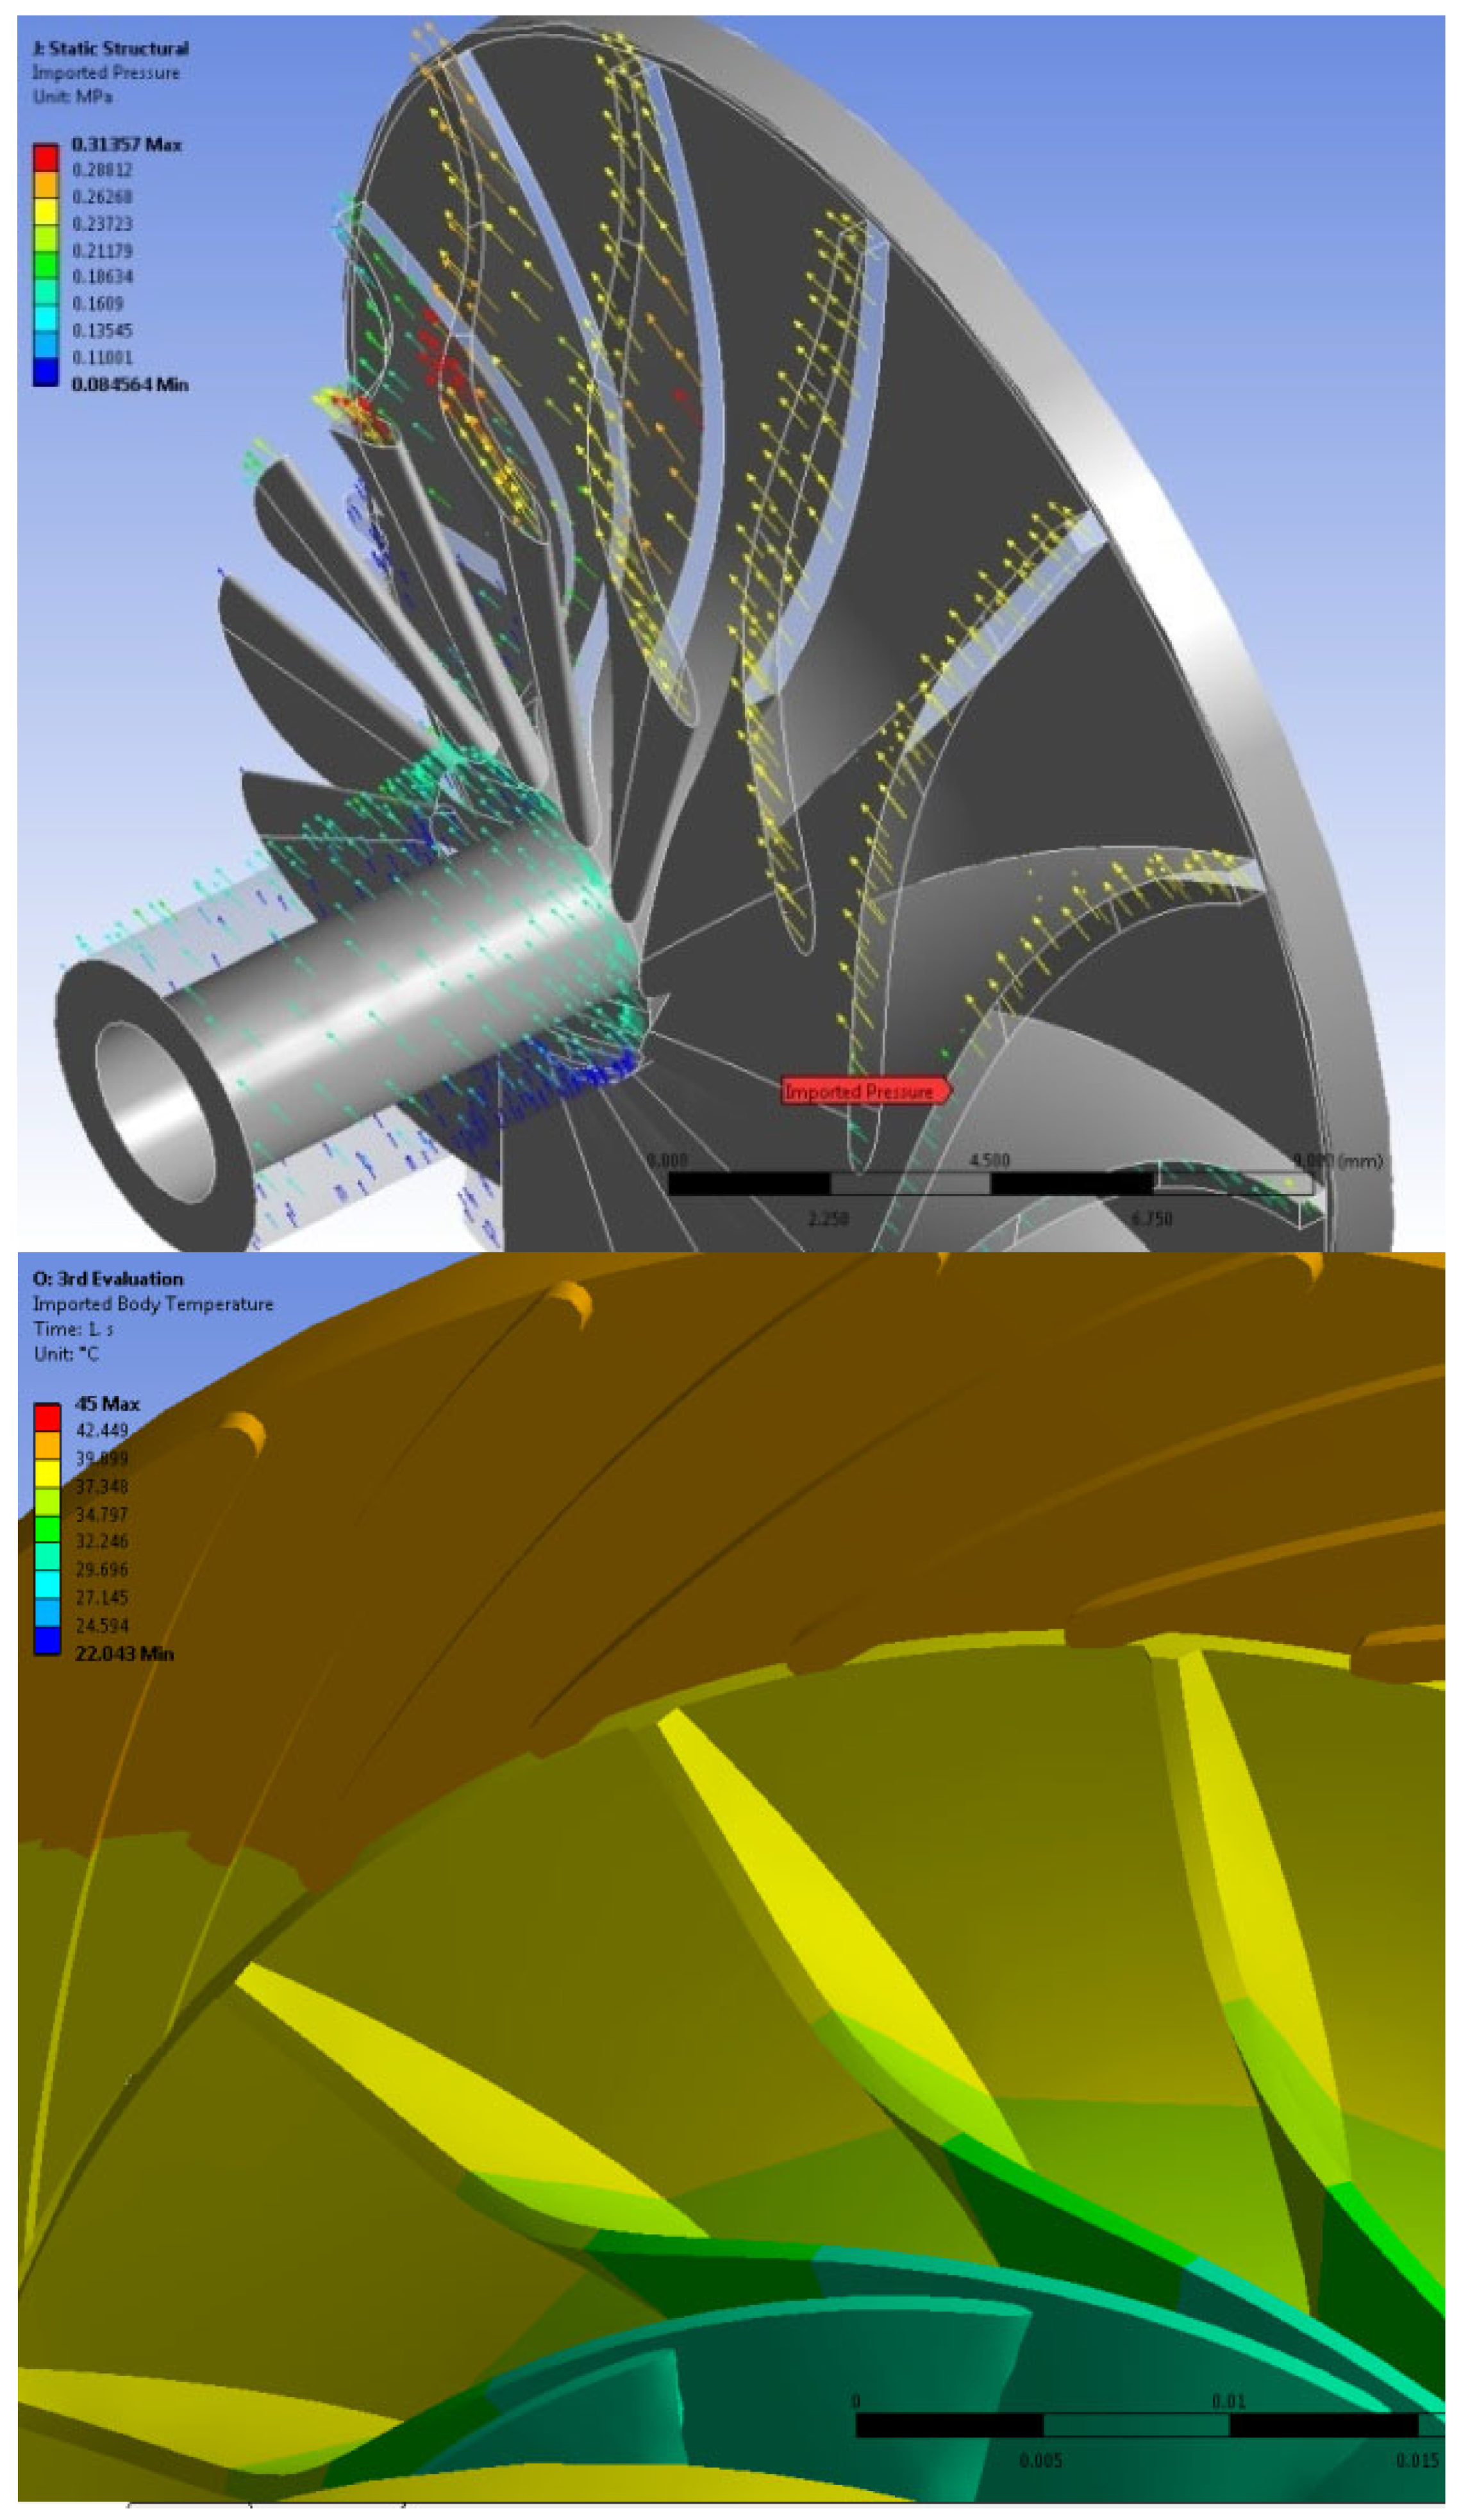
Figure 13 shows the imported pressure and temperature distribution. As shown in the figures, the pressure side of the blade is where the incoming air flow, as an aerodynamic load, is positioned in order to provide the requisite torque. The temperature profile on the blades of the rotor begins at the tip of the blade/maximum temperature value (because the incoming air flow rate has the highest temperature value), and then decreases as the compressed air is distributed on the other blade’s surface, particularly at the leading-edge side of the blades.
Once these two parts are initiated, the next step is to design the required volute required for distributing the inlet compressed air annually, delivering uniform mass flowrate and guiding it to the stator, ideally without pressure losses [33] and, serially, the rotor.
Turbines are one of the models that deal with high temperature analysis and, as a result, a thermal analysis, which plays a significant role in the expanse of endurance structural stresses, should be deeply evaluated. That which has been mentioned earlier will be even more appreciated once one knows that the material which has been used in manufacturing the turbine model is a plastic one. In this study, it was assumed that the inlet of compressed air was initially heated using a small scale thermal receiver (see more details in references [5,34], as these work are interested in the small-scale solar powered cycle applications).
Based on the experimental analysis carried out, the maximum compressed air temperature reached up to 70 °C; however, for the sake of material ability to withstand values such as these, the range with which this work deals was around 50 °C. This temperature value represents the compressed air inlet temperature in the turbine.
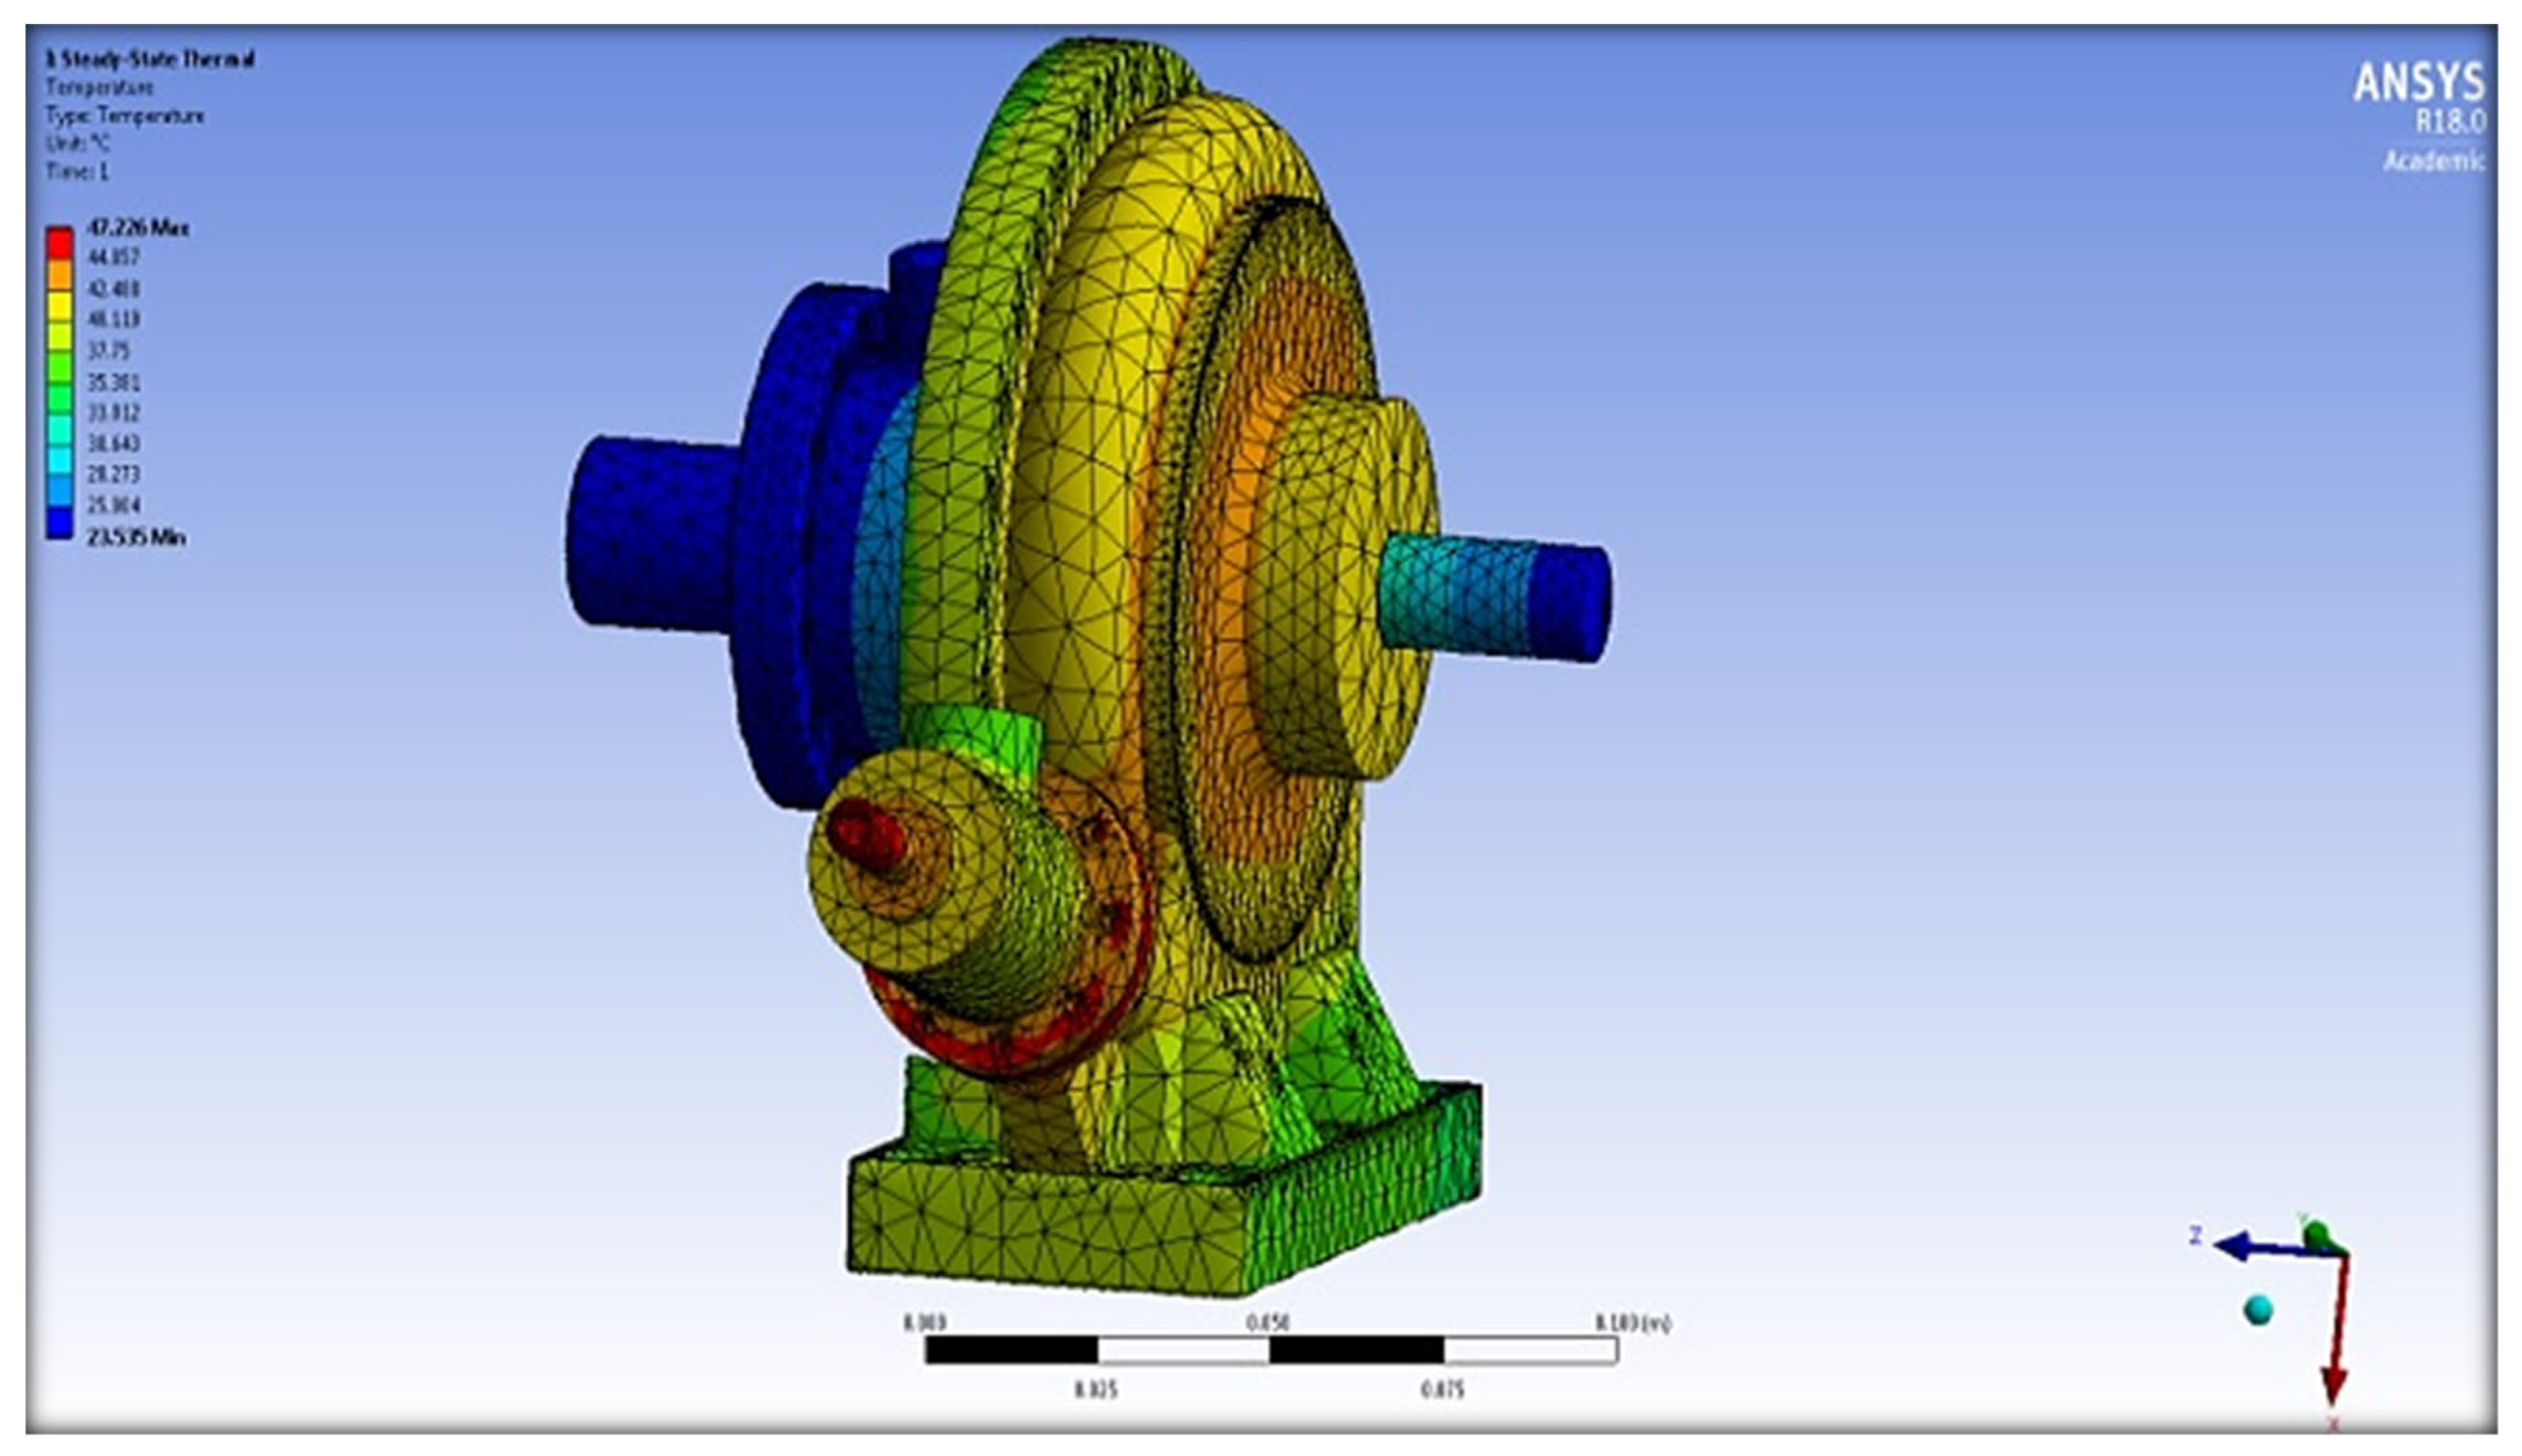
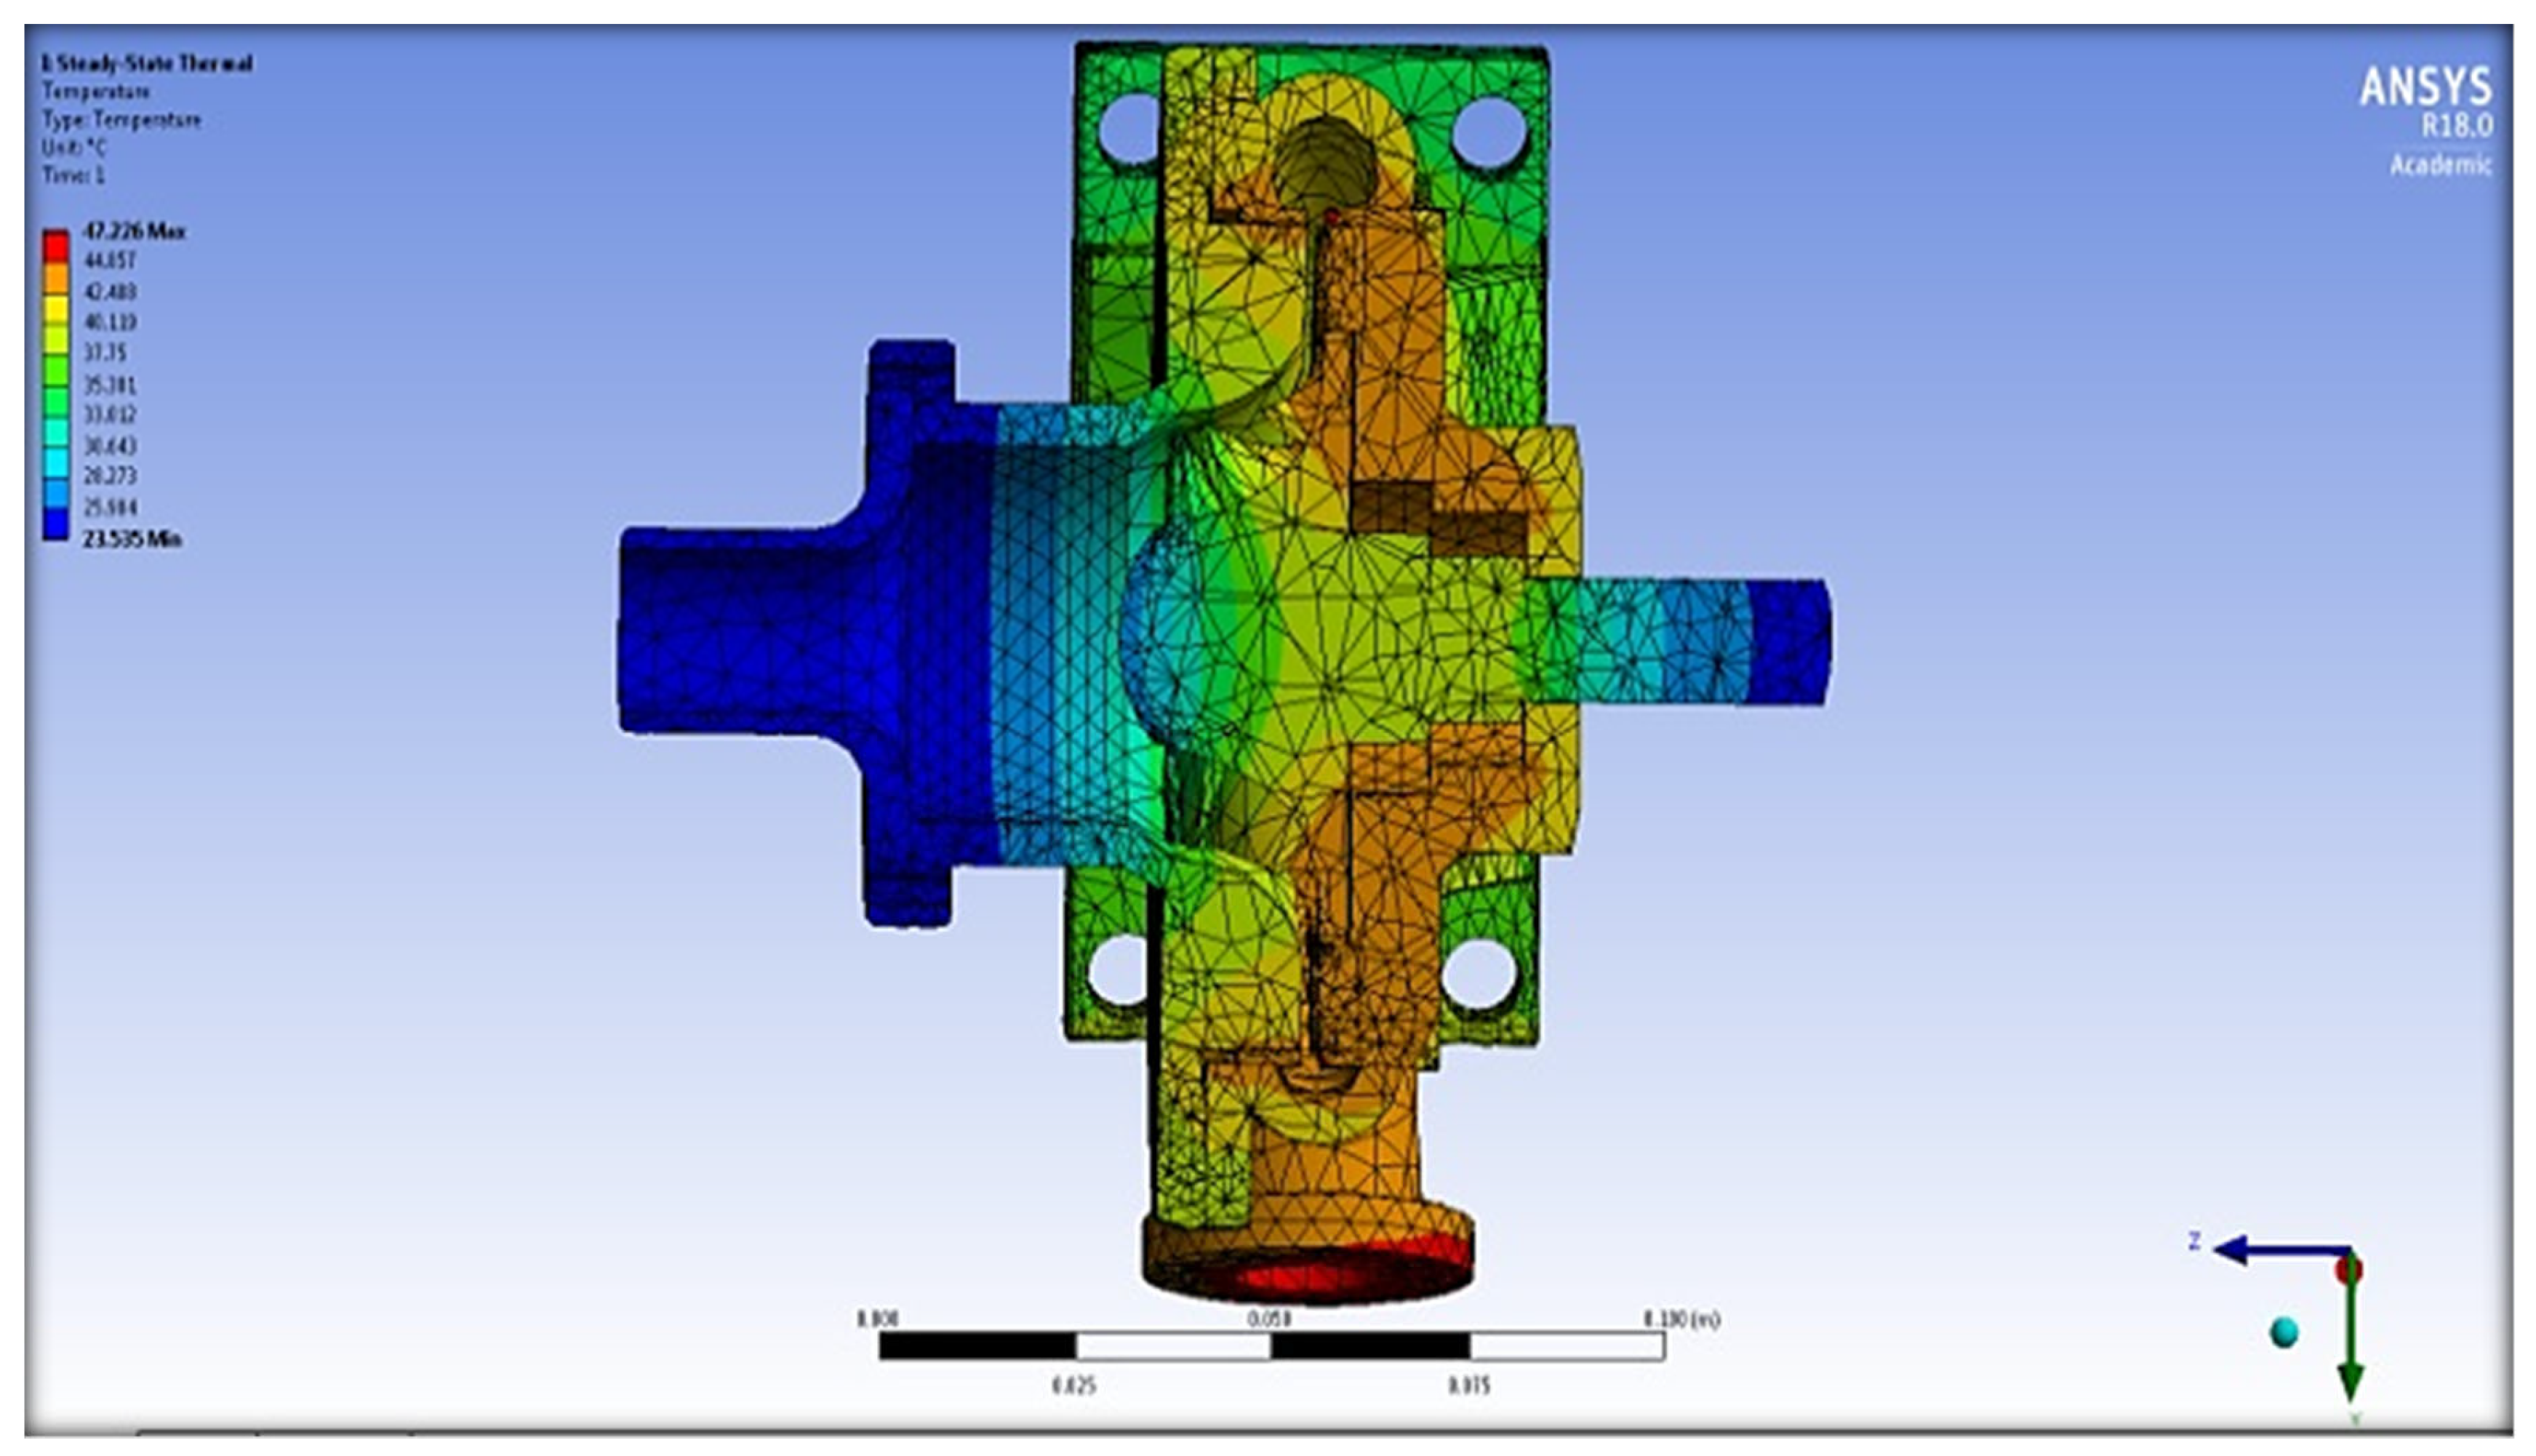
In Figure 14, it can be observed that the air inlet temperature has a significant effect on stress, strain and their distribution on the rotor. Based on the heat energy of the compressed air, the flux amount applied on the turbine model’s surfaces was estimated. Also, the convection, radiation and conduction locations were specified, depending on the model configuration, as heat sinks.
For example, the maximum temperature, around 48 °C, was located at the inlet flange and determined as being the first part that the incoming compressed air faces when entering the turbine model. By contrast, for the parts which are exposed to the atmosphere or those which are located at a further point, their temperature values are lower because of heat loss. Interestingly, the temperature value at the rotor exit is around 23 °C, which is almost the atmospheric temperature as initially defined in the boundary conditions on the assumption that the rotor is extracting most of the compressed air energy, including thermal energy. Here, it is important to highlight that, at this stage, no deformation or stress analyses have yet been established.
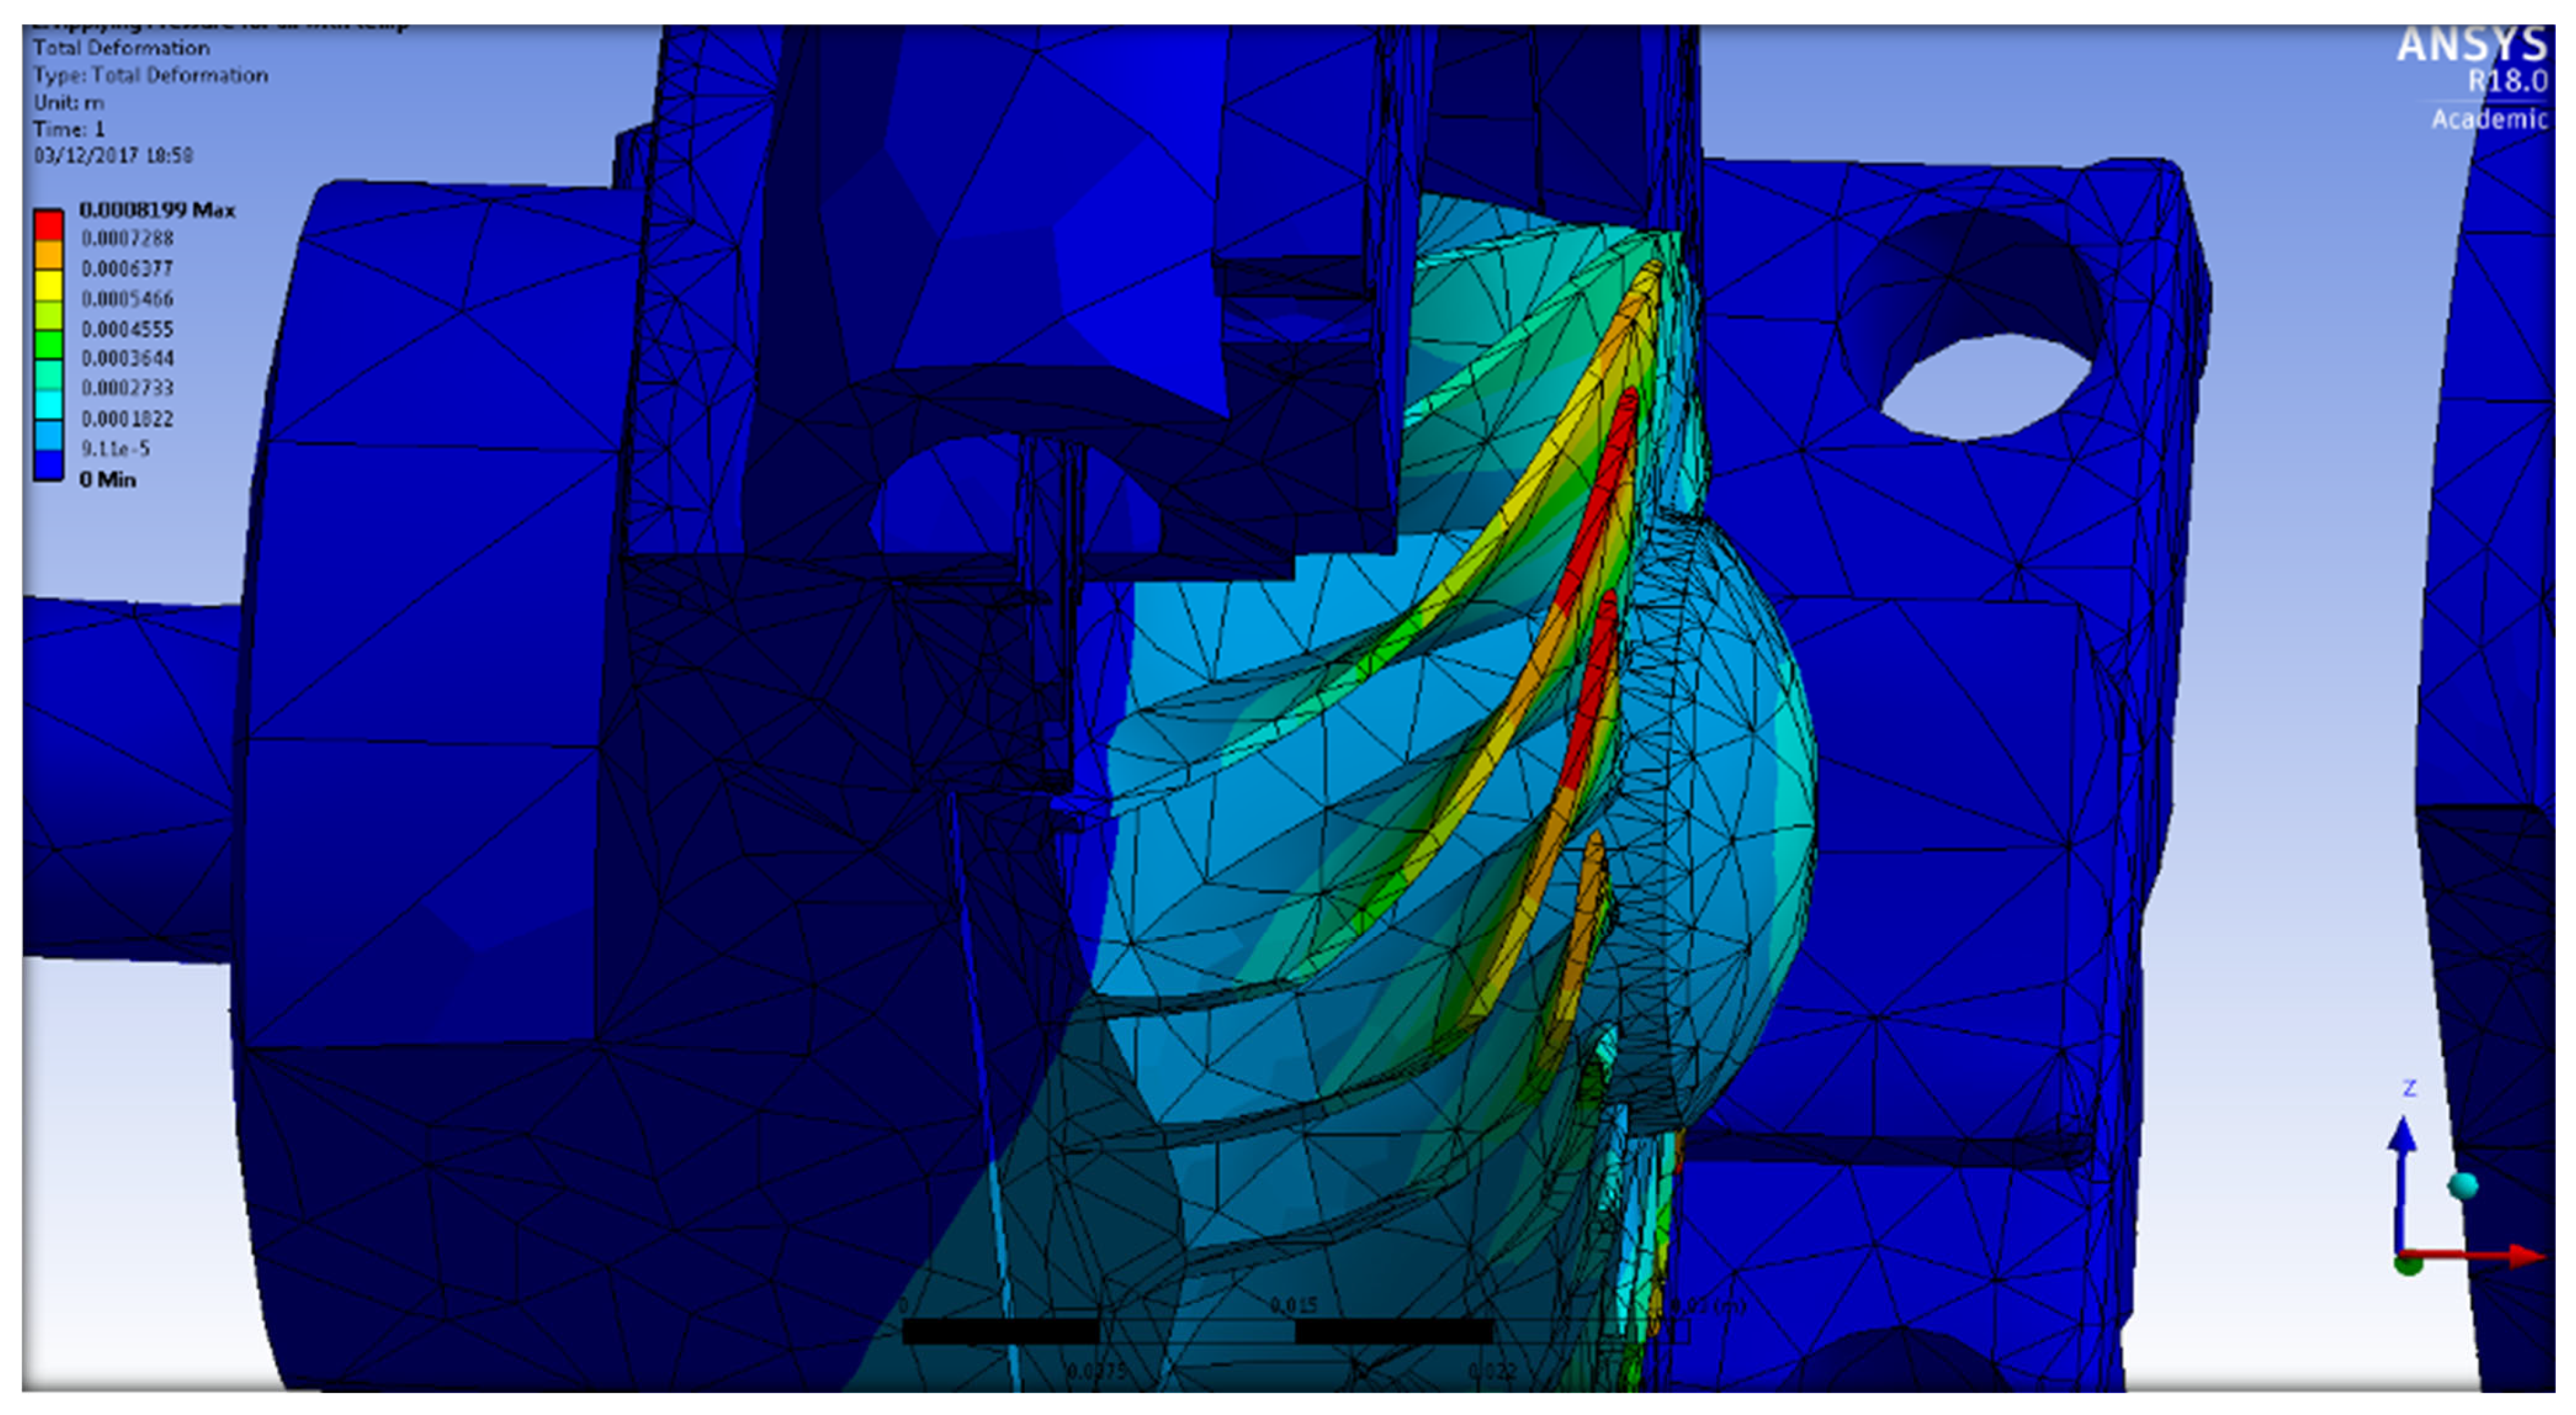
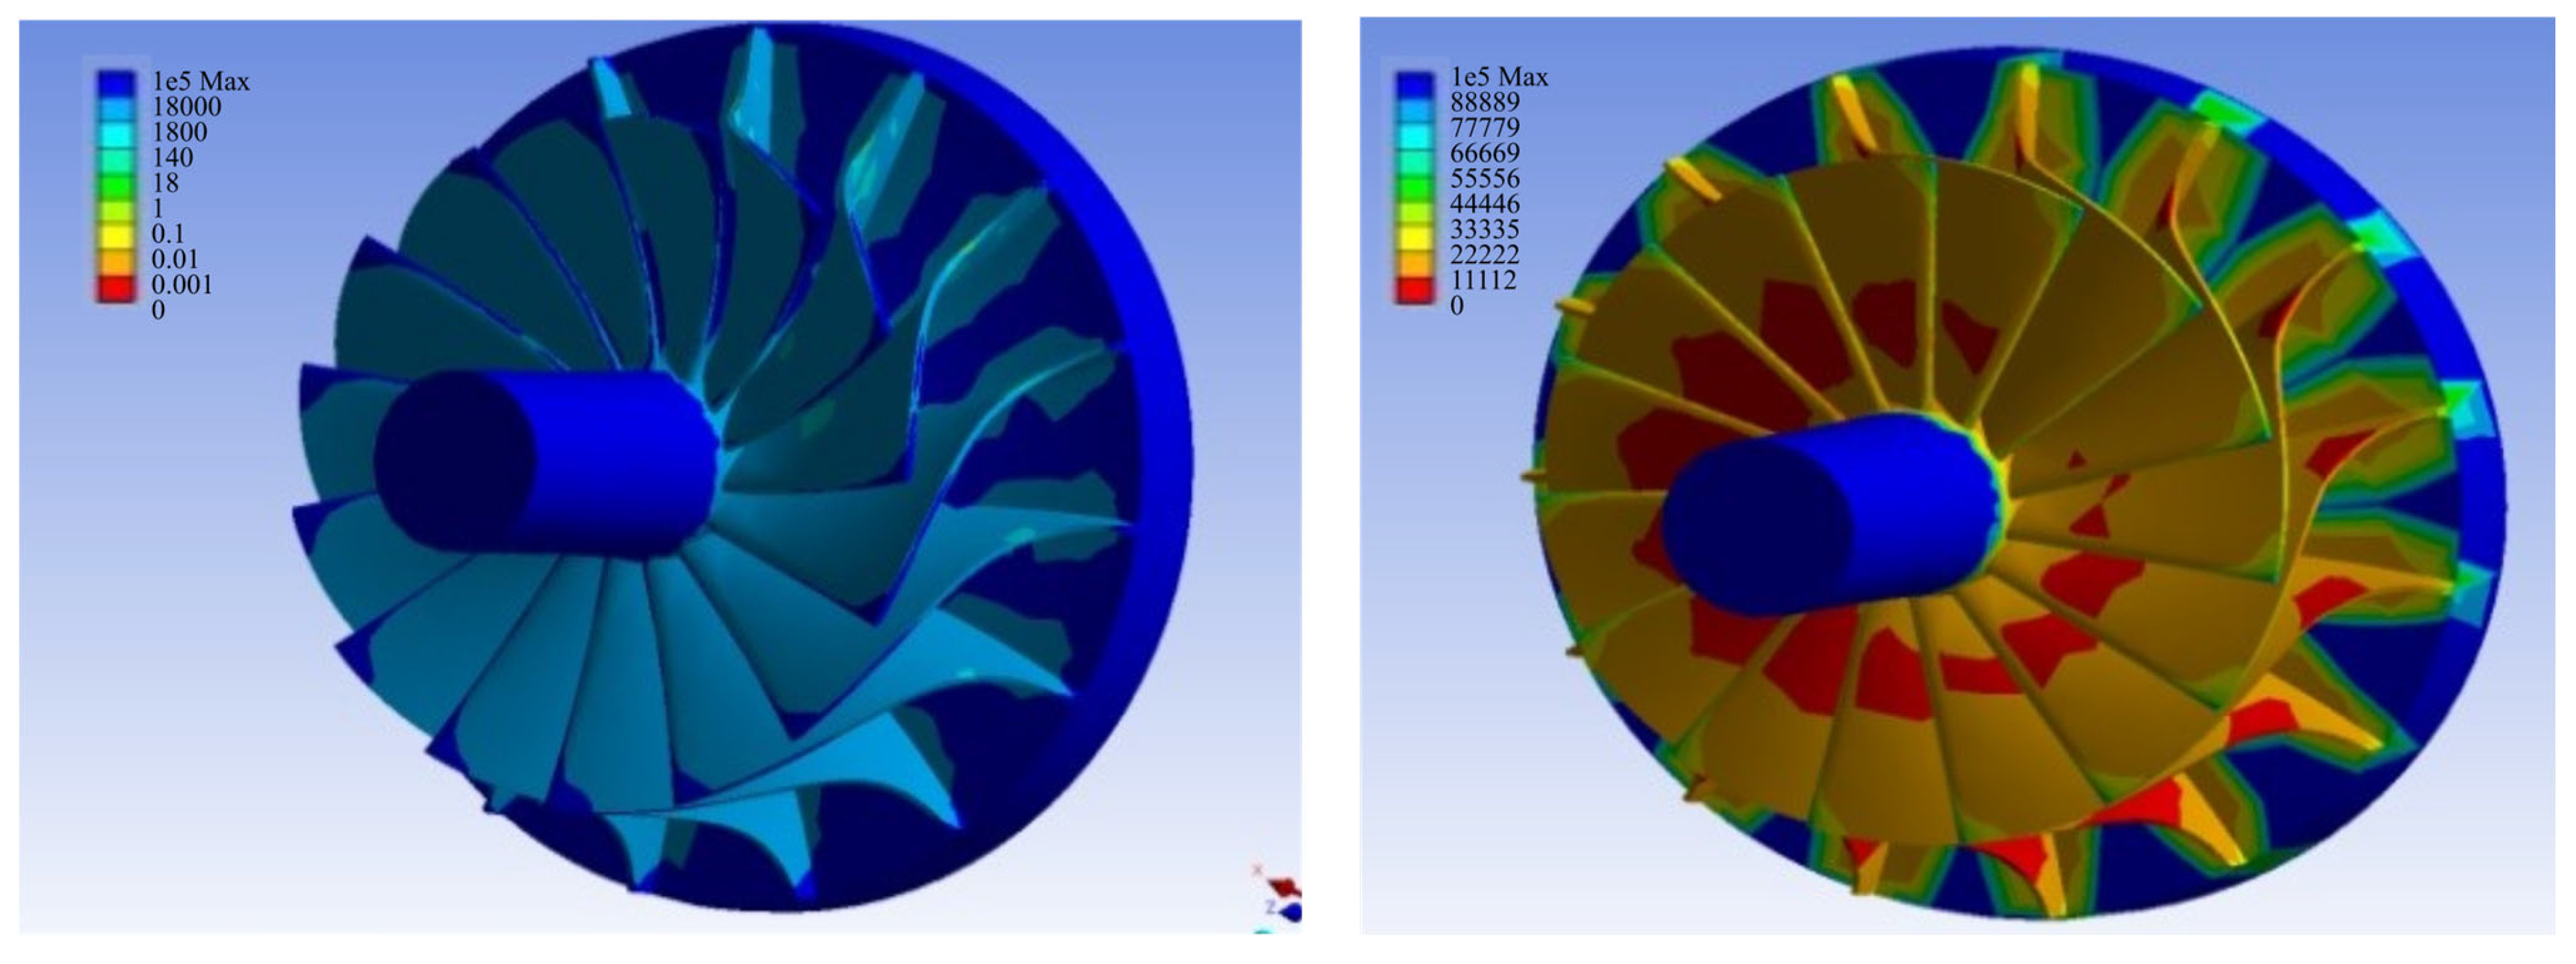
The other important consideration in this study is the structural analysis which includes the stress, the deformation and the safety factor values. So, by specifying the inlet and the exit pressure values through aerodynamic analysis, using ANSYS CFX, accompanied by the thermal load along the turbine model, the previously mentioned factors were determined at fixed rotational velocity at this stage. Figure 15 highlights the total deformation that can occur in the SSRT parts. From this figure, it can be noticed that the most influenced part was the rotor, especially the blade tip areas, as it is considered a cantilever beam, while the other rotor’s areas were relatively high compared to other parts of the turbine. By contrast, the latter experienced very low deformation because they were fixed, either by another turbine’s parts, by bolt connections or to the basement. The other important factor in this analysis is the equivalent stress initiated in the model, which is shown in Figure 16. This stress was concentrated where the blades’ roots were located, indicated that this stress was intensified in the previously mentioned area, as well as in the bolt spaces as a result of the applied forces’ directions.
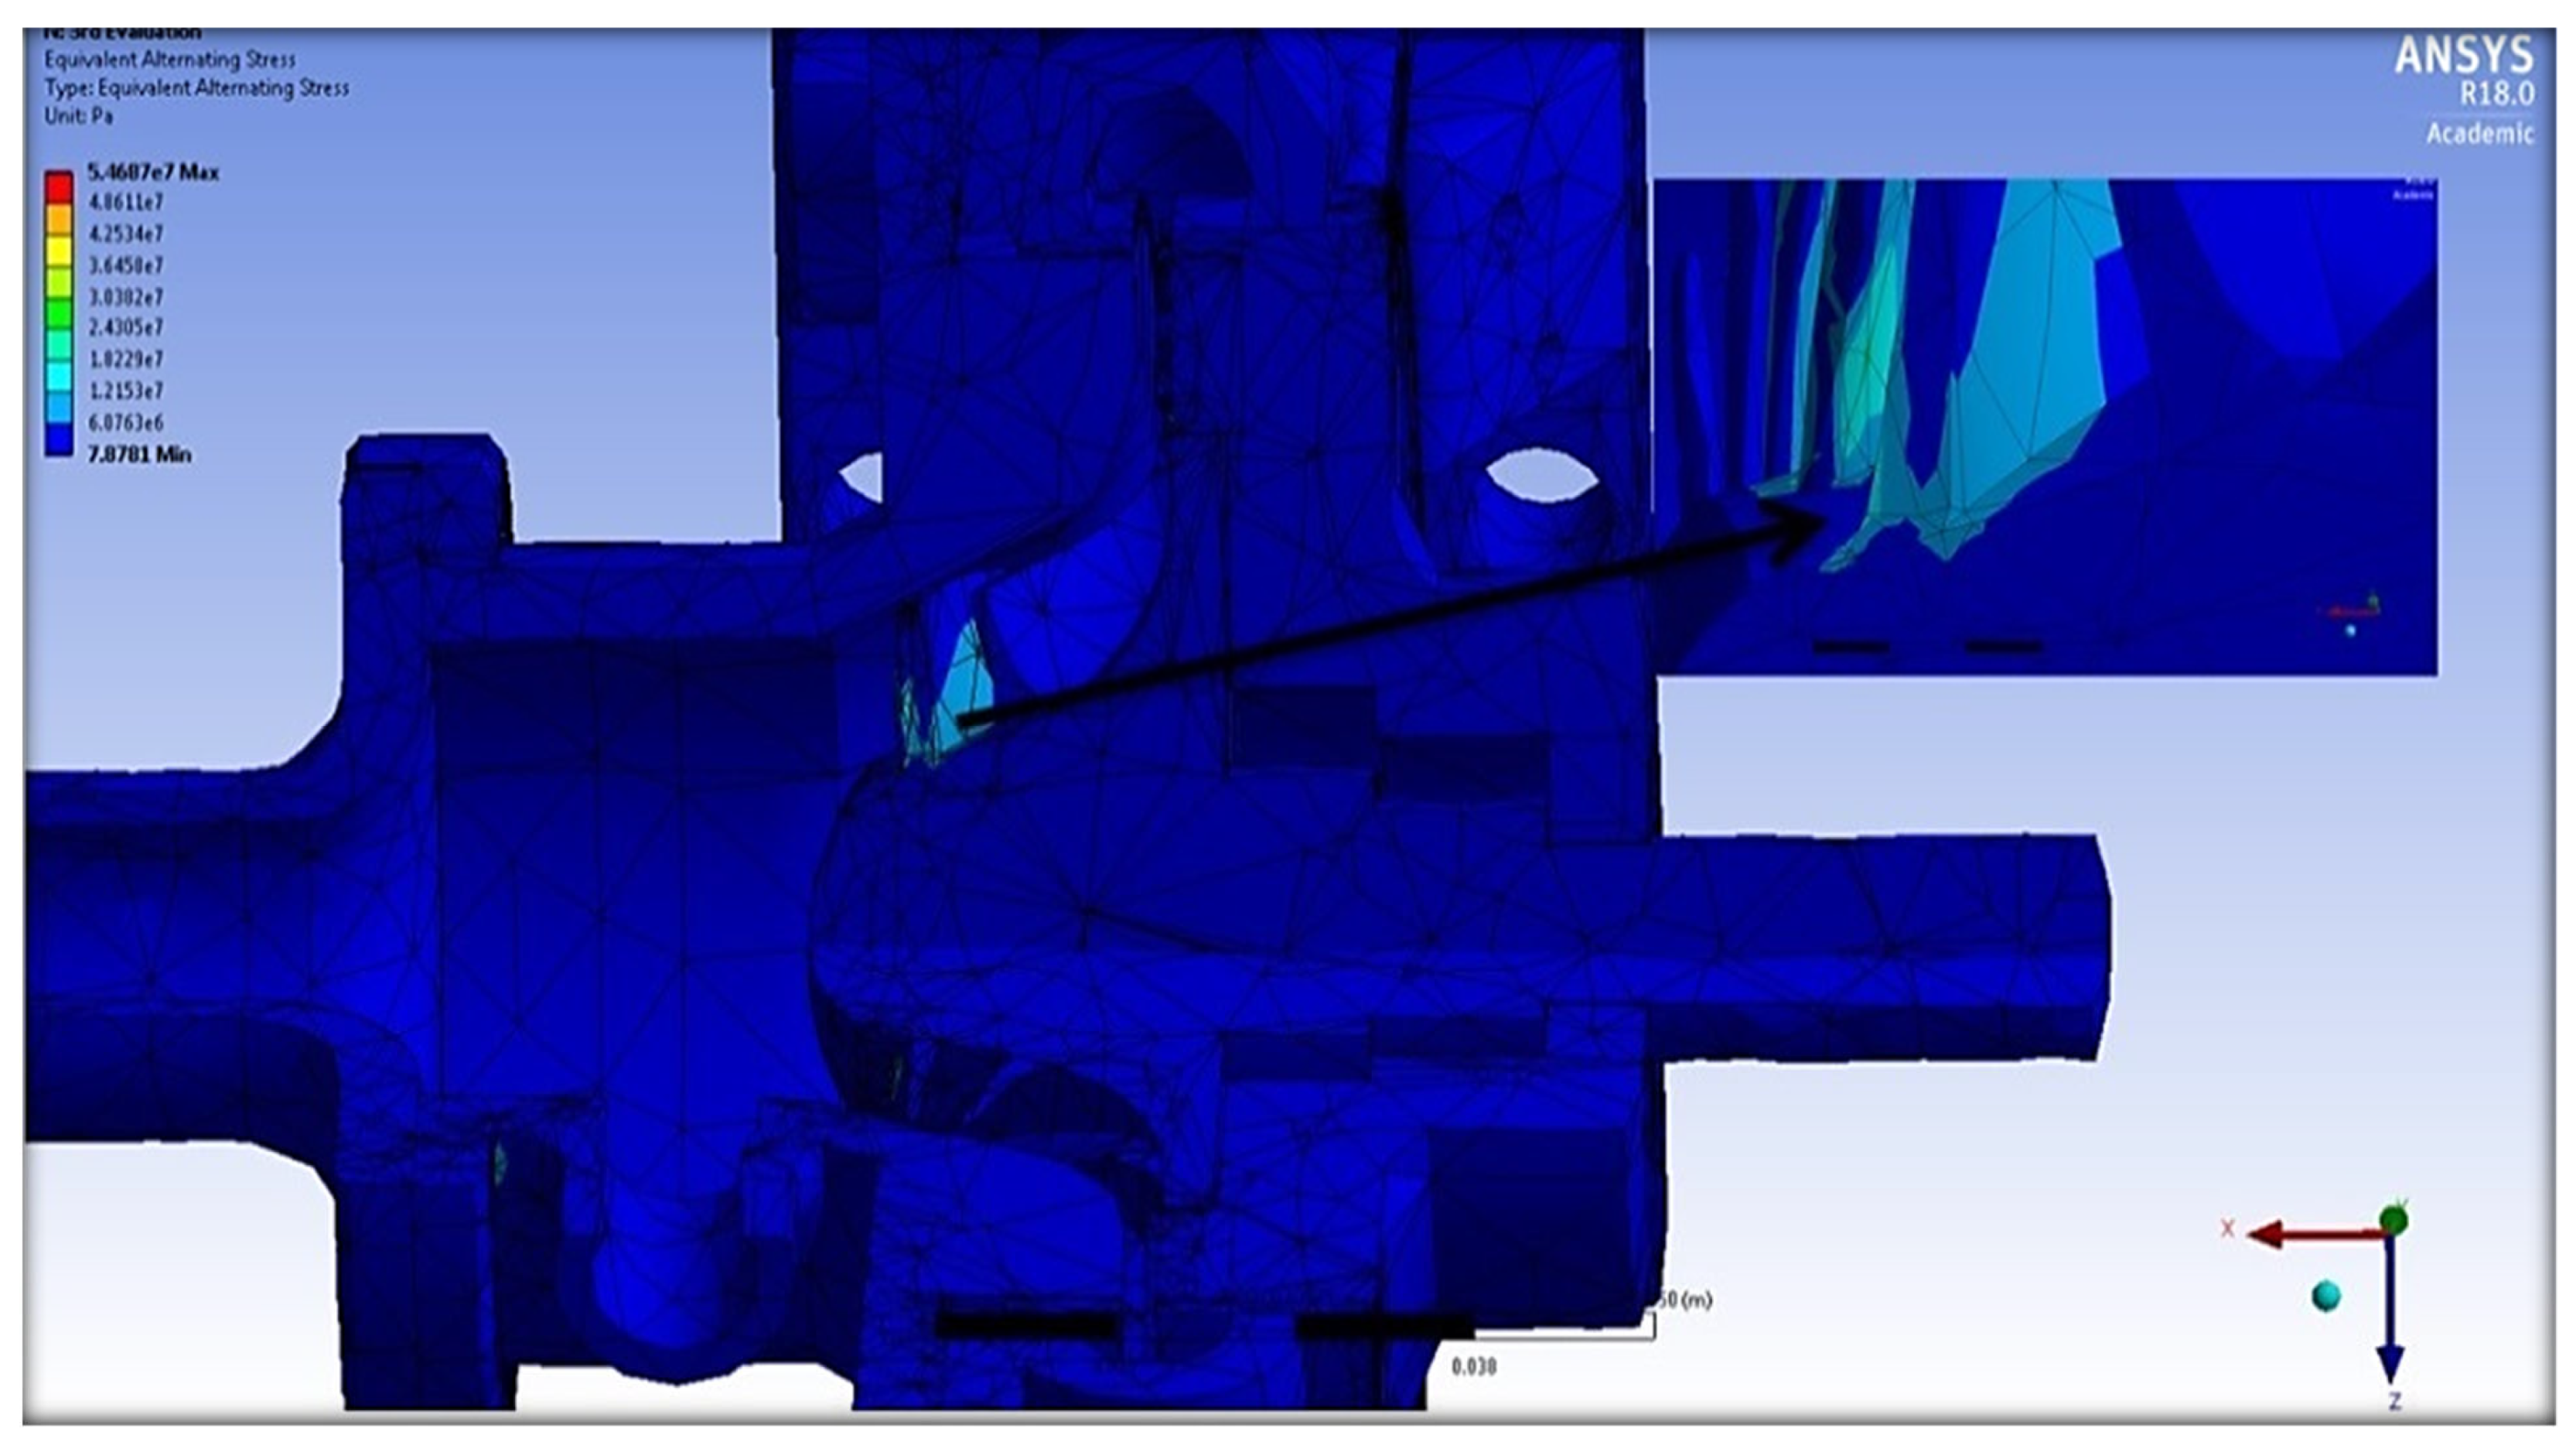
Figure 17 depicts the comprehensive fatigue assessments conducted on the rotating component of the SSRT, considering the two most extreme input compressed air temperature values of 25 °C and 65 °C. The initial factor assessed pertained to the lifespan, which reveals the notable influence of thermal occurrences on the overall efficacy of the rotor. The design lifespan, initially estimated at approximately 115,000 cycles at a temperature of 25 °C, diminishes to only about one-third of its previous value when subjected to a temperature of 65 °C. In this mode of analysis, the assessment of life at a given moment is conducted under the condition of constant amplitude. The evaluation is based on whether the minimum alternating stress, as indicated by the S–N curve, exceeds the corresponding alternating stress. In this study, the investigation also involved the calculation of fatigue damage to the rotor over its operational lifespan. The findings of this analysis confirm that the blade–hub connection area is the most vulnerable section of the rotor, irrespective of temperature conditions. The highest level of damage observed at the temperature of 25 °C was approximately 56,908 while, at a temperature of 65 °C, it reached approximately 7,350,000. This indicates that the observed damage can be attributed solely to the 40 °C difference in the temperature of the working fluid. In relation to the biaxiality factor, which can be defined as the ratio between the highest principal stress and the lowest principal stress, with the exclusion of the main stress when it is close to zero, the maximum biaxiality was observed to be 0.95 at a temperature of 25 °C and 0.99 at a temperature of 65 °C. Furthermore, the pertinent contour plot indicates that the highest degree of biaxiality was concentrated at the point of intersection between the X and Z axes, as observed at both tested temperatures (25 °C and 65 °C). The compressed air flow is perceived as entering the SSRT through the radial X axis and exiting through the axial Z axis, as depicted in the corresponding figure. The investigation of fatigue also considered the comparable alternating stress, which is demonstrated in the fourth figure, as another important aspect. This factor can be utilized for the identification of the type of fatigue S–N curve. In the context of fatigue analysis, the evaluation of fatigue loading type, mean stress effects and multiaxial effects is a crucial undertaking. Hence, the alternating stress that is equivalent can be considered as the ultimate value computed prior to the computation of fatigue life. The main advantage of this component is its ability to incorporate all fatigue-related calculations regardless of the specific characteristics of the fatigue material. This sets it apart from tensile strength, which is influenced by material properties and relies on other mean stress theories. The maximum values of this component have been observed to reach approximately 54.7 MPa and 57.9 MPa at the two tested temperatures of compressed air, specifically 25 °C and 65 °C, respectively. Finally, the fatigue safety factor, which differs to some extent from the factor estimated under static load conditions due to the dynamic nature of load variation over time, exhibits certain distinctions from the factor calculated under static load conditions. Hence, this particular element is associated with the occurrence of fatigue failure within a designated design lifespan. At a temperature of 25 °C, the minimum value observed was approximately 3.9, which subsequently decreased to below 0.1 as the compressed air progressed to a temperature of 65 °C. However, it is noteworthy that the safety factor of the rotor’s other areas exhibited significant variation, ranging from 55 at 65 °C to 3 at 25 °C. In contrast, the highest safety factor was approximately twice as high as that of the majority of these areas.
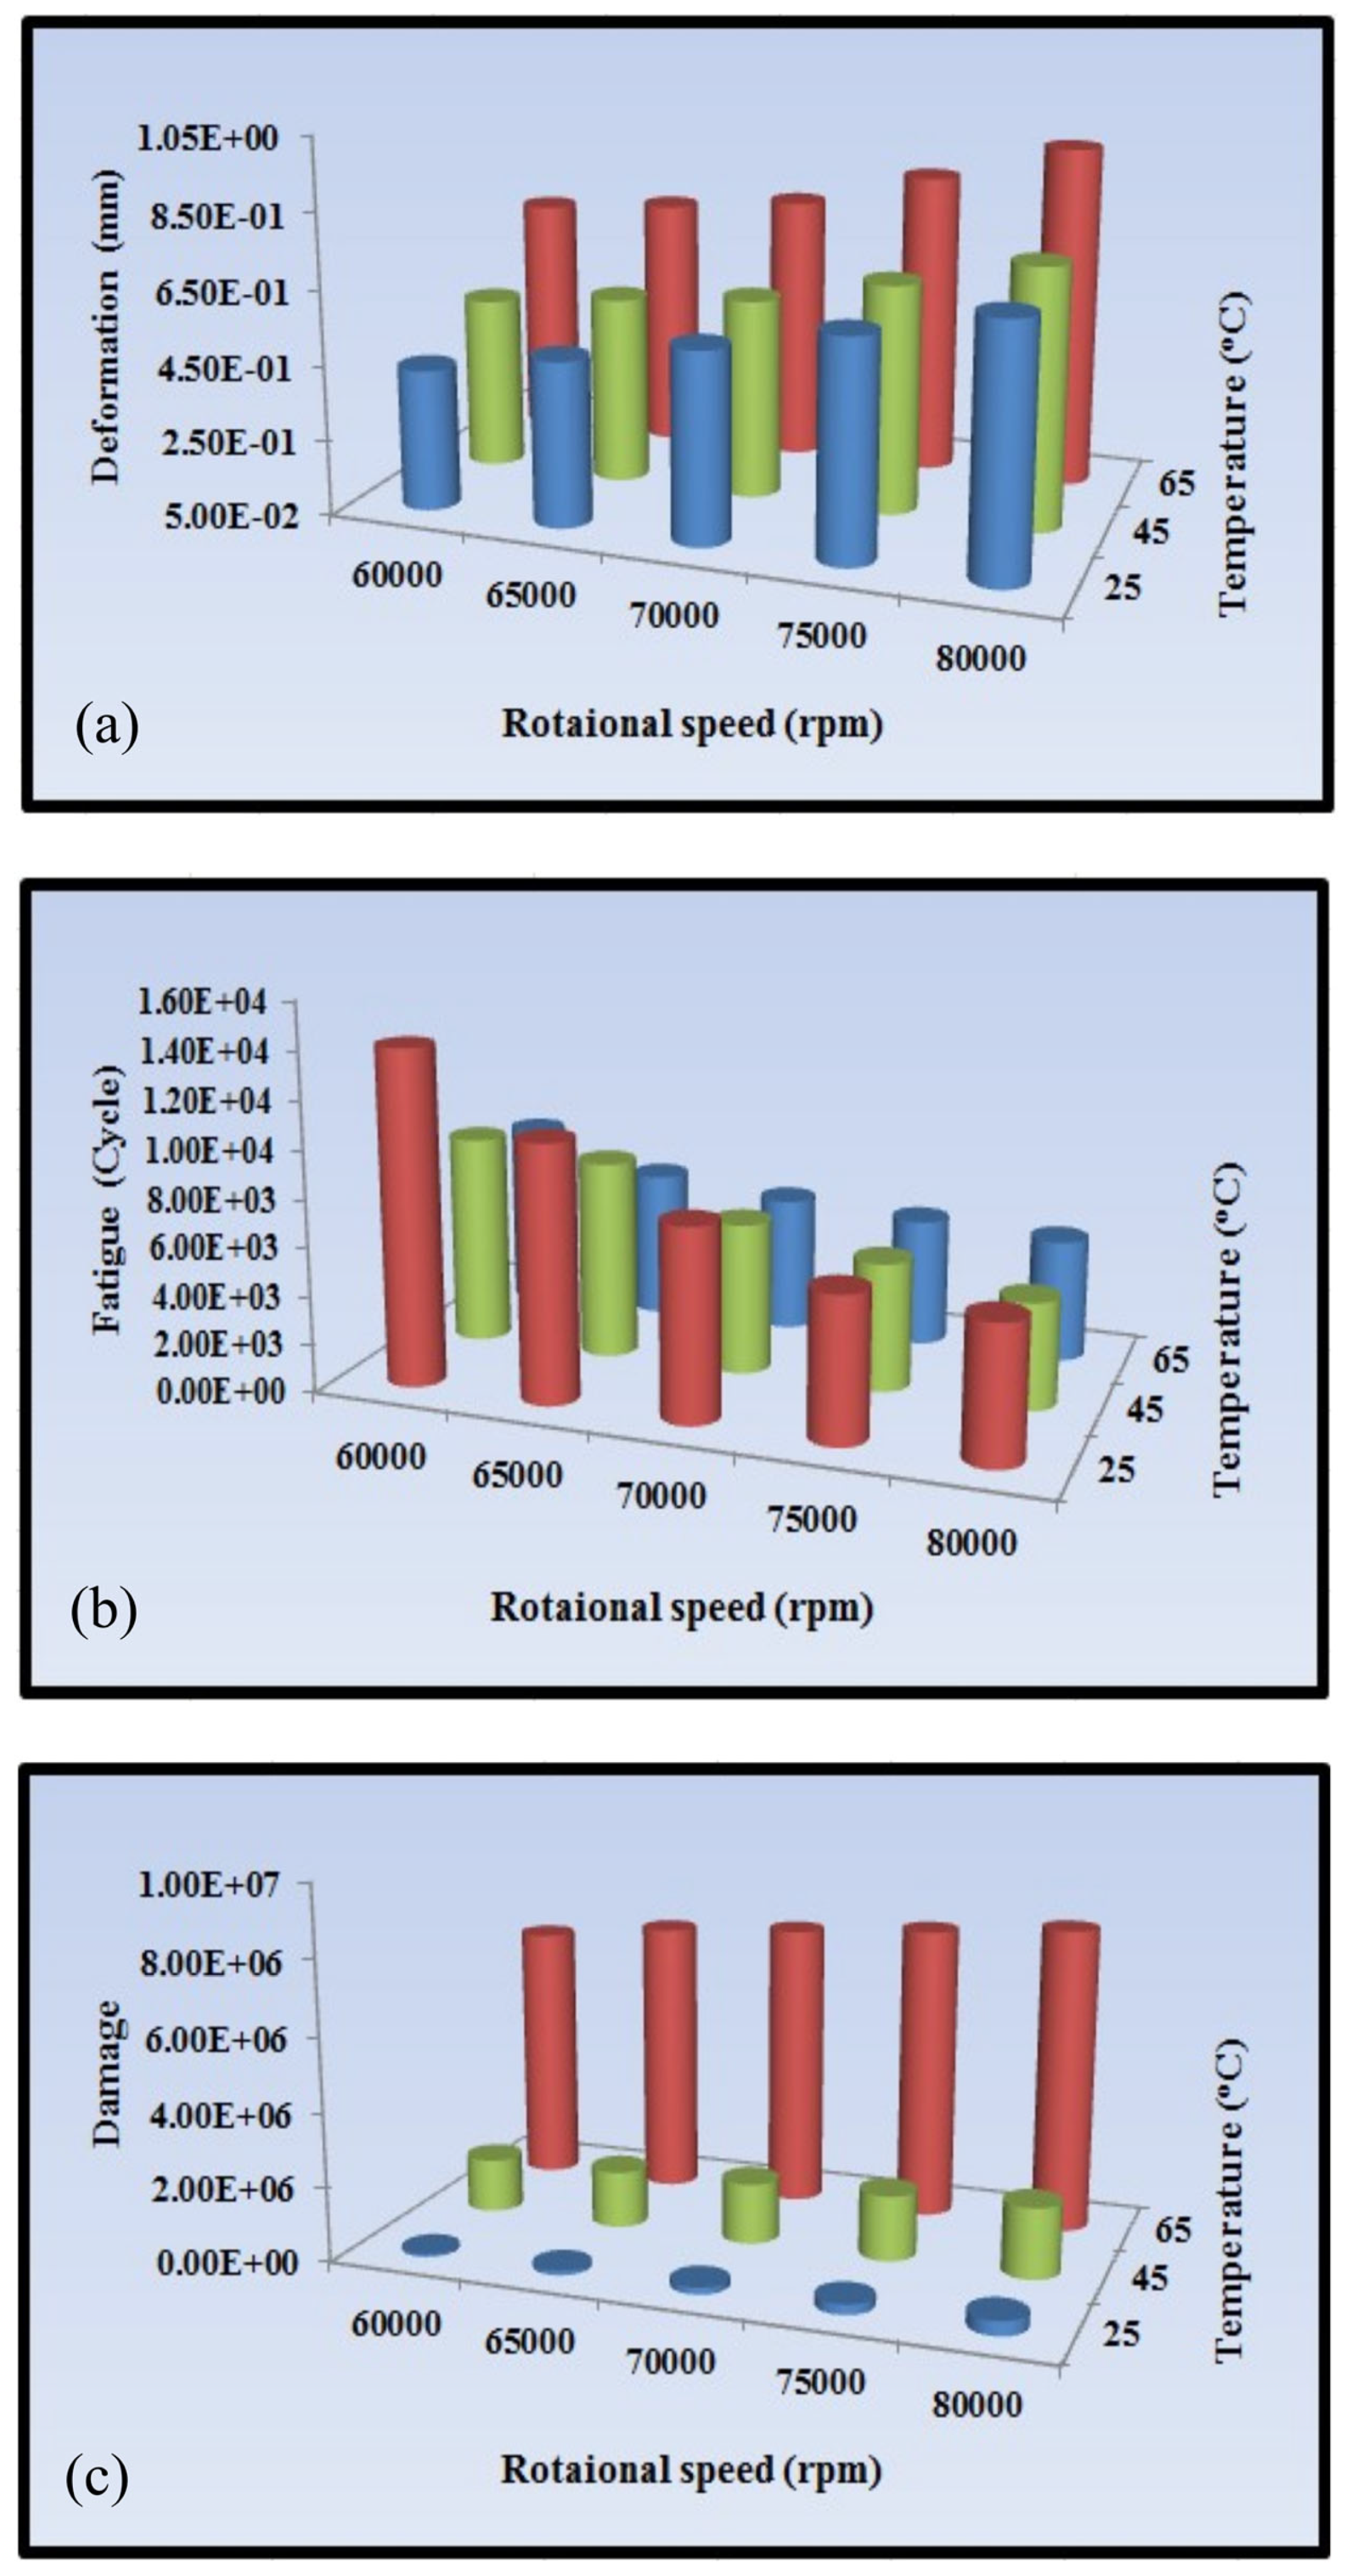
Figure 18a illustrates the maximum deformation observed at the blade tip in response to an augmentation in the rotational velocity of the rotor. The aforementioned element demonstrated a notable response to the escalation in rotor velocity. At a rotational speed of 60,000 rpm, the most significant deformations were observed at approximately 0.401, 0.592 and 0.874 mm for fluid temperatures of 25, 45 and 65 °C, respectively. The recorded values for the measurements were approximately 0.52 mm, 0.63 mm and 0.87 mm when the rotational speed was set at 80,000 rpm. The relatively small displacement values observed can be attributed to the turbine’s small dimensions. In analysing the impact of fluid temperature on rotor displacement, it becomes apparent that this particular factor had a negligible influence. This phenomenon could potentially be attributed to the material’s capacity to maintain stable temperatures within the specified range. The fourth parameter examined in this research pertains to the fatigue experienced in the rotating component of the analysed SSRT. The relationship between the rotational speed of the rotor and the three input air temperatures is depicted in Figure 18B. The presented graph illustrates the correlation between rotational speed, temperature and the expected fatigue life of the rotor. As an illustration, when the rotor rotational speed reached 60,000 rpm, the number of cycles within the endurance limit was approximately 140,000, 88,000 and 71,000 at compressed air temperatures of 25, 45 and 65 °C, respectively. At a rotational speed of 80,000 rpm, the corresponding values at temperatures of 25, 45 and 65 °C were recorded as 97,000, 57,000, and 50,000 cycles, respectively. It is imperative to acknowledge that the statistics provided herein represent the minimum quantity of cycles, and that the location potentially susceptible to fatigue life is depicted in the preceding images. The fatigue life values observed at a rotational speed of 70,000 rpm were found to be approximately equidistant from the values observed at the other two temperatures. The values for compressed inlet temperatures of 25, 45 and 65 °C are approximately 109,000, 71,000 and 59,000, respectively. Figure 18C illustrates the comprehensive extent of damage observed in the rotor section of the investigated SSRT, with respect to variations in both the temperature of the working fluid and the rotational speed of the rotor. Significant damage was primarily observed when the temperature and rotating speed reached their highest levels. The phenomenon under consideration can be elucidated through an examination of the interplay between thermal and mechanical stresses and their impact on the structure of the rotor. The maximum damage values recorded at a rotational speed of 60,000 rpm were approximately 51,400, 841,000 and 7,140,000 for working fluid temperatures of 25, 45 and 65 °C, respectively. In contrast, during the highest examined rotational speed of 80,000 rpm, the corresponding damage values were approximately 260,000, 111,000 and 4,390,000 for working fluid temperatures of 25, 45 and 65 °C, respectively. Furthermore, when the rotor rotational speed reached 70,000 revolutions per minute, the observed damage values were approximately 125,000, 952,000 and 4,100,000 for working fluid temperatures of 25, 45 and 65 °C, correspondingly.

5.3. Multidisciplinary Optimization Results

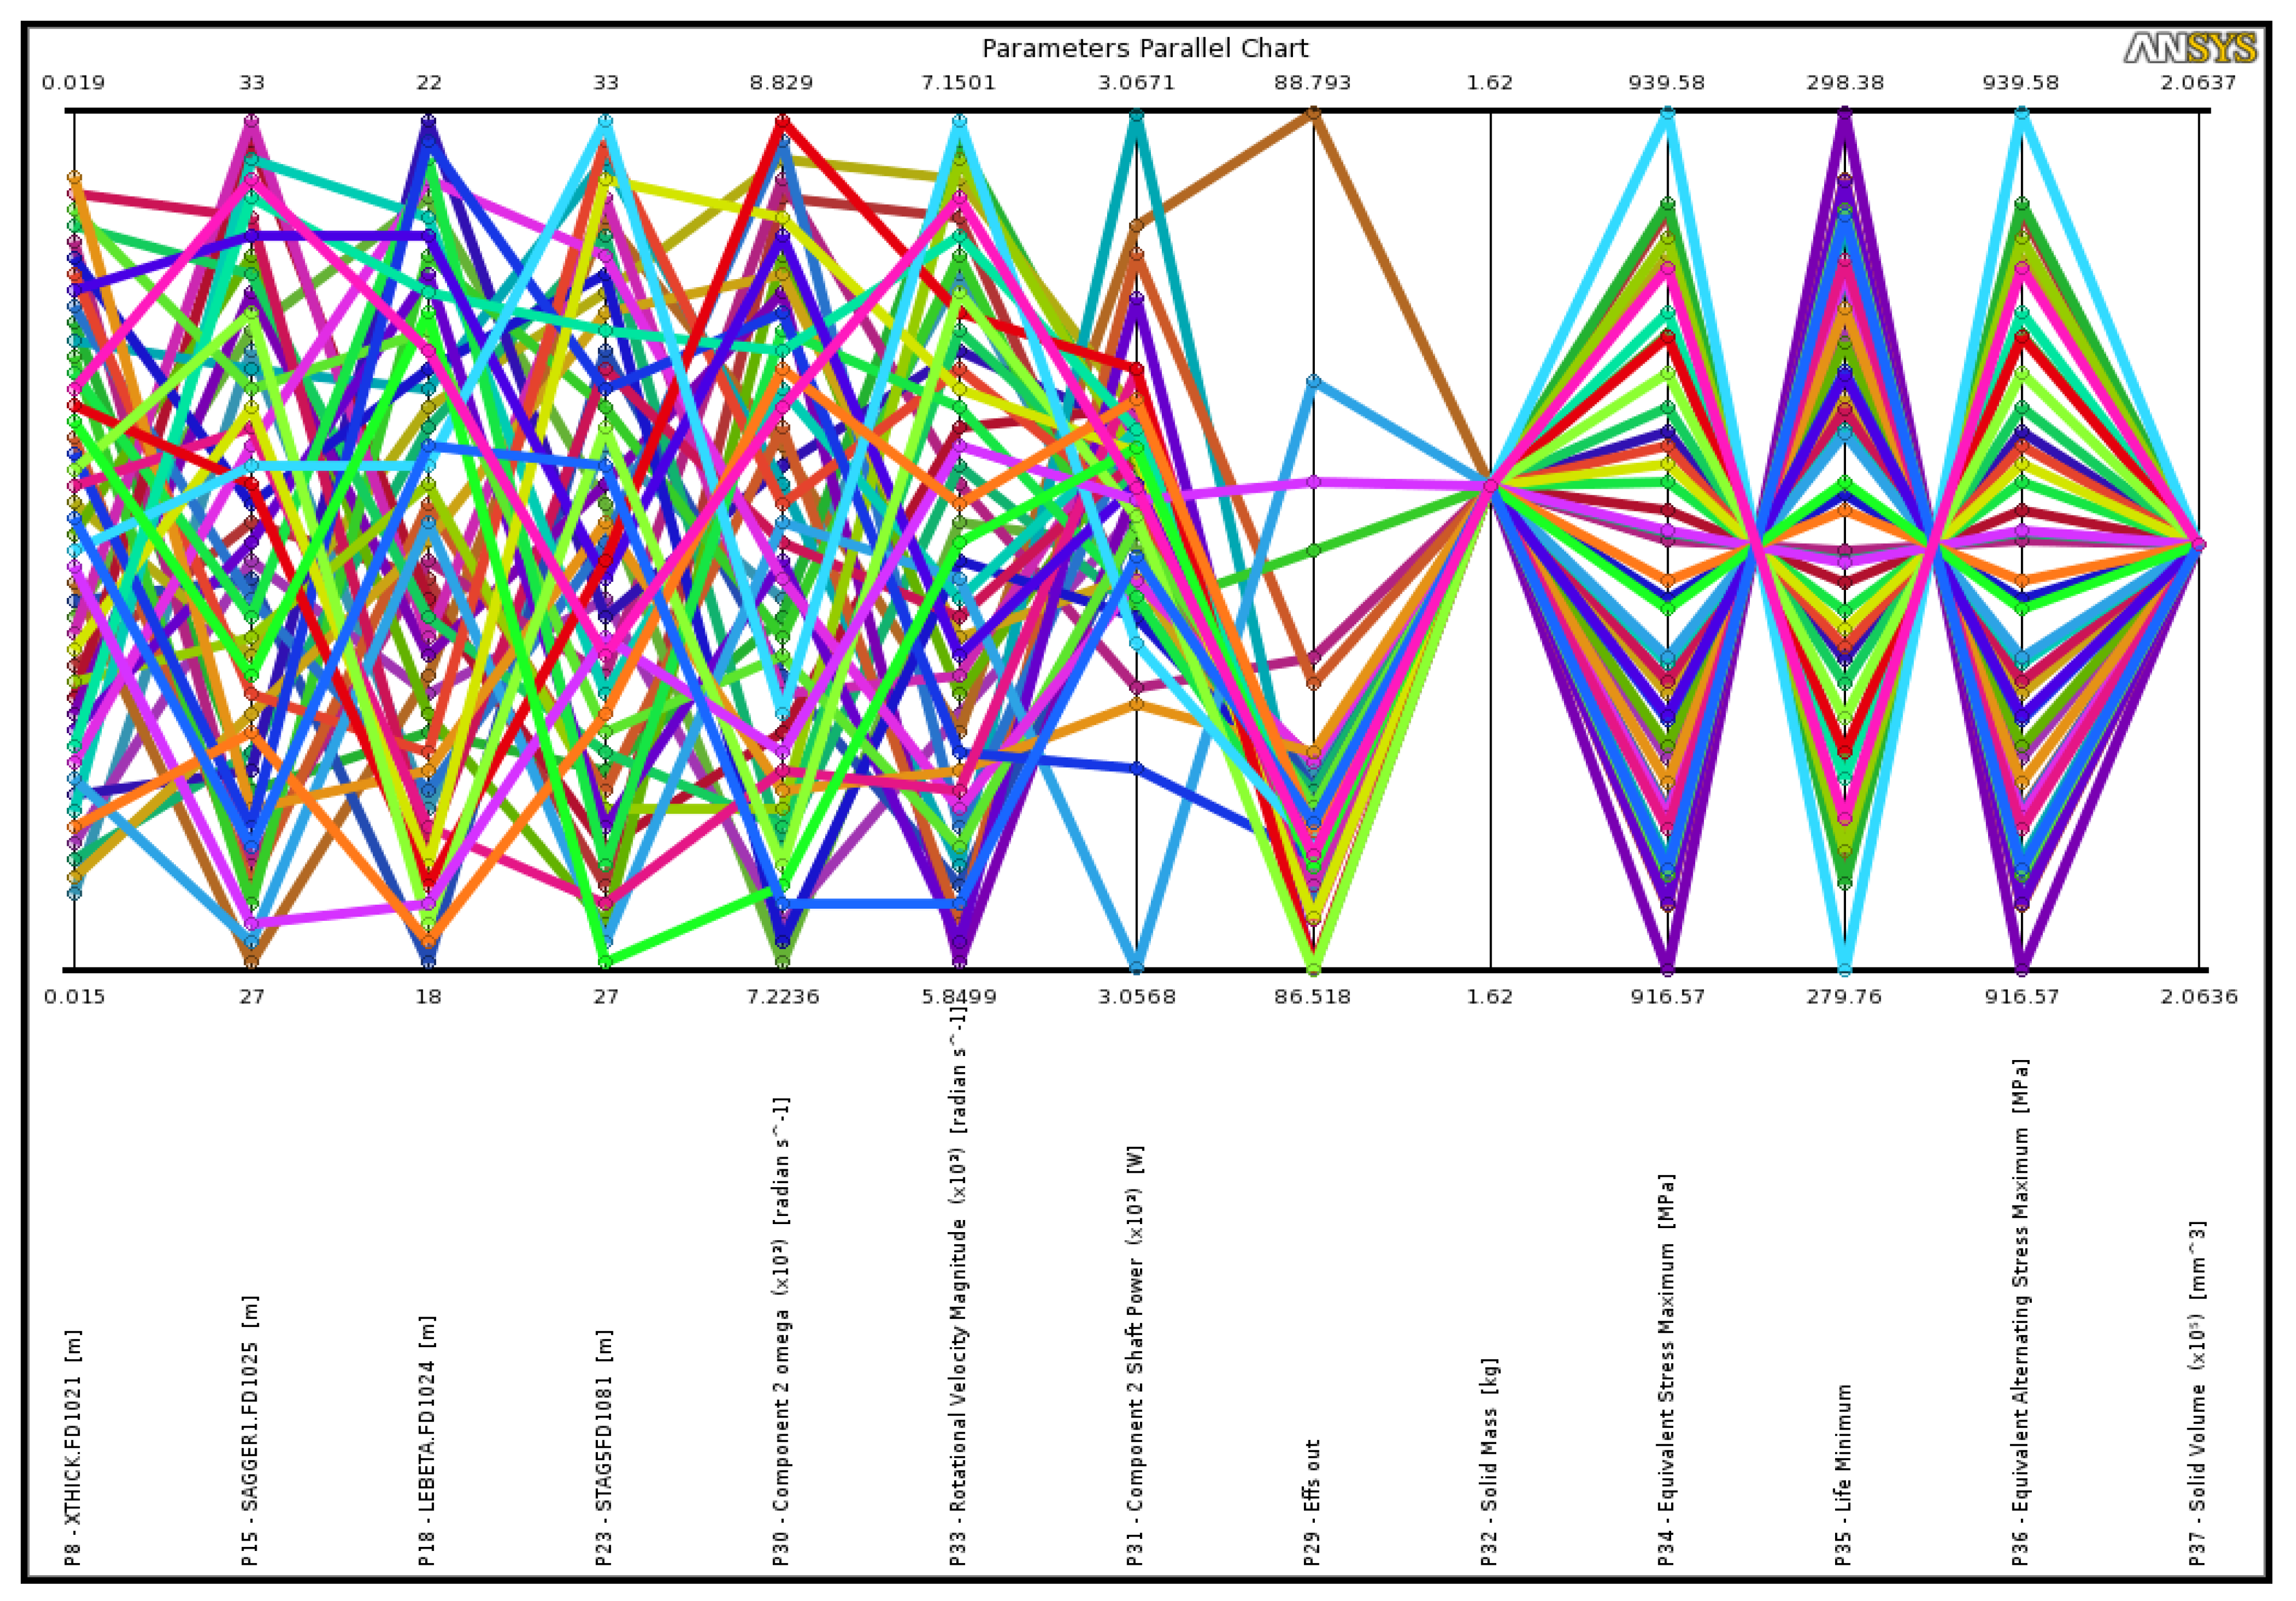
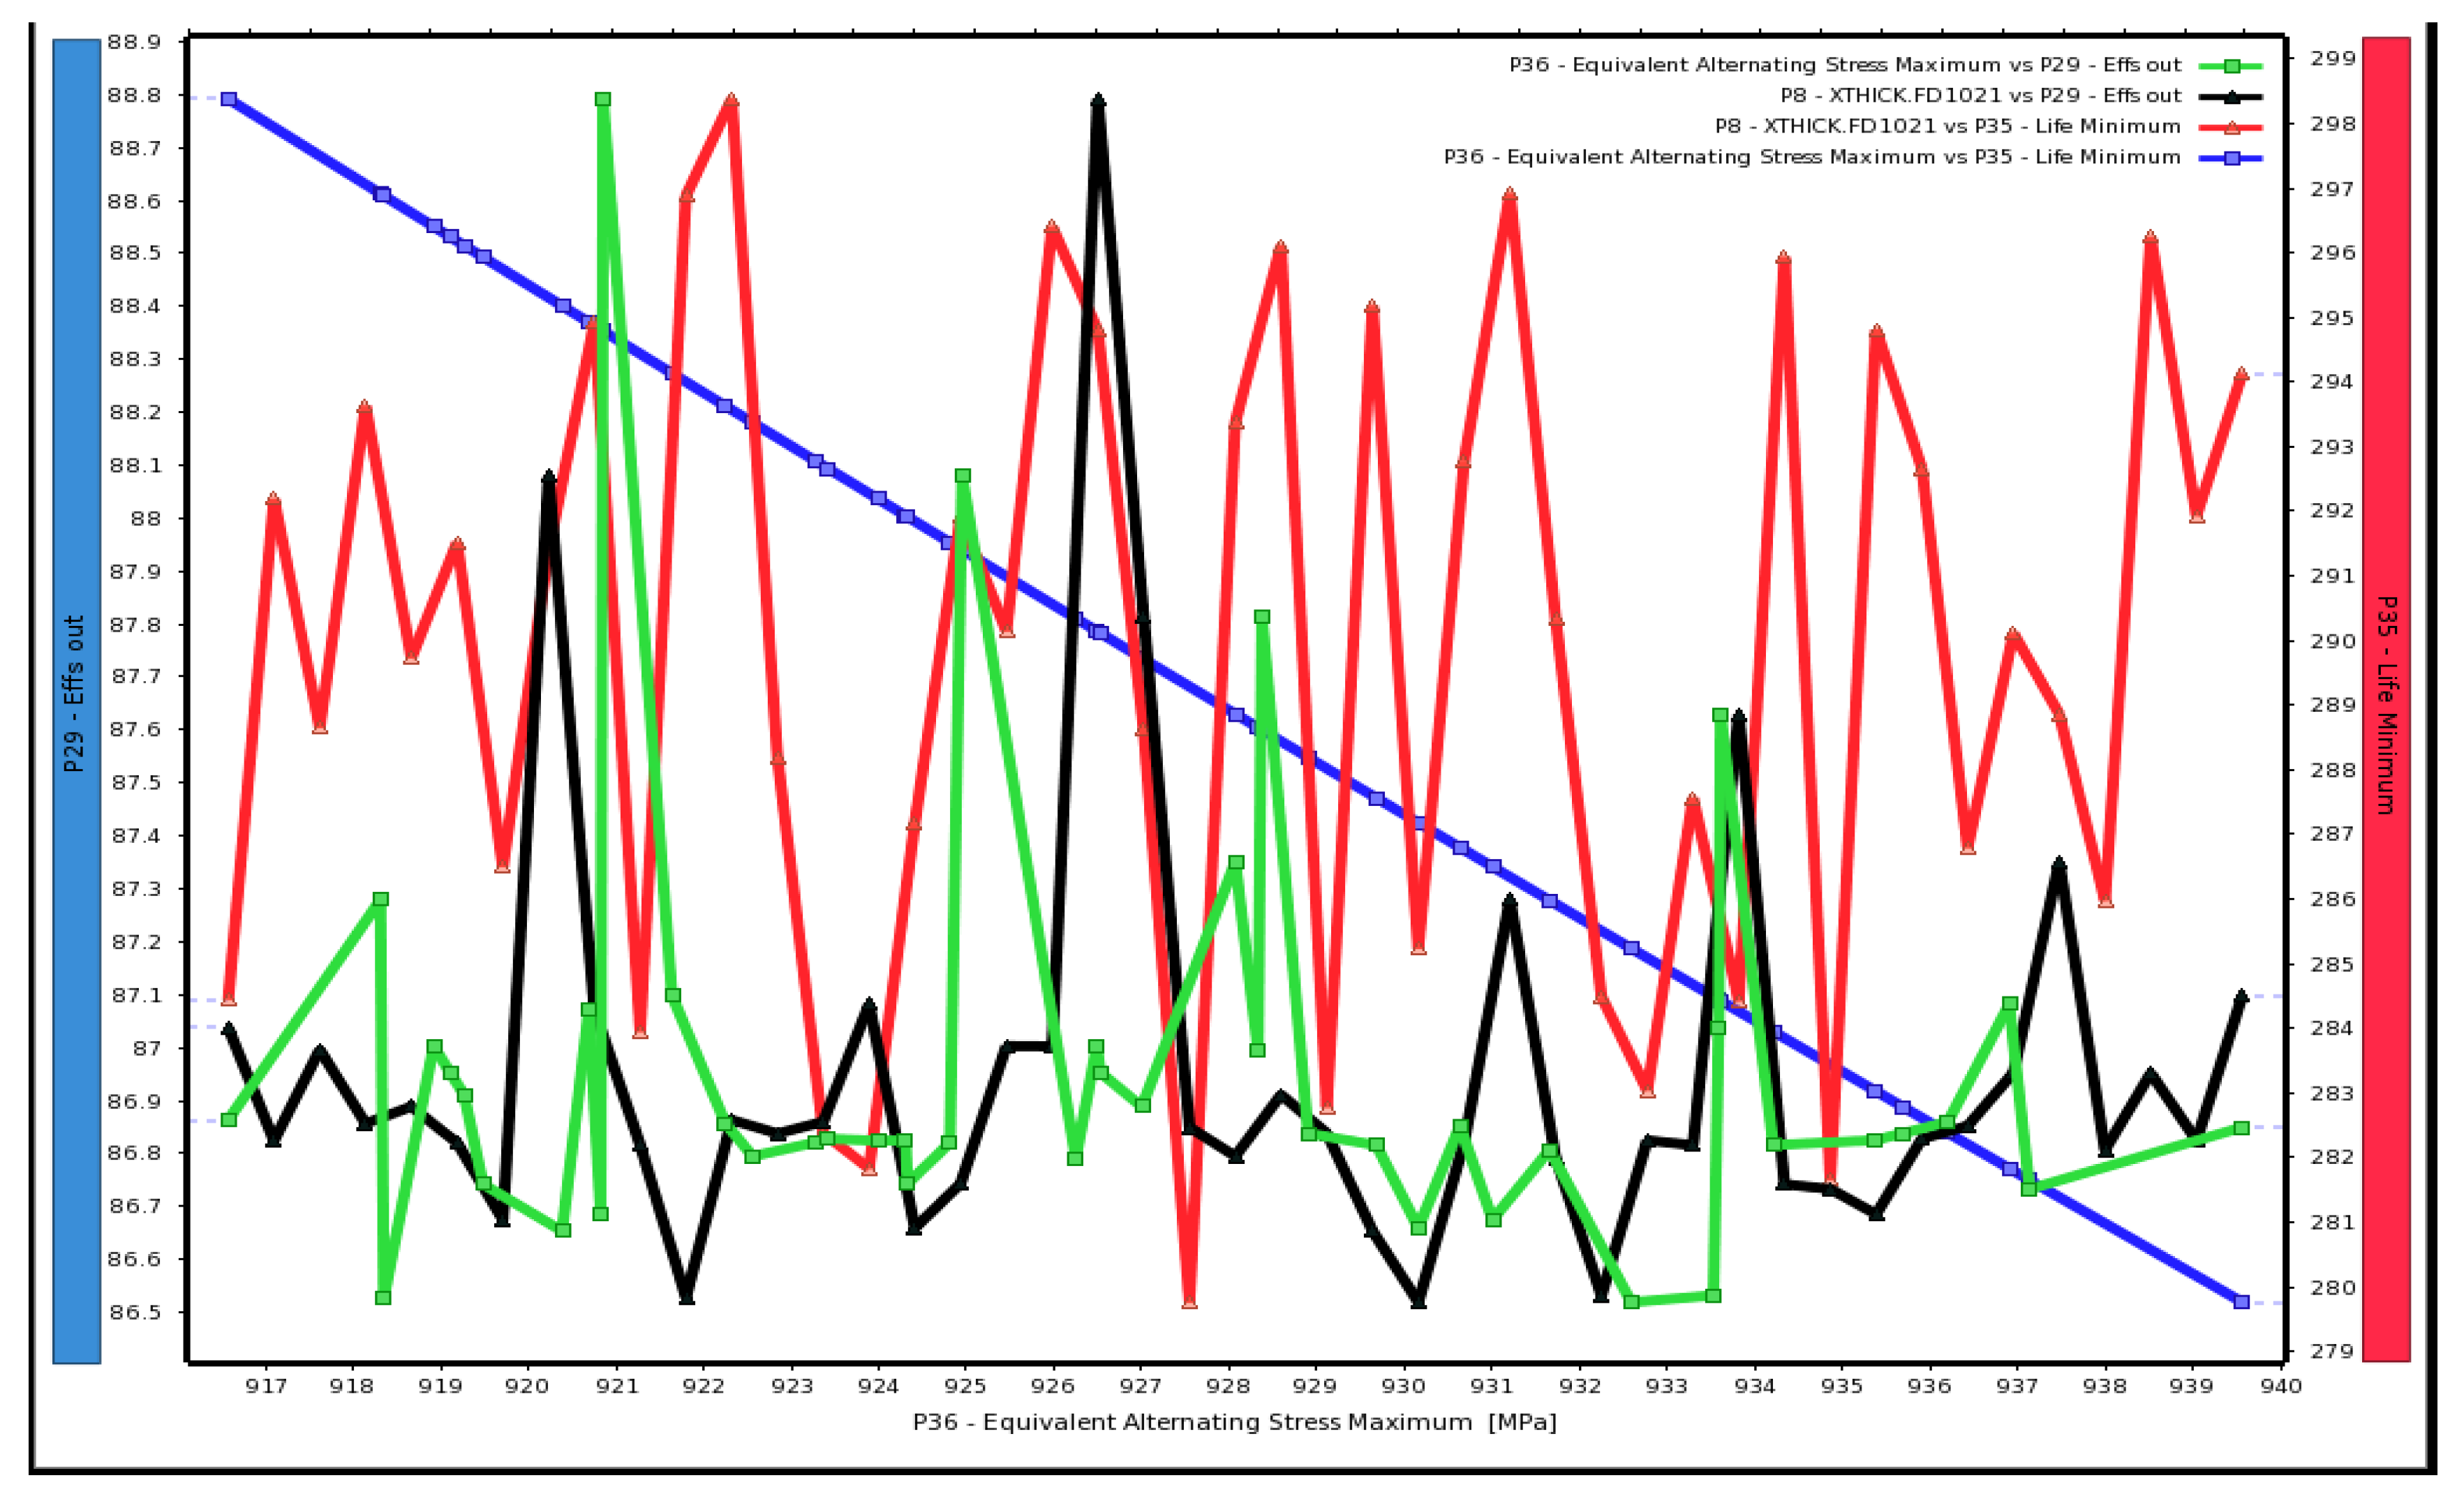
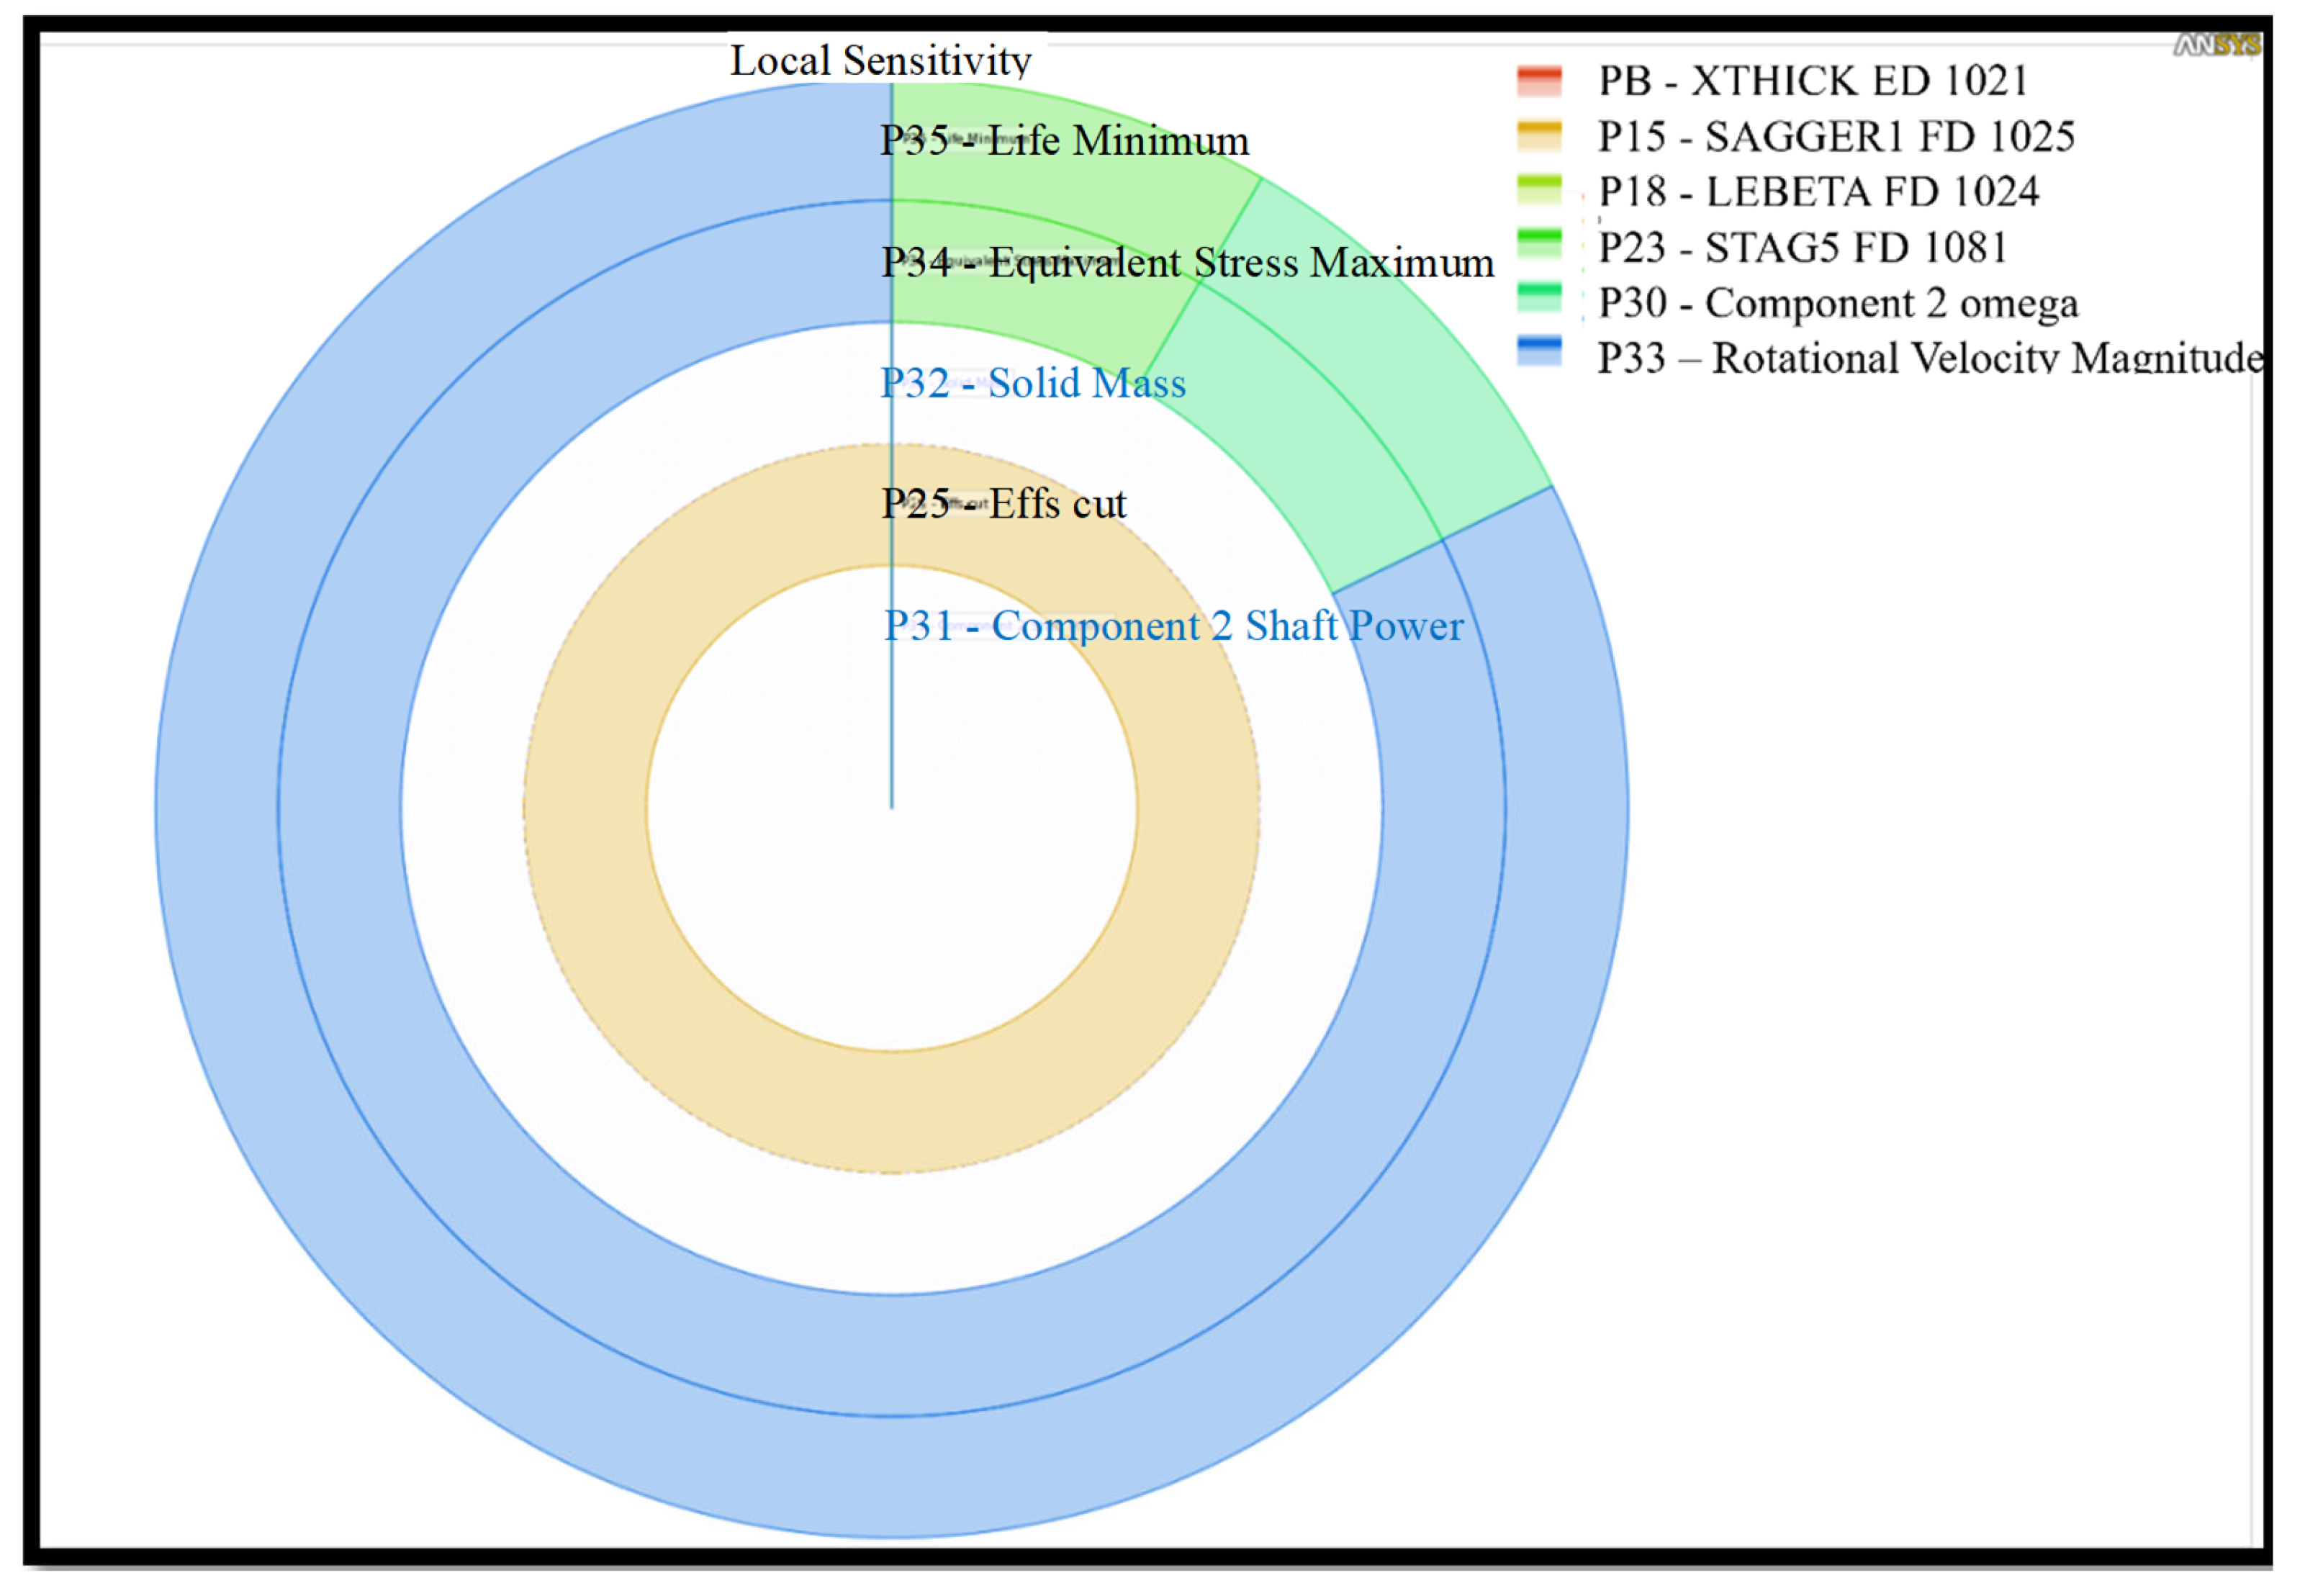
The final step in this work is to find the optimized turbine shape that is able to obtain the highest values of both the turbine efficiency and power output and, at the same time, able to withstand the stresses, deflections and fatigue. So, as previously mentioned, the most important parameters, which directly affected the above-mentioned analyses, were considered in order to structurally enhance the rotor performance and, at the same time, conserve its aerodynamic behaviour, as it achieved the best results in this regards. Figure 19 depicts the chart of parallel parameters for the SSRT using multidisciplinary optimization, while Figure 20 depicts the chart of design points with some of the selected parameters for the SSRT utilizing multidisciplinary optimization. Figure 21 illustrates the sensitivity of output parameters to each of the selected input factors in order to identify the most influential parameters. The graph illustrates that the rotational speed of the rotor is a significant determinant of the maximum equivalent stress and subsequent fatigue of the turbine rotor. The rotor stagger angle emerged as a noteworthy input parameter, exerting a substantial influence on both the efficiency of the turbine and the level of stress experienced by the rotor. In relation to aerodynamic performance, it can be observed that the thickness of the blade exerts a more significant influence on the stress value compared to other outlet factors.
The proposed correlation between the rotor rotational speed and the minimum life is presented in Figure 22. This shows the importance of having relatively low values of rotational speed in order to achieve the highest level of rotor life, as a result of having lower equivalent stress value. The linear correlation is imported as Y = −0.013072X + 374.84 and the R2 = 99.165%. However, the quadratic trend line is Y = −3.1132 × 10−6X2 + 0.027424X + 243.59 and the R2 = 99.773% when the Y and X are the minimum required life and the rotor rotational speed, respectively, where the proposed correlation is relatively high. The final step in this section is to find the rotor blade shape which has the lowest stress and deflection values and, at the same time, is able to withstand rotation for the longest time with as high a turbine efficiency and output power as possible, preserving the aerodynamic performance. The rotor exhibited a notable improvement in terms of the two most essential structural analysis criteria, the maximum equivalent stress and the fatigue life, with the first output parameter being lowered in order to achieve a greater number of cycles. Nonetheless, the consequence was a drop in total turbine efficiency of around 2%.
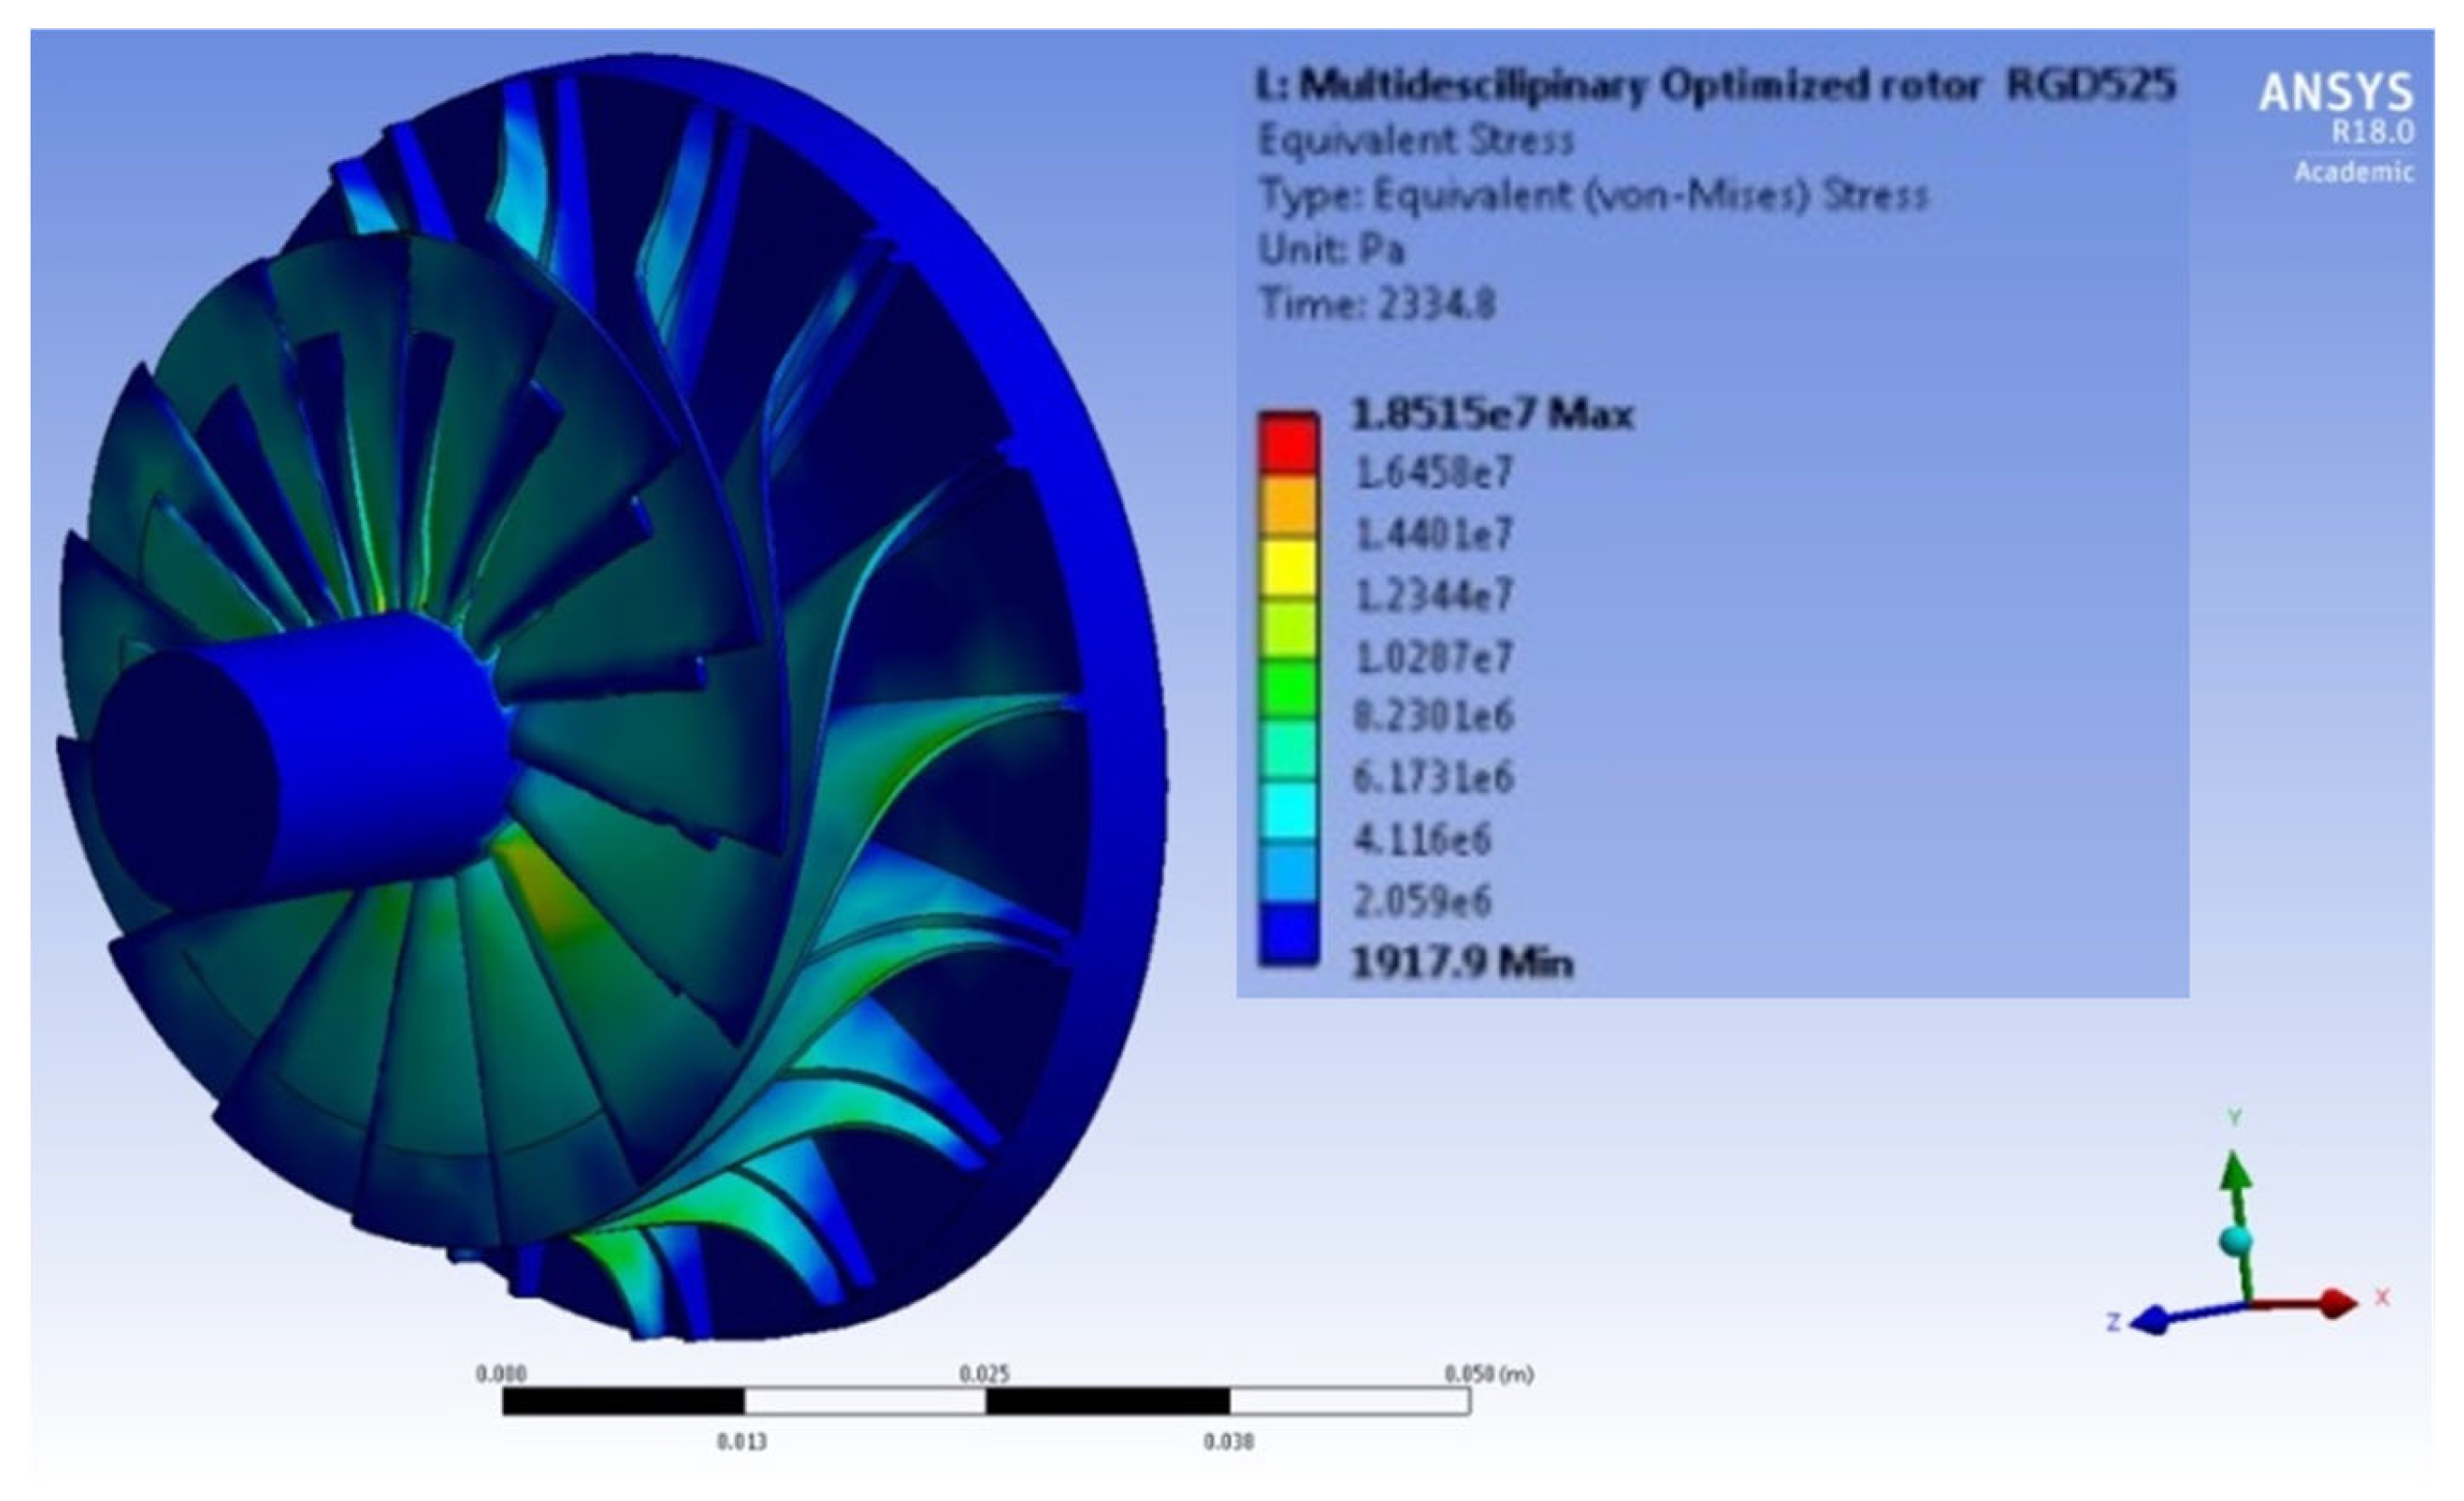
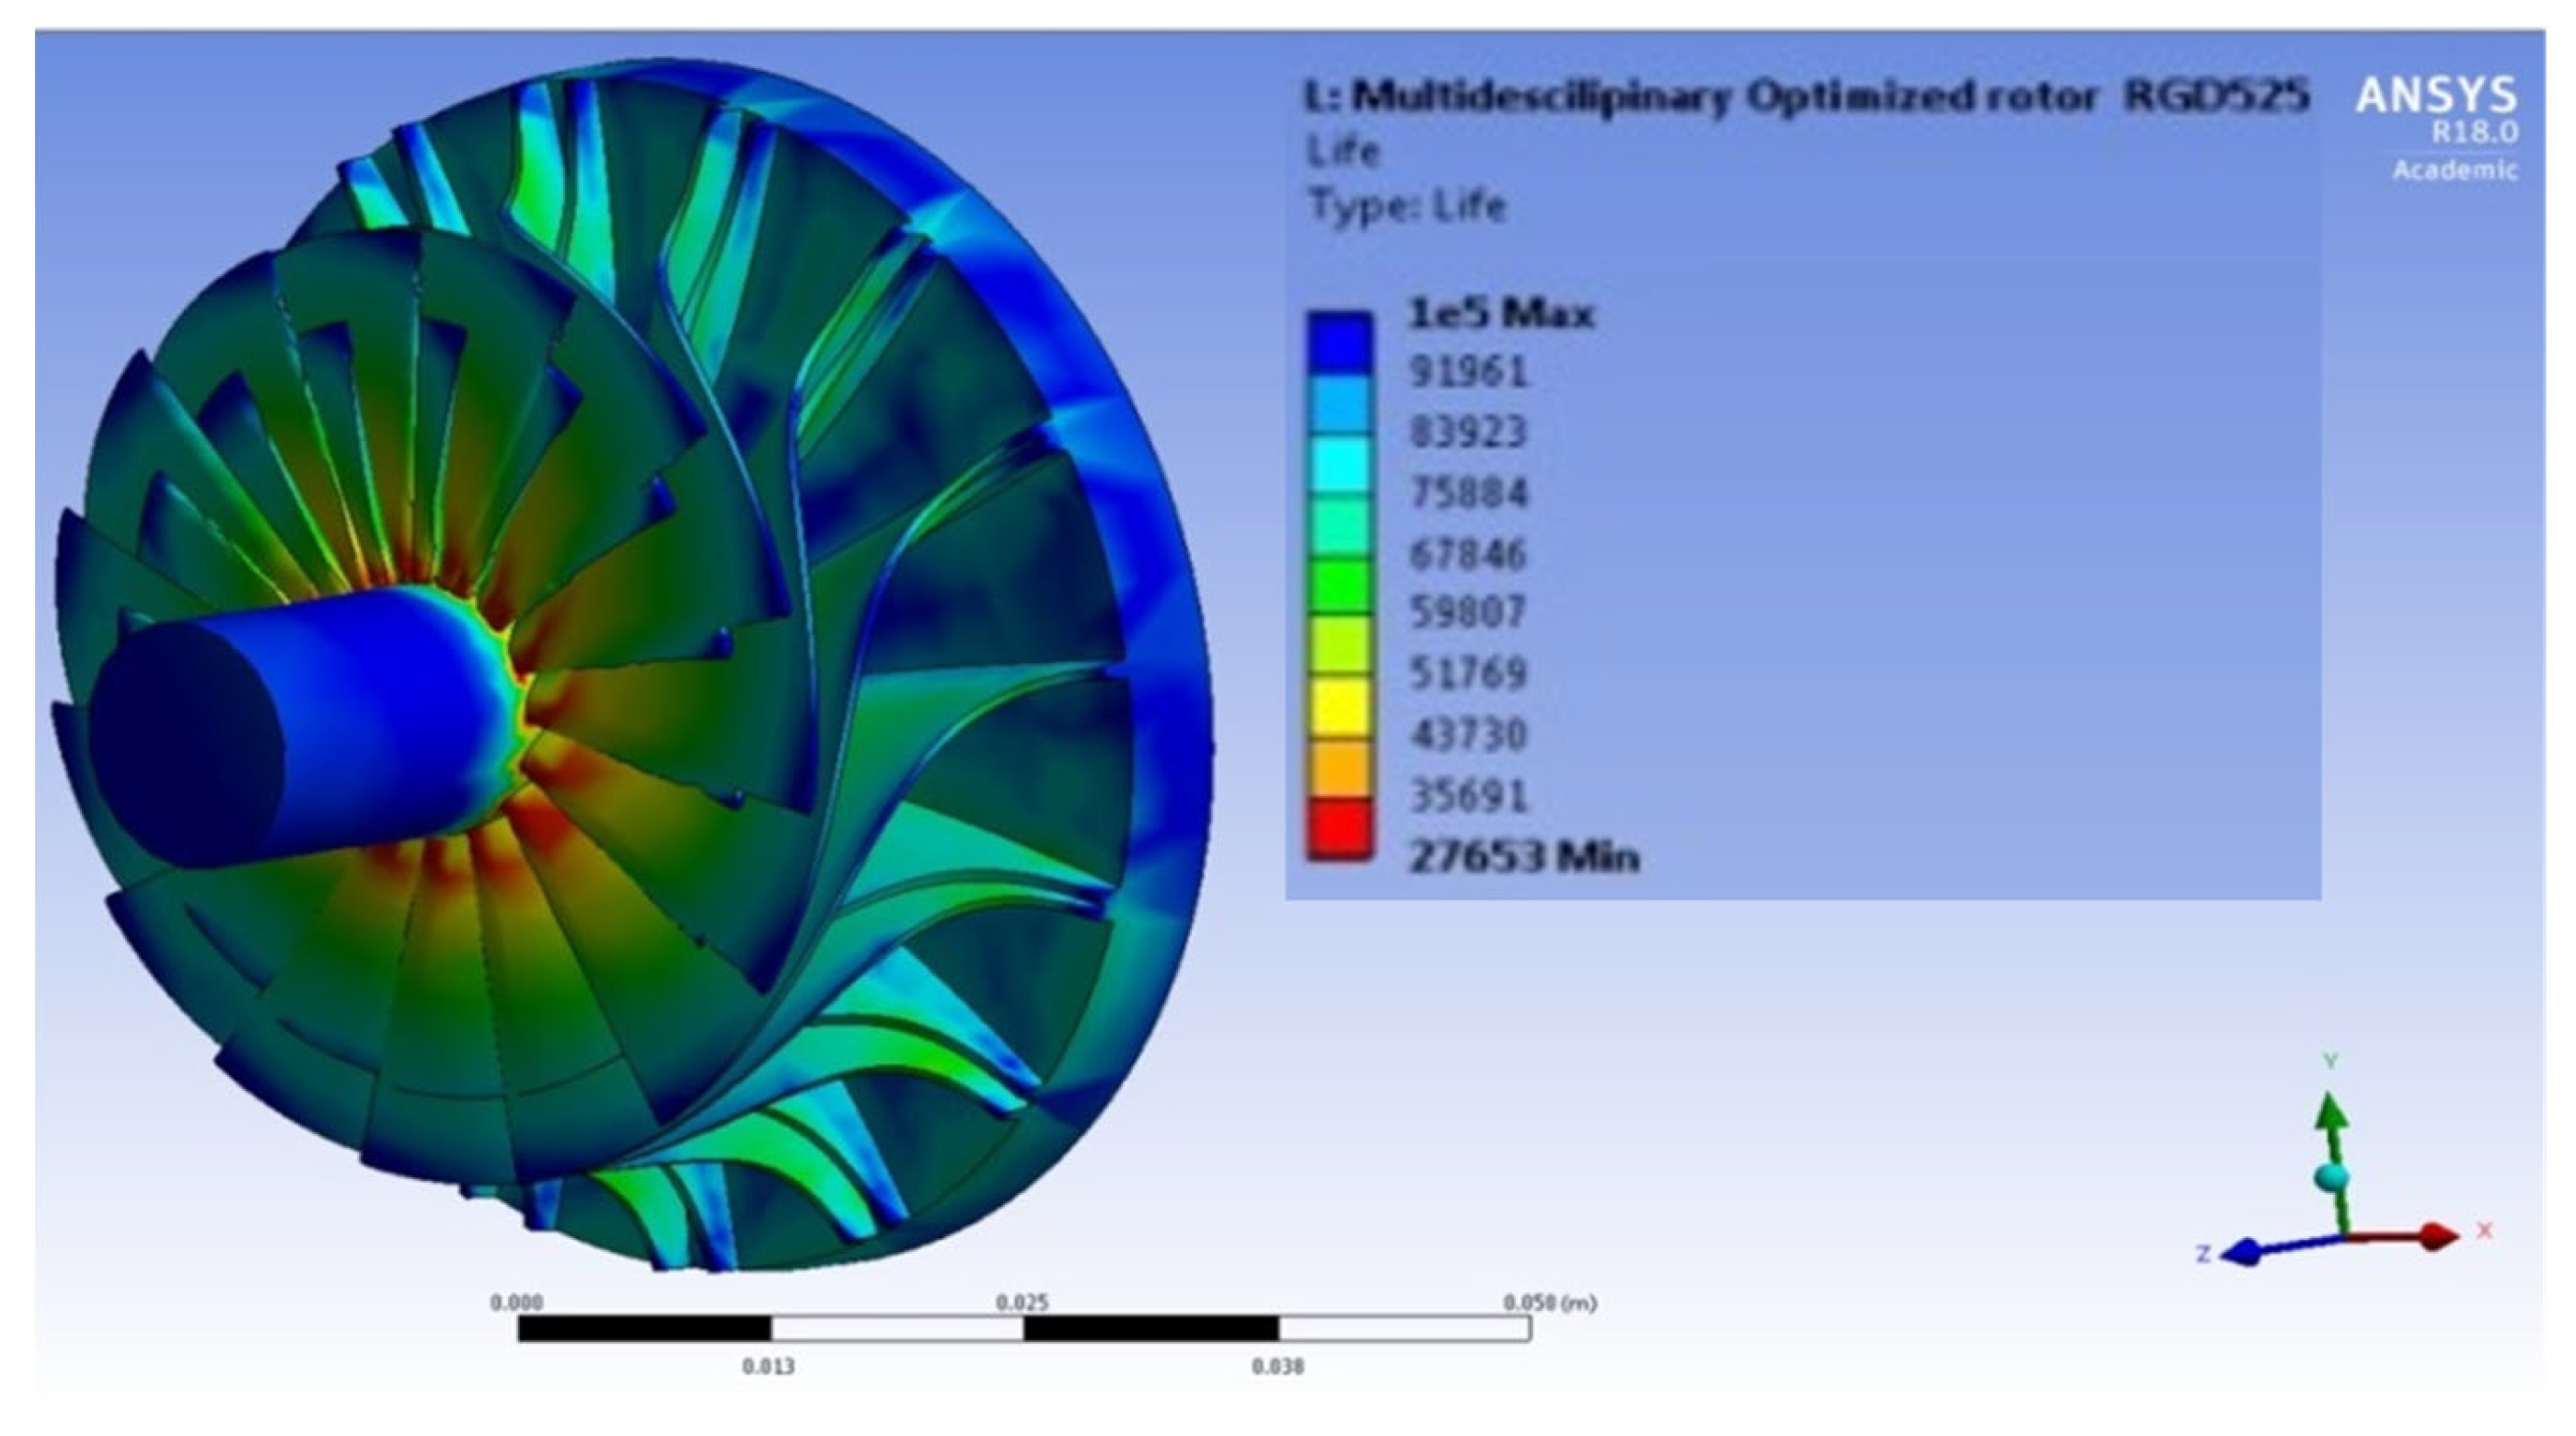
Figure 23, Figure 24 and Figure 25 show the values and distributions of equivalent stress, fatigue life and displacement, respectively, for interdisciplinary optimization. Figure 26 details the trade-off between the maximum equivalent stress, the fatigue life, the efficiency and the output power for the SSRT.

6. Conclusions

The present study extensively examines the impact of several significant boundary conditions, namely the inlet temperature of the compressed air, the rotational speed of the turbine’s rotor and the working pressure ratio, on the performance of the Small-Scale Radial Turbine. This investigation was conducted using 3D analysis and focused on its application in small-scale solar-powered Brayton cycle systems. The analysis builds upon prior research conducted by the authors in order to improve the aerodynamics of the turbine under study. The most significant consequences of this research can be summarized as follows:
  • It was observed that the rotating speed of the rotor has a considerable influence on the amount of stress and displacement, with a maximum increase of 69% in stress and 59% in deformation seen at the highest examined rotational speed of 65 °C.
  • The temperature of the fluid must also be carefully examined as a significant component. It was shown that reducing the temperature of compressed air to 25 °C reduced the aforementioned increases to about 27% and 7%, respectively.
  • In terms of stress region, the stress concentration was mostly in the region between the hub and the blades; thus, this area must be strengthened to survive high stress intensity in this position.
  • The region of the tip shroud in the rotor had greater deflection values at 21% of the blade tip width. Consequently, this distance between the blade tip and the shroud, as well as in between the blades, should be sufficient to accommodate the deflection.
  • According to the fatigue study, the increased input temperature of the fluid and compressed air resulted in an 84% decrease in rotor fatigue life, particularly at higher rotational speeds. The region where the rotor’s blades link to the hub had the lowest fatigue life. This location sustained the most damage among the other rotor bodies.
  • A structural analysis needs to be carefully and simultaneously considered during aerodynamic analysis in order to sustain what has been achieved in terms of aerodynamic analysis. Consequently, multi-objective optimization should also include some structural parameters and some of the objective function is needed in order to cover the stresses in other structural analyses.

Author Contributions

Conceptualization, H.H.; Methodology, A.M.D.; Software, A.M.D.; Validation, A.M.D. and M.A.B.; Investigation, A.M.D. and A.A.H.; Resources, S.S.; Data curation, A.K.; Writing—original draft, A.M.D.; Writing—review & editing, A.A.H.; Visualization, T.B.; Supervision, S.M. and R.A.-D. All authors have read and agreed to the published version of the manuscript.

Funding

This research received no external funding.

Data Availability Statement

Data is unavailable for public access.

Acknowledgments

The authors thank the Higher Committee of Developing Education in Iraq HCED for funding the work. They also thank the University of Mosul, the University of Birmingham and Teesside University for the facilities provided for the present research study.

Conflicts of Interest

The authors declare no conflict of interest.

Nomenclature

DStiffness matrix
εMechanical strain
sStress
EModulus of elasticity
αCoefficient of thermal expansion
νpPoisson’s ratio
TTemperature
mMass
rRadius of rotation (distance between the rotor center of gravity and its rotation centre)
ωsRotor rotational speed
FcfCentrifugal force
ρMaterial density
AThe blade cross sectional area
zThe blade thickness
AtCross sectional area of blade at the tip
ArCross sectional area of blade at the root
lbThe blade length
ω i ith natural circular frequency (radians per unit time)
t Time
f i ith natural frequency (cycles per unit time)
NfThe number of cycles to failure
σ f Fatigue strength parameter
bFatigue life exponent
σ u The ultimate strength of the material
σ a The alternating stress
σ m The mean stress
σeThe endurance stress (endurance limit for completely reversed loading)
RStress ratio
niith fatigue cycle
DfMaterial damage due to fatigue
kTurbulent flow kinetic energy
ωSpecific dissipation rate
YkDissipation of k
YωDissipation of ω
SUser-defined source term
GkThe generation of k due to mean velocity gradients
The generation of ω
ΓkThe effective diffusivity of k
ΓωThe effective diffusivity of ω

References

  1. Smadi, Y.; Alsood, E.; Aljaradin, M. A Solar Disinfection Water Treatment System for Rural Areas/Jordan. Al-Kitab J. Pure Sci. 2023, 5, 55–67. [Google Scholar] [CrossRef]
  2. Mahmood Ibrahim, A.; Ibraheem, R.R.; Bakr Weli, R. Energy Saving in Batteries Using the Photovoltaic System. Al-Kitab J. Pure Sci. 2023, 4, 78–94. [Google Scholar] [CrossRef]
  3. Edirisinghe, D.S.; Yang, H.S.; Gunawardane, S.D.G.S.P.; Alkhabbaz, A.; Tongphong, W.; Yoon, M.; Lee, Y.H. Numerical and Experimental Investigation on Water Vortex Power Plant to Recover the Energy from Industrial Wastewater. Renew. Energy 2023, 204, 617–634. [Google Scholar] [CrossRef]
  4. Alkhabbaz, A.; Yang, H.S.; Weerakoon, A.H.S.; Lee, Y.H. A Novel Linearization Approach of Chord and Twist Angle Distribution for 10 KW Horizontal Axis Wind Turbine. Renew. Energy 2021, 178, 1398–1420. [Google Scholar] [CrossRef]
  5. Daabo, A.M.; Al-Mola, Y.S.; Al-Rawy, A.Y.; Lattimore, T. State of the Art Single-Objective Optimization of Small Scale Cylindrical Cavity Receiver. Sustain. Energy Technol. Assess. 2019, 35, 278–290. [Google Scholar] [CrossRef]
  6. Daabo, A.M.; Bellos, E.; Pavlovic, S.; Bashir, M.A.; Mahmoud, S.; Al-Dadah, R.K. Characterization of a Micro Thermal Cavity Receiver–Experimental and Analytical Investigation. Therm. Sci. Eng. Prog. 2020, 18, 100554. [Google Scholar] [CrossRef]
  7. Zhang, R.; Xin, Z.; Huang, G.; Yan, B.; Zhou, X.; Deng, X. Characteristics and Modelling of Wake for Aligned Multiple Turbines Based on Numerical Simulation. J. Wind Eng. Ind. Aerodyn. 2022, 228, 105097. [Google Scholar] [CrossRef]
  8. Micallef, D.; Ferreira, C.; Herráez, I.; Höning, L.; Yu, W.; Capdevila, H. Assessment of Actuator Disc Models in Predicting Radial Flow and Wake Expansion. J. Wind Eng. Ind. Aerodyn. 2020, 207, 104396. [Google Scholar] [CrossRef]
  9. Collings, P.; Yu, Z. Modelling and Analysis of a Small-Scale Organic Rankine Cycle System with a Scroll Expander. Lect. Notes Eng. Comput. Sci. 2014, 2, 1472–1477. [Google Scholar]
  10. Daabo, A.M.; Mahmoud, S.; Al-Dadah, R.K.; Al Jubori, A.M.; Bhar Ennil, A. Numerical Analysis of Small Scale Axial and Radial Turbines for Solar Powered Brayton Cycle Application. Appl. Therm. Eng. 2017, 120, 672–693. [Google Scholar] [CrossRef]
  11. Gomes, R.P.F.; Henriques, J.C.C.; Gato, L.M.C.; Falcão, A.F.O. Multi-Point Aerodynamic Optimization of the Rotor Blade Sections of an Axial-Flow Impulse Air Turbine for Wave Energy Conversion. Energy 2012, 45, 570–580. [Google Scholar] [CrossRef]
  12. Shanechi, M.M.; Odabaee, M.; Hooman, K. Optimisation of a High Pressure Ratio Radial-Inflow Turbine: Coupled CFD-FE Analysis. Proc. ASME Turbo Expo 2015, 2C. [Google Scholar] [CrossRef]
  13. Barsi, D.; Perrone, A.; Ratto, L.; Simoni, D.; Zunino, P. Radial Inflow Turbine Design through Multi-Disciplinary Optimisation Technique. Proc. ASME Turbo Expo 2015, 8, V008T23A009. [Google Scholar] [CrossRef]
  14. Wang, H.L.; Xi, G. Effect of Thermal and Mechanical Loads on the Centrifugal Impeller Deformation and Its Structure Optimization. Proc. ASME Turbo Expo 2009, 5, 75–84. [Google Scholar] [CrossRef]
  15. Fu, L.; Shi, Y.; Deng, Q.; Li, H.; Feng, Z. Integrated Optimization Design for a Radial Turbine Wheel of a 100 KW-Class Microturbine. J. Eng. Gas Turbines Power 2012, 134, 012301. [Google Scholar] [CrossRef]
  16. Alawadhi, K.; Alhouli, Y.; Ashour, A.; Alfalah, A. Design and Optimization of a Radial Turbine to Be Used in a Rankine Cycle Operating with an OTEC System. J. Mar. Sci. Eng. 2020, 8, 855. [Google Scholar] [CrossRef]
  17. Feng, Z.; Deng, Q.; Li, J. Aerothermodynamic Design and Numerical Simulation of Radial Inflow Turbine Impeller for a 100kW Microturbine. Proc. ASME Turbo Expo 2005, 1, 873–880. [Google Scholar] [CrossRef]
  18. Causier, A.; Carret, G.; Boutin, C.; Berthelot, T.; Berthault, P. 3D-Printed System Optimizing Dissolution of Hyperpolarized Gaseous Species for Micro-Sized NMR. Lab A Chip 2015, 15, 2049–2054. [Google Scholar] [CrossRef]
  19. O’Neill, P.; Jolivet, L.; Kent, N.J.; Brabazon, D. Physical Integrity of 3D Printed Parts for Use as Embossing Tools. Adv. Mater. Process. Technol. 2017, 3, 308–317. [Google Scholar] [CrossRef] [Green Version]
  20. ANSYS CFX-Solver Theory Guide; ANSYS, Inc.: Canonsburg, PE, USA, 2009; Volume 15317, pp. 724–746.
  21. Singh, M. Steam Turbines-Design, Application, and Re-Rating; Mcgraw-hill Education-Europe: Sydney, Australia, 2008. [Google Scholar]
  22. Poblano-Salas, C.A.; Barceinas-Sanchez, J.D.O.; Sanchez-Jimenez, J.C. Failure Analysis of an AISI 410 Stainless Steel Airfoil in a Steam Turbine. Eng. Fail. Anal. 2011, 18, 68–74. [Google Scholar] [CrossRef]
  23. Dowling, N.; Dowling, N. Mechanical Behavior of Materials: Engineering Methods for Deformation; Pearson: London, UK, 2012; p. 59. Available online: https://www.amazon.co.uk/Mechanical-Behavior-Materials-Norman-Dowling/dp/0131395068 (accessed on 28 June 2023).
  24. Boentgen, R.R.; Clickner, S.J. Experimental Modal Analysis. CSI Reliab. Week 1983, 1, 581–584. [Google Scholar]
  25. Eftekhari, M.; Fatemi, A. Creep-Fatigue Interaction and Thermo-Mechanical Fatigue Behaviors of Thermoplastics and Their Composites. Int. J. Fatigue 2016, 91, 136–148. [Google Scholar] [CrossRef]
  26. Mura, A.; Ricci, A.; Canavese, G. Investigation of Fatigue Behavior of ABS and PC-ABS Polymers at Different Temperatures. Materials 2018, 11, 1818. [Google Scholar] [CrossRef] [PubMed] [Green Version]
  27. Mohammed, A.A.; Dawood, A.S. Mixed Convection Heat Transfer in a Ventilated Enclosure with and without a Saturated Porous Medium. J. Porous Media 2016, 19, 347–366. [Google Scholar] [CrossRef]
  28. Alkhabbaz, A.; Yang, H.S.; Tongphong, W.; Lee, Y.H. Impact of Compact Diffuser Shroud on Wind Turbine Aerodynamic Performance: CFD and Experimental Investigations. Int. J. Mech. Sci. 2022, 216, 106978. [Google Scholar] [CrossRef]
  29. Djodikusumo, I.; Diasta, I.N.; Sanjaya Awaluddin, I. Geometric Modeling of a Propeller Turbine Runner Using ANSYS BladeGen, Meshing Using ANSYS TurboGrid and Fluid Dynamic Simulation Using ANSYS Fluent. Appl. Mech. Mater. 2016, 842, 164–177. [Google Scholar] [CrossRef]
  30. Ansys, Inc. ANSYS CFX-Solver Modeling Guide V14.0. ANSYS CFX V14.0; Ansys, Inc.: Canonsburg, PE, USA, 2011. [Google Scholar]
  31. Yang, H.S.; Alkhabbaz, A.; Edirisinghe, D.S.; Tongphong, W.; Lee, Y.H. FOWT Stability Study According to Number of Columns Considering Amount of Materials Used. Energies 2022, 15, 1653. [Google Scholar] [CrossRef]
  32. Korte, J.J.; Salas, A.O.; Dunn, H.J.; Alexandrov, N.M.; Follett, W.W.; Orient, G.E.; Hadid, A.H. Multidisciplinary Approach to Linear Aerospike Nozzle Design. J. Propuls. Power 2001, 17, 93–98. [Google Scholar] [CrossRef]
  33. Moustapha, H.; Zelesky, M.; Baines, N.; Japikse, D. Axial and Radial Turbines; Concepts NREC: White River Junction, VT, USA, 2003; p. 10. Available online: https://www.amazon.co.uk/Axial-Radial-Turbines-Haney-Moustapha/dp/0933283121 (accessed on 28 June 2023).
  34. Daabo, A.M.; Hammo, K.E.; Mohammed, O.A.; Hassan, A.A.; Lattimore, T. Performance Investigation and Design Optimization of Micro Scale Compressed Air Axial Turbine for Domestic Solar Powered Brayton Cycle. Sustain. Energy Technol. Assess. 2020, 37, 100583. [Google Scholar] [CrossRef]
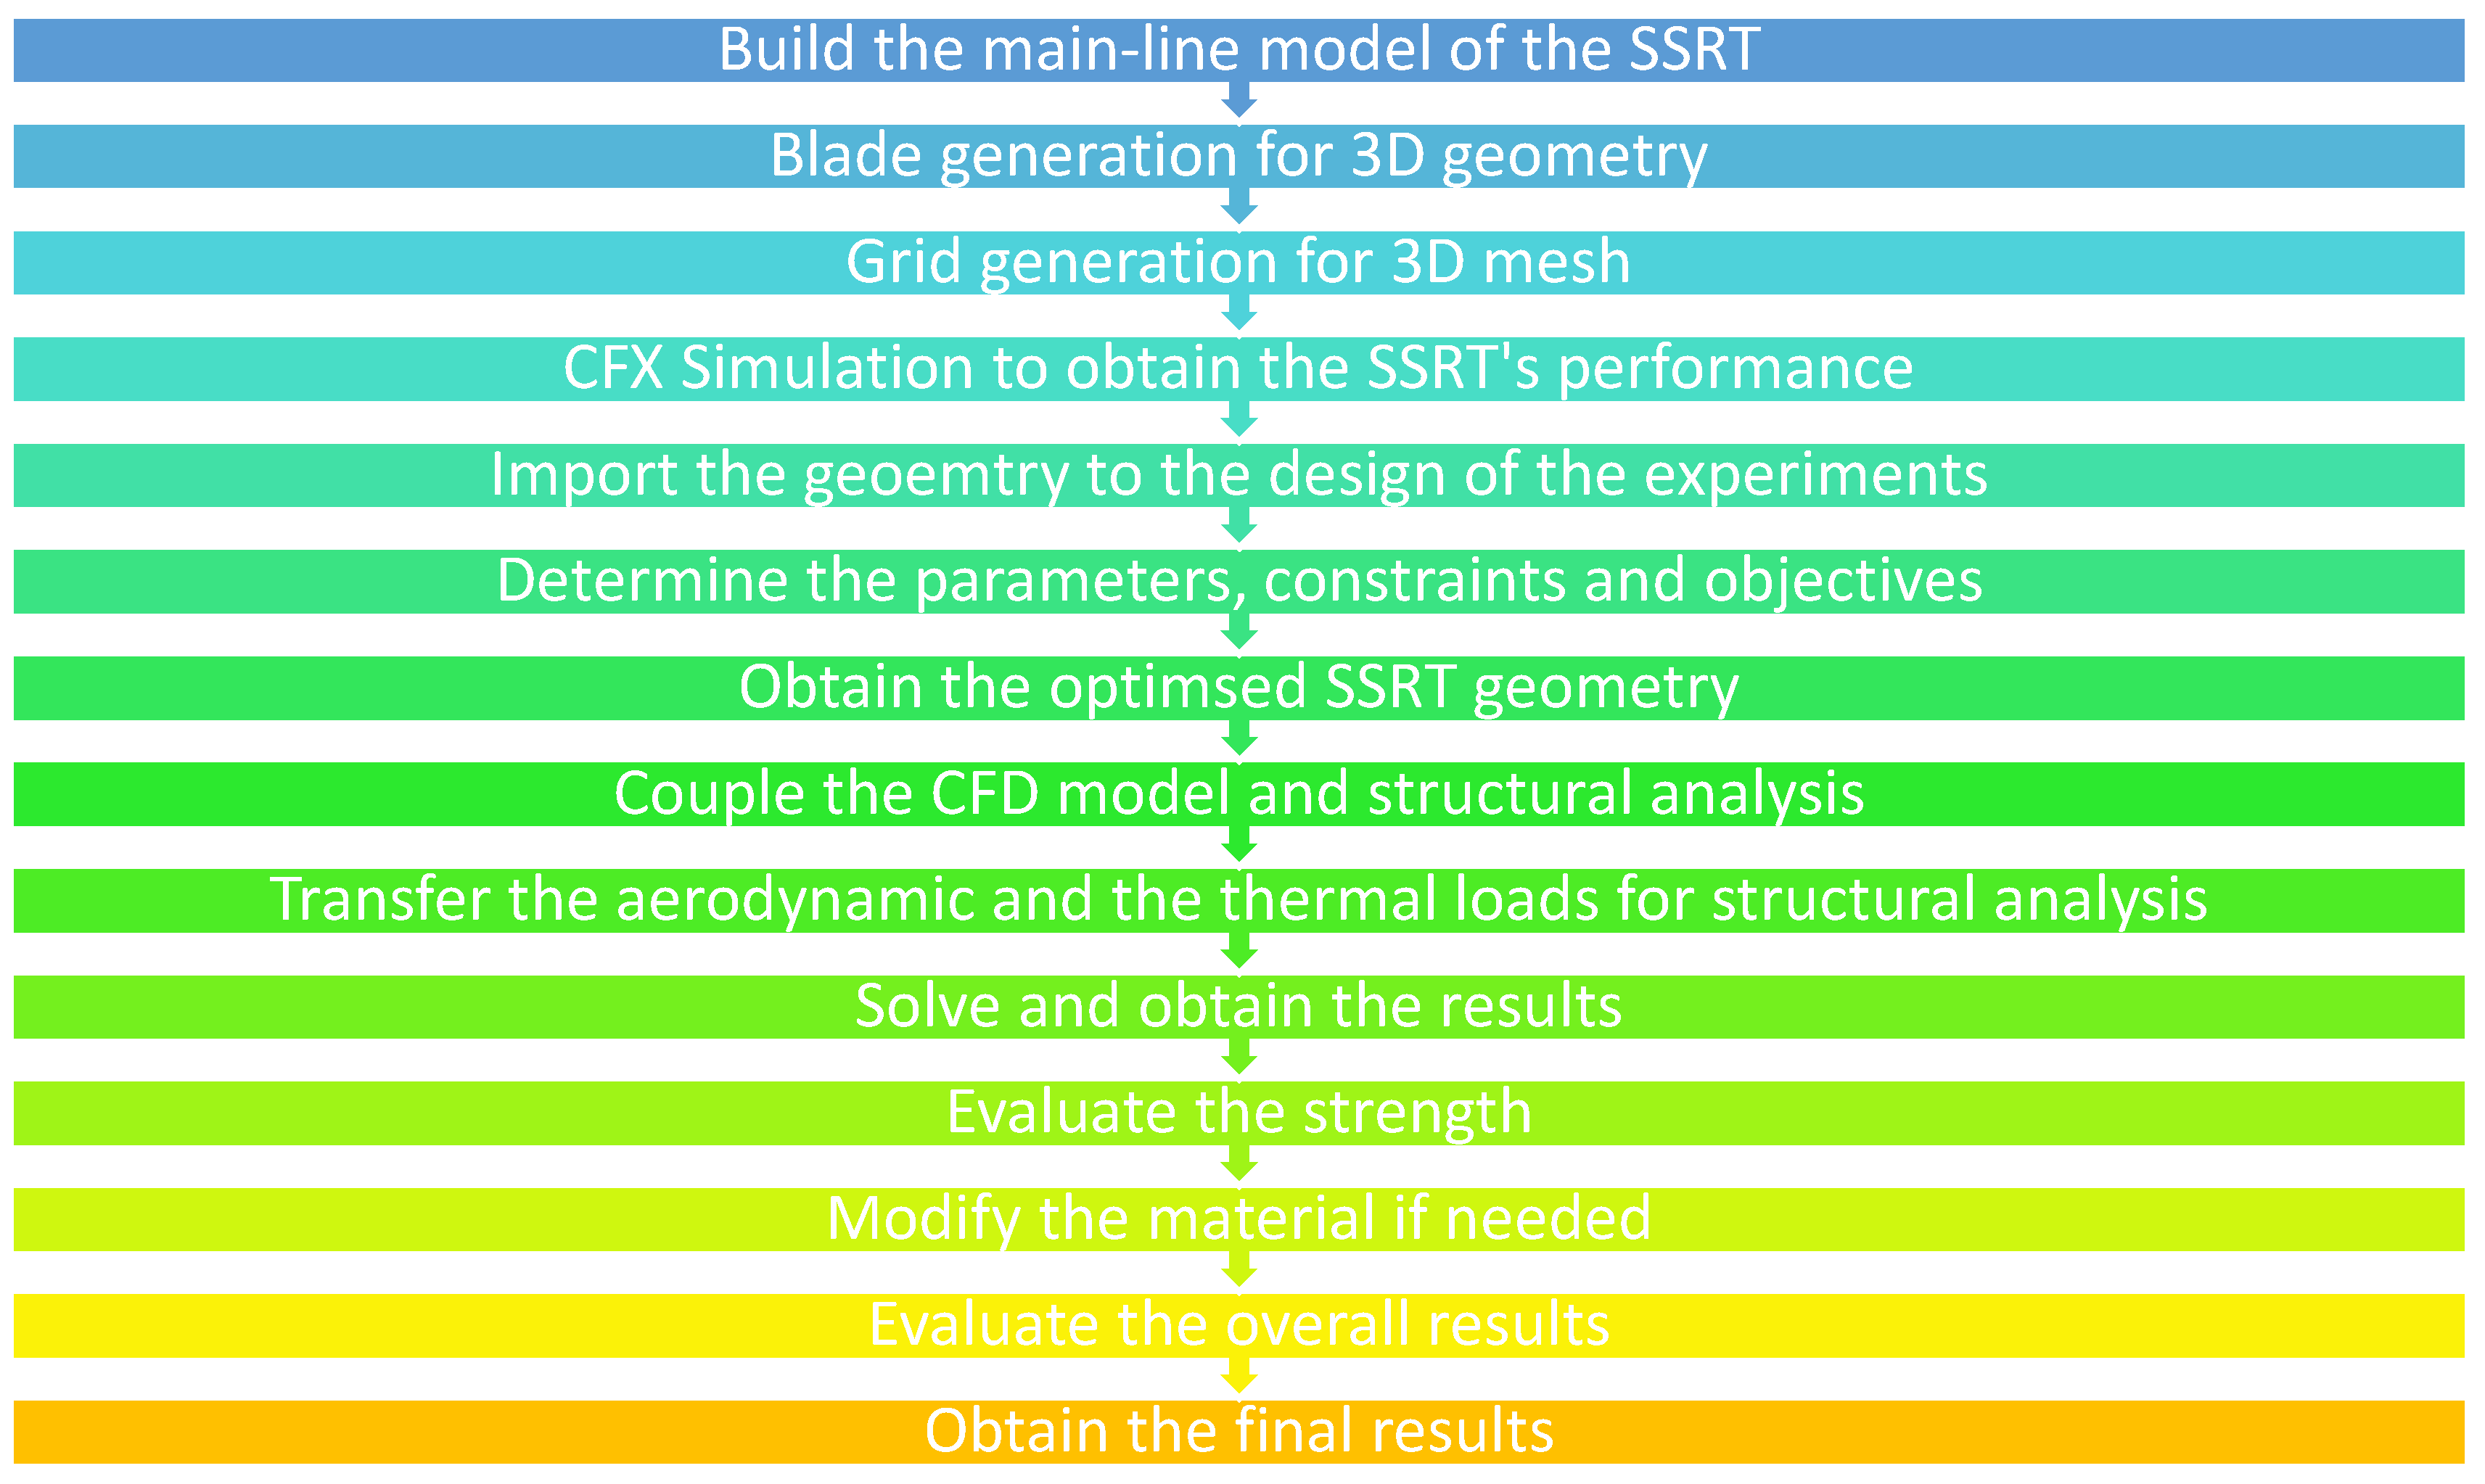
Figure 1. Overview process of the analyses’ procedure.
Machines 11 00817 g001
Figure 2. The complete model of the designed SSRT (left) and its cross-sectional view (right).
Machines 11 00817 g002
Figure 3. Oven temperature over time (A) and (B) oven used in the heat treatment.
Machines 11 00817 g003
Figure 4. Tensile test results of the treated RGD 525; (a) 25 °C, (b) 35 °C and (c) 45 °C.
Machines 11 00817 g004
Figure 5. Fatigue test carried out using ISTRON 8801 machine.
Machines 11 00817 g005
Figure 6. SSRT parts which are printed by 3D printing technology.
Machines 11 00817 g006
Figure 7. Simultaneous mean and cyclic loading.
Machines 11 00817 g007
Figure 8. The 3D mesh generations for the stator and the rotor together.
Machines 11 00817 g008
Figure 9. Turbine model efficiency corresponding to element number.
Machines 11 00817 g009
Figure 10. The cross-sectional view of the designed SSRT showing its mesh.
Machines 11 00817 g010
Figure 11. Validation of CFD modelling and experiment for SSRT: (a) efficiency and (b) developed power at 40 °C.
Machines 11 00817 g011aMachines 11 00817 g011b
Figure 12. Pressure contours (a) and velocity contours (b) for SSRT using blade-to-blade vision.
Machines 11 00817 g012
Figure 13. Imported pressure (top) and temperature (bottom) from the CFD model to the FEA model.
Machines 11 00817 g013
Figure 14. The temperature distribution as a result of heated compressed air supplied through the inlet.
Machines 11 00817 g014aMachines 11 00817 g014b
Figure 15. The total deformation distribution of the SSRT.
Machines 11 00817 g015
Figure 16. The total equivalent stress distribution of the SSRT.
Machines 11 00817 g016
Figure 17. An example of fatigue life expectation in the rotor at two different values of inlet air temperature; 25 °C (Left-Hand side) and (Right-Hand Side) 65 °C.
Machines 11 00817 g017
Figure 18. The effect of both inlet air temperature and the rotor rotational speed on: (a) the maximum deformation, (b) the rotor fatigue life and (c) the overall damage in the rotor’s body. Different coloured columns represent variables at different temperatures.
Machines 11 00817 g018
Figure 19. Parameters parallel chart for the SSRT using the multidisciplinary optimization. Each coloured-line represents different design parameter.
Machines 11 00817 g019
Figure 20. Design points vs. chosen parameters chart for the SSRT using multidisciplinary optimization.
Machines 11 00817 g020
Figure 21. The local sensitivity of the outlet parameters with respect to the inlet parameters.
Machines 11 00817 g021
Figure 22. The achieved correlation between the rotor speed and the minimum life.
Machines 11 00817 g022
Figure 23. Maximum equivalent stress value for the multidisciplinary optimized rotor of the SSRD.
Machines 11 00817 g023
Figure 24. The fatigue life for the multidisciplinary optimized rotor of the SSRD.
Machines 11 00817 g024
Figure 25. The total deformation for the multidisciplinary optimized rotor of the SSRT.
Machines 11 00817 g025
Figure 26. The chosen parameters compromission.
Machines 11 00817 g026
Table 1. RGD525 material properties.
Properties Value
Young’s Modulus, MPa2000
Poisson’s Ratio0.3
Flexural Modulus, MPa3300
Tensile Strength, MPa75
Density, kg/m31175
Coefficient of Thermal Expansion, /C0.000012
Specific Heat, J/kg °C434
Thermal Conductivity, W/mm °C0.0605
Table 2. Model mesh parameters.
Physics PreferenceMechanical
Sizing:
Relevance CentreMedium
Initial Size SeedActive Assembly
SmoothingMedium
TransitionFast
Span Angle CentreCoarse
Minimum Edge Length0.0546 mm
Inflation:
Inflation OptionSmooth Transition
Transition Ratio0.272
Maximum Layers5
Growth Rate1.2
Inflation AlgorithmPre
Patch Independent Options:
Topology CheckingYes
Advanced:
Shape CheckingStandard Mechanical
Element Mid-side NodesProgram Controlled
Extra Retries for AssemblyYes
Rigid Body BehaviourDimensionally Reduced
Disclaimer/Publisher’s Note: The statements, opinions and data contained in all publications are solely those of the individual author(s) and contributor(s) and not of MDPI and/or the editor(s). MDPI and/or the editor(s) disclaim responsibility for any injury to people or property resulting from any ideas, methods, instructions or products referred to in the content.