Article

Development, Characterization and High-Temperature Oxidation Behaviour of Hot-Isostatic-Treated Cold-Sprayed Thick Titanium Deposits

1
Department of Mechanical Engineering, Indian Institute of Technology Ropar, Rupnagar 140001, Punjab, India
2
Department of Mechanical Engineering and Product Design Engineering, Industrial Transformation Training Center on “Surface Engineering for Advanced Materials”—SEAM, Swinburne University of Technology, Hawthorn, VIC 3122, Australia
3
General Electric Vernova, Bengaluru 560067, Karnataka, India
4
Surface Science and Tribology Lab, Department of Mechanical Engineering, Shiv Nadar Institution of Eminence, Gautam Budh Nagar 201314, Uttar Pradesh, India
*
Author to whom correspondence should be addressed.
Machines 2023, 11(8), 805; https://doi.org/10.3390/machines11080805
Submission received: 20 June 2023 / Revised: 27 July 2023 / Accepted: 2 August 2023 / Published: 4 August 2023
(This article belongs to the Special Issue Recent Advances in Surface Processing of Metals and Alloys)

Abstract

:
In this work, thick deposits of pure titanium (Ti), with a thickness of around 15 mm, were additively manufactured using high-pressure cold spraying. Nitrogen was employed as the process gas. Subsequently, the deposits were subjected to hot isostatic pressing (HIP). The HIP-treated Ti deposits were analyzed for their metallurgical and mechanical characteristics with the aim of exploring the viability of using cold spraying for the additive manufacturing of Ti components. Moreover, high-temperature cyclic oxidation testing was also performed on the HIP-treated Ti deposit to understand its stability at high temperatures. SEM/EDS showed a dense structure with marginal porosity for the HIP-treated Ti deposits, without any oxide formation, which was further confirmed via XRD analysis. An average microhardness of 214 HV was measured for the HIP-treated Ti deposits, which is close to that of the commercially available bulk titanium (202 HV). The high-temperature oxidation studies revealed that the cold-sprayed HIP-treated Ti has very good oxidation resistance, which could be attributed to the formation of protective titanium dioxide in its oxide scale.

1. Introduction

Additive manufacturing (AM) is a process of creating three-dimensional standalone components, during which the component is manufactured by adding material in a layer-by-layer fashion, in contrast to conventional material subtraction processes. AM is one of the most significant developments in manufacturing technologies. AM has evolved as a promising technology for synthesizing specific and complex geometries with reasonable production volume and reduced production time [1]. Looking at the temporal evolution, selective laser sintering (SLS) evolved as the first metal-based additive manufacturing technology for a wide range of materials. Selective laser melting (SLM) was developed to eliminate the post-processing of SLS-fabricated components. In addition to laser-based processes, quite a few other techniques have been developed, such as electron beam melting and ultrasonic consolidation [2,3,4,5,6]. However, these techniques are yet to attract significant importance due to the inherent limitations like poor surface quality, low adhesion and low production volumes [7]. Cold spraying (CS) is a recent entrant to the list of thermal spray techniques. During thermal spraying, material in powder form is accelerated to high velocity under heated conditions to obtain a deposited coating layer, whereas during CS, mainly velocity is used to deposit the feedstock powders. Cold spraying is a solid-state high-strain-rate material deposition technique wherein powder feedstock (metallic or composite) in size range of 5–100 microns is entrained in the supersonic gas jet to form the coating and 3-D complex free-standing shapes through self-consolidation [8,9]. Metallurgical bonding and mechanical interlocking are the two mechanisms that play crucial roles in ensuring a durable and reliable bonding between the powder particles and the substrate. CS offers high flexibility regarding fabricating standalone shapes with significant productivity. Since the temperatures involved are low, thermal stresses are limited in the components synthesized using cold spraying [7,9,10]. The microstructure of the components manufactured is likely to be homogeneous and refined owing to high-strain plastic deformation and the absence of high temperature. Powder compaction is driven by high external pressure rather than high temperatures, which promotes the development of a highly dense and compact structure owing to increased inter-lamellar cohesion. Also, the problems arising due to a mismatch of thermal conductivity and melting temperature between different powder constituents are avoided [7,11].
In the context of additive manufacturing, the use of cold spraying is a recent advancement. The process appears to be promising; however, the applicability of the process for components of different metals such as Ni, Ti, and Mg and their respective alloys and superalloys at industrial scale such as for energy, aviation, oil and gas, locomotives, and healthcare sectors, is limited and less known. The production of titanium via conventional methods requires many resource-intensive processes, and its poor workability and reactivity make it difficult to machine, cast, and forge [12,13].
Commercially pure grades of titanium have ultimate strength in the range of 434 MPa, which is equivalent to low-grade steels; however, their density is relatively low. The grades are 60% denser than commonly used 6061-T6 aluminum alloy, however, with nearly double strength. Titanium has a high strength-to-density ratio, excellent creep and fatigue strengths at high temperatures, corrosion resistance at high temperatures, high osseointegration properties, and is both aqua regia and seawater corrosion-resistant. It has widespread applications in medical, nuclear, marine, aerospace and many more sectors. However, titanium powder with a particle size of less than 45 microns in the presence of oxygen is considered a flammability hazard as it is highly pyrophoric. It reacts with nitrogen and oxygen at relatively low temperatures. Therefore, it is very difficult to spray unless we provide a vacuum or inert gas shroud during thermal spray processes [14]. In this regard, the cold spray process provides the possibility of depositing Ti in a solid state. Therefore, in this study, cold spray technology has been used to create thick deposits of pure titanium, which were HIP treated. The manufactured deposits were characterized to assess the potentiality of the cold-spray-based additive manufacturing (CSAM) technology in developing industry-relevant real-life components of titanium and its alloys.

2. Methodology

A flow chart representing the experimental procedure adopted to develop and characterize thick Ti deposits using cold spray technology is shown in Figure 1. Pure titanium powder (Praxair Surface Technologies, Indianapolis, IN, USA), ranging in size from 11 to 45 µm, and having an irregular shape was employed as a feedstock material. Inconel 718 superalloy was employed as a substrate material. A cold spray system (Impact Innovations GmbH) was used to manufacture the thick titanium deposits. The system consists of a cold spray gun, cylinder pallets, a gas control unit, gas pressure regulators, a control console, a powder feeder and other associated peripherals. Two important components of the cold spray gun are a CD (convergent-divergent) nozzle and a gas preheating chamber. The nozzle has an exit diameter of 6 mm and a throat diameter of 2 mm. The barrel measures 100 mm in length from the throat to the exit. Nitrogen gas at 40 bar pressure was preheated at a temperature of 550 °C and supplied to the spray gun. Unheated nitrogen gas having more pressure (to prevent backflow of powder) is fed to the powder feeder for conveying the Ti powder particles to the spray gun. The distance between the nozzle exit and the substrate is called the standoff distance, which was kept at 30 mm. A robotic arm manipulated the cold spray gun to deposit multiple layers of titanium. Since titanium has a lower density and a hexagonal closed pack (HCP) crystal structure, it is exceedingly challenging to densify it during cold spraying; therefore, the manufactured deposits were processed under a hot isostatic press (HIP) at a temperature of 1650 °F (900 °C) and under a pressure of 15,000 psi (104 N/mm2) for 2 h to improve their properties. The cold-sprayed samples were prepared at General Electric (Bengaluru), India.

2.1. Microstructural Analyses

For microstructural analysis, surface, as well as sectioned samples, were prepared from the cold-sprayed deposits as per standard metallurgical procedures. The cross-sectional morphology was examined using a scanning electron microscope (SEM) (JEOL JSM-6610LV, JEOL Ltd., Tokyo, Japan) to comprehend the microstructure of the deposit and check the oxide inclusions, pores, and unmelted particles. The calculation of pore size distribution in all the samples was performed using the Image-J tool. Ten random SEM (greyscale) images were used in Image-J for the analysis. After converting SEM images to bmp-format, introducing and setting the scale to the software, binarization using thresholding procedure and analyzing the results, the pore size distribution was determined. Additionally, the density of the samples was calculated with the help of a density measurement kit based on the Archimedes principle (Mettler Toledo, MS-DNY-54, Zürich, Switzerland).
The specimens were examined using X-ray diffraction (XRD) (Analytical X-pert Pro, The Netherlands) in order to investigate the generation of different phases. Diffraction patterns were obtained using a diffractometer with a nickel filter set at a voltage having a value of 35 kV and a current of 20 mA with Cu-Kα radiation. The intensities were measured using a goniometer at a speed of 1°/min while the samples were scanned at a speed of 1 kcps in a 2θ range of 10 to 100°. The diffractometer was linked to X-Ray diffraction software, which generated “d” values for each peak for the identification of different phases.

2.2. Mechanical Properties’ Evaluation

A microhardness tester (Wilson, 402MVD, Chicago, IL, USA) with an applied load of 300 g and a dwell period of 10 s was used to investigate the variation in the cross-sectional microhardness of the deposit. Five consecutive lines of indents along the lateral direction to the interface (representative of different thickness values) were made, and the mean of ten values was considered along each line.
Quasistatic nanoindentation analysis was also performed, which is a standard technique used for the nanomechanical characterization of materials. A triboindenter (Hysitron, Inc., TI-950, Minneapolis, MN, USA) was utilized to measure the nanohardness and Young’s modulus of the manufactured Ti thick layer at the surface and along its thickness. With a 5 μm inter-indent space, 20 indents in the shape of a 5 × 4 matrix were formed. The average values of the elastic modulus and the hardness of the deposit were determined by performing three iterations of this experiment (a total of 60 indents for one sample). The test was conducted with a frequently applied Berkovich diamond tip indenter under a constant 1000 μN loading. The Berkovich indenter had an elastic modulus and a Poisson’s ratio of 1140 GPa and 0.07, respectively.
The tensile specimens were cut from the 15 mm thick Ti deposit using a wire cut-EDM and were tested using a universal tensile testing machine (FIE, UTES 40, Kolhapur, Maharashtra, India). The specimens were dog-bone-shaped (as per ASTM standard E8), each measuring 25 mm gauge length, 10 mm width, and 1 mm thickness. The specimens were subjected to tensile testing using a load cell with a maximum capacity of 20 kN and a low strain rate of 0.02 mm/min. Additionally, a shear test was carried out on the same machine in accordance with ASTM D906-98 standards to determine the adhesion/shear strengths of the layers that were deposited. The specimens were also micro-tensile tested on a micro-tensile testing attachment (Kammrath Weiss GmBH, Schwerte, Germany) in SEM. For this purpose, dog-bone-shaped specimens (according to ASTM standard E8), each measuring 25 mm gauge length, 3 mm width, and 1 mm thickness, were cut using a wire-cut EDM. The specimens were strained at a crosshead speed of 0.5 mm/min with a load cell of 10 kN. The in situ microstructure changes were observed through SEM imaging. The in situ micrographs were taken at several stages, such as crack nucleation, propagation, and fracture.

2.3. High Temperature Cyclic Oxidation Study

Cyclic oxidation tests were carried out in a silicon carbide tube furnace at an elevated temperature of 900 °C. The furnace was calibrated to an accuracy of ±5 °C with a Platinum/Platinum-13% Rhodium thermocouple connected with a temperature indicator. After polishing the cold-sprayed samples, physical characteristics were precisely recorded using a Vernier caliper to calculate their total surface area. The measured specimens were then cleaned with isopropyl alcohol and dried with the help of hot air to eliminate any remaining moisture. Alumina boats were used to contain the prepared specimen during the experiment. The mass of the alumina boats utilized in the experiment was assumed to remain uniform during the cyclic oxidation test, as these boats were preheated to 1200 °C for 6 h. The boat containing the specimen was then placed inside the furnace’s hot zone, which was preheated to 900 °C. After one hour of holding in the furnace, the boat holding the specimen was removed and allowed to cool to room temperature for 20 min. The next step was to measure the mass of the boat and the sample; this completed one cycle. The mass change measurements also accounted for any scales that had fallen off the boat. The mass was measured using an electronic balance with a sensitivity of 10−3 g. After each cycle, visual observations were conducted regarding the color, luster, or any other physical characteristic of the oxide scales. The oxidation data were expressed in terms of mass change per surface area (g/mm2) versus the number of cycles.

3. Results and Discussion

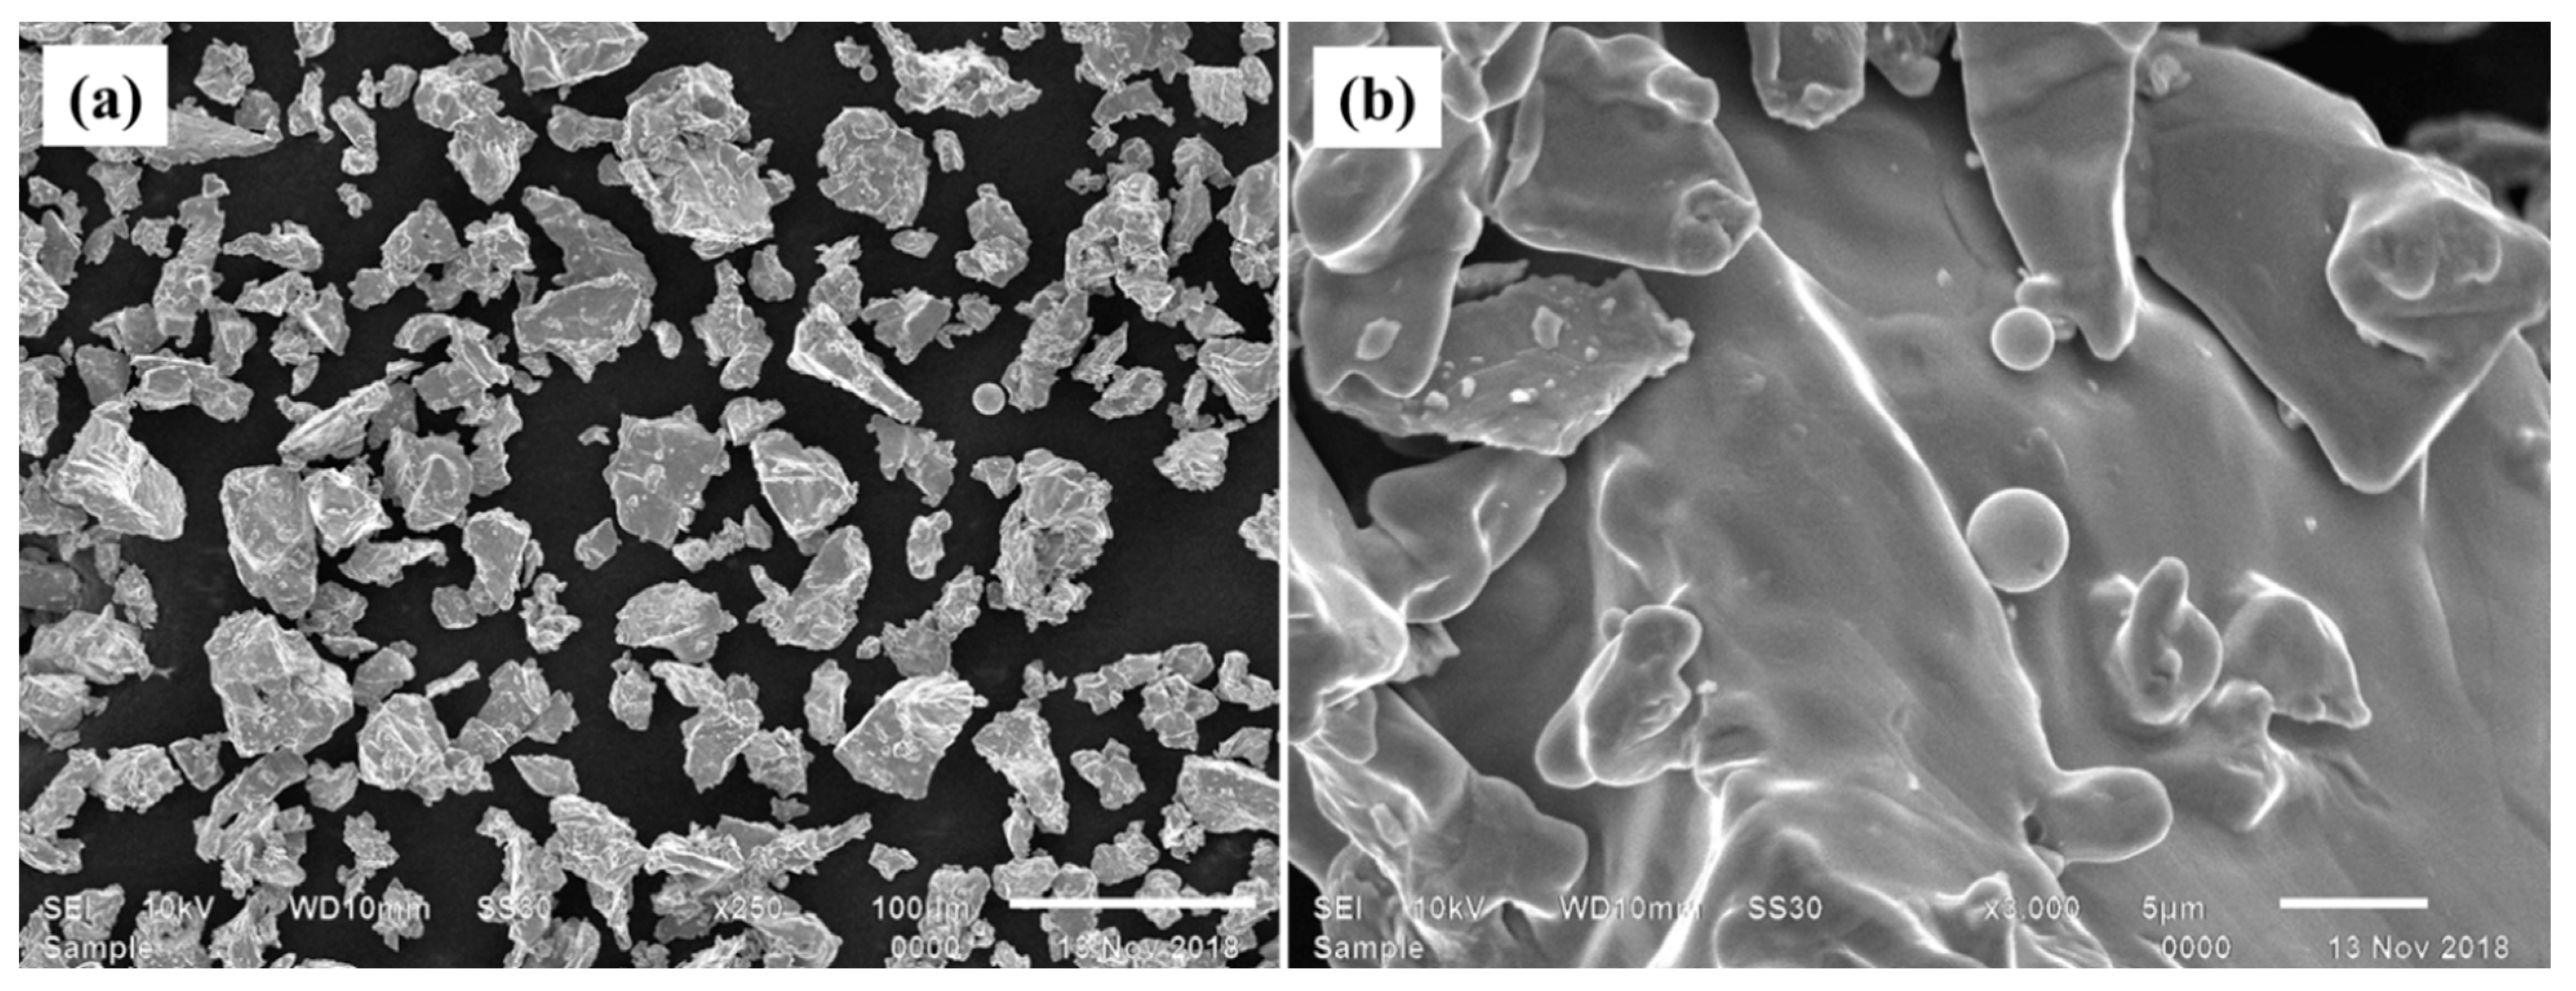
3.1. Microstructural Analyses

SEM images of the Ti feedstock powder revealed an irregular morphology with an angular particle shape, as shown in 
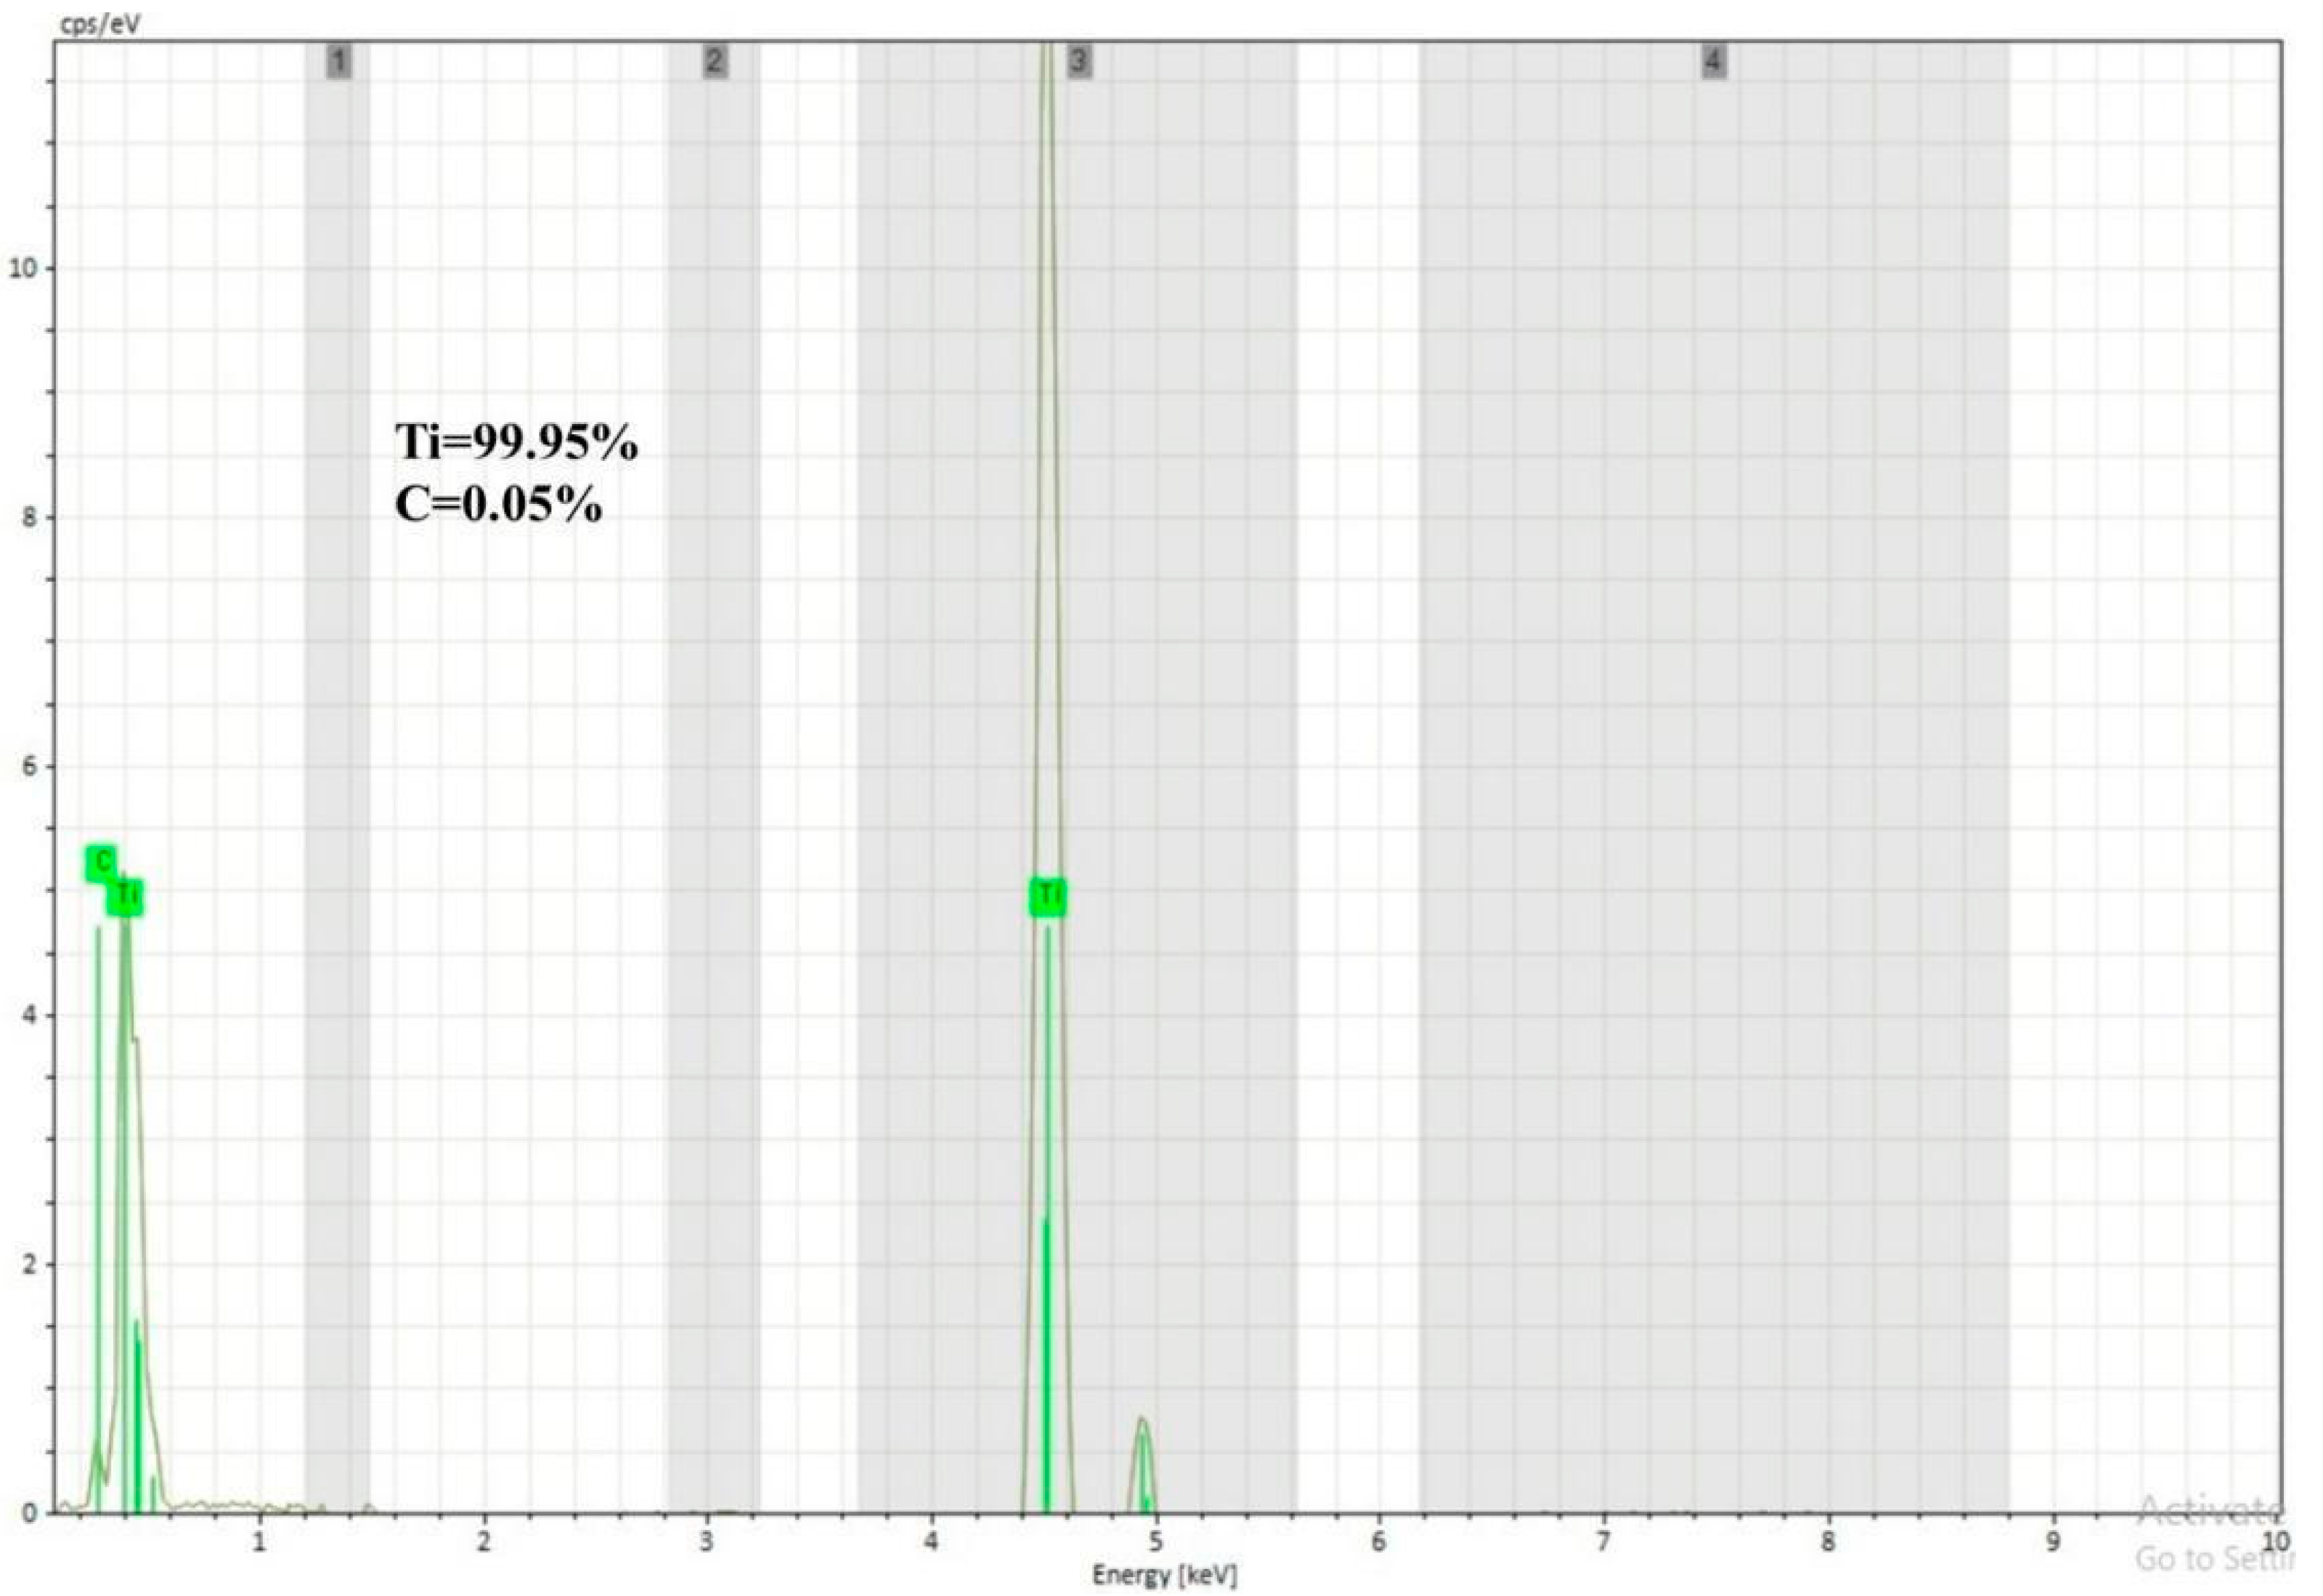
Figure 2. The EDS examination of the powder revealed the existence of only the Ti phase (99.95%), as displayed in 
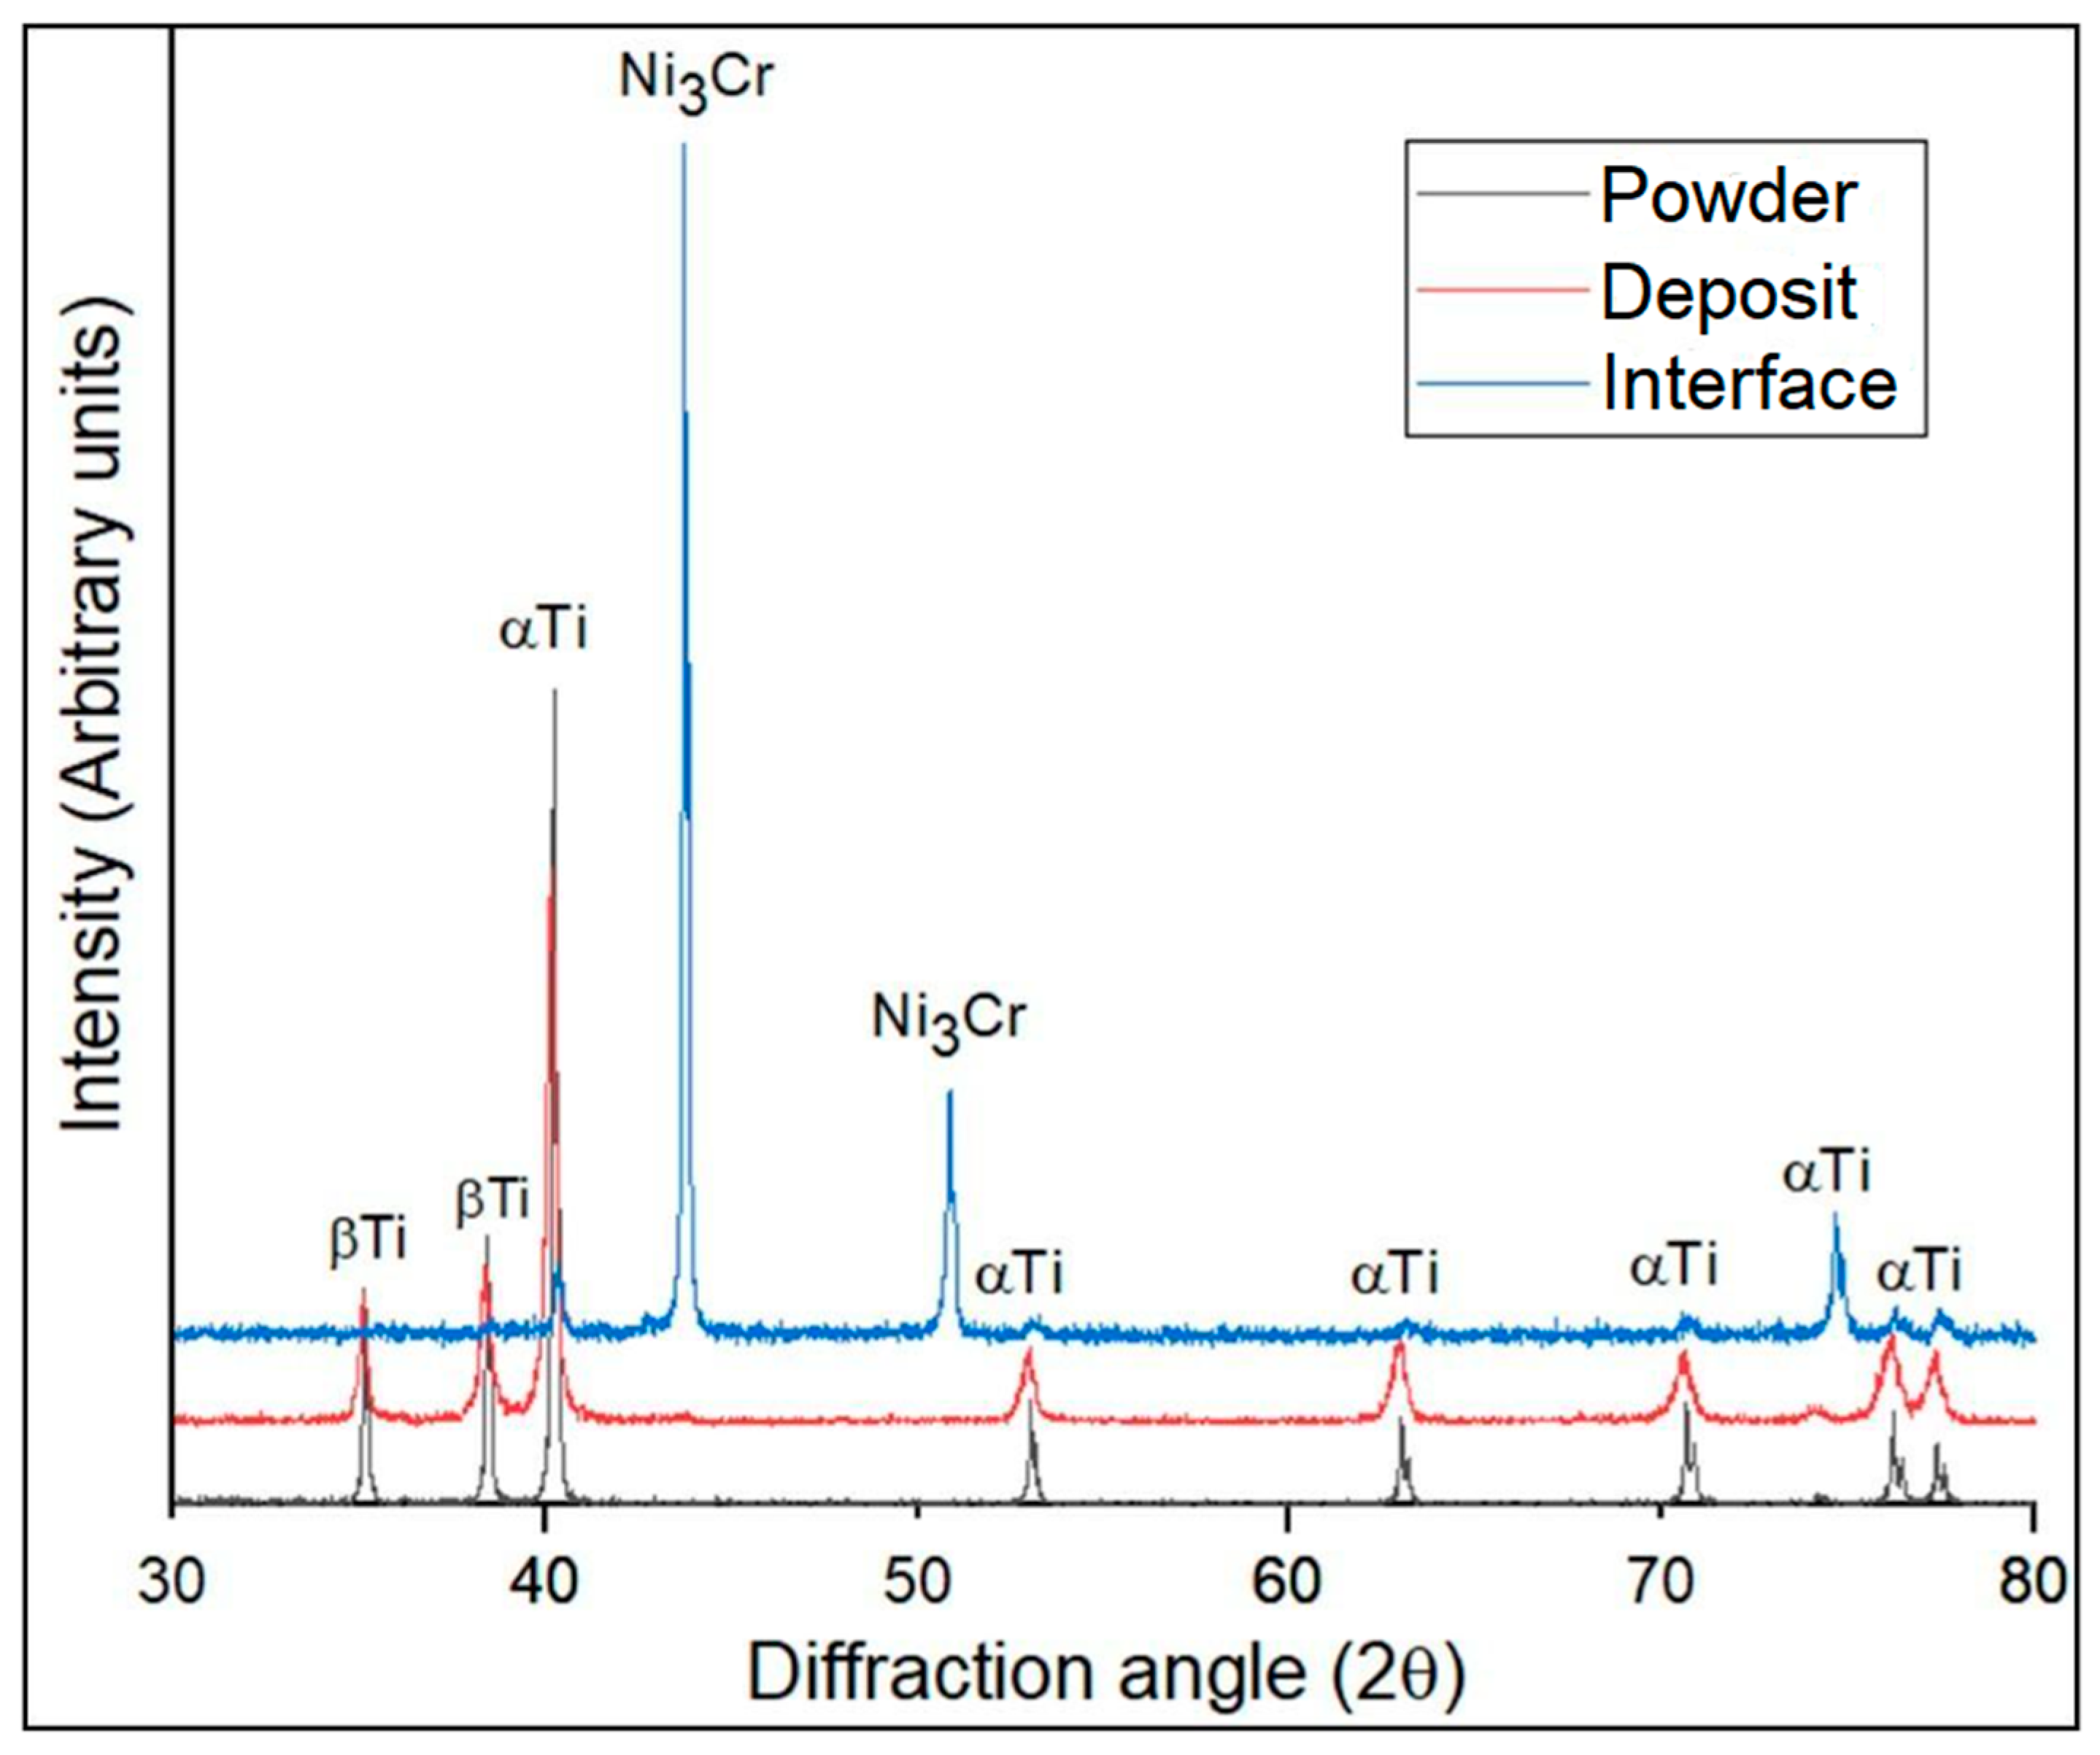
Figure 3, which was further confirmed via XRD investigation (Figure 4). The carbon traces in the EDS data could be attributed to the carbon tape used during analysis to avoid the charging effect of electrons. The XRD analysis revealed that the deposit exhibited a more pronounced peak broadening compared to the powder and interface regions, as depicted in Figure 4. This phenomenon could be attributed to the combined influence of strain and size effects in cold-sprayed HIP-treated pure titanium deposits. The strain and dislocation movements might vary the lattice spacing, resulting in peak broadening. The crystallite size decreased due to grain subdivision, dynamic recrystallization, and grain refinement. Smaller crystallites had a limited number of lattice planes contributing to the diffraction, resulting in broader diffraction peaks [15].
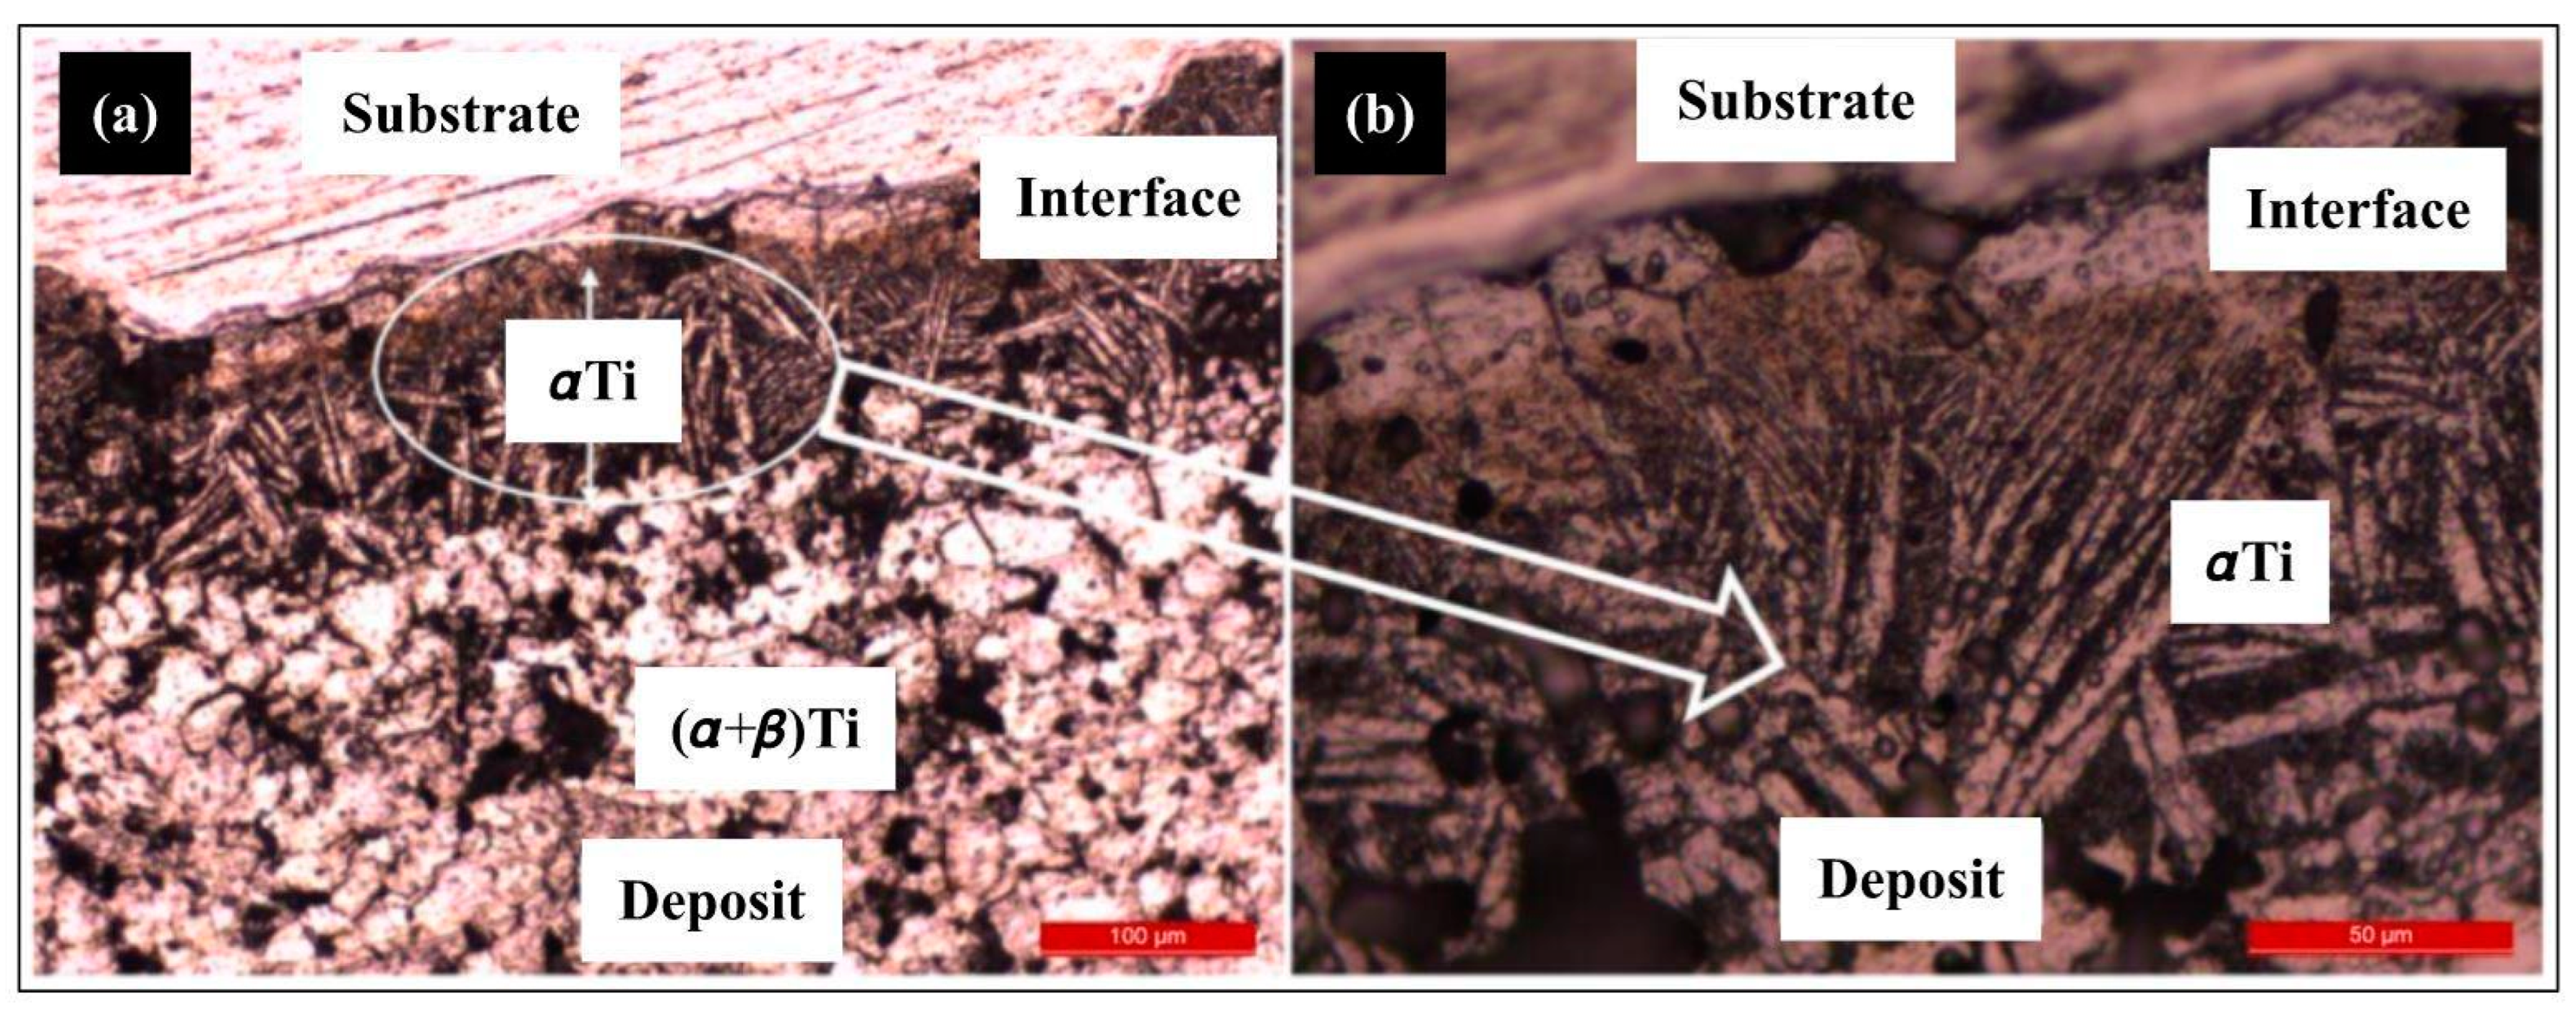
The optical micrographs of the cold-sprayed HIP-treated pure titanium deposit are represented in Figure 5. The deposit is found to have two different types of microstructures. A granular structure with spherical grains of (α + β phase of titanium) has been observed near the center of the deposit. However, a bunch of bush-like structures (Widmanstatten) has been observed near the interface, which was further identified (via XRD, SEM, and microhardness) as α-titanium.
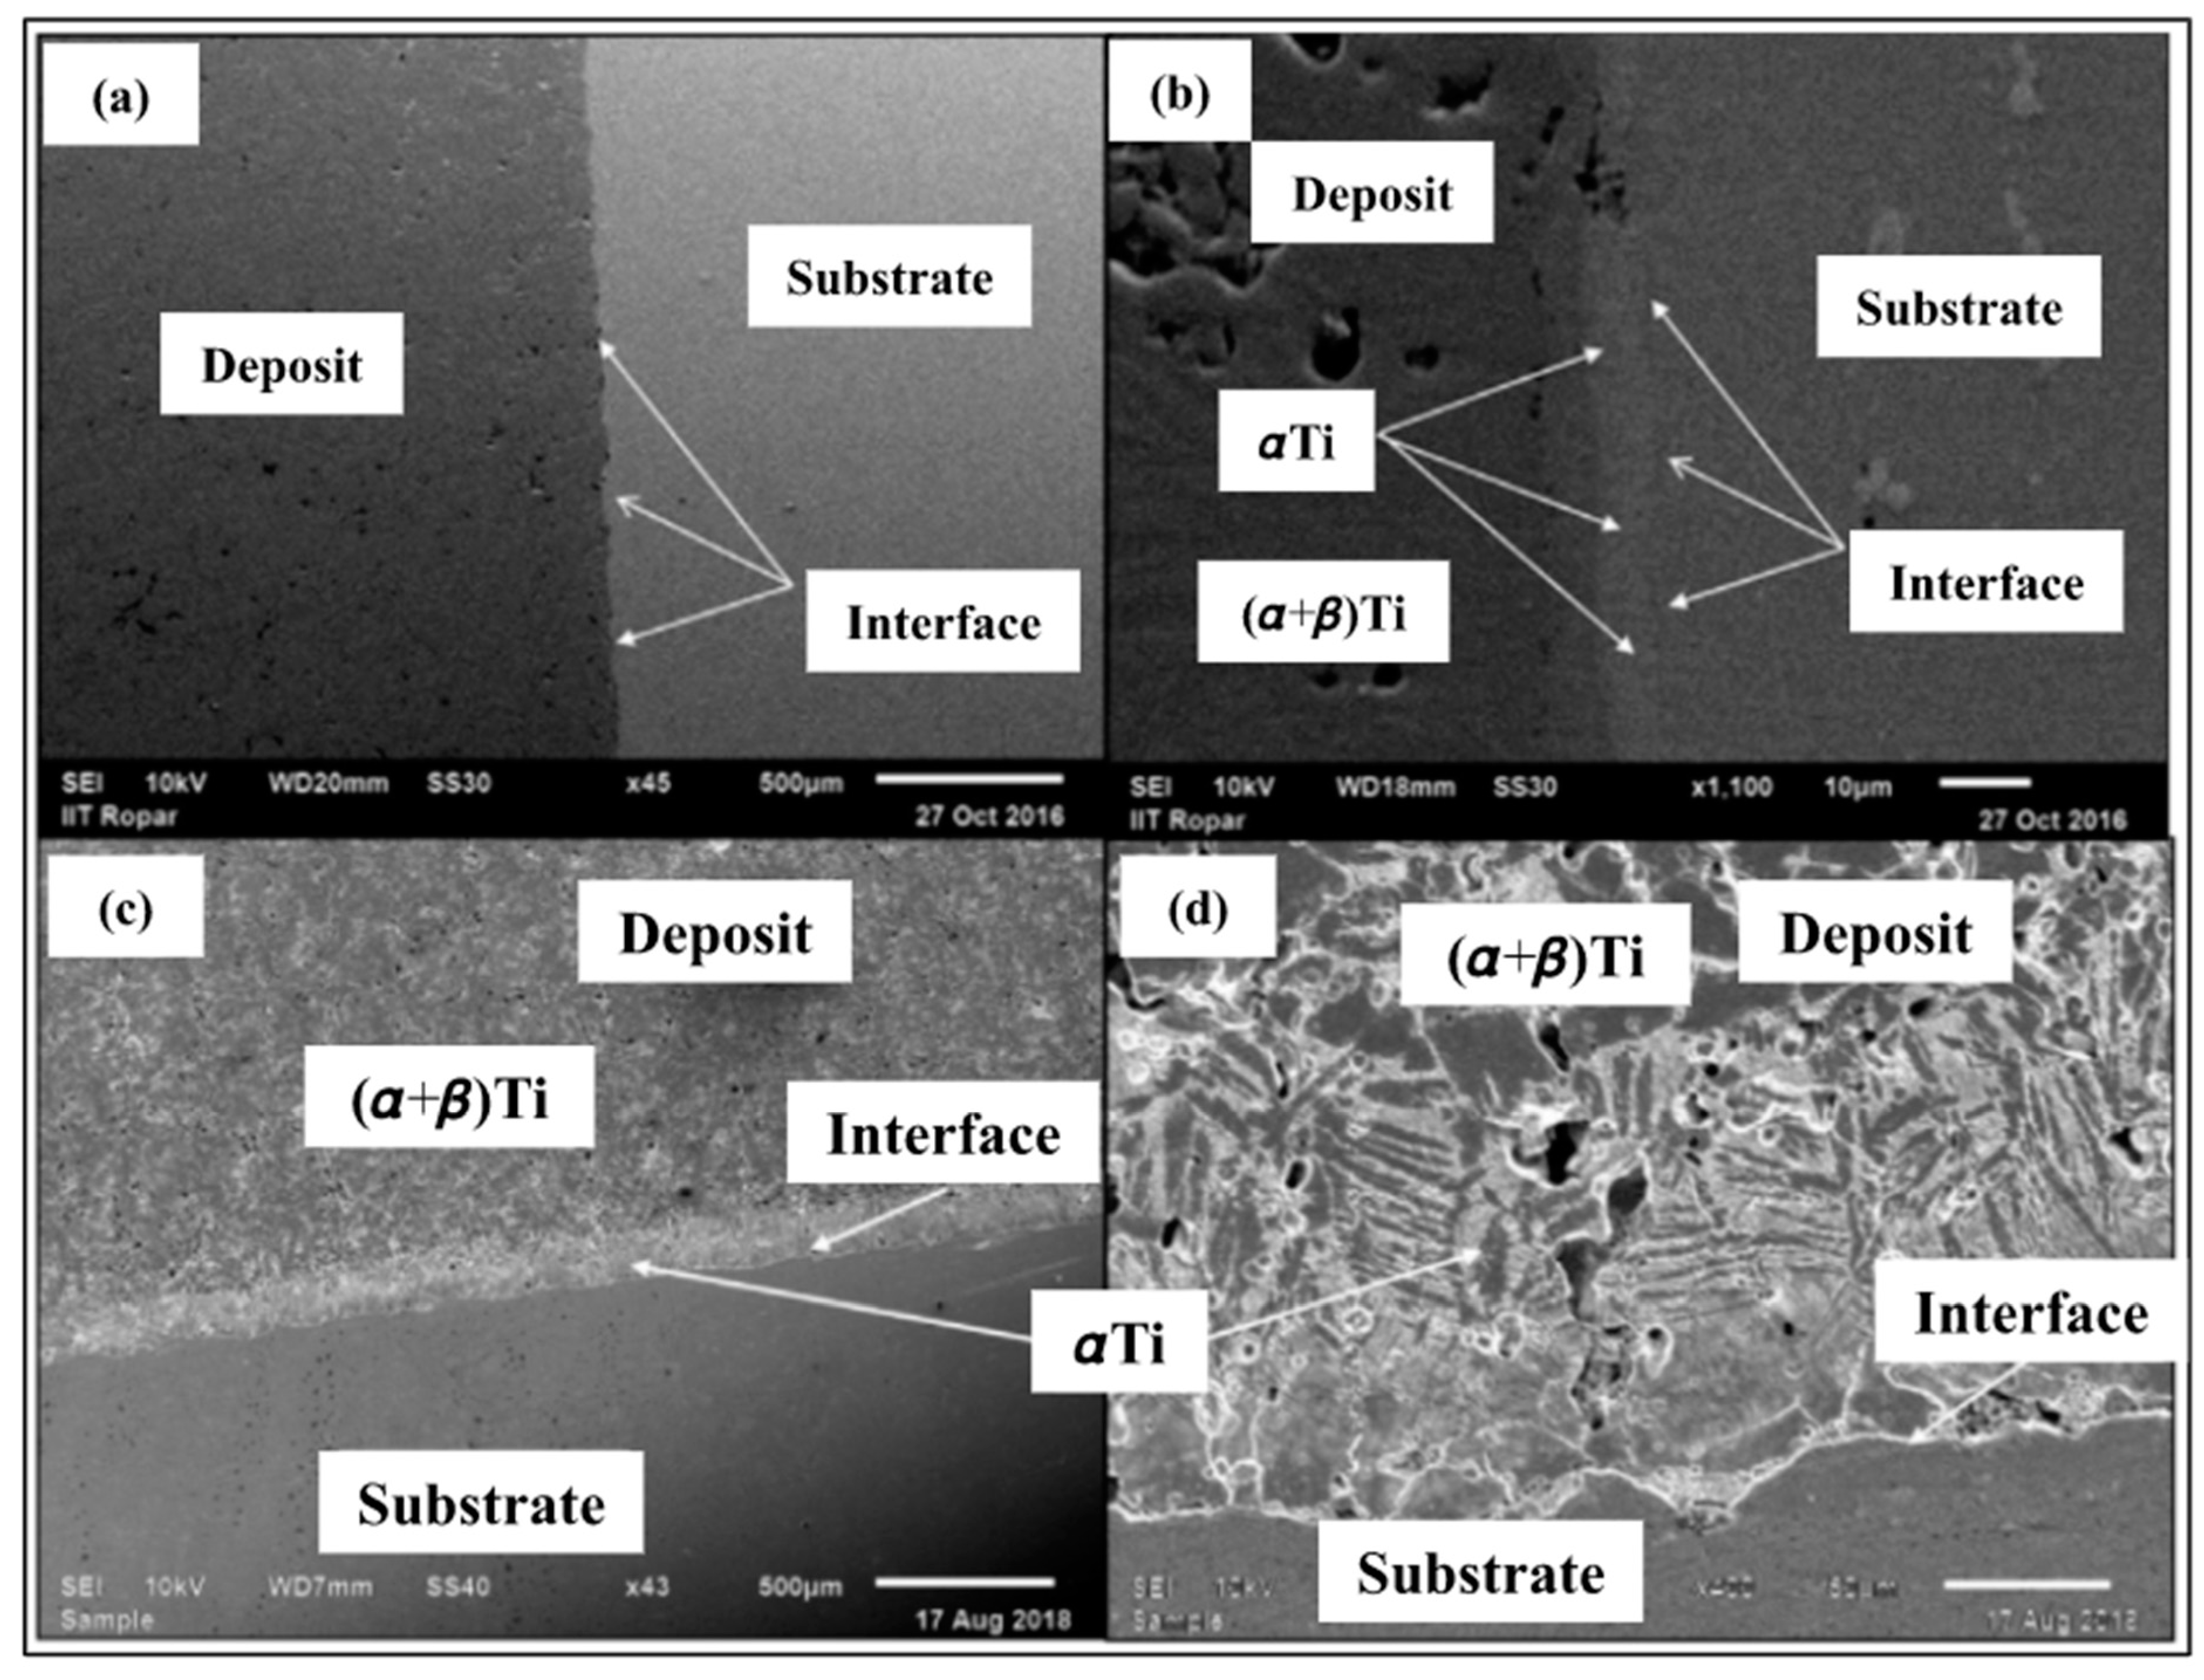
SEM images of the developed Ti deposit are presented in Figure 6. It can be seen from Figure 6a that there is no gap at the interface, which indicates appropriate adhesion between the substrate and the first layer of the deposit. This information can be useful if one is interested in developing Ti deposits on IN718. There were no cracks found in the Ti coating deposit. However, micron-sized inter-particulate pores, as well as weakly bonded inter-particulate boundaries, were found. These imperfections, cavities, and pores could be the result of inadequate plastic deformation of powder particles during deposition. It is worth mentioning as a side note that these features are very important in medical prostheses, such as orthopedic or dental implants, to act as nucleation sites for the cells to proliferate, aiding in osseointegration. Osseointegration helps in improving prosthetics for amputees.
A white layer at the interface was also observed. A high-magnification SEM image shown in Figure 6d also shows a bunch of bush-like structures (Widmanstatten) near the interface, which were further characterized as α-titanium via XRD (Figure 3) and microhardness analysis). The EDS mappings (
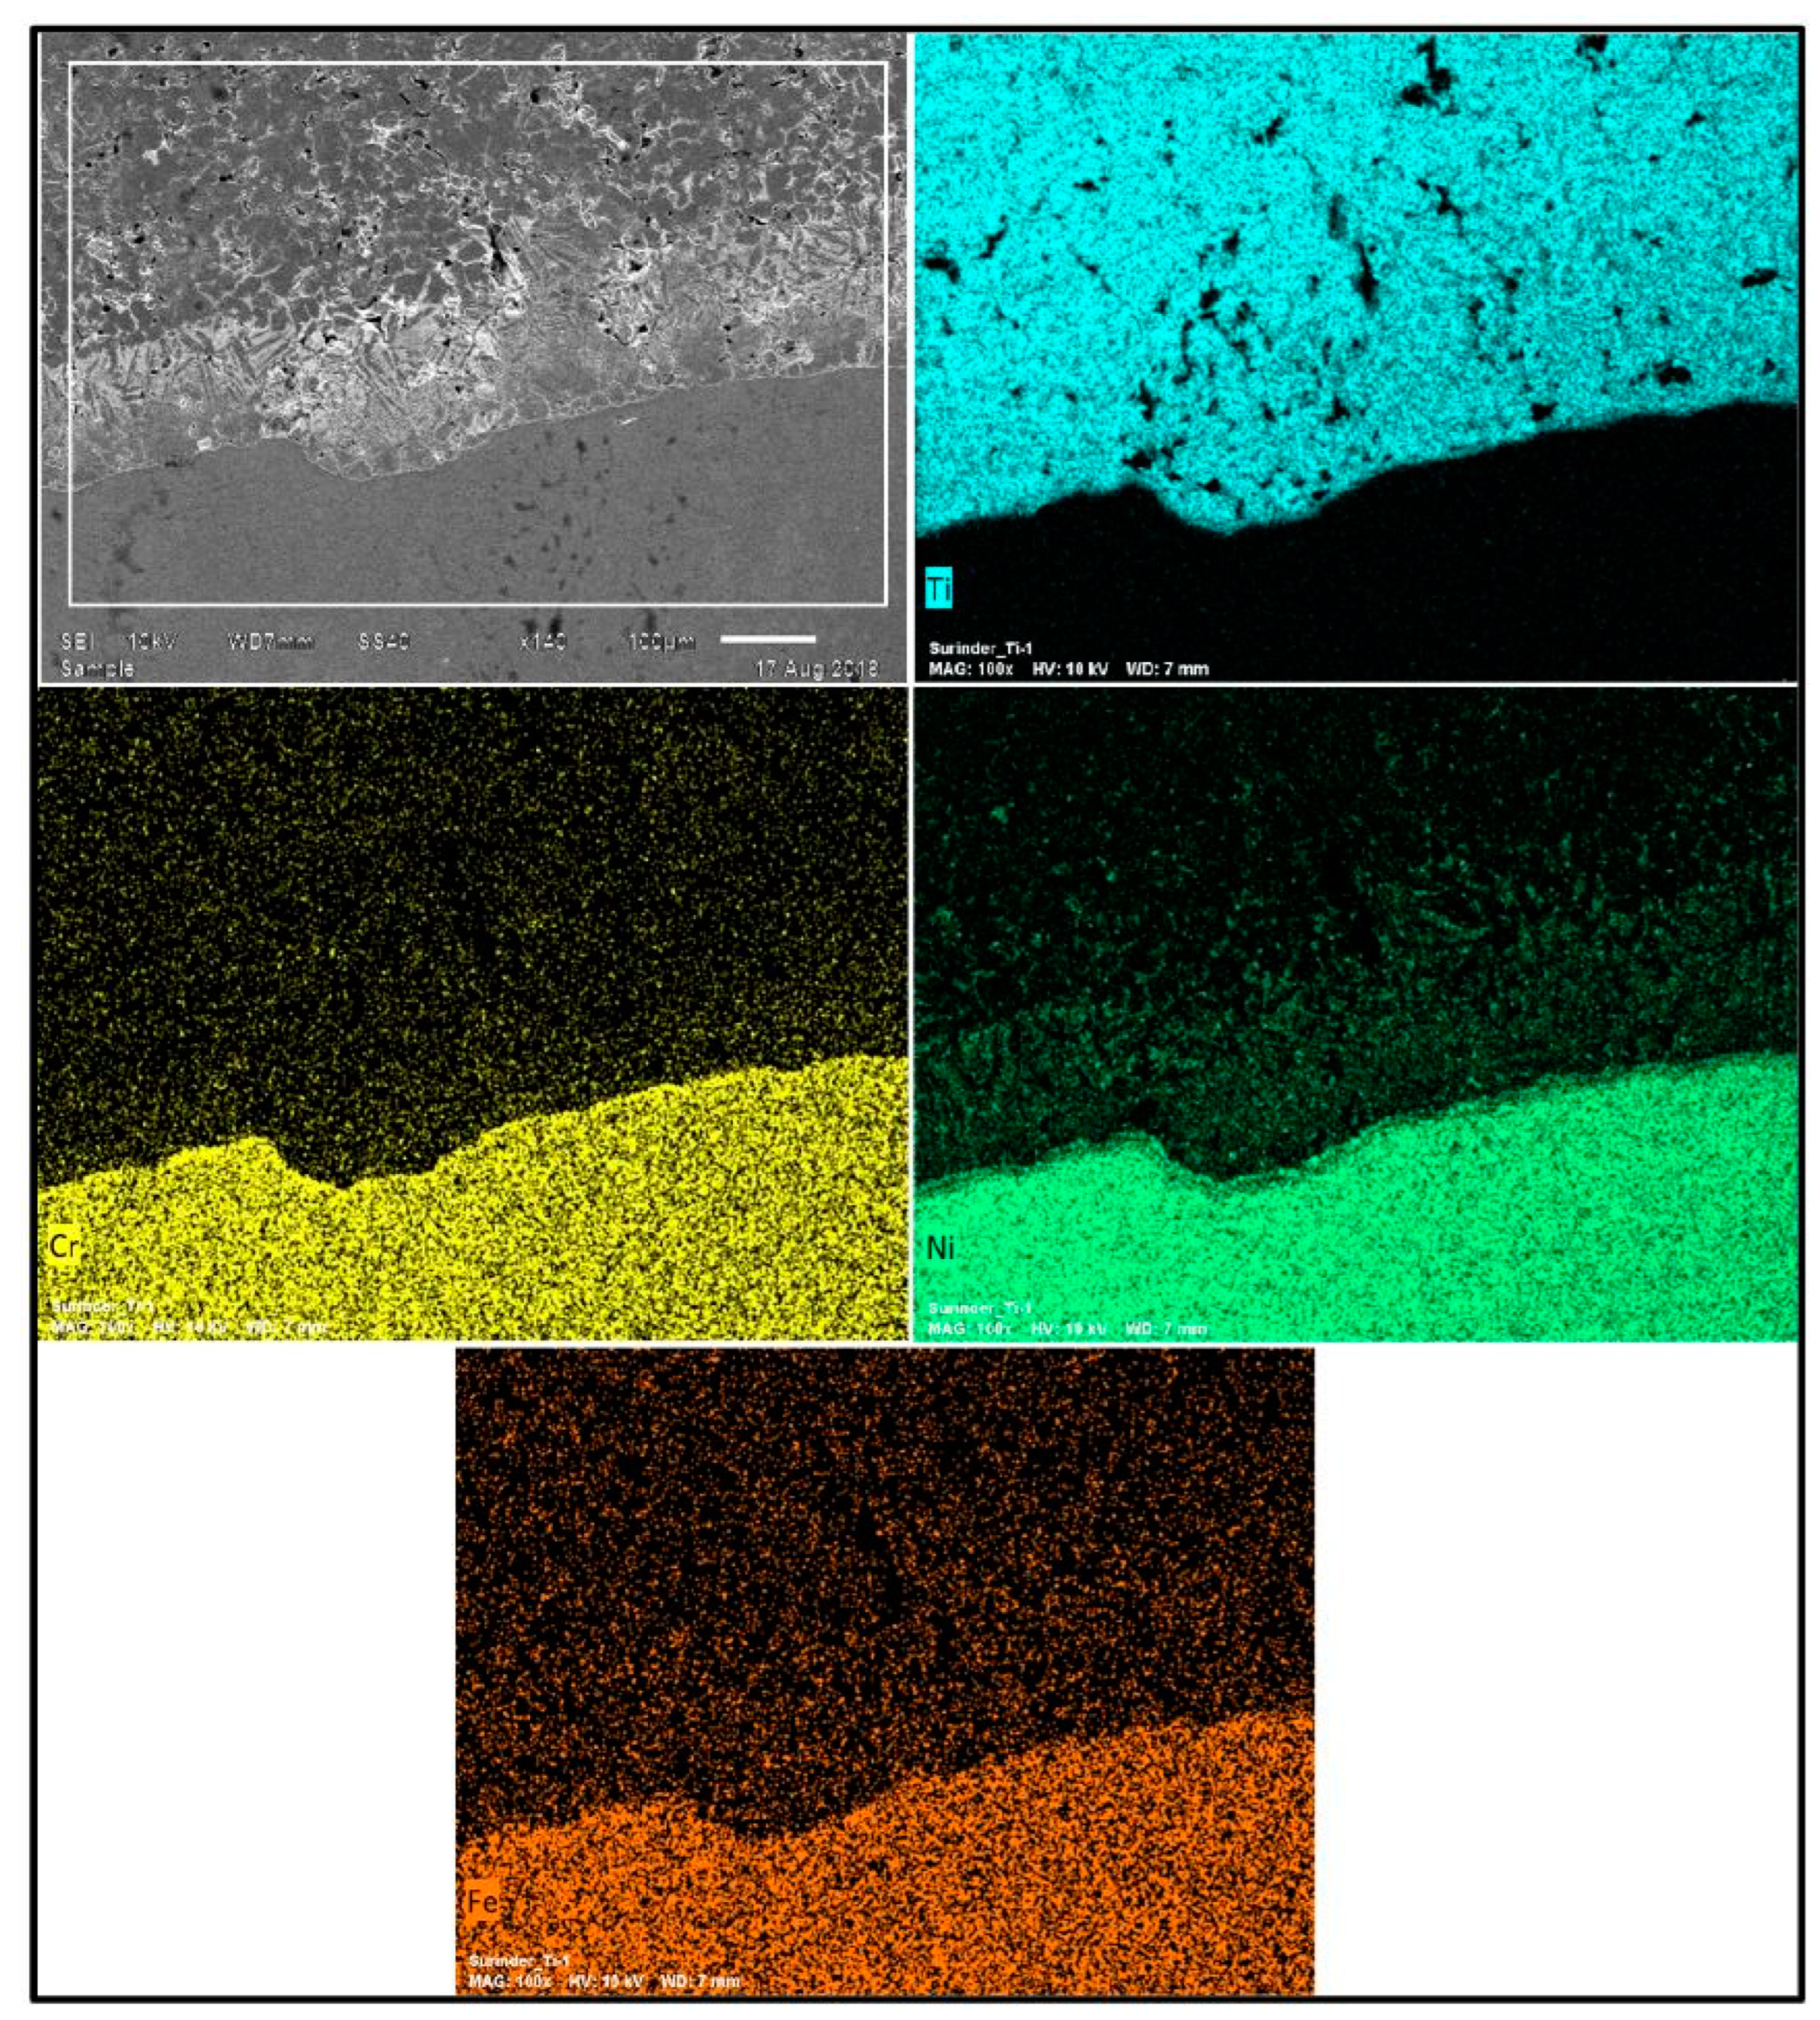
Figure 7) showed pure titanium on the deposit side and nickel, chromium, and iron on the substrate side. There was no oxide formation in the deposit during cold spraying and HIP processing, highlighting the capability of the used approach for the development of standalone pure titanium products. Moreover, no inter-diffusion across the Ti-layer and substrate material was observed. A microstructure comprising a variety of irregularly shaped particles and voids has been observed at the inter-particle boundaries. These voids were not noticeable in the un-etched sample (Figure 6a,b), while the mass loss due to attack by the etchant (Figure 6c,d) exposed the hidden pores. Therefore, it can be concluded that the un-etched surface can lead to the underestimation of porosity [16].
Figure 4 shows the XRD analysis of the developed HIP-treated Ti deposit near the interfacial area and inside the deposit performed by placing the sample in line with the mark of the XRD fixture, which indicates the sight of the XRD scan. XRD analysis of both areas indicates that no oxide phases were formed. This observation was also supported by the EDS analysis. This is a positive attribute regarding the development of pure-Ti products using the cold spraying process. Additionally, the absence of intermetallic phases at the interface proved that cold spraying (CS) is superior to conventional high-temperature additive manufacturing (AM) technologies in inhibiting the synthesis of brittle intermetallic phases at the multi-materials interface. The XRD analysis of the cold-sprayed HIP-treated deposit and the used powder showed the presence of both α- and β-titanium, while at the interface, only α-titanium peaks were observed. The presence of both the phases (α and β) in the titanium powder, as illustrated in Figure 4, was a result of the material’s unique phase diagram and the specific manufacturing processes used to produce the powder. At high temperatures (above the β transus temperature, typically around 882 °C or 1620°F), titanium exists in the β phase, which has a body-centered cubic (BCC) crystal structure. As the temperature decreases below the β transus, titanium undergoes a phase transformation to the α phase, which has a hexagonal close-packed (HCP) crystal structure. It is important to mention that the method used for making the feedstock titanium powder was atomization in this case. In this method, molten titanium is sprayed or atomized into fine droplets using high-pressure gas or other means. These droplets are rapidly cooled and solidified into powder particles. During the rapid cooling process, the material could become “frozen” in a metastable state, preserving both the α and β phases in the powder. This was because the cooling rate is so fast that the phase transformation from β to α may not have had time to complete before the particles solidified. The presence of only α-Ti peaks at the interface suggests that a transformation of β to α occurred in the titanium deposits. This transformation is often influenced by two main factors: rapid cooling from the β phase or α + β regions, which might have taken place after HIP, especially the interfacial region, which was closer to the substrate than the other part of the deposit, and plastic deformation during cold spraying, which induced this transformation. The fast cooling at the interface led to the formation of Widmanstatten-α laths. Moreover, the HIP treatment applied to the cold-sprayed Ti deposits resulted in the spheroidization of the colony microstructure within each β grain. This process produced a micro-duplex structure comprising primary α particles in a matrix of β grains/sub-grains. These β grains/sub-grains developed during the slow cooling of the deposit after HIP in contrast to the interfacial region. This is the reason for the α and β peaks in the case of the deposit, as depicted in Figure 4 [17,18].
The density for the cold-sprayed HIP-treated pure titanium sample was observed at 4.14 g/cc when determined using the Archimedes method, respectively. However, the density of the pure bulk Ti (manufactured through special casting machines) was measured as being 4.50 g/cc when determined using the aforesaid method. It is very challenging to produce a pore-free deposit of titanium powder using cold spraying (solid-state deposition) alone due to the irregularly shaped morphology of powder particles. Furthermore, owing to its low density and hexagonal closed-pack (HCP) crystal structure, it is very difficult to densify Ti [16]. Therefore, the HIP treatment of the thick Ti deposits has been performed to achieve a comparatively denser microstructure with a density approaching that of bulk Ti. An apparent surface porosity having a value of less than 1% has been achieved in a HIP-treated Ti deposit. However, pores with size variation from 3 to 10 µm have been observed in the deposit when measured using the Image-J analyzer. Relatively higher amounts of smaller pores (having a pore size ranging between 3 and 6 µm) have been observed as compared to that of larger pores (having a pore size range of 6–10 µm).

3.2. Mechanical Properties Evaluation

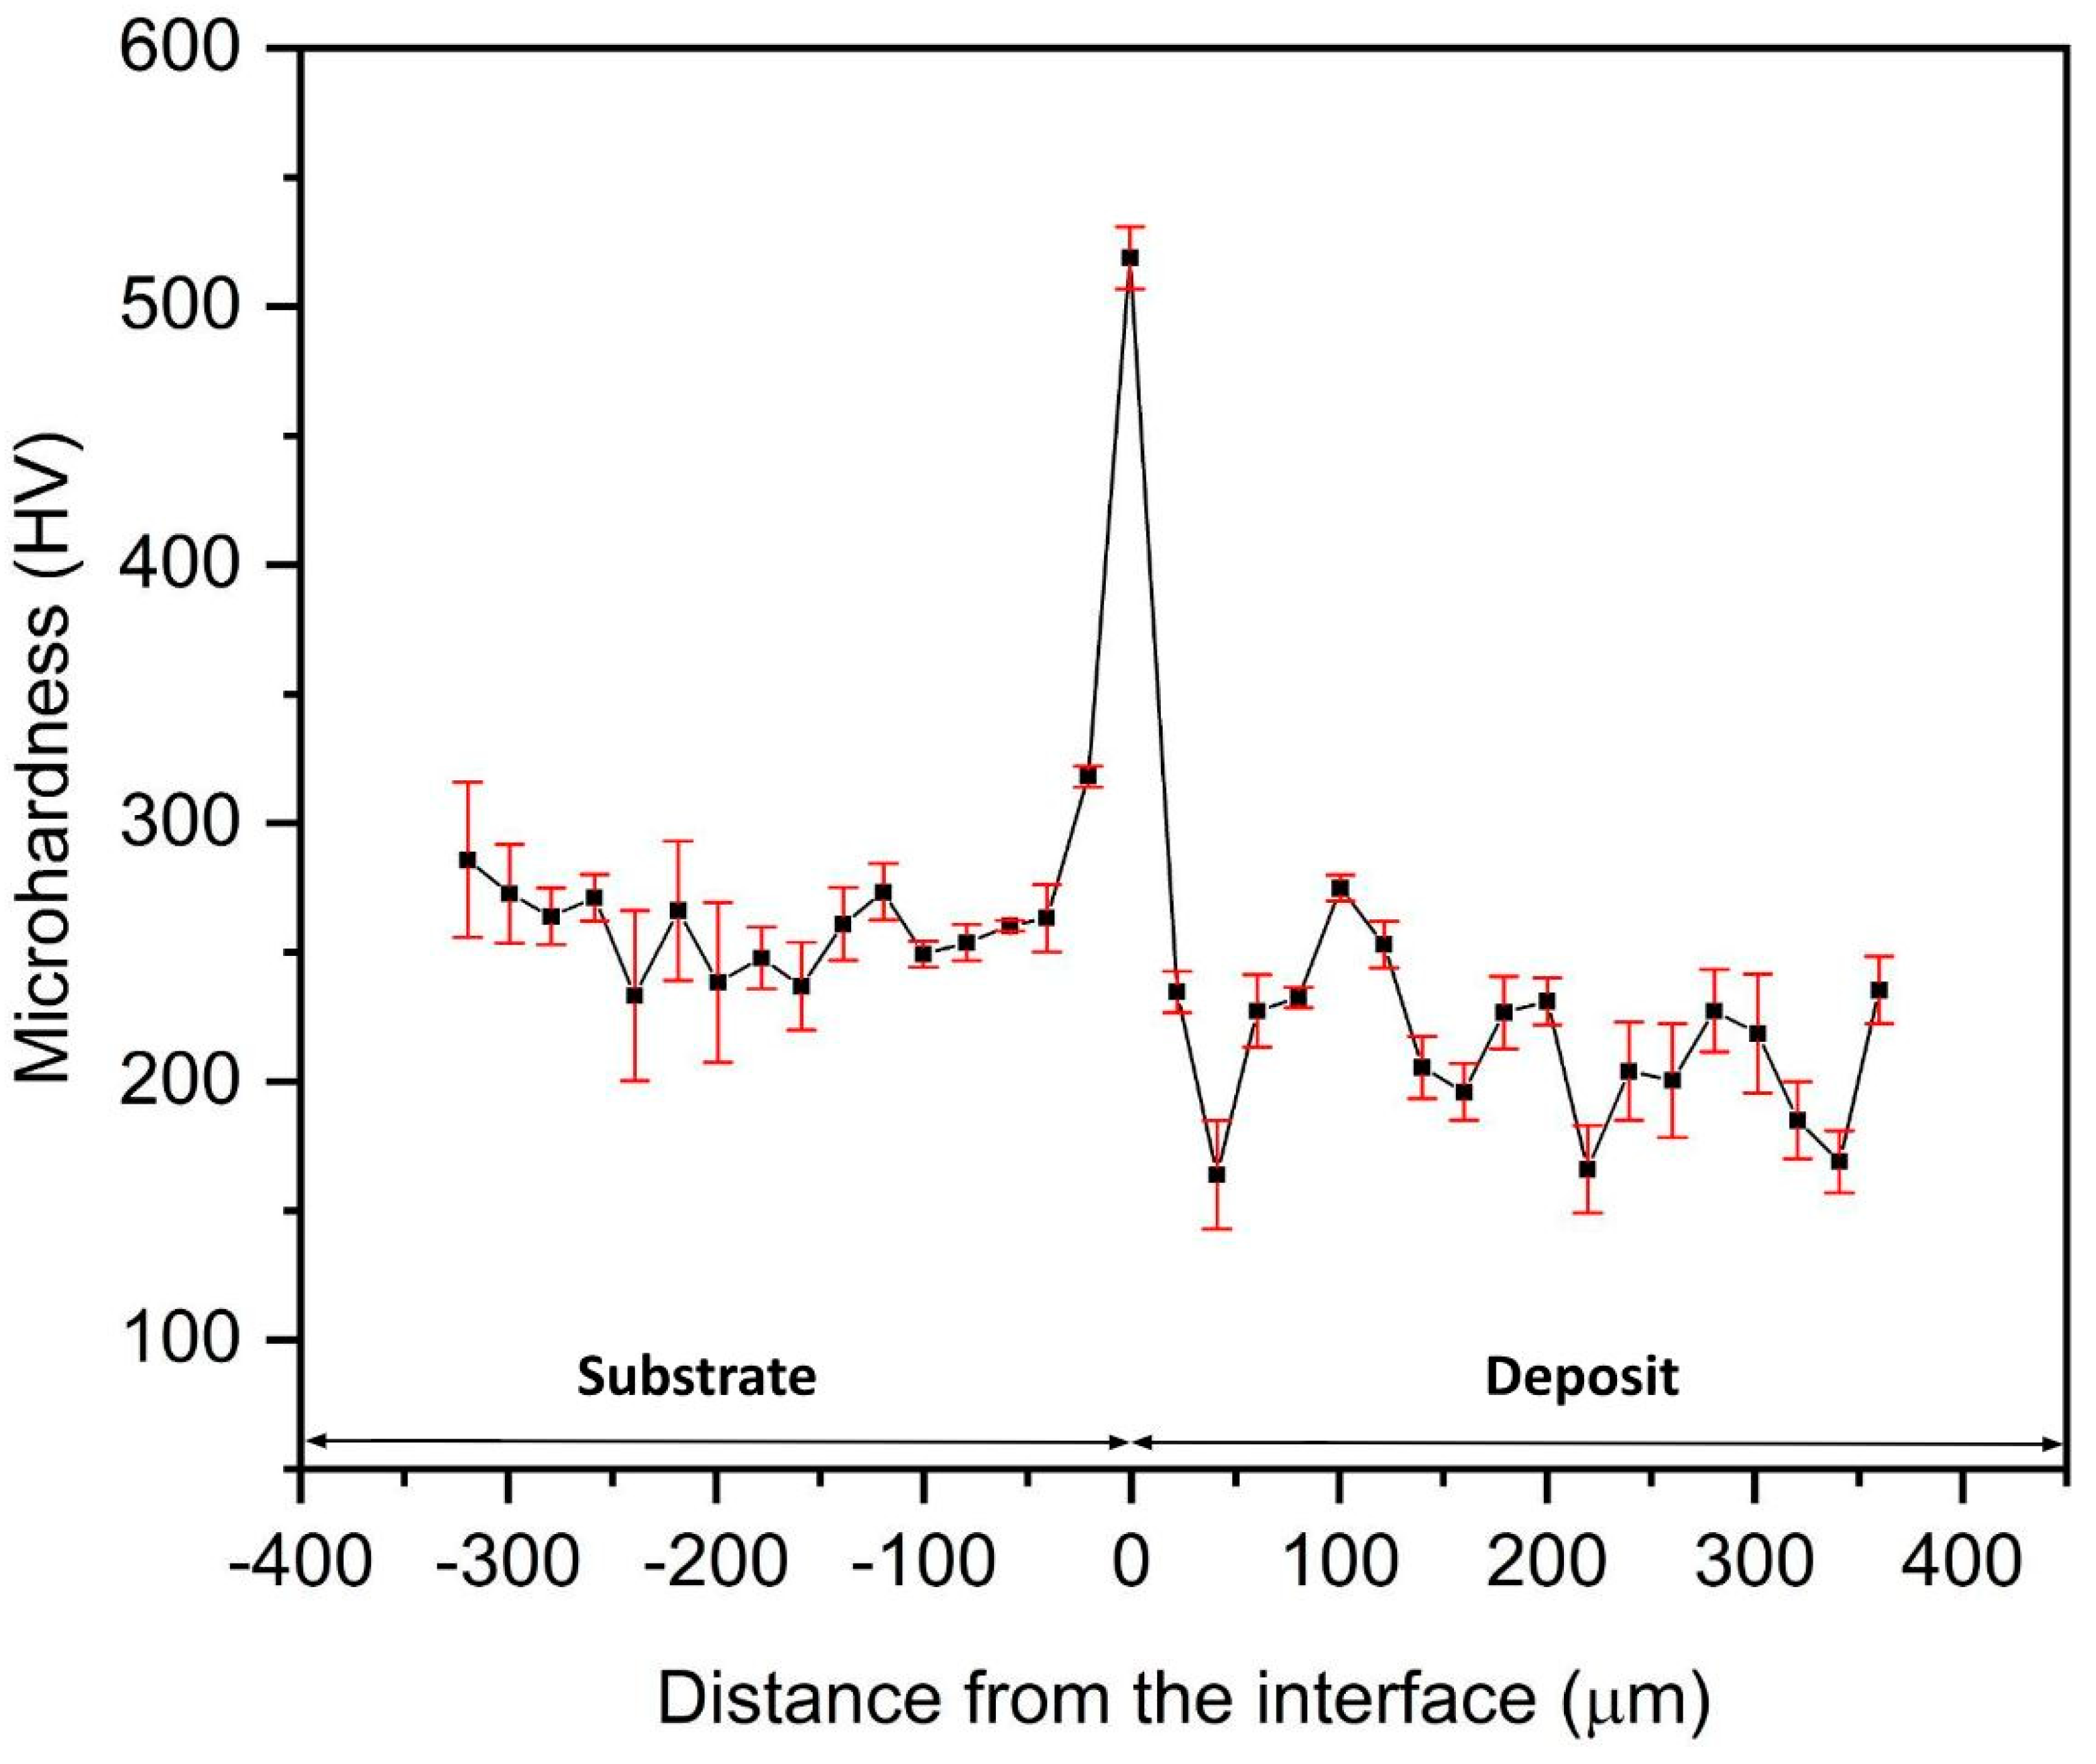
The microhardness plot (hardness v/s thickness) of the cold-sprayed HIP-treated pure titanium deposits is shown in Figure 8. The average microhardness of the Ti-layers is 214 HV, which is slightly higher than that of the commercially available bulk titanium (202 HV) [19]. The average microhardness value at the interface was observed as being 519 HV (at the white line observed in SEM images). This jump was observed because of the strain hardening of the substrate at the interfacial region due to the extremely high-velocity bombardment of the Ti particles. Additionally, it may be due to the presence of α phase, which has hexagonal close packing (HCP) compared to the β-phase possessing a body-centered cubic (BCC) crystal structure, leading to the greater hardness of the α phase compared to the β phase [19]. The transition elements in the substrate might have stabilized the α phase of titanium by lowering the β–α phase transition temperature during HIP treatment at 900 °C [20]. The XRD data (Figure 4) also established the stabilization of the α phase because β phase peaks were not seen in the XRD analysis at the interface [21].
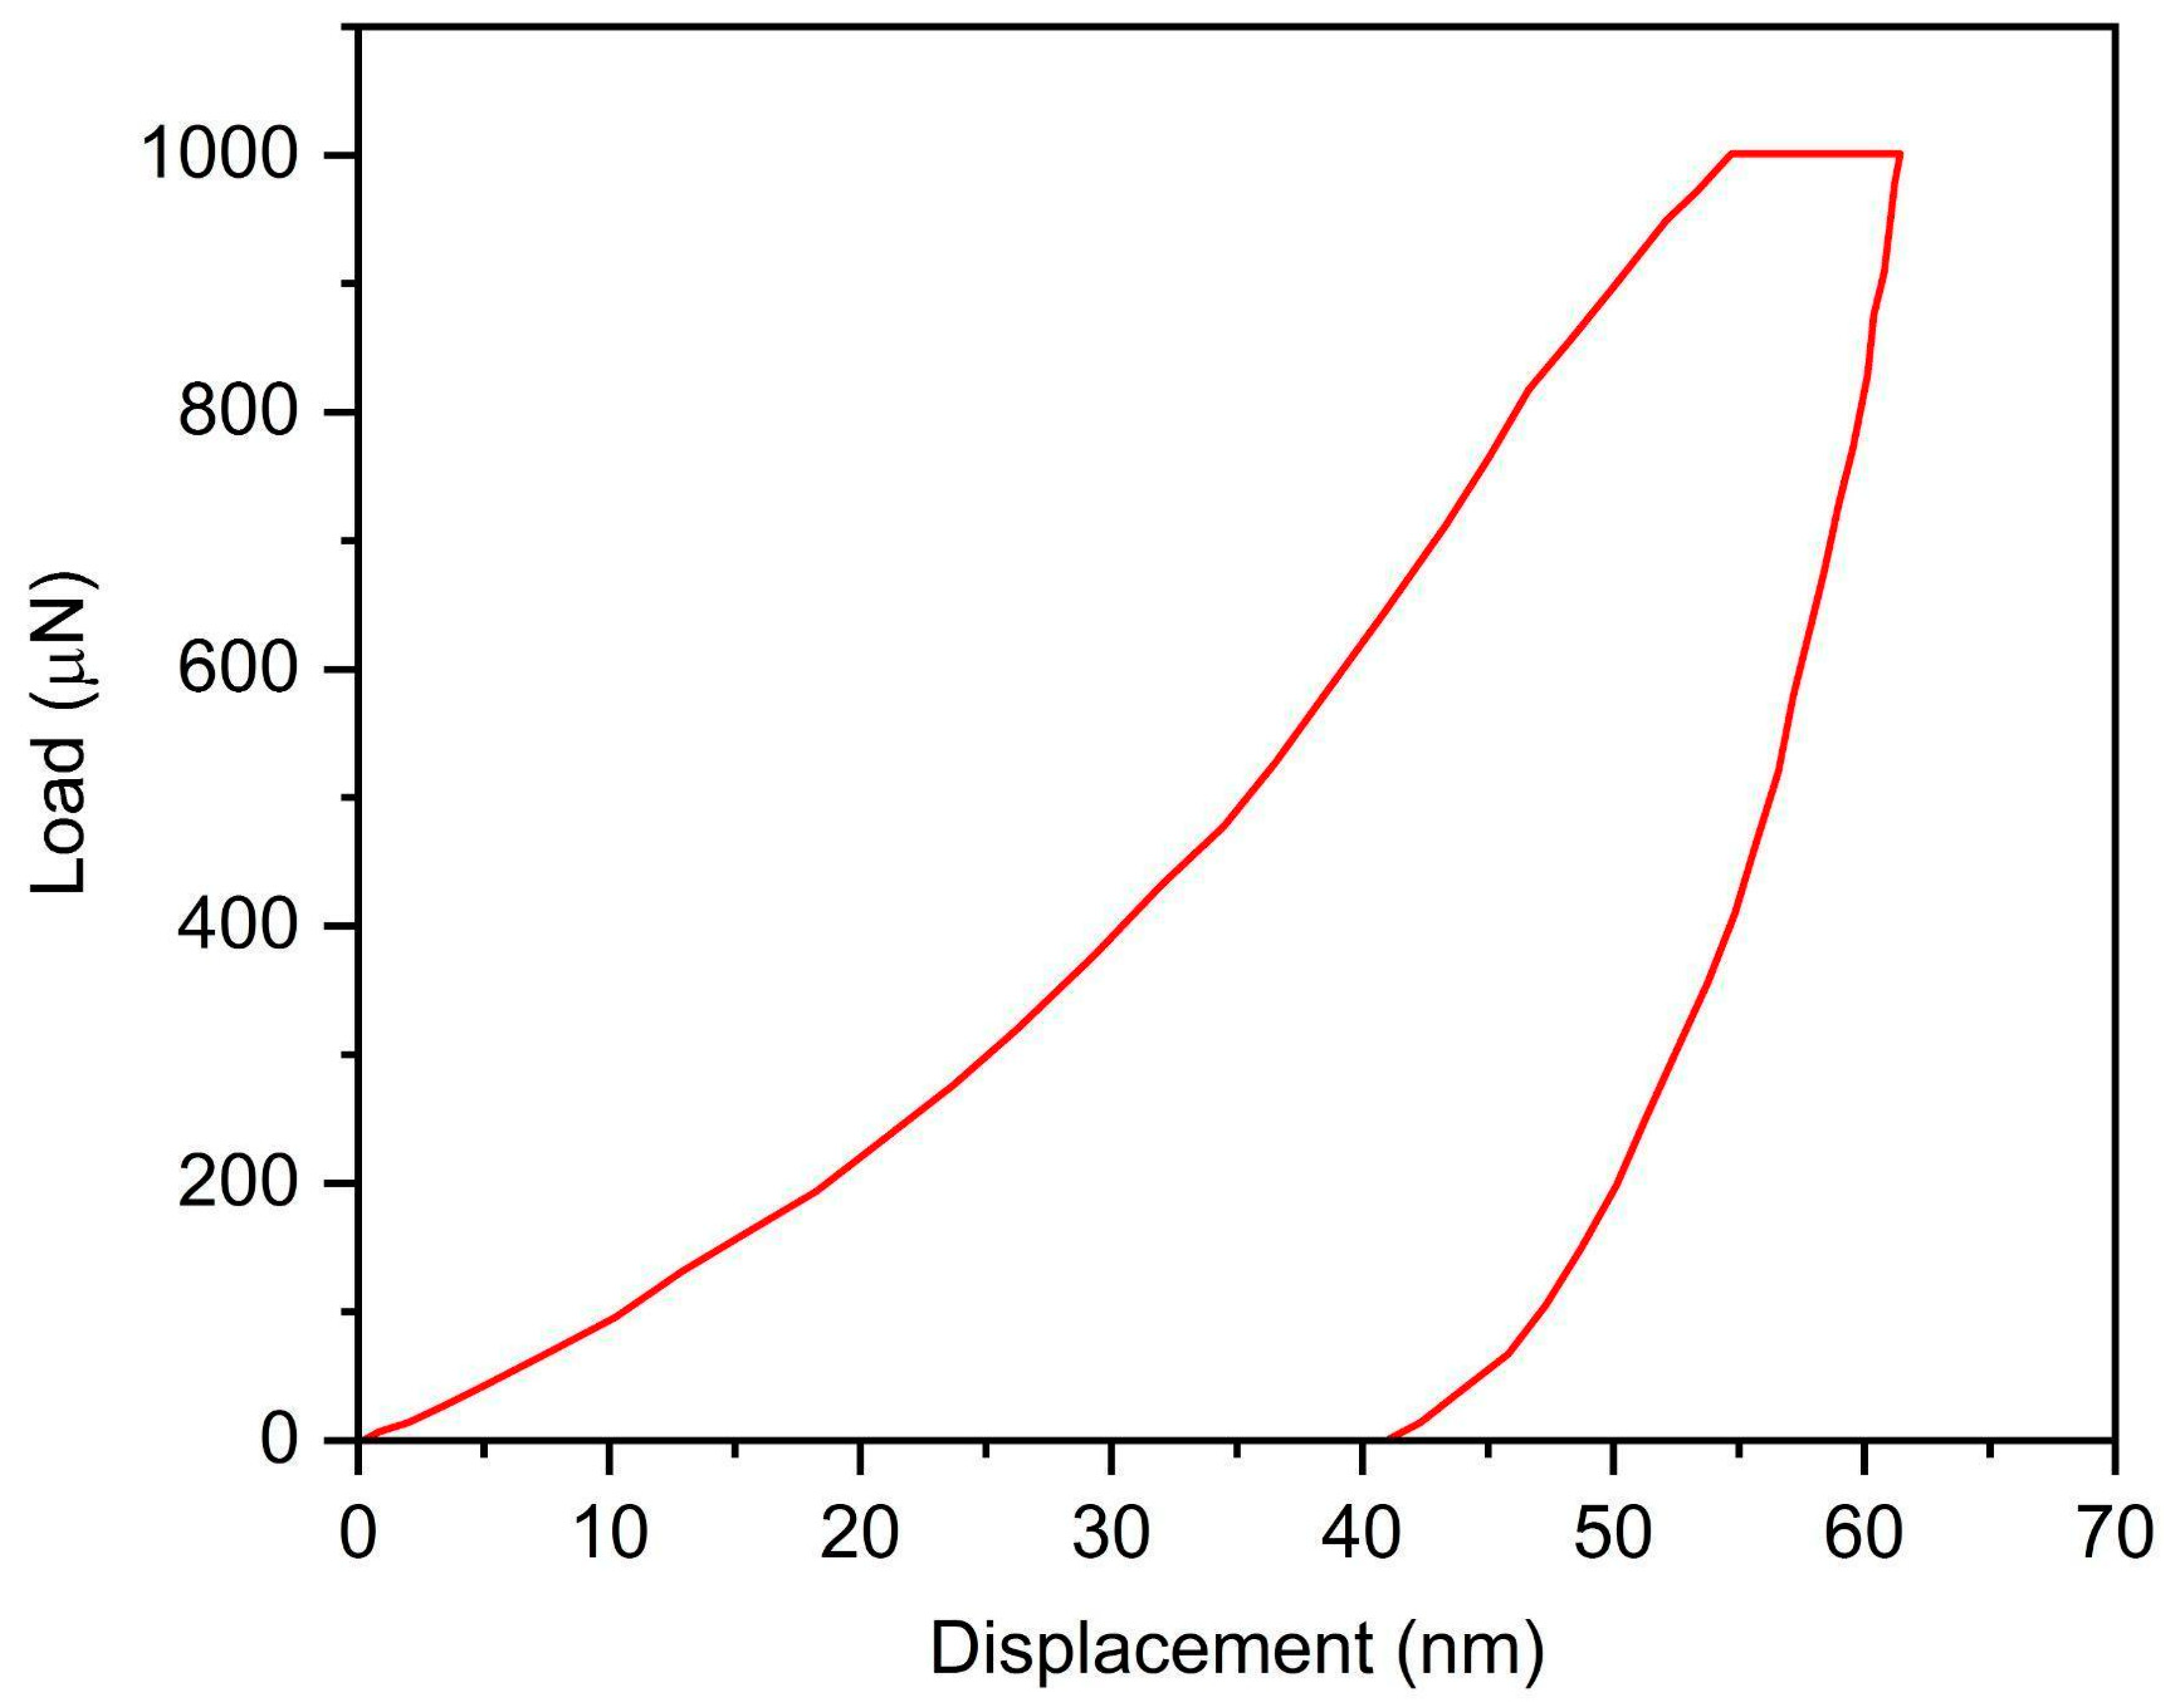
Localized mechanical properties of the deposited titanium without the substrate were measured via nanoindentation. The load–displacement curve is depicted in Figure 9. The nanohardness was found to be 5.2 GPa. Young’s modulus of the sample was found to be 148 GPa in comparison to 105–115 GPa of the bulk titanium [22]. The magnitude of Young’s modulus was found to be higher because the applied stress needs to first overcome the residual compressive stresses owing to cold spraying and HIP treatment before straining the material. It may also be due to individual particle sampling in nanoindentation, which offers less in terms of contribution from pores/oxides [19].
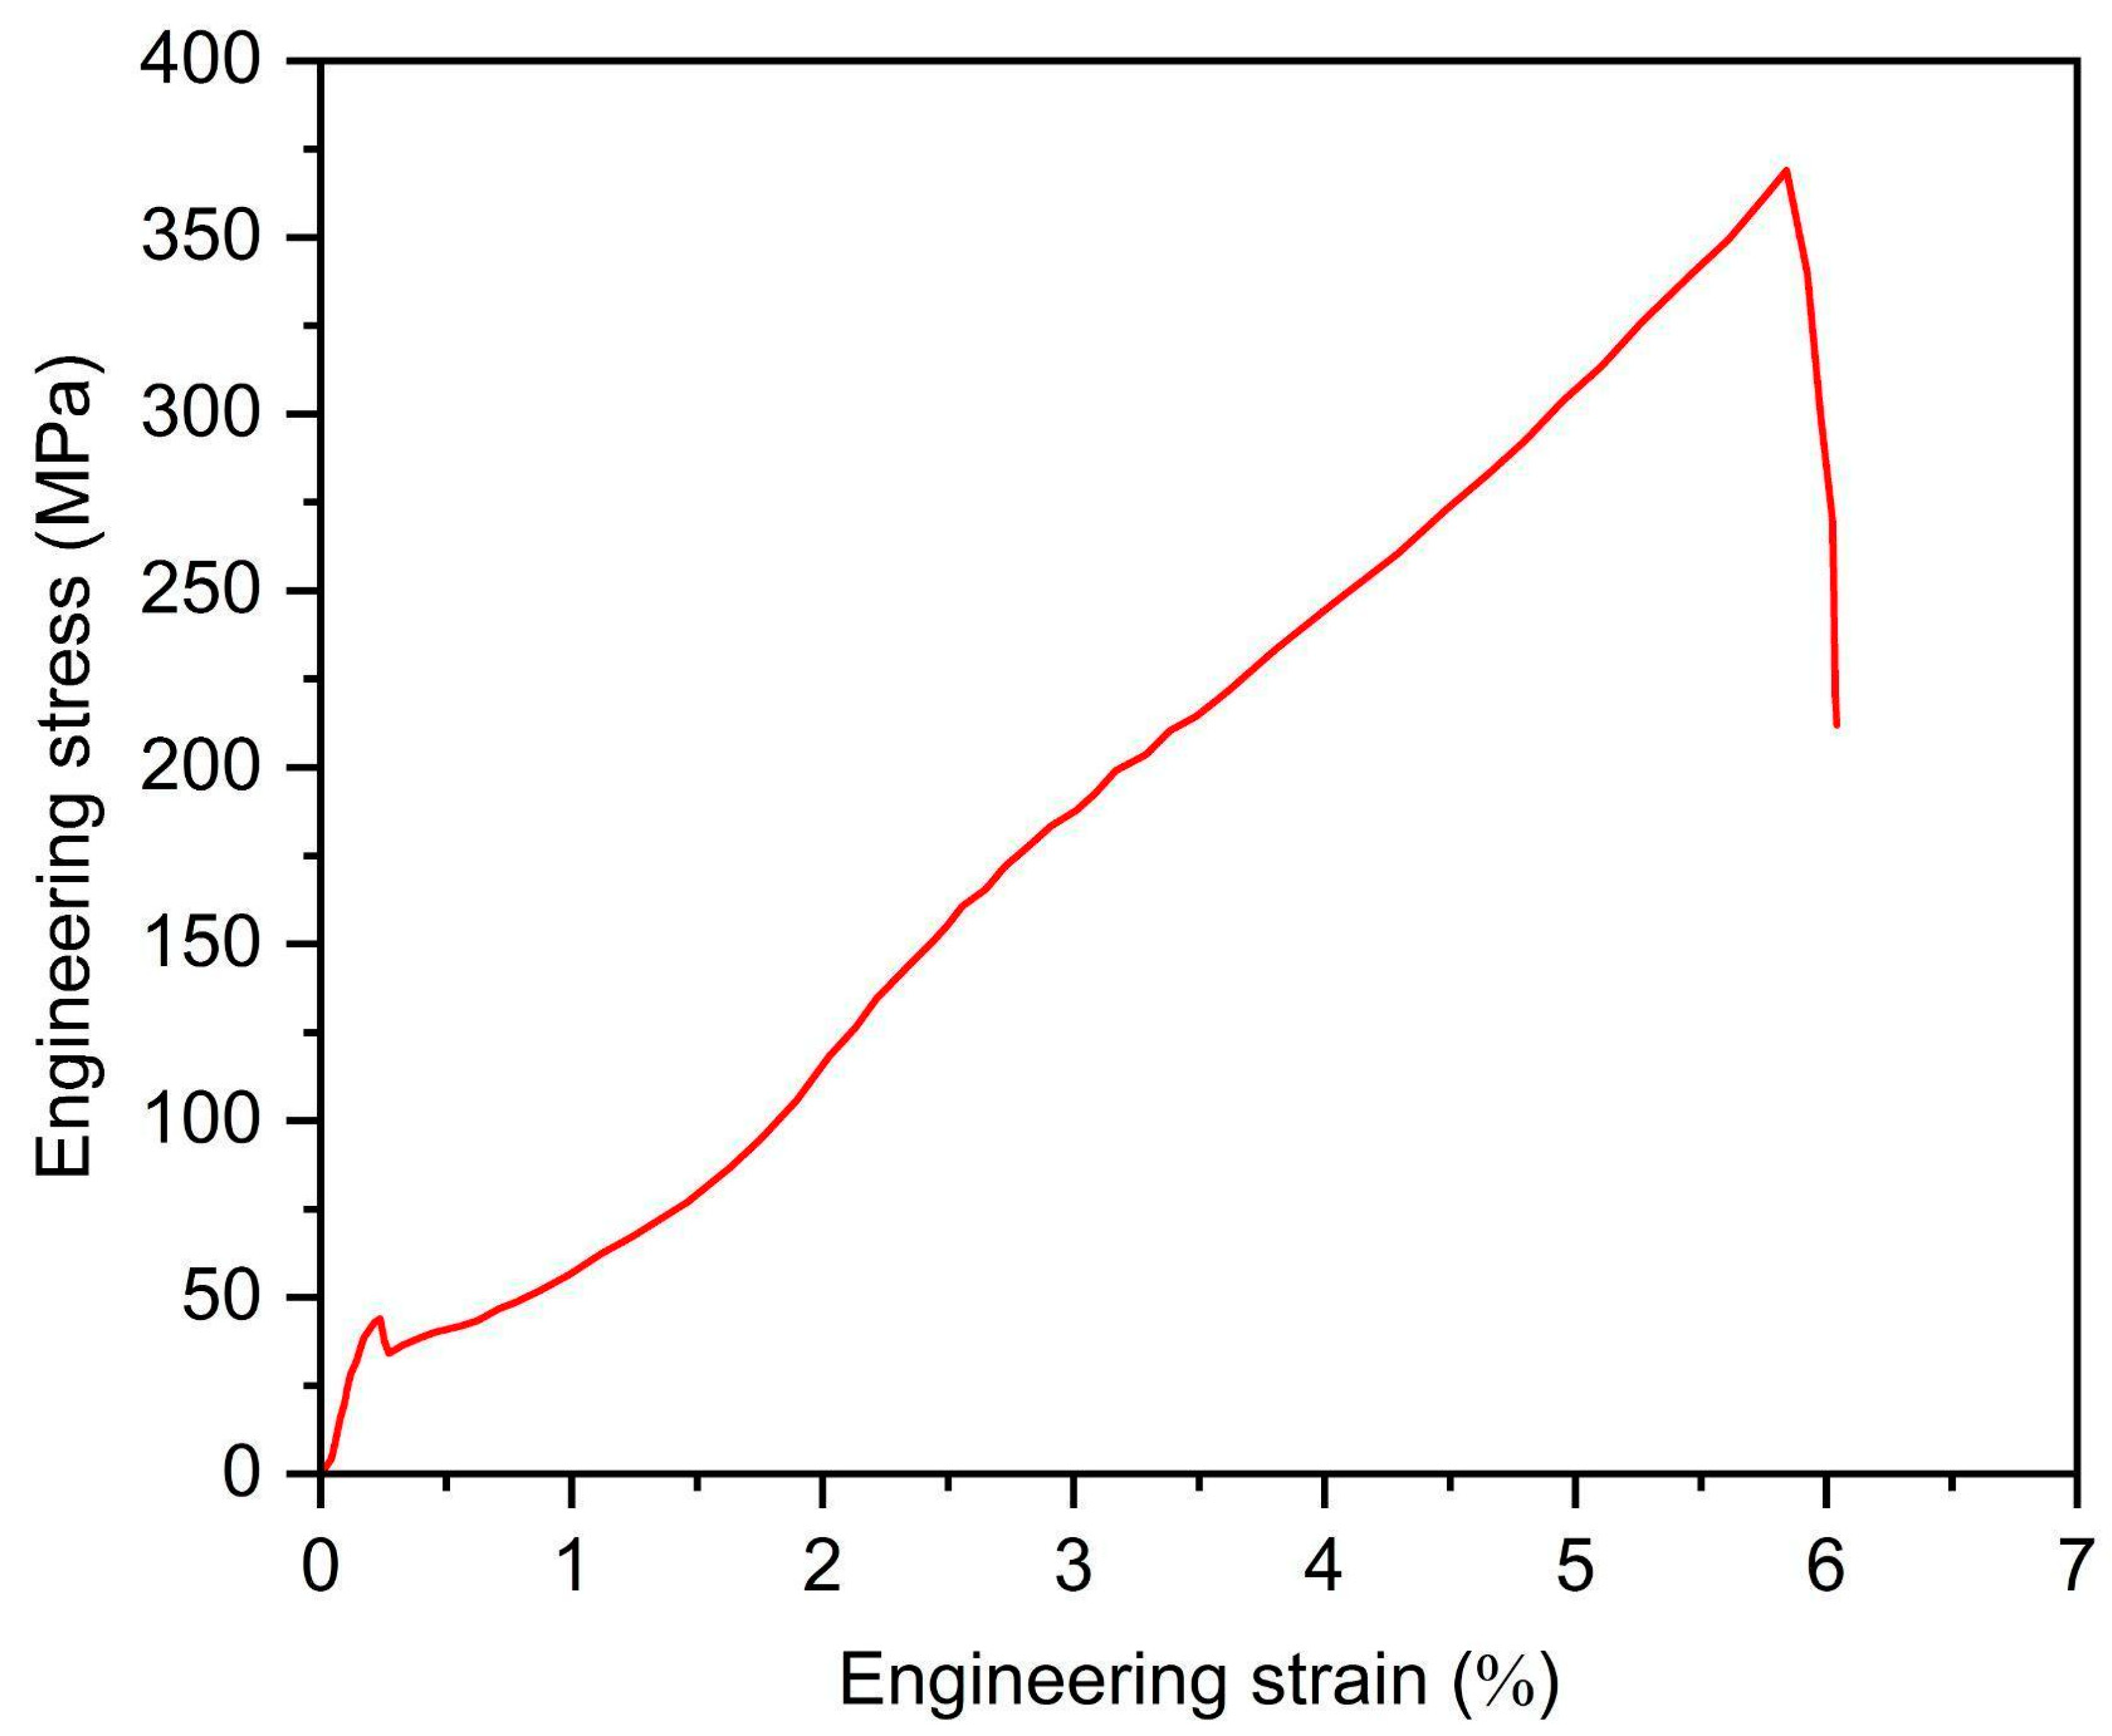
The ultimate tensile strength (UTS) was found to be 384 MPa, with a total elongation of 6%, as represented in Figure 10. The UTS achieved in the present study is more than that achieved by Hussain et al., which was 247 ± 15 MPa for titanium deposit sprayed with a commercially available CGT system using nitrogen at 800 °C at 4.0 MPa. Additionally, the achieved UTS was near to the UTS of bulk titanium (434 MPa) [22]. This may be due to the HIP treatment of as-sprayed titanium, which led to lesser porosity and higher UTS. It is well known that the elongation can be augmented via the post-heat treatment routes available in the literature.
The shear strength between the first layer of the deposit and the substrate was found to be 26 MPa. This poor adhesion may be due to the formation of a hard face (α-titanium) near the interface. Additionally, the diffusion coefficient of HCP α-titanium is lower than the diffusion coefficient of BCC β-titanium due to the dense packing of atoms in HCP α-titanium [22]. This decreased diffusion and formation of the hard phase of HCP α-titanium at the interface might have led to poor metallurgical bonding at the interface. It is pertinent to mention that this lower shear strength is beneficial with regard to the AM aspect of cold spraying, as one has to remove the substrate in the case that a standalone structure of Ti is required to be manufactured.
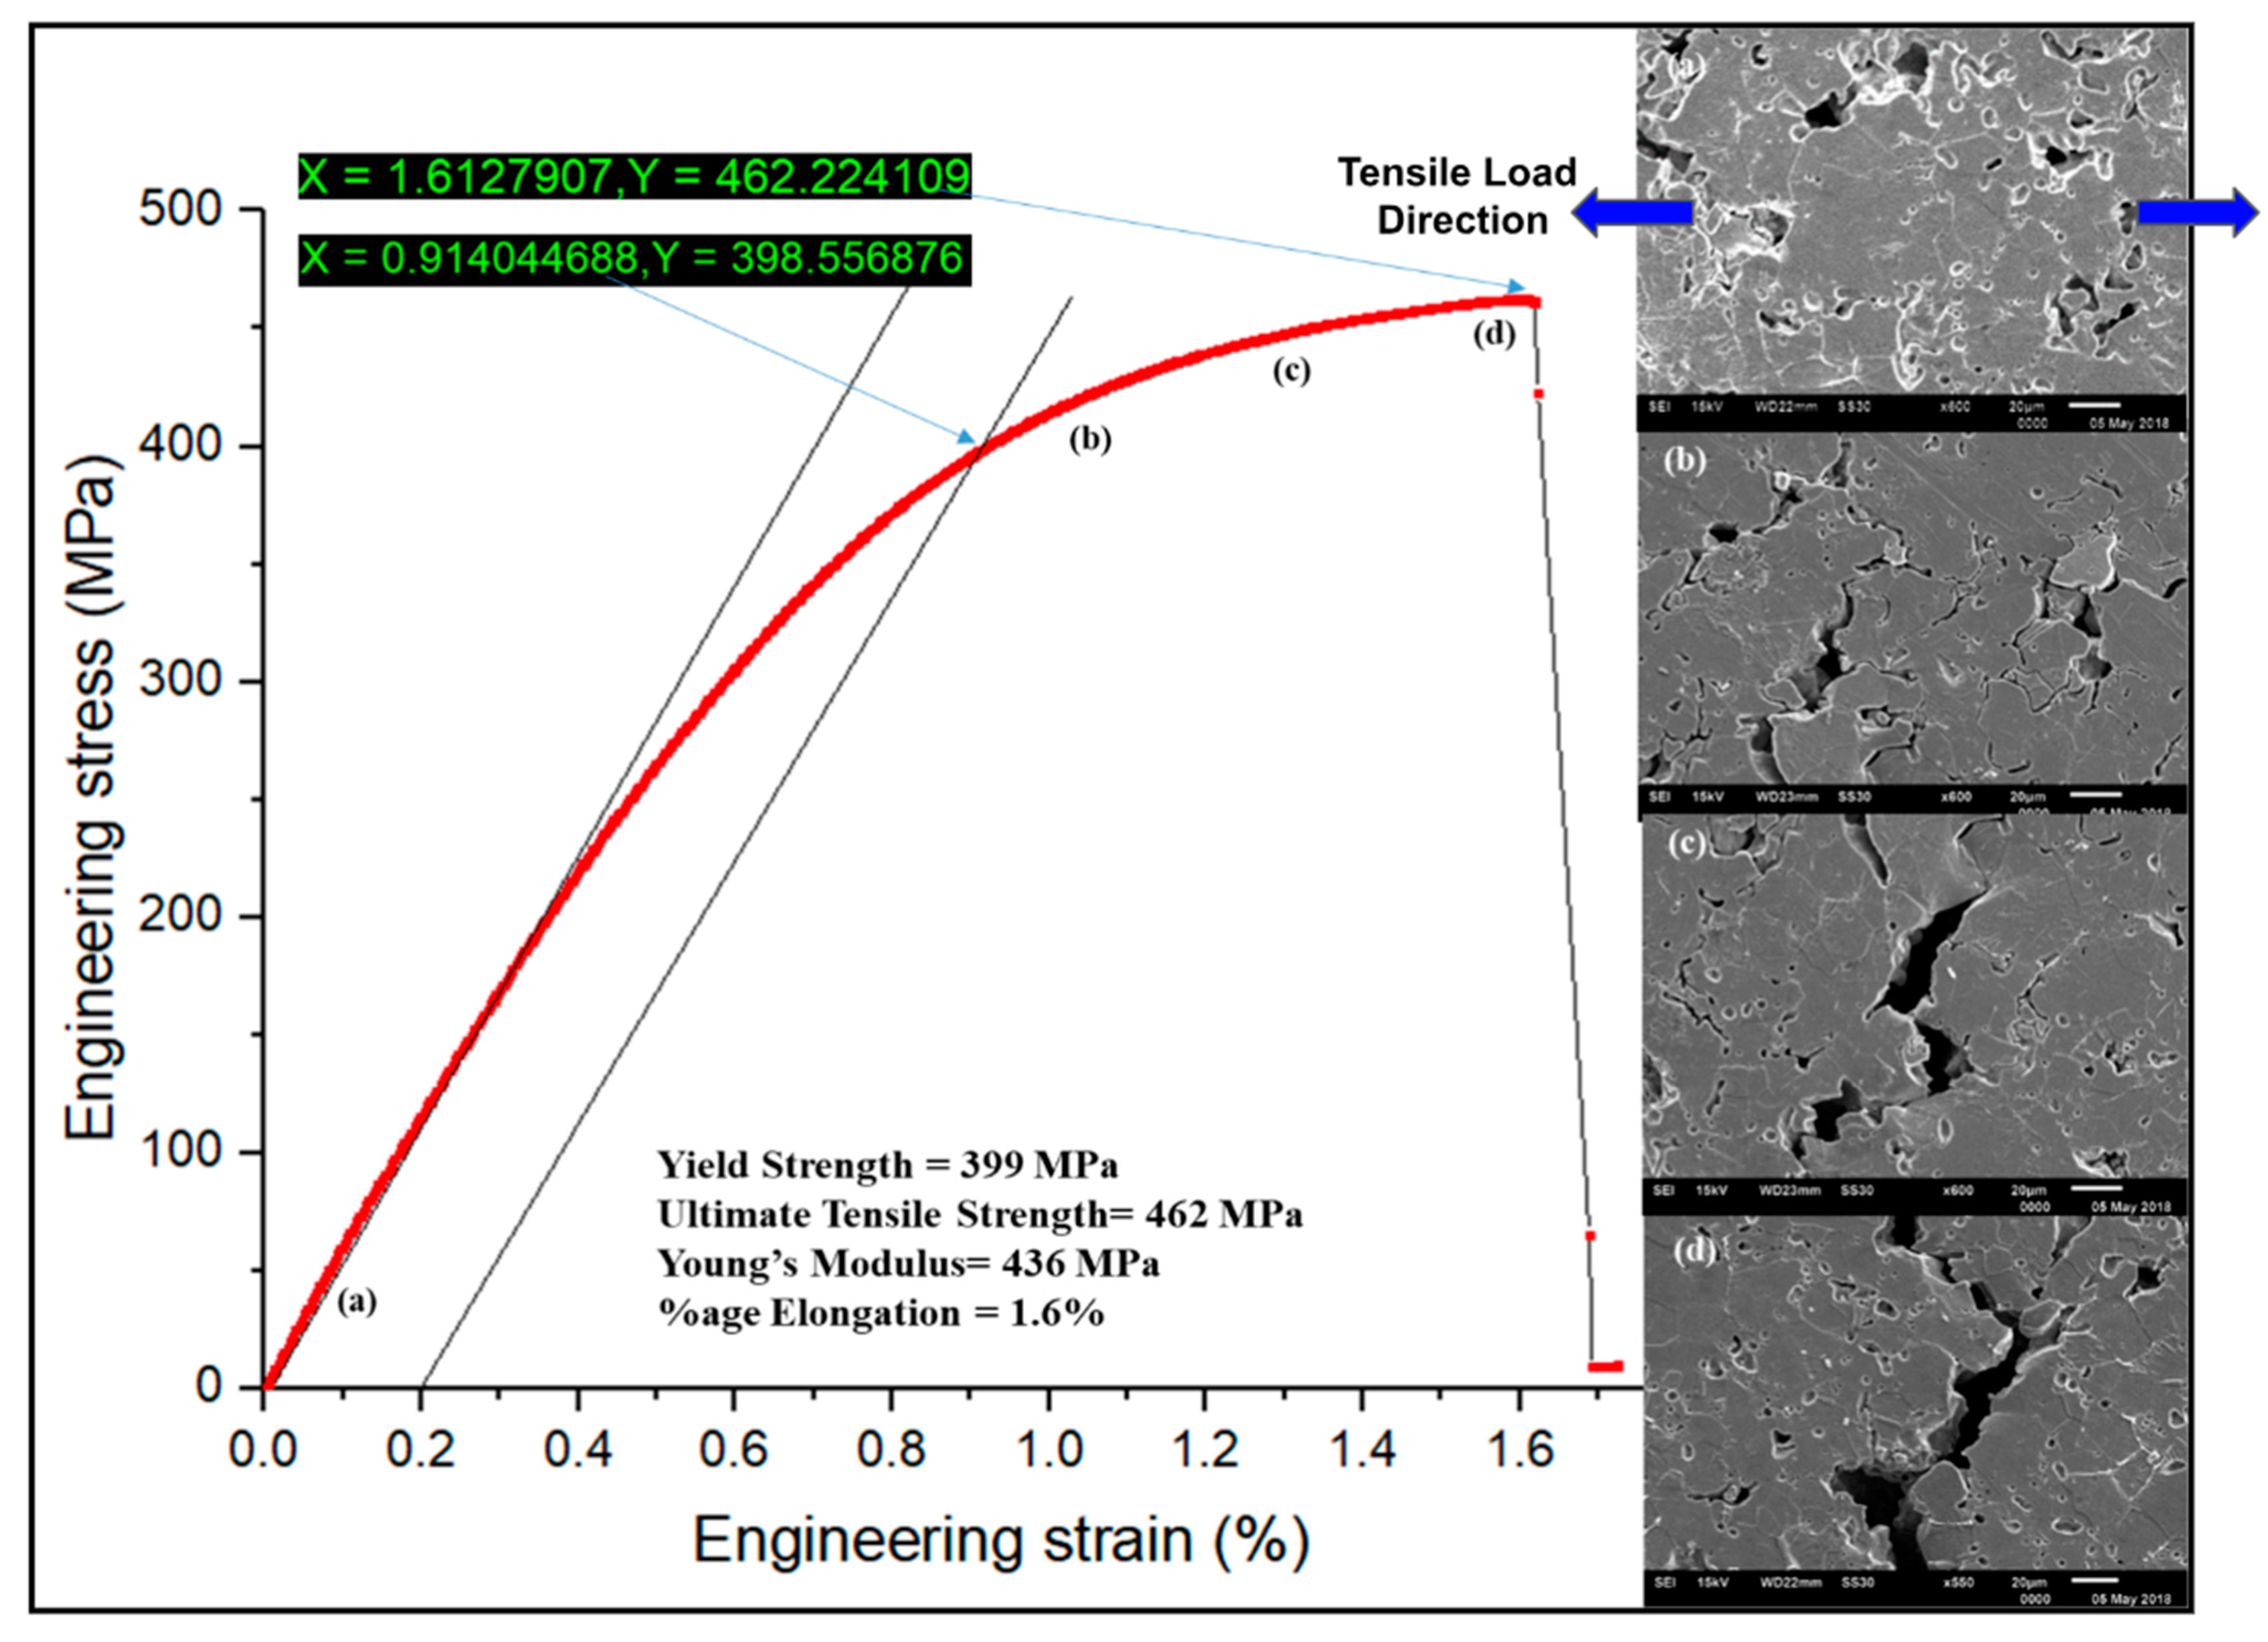
Micro-tensile plot showing engineering stress versus engineering strain, along with the corresponding SEM images at various stages, is shown in Figure 11. A complete brittle nature of the fracture can be observed from the tensile curve. The ultimate tensile strength was found to be 462 MPa, with an elongation of 1.6% only. Moreover, micro-UTS was found to be higher than macro-UTS. It may be due to the polishing performed on the micro-tensile sample. A finely polished surface might have delayed the crack initiation, which led to higher yield strength and UTS. Young’s modulus achieved by micro-tensile (436 MPa) is higher than that achieved from a macro-tensile sample (281 MPa); however, it is very less than that observed during nanoindentation (143 GPa). The lower modulus in macro-tensile compared to micro-tensile analysis could be attributed to the polishing of samples required for micro-tensile for in situ analysis in SEM. It has been reported that the sprayed deposits have a significantly lower modulus often as compared to bulk material because of less compliance between the splats [23]. Moreover, higher values achieved through nanoindentation may be due to individual particle sampling, which offers less contribution from pores/oxides.
It was also observed during the in situ tensile testing that no cracks were nucleated (Figure 11a) till 399 MPa (Yield strength). The cracks started nucleating from the pore boundaries above the yield point, as represented in Figure 11b. Further, straining of the material led to the propagation of cracks through the splat boundaries. The cracks passed from pore to pore through the splat and grain boundaries (Figure 11c). The final fracture of the material showed a brittle nature (
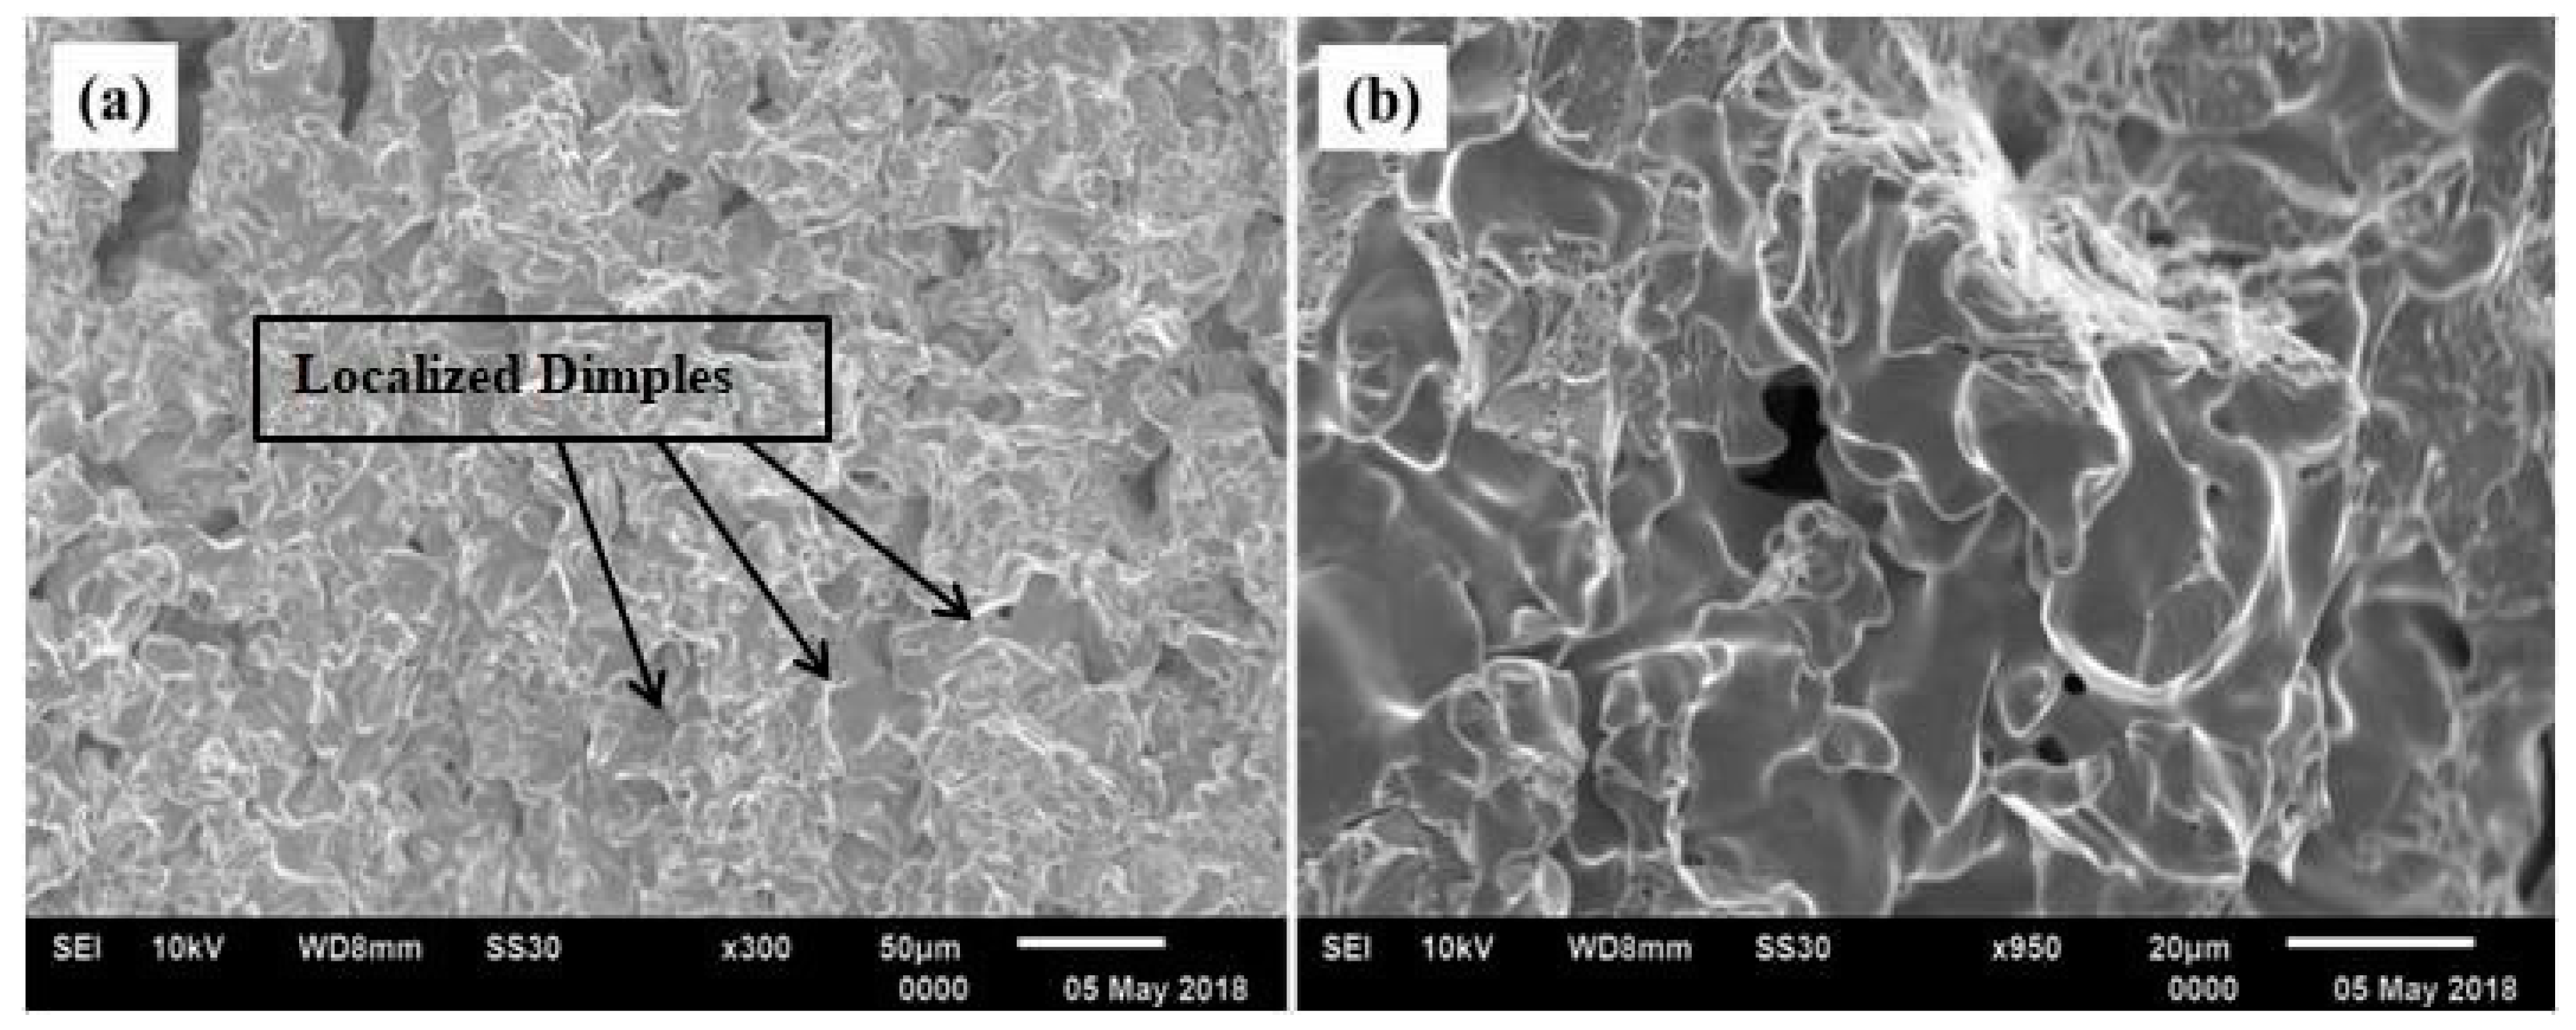
Figure 11d). An examination of the fractured surfaces of the deposited Ti sample was performed using SEM, which is shown in Figure 12. Despite the fact that some localized dimples were also visible, the fractography study does not provide any indications of distinctive features like cup and cone. These fractured surfaces are significantly similar to those found in powder metallurgy [12].

3.3. High Temperature Cyclic Oxidation Study

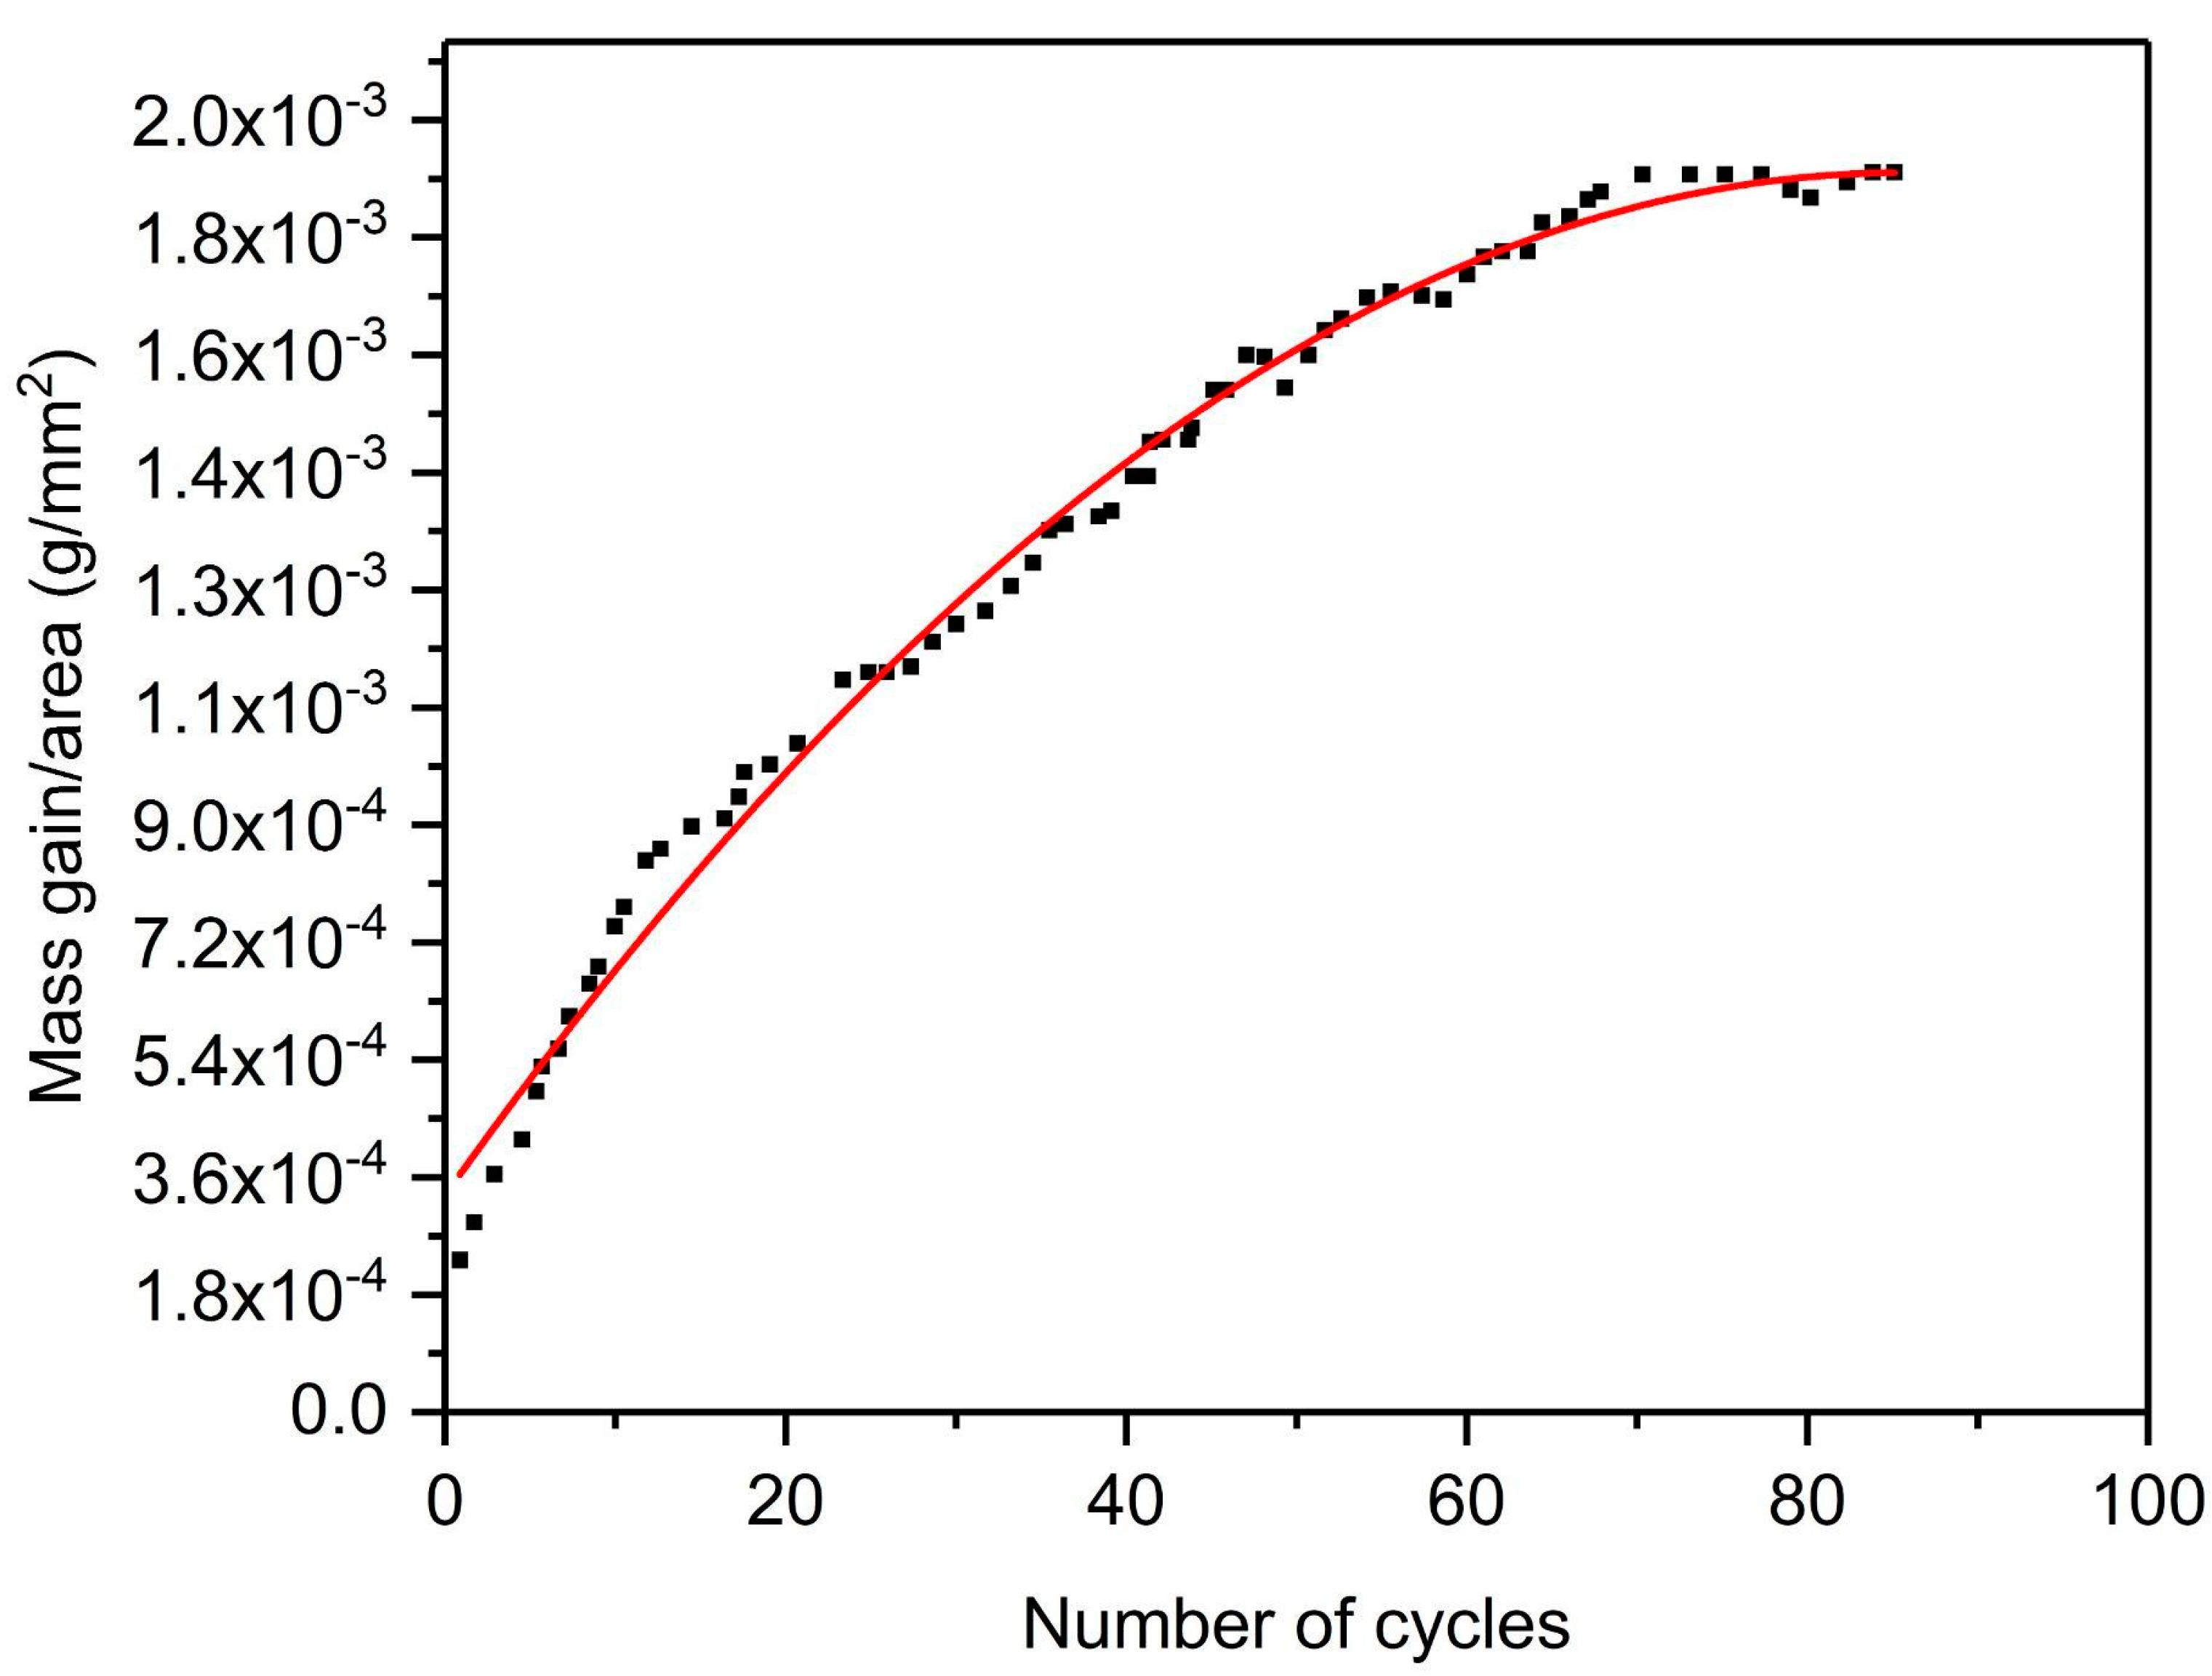
Cyclic oxidation was performed to evaluate the deposit’s sustainability under high-temperature conditions. The plot of the mass gain vs. number of cycles is represented in 
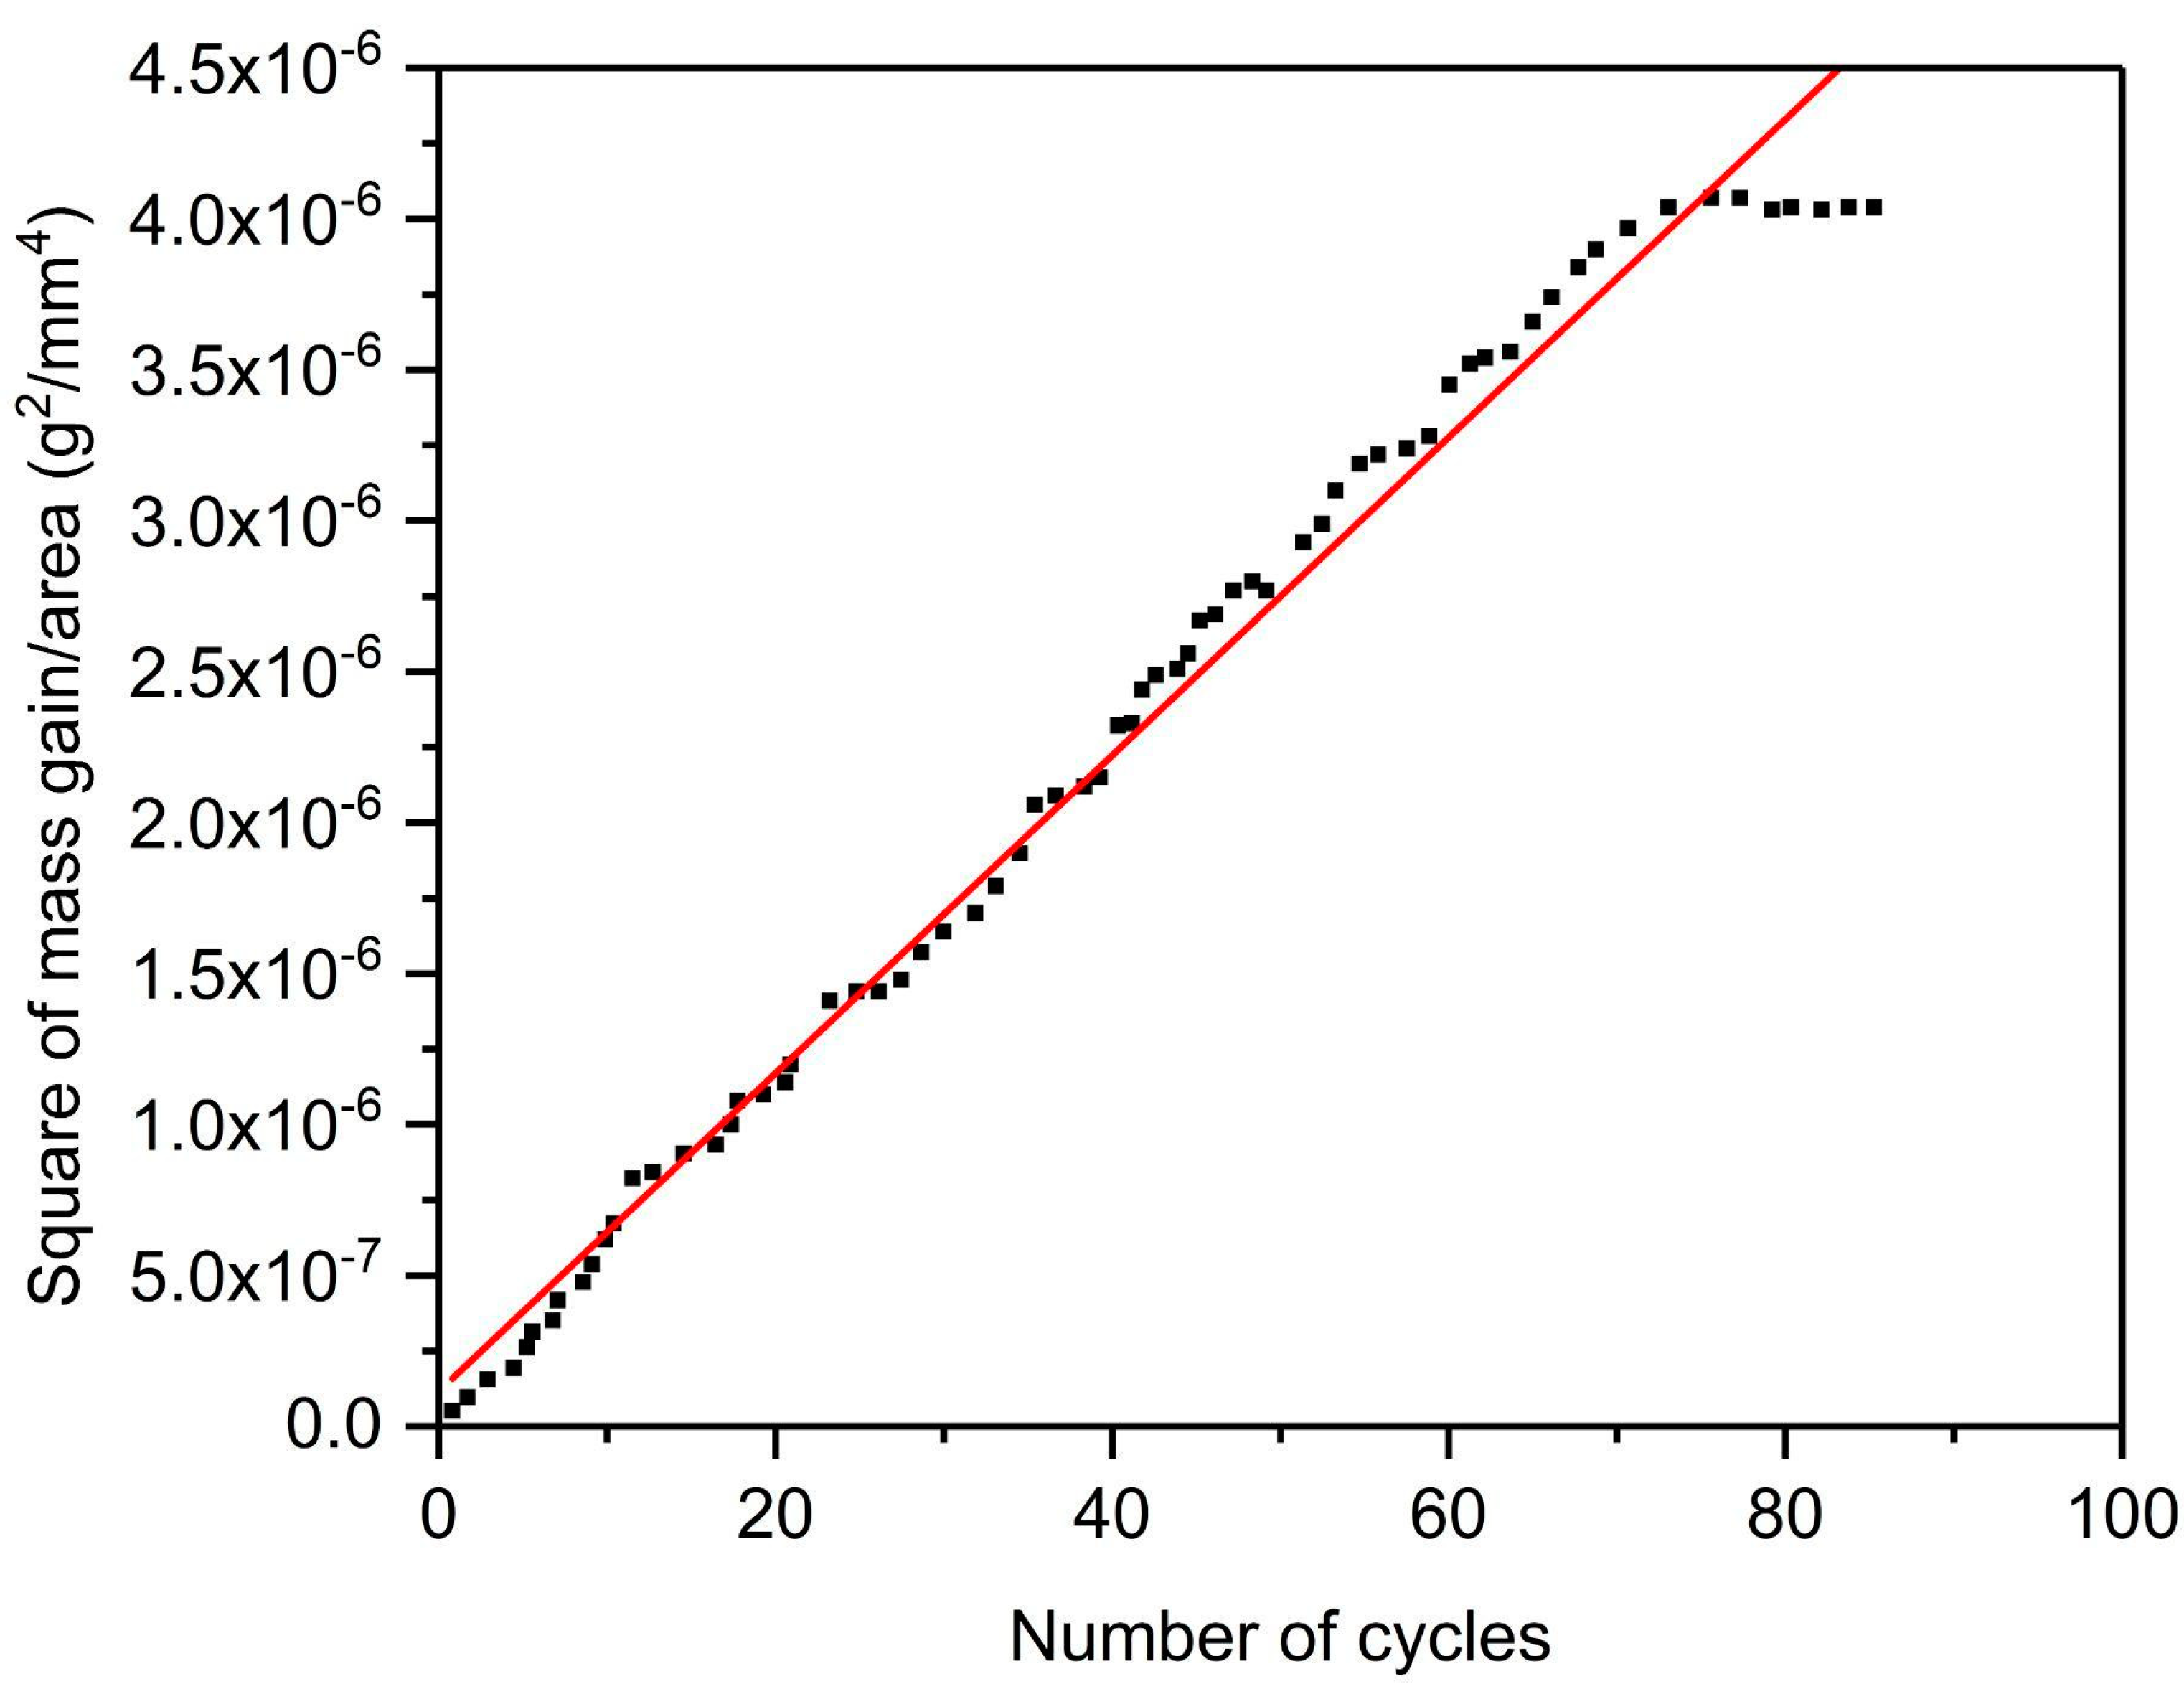
Figure 13. To ascertain the rate law for high-temperature cyclic oxidation of the sample, the square of mass gain vs. number of cycles plot is drawn as displayed in Figure 14. A parabolic relationship was observed to approximate the data. The parabolic rate constant of deposited Ti can be calculated as follows [24]:
(∆W)2 = Kp·t
where ∆W is the mass change per total surface area, Kp is the parabolic rate constant, and t is the oxidation time. The value of Kp for the cold-sprayed HIP-treated pure titanium sample is found to be 1.17 × 10⁻¹¹ g2 mm−4 s−1, which describes the cyclic oxidation rate quantitatively. The magnitude of Kp was observed to be less than that of titanium specimens prepared via the powder metallurgy process assisted with inductive sintering (1.43 × 10⁻¹¹ g2 mm−4 s−1) [25]. The mass of the cold-sprayed HIP-treated pure titanium sample was found to increase during the first 67th cycles. However, the mass of the sample stabilized after the 68th cycle. This mass stabilization effect is evident from the parabolic nature of the curve, as shown in Figure 13 [26]. No spallation was observed during the whole oxidation study. The mass change trend shows that the material could have good oxidation resistance during longer usage. That may be due to the forming of a protective layer of titanium oxide. However, no stabilization in mass gain was observed in the studies available in the literature, even after 1500 cycles of oxidation in air at a 700 °C temperature for pure bulk titanium [25]. This concretes that cold-sprayed HIP-treated pure titanium deposit is more advantageous for high-temperature applications.
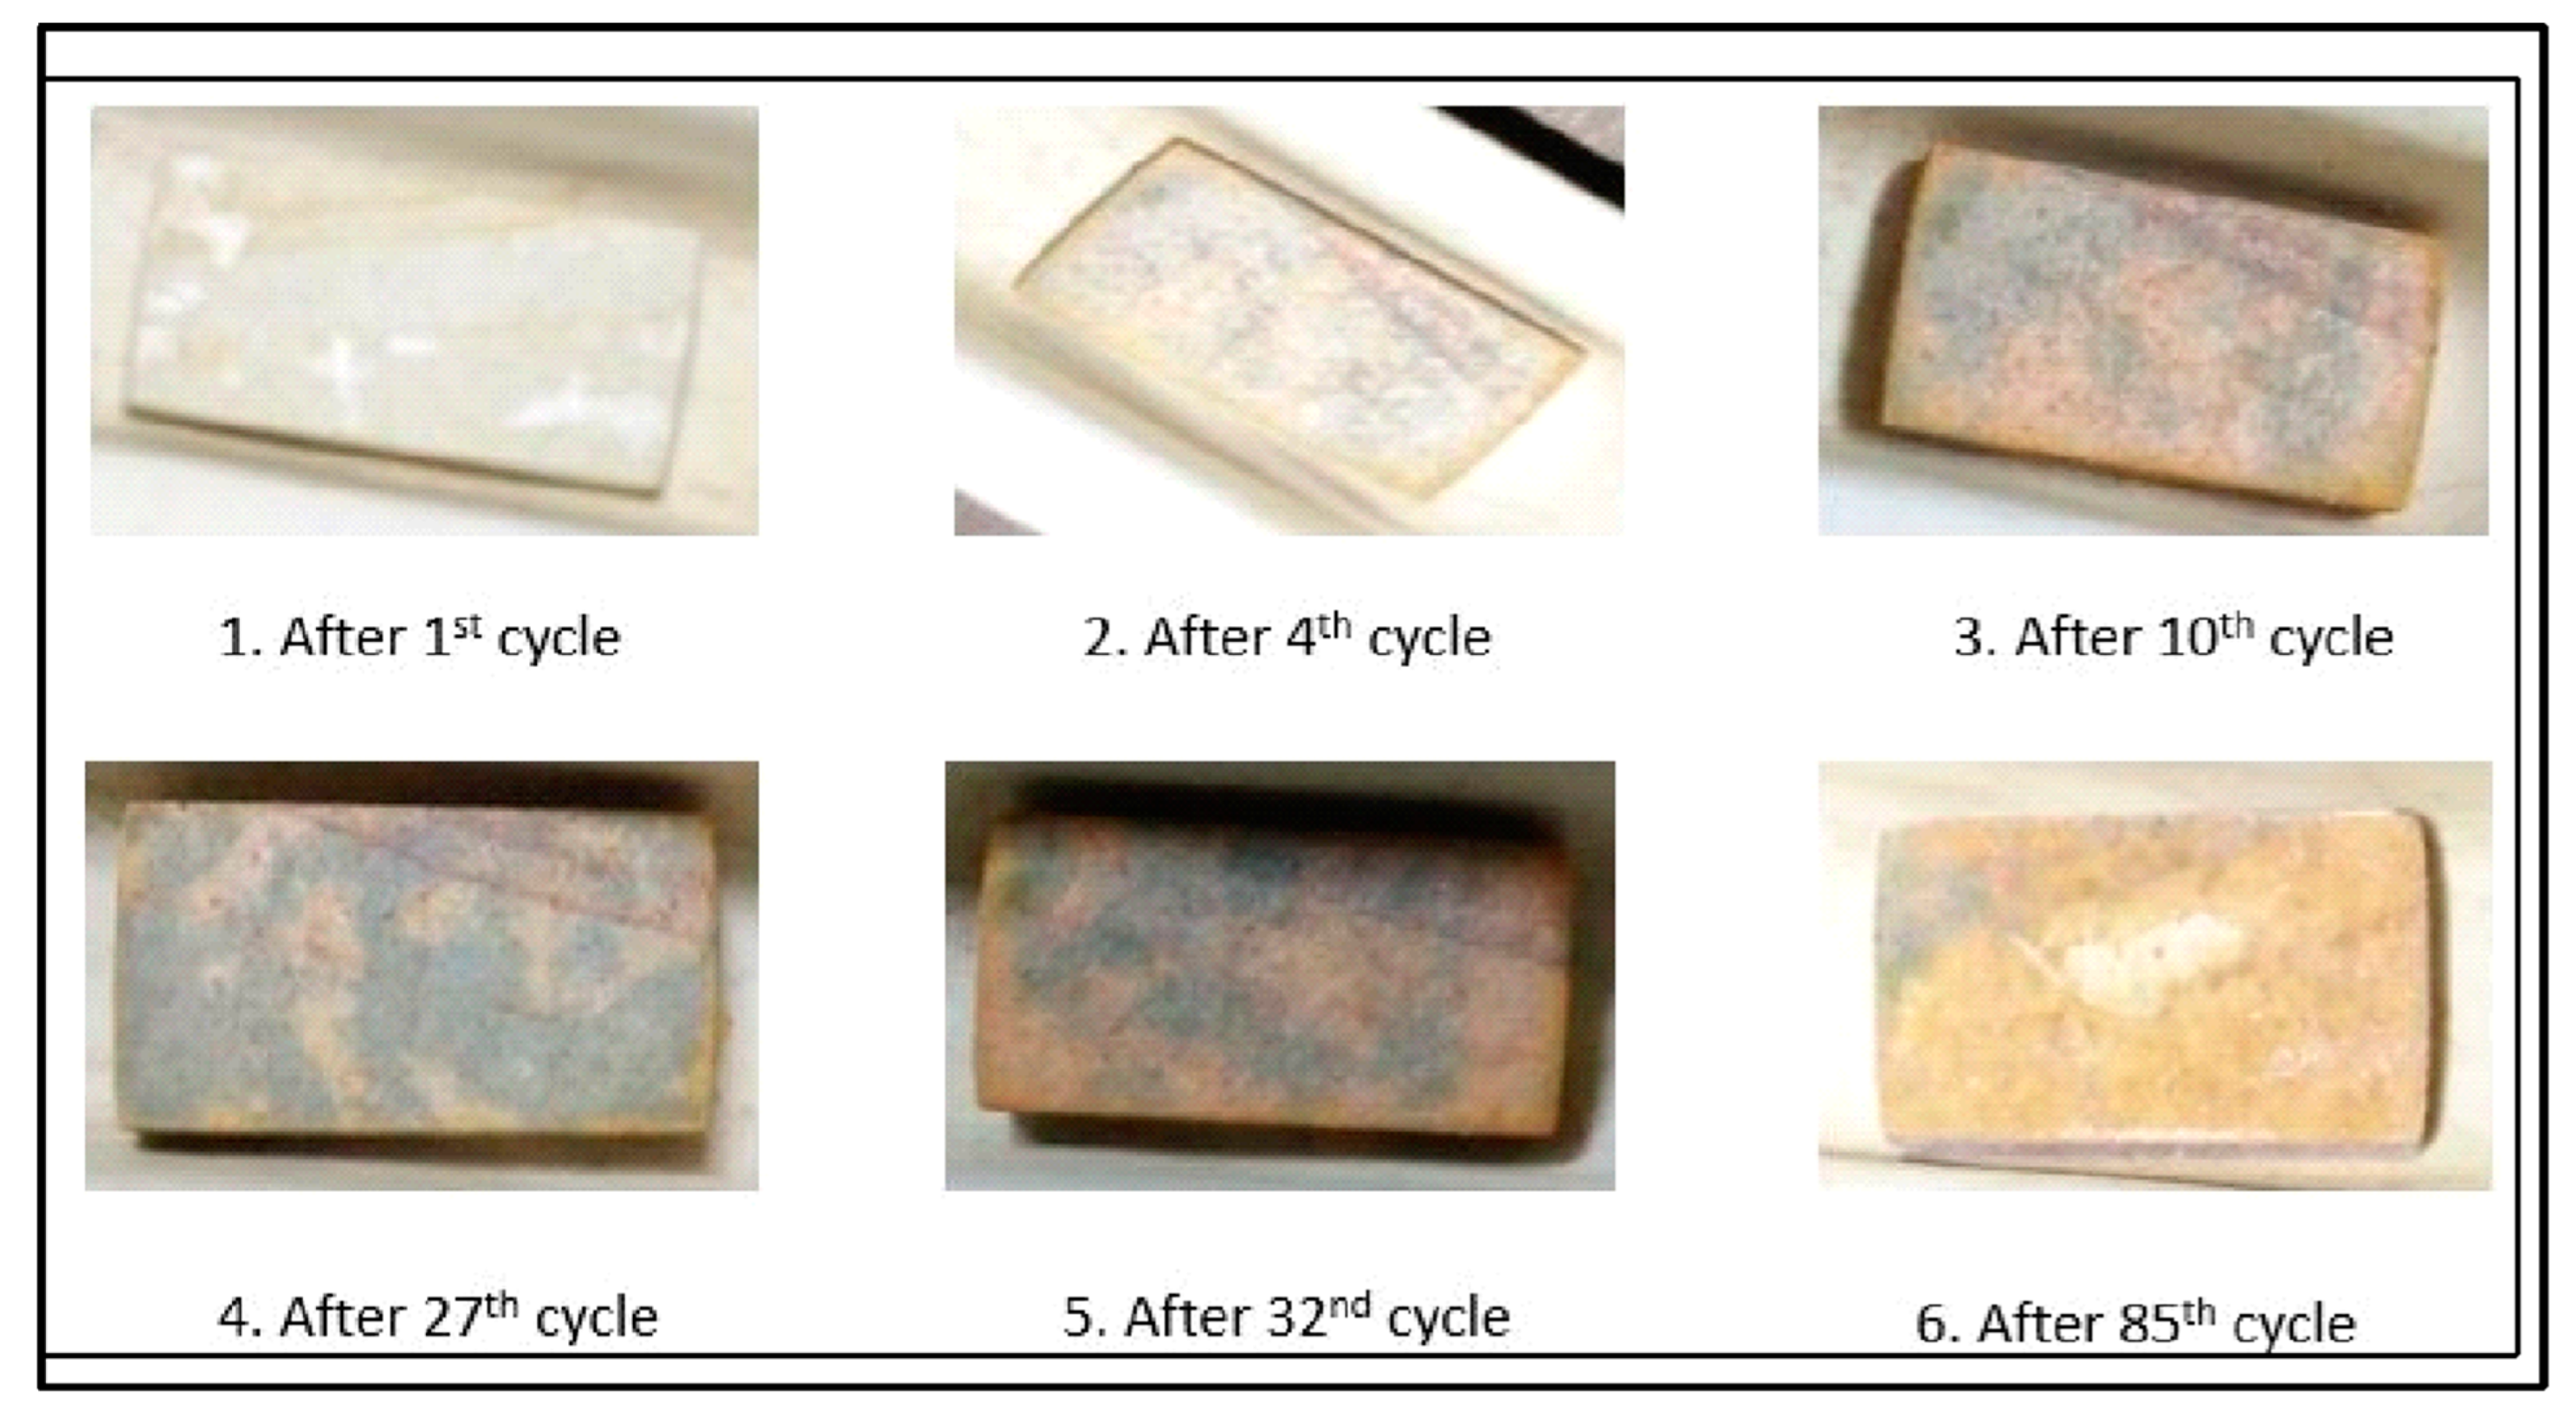
The macrographs of one of the samples subjected to cyclic oxidation at high temperatures are presented in Figure 15. Overall, the scale was smooth and continuous without cracks, with no trend of scale spalling during the entire study. The sample at its initial stage was metallic in color with a shining surface due to fine polishing. After the first oxidation cycle, the whole surface became creamish in color, and gray spots started appearing after the 4th cycle with a cream color in the backdrop. These gray spots started increasing in size, and almost 80% of the surface became gray after the 27th cycle. Further, the gray shade became creamish, and the creamish color began changing to a light-yellow tone. Almost the whole surface of the sample turned light yellow towards the end of the high-temperature cyclic oxidation study carried out for 85 cycles. These color variations may be due to changes in the mineral form of titanium dioxide from anatase to rutile or vice versa during heating [27,28].
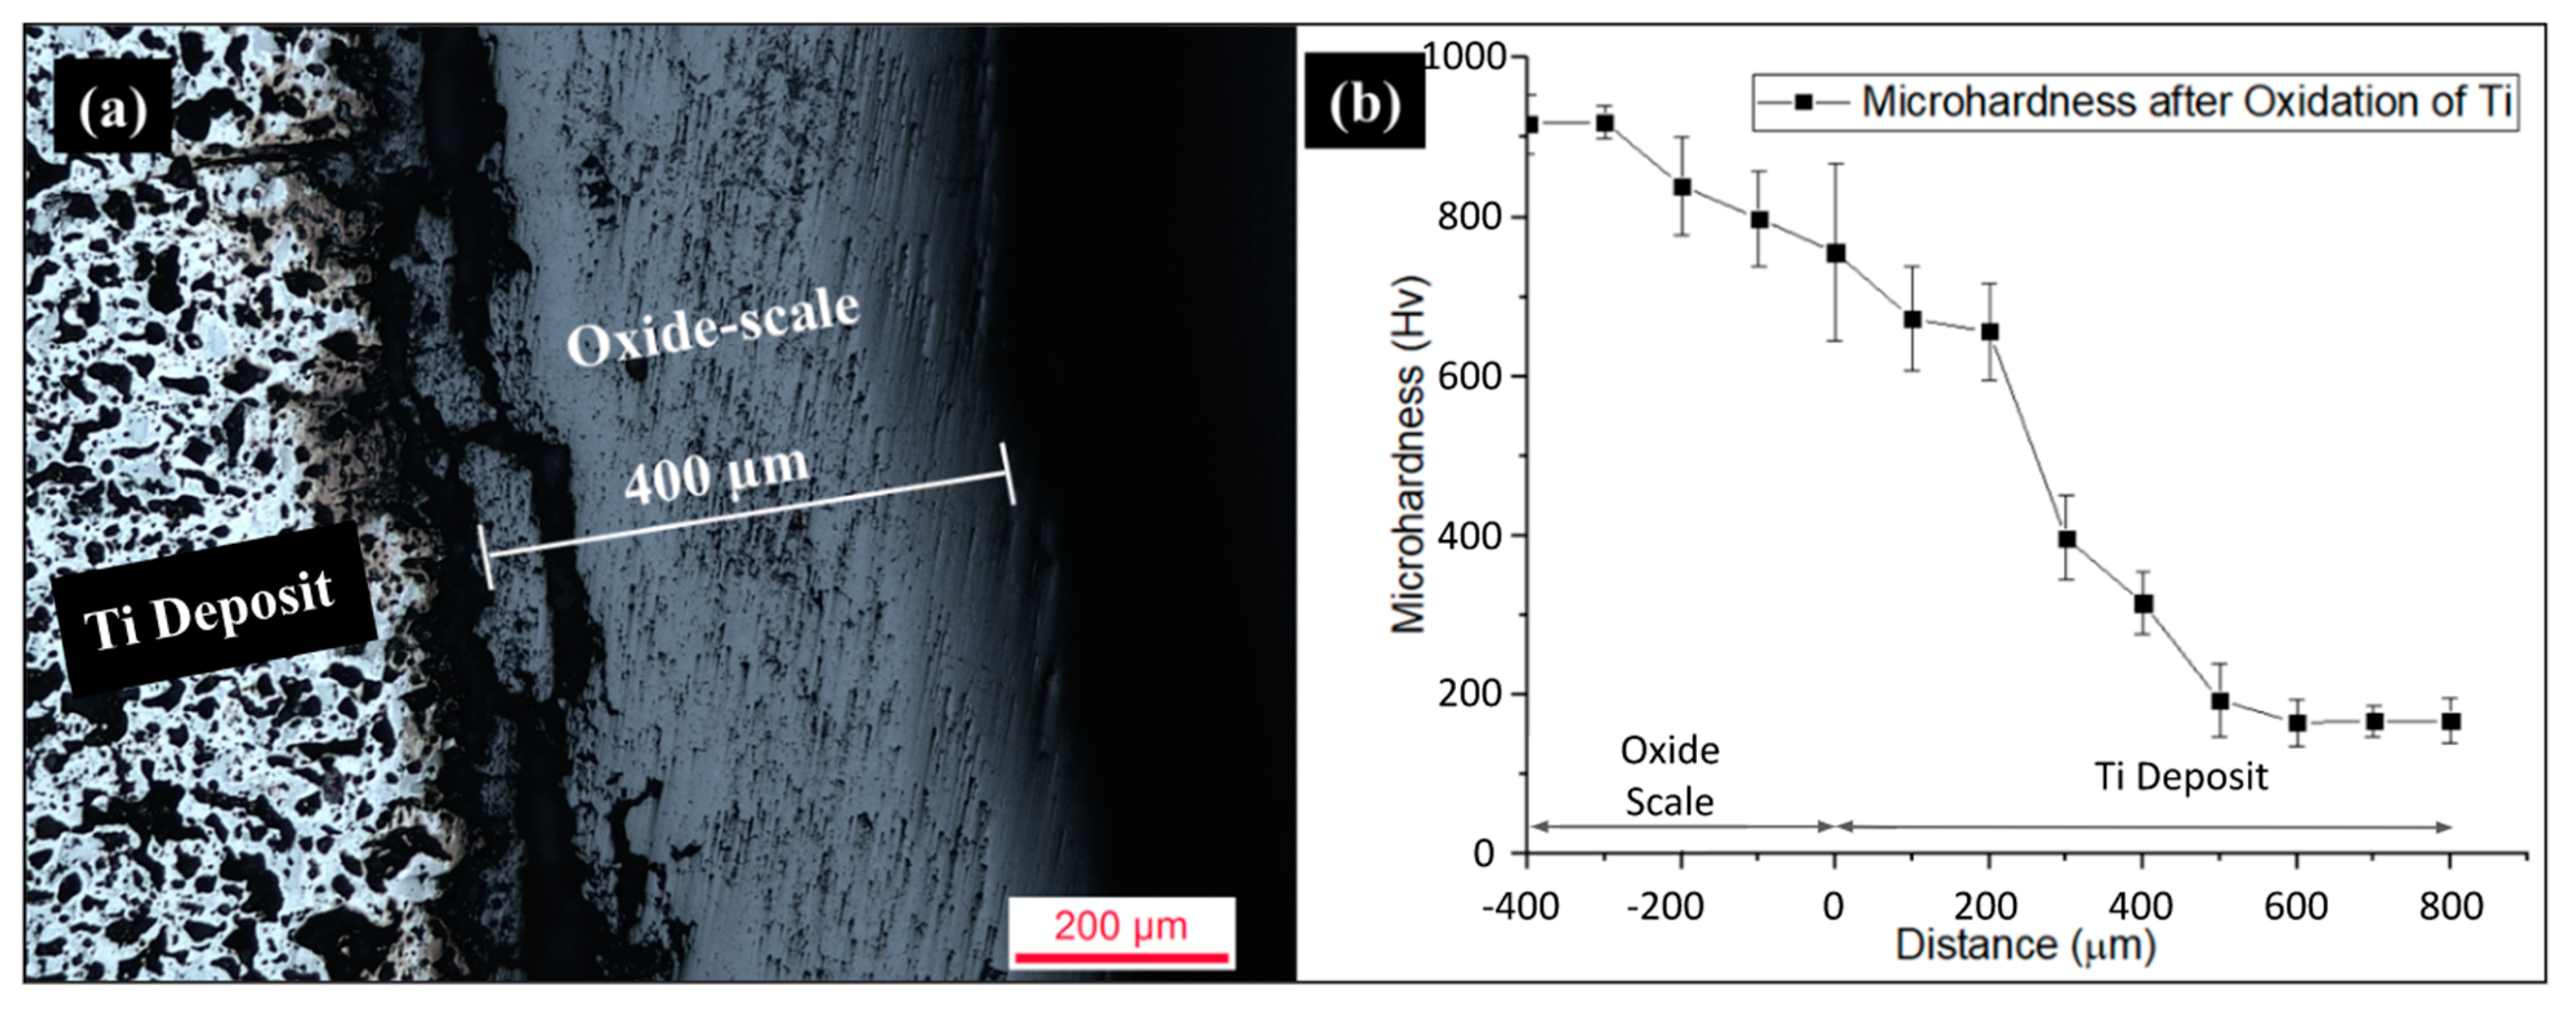
Cross-sectional optical images and microhardness analysis of the cold-sprayed HIP-treated pure titanium deposit subjected to high-temperature cyclic oxidation are represented in Figure 16a,b, respectively. High-temperature cyclic oxidation induced the development of a layered oxide structure through a complex interplay of oxidation and reduction cycles. This cyclic process led to the continuous growth of the oxide scale with each cycle, resulting in distinct layers. Moreover, diffusion and segregation of elements at the oxide–metal interface significantly influenced the composition and structure of the layers. Additionally, phase changes of the oxide layers in response to varying conditions and the intricate influence of microstructural features, such as grain boundaries, precipitates, and defects, were pivotal factors shaping the layered oxide structure. Understanding these phenomena was crucial for improving the performance and durability of materials in high-temperature environments, particularly in gas turbine components, heat exchangers, and other applications subjected to repeated thermal cycling in oxidizing atmospheres [29]. A cracked oxide scale of 400 µm thickness and an average microhardness of 818 HV was observed, which implies the critical scale thickness for spallation. The tremendous rise in the oxide scale microhardness is because of the mineral forms of titanium dioxide present in the oxide scale. Rutile and anatase phases were the mineral forms of titanium dioxide investigated through XRD analysis. These two mineral forms have body-centered tetragonal (BCT) crystalline structures, which have fewer active slip systems and hence high hardness and brittleness. The microhardness of the cold-sprayed HIP-treated Ti deposit was observed to be higher (775 HV) at the deposit-oxide scale interface (0 µm), which starts to decrease up to 500 µm deeper inside the deposit, attaining a microhardness of 202 HV. The microhardness value stabilized to an average value of 175 HV after 500 µm distance from the deposit–oxide scale interface. The variation in hardness may be due to comparatively higher oxygen concentration (enrichment of titanium with oxygen) in the outer layers than in the inner layers of the deposit. Therefore, from the obtained microhardness values and optical micrographs, it can be concluded that oxidation of titanium comprises both oxidation dissolution of the titanium near the interface and oxide scale formation.
Surface SEM analysis of the oxidized deposit is provided in Figure 17a. A crystalline structure can be seen, like a bunch of rods with variations in length. The development of a crystalline rod-like structure with varying lengths during high-temperature cyclic oxidation of titanium (Ti) arose from the influence of Ti’s hexagonal close-packed (HCP) crystal structure. The repeated oxidation–reduction cycles in an oxidizing environment facilitated the preferential growth of rutile titanium oxide (TiO2) along specific crystallographic directions, resulting in the formation of rod-like morphologies. This phenomenon was affected by crucial parameters such as temperature, oxygen concentration, and the number of oxidation cycles, which contributed to the observed variations in rod lengths. Additionally, microstructural features, including grain boundaries and defects, played a significant role by serving as preferential sites for oxide growth, thereby enhancing the diversity in rod lengths. A comprehensive understanding of these factors was essential for tailoring and optimizing the performance of titanium-based materials under high-temperature conditions, thus enabling advancements in various industrial applications [
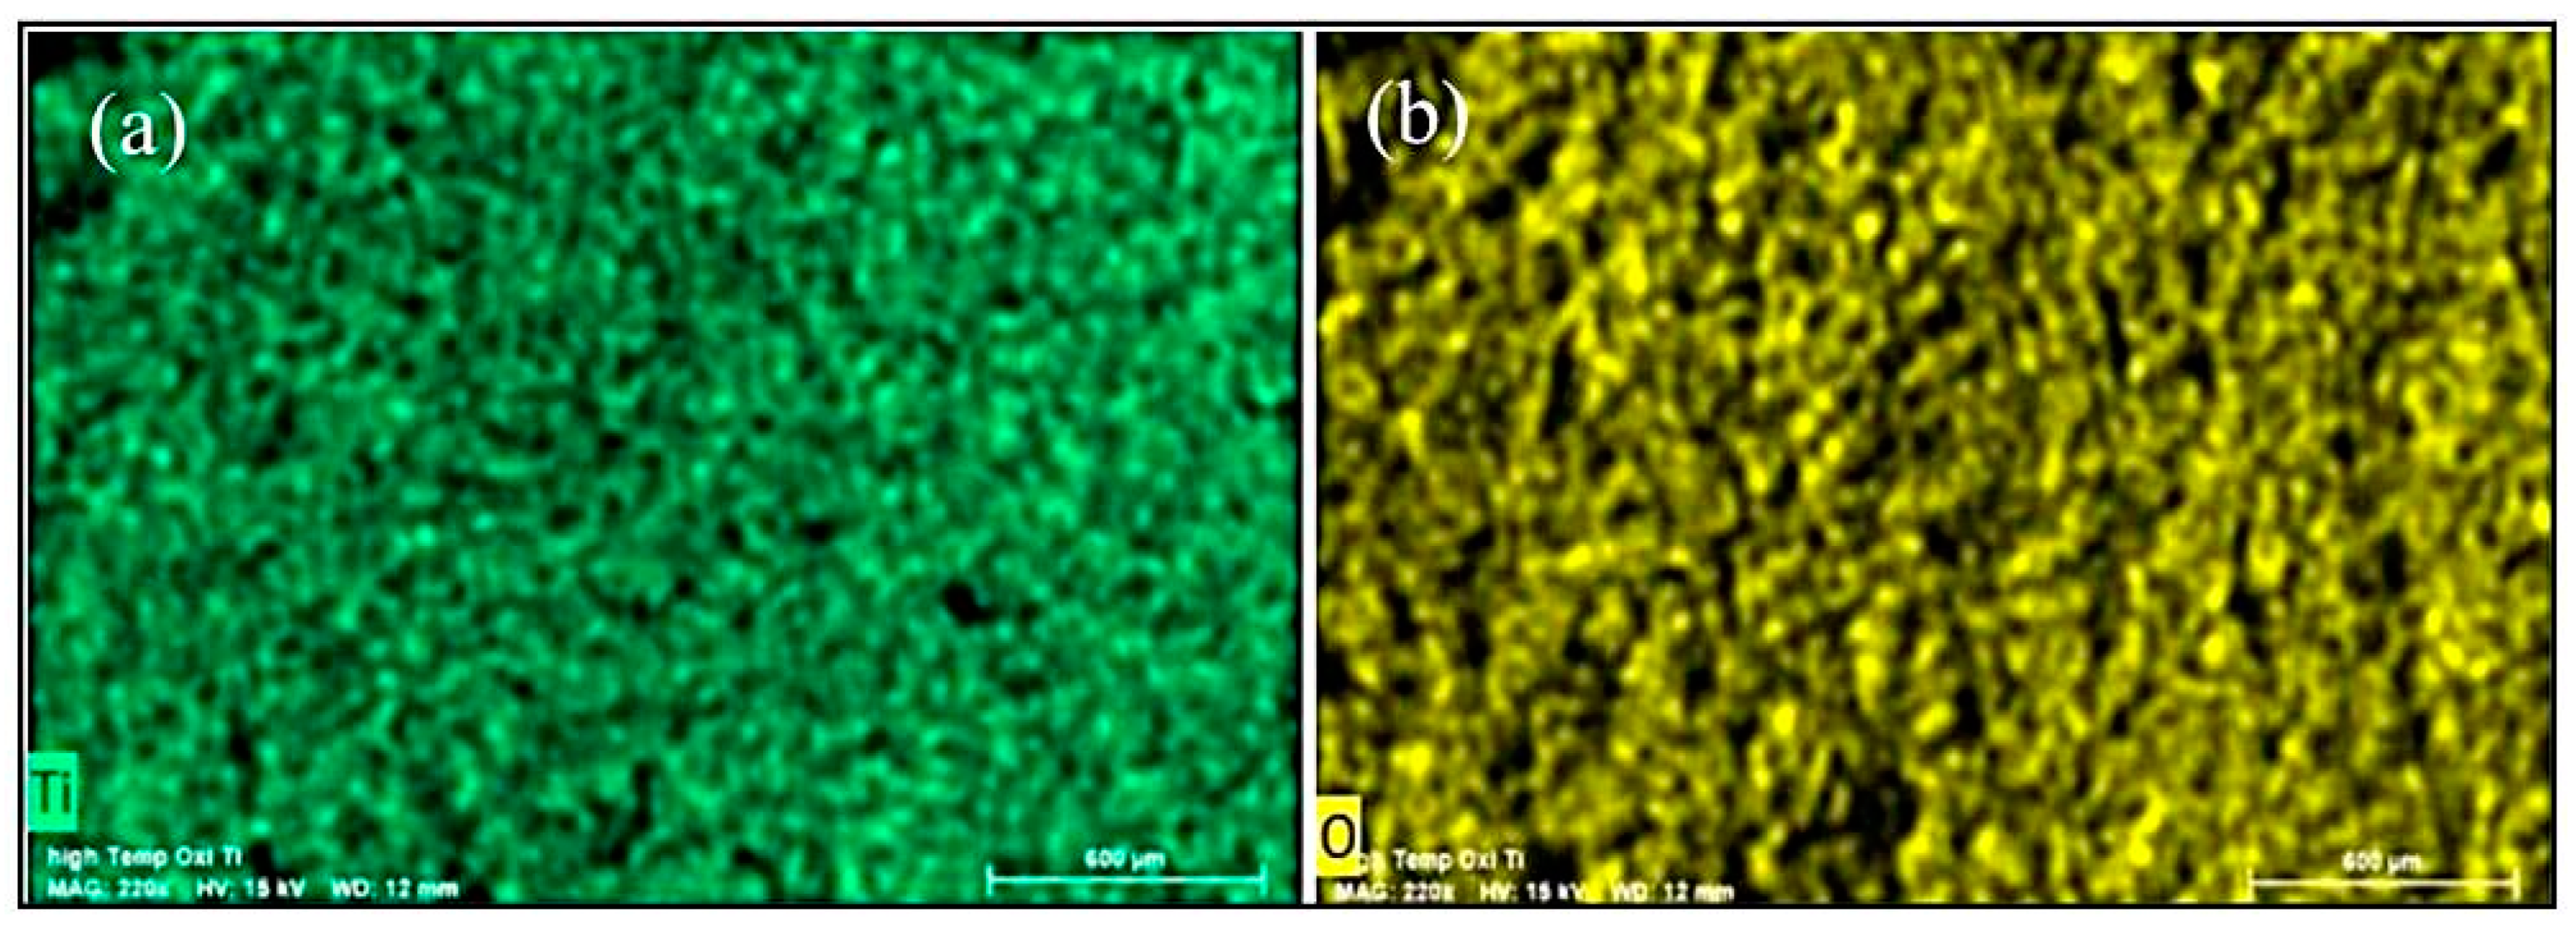
30]. EDS analysis with point spectrum and mapping showed the presence of titanium and oxides on the whole surface (Figure 17b and Figure 18, respectively). EDS square spectrum analysis (shown in Figure 17b) showed an 80% concentration of oxide and a 20% concentration of titanium on the surface. The presence of platinum in the EDS spectrum is due to the sputtering performed before the SEM/EDS analysis to make the oxide layer conductive for obtaining better results in SEM/EDS.
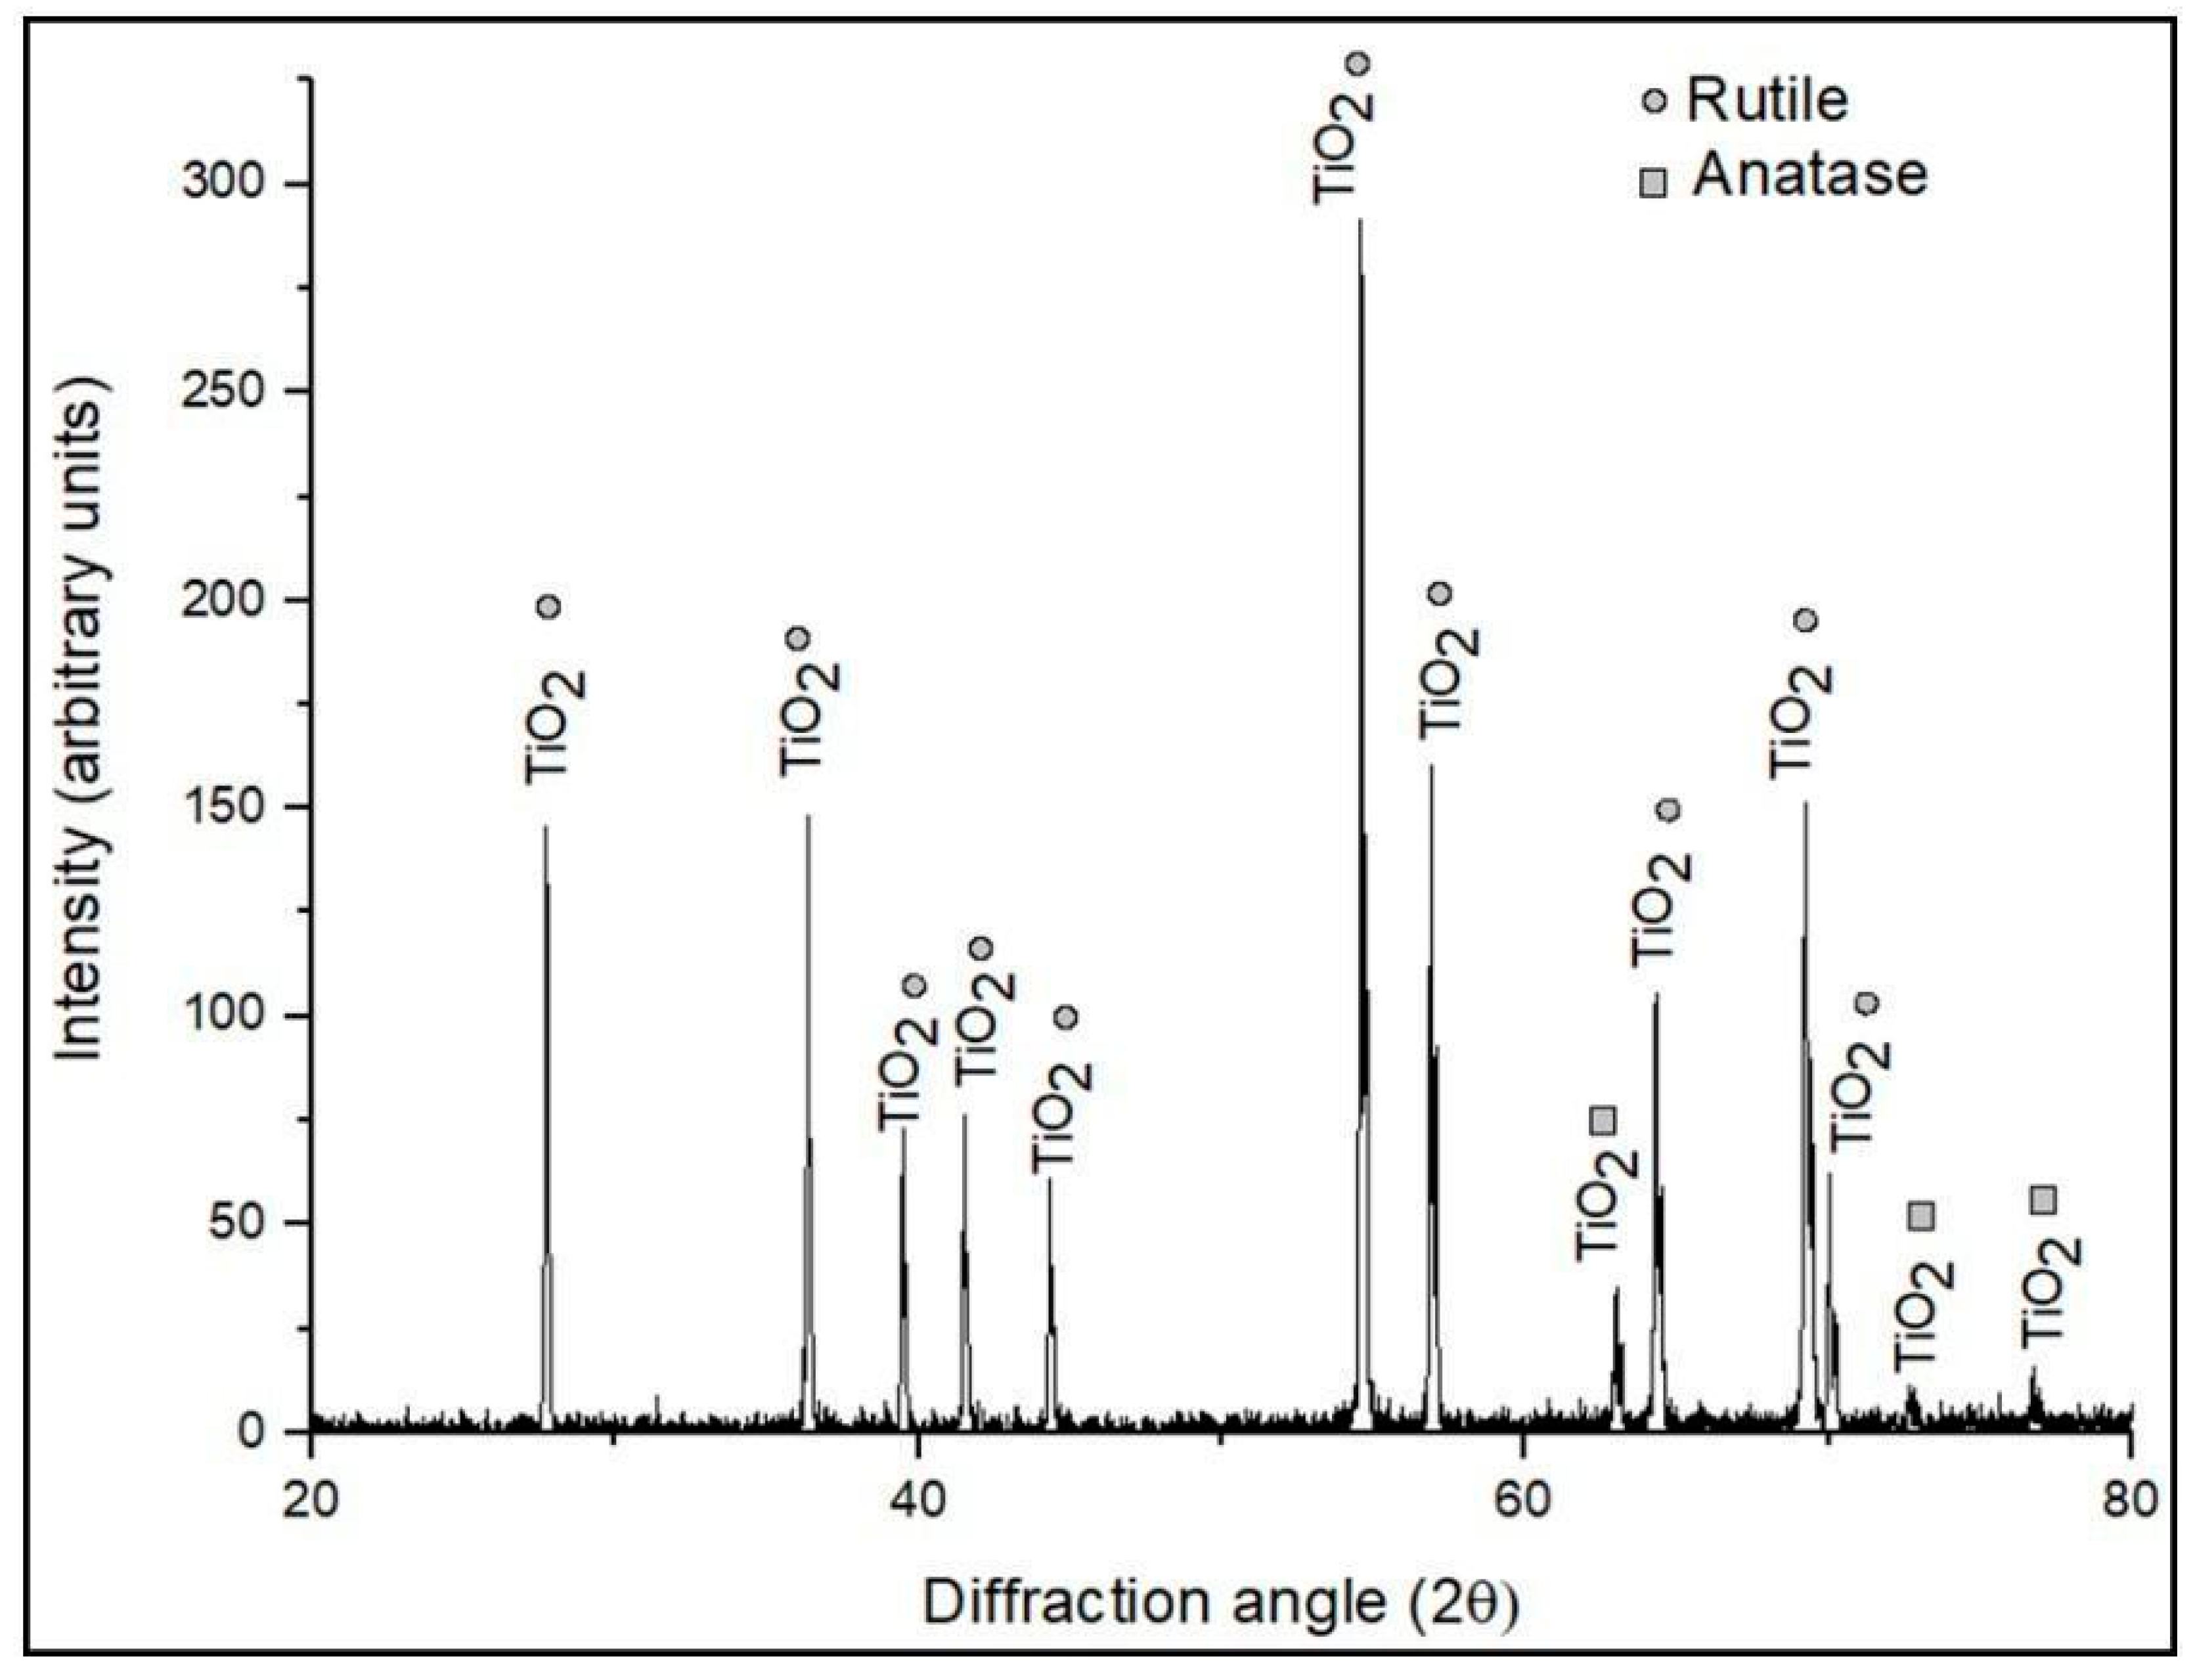
The X-ray diffractogram for the cold-sprayed HIP-treated pure titanium deposit subjected to high-temperature cyclic oxidation is displayed in Figure 19. It is evident from the XRD analysis that the cold-sprayed HIP-treated pure titanium sample developed a layer of titanium oxide TiO2 after high-temperature cyclic oxidation. Diffraction peaks observed were of TiO2 having a crystalline structure in the form of rutile and anatase, which are the two mineral forms of the crystalline structure of titanium dioxide [28]. Most of the peaks are rutile, and very few have an anatase structure. The formation and transformation of rutile and anatase phases during high-temperature cyclic oxidation were governed by a complex interplay of temperature-dependent thermodynamics, phase transition kinetics, and microstructural influences. Initially, rapid oxidation resulted in the thermodynamically favored rutile phase formation. Subsequent heating and cooling cycles induced fluctuations in temperature and oxygen concentration, impacting microstructure and stability. Lower temperatures promoted the kinetics-favorable transformation to metastable anatase, while higher temperatures reverted anatase to rutile due to equilibrium thermodynamics. Microstructural features, such as grain boundaries and defects, influenced phase nucleation and growth. Additionally, oxygen diffusion into the oxide scale during oxidation–reduction cycles significantly affected phase transformation kinetics, contributing to the observed phase changes [31]. Therefore, it may be concluded that initially (after 1st cycle) rutile structure of titanium dioxide was formed, which probably appeared creamish in color. After further heating cycles, it converted into anatase and appeared blackish after the 27th cycle. Further heating cycles may lead to the conversion of anatase to a rutile crystal structure of titanium dioxide. The rutile crystal is the most stable polymorph of TiO2 at all temperatures compared to metastable anatase. The color variation is due to a change in crystal structure having a difference in refractive index. Rutile has a higher refractive index (RI) when compared to anatase. Therefore, the scattering of light is relatively higher by the rutile phase, leading to creamish/yellow color, whereas anatase has comparatively lesser RI, scatters less light, and appears grayish. The rutile type of pigments is generally preferred over anatase because they scatter light more efficiently, are more stable, and are less likely to catalyze photodegradation [32]. Additionally, rutile can be converted into a titanium sponge through the Kroll process.
Summarizing the above discussion on oxidation behavior, it is concluded that the manufactured titanium deposit has a high oxidation resistance.

4. Conclusions

Cold spraying was successfully used to develop intermetallic-phase-free thick Ti deposits via the solid-state deposition of Ti-powder feedstock. Due to the low density and hexagonal close-packed crystal lattice structure of Ti, densification was performed on as-sprayed deposits through hot isostatic pressing. Macro-tensile testing was performed on HIP-treated Ti deposits, showing a UTS of 384 MPa, with a total elongation of 6% (comparable UTS to that of bulk Ti). HIP treatment led to lesser porosity and higher UTS. The micro-tensile test revealed brittle fractures, having some localized dimples with the nucleation of cracks initiating from pores and traveling through pores, splat, and grain boundaries. The formation of hard-phase α-titanium (HCP) was augmented via the presence of transition elements in the IN718 substrate by lowering the β–α phase transition temperature during HIP treatment. This not only increased the hardness at the deposit-substrate interface but also helped in removing the thick standalone deposits from the substrate. It can be concluded that the application of HIP treatment after cold spraying is helpful in fabricating industry-relevant standalone components, which have a requirement for a hardened surface with a softer core. Furthermore, the formation of a hard, protective oxide scale of titanium dioxide (rutile crystal structure) on the developed HIP-treated Ti helped in achieving very good high-temperature oxidation resistance. Therefore, the developed approach could be used to additively manufacture Ti standalone components for high-temperature applications such as nuclear, automobile, and aerospace.

Author Contributions

Conceptualization, H.S., E.C., H.S.G., H.S.A., P.S. and S.S.; methodology, H.S., E.C., H.S.G., H.S.A., P.S. and S.S.; software, P.S., S.S. and H.S.; validation, H.S., P.S., S.S., E.C., H.S.G. and A.K.; formal analysis, P.S., S.S., H.S. and E.C.; investigation, P.S. and S.S.; resources, H.S., E.C. and A.K.; data curation, P.S. and S.S.; writing—original draft preparation, P.S. and S.S.; writing—review and editing, H.S., E.C., H.S.G., P.S. and S.S.; visualization, H.S., E.C., H.S.G., H.S.A., A.K., P.S. and S.S.; supervision, H.S., E.C., H.S.G., H.S.A. and A.K.; project administration, H.S., E.C., H.S.A. and H.S.G.; funding acquisition, H.S., E.C., H.S.G. and H.S.A. All authors have read and agreed to the published version of the manuscript.

Funding

This research was jointly funded by the Ministry of Education (MoE) and the Department of Science and Technology (DST), Government of India (GoI) under Uchhatar Avishkar Yojana (UAY, IITRPR_001). DST, GoI (DST-FIST, SR/FST/ETI-379/2014) also extended financial support to establish an EDS facility, which is used to carry out the EDS analysis. The APC was waived-off by the journal.

Institutional Review Board Statement

Not applicable.

Informed Consent Statement

Not applicable.

Data Availability Statement

Data is contained within the article.

Acknowledgments

The authors acknowledge the Ministry of Education and the Department of Science and Technology, and the Government of India for the financial support under the UAY (Uchchatar Avishkar Yojana) scheme (IITRPR-001). The authors also acknowledge GE Power, Bengaluru, for the cold spraying and HIP treatments.

Conflicts of Interest

The authors declare no conflict of interest.

References

  1. Yin, S.; Yan, X.; Chen, C.; Jenkins, R.; Liu, M.; Lupoi, R. Hybrid additive manufacturing of AlTi6Al4V functionally graded materials with selective laser melting and cold spraying. J. Mater. Process. Technol. 2018, 255, 650–655. [Google Scholar] [CrossRef]
  2. Kruth, J.-P.; Leu, M.C.; Nakagawa, T. Progress in Additive Manufacturing and Rapid Prototyping. CIRP Ann. 1998, 47, 525–540. [Google Scholar] [CrossRef]
  3. Singh, P.; Singh, S.; Singh, H.; Calla, E.; Grewal, H.S.; Arora, H.S.; Krishnamurthy, A. Characterization and High-Temperature Oxidation Behavior of Ni–20Cr Deposits Fabricated by Cold Spray-Based Additive Manufacturing. Coatings 2023, 13, 904. [Google Scholar] [CrossRef]
  4. Yang, K.; Li, W.; Guo, X.; Yang, X.; Xu, Y. Characterizations and anisotropy of cold-spraying additive-manufactured copper bulk. J. Mater. Sci. Technol. 2018, 34, 1570–1579. [Google Scholar] [CrossRef]
  5. Murr, L.E.; Gaytan, S.M.; Ramirez, D.A.; Martinez, E.; Hernandez, J.; Amato, K.N.; Shindo, P.W.; Medina, F.R.; Wicker, R.B. Metal Fabrication by Additive Manufacturing Using Laser and Electron Beam Melting Technologies. J. Mater. Sci. Technol. 2012, 28, 1–14. [Google Scholar] [CrossRef]
  6. Vaz, R.F.; Garfias, A.; Albaladejo, V.; Sanchez, J.; Cano, I.G. A Review of Advances in Cold Spray Additive Manufacturing. Coatings 2023, 13, 267. [Google Scholar] [CrossRef]
  7. Pathak, S.; Saha, G.C. Development of Sustainable Cold Spray Coatings and 3D Additive Manufacturing Components for Repair/Manufacturing Applications: A Critical Review. Coatings 2017, 7, 122. [Google Scholar] [CrossRef] [Green Version]
  8. Singh, S.; Kumar, M.; Sodhi, G.P.S.; Buddu, R.K.; Singh, H. Development of thick copper claddings on SS316L steel for In-vessel components of fusion reactors and copper-cast iron canisters. Fusion Eng. Des. 2018, 128, 126–137. [Google Scholar] [CrossRef]
  9. Li, C.-J.; Li, W.-Y. Deposition characteristics of titanium coating in cold spraying. Surf. Coat. Technol. 2003, 167, 278–283. [Google Scholar] [CrossRef]
  10. Pattison, J.; Celotto, S.; Morgan, R.; Bray, M.; O’Neill, W. Cold gas dynamic manufacturing: A non-thermal approach to freeform fabrication. Int. J. Mach. Tools Manuf. 2007, 47, 627–634. [Google Scholar] [CrossRef]
  11. Sova, A.; Grigoriev, S.; Okunkova, A.; Smurov, I. Potential of cold gas dynamic spray as additive manufacturing technology. Int. J. Adv. Manuf. Technol. 2013, 69, 2269–2278. [Google Scholar] [CrossRef]
  12. MacDonald, D.; Fernández, R.; Delloro, F.; Jodoin, B. Cold Spraying of Armstrong Process Titanium Powder for Additive Manufacturing. J. Therm. Spray Technol. 2016, 26, 598–609. [Google Scholar] [CrossRef] [Green Version]
  13. AlMangour, B. Fundamentals of Cold Spray Processing: Evolution and Future Perspectives. In Cold-Spray Coatings; Cavaliere, P., Ed.; Springer International Publishing: Cham, Switzerland, 2018; pp. 3–24. [Google Scholar] [CrossRef]
  14. Tucker, R.C. Surface Engineering. In Thermal Spray Technology; Tucker, R.C., Ed.; ASM International: Almere, The Netherlands, 2013; pp. 10–30. [Google Scholar] [CrossRef]
  15. Zitting, A.; Paajanen, A.; Penttilä, P.A. Impact of hemicelluloses and crystal size on X-ray scattering from atomistic models of cellulose microfibrils. Cellulose 2023, 30, 1–20. [Google Scholar] [CrossRef]
  16. Hussain, T.; McCartney, D.G.; Shipway, P.H.; Marrocco, T. Corrosion Behavior of Cold Sprayed Titanium Coatings and Free Standing Deposits. J. Therm. Spray Technol. 2010, 20, 260–274. [Google Scholar] [CrossRef] [Green Version]
  17. Semiatin, S.L. An Overview of the Thermomechanical Processing of α/β Titanium Alloys: Current Status and Future Research Opportunities. Met. Mater. Trans. A 2020, 51, 2593–2625. [Google Scholar] [CrossRef] [Green Version]
  18. Motyka, M.; Nowak, W.J.; Wierzba, B.; Chrominski, W. Characterization of the Interface Between α and β Titanium Alloys in the Diffusion Couple. Met. Mater. Trans. A 2020, 51, 6584–6591. [Google Scholar] [CrossRef]
  19. Rocha, S.S.D.; Adabo, G.L.; Henriques, G.E.P.; Nóbilo, M.A.D.A. Vickers hardness of cast commercially pure titanium and Ti-6Al-4V alloy submitted to heat treatments. Braz. Dent. J. 2006, 17, 126–129. [Google Scholar] [CrossRef]
  20. Henriques, V.A.R.; Campos, P.P.D.; Cairo, C.A.A.; Bressiani, J.C. Production of titanium alloys for advanced aerospace systems by powder metallurgy. Mater. Res. 2005, 8, 443–446. [Google Scholar] [CrossRef]
  21. Leyens, C.; Pete, M. (Eds.) Titanium and Titanium Alloys: Fundamentals and Applications; Wiley-VCH: Weinheim, Germany; John Wiley: Chichester, UK, 2003. [Google Scholar]
  22. Hussain, T. Cold Spraying of Titanium: A Review of Bonding Mechanisms, Microstructure and Properties. Key Eng. Mater. 2012, 533, 53–90. [Google Scholar] [CrossRef]
  23. Torrance, J.; Stefanescu, D. Investigation on the effect of surface roughness on the static mechanical properties of thin-wall ductile iron castings. AFS Trans. 2004, 112, 757–772. [Google Scholar]
  24. Kaur, N.; Kumar, M.; Sharma, S.K.; Kim, D.Y.; Kumar, S.; Chavan, N.; Joshi, S.; Singh, N.; Singh, H. Study of mechanical properties and high temperature oxidation behavior of a novel cold-spray Ni-20Cr coating on boiler steels. Appl. Surf. Sci. 2015, 328, 13–25. [Google Scholar] [CrossRef]
  25. Latief, F.H.; Sherif, E.-S.M.; Wismogroho, A.S.; Widayatno, W.B.; Abdo, H.S. The Cyclic Oxidation and Hardness Characteristics of Thermally Exposed Titanium Prepared by Inductive Sintering-Assisted Powder Metallurgy. Crystals 2020, 10, 104. [Google Scholar] [CrossRef] [Green Version]
  26. Kang, Y.-J.; Yang, S.; Kim, Y.-K.; AlMangour, B.; Lee, K.-A. Effect of post-treatment on the microstructure and high-temperature oxidation behaviour of additively manufactured inconel 718 alloy. Corros. Sci. 2019, 158, 108082. [Google Scholar] [CrossRef]
  27. Kanjer, A.; Optasanu, V.; de Lucas, M.M.; Heintz, O.; Geoffroy, N.; François, M.; Berger, P.; Montesin, T.; Lavisse, L. Improving the high temperature oxidation resistance of pure titanium by shot peening treatments. Surf. Coat. Technol. 2018, 343, 93–100. [Google Scholar] [CrossRef]
  28. Kavei, G.; Nakaruk, A.; Sorrell, C.C. Equilibrium State of Anatase to Rutile Transformation for Titanium Dioxide Film Prepared by Ultrasonic Spray Pyrolysis Technique. Mater. Sci. Appl. 2011, 2, 700–705. [Google Scholar] [CrossRef] [Green Version]
  29. Xu, Y.; Li, W.; Qu, L.; Yang, X.; Song, B.; Lupoi, R.; Yin, S. Solid-state cold spraying of FeCoCrNiMn high-entropy alloy: An insight into microstructure evolution and oxidation behavior at 700–900 °C. J. Mater. Sci. Technol. 2021, 68, 172–183. [Google Scholar] [CrossRef]
  30. Liu, S.; Jiang, T.; Fan, M.; Tan, G.; Cui, S.; Shen, X. Nanostructure rod-like TiO2-reduced graphene oxide composite aerogels for highly-efficient visible-light photocatalytic CO2 reduction. J. Alloys Compd. 2021, 861, 158598. [Google Scholar] [CrossRef]
  31. Hanaor, D.A.H.; Sorrell, C.C. Review of the anatase to rutile phase transformation. J. Mater. Sci. 2011, 46, 855–874. [Google Scholar] [CrossRef] [Green Version]
  32. Luttrell, T.; Halpegamage, S.; Tao, J.; Kramer, A.; Sutter, E.; Batzill, M. Why is anatase a better photocatalyst than rutile?-Model studies on epitaxial TiO2 films. Sci. Rep. 2014, 4, 4043. [Google Scholar] [CrossRef] [Green Version]
Figure 1. A flow chart representing the experimental procedure adopted to develop and characterize thick Ti deposits using cold spray technology.
Machines 11 00805 g001
Figure 2. SEM images of the feedstock titanium powder used for cold spray deposition: (a) low magnification; (b) high magnification.
Machines 11 00805 g002
Figure 3. EDS of the feedstock titanium powder used for cold spray deposition.
Machines 11 00805 g003
Figure 4. XRD data of the feedstock titanium powder, central region of the cold-sprayed HIP-treated pure Ti-deposit and at the interface of the deposited titanium layer and IN718 substrate.
Machines 11 00805 g004
Figure 5. Optical images of the cold-sprayed HIP-treated pure titanium deposit around the interface at (a) low magnification; (b) high magnification.
Machines 11 00805 g005
Figure 6. SEM images of the cold-sprayed HIP-treated pure titanium deposit without etching at (a) low and (b) high magnification and with etching at (c) low and (d) high magnification.
Machines 11 00805 g006
Figure 7. EDS mapping of the cold-sprayed HIP-treated pure titanium deposited on the IN718 substrate.
Machines 11 00805 g007
Figure 8. Cross–sectional microhardness analysis of the cold-sprayed HIP-treated pure titanium on IN718 substrate.
Machines 11 00805 g008
Figure 9. Load–displacement curve of the cold-sprayed HIP-treated pure titanium deposit obtained through nanoindentation.
Machines 11 00805 g009
Figure 10. Macro-tensile plot showing engineering stress versus engineering strain for the cold-sprayed HIP-treated pure titanium deposit.
Machines 11 00805 g010
Figure 11. Micro-tensile plot showing engineering stress versus engineering strain along with the in situ SEM-micrographs at various crack stages for the cold-sprayed HIP-treated pure titanium deposit.
Machines 11 00805 g011
Figure 12. Fractography analysis of the cold-sprayed HIP-treated pure titanium deposit after micro-tensile test at (a) lower and (b) higher magnification.
Machines 11 00805 g012
Figure 13. Mass gain per area versus number of cycles plot for the cold-sprayed HIP-treated pure titanium deposit subjected to cyclic oxidation in air at 900 °C.
Machines 11 00805 g013
Figure 14. Square of mass gain per area versus number of cycles plot for the cold-sprayed HIP-treated pure titanium deposit subjected to cyclic oxidation in air at 900 °C.
Machines 11 00805 g014
Figure 15. Macrographs of the cold-sprayed HIP-treated pure titanium deposit subjected to high-temperature cyclic oxidation in air at 900 °C.
Machines 11 00805 g015
Figure 16. (a) Cross–sectional optical micrograph; (b) cross-sectional microhardness analysis of the cold-sprayed HIP-treated pure titanium deposit subjected to high-temperature cyclic oxidation in air at 900 °C.
Machines 11 00805 g016
Figure 17. (a) Surface SEM micrographs; (b) EDS spectrum of the cold-sprayed HIP-treated pure titanium deposit subjected to high-temperature cyclic oxidation in air at 900 °C.
Machines 11 00805 g017
Figure 18. EDS mapping of the cold-sprayed HIP-treated pure titanium deposit subjected to high-temperature cyclic oxidation in air at 900 °C: (a) titanium; (b) oxygen.
Machines 11 00805 g018
Figure 19. XRD analysis of the cold-sprayed HIP-treated pure titanium deposit subjected to high-temperature cyclic oxidation in air at 900 °C.
Machines 11 00805 g019
Disclaimer/Publisher’s Note: The statements, opinions and data contained in all publications are solely those of the individual author(s) and contributor(s) and not of MDPI and/or the editor(s). MDPI and/or the editor(s) disclaim responsibility for any injury to people or property resulting from any ideas, methods, instructions or products referred to in the content.

