Abstract
The new technological developments have allowed the evolution of the industrial process to this new concept called Industry 4.0, which integrates power machines, robotics, smart sensors, communication systems, and the Internet of Things to have more reliable automation systems. However, electrical rotating machines like the Induction Motor (IM) are still widely used in several industrial applications because of their robust elements, high efficiency, and versatility in industrial applications. Nevertheless, the occurrence of faults in IMs is inherent to their operating conditions; hence, Inter-turn short-circuit (ITSC) is one of the most common failures that affect IMs, and its appearance is due to electrical stresses leading to the degradation of the stator winding insulation. In this regard, this work proposes a diagnosis methodology capable of performing the assessment and automatic detection of incipient electric faults like ITSC in IMs; the proposed method is supported through the processing of different physical magnitudes such as vibration, stator currents and magnetic stray-flux and their fusion of information. Certainly, the novelty and contribution include the characterization of different physical magnitudes by estimating a set of statistical time domain features, as well as their fusion following a feature-level fusion approach and their reduction through the Linear discriminant Analysis technique. Furthermore, the fusion and reduction of information from different physical magnitudes lead to performing automatic fault detection and identification by a simple Neural-Network (NN) structure since all considered conditions can be represented in a 2D plane. The proposed method is evaluated under a complete set of experimental data, and the obtained results demonstrate that the fusion of information from different sources (physical magnitudes) can lead to achieving a global classification ratio of up to 99.4% during the detection of ITSC in IMs and an improvement higher than 30% in comparison with classical approaches that consider the analysis of a unique physical magnitude. Additionally, the results make this proposal feasible to be incorporated as a part of condition-based maintenance programs in the industry.
1. Introduction
In recent years, the advent of Industry 4.0 has been possible due to the evolution of technologies together with the integration of advanced communication systems [1,2] and smart sensors [3]. Despite this technological growth, the induction motor (IM) remains the medullar column to provide industrial processes with mechanical rotative power and linear motion and to propel mechanisms in general [4]. The typical applications of this machine are pumps, fans, compressors, manufacturing, materials processing, refrigeration, transportation, conveyors, shredders, etc. [5]. Electrical rotating machines are electromechanical systems used in industry because of their benefits such as low cost, high efficiency, high output torque ratio, high power-to-weight ratio, easiness of maintenance, reliability, applicability, and low noise emissions, among others [6,7]. According to the reported literature, induction machines are one of the most common and widespread motors over the globe in industry, constituting around 80% of all industrial equipment [8], and they consume approximately between 40% and 80% of the total energy generated for these companies [9,10,11]. Therefore, considering this information, any industrial process downtime due to motor failures would directly impact aspects like overall costs, maintenance planning, equipment damage or replacement, the possibility of user risks or injuries, and even environmental effects (because the energy consumed by IMs is generated majorly through conventional fuels) [12]. Now, typically the ensemble of an IM considers several components that allow its proper operations, including the principal ones the stator, the rotor, the windings, the rolling bearings, and the fan [13]. Recently, several scientific reviews have analyzed and concluded, in relation to the motor components, that the most typical faults and their corresponding percentages ranges of occurrence are the following [14,15,16]: bearing faults between 40% to 50%, stator winding faults between 28% to 38%, rotor related faults between 5% to 10%, and other associated faults between 12% to 28%. From previous information, it can be noted that the faults associated with the stator windings are the second major problems that appear in the components of the IM. However, also, in turn, a specific failure related to the stator circuit is the inter-turn short-circuits (ITSC) faults [17] that affect the IM performance with a high probability of severe equipment damage, and for this reason, they are still a topic of interest.
Particularly speaking about the ITSC faults in electric rotative machines, in the literature, much research has been carried out addressing this phenomenon. It has been reported that ITSC faults are the most common and frequent electrical problems, and they represent approximately 30% to 40% of all types of stator circuit damage [18]. These faults are understood as damage in the winding insulation, and they can occur at different locations of the coil turns in a single phase [19]. The general circumstances that cause failures in electric motors are harsh environments in the industry, like high temperatures, humidity, mechanical tension due to overloads, contamination, grease, vibrations, electric discharges, and overvoltages, among others [20]. However, for the particular case of the ITSC, the causes are, for example, flows of current with an intensity that exceeds the nominal operating conditions, consequently generating a release of energy in the form of heat and mechanical stress, or the use of fast switching PWM inverters that accelerates the insulation degradation [19,21]. Some effects of the ITSC faults in the motors are, of course, malfunctioning in its operation, performance reduction, local magnetic saturation, and asymmetric behavior of the motor, to mention some [20,22]. With the purpose of better understanding the inter-turn short circuits, several investigations have developed models of these faults, such as the case of the finite element models (FEM) [18,23], parametric mathematical models based on electrical circuits [24,25], and combined FEM-parametric models [26,27]. The objective of such models is the development of methodologies for detecting such faults in simulation environments but assuming or omitting other conditions that could happen in real systems.
Regarding the classical methodologies, there are several works that have developed approaches addressing the detection of ITSC. For example, in [6], the implementation of an improved wavelet packet transform (WPT) was done over the rotor current and the motor vibration signals in LabVIEW for permanent magnet synchronous motors (PMSM). In other work, like [28], a Kalman filter excludes the frequency components corresponding to the 3rd, 5th, and 7th harmonics in the current signal measured from an IM, then the time-frequency spectrogram of the signal is used to obtain a gray level image and its corresponding histogram. With this information, considerable deviations of the histogram distributions from a normal distribution are used for detecting the ITSC. On the other hand, some works focused their efforts on the development of methodologies based on non-intrusive signals like magnetic flux in motors for detecting ITSC faults; such is the case in [29], which presents a statistical methodology for detecting ITSC faults that uses a correlation coefficient between two external magnetic field signals measured by two sensors located symmetrically in the motor vicinity. The correlation obtained is based on the Pearson correlation coefficient applied to induction and synchronous machines. In this same area, the approach described in [30] also makes use of non-invasive stray magnetic field sensors for discriminating ITSC on salient pole synchronous generators (SPSG). To achieve the discrimination of the fault, the system model is developed using the finite element method (FEM) and by introducing a unique pattern observed on the time-frequency domain signal processing through the short-time Fourier transform (STFT). For its part, an online approach for detecting ITSC in PMSM is developed in [31] using the stray magnetic field measured from the stator yoke. For this purpose, the inter-turn short-circuits dynamic and the stray magnetic flux dynamic are implemented through FEM considering 24 sensitive tunneling magnetoresistive (TMR) sensor units. In other work, the harmonic analysis of different electric signals is performed in [32] for detecting ITSC in the stator windings of squirrel cage IMs. The signals considered are stator phase current, external magnetic flux, and electromagnetic torque at different load levels. The validation of this proposal was made through a simulation by means of FEM. Meanwhile, [33] presents a methodology for diagnosing ITSC faults for line start PMSM through the frequency analysis of acoustic signals. The acoustic signals are decomposed through the fast Fourier transform (FFT), analyzing their amplitudes. It is worth mentioning that many works address the ITSC faults diagnosis on motors through infrared thermographic analysis, such as in [34], which develops an online non-intrusive algorithm that extracts features from the infrared histogram of the images profile taken from the hottest region of the machine surface. In this same line, the research in [35] describes an online non-invasive technique that detects the ITSC fault and its severity through two methods. The first method uses transient thermal monitoring during motor starting, and the second method implements a pseudo-coloring technique on an infrared image of the motor in the steady state. On the same line, the work in [36] presents a methodology for diagnosing ITSC faults in the stator winding based on an infrared thermopile sensor array (IRSA) and a hall-effect sensor array (HESA). With these arrays, direct contactless measurements of temperature and magnetic flux distribution along the end-winding region are done. Later, deviations in thermal and magnetic symmetries induced by the faults are assessed for detection. For its part, the work presented in [37] develops a metal-coated fiber Bragg grating (FBG) sensor to monitor the temperature and magnetic field around the end winding of IMs. The sensor measurements are decoupled by a filtering stage, and the separated data is analyzed in the time-frequency domain for detecting the ITSC. From previous works discussion, it is notorious the effort done for diagnosing the inter-turn short-circuits on electric motors in what can be defined as classical ways of acquiring signals and processing them using space transformations. However, they are mostly validated through model simulations omitting some real operating conditions, and they do not consider data fusion to improve detection reliability.
Recently, some methodologies addressed the use of data-driven (DD), machine learning (ML), and deep learning (DL) techniques for detecting and diagnosing motor faults associated with ITSC with high accuracy. For example, an online fault detection framework is developed in [38] by collecting data from IMs, performing multiple extraction/selection of features, finding the most sensitive ones in the frequency domain, and enhancing the classification task by integrating multiple classifiers. Meanwhile, in [39] a methodology for incipient ITSC diagnosis on PMSM based on data-driven digital twins is described. For this purpose, a theoretical analysis of the three-phase current residuals under ITSC is carried out, and a digital twin model of a healthy target motor is defined through the nonlinear auto-regressive model with exogenous inputs (NARX) network, at last, the incipient faults are detected through current residual. Now, about the machine learning (ML) approaches, several works have developed methodologies, such as in [40], where support vector machines (SVM) and convolutional neural networks (CNN) techniques are implemented for diagnosing ITSC on PMSM. In such work, it was demonstrated that SVM have more efficient training than CNN, considering that the first technique requires much fewer data. In the same context, a developed algorithm combines the discrete wavelet transform (DWT) for multiresolution analysis (MRA), statistical features extraction, and ML techniques to processes voltage signals generated by axial leakage flux from an IM for detecting incipient ITSC [41]. In another case, a fault diagnosis method applied to PMSM is presented in [42], where a sparse representation is used for extracting the first and second largest sparse coefficients of current and vibration signals, and for composing four-dimensional feature vectors. Then, the feature vectors are input to the SVM for final diagnosis of ITSC, this is convenient for small sample sets. Similarly, the study presented in [43] explores the potential of several ML classifiers and signal processing for the online condition monitoring of ITSC in the field winding of SPSG. In that work, the data set for the ML is generated by applying the FFT to the power spectral density of the air gap magnetic field, DWT energies, and time series feature extraction based on a hypothesis test. At last, but not least, the deep learning techniques are also present in the ITSC fault diagnosis. For instance, in [44], an approach based on the conditional generative adversarial net (CGAN) and an optimized sparse auto encoder (OSAE) applied to PMSM is described; an important attribute of this approach is the use of small sample sets. Other work explores the use of neural networks as efficient diagnostic tools for estimating the percentage of stator winding shorted turns on three-phase IMs. The implementation was done in MATLAB under different load conditions [45]. From the previous discussion of the works reported in the literature, it can be noted that data-driven, machine learning, and deep learning are techniques and schemes that provide reliable approaches for detecting ITSC. Most of them use the analysis of two measured signals, such as current and vibration, or current and stray magnetic flux from the motor. However, it would be interesting to explore the potential of using currents, vibrations, and stray magnetic flux signals from different sensor channels (or sensor axes), perform features extraction, and make data fusion and classification. This way, in Table 1, a summary of the challenges and drawbacks of the classic and recent (DD, ML, and DL) techniques reported in the literature is presented, as well as the motivations for this proposed work.

Table 1.
Summary of reported works with their drawbacks and limitations, and challenges and motivations.
The contribution of this work is with an integrated methodology based on a statistical machine learning strategy and the data fusion of several physical signals measured from an induction motor for detecting the early occurrence of ITSC faults.
- In the first place, the physical signals from the motor corresponding to the phase currents, the vibrations, and the external magnetic stray flux are acquired.
- Next, several statistical features are extracted from the time-domain signals to compose sets of sensitive matrices of features related to the fault condition, which will integrate a general high-dimensional matrix providing meaningful information about the fault not directly from the time-domain signals but considering its statistical data patterns.
- Posteriorly, a feature-level fusion is carried out through the linear discriminant analysis, which will reduce the matrix of features of high dimensionality to a two-dimensional representation having those significant features to be used in the last classification stage.
- Finally, a classifier with a simple structure based on the neural networks is implemented for performing the final diagnosis.
The proposed methodology can detect different machine conditions, and for this case, four conditions are considered: the healthy state of the motor and three fault conditions with different severities of ITSC (2, 4, and 6 coil turns in short circuits). The experimental tests considered the motor operation under four operating frequencies (15 Hz, 30 Hz, 50 Hz, and 60 Hz). The obtained results demonstrate the reliability and efficiency of the proposed methodology. The rest of the paper is structured as follows; Section 2 includes the Material and Methods that must be followed to perform the detection of different severities of ITSCs; additionally, Section 2 includes the most important theoretical aspects that ITSCs introduce IMs. Section 3 describes the Experimental test bench that is considered to carry out different experiments; Section 4 presents the Results and Discussion that support the effectiveness and reliability of this proposal; and Section 5 presents and highlights the most important conclusions and proposed future work.
2. Materials and Methods
Electrical rotating machines like the induction motor (IM) are subjected to electrical stresses that can lead to the sudden occurrence of faults; in this sense, the stator inter-turn short-circuits (ITSC) are common faults caused by problems associated with the stator winding insulation. Consequently, an amplitude increase is produced in the harmonic components of the stator current signature when IMs are operating under the influence of ITSC; similarly, the air-gap flux density is also modified when ITSC occurs. In this regard, classical approaches based on the motor current signature analysis (MCSA), or the spectral representation in the frequency domain as indicated in Table 1, perform the detection of ITSC by analyzing the spectra of stator currents and/or magnetic stray-flux through Equation (1) [6,7,30]:
where represents the supply frequency, is the per unit slip, is the pair of poles in the IM, and and are integers that can be defined as and
On the other side, although electrical problems such as ITSC produce direct affections over those electrical patterns like stator currents or stray magnetic flux, the abnormal appearance of vibrations is additionally produced since the magnetic field asymmetry is altered by the three-phase asymmetry of the IM windings. Theoretically, a characteristic fault-related vibrations frequency component of the stator appears at ; moreover, the occurrence of vibrations due to ITSC leads also to characteristic harmonic components that can be located at and on a vibration spectrum. Accordingly, regardless that ITSC in IMs can be detected through different physical magnitudes like stator currents, magnetic flux and vibrations, the accurate assessment depends on the considered signal processing. Hence, processing techniques achieved in the time domain, frequency domain, and time-frequency domain are commonly used to analyze signals and extract characteristic fault-related patterns produced by the occurrence of faults.
It is worth mentioning that the proposed work considers statistical machine learning (SML), which uses statistical indicators as features for learning data patterns from measured sensor signals processed in the time domain but can be carried out in any other domain (frequency and time-frequency), instead of conventional machine learning (CML). This is done because SML maintains methodological simplicity, in counterpart to CML that uses any type of feature, whether this is a statistic or not, like energy indicators, correlation indexes, errors, electrical indicators, acoustic indicators, and thermal indicators, among others, which could require extra data-processing. Aiming to contribute to the field of condition monitoring and fault detection, in this work is proposed a diagnosis methodology for detecting the incipient occurrence of ITSC in IMs through the estimation of a set of statistical time-based domain features from different physical magnitudes such as stator currents, magnetic stray-flux and vibrations. Additionally, the computed statistical features are then pooled to carry out a feature-level fusion by means of the linear discriminant analysis (LDA) technique. Finally, the automatic identification of incipient ITSC in IMs is achieved by a proposed neural network (NN) classifier. The flow chart of the proposed method is shown in Figure 1 and consists of five main steps: (i) Electromechanical pulley-belt system, (ii) Data acquisition, (iii) Feature calculation, (iv) Feature fusion-reduction, and (v) Automatic fault classification.
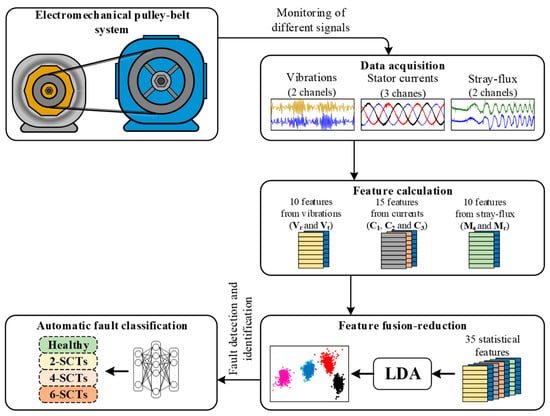
Figure 1.
Flow chart of the proposed methodology based on the acquisition of different signals for identifying the incipient occurrence of ITSCs in IMs.
2.1. Electromechanical Pulley-Belt System
The electromechanical pulley-belt system is the system under evaluation and is composed of an IM coupled to an automotive alternator (AA) by means of a pulley-belt system. Particularly, in the IM are tested four different conditions comprising the healthy state (HLT) and three incipient conditions of ITSC such as 2-SCTs, 4-SCTs, and 6-SCTs. Each one of the aforementioned conditions is iteratively tested in the IM under different operating conditions, where the supply frequency is set with different values (15 Hz, 30 Hz, 50 Hz and 60 Hz) in order to monitor its behavior through multiple sensors that allow the measurement of vibrations, stator currents, and magnetic stray flux.
2.2. Data Acquisition
The data acquisition is carried out by a self-designed and proprietary data acquisition system (DAS) based on a field programmable gate array (FPGA); hence, the proprietary DAS allows the continuous monitoring of the IM operation by means of the measurement of vibrations, stator currents, and magnetic stray flux signals. Specifically, the vibrations are measured from the radial () and tangential () axes of the IM, the stator currents belong to the three lines currents () of the IM, and the stray magnetic flux comprises the measurement of the axial () and radial () components. In this regard, for each performed test, the aforementioned signals are continuously recorded and stored in a personal computer for further analysis; moreover, the acquisition of the signals is carried out during 150 s of the continuous operation of the IM.
2.3. Feature Calculation
Most of the proposed condition monitoring strategies include stages in which the feature calculation is performed to obtain those representative fault-related patterns that better characterize the effects produced by the occurrence of faults; indeed, different processing techniques in different domains (time, frequency, and time-frequency) are usually applied to the set of available physical magnitudes as a part of the feature calculation. Thus, in this work, the feature calculation is carried out by analyzing each one of the acquired signals (vibrations, currents, and stray magnetic flux) in the time domain; precisely, a set of five statistical time-domain features is proposed to be estimated from each acquired signal, where the sampled points of each acquired signal are the most important parameter to achieve the feature calculation. The calculation of the five statistical features, according to Table 2, is applied to each one of the acquired signals per sensor channel, that is, and from the vibration sensor, from the three current lines, and and from the stray magnetic flux sensor. This way, a total of 10, 15, and 10 statistical features are defined per sensor signal. Hence, if is a vector that represents one of the acquired signals and it is composed of samples, is first segmented into equal parts where each segmented part has a number of points (samples) equal to , as in Figure 2 is shown. Specifically, the segmentation of in terms of and is achieved by following the proposed Equation (2).
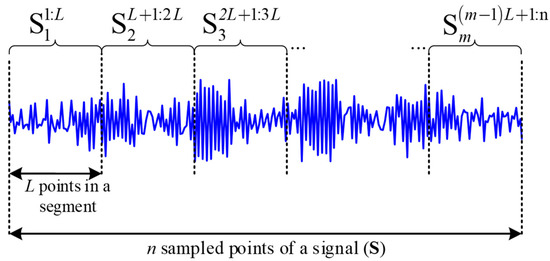
Figure 2.
Representation of the signal segmentation that is performed to estimate the set of five statistical time-domain features from each one of the acquired physical magnitudes.
Once the signal segmentation is carried out, from each segmented part is estimated the meaningful set of five statistical time-domain features leading to obtaining a characteristic feature matrix for each considered physical magnitude. That is, i.e., for the vibration signal measured in the radial () axis is the estimated characteristic feature matrix composed of five columns (representing each statistical feature) and rows (representing each segmented part of the signal); indeed, the signal segmentation is also accomplished to generate a consecutive set of samples. Certainly, the vibration signals are estimated as and for the radial and tangential axis, respectively; from the stator signatures are estimated as , and correspondingly for each current line and, from the axial and radial magnetic stray-flux components, are estimated and , respectively. The set of statistical time-domain features as well as the corresponding mathematical expressions are summarized in Table 1, Equations (3)–(7). These statistical features are proposed due to their capability to model trends, distributions, asymmetries, forms, dispersion, and changes in signals; additionally, their low computational cost can lead to quick responses when implemented.
Table 2.
Considered set of statistical time-domain features for the characterization of the acquired signals, where is the input vector of data; and is the k-th individual sample.
Table 2.
Considered set of statistical time-domain features for the characterization of the acquired signals, where is the input vector of data; and is the k-th individual sample.
| Name | Mathematical Equation | |
|---|---|---|
| Maximum value, | (3) | |
| Root mean square, | (4) | |
| Standard deviation, | (5) | |
| Shape factor, | (6) | |
| Crest factor, | (7) |
2.4. Feature Fusion-Reduction
The stage of feature fusion-reduction is proposed for combining the whole available information from different sources and then for reducing such information into a lower representation in a new feature space. In this regard, the fusion of all previously estimated feature matrices (, , , , , and ) is performed within a feature-level fusion approach; that is, all feature matrices are pooled into a single set, as appreciated in Figure 3. Hence, the feature matrices , and are generated first to group the characteristic feature matrices for each corresponding physical magnitude; that is, , , and are defined as , and ; where represents the pooling of information for the acquired vibrations in the radial and tangential axes, in are pooled the information for the three current lines and, contains the pooling of information for the stray magnetic flux in the axial and radial axes. Subsequently, , , and are then pooled into a Global Feature Matrix () leading to obtain a high-dimensional representation of the different conditions under evaluation. Additionally, it should be clarified that a specific is obtained for each one of the studied conditions (HLT, 2-SCTs, 4-SCTs, and 6-SCTs) that are experimentally tested under different operating frequencies (15 Hz, 30 Hz, 50 Hz, and 60 Hz); accordingly, , , and are the for the HLT, 2-SCTs, 4-SCTs, and 6-SCTs conditions, respectively. Afterward, all are also grouped, as observed in Figure 3, and then subjected to a reduction and space transformation procedure by following Equation (8) in order to carry out the reduction from to . Thus, a new set of extracted features () are obtained by the linear combination between the input feature space () and the weighting coefficients (); for this proposal, of the . Indeed, one of the aims of the LDA is to find the best combination of coefficients of that lead to a better class separation by following the criteria of Equation (9), where, and are the mean and intra-class variance of the i-th class. Thus, the implementation of the LDA also facilitates the visualization of all evaluated conditions due to the newly extracted features can be projected into a 2D space which denotes the linear combination (in different weights) of the original feature space; that is.
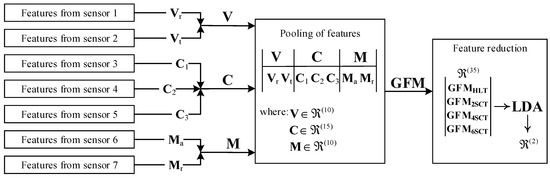
Figure 3.
Representation of the feature-level fusion approach performed in this work for fusing information from different physical magnitudes.
2.5. Automatic Fault Classification
The automatic fault classification of incipient ITSC in IMs is carried out by an NN-based classifier with a simple structure. The main objective of this stage is to evaluate the set of features extracted by the LDA technique; specifically, the extracted features () are the set of features evaluated in the NN classifier. In this sense, the proposed NN classifier consists of three main layers such as input, hidden, and output, where the input layer is represented by two neurons since in the previous stage, “Feature fusion-reduction” is performed the reduction from to , the hidden layer has ten neurons, as is recommended in the literature [46], and four neurons compose the output layer representing each one of the evaluated conditions. A representation of the proposed NN structure is presented in Figure 4. In addition, the NN-based classifier is trained and tested under a k-fold cross-validation scheme (with k = 5) aiming to obtain statistically significant results; thus, the training and validation of the NN is accomplished under the one-leave-out scheme that considers segmenting the total number of samples into two parts with a 4:1 ratio. That is, the total number of samples of the data set is divided in k = 5 parts and in the first-fold, i.e., the first four parts are used for training purposes whereas the last part is used for validation; then, the training and validation of the NN is achieved for the second, third and the k-th fold while the training and validations data changes for each fold. On the other hand, fifty epochs and a back-propagation algorithm are considered for the training of the NN. Moreover, the NN classifier considers a sigmoid function as the activation function allowing us to evaluate the percentage of correspondence with each membership function in the output layer.
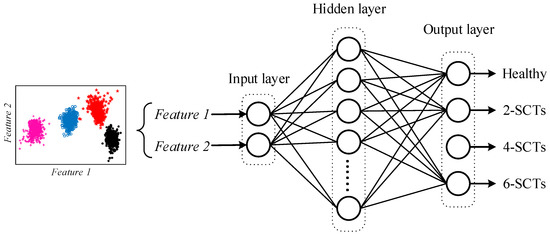
Figure 4.
Schematic representation of the simple structure considered in the proposed NN-based classifier for carrying out the automatic fault detection and identification of incipient ITSCs in IMs.
3. Experimental Test Bench
In order to verify the performance of the proposed methodology for the detection of the incipient occurrence of ITSC in IMs, experimentation is performed using a 1.49 kW (2HP) three-phase induction motor from WEG. The main specifications of the motor are summarized in Table 3 [14,17].
Table 3.
Specifications of the 2HP WEG induction motor under test.
To feed the IM, it is used a variable frequency drive (VFD) so the rotational speed can be controlled. In this work, a total of four different frequencies are achieved by using the VFD: 15 Hz, 30 Hz, 50 Hz, and 60 Hz. This way, it is possible to demonstrate the effectiveness of the proposed approach regardless of the frequency of the power supply. Additionally, with the purpose of providing the motor with a load, it is coupled to a 12 V alternator by means of a pulley-belt system that represents between the 15% and the 25% of the nominal load. To produce the occurrence of ITSC in the IM, three different severities of ITSC are artificially induced in a single stator winding. The first severity considers 2-short circuit turns (2-SCTs), the second one 4-SCTs, whereas the third comprises 6-SCTs. Since the motor under test contains a total of 141 turns per phase winding, these severities represent 1.42%, 2.85% and 4.28% of damage, respectively. Therefore, a total of four operating conditions are assessed in this work: the healthy condition (HLT) and three ITSC severities (2-SCT, 4-SCT, and 6-SCTs). Moreover, every condition is also tested using the four operating frequencies generated by means of the VFD (15 Hz, 30 Hz, 50 Hz, and 60 Hz). To achieve the different ITSC severities, three taps are located at the points where the faults were induced. Each tap can be selected by closing a switch connected to an external resistor, , so the short circuit current can be limited to avoid catastrophic damage to the motor (see Figure 5).
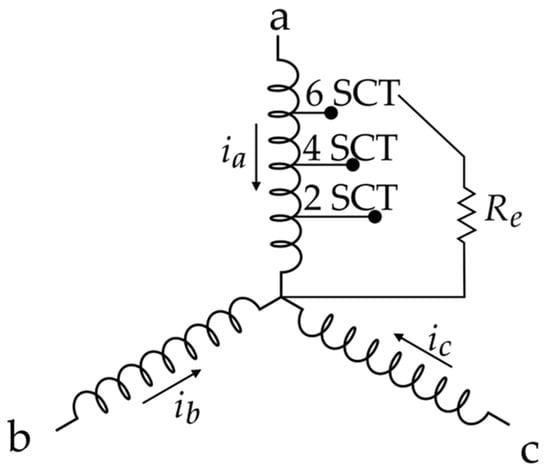
Figure 5.
Schematic representation of different severities of the ITSCs tested in an IM, where, , and are the currents through the IM windings, is the external resistor used to avoid damages in the IM when 2, 4 and 6 SCT are artificially induced.
The proposed method considers the use of three different physical magnitudes: vibrations, stator currents, and stray flux. The vibration signals are measured using a three axes accelerometer (LIS3LL02AS4) that is configured to work in the range of ±6 g. This sensor is located at the top of the IM; as shown in Figure 6, the measurement of vibration belongs to the perpendicular plane of the IM axis (radial and tangential axes). Additionally, to carry out the stator current measurements, three hall-effect sensors L08P050D15 are placed in the power lines that go from the VFD to the IM. Finally, a proprietary board that uses hall sensors A1325 from ALLEGRO is used to obtain the IM stray flux. This board is also located on the top of the motor, next to the accelerometer, as shown in Figure 6, and it can sense the radial flux and the axial flux simultaneously.
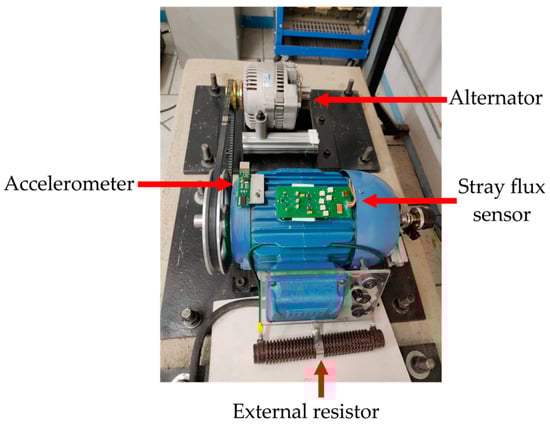
Figure 6.
Main components of the experimental test bench.
All the data delivered by the sensors are collected using a proprietary data acquisition system (DAS) that is based on a field programmable gate array (FPGA) technology. The DAS includes two 4-channel analog-to-digital converters with 12-bit resolution (ADS7841 from Texas Instruments). This way, it is possible to acquire the occurrence of vibrations, the stator current consumption, and the magnetic stray-flux in the IM at a single run; also, each acquired physical magnitude is acquired with a sampling frequency of 3000 Hz, 6000 Hz, and 4000 Hz, respectively. During each performed test, the aforementioned signals are collected during 150 s of the steady-state operation of the IM and then are sent to a personal computer where they are stored to be processed offline.
4. Results and Discussion
The proposed diagnosis methodology is developed under Matlab 2022a, which is a dedicated software used in a wide range of applications for different disciplines; on the other hand, this proposal is validated under a real data set acquired from several experiments that are performed in a laboratory test bench, thus, as the proposed method describes, the acquisition of two vibrations signals ( and ), three stator currents signatures () and two magnetic stray-flux signals ( and ) are continuously measured during the experimental evaluation of the healthy condition (HLT) and three incipient conditions of ITSC (2-SCTs, 4-SCTs, and 6-SCTs). In addition, each one of the conditions under study is tested under different operating frequencies in the VFD (15 Hz, 30 Hz, 50 Hz, and 60 Hz). Consequently, each test acquired approximately 450 kSamples for each vibration signal, 900 kSamples for each stator current signature, and 600 kSamples for each magnetic stray flux signal.
Subsequently, the feature estimation is carried out in order to characterize the acquired signal for each performed test. In this regard, Equation (2) is applied to each one of the stored physical magnitudes in order to segment them in equal parts of one second; hence, for vibration signals, the length used in Equation (2) is equal to ; meanwhile, is equal to and for the stator currents and stray magnetic flux, respectively. Once the segmentation of the signals is accomplished, the estimation of the meaningful set of five statistical time domain features is individually estimated from each segmented part for each acquired signal. Then, for each studied condition is estimated a set of characteristic feature matrices, , , , , , and , where each feature matrix has five statistical features with 150 consecutive samples. Due to each condition under study being tested at different operating frequencies, a Global Feature Matrix () is generated for the HLT condition and for the three incipient conditions of ITSC (2-SCTs, 4-SCTs, and 6-SCTs); thus, the is generated as a matrix arrangement comprising the pooling of all characteristic feature matrices, , , , , , and , for all physical magnitudes and all operating frequencies. For example, depicts the HLT condition generated by following the matrix arrangement of Equation (10). As appreciated, feature matrices for different physical magnitudes are included as columns; meanwhile, feature matrices for different operating frequencies are included as rows. Similarly, for the conditions related to SCT are generated the , , , for 2-SCTs, 4-SCTs, and 6-SCTs, respectively. It should be mentioned that each one of the previous is composed of 35 statistical time domain features estimated from different physical magnitudes (5 statistical features per available signal) with 600 consecutive samples, 150 samples per operating frequency.
Next, , , , and are then subjected to the dimensionality reduction procedure through the application of the LDA technique; thereby, the for all the studied conditions are first concatenated by following Equation (11) to generate an original feature space represented by comprised by 35 statistical time domain features as columns and 2400 rows as samples (600 samples per conditions). Afterward, Equations (8) and (9) are taken into account to perform the feature reduction by considering that each column of represents the i-th feature. Consequently, during the reduction procedure is performed a space transformation from to . Consequently, the use of the LDA allows the visualization of all considered conditions into a 2D plane. Figure 7 shows the resulting projection in which it is possible to appreciate that all studied conditions appear separated from each other. Additionally, it must be highlighted that the extracted features (Feature 1 and Feature 2) that are projected into the 2D plane also represent the linear combination, in different weights, of all considered features. In this regard, Table 4 summarizes the weights assigned by the LDA during the feature reduction process. From Table 4, the importance and contribution of each estimated feature can be analyzed; precisely, large absolute values mean high importance, whereas small absolute values can be understood as non-relevant features.
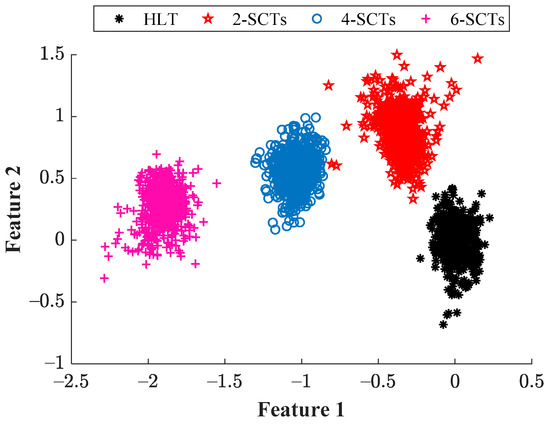
Figure 7.
Visual representation achieved by the LDA technique in a 2D plane when considering the vibration signals, stator currents, and magnetic stray-flux for all considered conditions.
Table 4.
Weights assigned by the LDA during the feature reduction procedure when transforming the original feature space () into a lower space ().
Later, the extracted features by the LDA technique are then evaluated under a five-fold cross-validation scheme through the proposed NN-based classifier with the aim of carrying out the final diagnosis outcome; thereby, for each considered condition, 480 samples are used for training purposes, and 120 samples are used for validation purposes. The training of the NN is achieved under a back-propagation approach during 70 epochs and, as an activation function, is used a sigmoid function. Hence, the global classification ratio achieved during the training is 100%, whereas 99.4% is reached during the validation; in addition, Table 5 summarizes the individual classifications. From Table 5, the proposed methodology leads to a high-performance classification avoiding positive falses, which is a critical issue that may lead to machine breakdown. On the other side, the use of the proposed NN classifier also facilitates the estimation of the decision regions on the 2D plane; hence, the decision regions for each tested condition are shown in Figure 8, from the modeled classification regions in Figure 8 it can be observed that a specific region has been assigned for each particular condition and, the assessment of new or unknown samples can be carried out in order to determinate the actual condition of IMs that suddenly operates under ITSC.
Table 5.
Achieved classification ratios through the proposed NN-based classifier for the evaluation of the extracted features by the LDA for all assessed conditions.
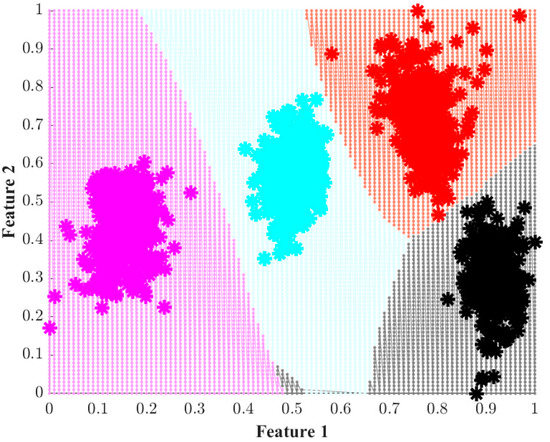
Figure 8.
Resulting decision regions carried out by the proposed NN-based classifier when the 2D extracted features are evaluated, where, the black region belongs to the Healthy conditions and the regions in red, cyan and magenta belong to 2, 4 and 6 SCT, respectively.
Finally, in order to highlight that the fusion information of different physical magnitudes such as vibrations, stator currents, and magnetic stray-flux leads to an accurate detection of incipient ITSCs in IMs, the characteristic feature matrices estimated from different signals are individually analyzed and then are also combined between them whit the objective of evaluate their performance. In this regard, the statistical features for vibrations, stator currents, and magnetic stray-flux are individually subjected to the same reduction procedure by means of the LDA technique; specifically, the corresponding characteristic feature matrices , , and for the conditions under study and different operating frequencies are subjected to the space transformation obtaining the 2D visual projections of Figure 9a–c, respectively. As it is appreciated in Figure 9a, an overlapping between all considered conditions is achieved when vibrations signals are individually analyzed; on the other side, Figure 9b shows the separation between considered conditions with an improved (but severe overlapping between HLT and 2-SCTs conditions is presented) whether stator current signals are individually processed; and, in Figure 9c is observed an overlapping between all conditions under analysis. Therefore, the consideration of single physical magnitudes may affect the performance during the detection and classification of incipient faults like ITSC in IMs. On the contrary, the combination of different physical magnitudes may result in a practical solution that can increase the capabilities of condition monitoring strategies for detecting the occurrence of faulty conditions. Subsequently, the first combination considers only vibrations and stator currents; the second combination uses vibrations and magnetic stray-flux; and the third combination includes stator currents with magnetic stray-flux. Then, each one of these combinations is subjected to the feature reduction procedure through the LDA, and the resulting 2D projections are shown from Figure 9d to Figure 9f for each combination. As appreciated, the most critical case is when vibrations and magnetic stray-flux are combined since samples of all considered conditions appear to overlap between them; on the other hand, an improvement is obtained when the combinations of vibrations and stator currents as well as stator currents with magnetic stray-flux; however, for these combinations, the classifier may produce misclassifications between the HLT and 2-SCTs conditions. To finish the validation and for comparative purposes with classic solutions, the extracted features from Figure 9a–f are also evaluated under the same NN structure, and the global classification ratios achieved during the training and validations are summarized in Table 6. From Table 6, it can be noticed that when only considering vibration signals it is achieved an average global classification ratio of about 49.4% during the training and validation of the NN; in the meantime, an averaged global classification ratio of about 91.0% is obtained for the case of analyzing only current signals; finally, when the magnetic stray-flux signal are individually evaluated is achieved an averaged classification ratio of about 66.1% for the training and test of the NN. This makes sense because the signal of current is directly affected by the ITSC fault, while the other two variables are indirectly affected. For example, the second variable that gives better results is the magnetic stray-flux; this assertion is due to this physical magnitude being directly dependent on the current magnitude, but also confirming that this non-intrusive signal is also helpful in providing information related to the fault. Now, the case of the vibration signal providing the worst performance due to its minor relation to the analyzed faults confirms that vibrations can, in fact, provide some information about the ITSC faults, but it is perhaps more helpful when the analyzed fault is related to a mechanical problem. Nevertheless, despite the interesting results obtained by analyzing the signals separately, as classical approaches do, their performance is lower than those obtained through data fusion, and they are still far from the performance reached by fusing the signals of the three variables. On the other hand, as Table 6 summarizes, the global classification ratios show an improvement when is considered the combination of physical magnitudes, that is, the averaged global classification ratios for the combination of vibrations and stator currents generates, vibrations and magnetic stray-flux and, stator currents with magnetic stray-flux are of about 89.7%, 84.3%, and 97.6%, respectively. The obtained results show that this proposal can lead to accurate identification of ITSCs in IMs, achieving a global classification ratio of about 99.4% and showing to produce an improvement higher than 30% in comparison with classical approaches that consider the analysis of a unique physical magnitude. Moreover, the characterization of vibrations, stator currents, and magnetic stray-flux by means of statistical features offers a trade-off between simplicity efficiency when trends and changes are modeled from raw time-domain signals.
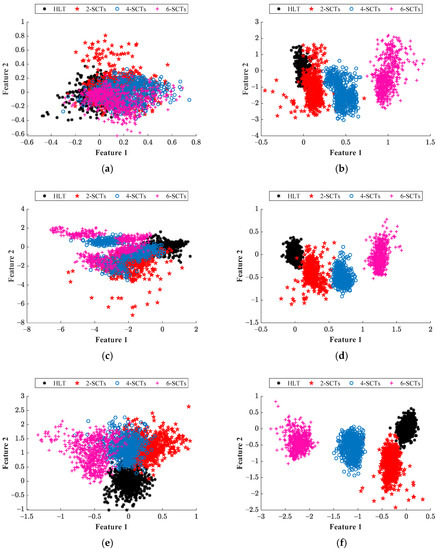
Figure 9.
2D projection achieved by the LDA technique when the physical magnitudes are combined as (a) vibrations, (b) stator currents, (c) magnetic stray-flux, (d) vibrations + stator currents, (e) vibrations + magnetic stray-flux, and (f) stator currents + magnetic stray-flux.
Table 6.
Achieved classification ratios performed by the proposed NN-based classifier when different combinations of physical magnitudes are considered.
5. Conclusions
The ITSC are common faults in IMs, and they can produce catastrophic damage with consequences not only for the machinery but also for the safety of the personnel in the surroundings. Therefore, the development of strategies and methodologies for the proper identification of these faults becomes important for the industrial sector. In this sense, this work presented a diagnosis methodology based on multi-sensor data fusion and statistical machine learning to perform the detection and identification of different severities of ITSC that can occur in IMs. An important aspect to be highlighted is the measurement of vibrations, stator currents, and magnetic stray-flux in an IM, allowing reliable monitoring; also, their characterization through a meaningful set of statistical features leads to a high-performance characterization of the IM condition. Thus, while most of the methodologies reported so far only use simulated signals, this work is carried out through experimentation with real signals from an induction motor with different damage severities. The results show that the selection of the physical variables to be used for the detection of the fault is not a trivial task. In this sense, the fusion of vibration, stator current, and magnetic stray flux data improve the results compared with the use of only one or two of these magnitudes. This situation results in a detection accuracy higher than 98%, proving that the proposed methodology is a helpful and reliable tool for identifying and classifying ITSC faults in IM. Moreover, it is worth noting that one of the major drawbacks of the machine learning approaches relies on the use of big amounts of data, a situation that results in complex processing and classification tasks that require a high computational burden. To overcome this issue, this work is used the LDA technique to perform a dimensionality reduction, projecting all the data in a 2-dimensional space without losing relevant information. This way, it is possible to implement a simple classifier based on artificial neural networks. Finally, as a future work, it is planned to extend this study to other faults like phase-to-phase and phase-to-ground short circuits in IMs and their corresponding analysis under a power quality perspective; additionally, the implementation of this proposed methodology is planned to be implemented in a Hardware platform aiming to develop a diagnostic tool capable of provide real-time responses.
Author Contributions
Conceptualization, J.J.S.-D., A.Y.J.-C. and D.A.E.-O.; methodology, A.Y.J.-C. and D.A.E.-O.; software, J.J.S.-D.; validation, J.J.S.-D., A.Y.J.-C. and D.A.E.-O.; formal analysis, J.J.S.-D.; investigation, A.Y.J.-C.; resources, J.J.S.-D.; data curation, D.A.E.-O.; writing—original draft preparation, A.Y.J.-C.; writing—review and editing, A.Y.J.-C.; visualization, D.A.E.-O.; supervision, A.Y.J.-C. and J.J.S.-D.; project administration, J.J.S.-D.; funding acquisition, J.J.S.-D. All authors have read and agreed to the published version of the manuscript.
Funding
This project has been partially supported by the Universidad Autonoma de Querétaro through “Fondo para el Desarrollo del Conocimiento” (FONDEC-UAQ-2022) under project number 20205007071601.
Conflicts of Interest
The authors declare no conflict of interest.
Glossary and Nomenclature
| Vibration signals from radial and tangential axes | |
| Stator current signals from lines 1, 2 and 3 | |
| Magnetic stray-flux signals from axial and radial axes | |
| Generic signal | |
| Total number of samples of | |
| Number of segmented parts of | |
| Number of points for a segment | |
| Feature matrices for radial and tangential vibrations | |
| Feature matrices for stator currents in lines 1, 2 and 3 | |
| Feature matrices for axial and radial magnetic stray-flux | |
| Characteristic feature matrix for vibrations | |
| Characteristic feature matrix for stator currents | |
| Characteristic feature matrix for magnetic stray-flux | |
| , , , | Global feature matrices for the HLT, 2SCT, 4SCT, and 6SCT conditions. |
References
- Hajoary, P.K. Industry 4.0 Maturity and Readiness—A Case of a Steel Manufacturing Organization. Procedia Comput. Sci. 2023, 217, 614–619. [Google Scholar] [CrossRef]
- Faheem, M.; Fizza, G.; Ashraf, M.W.; Butt, R.A.; Ngadi, M.A.; Gungor, V.C. Big Data Acquired by Internet of Things-Enabled Industrial Multichannel Wireless Sensors Networks for Active Monitoring and Control in the Smart Grid Industry 4.0. Data Brief 2021, 35, 106854. [Google Scholar] [CrossRef]
- Soori, M.; Arezoo, B.; Dastres, R. Internet of Things for Smart Factories in Industry 4.0, a Review. Internet Things Cyber-Phys. Syst. 2023, 3, 192–204. [Google Scholar] [CrossRef]
- Singh, A.; Grant, B.; De Four, R.; Sharma, C.; Bahadoorsingh, S. A Review of Induction Motor Fault Modeling. Electr. Power Syst. Res. 2016, 133, 191–197. [Google Scholar] [CrossRef]
- Torrent, M.; Blanqué, B.; Monjo, L. Replacing Induction Motors without Defined Efficiency Class by IE Class: Example of Energy, Economic, and Environmental Evaluation in 1.5 KW—IE3 Motors. Machines 2023, 11, 567. [Google Scholar] [CrossRef]
- Liang, H.; Chen, Y.; Liang, S.; Wang, C. Fault Detection of Stator Inter-Turn Short-Circuit in PMSM on Stator Current and Vibration Signal. Appl. Sci. 2018, 8, 1677. [Google Scholar] [CrossRef]
- Garcia-Calva, T.; Morinigo-Sotelo, D.; Fernandez-Cavero, V.; Romero-Troncoso, R. Early Detection of Faults in Induction Motors—A Review. Energies 2022, 15, 7855. [Google Scholar] [CrossRef]
- Rangel-Magdaleno, J.; Peregrina-Barreto, H.; Ramirez-Cortes, J.; Cruz-Vega, I. Hilbert Spectrum Analysis of Induction Motors for the Detection of Incipient Broken Rotor Bars. Measurement 2017, 109, 247–255. [Google Scholar] [CrossRef]
- Singh, G.; Anil Kumar, T.C.; Naikan, V.N.A. Efficiency Monitoring as a Strategy for Cost Effective Maintenance of Induction Motors for Minimizing Carbon Emission and Energy Consumption. Reliab. Eng. Syst. Saf. 2019, 184, 193–201. [Google Scholar] [CrossRef]
- Lu, S.-M. A Review of High-Efficiency Motors: Specification, Policy, and Technology. Renew. Sustain. Energy Rev. 2016, 59, 1–12. [Google Scholar] [CrossRef]
- Ghosh, P.K.; Sadhu, P.K.; Basak, R.; Sanyal, A. Energy Efficient Design of Three Phase Induction Motor by Water Cycle Algorithm. Ain Shams Eng. J. 2020, 11, 1139–1147. [Google Scholar] [CrossRef]
- Burgos Payán, M.; Roldan Fernandez, J.M.; Maza Ortega, J.M.; Riquelme Santos, J.M. Techno-Economic Optimal Power Rating of Induction Motors. Appl. Energy 2019, 240, 1031–1048. [Google Scholar] [CrossRef]
- Kim, S.-H. Chapter 3—Alternating Current Motors: Synchronous Motor and Induction Motor. In Electric Motor Control; Kim, S.-H., Ed.; Elsevier: Amsterdam, The Netherlands, 2017; pp. 95–152. ISBN 978-0-12-812138-2. [Google Scholar]
- Skowron, M.; Wolkiewicz, M.; Orlowska-Kowalska, T.; Kowalski, C.T. Application of Self-Organizing Neural Networks to Electrical Fault Classification in Induction Motors. Appl. Sci. 2019, 9, 616. [Google Scholar] [CrossRef]
- Gangsar, P.; Tiwari, R. Signal Based Condition Monitoring Techniques for Fault Detection and Diagnosis of Induction Motors: A State-of-the-Art Review. Mech. Syst. Signal Process. 2020, 144, 106908. [Google Scholar] [CrossRef]
- Terron-Santiago, C.; Martinez-Roman, J.; Puche-Panadero, R.; Sapena-Bano, A. A Review of Techniques Used for Induction Machine Fault Modelling. Sensors 2021, 21, 4855. [Google Scholar] [CrossRef]
- Faiz, J.; Keravand, M.; Ghasemi-Bijan, M.; Cruz, S.M.Â.; Bandar-Abadi, M. Impacts of Rotor Inter-Turn Short Circuit Fault upon Performance of Wound Rotor Induction Machines. Electr. Power Syst. Res. 2016, 135, 48–58. [Google Scholar] [CrossRef]
- Qiu, H.; Zhao, X.; Yang, C.; Ran, Y.; Wei, Y. Influence of Inter-Turn Short-Circuit Fault Considering Loop Current on Electromagnetic Field of High-Speed Permanent Magnet Generator with Gramme Ring Windings. J. Electr. Eng. Technol. 2019, 14, 701–710. [Google Scholar] [CrossRef]
- Pietrowski, W.; Górny, K. Analysis of Torque Ripples of an Induction Motor Taking into Account a Inter-Turn Short-Circuit in a Stator Winding. Energies 2020, 13, 3626. [Google Scholar] [CrossRef]
- Ullah, Z.; Hur, J. A Comprehensive Review of Winding Short Circuit Fault and Irreversible Demagnetization Fault Detection in PM Type Machines. Energies 2018, 11, 3309. [Google Scholar] [CrossRef]
- Moosavi, S.-M.M.; Faiz, J.; Abadi, M.B.; Cruz, S.M.A. Comparison of Rotor Electrical Fault Indices Owing to Inter-Turn Short Circuit and Unbalanced Resistance in Doubly-Fed Induction Generator. IET Electr. Power Appl. 2019, 13, 235–242. [Google Scholar] [CrossRef]
- Forstner, G.; Kugi, A.; Kemmetmüller, W. Fault-Tolerant Torque Control of a Three-Phase Permanent Magnet Synchronous Motor with Inter-Turn Winding Short Circuit. Control. Eng. Pract. 2021, 113, 104846. [Google Scholar] [CrossRef]
- Adouni, A.; Marques Cardoso, A.J. Thermal Analysis of Low-Power Three-Phase Induction Motors Operating under Voltage Unbalance and Inter-Turn Short Circuit Faults. Machines 2021, 9, 2. [Google Scholar] [CrossRef]
- Yuan, X.-H.; He, Y.-L.; Liu, M.-Y.; Wang, H.; Wan, S.-T.; Vakil, G. Impact of the Field Winding Interturn Short-Circuit Position on Rotor Vibration Properties in Synchronous Generators. Math. Probl. Eng. 2021, 2021, e9236726. [Google Scholar] [CrossRef]
- Yang, J.; Dou, M.; Dai, Z. Modeling and Fault Diagnosis of Interturn Short Circuit for Five-Phase Permanent Magnet Synchronous Motor. J. Electr. Comput. Eng. 2015, 2015, e168786. [Google Scholar] [CrossRef]
- He, Y.-L.; Xu, M.-X.; Zhang, W.; Wang, X.-L.; Lu, P.; Gerada, C.; Gerada, D. Impact of Stator Interturn Short Circuit Position on End Winding Vibration in Synchronous Generators. IEEE Trans. Energy Convers. 2021, 36, 713–724. [Google Scholar] [CrossRef]
- Im, S.-H.; Gu, B.-G. Study of Induction Motor Inter-Turn Fault Part I: Development of Fault Models with Distorted Flux Representation. Energies 2022, 15, 894. [Google Scholar] [CrossRef]
- Ghanbari, T.; Mehraban, A.; Farjah, E. Inter-Turn Fault Detection of Induction Motors Using a Method Based on Spectrogram of Motor Currents. Measurement 2022, 205, 112180. [Google Scholar] [CrossRef]
- Irhoumah, M.; Pusca, R.; Lefevre, E.; Mercier, D.; Romary, R. Detection of the Stator Winding Inter-Turn Faults in Induction and Synchronous Machines through the Correlation Between Harmonics of the Voltage of Two Magnetic Flux Sensors. IEEE Trans. Ind. Appl. 2019, 55, 2682–2689. [Google Scholar] [CrossRef]
- Ehya, H.; Nysveen, A. Pattern Recognition of Interturn Short Circuit Fault in a Synchronous Generator Using Magnetic Flux. IEEE Trans. Ind. Appl. 2021, 57, 3573–3581. [Google Scholar] [CrossRef]
- Liu, X.; Miao, W.; Xu, Q.; Cao, L.; Liu, C.; Pong, P.W.T. Inter-Turn Short-Circuit Fault Detection Approach for Permanent Magnet Synchronous Machines Through Stray Magnetic Field Sensing. IEEE Sens. J. 2019, 19, 7884–7895. [Google Scholar] [CrossRef]
- Zorig, A.; Hedayati Kia, S.; Chouder, A.; Rabhi, A. A Comparative Study for Stator Winding Inter-Turn Short-Circuit Fault Detection Based on Harmonic Analysis of Induction Machine Signatures. Math. Comput. Simul. 2022, 196, 273–288. [Google Scholar] [CrossRef]
- Maraaba, L.S.; Twaha, S.; Memon, A.; Al-Hamouz, Z. Recognition of Stator Winding Inter-Turn Fault in Interior-Mount LSPMSM Using Acoustic Signals. Symmetry 2020, 12, 1370. [Google Scholar] [CrossRef]
- Eftekhari, M.; Moallem, M.; Sadri, S.; Hsieh, M.-F. A Novel Indicator of Stator Winding Inter-Turn Fault in Induction Motor Using Infrared Thermal Imaging. Infrared Phys. Technol. 2013, 61, 330–336. [Google Scholar] [CrossRef]
- Singh, G.; Anil Kumar, T.C.; Naikan, V.N.A. Induction Motor Inter Turn Fault Detection Using Infrared Thermographic Analysis. Infrared Phys. Technol. 2016, 77, 277–282. [Google Scholar] [CrossRef]
- Kumar, P.S.; Xie, L.; Halick, M.S.M.; Vaiyapuri, V. Stator End-Winding Thermal and Magnetic Sensor Arrays for Online Stator Inter-Turn Fault Detection. IEEE Sens. J. 2021, 21, 5312–5321. [Google Scholar] [CrossRef]
- Wu, Y.-H.; Liu, M.-Y.; Song, H.; Li, C.; Yang, X.-L. A Temperature and Magnetic Field-Based Approach for Stator Inter-Turn Fault Detection. IEEE Sens. J. 2022, 22, 17799–17807. [Google Scholar] [CrossRef]
- Xu, Z.; Hu, C.; Yang, F.; Kuo, S.-H.; Goh, C.-K.; Gupta, A.; Nadarajan, S. Data-Driven Inter-Turn Short Circuit Fault Detection in Induction Machines. IEEE Access 2017, 5, 25055–25068. [Google Scholar] [CrossRef]
- Chen, Z.; Liang, D.; Jia, S.; Yang, L.; Yang, S. Incipient Interturn Short Circuit Fault Diagnosis of Permanent Magnet Synchronous Motors Based on the Data-Driven Digital Twin Model. IEEE J. Emerg. Sel. Top. Power Electron. 2023, 11, 3514–3524. [Google Scholar] [CrossRef]
- Shih, K.-J.; Hsieh, M.-F.; Chen, B.-J.; Huang, S.-F. Machine Learning for Inter-Turn Short-Circuit Fault Diagnosis in Permanent Magnet Synchronous Motors. IEEE Trans. Magn. 2022, 58, 1–7. [Google Scholar] [CrossRef]
- Guerreiro Carvalho Cunha, R.; da Silva, E.T.; Marques de Sá Medeiros, C. Machine Learning and Multiresolution Decomposition for Embedded Applications to Detect Short-Circuit in Induction Motors. Comput. Ind. 2021, 129, 103461. [Google Scholar] [CrossRef]
- Liang, S.; Chen, Y.; Liang, H.; Li, X. Sparse Representation and SVM Diagnosis Method for Inter-Turn Short-Circuit Fault in PMSM. Appl. Sci. 2019, 9, 224. [Google Scholar] [CrossRef]
- Ehya, H.; Skreien, T.N.; Nysveen, A. Intelligent Data-Driven Diagnosis of Incipient Interturn Short Circuit Fault in Field Winding of Salient Pole Synchronous Generators. IEEE Trans. Ind. Inform. 2022, 18, 3286–3294. [Google Scholar] [CrossRef]
- Li, Y.; Wang, Y.; Zhang, Y.; Zhang, J. Diagnosis of Inter-Turn Short Circuit of Permanent Magnet Synchronous Motor Based on Deep Learning and Small Fault Samples. Neurocomputing 2021, 442, 348–358. [Google Scholar] [CrossRef]
- Maraaba, L.; Al-Hamouz, Z.; Abido, M. An Efficient Stator Inter-Turn Fault Diagnosis Tool for Induction Motors. Energies 2018, 11, 653. [Google Scholar] [CrossRef]
- Duda, R.O.; Hart, P.E.; Stork, D.G. Pattern Classification, 2nd ed.; Wiley: New York, NY, USA, 2001; ISBN 978-0-471-05669-0. [Google Scholar]


Disclaimer/Publisher’s Note: The statements, opinions and data contained in all publications are solely those of the individual author(s) and contributor(s) and not of MDPI and/or the editor(s). MDPI and/or the editor(s) disclaim responsibility for any injury to people or property resulting from any ideas, methods, instructions or products referred to in the content. |
© 2023 by the authors. Licensee MDPI, Basel, Switzerland. This article is an open access article distributed under the terms and conditions of the Creative Commons Attribution (CC BY) license (https://creativecommons.org/licenses/by/4.0/).