Abstract
Infrared thermography (IRT) has become an interesting alternative for performing condition assessments of different types of induction motor (IM)-based equipment when it operates under harsh conditions. The reported results from state-of-the-art articles that have analyzed thermal images do not consider (1): the presence of more than one fault, and (2) the inevitable noise-corruption the images suffer. Bearing in mind these reasons, this paper presents a convolutional neural network (CNN)-based methodology that is specifically designed to deal with noise-corrupted images for detecting the failures that have the highest incidence rate: bearing and broken bar failures; moreover, rotor misalignment failure is also considered, as it can cause a further increase in electricity consumption. The presented results show that the proposal is effective in detecting healthy and failure states, as well as identifying the failure nature, as a 95% accuracy is achieved. These results allow considering the proposal as an interesting alternative for using IRT images obtained in hostile environments.
1. Introduction
Induction Motors (IMs) have become one of the most used pieces of equipment in modern industry due to their ability to transform electrical currents into mechanical movement. This feature is highly appreciated in different industries such as the automotive, electrical, and consumption goods production industries, among others [1,2], where they are the preferred choice for developing production equipment, as they: (1) have a robust mechanical construction, (2) can adapt to variable load conditions, (3) can operate in harsh environments, (4) require low maintenance, and (5) are fault tolerant in normal operational conditions [3]. For these reasons, IMs are responsible for more than 80% of the electricity consumption in the industrial sector [4]. Still, it should be considered that the aforementioned conditions also constitute a potential drawback, since IMs can suffer from fast and excessive deterioration due to their fault-tolerant operation [5]. In this sense, it is necessary to perform continuous assessments of their mechanical and electrical conditions, in order to be able to detect any slight variation in their nominal operational parameters (for instance, current and torque values), as this variation could indicate the presence of a fault, allowing for the appropriate maintenance actions to be taken. In this sense, the worst scenario can be avoided, i.e., machinery shut-off, with the associated economic consequences in terms of the lost production.
The most common faults that IMs are susceptible to suffering from are bearing damage and rotor broken bars [1,5]. Since these failures have a silent nature, i.e., they do not impede the machine’s normal operation, it is a more challenging task to perform their detection. One alternative that is widely used by engineers and scientists is the monitoring of physical variables that, by using signal processing techniques, can indicate the presence of a fault. In this sense, vibration and noise monitoring [2,6,7,8,9,10,11], acoustic emission [12,13,14,15], and stray flux [16,17,18], as well as electrical current [19,20,21,22,23,24,25], are the variables that are usually employed to perform either or both of the aforementioned fault detections. It is worth noticing that these sensors require installation in easy-access locations so they can be subjected to periodic inspections, especially if they operate under harsh conditions [26]. Further, one feature they share is the necessity of using a signal-processing-technique-based strategy to decompose the measured signals into their fundamental components, in order to find out which is the one that is modified the most (in terms of their amplitudes or frequency content) when the fault occurs. In this sense, strategies based on the use of the wavelet transform (WT), empirical mode decomposition (EMD), and variational mode decomposition (VMD), among others, are usually employed when dealing with vibration, sound, and AE signals. It should be pointed out that, to obtain the best possible results, a hand-crafted selection of the technique features, such as the wavelet mother selection for WT, the interpolation algorithm for the sifting process in EMD, or the initial value of the instantaneous frequency in VMD, is performed. This can constitute a limitation when the operational conditions change during normal operation [26]. On the other hand, a motor current signature analysis (MCSA) is performed by estimating the frequency content or spectra of the current signal [5]. This method is effective but requires a specialist that can interpret the obtained results to determine the motor condition [5,27], which could be a restriction if a fully automated operation of the monitoring system is desired.
In the past ten years, stray flux measurements have been carried out as an alternative strategy to performing fault detection in IMs [16,17,18]. Broadly speaking, this strategy analyses either the magnetic flux that is measured outside of the motor or the air gap flux that is generated between the rotor and the stator [28]. Since the magnetic flux is also an electrical-current-based variable, the same abovementioned signal processing techniques are used. On the other hand, while they can detect efficiently and with less false positives than other strategies, their widespread utilization is still restricted, as: (1) the installation of coils or hall-effect-based sensors is considered to be invasive, (2) if the air gap flux is analyzed, the sensors must be installed during the IM fabrication, and (3) the remote operation is compromised, as the generated information must be processed in the same physical location, since the generated flux can be corrupted with the electromagnetic radiation that is ever present [28,29].
In this sense, considering all the benefits and limitations, it is still necessary to develop a methodology that: (1) does not require hand-crafted optimization to ensure the best possible results, (2) can use sensors capable of operating in harsh environments without requiring additional maintenance tasks to ensure their correct functioning, and (3) can be used in all types of IMs, regardless the motor age or construction.
Recently, infrared thermography (IRT) has emerged as an interesting alternative to monitoring IM machines, due to its measurement method being: (1) contactless, (2) non-invasive, and (3) the sensor can be located at a distant location [30]. In this sense, different applications have been reported [31,32,33,34]. Li et al. [31] proposed a support vector machine (SVM)-based methodology for diagnosing the condition of gearboxes. They detected pitting, broken, missing, and cracked tooths, obtaining an average accuracy of 91% for all the aforementioned faults. Glowacz [32] used a fusion of different histogram algorithms for the feature extraction of the IRT images, which, coupled with a long short-term memory (LSTM) neural network, could determine if an IM had a mechanical or electrical failure. One of the detected failures was a broken bar, obtaining a range of accuracy between 95 and 100%, depending on the detected failure. Sharma et al. [33] and Choudhary et al. [34] used IRT fused with a Convolutional Neural Network (CNN) to determine if a bearing was damaged. They reported accuracies ranging from 90 to 99%, depending on the level and ubication of the bearing damage. They noted that the dataset size must be considered to obtain the best possible results. Similar conclusions have been reported [35,36,37]. In this sense, from the presented works, some aspects can be concluded: (1) to the best of the authors knowledge, a study that analyzes the presence of more than one fault (i.e., bearing and broken bar) with IRT is still missing, (2) when deep learning approaches are employed, data augmentation is not considered, and (3) the noise corruption that thermal images can suffer is not considered.
This paper presents an experimental study that uses thermal images obtained under four different scenarios: healthy (HLT), one broken bar (BB), outer bearing (OB), and misalignment (MAL), for its detection using a CNN-based methodology. Moreover, the data augmentation and inevitable noise presence are addressed by: (1) modifying the pixel intensity levels to generate different thermal images, and (2) adding different salt and pepper noise levels to the original images. It should be pointed out that a specific-purpose CNN architecture is presented to deal with noise-corrupted images. The obtained results show that the proposal can effectively deal with noiseless and noise-corrupted images, as the obtained efficacy for detecting all the faults is about 99%. Hence, all the abovementioned opportunity areas are addressed, allowing the proposal to be considered as a solid alternative when IM monitoring and diagnosing must be performed in hostile environments.
2. Proposed Methodology
The proposed methodology is shown in Figure 1, where it can be seen that the proposal is based on four steps. In the first one, the database is prepared by acquiring 200 thermographic images of the four IM conditions (OB, BB, MAL, and HLT). Subsequently, the second stage performs the data augmentation, which consists of making modifications to the thermal images that could occur in real-life conditions, (e.g., brightness modification, image reflection, and noise corruption). In the third stage, the CNN designed is presented along with its parameters so that it can fulfill its objective, that is, having a balance between the precision and computational load. Finally, the last step, the IM diagnosis is set using the CNN.
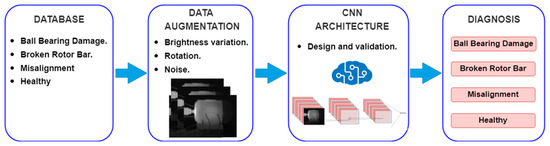
Figure 1.
Proposed methodology for automatic motor condition detection.
2.1. Database (Experimental Setup)
This work is based on the experiment documented in [38]. For this work, the images are taken using an FLIR GF320 thermal imaging camera with a thermal sensitivity of <15 mK at 30 °C, a resolution of 320 × 240 pixels, and a spectral range of 3.2–3.4 µm. The emissivity used is set at 0.95 [38]. A FLUKE 975 air quality meter and a FLUKE 61 infrared thermometer are used to monitor the environmental conditions. The thermographic images are acquired using the grayscale color pallet, since an intensity pixel value change in the gray level is proportional to a change in temperature, i.e., it shows linear behavior. As a result, this linear relationship helps to improve the efficiency of deep learning methods and reduce the hardware requirements [39].
The electromechanical system on which the tests are performed is composed of a 1.5 KW-WEG three-phase induction motor, powered at 220 VAC—60 Hz, which is mechanically coupled to an electric generator (system load) by the means of rigid coupling, a gearbox, and a gearbox reduction. The mechanical connection can be seen in Figure 2.
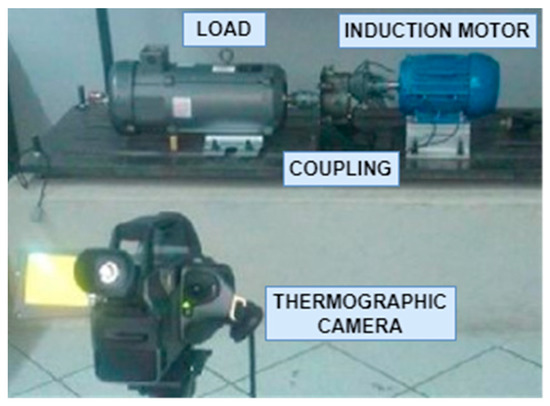
Figure 2.
Electromechanical system used for testing.
On the other hand, the tests are performed under four conditions: outer ball bearing damage, a broken rotor bar, misalignment, and the healthy state. The outer ball bearing damage is performed by drilling a 2 mm hole in the outer race (as seen in Figure 3a). The broken rotor bar is achieved by drilling it at 8 mm to break the rotor bar (Figure 3b). Finally, for the misalignment, the free end of the electromechanical system is displaced 5 mm along the horizontal plane (Figure 3c).
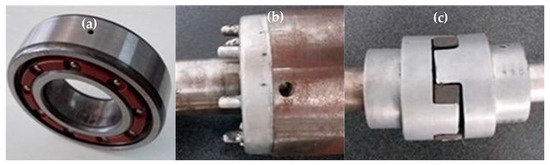
Figure 3.
Induced failures. (a) Ball Bearing Damage, (b) Broken Rotor Bar, and (c) Misalignment.
Each of the four tests lasts 80 min, since thermal stability is achieved during this time [40,41]. Thermographic images are acquired every minute, so at the end of each test, 80 images are obtained. It should be noticed that, for this work, the images from 15–65 min are used, since, in the first and last 15 min, there is no significant temperature change. At the end, a total of 200 thermographic images are used, 50 for each condition.
It is worth noticing that, from the original thermographic images, whose size is 320 × 240 pixels, the IM area is extracted. The resulting images have a size of 100 × 80 pixels.
2.2. Data Augmentation
From the abovementioned remarks, the original database consists of 200 thermographic images, 50 for each induction motor condition. Since it is necessary to consider all the possible scenarios where images can be corrupted, it is necessary to generate them. In this sense, some of the main alterations consist of modifying the brightness, adding salt and pepper noise, and their rotation [41], where these transformations are selected because they are the variables that can change in real-life conditions. In the first stage, for each of the original thermographic images, the intensity levels are varied by 10%, 20%, and 30%. These values are used since the gray level can change according to the automatic adjustment of the scene. At the end of this process, the database size increases up to 800 images. Subsequently, to each of the obtained images, salt and pepper noise is added at 2% and 3%. These values are selected, as the final image quality can be affected by disturbances; thus, the database used in this work has a size of 2400 images, with each one being 100 × 80 pixels. Finally, a reflection is applied to all the 2400 images, obtaining a total of 4800 images.
2.3. CNN Architecture and Diagnosis
CNNs are one of the deep learning techniques that use input images that depict the relevant phenomena information, which, by the means of different layers, can achieve a high accuracy for classification tasks [42]. A CNN contains three layers: convolutional, pooling, and fully connected layers [42]. For this work, the different parameters of the CNN are tuned to enhance the accuracy and reduce the computational load required for both the training and execution stages. In particular, the convolutional layer is composed of several kernels to calculate different feature maps [43]. Mathematically, the output of each feature map (z) can be expressed as:
where w are the weights and coefficients of the employed kernel, x is the image to be processed, and b is the bias term. To calculate the i-th layer output, the following equation describes the mathematical relationship:
where a is the activation function (AF) of the layer. The rectifier linear unit AF is used, since it increases the learning rate speed [44,45]. To further highlight the distinct features, the size of the layer output can be reduced using a pooling stage. In general terms, the pooling stage reduces the resulting image size by performing some mathematical operations, such as average or maximum values with the adjacent pixels [44]. Moreover, by performing this operation, a shift invariance is also achieved. This operation, for the i-th layer, can be represented as:
z = wTx + b
ai = a(z)
yi = pool(ai)
From the abovementioned concepts, it can be easily inferred that the output of the network generates the IM diagnosis; thus, the training algorithm aims to minimize the errors of the network using the weights and biases of each kernel layer, and the input images. Assuming that θ are all the parameters the network has (weights and biases of each kernel layer), the input data are represented by (xi, oi) (oi is the label of the i-th input image xi), and yi is the network output, the main equation the training algorithm uses is expressed as [43]:
It can be seen that the training algorithm results in a global optimization problem. In this paper, the stochastic gradient algorithm is used, as it provides the best compromise between the training speed and resource utilization [43].
One of the main aspects that must be considered is the filter selection for performing the convolution operation. In general terms, the thermal maps should be processed in order to quantify the potential temperature differences and/or the patterns that can be generated, depending on the mechanical condition analyzed [46]. In this sense, up to 24 filters are designed for executing the image segmentation by detecting the edges in every thermographic image when the convolution operation is performed; thus, the pattern is exposed, allowing the FC layer to obtain the correct classification. Table 1 shows the accuracy values obtained when varying the number and size of the employed filters.

Table 1.
Relationship between the CNN Configuration, number of filters, and filter size.
It should be pointed out that the number of filters is selected after extensive experimentation, as this allows for obtaining the tradeoff between the computational burden used to train the network and the resulting accuracy. As a consequence, the resulting architecture can effectively deal with thermal images, even noise-corrupted ones. After performing several trials, and from the results presented in Table 1, the best parameters for the CNN are an input image of 100 × 80 pixels with 3 channels, a filter size of 3 × 3, 8 filters, an average pooling of 2 × 2, 20 epochs, 60 iterations, and a batch size = N/5, where N is the total number of images of the test. This architecture is depicted in Figure 4.
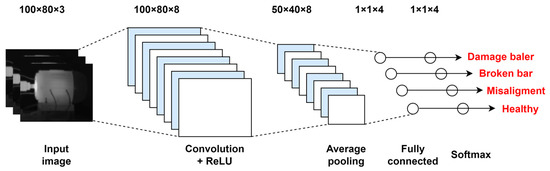
Figure 4.
Proposed CNN architecture.
3. Results
This section presents the obtained results using the proposed methodology, where the augmentation allows for increasing the database size from 200 to 4800 images. Of these images, 60% are used for the training and the remaining images are equally split for validation and testing purposes, respectively.
3.1. Database Augmentation
To augment the database, six different tests are performed. As mentioned in Section 2, the augmentation consists of modifying the intensity levels and adding salt and pepper noise to the original grayscale images. It should be noted that there are 50 grayscale thermographic images for each class, resulting in 200 grayscale thermographic images (i.e., test 1). In this sense, for tests 2 to 4, each image is copied to modify the intensity levels to 10%, 20%, and 30% of their original value, respectively, and merge them with the images at their corresponding intensity levels; as a consequence, the database size increases to 400 images. To further increase this size, in test 5, the original images are supplemented with the obtained ones, resulting in 800 images. Finally, in test 6, salt and pepper noise is applied at 2% and 3% to the total number of images from test 5; this allows for a total database of N = 2400 images. On the other hand, it should be considered that the axis orientation can be either to the right or to the left of the image, and the database undergoes modification by horizontally flipping all the images, thus doubling the dataset from 2400 to 4800 images. Figure 5 shows some of the thermographic images from each test.
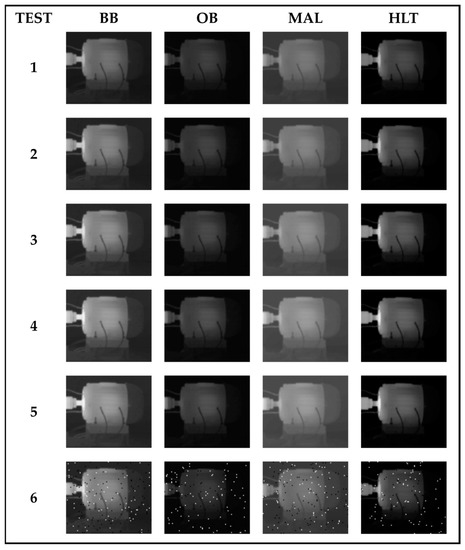
Figure 5.
Test matrix for database augmentation: Test 1 (original thermographic images), Tests 2–4 (modified images to 10%, 20%, and 30% of their original value), Test 5 (supplemented images with the ones obtained from Test 1–4), and Test 6 (Salt and Pepper noise applied at 2% and 3% to the total number of images from Test 5).
3.2. CNN Results
The results of the CNN for the IM fault detection are described in the next two subsections. In the first one, the obtained results using the augmented database are presented. It is important to mention that the reported results are obtained using the validation subset of the augmented database.
3.2.1. CNN with Original Database
Once the CNN architecture is proposed, the network is trained for each of the tests shown in Figure 4. It should be noted that the mean accuracy values are obtained, and the confusion matrix is acquired to obtain the values of the precision, recall, and F1 score. These parameters are used as they are the common for comparison purposes [43,45] The results obtained for each of the tests performed are shown in Table 2.
Table 2.
Performance metrics for all the executed tests.
As shown in Table 2, test 6 (the noise-corrupted images) had the best results, with 99.60% for the accuracy, precision, recall, and F1 score. This demonstrates that the utilization of the average pooling method, as well as the filters used in the convolutional stage, can effectively deal with noise-corrupted images, as they allow for capturing different thermal zones. The accuracy (Figure 6a) and loss (Figure 6b) graphs for the training of test 6 (noise-corrupted images) are shown in Figure 6; moreover, Figure 7 shows the confusion matrix and classification results obtained by the CNN.
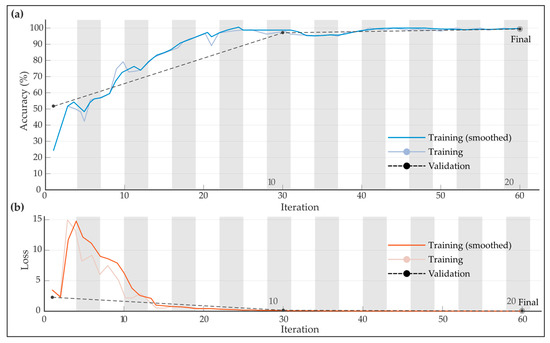
Figure 6.
CNN training and validation for test 6, (a) Accuracy, and (b) loss.

Figure 7.
Confusion matrix, predictions for test 6.
From these figures, it is seen that the overfitting phenomenon is not present, as the accuracy values for both the validation and training set do not present a significant divergence [43,47]. This confirms the design choices made for the CNN architecture, as its performance does not decrease.
3.2.2. CNN with Horizontal Reflection
To further increase the proposal reliability under different scenarios, the trained CNN, used in the previous section, is tested by adding horizontal reflection to each of the proposed tests in Figure 4. For illustration purposes, some of the input images to the CNN for the validation of the proposed methodology are shown in Figure 8.
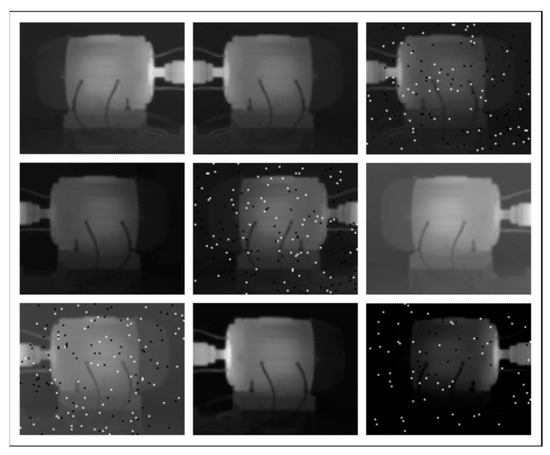
Figure 8.
Input images with random horizontal rotation.
Table 3 summarizes the obtained results from the confusion matrix for the training and validation by performing a horizontal reflection of each test in the database. The best result corresponds to test 6, as accuracy and precision values of 99.50% are obtained, as well as 99.48% for the recall and F1 score. On the other hand, a visual representation of the results is presented with the graphs in Figure 9, which shows the behavior for the accuracy (Figure 9a) and loss (Figure 9b) of the training and validation of the CNN, while Figure 10 shows the predictions performed by the CNN for each type of failure.
Table 3.
Performance metrics for all tests with horizontal reflection.
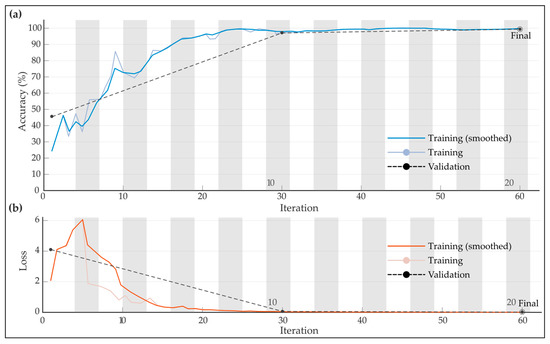
Figure 9.
CNN training and validation for test 6 with horizontal reflection, (a) Accuracy, and (b) loss.
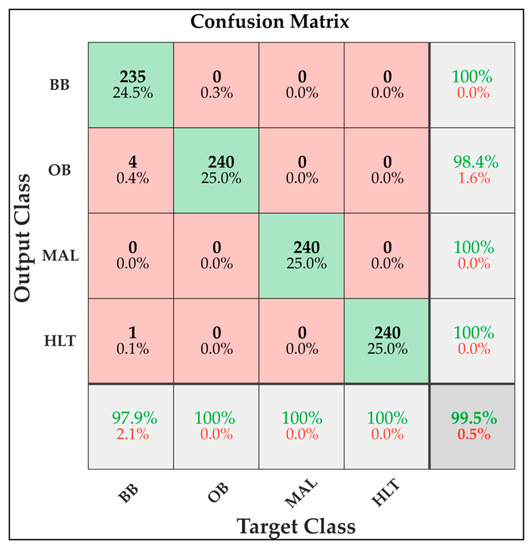
Figure 10.
Predictions and confusion matrix of test 6 with horizontal reflection.
As expected, no overfitting is seen, while it can be thought that the horizontal reflection does not affect the obtained results. In particular, the latter is also expected, as the filters used are designed to maintain and enhance the spatial relationship the pixels can have [44,46]. Overall, the results show an accuracy value higher than 95% for each of the tests performed on the increment of the database, also demonstrating that satisfactory results can be obtained despite adding noise and intensity levels to the original images, as well as a change in the orientation of the images, which demonstrates the CNN’s reliability and robustness in real-life operational conditions that may arise in the experimental setup.
4. Discussion
The results obtained in different works for the automatic identification of failures in induction motors using infrared thermography are shown in Table 4. In particular, the methods used, and the accuracy of each methodology are also described [48,49,50,51,52]. It is observed that accuracy values higher than 90% were obtained for the classification of failures in induction motors by all the works. Still, there are some comments that can be made. It is worth noticing that most of the methodologies only focused on analyzing a single element of the induction motor, such as the stator winding, the bearings, or the broken rotor bar, among others, and on identifying whether they presented a fault [4,50]. In this sense, while the presented results are notable, it can be thought that the utilization of CNN-based methodologies for this type of task results in an underutilization of the CNN’s capabilities. In this sense, the proposal analyzed different failures in various parts of the induction motor, such as a healthy state, broken rotor bar and bearing failures, and misalignment failures, obtaining an accuracy of 99.4% in the classification. The accurate identification of these failures usually involves the fusion of different variables, such as current and vibration signals, or vibration and stray flux [51,52,53].
Table 4.
Methods based on Infrared thermography to automatic fault induction motor identification for qualitative comparison.
On the other hand, and by performing an accuracy analysis of the proposals, it is observed that the methodology described in [52] reported a 100% accuracy. While this number at first sight can indicate that the fault detection problem is practically solved, some aspects can be commented on. It should be noted that, if the dataset size is small, the accuracy obtained can be misguiding [54]; in this sense, the dataset size used in all the presented methodologies, as shown in Table 4, did not exceed 400 thermographic images, whereas this work, to avoid the aforementioned issue, used 4800 thermographic images. Moreover, for industry applications, when accuracy values exceed 70 in classification problems, this is considered as acceptable, as it remains as a challenging task to capture and represent all the possible variations that can occur in real-life operational conditions [46]. Another aspect that can be assessed is the number of fault conditions detected, as it is expected that the higher the number of detected faults, the lower the accuracy can be [54,55]. This work detected four types of mechanical faults, obtaining a 99.5% accuracy. These results indicate that the proposal should be modified to further detect different bearing faults, as these are one of the most recurrent mechanical failures in an IM.
To measure the performance of a classification algorithm, accuracy is one of the most used indicators [54,55]. However, it is not the only indicator that can be obtained. For the methodology proposed in this work, Table 3 shows indicators such as precision, recall, and F1 score, which allow for knowing the performance of the proposed CNN algorithm. The best performance obtained when measuring these indicators was precision = 99.5%, recall = 99.5%, and F1 score = 99.5%. In summary, these indicators show a more complete panorama regarding the proposal performance, as they indicate the number of correct classifications regardless of the dataset size [55]. However, when compared with the works related to Table 4, these do not report other indicators, only the accuracy of the classifier, so it is not possible to compare them with another indicator.
On the other hand, another interesting point that can be discussed is that the presented methodologies required the hand-crafted selection of a wide variety of parameters at each stage their proposal required, such as image processing, feature extraction, dimensionality reduction, and classification algorithms to determine the state of the induction motor [48,49,50,51,52]; moreover, it can be seen that the required computing time for both the training and execution of the proposals was set to be higher compared to methodologies that employed less steps. On the contrary, the proposal did not require this hand-crafted selection to obtain the best possible results, as it processed thermographic images directly. Considering this factor, and the nature of the proposed CNN architecture, the used computational load required to process the images was lower than that required by other methods that use multi-steps strategies. Finally, it should be noted that neither of the proposals dealt with the unavoidable noise corruption, which this work did. This allows for the design of a robust and reliable method that can deal with real-life scenarios.
Finally, there is still a necessity to develop a methodology that performs the study of the identification of multiple failures that may occur in the induction motor and its kinematic chain simultaneously, as it has been reported in the literature that, when part of an element fails in the induction motor, this can have an impact on the connected elements, propagating the damage throughout the kinematic chain and generating very undesirable consequences, as it will require an extended maintenance time to restore the machine’s functionality.
In spite of the good results of this work, some limitations are found. For example, the experiments were conducted with only four conditions (HLT, BB, MAL, and OB); therefore, at present, it is only possible to diagnose these conditions. However, for future work, it is proposed to collect information to diagnose other conditions, such as failures in the inner race, outer race, rolling elements of the bearing, or even electrical failures. On the other hand, the CNN configuration can be further optimized and retrained to include the abovementioned failures; moreover, it can also be proposed to work on the configuration of the CNN and be able to optimize it for a low computational load, making it possible for it to be programmed in an embedded system for the development of a smart sensor for the detection of faults in induction motors and their kinematic chains, where more than one fault is present during the machine operation.
5. Conclusions
This paper presented a CNN-based methodology for IM fault detection and identification using thermographic images. The proposal used a specific-purpose CNN architecture that dealt with noise-corrupted signals, as well as different shaft locations. Moreover, as one of the main problems of an artificial intelligence (AI)-based algorithm is the underrepresentation of the classes that will be detected, and a simple-yet-effective strategy to generate representative thermal images using basic operations was also presented.
The obtained results demonstrated that the design choices regarding the filters used in the convolutional and pooling stages were the most appropriate ones, as the accuracy obtained in each fault detection (HLT, BB, MAL, and OB) exceeded a 95% accuracy, even when processing noise-corrupted images. One of the main advantages of this work was the ability to perform a classification of different failures: healthy state, broken rotor bar failures, bearing failures, and misalignment failures of an induction motor with a high accuracy, rather than focusing only on one fault. Furthermore, the proposal methodology has the capability of classification despite a change in the orientation of the images, which can work in some cases when the camera changes its position. Therefore, the methodology presented in this work is an interesting alternative for assessing the condition of an induction motor under real-life conditions.
In future work, the obtention of more thermal images, as well as the study of different bearing faults, can further enhance the proposal reliability in order to offer a more robust and complete solution that can be used in industrial applications; moreover, the CNN optimization that can allow for the proposal’s implementation is also an attractive opportunity area.
Author Contributions
Conceptualization, E.R.-O. and C.A.P.-R.; methodology, O.T.-C. and I.A.C.-A.; software, O.T.-C.; validation, L.A.M.-H., J.A.B.-H. and A.S.-A.; formal analysis, E.R.-O. and C.A.P.-R.; investigation, J.A.B.-H. and A.S.-A.; data curation, L.A.M.-H., O.T.-C. and I.A.C.-A.; writing—original draft all the authors; writing—review and editing, I.A.C.-A. and C.A.P.-R.; supervision and project administration, I.A.C.-A. and C.A.P.-R.; funding acquisition, L.A.M.-H. All authors have read and agreed to the published version of the manuscript.
Funding
This research received no external funding.
Data Availability Statement
The data presented in this study are not publicly available due to privacy issues.
Acknowledgments
The first author is grateful to the Mexican Council of Humanities, Science, and Technology (CONAHCyT) by the scholarship 763065.
Conflicts of Interest
The authors declare no conflict of interest.
References
- Yatsugi, K.; Pandarakone, S.E.; Mizuno, Y.; Nakamura, H. Common Diagnosis Approach to Three-Class Induction Motor Faults Using Stator Current Feature and Support Vector Machine. IEEE Access 2023, 11, 24945–24952. [Google Scholar] [CrossRef]
- Tran, M.-Q.; Amer, M.; Dababat, A.; Abdelaziz, A.Y.; Dai, H.-J.; Liu, M.-K.; Elsisi, M. Robust fault recognition and correction scheme for induction motors using an effective IoT with deep learning approach. Measurement 2023, 207, 112398. [Google Scholar] [CrossRef]
- Choudhary, A.; Mishra, R.K.; Fatima, S.; Panigrahi, B.K. Multi-input CNN based vibro-acoustic fusion for accurate fault diagnosis of induction motor. Eng. Appl. Artif. Intell. 2023, 120, 105872. [Google Scholar] [CrossRef]
- Yakhni, M.F.; Cauet, S.; Sakout, A.; Assoum, H.; Etien, E.; Rambault, L.; El-Gohary, M. Variable speed induction motors’ fault detection based on transient motor current signatures analysis: A review. Mech. Syst. Signal Process. 2023, 184, 109737. [Google Scholar] [CrossRef]
- Valtierra-Rodriguez, M.; Rivera-Guillen, J.R.; De Santiago-Perez, J.J.; Perez-Soto, G.I.; Amezquita-Sanchez, J.P. Expert System Based on Autoencoders for Detection of Broken Rotor Bars in Induction Motors Employing Start-Up and Steady-State Regimes. Machines 2023, 11, 156. [Google Scholar] [CrossRef]
- Mishra, S.K.; Shakya, P.; Babureddy, P.; Vignesh, S.A. An approach to improve high-frequency resonance technique for bearing fault diagnosis. Measurement 2021, 178, 109318. [Google Scholar] [CrossRef]
- Lee, Y.; Park, B.; Jo, M.; Lee, J.; Lee, C. A quantitative diagnostic method of feature coordination for machine learning model with massive data from rotary machine. Exp. Syst. Appl. 2023, 214, 119117. [Google Scholar] [CrossRef]
- Li, Y.; Yang, Y.; Feng, K.; Zuo, M.J.; Chen, Z. Automated and Adaptive Ridge Extraction for Rotating Machinery Fault Detection. IEEE ASME Trans. Mechatron. 2023, 1–11. [Google Scholar] [CrossRef]
- Bautista-Morales, M.R.; Patiño-López, L.D. Acoustic detection of bearing faults through fractional harmonics lock-in amplification. Mech. Syst. Signal Proc. 2023, 185, 109740. [Google Scholar] [CrossRef]
- Al Shorman, O.; Alkahatni, F.; Masadeh, M. Sounds and acoustic emission-based early fault diagnosis of induction motor: A review study. Adv. Mech. Eng. 2021, 13. [Google Scholar] [CrossRef]
- Wang, H.; Chen, S.; Zhai, W. Data-driven adaptive chirp mode decomposition with application to machine fault diagnosis under non-stationary conditions. Mech. Syst. Signal Proc. 2023, 188, 109997. [Google Scholar] [CrossRef]
- Guo, J.; He, Q.; Zhen, D.; Gu, F.; Ball, A.D. Multi-sensor data fusion for rotating machinery fault detection using improved cyclic spectral covariance matrix and motor current signal analysis. Reliab. Eng. Syst. Saf. 2023, 230, 108969. [Google Scholar] [CrossRef]
- Patil, S.; Jalan, A.K.; Marathe, A. Condition Monitoring of Misaligned Rotor System Using Acoustic Sensor by Response Surface Methodology. ASME J. Nondestruct. Eval. 2023, 6, 011002. [Google Scholar] [CrossRef]
- Motahari-Nezhad, M.; Jafari, S.M. Comparison of MLP and RBF neural networks for bearing remaining useful life prediction based on acoustic emission. Proc. Inst. Mech. Eng. J. Eng. Tribol. 2023, 237, 129–148. [Google Scholar] [CrossRef]
- Mutra, R.R.; Reddy, D.M.; Srinivas, J.; Sachin, D.; Rao, K.B. Signal-based parameter and fault identification in roller bearings using adaptive neuro-fuzzy inference systems. J. Braz. Soc. Mech. Sci. Eng. 2023, 45, 45. [Google Scholar] [CrossRef]
- Zamudio-Ramirez, I.; Osornio-Rios, R.A.; Antonino-Daviu, J.A. Smart Sensor for Fault Detection in Induction Motors Based on the Combined Analysis of Stray-Flux and Current Signals: A Flexible, Robust Approach. IEEE Ind. Appl. Mag. 2022, 28, 56–66. [Google Scholar] [CrossRef]
- Lamim Filho, P.C.M.; Rabelo Baccarini, L.M.; Batista, F.B.; Araújo, A.C. Orbit Analysis From a Stray Flux Full Spectrum for Induction Machine Fault Detection. IEEE Sens. J. 2022, 21, 16152–16161. [Google Scholar] [CrossRef]
- Park, Y.; Choi, H.; Shin, J.; Park, J.; Bin Lee, S.; Jo, H. Airgap Flux Based Detection and Classification of Induction Motor Rotor and Load Defects During the Starting Transient. IEEE Trans. Ind. Electron. 2020, 67, 10075–10084. [Google Scholar] [CrossRef]
- Wang, P.; Xiong, H.; He, H. Bearing fault diagnosis under various conditions using an incremental learning-based multi-task shared classifier. Knowl.-Based Syst. 2023, 266, 110395. [Google Scholar] [CrossRef]
- Aguayo-Tapia, S.; Avalos-Almazan, G.; Rangel-Magdaleno, J.d.J.; Paternina, M.R.A. Broken Bar Fault Detection Using Taylor–Fourier Filters and Statistical Analysis. Entropy 2023, 25, 44. [Google Scholar] [CrossRef]
- Tabasi, M.; Mostafavi, M.; Ojaghi, M. Motor Current Signature Analysis for Detecting Local Defects on Rolling-Element Bearings of Induction Motors. Arab. J. Sci. Eng. 2023. [Google Scholar] [CrossRef]
- Nazari, S.; Shokoohi, S.; Moshtagh, J. A Current Noise Cancellation Method Based on Integration of Stator Synchronized Currents for Bearing Fault Diagnosis. IEEE Trans. Instrum. Meas. 2023. [Google Scholar] [CrossRef]
- Lee, J.; Lee, Y.; Kim, N. Detection and analysis of shaft misalignment in application of production and logistics systems using motor current signature analysis. Exp. Syst. Appl. 2023, 217, 119463. [Google Scholar] [CrossRef]
- Elhaija, W.A.; Al-Haija, Q.A. A novel dataset and lightweight detection system for broken bars induction motors using optimizable neural networks. Intell. Syst. Appl. 2023, 17, 200167. [Google Scholar] [CrossRef]
- Halder, S.; Bhat, S.; Dora, B. Start-up transient analysis using CWT and ridges for broken rotor bar fault diagnosis. Electr. Eng. 2023, 105, 221–232. [Google Scholar] [CrossRef]
- Jaros, R.; Byrtus, R.; Dohnal, J.; Danys, L.; Baros, J.; Koziorek, J.; Zmij, P.; Martinek, R. Advanced Signal Processing Methods for Condition Monitoring. Arch. Comput. Methods Eng. 2023, 30, 1553–1577. [Google Scholar] [CrossRef]
- Sun, Q.; Chen, C.; Liu, X. Comparative study of stator current-based and vibration-based methods for railway traction motor bearing cage fault diagnosis at high-speed condition. Struct. Health Monit. 2023, 22, 978–992. [Google Scholar] [CrossRef]
- Aguayo-Tapia, S.; Avalos-Almazan, G.; Rangel-Magdaleno, J.d.J.; Ramirez-Cortes, J.M. Physical Variable Measurement Techniques for Fault Detection in Electric Motors. Energies 2023, 16, 4780. [Google Scholar] [CrossRef]
- Surucu, O.; Gadsden, S.A.; Yawney, J. Condition Monitoring using Machine Learning: A Review of Theory, Applications, and Recent Advances. Exp. Syst. Appl. 2023, 221, 119738. [Google Scholar] [CrossRef]
- Boztas, G. Comparison of acoustic signal–based fault detection of mechanical faults in induction motors using image classification models. Trans. Ins. Meas. Control. 2023. [Google Scholar] [CrossRef]
- Li, X.; Li, Y.; Yan, K.; Shao, H.; Lin, J. Intelligent fault diagnosis of bevel gearboxes using semi-supervised probability support matrix machine and infrared imaging. Reliab. Eng. Syst. Saf. 2023, 230, 108921. [Google Scholar] [CrossRef]
- Glowacz, A. Thermographic fault diagnosis of electrical faults of commutator and induction motors. Eng. Appl. Artif. Intell. 2023, 121, 105962. [Google Scholar] [CrossRef]
- Sharma, K.; Goyal, D.; Kanda, R. Intelligent Fault Diagnosis of Bearings based on Convolutional Neural Network using Infrared Thermography. Proc. Inst. Mech. Eng. 2022, 236, 2439–2446. [Google Scholar] [CrossRef]
- Choudhary, A.; Mian, T.; Fatima, S. Convolutional neural network based bearing fault diagnosis of rotating machine using thermal images. Measurement 2021, 176, 109196. [Google Scholar] [CrossRef]
- Alvarado-Hernandez, A.I.; Zamudio-Ramirez, I.; Jaen-Cuellar, A.Y.; Osornio-Rios, R.A.; Donderis-Quiles, V.; Antonino-Daviu, J.A. Infrared Thermography Smart Sensor for the Condition Monitoring of Gearbox and Bearings Faults in Induction Motors. Sensors 2022, 22, 6075. [Google Scholar] [CrossRef]
- Li, Y.; Du, X.; Wan, F.; Wang, X.; Yu, H. Rotating machinery fault diagnosis based on convolutional neural network and infrared thermal imaging. Chin. J. Aeronaut. 2020, 33, 427–438. [Google Scholar] [CrossRef]
- Li, X.; Cheng, J.; Shao, H.; Liu, K.; Cai, B. Fusion CWSMM-Based Framework for Rotating Machinery Fault Diagnosis Under Strong Interference and Imbalanced Case. IEEE Trans. Industr. Inform. 2022, 18, 5180–5189. [Google Scholar] [CrossRef]
- Resendiz-Ochoa, E.; Osornio-Rios, R.A.; Benitez-Rangel, J.P.; Romero-Troncoso, R.D.J.; Morales-Hernandez, L.A. Induction motor failure analysis: An automatic methodology based on infrared imaging. IEEE Access 2018, 6, 76993–77003. [Google Scholar] [CrossRef]
- Han, S.; Yang, F.; Jiang, H.; Yang, G.; Wang, D.; Zhang, N. Statistical Analysis of Infrared Thermogram for CNN-Based Electrical Equipment Identification Methods. Appl. Artif. Intell. 2022, 36, 2004348. [Google Scholar] [CrossRef]
- Balakrishnan, G.K.; Yaw, C.T.; Koh, S.P.; Abedin, T.; Raj, A.A.; Tiong, S.K.; Chen, C.P. A Review of Infrared Thermography for Condition-Based Monitoring in Electrical Energy: Applications and Recommendations. Energies 2022, 15, 6000. [Google Scholar] [CrossRef]
- Picazo-Rodenas, M.J.; Antonino-Daviu, J.; Climente-Alarcon, V.; Royo-Pastor, R.; Mota-Villar, A. Combination of noninvasive approaches for general assessment of induction motors. IEEE Trans. Ind. Appl. 2015, 51, 2172–2180. [Google Scholar] [CrossRef]
- Shorten, C.; Khoshgoftaar, T.M. A survey on image data augmentation for deep learning. J. Big Data 2019, 6, 60. [Google Scholar] [CrossRef]
- Valizadeh, M.; Wolff, S.J. Convolutional Neural Network Applications in Additive Manufacturing: A Review. Adv. Ind. Manuf. Eng. 2022, 4, 100072. [Google Scholar] [CrossRef]
- Li, Z.; Liu, F.; Yang, W.; Peng, S.; Zhou, J. A Survey of Convolutional Neural Networks: Analysis, Applications, and Prospects. IEEE Trans. Neural Netw. Learn Syst. 2022, 33, 6999–7019. [Google Scholar] [CrossRef] [PubMed]
- Singh, S.; Raj, P.; Namboodiri, V.P. EDS pooling layer. Image Vis. Comput. 2020, 98, 103923. [Google Scholar] [CrossRef]
- López-Pérez, D.; Antonino-Daviu, J. Application of Infrared Thermography to Failure Detection in Industrial Induction Motors: Case Stories. IEEE Trans. Ind. Appl. 2017, 53, 1901–1908. [Google Scholar] [CrossRef]
- Alhassan, A.M.; Zainon, W.M.N.W. Brain tumor classification in magnetic resonance image using hard swish-based RELU activation function-convolutional neural network. Neural Comput. Appl. 2021, 33, 9075–9087. [Google Scholar] [CrossRef]
- Osornio-Rios, R.A.; Jean-Cuellar, A.Y.; Alvarado-Hernandez, A.I.; Zamudio-Ramirez, I.; Cruz-Albarran, I.A.; Antonino-Daviu, J.A. Fault detection and classification in kinematic chain by means of PCA extraction-reduction of features from thermographic images. Measurement 2022, 197, 111340. [Google Scholar] [CrossRef]
- Khanjani, M.; Ezoji, M. Electrical fault detection in three-phase induction motor using deep network-based features of thermograms. Measurement 2021, 173, 108622. [Google Scholar] [CrossRef]
- Choudhary, A.; Goyal, D.; Sudha Letha, S. Infrared Thermography-Based Fault Diagnosis of Induction Motor Bearings Using Machine Learning. IEEE Sens. J. 2021, 21, 1727–1734. [Google Scholar] [CrossRef]
- Badoni, S.; Jarial, R.K. Health Monitoring of three phase induction motor using infrared thermography. In Proceedings of the 2021 6th International Conference on Communication and Electronics Systems (ICCES21), Coimbatre, India, 8–10 July 2021. [Google Scholar] [CrossRef]
- Mehta, A.; Goyal, D.; Choudhary, A.; Pabla, B.S.; Belghith, S. Machine Learning-Based Fault Diagnosis of Self-Aligning Bearing for Rotating Machinery Using Infrared Thermography. Math. Probl. Eng. 2021, 15, 9947300. [Google Scholar] [CrossRef]
- Zamudio-Ramirez, I.; Osornio-Rios, R.A.; Antonino-Daviu, J.A.; Razik, H.; Romero-Troncoso, R.J. Magnetic flux analysis for the condition monitoring of electric machines: A review. IEEE Trans. Ind. Inform. 2022, 18, 2895–2908. [Google Scholar] [CrossRef]
- Ibrahim, I.M.; Abdulazeez, A.M. The Role of Machine Learning Algorithms for Diagnosis Diseases. J. Appl. Sci. Technol. Trends 2021, 2, 10–19. [Google Scholar] [CrossRef]
- Novakovic, J.D.; Veljovic, A.; IIic, S.S.; Papic, Z.; Tomovic, M. Evaluation of Classification Models in Machine Learning. Theory Appl. Math. Comput. Sci. 2017, 7, 39–46. [Google Scholar]


Disclaimer/Publisher’s Note: The statements, opinions and data contained in all publications are solely those of the individual author(s) and contributor(s) and not of MDPI and/or the editor(s). MDPI and/or the editor(s) disclaim responsibility for any injury to people or property resulting from any ideas, methods, instructions or products referred to in the content. |
© 2023 by the authors. Licensee MDPI, Basel, Switzerland. This article is an open access article distributed under the terms and conditions of the Creative Commons Attribution (CC BY) license (https://creativecommons.org/licenses/by/4.0/).