Abstract
The rapid development of automated vehicle technology requires reasonable test scenarios and comprehensive evaluation methods. This paper proposes an evaluation method for automated vehicles combining subjective and objective factors. First, we propose a method for automatically generating test scenarios and for batch testing autonomous vehicles. Then, the use of the target layer, total index layer, and index layer of automated vehicles is proposed to establish a more comprehensive evaluation system for automated vehicles. Specifically, the analytic hierarchy process (AHP, subjective) and improved criteria importance though intercriteria correlation (CRITIC, objective) methods are used to determine the weight of the indicators, and a two-level fuzzy comprehensive (subjective and objective) evaluation method is adopted to comprehensively evaluate the performance of the automated vehicles. Finally, the effectiveness of the proposed evaluation method combining subjective and objective factors is verified through virtual simulations and real-world experiments. Through a combination of subjective and objective methods, improved results can be obtained for safety, efficiency, economy, intelligence, and comfort tests.
1. Introduction
1.1. Motivation
At present, the automobile industry is moving towards automation and intelligence, attracting the attention of governments and research institutes around the world. However, with the expansion of automatic driving technology, automatic driving systems are becoming more complex and potentially dangerous [1]. Like many systems, automated vehicles may experience software or hardware failures that prevent them from completing tasks and may even cause harm to passengers and pedestrians [2]. Therefore, the testing and evaluation of autonomous driving functions have become an important foundation in the development of automated vehicles [3]. However, there is no complete standard or policy for reference for evaluation index systems for automated vehicle testing [4]. Qualitative evaluation methods exhibit a lack of subjectivity in determining the weight of evaluation indicators [5], while some quantitative evaluation methods do not consider the subjective will of decision makers in the evaluation process [6]. In the light of these analytical gaps, it is necessary to design and propose a subjective and objective evaluation method for automated vehicles [7].
1.2. Literature Review
1.2.1. Test Scenario Data and Test Scenario Construction Methods
Scenarios play an important role in the entire testing process and are an important component of testing the performance of automated vehicles [8]. Automated driving test scenario data include real data, simulation data, and expert experience data [9]. Real data mainly include natural driving data, traffic accident data, and open road test data. Simulation data include driving simulator data and simulation data [10]. Expert experience data contain the scene element information obtained from previous test experience knowledge based on standards and regulations. At present, the main data sources for automated vehicle testing are natural driving data and traffic accident data [11]. This paper focuses on these two types of data. For scenario-based simulation testing, the key foundation is to generate automatic driving test scenarios that can make vehicle running scenarios consistent with real scenarios. According to the development process of each stage in the ISO26262 standard, the German PEGASUS project proposed requirements for scenarios in different stages and divided the scenarios into three categories [12]: functional scenarios in the conceptual design stage, logical scenarios in the system development stage, and specific scenarios in the test verification stage, laying the foundation for the structured generation of automatic driving test scenarios.
Gelder et al. parameterized natural driving data and determined the parameter space of the logical scenario, laying the foundation for the generation of test cases [13]. Li et al. put forward a framework for verifying, testing, and confirming autopilot functions, described the autopilot scene with ontology [14], and converted the scene into an input model for combined testing with two algorithms, thus generating the parameters required for specific scenarios. Menzel et al. transformed a function scenario described based on keywords into a logic scenario represented by parameter space, and they then restricted the parameter values [15]. The authors also transformed the logic scenario into the data format required for simulation testing, providing a basis for the generation of specific scenarios. Existing scenario generation methods focus on the parameter ranges needed to generate logical scenarios. This paper further sets parameters based on logical scenarios using functional scenarios and implements the batch generation of specific scenarios through parametric design.
1.2.2. Evaluation Methods for Automated Vehicle Testing
Zheng et al. put forward a comprehensive evaluation method to evaluate the smoothness of automated vehicles under braking conditions. The comfort index (CI) value was used to quantitatively express the smoothness of the vehicles, and then the CI value was divided into intervals. In the experiment, different brake pressures were used to obtain multiple groups of CI values. The two-dimensional table of CI and time was observed to analyze the smoothness of automated vehicles during braking [16]. Bachmann et al. proposed a method to evaluate the perception of automated vehicles in 1/10 urban scenes by comparing the percentage of time required to cross the lane line with full sensors and with one sensor missing; they evaluated and compared the positioning of target detectors and various sensor fusion configurations based on cameras and LiDAR [17]. Niu et al. selected 21 evaluation indicators based on aspects such as environmental awareness and positioning accuracy, communication and transmission capabilities, application scenarios, decision control effectiveness, and system adaptability; they proposed an evaluation index system for the vehicle information and communication system (VICS). Using a combination of the analytic hierarchy process and the entropy method, an evaluation framework for a multimode communication VICS was established [18]. Ito et al. considered subjective evaluation indicators in vehicle detection using intersection over union (IoU) and conducted subjective evaluation experiments for real ground registration errors in vehicle detection [19]. Dong et al. combined gray correlation analysis with an improved analytical hierarchy process (AHP) to evaluate the intelligent turning behavior of unmanned vehicles. Applying an evaluation index system for intelligent turn-around behavior, an improved AHP method was used to determine the weight of each evaluation index, and a grey correlation analysis evaluation model was used for evaluation [20]. Zhao et al. explored the relationship between subjective evaluation and objective indicators of vehicles’ dynamic performance and established an overall subjective evaluation model based on a probabilistic neural network (PNN) to evaluate vehicle dynamic performance [21]. Kim et al. used road information to develop assessment scenarios and study the evaluation criteria for control systems between vehicles and infrastructure [22].
1.3. Contribution and Section Arrangement
Most existing evaluation methods for automated vehicles use qualitative evaluation methods, while few quantitative evaluation methods are used. Additionally, most of the existing evaluation methods focus on the performance evaluation of a certain vehicle system [23,24] or on a unilateral performance evaluation of the vehicle (such as an intelligence evaluation [25], comfort evaluation [26], or safety evaluation [27]), and few experts pay attention to the vehicle’s comprehensive performance in the existing evaluations of automatic driving systems. Therefore, an evaluation method combining subjective and objective factors is designed and proposed to evaluate the comprehensive performance of automated vehicles. Specifically, the virtual test scenarios are first built in PreScan to test the automated vehicles, and the automated vehicles are defined based on the certain parameters and behavior characteristics. Then, according to the specific performance and corresponding weight of the automated vehicles in the test scenarios, an evaluation method combining subjective and objective factors is designed. Finally, some virtual simulations and real experiments are used to verify the effectiveness and feasibility of the proposed method.
Based on the above analysis of methods, this paper proposes an evaluation method for automated vehicles combining subjective and objective factors. The main contributions of this paper are as follows:
- The five evaluation dimensions of safety, efficiency, economy, intelligence, and comfort, as well as 13 indicators, are applied to establish a more comprehensive evaluation system for automated vehicles.
- AHP (subjective) and improved CTITIC (objective) methods are combined to determine the weights of indicators, and a two-level fuzzy comprehensive (subjective and objective) evaluation method is adopted to comprehensively evaluate the performance of automated vehicles.
- An evaluation method combining subjective and objective factors is proposed to obtain more reasonable vehicle performance test results and achieve a more comprehensive and effective evaluation of automated vehicles.
The organization of this work is as follows: Section 1 introduces the research significance and current status of automated vehicle testing and evaluation. Section 2 introduces an automatic generation method for scenarios. Section 3 proposes a subjective and objective method for evaluating automated vehicles. Section 4 validates the subjective and objective evaluation methods. Section 5 summarizes the research content and the innovations of this paper.
2. Automatic Generation of Test Scenarios
Traditional test scenarios are generated manually and are relatively inefficient [28,29]. At the same time, when various scenarios and complex parameters are tested, the amount of testing is relatively large, and the manual generation method described above consumes significant manpower [30]. Against this background, the present study proposes an automatic scenario generation method to realize automatic scene generation and batch testing.
2.1. Scene Element Classification
Generating automated test scenarios is the foundation and prerequisite for testing automated vehicles. In order to cover the test scenarios for automated vehicles as comprehensively as possible, the scene elements that make up the test scenarios are first classified, as shown in Figure 1.
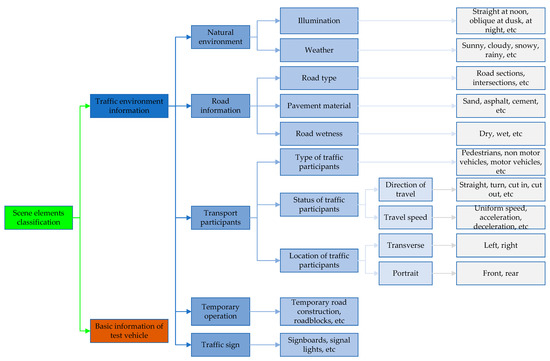
Figure 1.
Classification of scene elements.
2.2. Automatic Generation of Test Scenarios
The generation of test scenarios is the key to testing automated vehicles. According to the abstraction level of each scenario, the test scenarios were divided into functional scenarios, logical scenarios, and specific scenarios; the more specific the scenarios, the greater the number of scenarios. The schematic diagram for automatically generating test scenarios is shown in Figure 2. Here, (1) the functional scenarios are determined through scene elements, (2) the logical scenarios are obtained by parameterizing some scene elements in the functional scenarios, (3) the specific scenarios are obtained by specifying parameters in the logical scenarios, (4) the parameters are encoded, and simulation software is used to parse the encoding and to build test scenarios using the relevant scripts. The above steps proposed in this paper can realize the automatic generation of test scenarios (See Figure 2).
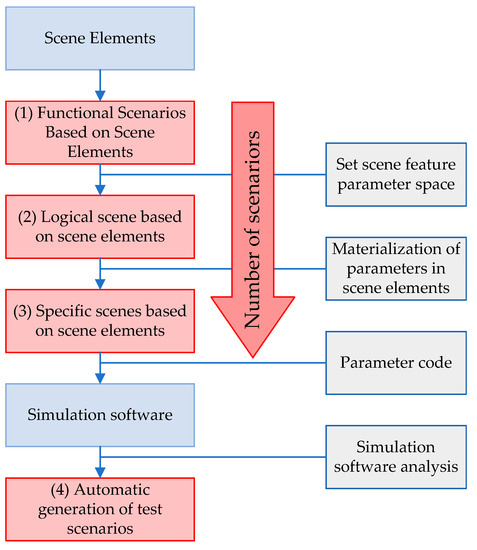
Figure 2.
Schematic diagram for the automatic generation of test scenarios.
More specifically, the automatic scenario generation method can be used to plan the lowest-cost driving route for vehicles from the current location to the target location based on global path planning. Through the environmental perception module, the surrounding environmental information, including static and dynamic targets, is detected by LiDAR and millimeter wave radar, and the information is fused. Through the decision-making module, decisions such as following, changing lanes, and overtaking are made based on the current surrounding environmental information. Through the planning and control module, a safe space (variable lane space) is planned based on the instructions issued by the decision-making module. The above analysis was used to complete the design and development of the automatic scenario generation method. The key information in Figure 2 is as follows:
(1) Functional Scenarios Based on Scene Elements
Functional scenarios describe test scenarios in textual form, extending from the classification of scenario elements. By integrating natural environmental information, road information, traffic participant information, and traffic sign information, three typical functional scenarios are identified: vehicle–pedestrian, vehicle–non-motor vehicle, and vehicle–motor vehicle. A schematic diagram of typical functional scenarios is shown in Table 1.

Table 1.
Typical functional scenarios.
(2) Logical Scenarios Based on Functional Scenarios
Logical scenarios are used to quantify the unassigned elements in the function scenario and set the parameter space. The functional scenarios of the above three typical scenarios of vehicle–pedestrian, vehicle–non-motor vehicle, and vehicle–motor vehicle are analyzed. First, the speed ranges of vehicles and traffic participants on different roads are determined. Second, the initial position and driving direction of the traffic participants are set through a simulation test. Here, the speed of the participants is the maximum of the speed interval, and, when the vehicles collide with the participants, the position is the collision boundary. Finally, the space of scene parameters is determined to obtain the typical logical scenarios. Since the specific logical scenarios are similar to the functional scenarios, figures are not shown in this section.
(3) Specific Scenarios Based on Logical Scenarios
According to the space of the scene parameters in the logical scenarios, the specific parameters of the scene elements are set and recombined to obtain the specific scenarios. Specific scenarios for the three typical scenes are as follows: vehicle–pedestrian, vehicle–non-motor vehicle, and vehicle–motor vehicle. The specific scenarios generated here are also similar to the functional scenarios.
(4) Automatic Generation of Specific Scenarios
To improve the efficiency of constructing the test scenarios, the functional scenarios are used as the basic scenarios. Then, each test only requires changing the parameters of elements not assigned in the functional scenarios of the basic scenarios according to the parameter space in the logical scenarios. In the simulation software, parameters are read through scripted design, and values are assigned to elements in the scene, such as the location of the traffic participants, the speed of traffic participants, etc., to achieve the automatic generation of test scenarios. An example scenario generated using a typical vehicle–vehicle scenario is shown in Figure 3.
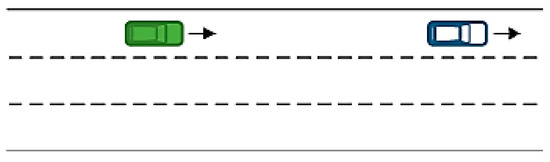
Figure 3.
Generation of specific scenarios.
2.3. Batch Testing
After the test scenarios are generated, it is necessary to test the scenarios to verify the effectiveness of the automatic generation of the test scenarios. In order to improve the testing efficiency, batch testing is adopted. Here, the AEB (automatic emergency braking) test is used an example to complete the batch testing of the generated scenarios. As shown in Figure 4, the test vehicle travels in a straight line at a constant speed of V1 m/s, and the vehicle in front travels in a straight line at a constant speed of V2 m/s, where L represents the initial distance between the test vehicle and the vehicle in front.
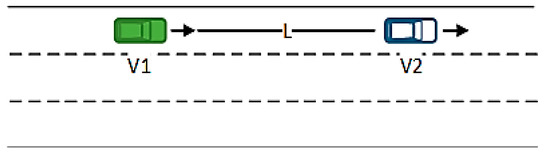
Figure 4.
AEB test scenario.
The TTC (time to collision) is calculated in real time using the control model established in the Simulink. When TTC < 1.6 s, the test vehicle starts to partially brake, and when TTC < 0.6 s, the test vehicle starts to fully brake. When the longitudinal distance between two vehicles in the same lane is 0, the vehicles are considered to have collided. Some test results are shown in Table 2.
Table 2.
Some test results.
The batch testing results show that the automatic generation method for test scenarios proposed in this paper is effective. This method was able to improve the efficiency of the test and quickly find the security boundaries of vehicles during operation after testing.
3. Comprehensive Evaluation Combining Subjective and Objective Methods
Comprehensive evaluation refers to the method of determining an evaluation index system based on the evaluation object and evaluation objectives [31] and using certain mathematical methods to convert multiple evaluation indicators into an index that can characterize the comprehensive performance of the evaluation object [32,33]. The performance of automated vehicles is affected by the driving system, environment, etc. In order to comprehensively evaluate the performance of automated vehicles, we designed a comprehensive evaluation method combining subjective and objective factors. The process of the comprehensive evaluation is shown in Figure 5.
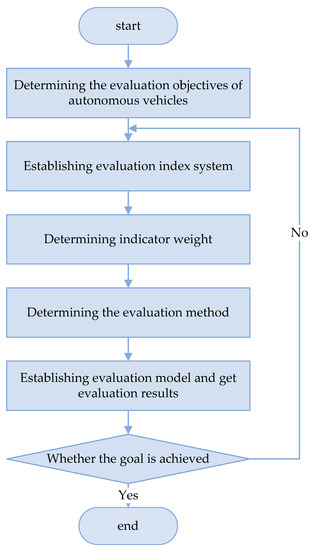
Figure 5.
Comprehensive evaluation process.
3.1. Establishment of an Evaluation Index System for Automated Vehicles
The design and development of an evaluation method for automated vehicles should comprehensively consider perception, decision-making, planning, and control capabilities. According to the principles for selecting the indicators mentioned above, this paper evaluates the performance of automated vehicles based on five aspects: safety, efficiency, economy, intelligence, and comfort. The comprehensive evaluation system for automated vehicles proposed and established in this paper is shown in Figure 6, where the target layer is the comprehensive evaluation of automated vehicles, the total index layer includes 5 overall indicators (safety, efficiency, economy, intelligence, and comfort), and the index layer includes 13 indicators.
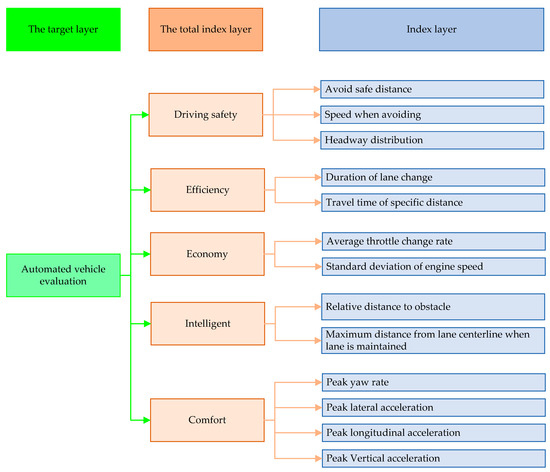
Figure 6.
Evaluation index system for automated vehicles.
3.2. Determination of Index Weights
Determining the weight coefficients of the evaluation indicators is the core of comprehensive evaluation, and it has a direct impact on the quality of the evaluation results [34,35]. Therefore, after determining the comprehensive evaluation system for automated vehicles, the weight coefficients of the evaluation indicators should be determined first. For the total index layer of automated vehicles, considering that it is difficult to quantify the index numerically, a subjective weighting method (analytic hierarchy process, AHP) is adopted to determine the weight value. For the index layer, the indicators can be expressed via numerical quantification and analyzed based on the correlation between data and the volatility of data (criteria importance though intercriteria correlation, CRITIC). The CRITIC method combines the correlation coefficient and contrast strength between indicators to calculate the weight coefficient [36,37]. Specifically, the correlation coefficient is used to express the conflict between indicators, and the contrast strength is reflected through the standard deviation.
3.2.1. AHP Method for Determining the Weight of the Total Index Layer
The indicators of the total index layer are compared in pairs, and index importance is assigned to complete the construction of the judgment matrix :
where is the result of comparing indicator with indicator , and the judgment matrix has the following properties:
First, the judgment matrix is normalized according to the column vector:
Second, the normalized matrix is summed by rows to obtain the sum vector :
Finally, the indicator weight vector of the total index layer is obtained by normalizing the :
3.2.2. Improved CRITIC Method for Determining the Weight of the Index Layer
The traditional CRITIC method uses the Pearson correlation coefficient, but the conditions for the use of the Pearson correlation coefficient are relatively strict. Consequently, this paper proposes an improved CRITIC method to determine the indicator weights of the index layer. In the improved CRITIC method, discrete coefficients are used to replace the standard deviation to measure the volatility of data to determine the contrast strength between indicators, and the Spearman correlation coefficients are used to replace the Pearson correlation coefficients to measure the correlation between indicators. The improved CRITIC method process is shown in Figure 7.
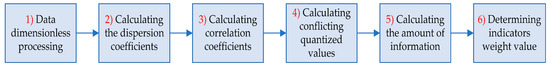
Figure 7.
Improved CRITIC method.
Assuming that there are evaluation objects, and each evaluation object has evaluation indicators, the judgment matrix can be obtained from Formula (6), and the weight of the index layer can be obtained according to Figure 7, as follows:
(1) Data dimensionless processing. Due to the different meanings and units represented by the various indicators in the index layer, the normalization process is carried out as follows:
where is the data of the j-th indicator of the i-th evaluation object, ; and are the maximum, average, and minimum values of , respectively, is the normalized data of , and is the normalized judgment matrix.
(2) Calculating the dispersion coefficients. The contrast strength between indicators reflects the fluctuation of differences between indicators, which can be characterized by discrete coefficients. The discrete coefficient of the k-th indicator can be obtained as follows:
where is the average value of the k-th indicator, and is the standard deviation of the k-th indicator.
(3) Calculating the correlation coefficients. According to the indicator value, the evaluation objects are stored from small to large, and the position of the evaluation objects after storing is represented by the rank. For example, if the evaluation objects are stored based on the j-th indicator value, the rank of the i-th evaluation object can be expressed as . The rank difference of the k-th and l-th indicators of the i-th evaluation object can then be obtained as follows:
The Spearman correlation coefficient for the k-th and l-th indicators can also be obtained as follows:
(4) Calculating conflicting quantized values. The quantitative value of conflict between the k-th indicator and other indicators can be obtained as follows:
(5) Calculating the amount of information. The information that the k-th indicator provides is calculated as follows:
(6) Determining the indicator weight values. The weight of the k-th indicator can be obtained from the above steps as follows:
3.3. Determination of Evaluation Methods
As mentioned above, the evaluation index system for autonomous vehicles is a complex system that includes the target layer, total index layer, and index layer. Considering the relatively large number of indicators and the unclear relationship between indicators, a two-level fuzzy comprehensive evaluation method is proposed in this paper. In the two-level fuzzy comprehensive evaluation method, constructing the judgment matrix requires h experts to score the indicators. Due to the different technical levels of the experts, this paper evaluates the comprehensive ability of experts from m aspects to determine the weighting coefficient of the experts and obtain the final judgment matrix. The process of the two-level fuzzy comprehensive evaluation method is shown in Figure 8.

Figure 8.
The two-level fuzzy comprehensive evaluation method.
The indicator set composed of indicators in the index layer of automated vehicles is :
and the evaluation set of automated vehicles is :
where is the number of expert comments, and the corresponding scores for expert comments are .
The evaluation weight coefficient of the p-th expert is :
where is the score of the p-th expert for the j-th indicator.
The judgment matrix of the two-level indicator set can be obtained as follows:
where is the evaluation result of the two-level indicator set by the p-th expert, is the rank of the i-th indicator in the two-level indicator set by the p-th expert, and is the judgment matrix of h experts of the two-level indicator set.
The judgment matrix of the one-level indicator set can also be obtained as follows:
where is the weight coefficient of the two-level indicator set, is the comprehensive evaluation matrix of the two-level indicator set, and is the judgment matrix of h experts for the one-level indicator set.
Finally, the evaluation result matrix of automated vehicles using the two-level fuzzy comprehensive evaluation method can be obtained as follows:
where is the weight coefficient of the one-level indicator set, and is the comprehensive evaluation matrix of the one-level indicator set.
4. Examples of the Subjective and Objective Evaluation of Automated Vehicles
The testing and evaluation of automated vehicles can be performed on real roads or in virtual environments [38]. Considering that several millions of test kilometers must be completed to effectively test and evaluate automated vehicles [39], it can be concluded that the real testing and evaluation of automated vehicles are limited by factors such as cost, time, and scalability [40]. Thereby, the virtual environment was first adopted to test and evaluate automated vehicles in this paper to verify the effectiveness of the proposed method. Furthermore, in order to verify the effectiveness and feasibility of the proposed method, the real vehicle is tested and evaluated as well.
4.1. Virtual Testing and Evaluation of Automated Vehicles
According to the automatic generation method for test scenarios, the traffic flow scenarios were generated in PreScan, as shown in Figure 9, Figure 10 and Figure 11. Then, the subjective and objective comprehensive evaluation method was adopted to evaluate the comprehensive performance of automated vehicles in traffic flow scenarios.

Figure 9.
Test scenario clip 1.

Figure 10.
Test scenario clip 2.

Figure 11.
Test scenario clip 3.
4.1.1. Determination of Index Weights
(1) Determination of Weights for the Total Index Layer
Experts were invited to determine the judgment matrix for the total index level in the automated vehicle evaluation index system according to each indicator’s importance, as shown in Table 3. According to Formulas (1)–(5), the indicator weight vector of the total index layer was obtained.
Table 3.
Judgement matrix for the total index layer.
(2) Determination of Index Layer Weights
The improved CRITIC method was adopted to determine the indicator weights of the index layer. The dimensionless treatment of indicators according to Formulas (6)–(8) is shown in Table 4.
Table 4.
Indicator dimensionless values in different scenarios.
Then, according to Formulas (9) and (10), the dispersion coefficients of the indicators were calculated, as shown in Table 5.
Table 5.
Dispersion coefficients of indicators.
Finally, according to Formulas (11)–(15), the conflicting quantized values and amount of information were calculated, as were the weights of indicators in the index layer. To visually reflect the weight calculation results for each indicator, the total index layer calculation results and the index layer calculation results are unified in Table 6.
Table 6.
Indicator weights.
4.1.2. Evaluation by Two-Level Fuzzy Comprehensive Evaluation Method
In this paper, 20 experts from the CATARC Automotive Test Center, Jilin University, and other research institutes were invited to score the automated vehicles. The scoring standards are shown in Table 7.
Table 7.
Scoring standards.
Due to the different technical levels of the experts, it was necessary to evaluate their comprehensive abilities based on four factors (driving experience, driving level, professional skill, and driving style) to determine the weighting coefficients of the experts. The scoring standards for the comprehensive abilities of experts are shown in Table 8.
Table 8.
Scoring standards for the comprehensive abilities of experts.
The 20 invited experts were evaluated according to the scoring standards in Table 8, and the comprehensive ability scores of the 20 experts were obtained, as shown in Figure 12.
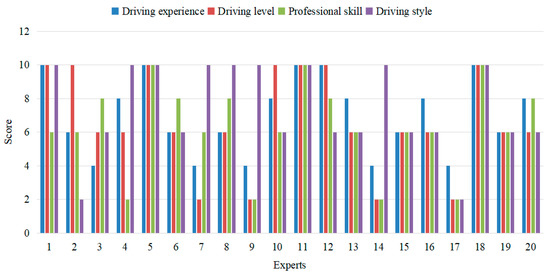
Figure 12.
The comprehensive ability scores of the 20 invited experts.
According to Formulas (16)–(18), the weights of the 20 invited experts were calculated. The weight calculation results are shown in Table 9.
Table 9.
The weight calculation results.
Then, the 20 invited experts scored 13 evaluation indicators in the index layer. According to the scoring results and Formulas (19) and (20), the judgment matrix of the two-level indicator set was obtained, as shown in Figure 13 and Table 10.
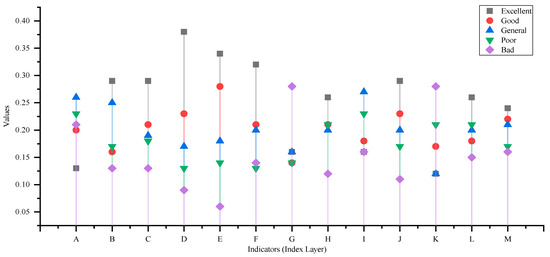
Figure 13.
The judgment matrix of the two-level indicator set.
Table 10.
The judgment matrix of the two-level indicator set.
Then, according to Formulas (21) and (22), the judgment matrix of the one-level indicator set was obtained, as shown in Figure 14 and Table 11.
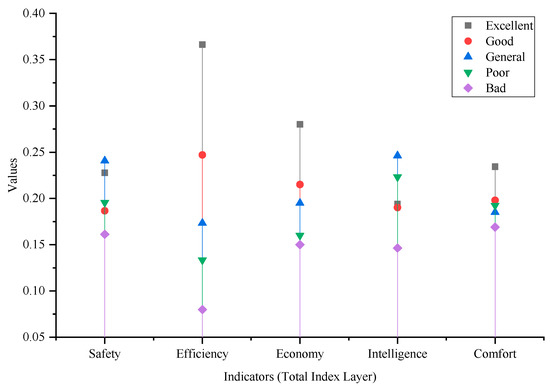
Figure 14.
The judgment matrix of the one-level indicator set.
Table 11.
The judgment matrix of the one-level indicator set.
Finally, according to Formulas (23) and (24), the comprehensive score and membership of automated vehicles were obtained, as shown in Table 12.
Table 12.
Comprehensive score.
According to the membership principle of the two-level fuzzy comprehensive evaluation method, 26% of experts evaluated the comprehensive performance of the test vehicle as excellent, 20% of experts evaluated the comprehensive performance of the test vehicle as good, 21% of experts evaluated the comprehensive performance of the test vehicle as general, 18% of experts evaluated the comprehensive performance of the test vehicle as poor, and 15% of experts evaluated the comprehensive performance of the test vehicle as bad. Combining the above, the score of each indicator (total index layer and target layer) was calculated and obtained, as shown in Table 13.
Table 13.
Virtual test and evaluation results of the two-level fuzzy comprehensive evaluation method.
According to the above analysis and calculation of automated vehicles in different test scenarios, evaluation results for safety, efficiency, economy, intelligence, and comfort were obtained. Specifically, we found that, in terms of safety, when an automated vehicle meets the vehicle in front at a low speed, it changes lanes and continues running without collision. Additionally, the speed was found to be reasonable relative to the average speed of the traffic flow during the avoidance maneuver. However, the safety distance was still small when avoiding traffic. For example, if the vehicle in front suddenly decelerates, the braking time is relatively short, which can easily create a dangerous situation, indicating that the safety of automated vehicles during driving needs to be improved. In terms of efficiency, the duration of lane changes and the travel time needed to cover specific distances in the three scenarios were found to be relatively short, thus meeting the efficiency requirements. In terms of economy, the standard deviation of engine speed was relatively large, which needs to be improved. In terms of intelligence, the vehicle could identify the target vehicle in advance, with a relatively long distance, and was able to avoid a collision over a relatively short period of time. However, during lane maintenance, the distance from the lane centerline in the first and third scenarios was relatively large, while the distance from the lane centerline in the second scenario was relatively moderate. In terms of comfort, the peak yaw rate was determined to be 12 deg/s based on the experts’ opinions, and the yaw rate of the automated vehicle was far less than the threshold value, thus meeting the comfort requirements.
4.2. Real Testing and Evaluation of Automated Vehicles
After completing the virtual testing and evaluation of the automated vehicles, in order to further verify the effectiveness and feasibility of the proposed evaluation method, real vehicle testing and evaluation experiments were also conducted on a passenger test vehicle with automated driving assistance function (see Figure 15a). We selected a road in Changchun, China as the test road for the test vehicle, and conducted three repeated actual road tests on a certain road (with a length of 2 km), with each test interval of 1 h. Additionally, one of the lane-changing trajectories of the test vehicle during the experiment is shown in Figure 15b.
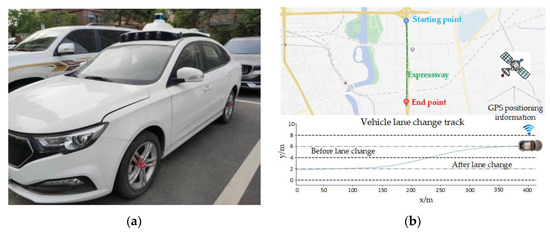
Figure 15.
Experiments of real testing and evaluation: (a) real test vehicle; (b) real test diagram.
Over three experiments, 13 evaluation index parameters were collected, and the collected data are shown in Table 14. According to the above evaluation process and methods, the test vehicle was evaluated, and the evaluation results obtained are shown in Table 15.
Table 14.
Indicator values in different experiments.
Table 15.
Real test and evaluation results of the two-level fuzzy comprehensive evaluation method.
According to the real experiments and evaluation results, we found that, in terms of safety, the vehicle avoidance distance is reasonable, but the vehicle avoidance speed is too high compared with the average speed of the traffic flow, and the test vehicle’s headway is small; this could potentially be dangerous, so the vehicle safety needs to be improved. In terms of efficiency, the duration of lane changes and the distance passing times are shorter, and the vehicle has good efficiency performance. It also performed well on the economic front. In terms of intelligence, the lane-keeping function needs to be improved. In terms of comfort, the lateral acceleration peak differs greatly from real drivers’ driving, and comfort needs to be improved.
5. Conclusions
In this paper, a method was proposed to achieve the automatic generation of test scenarios, laying the foundation for the evaluation of automated vehicles. Additionally, an evaluation method for automated vehicles combining subjective and objective factors was proposed: (1) the AHP method was adopted to determine the weight of the total index layer; (2) an improved CRITIC method was adopted to determine the weight of the index layer; and (3) a two-level fuzzy comprehensive evaluation method was proposed to evaluate the comprehensive performance of automated vehicles. The effectiveness of the proposed evaluation method combining subjective and objective factors was further verified through examples. The proposed evaluation method combining subjective and objective factors was able to more objectively evaluate the comprehensive performance of automated vehicles in specific driving scenarios. Specifically, comprehensive performance evaluation results for different types of automated vehicles were obtained, and the application effects of different control algorithms on automated vehicles were evaluated.
One of the main limitations of the present work is the limited number of experts invited to participate. More experts still need to be invited to evaluate automated vehicles. The use of more experts could provide more professional data, which would help us to conduct more rigorous and comprehensive research on the performance evaluation of automated vehicles. In addition, the 13 indicators in the index layer could be further improved. More comprehensive evaluation indicators could be used to comprehensively characterize automated vehicles and obtain more comprehensive and detailed evaluation results for such vehicles. Despite these limitations, the proposed evaluation method for automated vehicles combining subjective and objective factors was able to effectively evaluate the comprehensive performance of the automated vehicles, thereby laying a foundation for the further development of automated vehicle testing and evaluation. The proposed evaluation method, which combines subjective and objective factors, could also be adopted in other fields, such as robotics, artificial intelligence, and transportation engineering. In the future, more comprehensive and rigorous evaluation results will be obtained by acquiring more data, and related research on real vehicle testing and evaluation will be carried out.
Author Contributions
Conceptualization, W.W. and Y.M.; methodology, F.Q. and L.W.; software, X.L. and W.L.; validation, W.L. and D.M. formal analysis, W.W. and Y.M.; investigation, F.Q. and X.L.; writing—original draft preparation, W.W.; writing—review and editing, Y.M. and D.M.; visualization, Y.M.; supervision, W.W.; funding acquisition, W.W. All authors have read and agreed to the published version of the manuscript.
Funding
This research was funded by the Science and Technology Planning Project of Jilin (20210301023GX) and the Scientific research project of CATARC Automotive Test Center (Tianjin) Co., Ltd., (TJKY2223039).
Institutional Review Board Statement
Not applicable.
Informed Consent Statement
Not applicable.
Data Availability Statement
Not applicable.
Conflicts of Interest
The authors declare no conflict of interest.
References
- Pei, S.S.; Ma, C.; Zhu, H.T.; Luo, K. An Evaluation System Based on User Big Data Management and Artificial Intelligence for Automatic Vehicles. J. Organ. End User Comput. 2023, 34, 10. [Google Scholar]
- Chan, V.W.S. Autonomous Vehicles Safety. IEEE Commun. Mag. 2021, 59, 4. [Google Scholar] [CrossRef]
- Xu, Z.; Bai, Y.; Wang, G.; Gan, C.; Sun, Y. Research on Scenarios Construction for Automated Driving Functions Field Test. In Proceedings of the 2022 International Conference on Intelligent Dynamics and Control Technology (IDC 2022), Guilin, China, 22–24 April 2022. [Google Scholar]
- Luo, Y.; Xiang, D.; Zhang, S.; Liang, W.; Sun, J.; Zhu, L. Evaluation on the Fuel Economy of Automated Vehicles with Data-Driven Simulation Method. Energy AI 2021, 3, 100051. [Google Scholar] [CrossRef]
- Zhang, P.; Zhu, B.; Zhao, J.; Fan, T.; Sun, Y. Performance Evaluation Method for Automated Driving System in Logical Scenario. Automot. Innov. 2022, 5, 299–310. [Google Scholar] [CrossRef]
- Manuel, M.S.; Jos, E.; Emilia, S.; van de Molengraft, R. Scenario-based Evaluation of Prediction Models for Automated Vehicles. In Proceedings of the 2022 IEEE 25th International Conference on Intelligent Transportation Systems (ITSC), Macau, China, 8–12 October 2022. [Google Scholar]
- Gottschalg, G.; Leinen, S. Comparison and evaluation of integrity algorithms for vehicle dynamic state estimation in different scenarios for an application in automated driving. Sensors 2021, 21, 1458. [Google Scholar] [CrossRef]
- Li, S.; Li, W.; Li, P.; Ma, P.; Yang, M. Novel Test Scenario Generation Technology for Performance Evaluation of Automated Vehicle. Int. J. Automot. Technol. 2022, 23, 1295–1312. [Google Scholar] [CrossRef]
- Kibalama, D.; Tulpule, P.; Chen, B.S. AV/ADAS Safety-Critical Testing Scenario Generation from Vehicle Crash Data. In Proceedings of the SAE 2022 Annual World Congress Experience (WCX 2022), Online, 5–7 April 2022. [Google Scholar]
- Zhu, B.; Zhang, P.; Zhao, J.; Deng, W. Hazardous Scenario Enhanced Generation for Automated Vehicle Testing Based on Optimization Searching Method. IEEE Transp. Intell. Transp. 2022, 23, 7321–7331. [Google Scholar] [CrossRef]
- Lv, H.; Gao, P.; Yuan, K.; Shu, H. Research on Critical Test Scenarios of Automated Vehicle Overtaking on Highway. In Proceedings of the SAE 2021 Intelligent and Connected Vehicles Symposium (ICVS 2021), Chongqing, China, 4–6 November 2021. [Google Scholar]
- Menzel, T.; Bagschik, G.; Maurer, M. Scenarios for Development, Test and Validation of Automated Vehicles. In Proceedings of the 2018 IEEE Intelligent Vehicles Symposium (IV), Changshu, China, 26–30 June 2018. [Google Scholar]
- Gelder, E.; Paardekooper, J. Assessment of Automated Driving Systems using real-life scenarios. In Proceedings of the 2017 IEEE Intelligent Vehicles Symposium (IV), Los Angeles, CA, USA, 11–14 June 2017. [Google Scholar]
- Li, Y.; Tao, J.; Wotawa, F. Ontology-based test generation for automated and autonomous driving functions. Inform. Softw. Technol. 2020, 117, 106–200. [Google Scholar] [CrossRef]
- Menzel, T.; Bagschik, G.; Isensee, L.; Schomburg, A.; Maurer, M. From functional to logical scenarios: Detailing a keyword-based scenario description for execution in a simulation environment. In Proceedings of the 2019 IEEE Intelligent Vehicles Symposium (IV), Paris, France, 9–12 June 2019. [Google Scholar]
- Zheng, B.; Hong, Z.; Tang, J.; Han, M.; Chen, J.; Huang, X. A Comprehensive Method to Evaluate Ride Comfort of Autonomous Vehicles under Typical Braking Scenarios: Testing, Simulation and Analysis. Mathematics 2023, 11, 474. [Google Scholar] [CrossRef]
- Buckman, N.; Hansen, A.; Karaman, S.; Rus, D. Evaluating Autonomous Urban Perception and Planning in a 1/10th Scale MiniCity. Sensors 2022, 22, 6793. [Google Scholar] [CrossRef]
- Niu, W.; Liu, X.; Yue, D.; Zhang, F.; Yu, Y. A Comprehensive Evaluation Approach for Vehicle-Infrastructure Cooperation System Using AHP and Entropy Method. In Proceedings of the 12th International Conference on Green Intelligent Transportation Systems and Safety, Singapore, 28 October 2022. [Google Scholar]
- Ito, N.; Aktar, M.S.; Horita, Y. Construction of subjective vehicle detection evaluation model considering shift from ground truth position. EICE Trans. Fundam. Electron. Commun. Comput. Sci. 2019, 102, 1246–1249. [Google Scholar] [CrossRef]
- Dong, F.; Zhao, Y.N.; Gao, L. Application of Gray Correlation and Improved AHP to Evaluation on Intelligent U-Turn Behavior of Unmanned Vehicles. In Proceedings of the 8th International Symposium on Computational Intelligence and Design (ISCID), Hangzhou, China, 12–13 December 2015. [Google Scholar]
- Zhao, J.; Liu, J.; Yang, L.; He, P. Exploring the relationships between subjective evaluations and objective metrics of vehicle dynamic performance. J. Adv. Transp. 2018, 2018, 2638474. [Google Scholar] [CrossRef]
- Kim, J.; Jeong, C.; Jung, D.; Kim, B. Development of a quantitative evaluation method for vehicle control systems based on road information. In Proceedings of the 10th International Scientific Conference on Future Information Technology (Future Tech), Hanoi, Vietnam, 18–20 May 2015. [Google Scholar]
- Guo, R.L.; Yang, C.; Liang, D. Applied study on functional safety limit scenario test of a steering system based on whole vehicle in the loop. In Proceedings of the 2022 6th CAA International Conference on Vehicular Control and Intelligence (CVCI), Nanjing, China, 28–30 October 2022. [Google Scholar]
- Abdel-Aty, M.; Cai, Q.; Wu, Y.N.; Zheng, O. Evaluation of automated emergency braking system’s avoidance of pedestrian crashes at intersections under occluded conditions within a virtual simulator. Accid. Anal. Prev. 2022, 176, 106797. [Google Scholar] [CrossRef] [PubMed]
- Li, L.; Huang, W.L.; Liu, Y.H.; Zheng, N.N.; Wang, F.Y. Intelligence Testing for Autonomous Vehicles: A New Approach. IEEE Trans. Intell. Veh. 2016, 1, 158–166. [Google Scholar] [CrossRef]
- Zhu, J.; Zhang, W.; Wu, M.X. Evaluation of Ride Comfort and Driving Safety for Moving Vehicles on Slender Coastal Bridges. J. Vib. Acoust. 2018, 140, 051012. [Google Scholar] [CrossRef]
- Li, Y.; Li, Z.B.; Wang, H.; Wang, W.; Xing, L. Evaluating the safety impact of adaptive cruise control in traffic oscillations on freeways. Accid. Anal. Prev. 2017, 104, 137–145. [Google Scholar] [CrossRef]
- Jiang, C.; Mita, A. SISG4HEI_Alpha: Alpha version of simulated indoor scenario generator for houses with elderly individuals. J. Build. Eng. 2021, 35, 101963. [Google Scholar] [CrossRef]
- Hempen, T.; Biank, S.; Huber, W.; Diedrich, C. Model Based Generation of Driving Scenarios. In Proceedings of the 1st International Conference on Intelligent Transport Systems (INTSYS 2017), Hyvinkaa, Finland, 29–30 November 2017. [Google Scholar]
- Song, Y.; Chitturi, M.V.; Noyce, D.A. Intersection two-vehicle crash scenario specification for automated vehicle safety evaluation using sequence analysis and Bayesian networks. Accid. Anal. Prev. 2022, 176, 106814. [Google Scholar] [CrossRef] [PubMed]
- Bke, T.A.; Albak, E.L.; Kaya, N.; Bozkurt, R.; Ergul, M.; Ozturk, D.; Emiroglu, S.; Ozturk, F. Correlation between objective and subjective tests for vehicle ride comfort evaluations. Proc. Inst. Mech. Eng. Part D J. Automob. Eng. 2023, 237, 706–721. [Google Scholar] [CrossRef]
- Feng, S.; Feng, Y.H.; Yan, X.T.; Shen, S.Y.; Xu, S.B.; Liu, H.X. Safety assessment of highly automated driving systems in test tracks: A new framework. Accid. Anal. Prev. 2020, 144, 105664. [Google Scholar] [CrossRef]
- He, H.J.; Tian, C.; Jin, G.; An, L. An improved uncertainty measure theory based on game theory weighting. Math. Probl. Eng. 2019, 2019, 3893129. [Google Scholar] [CrossRef]
- Ho, W.; Ma, X. The state-of-the-art integrations and applications of the analytic hierarchy process. Eur. J. Oper. Res. 2018, 267, 399–414. [Google Scholar] [CrossRef]
- Brady, S.R. Utilizing and Adapting the Delphi Method for Use in Qualitative Research. Int. J. Qual. Meth. 2015, 14, 1609406915621381. [Google Scholar] [CrossRef]
- Wang, D.; Ha, M.M.; Zhao, M.M. The intelligent critic framework for advanced optimal control. Artif. Intell. Rev. 2022, 55, 1–22. [Google Scholar] [CrossRef]
- Krishnan, A.R.; Kasim, M.M.; Hamid, R.; Ghazali, M.F. A Modified CRITIC Method to Estimate the Objective Weights of Decision Criteria. Symmetry 2021, 13, 973. [Google Scholar] [CrossRef]
- Stadler, C.; Montanari, F.; Baron, W.; Sippl, C.; Djanatliev, A. A Credibility Assessment Approach for Scenario-Based Virtual Testing of Automated Driving Functions. IEEE Open J. Intell. Transp. Syst. 2022, 3, 45–60. [Google Scholar] [CrossRef]
- Piazzoni, A.; Vijay, R.; Cherian, J.; Chen, L.; Dauwels, J. Challenges in Virtual Testing of Autonomous Vehicles. In Proceedings of the 17th International Conference on Control, Automation, Robotics and Vision (ICARCV), Singapore, 11–13 December 2022. [Google Scholar]
- Sippl, C.; Schwab, B.; Kielar, P.; Djanatliev, A. Distributed Real-Time Traffic Simulation for Autonomous Vehicle Testing in Urban Environments. In Proceedings of the 21st International Conference on Intelligent Transportation Systems (ITSC), Maui, HI, USA, 4–7 November 2018. [Google Scholar]


Disclaimer/Publisher’s Note: The statements, opinions and data contained in all publications are solely those of the individual author(s) and contributor(s) and not of MDPI and/or the editor(s). MDPI and/or the editor(s) disclaim responsibility for any injury to people or property resulting from any ideas, methods, instructions or products referred to in the content. |
© 2023 by the authors. Licensee MDPI, Basel, Switzerland. This article is an open access article distributed under the terms and conditions of the Creative Commons Attribution (CC BY) license (https://creativecommons.org/licenses/by/4.0/).