Article

Remaining Useful Life Estimation of Spindle Bearing Based on Bearing Load Calculation and Off-Line Condition Monitoring

1
Research Centre of Manufacturing Technology, Department of Production Machines and Equipment, Faculty of Mechanical Engineering, Czech Technical University in Prague, 16000 Prague, Czech Republic
2
Department of Production and Automation, Czech Institute of Informatics, Robotics and Cybernetics, Czech Technical University in Prague, 16000 Prague, Czech Republic
3
VOPSS Řepeč s.r.o., 39161 Řepeč, Czech Republic
*
Author to whom correspondence should be addressed.
Machines 2023, 11(6), 586; https://doi.org/10.3390/machines11060586
Submission received: 11 April 2023 / Revised: 13 May 2023 / Accepted: 15 May 2023 / Published: 24 May 2023
(This article belongs to the Section Machine Design and Theory)

Abstract

:
Spindles are key components of machine tools. An efficient estimation of the spindle condition and its prognosis can improve production efficiency and quality due to predictive maintenance planning. This paper proposes a method for predicting the remaining useful life (RUL) of machine tool spindle bearings using a combined calculation and experimental approach. The calculation model based on the ISO 281 standard uses monitored real loading conditions caused by the machining process and the machine tool operation. The model enables the updated calculation of the spindle lifetime L10h using real load distribution. Since the operation hours of the spindle are also monitored, the remaining useful life (RUL) of the spindle can be calculated. This RUL value is corrected using a bearing condition assessment based on the effective value of the vibration velocity RMS according to the ISO 20816 standard and measured data from the machine tool control system. The proposed method is tested on two different spindle types featuring three pieces of every type. The experimental results of six spindles are compared and validated with a concurrent blind evaluation conducted by a skilled expert. The validation shows a very good match of the proposed method and the expert opinion. The method combining a calculation of the spindle lifetime using monitored real load distribution and subsequent result correction using vibration signal enables the implementation of a full automated estimation of the spindle RUL.

1. Introduction

The rolling bearings are the key design elements of the machine tool spindles. The bearing design and arrangement affect the main spindle parameters: the maximum spindle revolutions and maximum spindle load by the cutting process. Both of these parameters are connected in the criterion of the maximum spindle life. The spindle lifetime L10h presented in hours, meaning that 10% of the bearings will fail within the calculated lifetime running under planned loading conditions, can be calculated based on the expected time distribution of the axial and radial load and the time distribution of operational revolutions [1,2]. The calculation equation is based on the statistical observation only.
The building of the load distribution is usually based on the experience of the spindle designer and estimation of the operational conditions. The real loading may vary from these expectations but can be continuously monitored during the machine tool operation. This approach is based on the designer estimation and knowledge based on the expected machining operations performed with the specific spindle type for the specific machining operations. The initial value of the lifetime can be modified using correction variables [1,2] with respect to the expected quality of lubrication or risk of bearing contamination. In the bearing operation, the remaining useful life (RUL) of the bearing calculated as a difference between the expected bearing lifetime L10h and the operation time is an important parameter for the planning of the spindle service. However, the real earing lifetime limit depends on the real distribution of the bearing loading and revolutions.
The real load of the spindle during machine tool operations might be monitored and processed, and a decision on the spindle state could be made automatically. This is the concept of “smart machine tools” or “smart manufacturing systems”. There are several publications describing these concepts. Liu [3] introduced a generic system architecture for cyber-physical machine tools consisting of physical devices using the network services for a connection with the machine tool virtual twin. The virtual twin is used for the evaluation of the data acquired from the machine operation. Qu [4] provided state-of-the-art and future trends of smart manufacturing systems. A hierarchical architecture with four specific layers is introduced: a machine layer, control layer, planning player and execution layer. Helu [5] described the concept of distributed production enabling shared processing and an evaluation of the operation data from multiple machines (called “physical assets” in this generalized concept) through connection to the shared virtual environment. Since communication technologies are a keystone for digital manufacturing systems, Kurfess [6] provided a systematic overview of current connection strategies and frameworks used for various levels of communication. The operation data processing can be completed on-edge, on-premise or on-cloud using communication protocols such as MTConnect or OPC-UA.
As presented, the smart production systems provide technical solutions for data acquisition and processing. With respect to the topic of the RUL estimation of spindle bearings, the monitoring of operation forces acting on the spindle bearings is a basic approach for a calculation-based estimation of the bearing RUL. The loading forces can be measured directly. The concept of the direct process force measurement can be based on the integration of piezoelectric measurement cells [7,8], or it can use precise displacement sensors and the spindle stiffness model [9]. The cutting forces can be also estimated indirectly using the monitoring of the spindle power data using various edge monitoring options of control systems, such as the Siemens Industrial Edge solution [10], FANUC Focas communication library [11] or HEIDENHAIN DNC interface [12]. The power losses of the specific spindle have to be identified in advance [13,14], and the transfer function between the motor current and the cutting force should be identified [15,16]. The RUL of all bearings can be calculated using a combination of the monitored loading history and the total operation time of the spindle. The main advantage of this approach is the possibility to observe the bearing lifetime limit change due to variations of the loading conditions and estimations of the updated bearing lifetime based on the real loading history.
However, the real state of the spindle bearing not only depends on the variable load and operation revolutions. The bearing failure can be initialized, e.g., by soft crashes of the spindle or by bearing contamination due to the improper function of the contactless sealing and by others. Thus, bearing condition monitoring is a very useful concurrent approach for the real bearing fault state detection. The bearing diagnostics are based on vibration signal analyses using time-domain methods, frequency-domain methods or time-frequency-domain methods as presented in recent review papers [17,18]. The rolling bearing degradation has four main stages in the rolling bearing model (bearing running-in stage, bearing steady-state stage, defect initiation and propagation, damage growth; see [19]). The key issue is the selection of appropriate signal features and the threshold setting for the initial run of the device. Comparing historical vibration amplitude trends with the current vibration amplitude is the basic method for estimating the current state of the bearing damage. This approach is also being used for the prediction of the bearing RUL using machine learning methods. Wu [20] combined the generalized Weibull failure rate function (WFRF) and radial basis function neural network for the bearing RUL prediction. Distinguishing between OK and non-OK bearings might be based on various parameters. An et al. [21] predicted the RUL using an amplitude decrease at specific frequencies within the vibration spectra. The degradation feature was identified in the frequency domain using the PRONOSTIA experimental data set [22]. Hui [23] presented the RUL prediction method based on the combined neural network model involving a convolutional neural network (CNN) for feature extraction and gated recurrent units (GRU) for data regression. The results are denoised by the weighted average noise reduction method. The method showed good prediction capability on the example using the PRONOSTIA data set [22].
As visible from the presented literature search, the current state-of-art knowledge is based either on calculation models or on machine learning approaches for the vibration signal processing. The calculation models can estimate the total bearing lifetime with low uncertainty if realistic loading information is used for the calculation. The vibration signal analysis is very useful for the current estimation of the OK/NOK bearing state. As presented, the definition of failure signals is challenging, and AI is one significant research direction. In practice, the HI (human intelligence) of skilled specialists is the main source of processed data evaluations especially for off-line spindle diagnostics. This paper presents a method for a bearing RUL estimation combining both basic approaches: a calculation of the total bearing lifetime based on the monitored real load distribution and the correction of the calculated lifetime results using off-line bearing vibration diagnostics. This is the novelty differing the proposed approach from the pure diagnostic approaches. The method is designed as a low-cost method available for off-line diagnostic procedures often used in the praxis. The results were compared with an independent expert evaluation of the bearing status. The paper is organized as follows: the method background and workflow are described in Section 2. The experimental results based on two sets of monitored spindles are presented in Section 3. Method uncertainties and the further development potential are discussed in Section 4. The paper concludes with Section 5.

2. Method Description

The presented bearing RUL model is based on the continuous monitoring of bearing load and spindle operation hours and subsequent recalculation of the estimated bearing lifetime according to existing standards. The RUL value obtained as a difference between the estimated bearing lifetime and spindle operation hours is corrected with the current vibrational state of the bearing; see Figure 1.
The process forces are monitored through the spindle torque. Concurrently, the operation time under a specific load and total spindle operation time are monitored. The spindle model is used for the calculation of the bearing load from the process forces. Using the force load and bearing revolution information, the bearing lifetime L10h is estimated according to ISO standard for the monitored real working conditions. Based on that, the bearing RUL LRUL,10h is calculated. See Section 2.1 for more details.
The off-line measurement of the spindle vibration should be completed periodically, e.g., once a month or quarterly. This measurement should check possible spindle damage due to non-load factors, e.g., bearing damage due to sealing system misfunctions, etc. The results from this in situ check of the real spindle state are used for the correction of the RUL value—the corrected RUL value LcRUL,10h is calculated. See Section 2.2, Section 2.3 and Section 2.4 for more details.

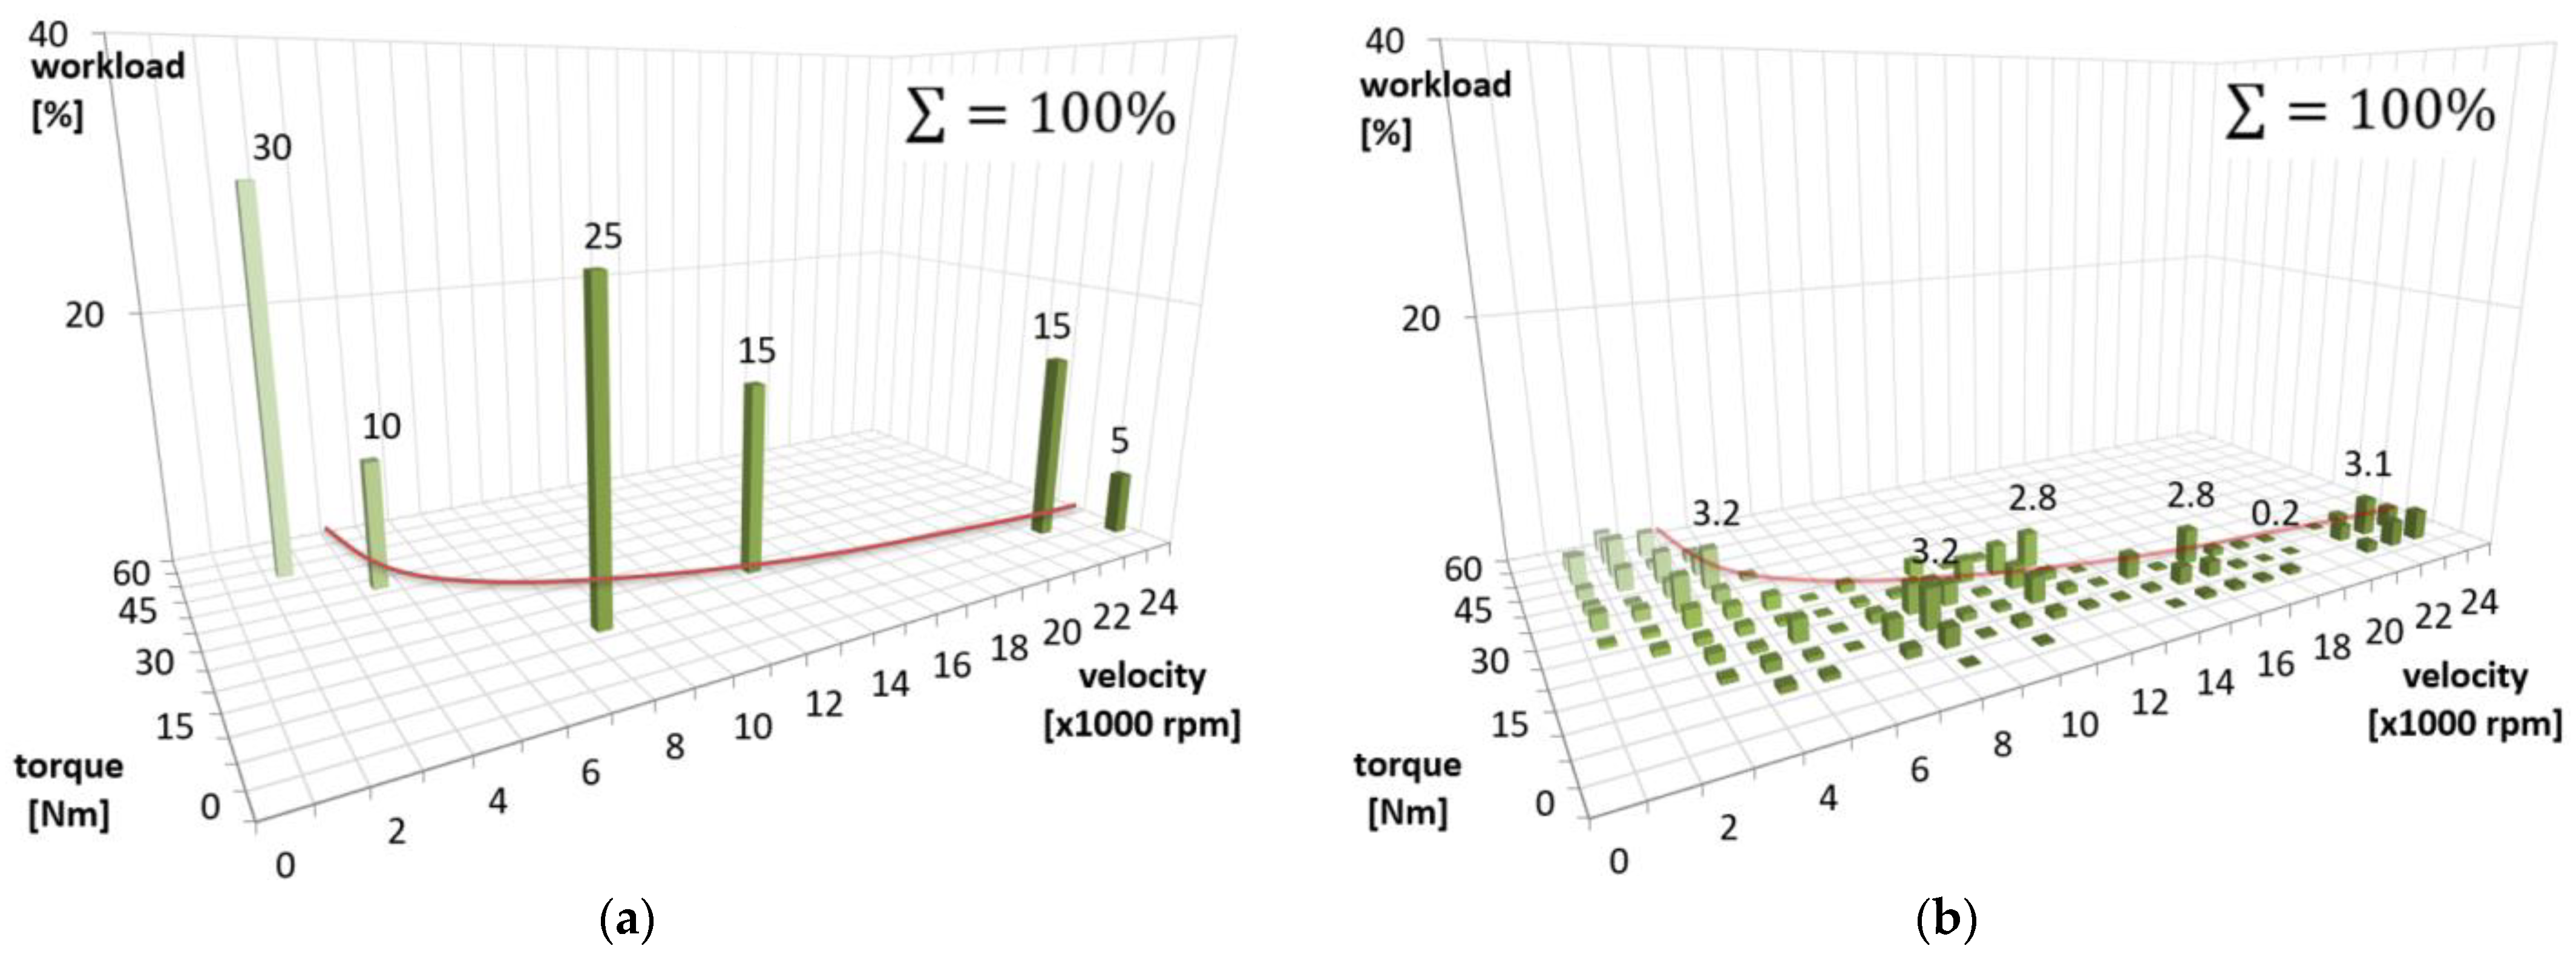
2.1. Acquisition of the Real Load Distribution

Standard design proposal methods for the spindle bearing lifetime are based on the load distribution estimated by the design with respect to the expected application of the spindle unit. A few typical loading conditions within the spindle torque characteristic are defined as the pairing of the torque on the tool and the process-relevant revolutions, including the relative time duration. See Figure 2a for an example of such initial loading conditions used for the initial calculation for the spindle bearing selection. In reality, every specific spindle works under its specific process load. A typical real loading situation can be characterized as multiple loading pairs (a combination of torque on the tool and the spindle revolution) with a lower relative time duration; see Figure 2b.
The real load distribution can be monitored through the machine tool control system data. The spindle revolution and spindle bearing load caused by the process forces have to be calculated. There are various methods for the process force estimation based only on machine drive signals [24] or using a digital twin of the machining operation as a supporting model for drive signal processing to calculate the cutting forces [24,25]. Since the spindle lifetime is in thousands of hours, these calculations of load distribution can be completed as a postprocess calculation after the cutting process because an estimation delay of some minutes is completely acceptable.
For three axis milling operations, following a very basic model is also acceptable. The process tangential cutting force FT can be computed using the known spindle torque value T and the tool diameter DC:
F T = 2 · T D c ;   N
The spindle radial load at the end of the tool can be calculated as a vector sum of the normal (radial) cutting force FN and the tangential cutting force FT:
F R = F T 2 + F N 2 ;   N
If we assume the conventional ratio between the tangential, normal (radial) and binormal (axial) cutting force component FT:FN:FBN = 4:2:1, we can calculate the radial loading force resulting from the milling processes directly using the tangential cutting force FT (1):
F R = F T 2 + F N 2 = F T 2 + 1 4 F T 2 = 5 2 · F T ;   N
By substituting the real spindle and clamped tool with the length of La with the simplified beam model with two supports (Figure 3), the radial reaction forces RA, RB acting at the bearing locations are calculated.
The equilibrium of moments and the resulting reaction force valid for location A and B:
        M A = 0 ;                     R A = F R   · L a + a + L L
M B = 0 ;                   R B = F R   · L a + a L
The axial load of the bearing is assumed to be the sum of the process binormal (axial) force and the bearing preload force. The process forces are estimated from the machining data processing as presented above. The preload force changes due to variations of the spindle operation revolutions, and variations of the thermal situation of the spindle bearing are neglected in this case.
The spindle operation conditions (process force magnitude and spatial direction, rotation speed) typically vary due to changeable machining conditions. Thus, the bearing lifetime has to be calculated for the limited number of particular load distribution; see the example in Figure 4 [2]. The figure schematically presents various cutting conditions resulting in various levels of forces Pi and revolutions ni with a duration time of Ui; see (8).
The spindle lifetime estimation might be calculated based on the monitored history of real operation conditions using procedures presented in the international standards ISO 281 [26] and ISO 5593 [27]. The resulting bearing lifetime of L10h represents the estimated bearing lifetime with a 90% probability based on its characteristic properties and operating conditions. The lifetime under constant operating conditions can be calculated [1,2]:
L 10 i = C g r o u p P i p
where L10i is the basic lifetime (at 90% reliability) (million revolutions); Cgroup is the basic dynamic load rating (kN) of the bearing group:
C g r o u p = C · b 0.7
C is one bearing basic dynamic load rating (kN); b is the number of bearings within the bearing group; Pi is the equivalent dynamic bearing load (kN) calculated by the ISO 281 standard [26] from the radial FR and axial FA spindle load (see Figure 3); and p is the exponent of the life equation (p = 3 for ball bearings, p = 10/3 for roller bearings). The life cycle fraction based on the temporally constant revolutions can be calculated:
U i = q i · n i i = 1 n q n · n n
where Ui is the life cycle fraction under the non-variable conditions i = 1, 2, … and qi is the fraction of the non-variable time period (n and P); n is the rotational speed (rpm). The spindle is then calculated as the sum of particular lifetimes:
L 10 = 1 i = 1 n U i L 10   i = 1 U 1 L 10   1 + U 2 L 10   2 + + U n L 10   n
where L10—the basic lifetime (at 90% reliability) (million revolutions), L10i—the basic rating lives (at 90% reliability) under constant conditions 1, 2, … (million revolutions), and Ui—the life cycle fraction under the conditions 1, 2, … Note: U1 + U2 + … +Un = 1.
The spindle mean revolutions nm during its whole operation time can be calculated using the partial revolution level ni and their partial duration qi:
n m = i = 1 n n i · q i 100
By substituting the values of Equations (9) and (10), the basic lifetime of bearings according to the real operating load distribution in spindle operating hours ti is calculated:
L 10 h   t i = L 10 · 10 6 60 · n m h o d
where L10h—the basic lifetime (at 90% reliability) (operating hours), and nm—the mean rotational speed (rpm).

2.2. Off-Line Monitoring of the Bearing Wear State

The operational diagnostics of the spindle units is an important part of the presented method. The diagnostic method should check the current spindle condition. Nowadays, the online condition monitoring of spindle units is still not commonly implemented in machine control systems due to the costs of the system. Off-line diagnostics are commonly used in practice as a cost-effective solution.
Measurements are only taken at specific time intervals during inspection diagnostics during the periodic inspection of the machines. An expert evaluation and trend reporting of the measured values are performed. The measured values are selected in terms of the most commonly used evaluation parameters of the vibration state of the spindle units in practice, e.g., the effective value of the vibration velocity vRMS and envelope of vibration acceleration gE. The limits of the evaluated vibration parameters are defined by ISO 20 816-1 [28]. Exceeded limits of values in the vibration trend graphs indicate a damaged condition of the spindle unit and bearings [29].
The following list provides an overview of key measured quantities, evaluated parameters and their limits for the estimation of the spindle unit state according to standards and practical experience:
  • Check of the vibration velocity vRMS trend (ISO 20816-1 [28]):
    Warning limit 1.12 mm/s;
    Damage limit 1.8 mm/s;
    Frequency range from 0 to 1000 Hz.
  • Check of the vibration acceleration envelope spectra:
    Frequency range according to maximum spindle speed;
    The peak to peak value is typically evaluated.
  • Tool interface runout ISO 10791-2 [30]:
    measured value < 0.002 mm.
  • Runout on the test arbor ISO 10791-2 [30]:
    L = 50 mm; measured value < 0.010 mm;
    L = 300 mm; measured value < 0.020 mm.
  • Size of clamping force:
    According to the spindle manufacturer specification.
  • Check of the spindle operating hours.
The standard rules for the repeatability of diagnostic measurements must be followed during the measurements, which are [31,32]:
  • Defining the appropriate measuring points (vibration sensors);
  • Definition of the position of the spindle unit in the workspace coordinate (x; y; z);
  • Use balanced instruments (etalon) in the highest balance level G for vibration measurements;
  • Use of calibrated measuring instruments and sensors;
  • Measuring vibrations at the same operating parameters, i.e., speed, tool (etalon).

2.3. Calculation of the Remaining Useful Life

The absolute value of the RUL is defined as the difference between the calculated theoretical value of the basic lifetime L10h for the specific operating conditions and the operating hours of the spindle ti:
L R U L , 10 h   t i = L 10 h   t i t i   h
Such a calculation can be completed after a certain period of the spindle operation, e.g., a few months, to update the RUL estimation; see Figure 5 for an example. The calculation of the RUL trend graph typically represents the most loaded first bearing of the front bearing group. If the loading conditions would not change, the curve would sink linearly over time during the spindle operation time ti. However, the loading situation of the spindle may vary due to various machining conditions. Figure 5 presents an example of five evaluation periods. During every period, the real load distribution is monitored. The monitored process data are used for the calculation of the mean load (see Section 2.1) that is used for the updated spindle lifetime estimation. Since loading conditions may vary (on average, higher or lower load and operation revolutions), the updated estimation of the lifetime may also vary. It can even be increased in case of a really low process load (as presented between the time points t2 and t3). If the value of the lifetime is negative, the bearing can be said to have achieved its theoretical lifetime. Theoretical calculation values of RUL are bounded by the interval of the estimated uncertainty deviation.
The relative value of the RUL L R U L , 10 %   presents the “relative consumption” of the estimated total spindle lifetime. It can be calculated using the absolute value of the RUL and the operating hours of the spindle:
L R U L , 10 %   t i   = L R U L , 10 h   t i L 10 h   t i · 100 = L 10 h   t i t i L 10 h   t i · 100 ;   %

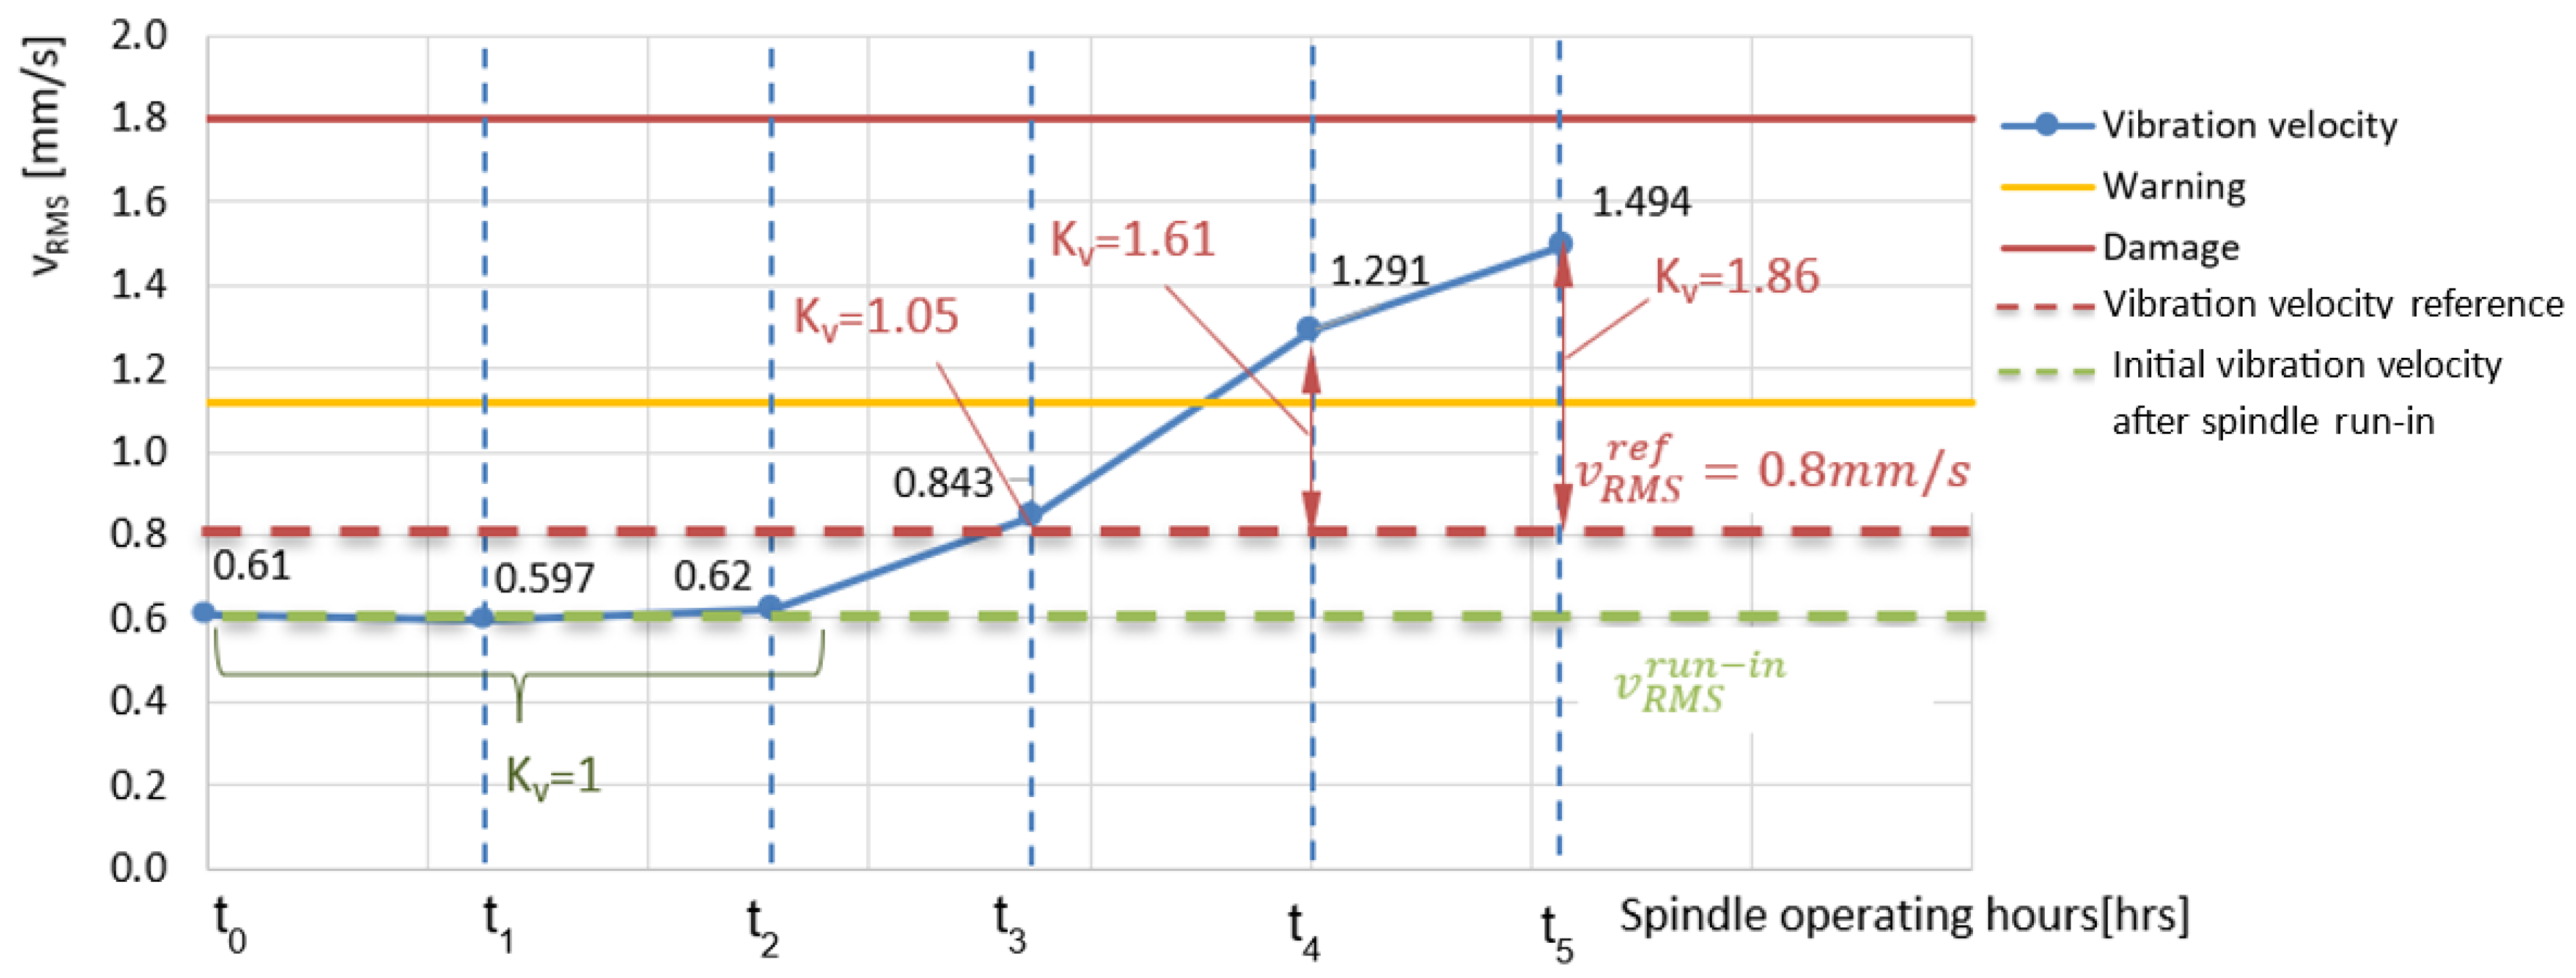
2.4. Remaining Useful Life Correction Based on the Vibration Velocity

The above-mentioned calculation of the RUL ( L R U L , 10 h   t i ) is purely a computational approach. Although the calculations are based on the recorded real load distribution, this approach cannot cover all real situations. Typically, if the spindle bearings are damaged due to other non-loading cases, e.g., due to assembly imperfections, spindle contamination caused by sealing system misfunctions, etc., this situation requires some correction approach based on the off-line measurement of the spindle vibration.
A correction factor of vibration Kv is introduced for the RUL value correction using the measured effective vibration velocity. The parameter of the effective vibration velocity has been selected because it is the most commonly used parameter for vibration monitoring reported in practice, e.g., in standards ISO 20816-1 [28]; ISO 13373-1 [33]; and ISO 230-8 [34]. The vibration correction factor Kv is computed as the ratio between the measured effective value v R M S   to the given reference value. The corrected RUL theory is derived from practical experience based on the estimation of the effect of the dynamic load variation and bearing vibration described as Brüel and Kjær [35,36,37] and similar publications [38,39]. A similar approach is a vibration evaluation using a single parameter such as the SPM method [40] or the trending of measured quantities with respect to the limit values of warning and damage.
The correction factor can be calculated:
K v   = 1     if   v R M S   v R M S r e f < 1   K v = v R M S   v R M S r e f   if   v R M S   v R M S r e f > 1
where v R M S is the current measured vibration velocity and v R M S r e f is the reference value of the vibration velocity valid for a specific spindle. The reference value v R M S r e f is valid for a steady-state condition during which the specific spindle can operate for a long time period without any damage and can fulfill the required quality of the machined surfaces. With respect to the knowledge about the specific spindle operation history, there are various approaches for setting the reference value v R M S r e f :
  • For a new spindle, it can be set as 1.25× the vibration velocity during the spindle run-in at the manufacturer premises and overall quality control. The spindle manufacturer provides a detailed quality check of the spindle. The measured value of the vibration velocity means the OK state for the specific spindle. The increasing of the value by +25% follows the standard ISO 13373-1 [33], which enables the increase in the vibration limits. Setting the limit according to the run-in spindle conditions enables taking into account the specific assembly quality of the spindle.
  • For short operation spindles (up to 2000 h), the reference value can be set as the measured vibration velocity increased by about 25%. These spindles are after the initial run-in and generally are in good condition. This situation is similar to new spindle state, but the spindle already has adjusted the vibration level. Concurrently, other quality parameters (see Section 2.2) also should be checked to confirm the spindle’s good condition (see “spindle A” in Section 3.2 for an example).
  • If the spindle is operated longer than one-half of the planned lifetime (approx. more than 6000 h), the reference value should be set on the warning limit defined by the above-mentioned ISO standards. The reason is that the spindle might already have some initial damage, and the current measured vibration velocity cannot be used as the reference value (see “spindle B” in Section 3.2 for an example).
The value of the corrected RUL is defined as the difference between the calculated theoretical value of the basic lifetime L10h and the operating conditions to the operating hours of the spindle ti, corrected for the assessment of the actual condition of the spindle before the first signs of material fatigue damage appear on the bearing. The corrected RUL calculated at time ti can be expressed:
L c R U L , 10 h   t i   = ( L 10 h   t i   t i ) K v 3 = L R U L , 10 h   t i     K v 3 ;   h r s
Following [35,36,37], the influence of the increased vibration velocity represented by the correction factor Kv is cubic. This means that if the real spindle vibration is over the estimated reference value, the estimation of the RUL is intensively decreased. This is presented on the following figures for illustration.
Figure 6 shows an example of a periodic check of the spindle vibration. The initial vibration velocity measured after the run-in was 0.65 mm/s (dashed green line). Thus, the vibration reference value was calculated as 0.8 mm/s (dashed red line). The vibration velocity value measured on the spindle was stable during the measurement of time t1 and t2. Then, it increased slowly in every other measurement (full blue line). The last two vibration values were even over the warning limit defined by ISO 13373-1 [33]. The RUL correction factor calculated for every measurement time is also presented in the figure.
Figure 7 shows a comparison of the corrected and non-corrected RUL estimation. For the uncorrected RUL L R U L , 10 h   (blue line), there is a uniform decrease in time with respect to the load on the spindle. The corrected RUL L c R U L , 10 h   has the same trend. Since the measured vibrations increased from the measurement time point t3, the corrected RUL decreases more intensively due to effect of the correction factor Kv (15). Based on this trend, the real end of life of the spindle is expected earlier.
The relative corrected RUL L R U L , 10 %   can be expressed as a percentage:
L c R U L , 10 % = L c R U L , 10 h   t i L 10 h   t i · 100 ;   %
The value of the relative corrected RUL L c R U L , 10 %   is defined as the ratio of the corrected RUL L c R U L , 10 h   to the calculated theoretical value of the basic lifetime L10h depending on the actual load spectrum of the spindle unit, expressed as a percentage, before the first signs of material fatigue damage appear on the bearing.
The advantage of the theory of the corrected RUL over the theoretical RUL presented in Section 2.3 is the consideration of the actual diagnostic condition of the spindle assessing lifetime: not the theoretical operating conditions in the load spectrum caused by normal wear, but the real operation condition taking into consideration the vibration manifestation of the spindle unit. The method has good automation potential for the low-cost off-line vibration measurement data and RUL prediction with respect to the spindle loading history. The application of this approach is shown in the next section on two groups of operation spindles.

3. Validation Use Cases

The theory described in the previous section is demonstrated on real use cases in this section. There is an example of two spindle types working in the serial large-series production of the roughing and finishing of steel-welded parts and cast-iron parts. There were two groups of milling machines with three machines within one group. All three machines in one specific group have been used for the same machining operations. This unique constellation brings two groups of different spindle types with three spindle pieces with the same design in every group. This is an acceptably large basis for the validation of the presented theory.

3.1. Description of Spindle Units and Used Measuring Equipment

The main technical parameters of the tested spindles are presented in Table 1 and Table 2. The two spindle types are identified as “type A” and “type B” in the following text. Each type of spindle unit is represented in the practical experiment by three pieces of the spindle units mounted on identical types of machine tools located at the same shop floor with the same production, i.e., the same process load distribution. However, the real operation of each spindle led to a different vibration progress due to minor variations of working conditions.
During the experiment, it was possible to monitor and analyze the behavior in the individual phases of the spindle units. The lifetime calculation focuses only on the front bearings because they are more loaded and are dominantly responsible for the spindle stiffness and accuracy. The current state of the spindle was measured and evaluated periodically. The spindle load was not measured continuously through the machine tool, but the load spectrum was calculated postprocess using the known cutting and engagement parameters of all processes.
The equipment presented in Table 3 was used for the measurement and evaluation of every individual spindle state during the on-route off-line diagnostic. The measurements of all spindle unit states also include measurements of the accuracy of the runout on the arbor according to ISO 10791-2 [30] and the check of the tool clamping force, which are very useful for the mechanical condition of the spindle unit.
The off-line measurements were carried out according to the standard rules for diagnosing spindle units in order to guarantee the repeatability and comparability of the measurement results:
  • Measurements using calibrated devices and calibrated sensors.
  • The same position of the spindle unit in the workspace (x, y, z coordinates).
  • Positioning of the sensors in identical positions (marks on spindle units 1 and 2).
  • Measurements made under the same conditions and with the same running-in cycle of the spindle unit.
  • The vibration measurement with the balanced reference tool at the same speed (maximum spindle speed).

3.2. Experiment Results and Validation Method

In this section, the measured results for both spindle types are presented and analyzed. An overview of the results is provided in Table 4 for spindle type A and in Table 5 for spindle type B. The structure of the diagrams is the same as in the commented general example on Figure 6 and Figure 7. The load spectrum of the spindle units was identified using a postprocess calculation using known process parameters. The resulting load distributions are shown for every spindle unit in a 3D bar diagram in the time of the initial and final measurement. Six measurements of the spindle quality and vibration state were taken during the analyzed period. The standard diagnostics methods described in Section 2.2 were used to perform the condition monitoring of the spindle units, i.e., the evaluation of the vibration acceleration spectra, vibration velocity RMS, vibration enveloping, runout of a test mandrel, clamping force measurement, etc. The RUL was calculated for every spindle after every off-line diagnostic analysis. The presented RUL trend estimation is the linear extrapolation of the last six measurement results.
The validation of the proposed method was completed using a blind comparison of calculated results of relative RUL with the experienced opinion of a spindle diagnostic expert. This expert with 10+ years of practical experience was a different person than the person making the calculations of RUL using validated methods. This approach was chosen because any spindle failed during the monitored period. The last known spindle state and final estimation of relative RUL by the expert is presented in Table 7.

3.2.1. Comments on Measurement Results of the Spindle Unit Type A

The results of all lifetime measurements for spindle type A are presented in Table 4. The spindle state was checked during the lifetime monitored operation period five or six times. The measurements were completed on the same day. Since some machines were off during some production periods, the working hour axis at lifetime diagrams in Table 4 shows different values for every specific spindle for the same condition measurement. All spindles were used for the same type of production. The wear intensity of all spindle units corresponds with the number of operation hours. All spindles were installed at the same time. The measurement of the initial vibration velocity was not completed after lifetime spindle installation. Thus, the reference value of the vibration velocity was defined after the first diagnostic measurement, which was before 1000 operation hours.
Spindle unit A1 had a low vibration velocity of 0.573 mm/s during the first measurement, which was after 603 operation hours. The reference velocity value was set at about 25% at 0.8 mm/s. The measured vibration velocity value is shown in the graph trend of vibration velocity vRMS (see Table 4-A1). The continuous worsening of the bearing condition is visible. Following that situation, the calculated corrected RUL shown in the trend graph Table 4-A1 was reduced; see Table 6-A1. The spindle is still in relatively good condition based on the evaluation of the RUL and considering 4256 operating hours of the spindle. The spindle can work for almost RUL = 2000 h to reach the estimated end of life at 6000 h. Thus, the relative RUL is 34% (Table 6-A1). The spindle condition evaluation conducted independently by a spindle diagnostic expert based on the vibration spectra, spindle running accuracy and changes of the clamping force is approximately 40% of the relative RUL (Table 7-A1). So, the calculated relative RUL using the model corrected with respect to the vibration level and the relative RUL estimated by an experienced expert are very similar.
Spindle unit A2 had a vibration velocity of 1.004 mm/s during the first measurement, which was after 925 operation hours. The value is slightly under the warning limit valid for this type of spindle. The reference velocity value was set on the warning threshold of 1.1 mm/s. The measured vibration velocity value is shown in the graph trend of the vibration velocity vRMS (see Table 4-A2). As can be seen, the worsening of the bearing condition was very moderate, almost stagnating. Following that situation, the calculated corrected RUL shown in the trend graph Table 4-A2 was reduced; see Table 6-A2. The spindle is still in relatively good condition based on the evaluation of the RUL and considering 4358 operating hours of the spindle. The spindle can work for almost RUL = 3000 h to reach the estimated end of life at 7500 h. Thus, the relative RUL is 43% (Table 6-A2). The spindle condition evaluation conducted independently by a spindle diagnostic expert based on the vibration spectra, spindle running accuracy and changes of the clamping force is approximately 40% of the relative RUL (Table 7-A2). So, the calculated relative RUL using the model corrected with respect to the vibration level and the relative RUL estimated by an experienced expert are very similar.
Spindle unit A3 had a vibration velocity of 1.638 mm/s during the first measurement completed after 896 operation hours, which is over the warning limit. The reference velocity value was set on the warning limit defined by the ISO standards at 1.12 mm/s. The measured vibration velocity value is shown in the graph trend of the vibration velocity vRMS (see Table 4-A3). The continuous worsening of the bearing condition around to the limit values of damage is visible. Following that situation, the calculated corrected RUL shown in the trend graph Table 4-A3 was reduced; see Table 6-A3. The spindle is in bad condition based on the evaluation of the RUL and considering 4368 operating hours of the spindle. The spindle can work for almost RUL = 32 h to reach the estimated end of life at approx. 4400 h. Thus, the relative RUL is 0.7% (Table 6-A3), which means immediate service is needed. The spindle condition evaluation conducted independently by a spindle diagnostic expert based on the vibration spectra, spindle running accuracy and changes of the clamping force is approximately 30% of relative RUL (Table 7-A3). This estimation is based on a stabilized vibration level. Although the vibration velocity was high since the spindle has been monitored, the vibration level does not have any progress in time. Moreover, the spindle has a low runout and no critical peaks in the vibration spectra. So, there are significant differences between the calculated relative RUL using the corrected model and the relative RUL estimated by an experienced expert in this case.

3.2.2. Comments on Measurement Results of the Spindle Unit Type B

The results of all measurements for spindle type B are presented in Table 5. The spindle state was checked during a monitored operation period four or five times. All spindles were used for the series production. The spindle units were in different stages of their lifetime in terms of their age. All three spindle units of type B had a different operation load distribution compared to each other, unlike the type A spindles. The wear intensity of spindle unit types B1 and B2 corresponds to the failure condition, and type B3 corresponds to the number of operation hours. These three spindles were not installed at the same time. The measurement of the initial vibration velocity was not taken after the spindle installation. Therefore, for the spindles of type B1 and B2, the reference value of the vibration velocity was defined on the warning limit defined by the above-mentioned ISO standards and for the spindle of type B3, while the reference value of the vibration velocity was defined after the first diagnostic measurement taken before 1000 operation hours.
Spindle unit B1 had a vibration velocity of 1.835 mm/s during the first measurement taken after 21,256 operation hours, which is over the damage limit. The reference velocity value was set on the warning limit defined by the ISO standards at 1.12 mm/s. The measured vibration velocity value is shown in the graph trend of the vibration velocity vRMS (see Table 5-B1). The spindle unit was in bad condition for a long time. The bearing condition above the limit values of damage is visible. Following that situation, the calculated corrected RUL shown in the trend graph Table 5-B1 was significantly reduced; see Table 8-B1. The spindle is in bad condition based on the evaluation of the RUL and considering 23667 operating hours of the spindle. The spindle can work for the maximum RUL = 500 h to reach the estimated end of life at 24,000 h. Thus, the relative RUL is 1% (Table 8-B1), and the spindle should be serviced. The spindle condition evaluation conducted independently by a spindle diagnostic expert based on the vibration spectra, spindle running accuracy and changes of the clamping force is 0% (i.e., failure condition) of the relative RUL (Table 9-B1). So, the calculated relative RUL using the model corrected with respect to the vibration level and relative RUL estimated by an experienced expert are very similar.
Spindle unit B2 had a vibration velocity of 5.694 mm/s during the first measurement taken after 12,198 operation hours, which is over the damage limit. The reference velocity value was set on the warning limit defined by the ISO standards at 1.12 mm/s. The measured vibration velocity value is shown in the graph trend of the vibration velocity vRMS (see Table 5-B2). The spindle unit was in bad condition for a longer time. Following that situation, the calculated corrected RUL shown in the trend graph Table 5-B2 was reduced; see Table 8-B2. The spindle is in bad condition based on the evaluation of the RUL and considering 17,705 operating hours of the spindle. The spindle unit should have already been replaced. Thus, the relative RUL is 0% (Table 8-B2). The spindle condition evaluation conducted independently by a spindle diagnostic expert based on the vibration spectra, spindle running accuracy and changes of the clamping force is approximately 0% (i.e., failure condition) of the relative RUL (Table 9-B2). So, the calculated relative RUL using the model corrected with respect to the vibration level and relative RUL estimated by an experienced expert are very similar.
Spindle unit B3 had a vibration velocity of 0.363 mm/s during the first measurement taken after 1006 operation hours. The reference velocity value was set at about 25% at 0.4 mm/s. The measured vibration velocity value is shown in the graph trend of the vibration velocity vRMS (see Table 5-B3) and shows the bearing condition is at a low vibration level: below the warning limit. Following that situation, the calculated corrected RUL shown in the trend graph of Table 5-B3 was not reduced; see Table 8-B3. The spindle is still in good condition based on the evaluation of the RUL and considering 3458 operating hours of the spindle. The spindle can work for almost RUL = 30500 h to reach the estimated end of life at 34000 h. Thus, the relative RUL is 90% (Table 8-B3). The spindle condition evaluation conducted independently by a spindle diagnostic expert based on the vibration spectra, spindle running accuracy and changes of the clamping force is approximately 80% of the relative RUL (Table 9-B3). So, the calculated relative RUL using the model corrected with respect to the vibration level and relative RUL estimated by an experienced expert are very similar.

3.3. Summary of the Experiment Data

The method of the corrected RUL calculation was verified on two types of different designs of electric spindles. Each type of spindle unit was represented by three samples of spindle units mounted on identical types of machines tools. Concurrently, there was a blind estimation of the relative RUL by a diagnostics expert. The comparison of the results is presented in Table 10. As can be seen, the non-corrected RUL using real loading conditions does not provide good results. The RUL estimation error compared to the expert opinion is about ±40%. If the calculated RUL is corrected using the current vibration level, the difference between this proposed method and the experienced specialist is ±10%. The only exceptional case is the situation of spindle A3, where the calculation method detects RUL = 0% and the expert estimates RUL = 30%. This difference is caused by the expert opinion that the vibration level does not increase too much from the initial value and the spindle has a low runout; thus, the spindle can continue working. From a practical point of view, the vibration level is high in absolute value, and an accelerated spindle degradation may soon occur.
It is necessary to understand that the presented validation results are a relative comparison of two estimation approaches. It was not possible to validate the corrected RUL approach and also the expert estimation with the absolute data represented, e.g., with the complete jamming of a specific spindle. With this perspective, Table 10 is just a relative comparison of two estimation methods where both methods have their own specific uncertainty level.

4. Discussion

The proposed method of the spindle RUL estimation is based on the lifetime calculation using real loading conditions and subsequently the correction of the calculated value based on the off-line measured vibration level of the spindle. The method was validated using a blind comparison with the opinion of a skilled expert. Unless the presented results show good results from the proposed approach, there are some points that should be critically discussed.
  • The results of the RUL calculation after correction are sensitive to the reference value setting. The rules for the reference setting are defined in Section 2.4. The key limit for spindles with an unknown history is the warning limit according to ISO 20816-1 [28]. If the spindle has a low vibration level in the initial life stage, the reference should be increased by about 25% to allow vibrations rising without the immediate shortening of the RUL value. The value of 25% is based on ISO 13373-1 [29], which enables the increase in the vibration limits.
  • The correction is based on one scalar value of the effective vibration velocity vRMS. This is a significant simplification, but practical results show that this parameter is appropriate for the simplified characterization of the spindle or bearing condition. As future work, the correction criterion could also be enhanced with other parameters sensitive to the state of the vibration spectra.
  • The results show that the spindle lifetime cannot be estimated using real loading inputs only, but it needs some correction with respect to the possible damage of the bearing caused by non-loading reasons, e.g., bearing contamination.
  • The method is based on the continuous monitoring of the loading cases. It is currently possible using the continuous reading of the machine tool control system data and subsequent calculation of the process forces. Nevertheless, these data are always available on the machine tool. The additional accelerometers can be used for off-line vibration measurements only. Thus, the method is low-cost and also useful for older machine tools.
  • The vibration level of the spindle has to be measured every time during the same boundary conditions.
  • The thermo-mechanical effects (e.g., increasing the axial preload force due to the increased working temperature of the bearing) are not directly considered in the method. If the thermo-mechanical situation is not stable, the spindle can be jammed, which is out of the prediction possibilities of this method. If the realistic thermal situation results in the overloading of the bearing, it can be detected due to the progress of the measured vibration signal.
  • The estimation accuracy of the method is approx. ±20%, which is acceptable. This value is based on the simplification used in the process force estimation and inaccuracies in the vibration velocity measurement.

5. Conclusions

This paper described the method for predicting the remaining useful life (RUL) of spindle bearings through a combination of methods for calculating the rating life L10h according to the standard ISO 281 and the bearing condition assessment based on the effective value of vibration velocity RMS according to the standard ISO 20816 and measured machine data from the machine tool control system. The calculation model of the updated lifetime L10h is based on the continuous monitoring on the loading distribution of the spindle load and the operating hours in the machine tool. The final estimation of the RUL with respect to the current condition of the spindle must be corrected with the correction factor. The correction factor of vibration Kv is a ratio between the current vibration velocity and the reference effective vibration velocity vRMS. The rules for the reference value definition are proposed in the paper.
An experiment using the long-term observation of real spindles was used for the validation of the method. Two groups of motor spindles with three spindles of the same design were observed. The estimation of the proposed method was compared with an expert evaluation of the specific spindle state in a blind test. The proposed method provided results similar to the expert. The expert used multiple inputs for the evaluation: vibration velocity, vibration spectra, check of the clamping force, check of the spindle runout. All the data were evaluated using human experience. Contrary to that, the proposed method was used to implement an algorithm and perform automatic processing. The method can be reliably used for electric spindles of various designs to estimate the residual life of the spindle bearings with regard to the current condition vibration of the bearings.
The key knowledge from the validation test is that the RUL estimation cannot be based just on the knowledge of the loading history of the spindle, but it is necessary to correct it through the Kv factor that enables covering the progress of bearing damage caused by non-loading reasons. The difference between the corrected RUL estimation and the human expert estimation were in the blind test under 10%. The uncorrected RUL estimation differed about 40% from the reference expert estimation.
The main advantage of the proposed method is its simplicity from the sensorics point of view. This could be also the weakness of the method. Future work should be focused on enhancing the basic sensor set with other types of sensors (e.g., for temperature measurement) and involve the additional information in the evaluation of the spindle state.

Author Contributions

Methodology: J.S., P.K. and D.B.; experiments J.S. and P.V.; paper conceptualization: J.S. and P.K.; validation: D.B.; writing, reviewing and editing all authors together. All authors have read and agreed to the published version of the manuscript.

Funding

As evidence of the sustainability of its outcomes, the authors would like to acknowledge funding support from the European Structural and Investment Funds and Operational Programme Research, Development and Education via Ministry of Education, Youth and Sports of the Czech Republic, under the project CZ.02.1.01/0.0/0.0/16_026/0008432 Cluster 4.0—Methodology of System Integration. The contribution of the Ph.D. student involved in the author team was also supported by the Grant Agency of the Czech Technical University in Prague, grant no. SGS19/165/OHK2/3T/12.

Data Availability Statement

Not applicable.

Acknowledgments

The experimental support of our colleague Jiri Štecher from VOPSS Řepeč. s.r.o is gratefully acknowledged.

Conflicts of Interest

The authors declare no conflict of interest. The funders had no role in the design of the study; in the collection, analyses, or interpretation of data; in the writing of the manuscript; or in the decision to publish the results.

References

  1. Super Precision Bearings. Technical Documentation of SCHAEFFLER. 2019. Available online: https://www.schaeffler.com/remotemedien/media/_shared_media/08_media_library/01_publications/schaeffler_2/catalogue_1/downloads_6/sp1_de_en.pdf (accessed on 2 November 2019).
  2. Super Precision Bearings. Technical Documentation of SKF. 2016. Available online: https://www.skf.com/binaries/pub12/Images/0901d19680495562-Super-precision-bearings-catalogue---13383_2-EN_tcm_12-129877.pdf (accessed on 2 March 2016).
  3. Liu, C.; Vengayil, H.; Zhong, R.Y.; Xu, X. A systematic development method for cyber-physical machine tools. J. Manuf. Syst. 2018, 48, 13–24. [Google Scholar] [CrossRef]
  4. Qu, Y.J.; Ming, X.G.; Liu, Z.W.; Zhang, X.Y.; Hou, Z.T. Smart manufacturing systems: State of the art and future trends. Int. J. Adv. Manuf. Technol. 2019, 103, 3751–3768. [Google Scholar] [CrossRef]
  5. Helu, M.; Sobel, W.; Nelaturi, S.; Waddell, R.; Hibbard, S. Industry Review of Distributed Production in Discrete Manufacturing. J. Manuf. Sci. Eng. 2020, 142, 110802. [Google Scholar] [CrossRef]
  6. Kurfess, T.R.; Saldana, C.; Saleeby, K.; Dezfouli, M.P. A Review of Modern Communication Technologies for Digital Manufacturing Processes in Industry 4.0. J. Manuf. Sci. Eng. 2020, 142, 110815. [Google Scholar] [CrossRef]
  7. Altintas, Y.; Park, S.S. Dynamic Compensation of Spindle-Integrated Force Sensors. CIRP Ann. 2004, 53, 305–308. [Google Scholar] [CrossRef]
  8. Möhring, H.-C.; Litwinski, K.M.; Gümmer, O. Process monitoring with sensory machine tool components. CIRP Ann. 2010, 59, 383–386. [Google Scholar] [CrossRef]
  9. Brecher, C.; Eckel, H.-M.; Motschke, T.; Fey, M.; Epple, A. Estimation of the virtual workpiece quality by the use of a spindle-integrated process force measurement. CIRP Ann. 2019, 68, 381–384. [Google Scholar] [CrossRef]
  10. Siemens Industrial Edge for Machine Tools. Available online: https://new.siemens.com/global/en/products/automation/topic-areas/industrial-edge/machine-tools.html (accessed on 31 December 2022).
  11. FANUC FOCAS Library. Available online: https://www.fanuc.eu/de/en/cnc/development-software/focas-development-libraries (accessed on 31 December 2022).
  12. HEIDENHAIN DNC. Available online: https://www.heidenhain.at/de_AT/produkte/cnc-steuerungen/connected-machining/heidenhain-dnc/ (accessed on 31 December 2022).
  13. Dunwoody, K. Automated Identification of Cutting Force Coefficients and Tool Dynamics on CNC Machines. Master’s Thesis, The University of British Columbia, Vancouver, BC, Canada, March 2010. [Google Scholar]
  14. Aggarwal, S.; Nešić, N.; Xirouchakis, P. Cutting torque and tangential cutting force coefficient identification from spindle motor current. Int. J. Adv. Manuf. Technol. 2013, 65, 81–95. [Google Scholar] [CrossRef]
  15. Altintas, Y.; Aslan, D. Integration of virtual and on-line machining process control and monitoring. CIRP Ann. 2017, 66, 349–352. [Google Scholar] [CrossRef]
  16. Janota, M.; Kolář, P.; Falta, J.; Kozlok, T. Calibration Method for In-Process Identification of Tangential Specific Cutting Force in Milling. Machines 2022, 10, 1095. [Google Scholar] [CrossRef]
  17. Gupta, P.; Pradhan, M.K. Fault detection analysis in rolling element bearing: A review. Mater. Today Proc. 2017, 4, 2085. [Google Scholar] [CrossRef]
  18. Wu, G.; Yan, T.; Yang, G.; Chai, H.; Cao, C. A Review on Rolling Bearing Fault Signal Detection Methods Based on Different Sensors. Sensors 2022, 22, 8330. [Google Scholar] [CrossRef] [PubMed]
  19. El-Thalji, I.; Jantunen, E. A descriptive model of wear evolution in rolling bearings. Eng. Fail. Anal. 2014, 45, 204–224. [Google Scholar] [CrossRef]
  20. Wu, B.; Li, W.; Qiu, M.-Q. Remaining Useful Life Prediction of Bearing with Vibration Signals Based on a Novel Indicator. Shock Vib. 2017, 2017, 8927937. [Google Scholar] [CrossRef]
  21. An, D.; Choi, J.-H.; Kim, N.H. Remaining useful life prediction of rolling element bearings using degradation feature based on amplitude decrease at specific frequencies. Struct. Health Monit. 2018, 17, 1095–1109. [Google Scholar] [CrossRef]
  22. Nectoux, P.; Gouriveau, R.; Medjaher, K.; Ramasso, E.; Chebel-Morello, B.; Zerhouni, N.; Varnier, C. PRONOSTIA: An experimental platform for bearing accelerated degradation test. In Proceedings of the IEEE International Conference on Prognostics and Health Management, Denver, CO, USA, 18–21 June 2012; pp. 1–8. [Google Scholar]
  23. Hui, J.; Huang, J.; Zhang, F.; Zhang, Y.; Tian, Y. Research on remaining life prediction of machine tool spindle bearing combining neural network and weighted average de-noising method. In Proceedings of the SPIE 2022 International Symposium on Robotics, Artificial Intelligence, and Information Engineering (RAIIE 2022), Hohhot, China, 23 November 2022; Volume 124542. [Google Scholar] [CrossRef]
  24. Hänel, A.; Wenkler, E.; Schnellhardt, T.; Corinth, C.; Brosius, A.; Fay, A.; Nestler, A. Development of a method to determine cutting forces based on planning and process data as contribution for the creation of digital process twins. MM Sci. J. 2019, 2019, 3148–3155. [Google Scholar] [CrossRef]
  25. Sulitka, M.; Kolar, P.; Sveda, J.; Smolik, J. Strategy for implementing predictive process-oriented machine tool digital twins. MM Sci. J. 2022, 2022, 5954–5961. [Google Scholar] [CrossRef]
  26. ISO 281:2007; Rolling Bearings—Dynamic Load Ratings and Lifetime. ISO: Geneva, Switzerland, 2007.
  27. ISO 5593:2019; Rolling bearings—Vocabulary. ISO: Geneva, Switzerland, 2019.
  28. ISO 20816-1:2016; Mechanical Vibration—Measurement and Evaluation of Machine Vibration. ISO: Geneva, Switzerland, 2016.
  29. SKF. Bearing Damage and Failure Analysis, PUB BU/I3 14219/2 EN. 2018. Available online: https://www.skf.com/binaries/pub12/Images/0901d1968064c148-Bearing-failures---14219_2-EN_tcm_12-297619.pdf (accessed on 1 June 2017).
  30. ISO 10791-2: 2001; Test Conditions for Machining Centers—Part 2: Geometric Tests for Machines with Vertical Spindle or Universal Heads with Vertical Primary Rotary Axis (Vertical Z-axis). ISO: Geneva, Switzerland, 2001.
  31. Broch, J.T. Mechanical Vibration and Shock Measurements; Brüel & Kjær: Nærum, Denmark, 1984; ISBN 87 87355 35 5. [Google Scholar]
  32. SKF. Condition Monitoring, CM 5003; SKF: San Diego, CA, USA, 1995. [Google Scholar]
  33. ISO 13373-1:2002; Condition Monitoring and Diagnostics of Machines—Vibration Condition Monitoring. ISO: Geneva, Switzerland, 2002.
  34. ISO 230-8:2015; Test Code for Machine Tools—Part 8: Vibrations. ISO: Geneva, Switzerland, 2010.
  35. Brüel & Kjær. Machine condition monitoring, BR 0267-13; Brüel & Kjær: Nærum, Denmark, 1989. [Google Scholar]
  36. Angelo, M. Vibration Monitoring of Machines, BV 0029-11; Brüel & Kjær: Nærum, Denmark, 1987; ISSN 007-2621. [Google Scholar]
  37. Brüel & Kjær. Measuring Vibration, BR 0094-12; Brüel & Kjær: Nærum, Denmark, 1982; p. 39. [Google Scholar]
  38. Sanjay, T. The Effect of Unbalance on Bearing Life. IOSR J. Mech. Civ. Eng. 2012, 1, 47–54. [Google Scholar] [CrossRef]
  39. Berry, L.D. Vibration versus Bearing Life. Reliab. Mag. 1995, 11. Available online: https://cswea.org/wp-content/uploads/2017/09/Vibration-versus-Bearing-Life-Handout.pdf (accessed on 22 February 2023).
  40. Sohoel, E. Method and Instrument for Determining the Condition of an Operating Bearing. U.S. Patent USP4528852, 16 July 1983. Available online: https://patents.google.com/patent/US4528852A/en (accessed on 20 February 2023).
Figure 1. Flow chart for corrected bearing RUL estimation.
Machines 11 00586 g001
Figure 2. Operating load distribution of spindle unit in a 3D graph. (a) Initial proposal of the spindle load distribution used for the spindle bearing selection. (b) Example of real operation distribution of the spindle load—many combinations, but lower relative time duration.
Machines 11 00586 g002
Figure 3. Simplified model of the spindle unit (La—tool length; b—distance between spindle front end and center of the front bearing group; L—distance between front and rear bearing group centers).
Machines 11 00586 g003
Figure 4. The spindle load distribution composed as a time block with a constant load and revolutions [2].
Machines 11 00586 g004
Figure 5. Trend graph of remaining useful life.
Machines 11 00586 g005
Figure 6. Vibration velocity plot. The vibration is measured off-line in discrete time points with longer period (within range of months).
Machines 11 00586 g006
Figure 7. Graph comparing corrected and non-corrected RUL. The strong influence of the correction factor based on the vibration velocity measurement is visible.
Machines 11 00586 g007
Table 1. Specifications of spindle units type A.
Specification: Type A
Machines 11 00586 i001Type of machine tool:5-axis machine center
Type of spindle:Electrospindle
Orientation:Horizontal
Max. power (S6/S1):27/20 kW
Max. speed:10,000 rpm
Tool interface:HSK-A 100
Front bearing arrangement:// \
Front bearings:HC7020-E-T-P4S
Rear bearing arrangement:/ \
Rear bearings:HC7016-E-T-P4S
Distance between bearings:L = 480 mm
Distance to the face:a = 120 mm
Table 2. Specifications of spindle units type B.
Specification: Type B
Machines 11 00586 i002Type of machine tool:3-axis machine center
Type of spindle:Electro spindle
Orientation:Horizontal
Max. power (S6/S1):18.5/11 kW
Max. speed:14,000 rpm
Tool interface:MAS BT40
Front bearing arrangement:/ \
Front bearings:HC7016-EDLR-T-P4S-UL
Rear bearing arrangement:/ \
Rear bearings:HC7011-C-T-P4S
Distance between bearings:L = 320 mm
Distance to the face:a = 90 mm
Table 3. Description of equipment used for off-line spindle diagnostic.
Machines 11 00586 i003Vibration analyzer:
Type: SKF Microlog CMXA 48
Vibration sensors:
Type: ICP 608A11
S.n.: LW229726(1); LW229727(2)
Sensitivity (±15%): 100 mV/g
Measuring range: ±50 g
Frequency range (±3 dB): 0.5 to 10,000 Hz
Clamping force sensor:
Type: OTT POWER CHECK-2 75 kN
S.n.: 574,582
Measuring range: 10 to 75 kN
Uncertainty≤ 0.2% (+/−)
Test bars for spindle runout calibration:
HSK-A100 DIN 69893
MAS BT40 (JIS B 6339)
Table 4. Measured results of spindle type A (max. speed: 10,000 rpm).
Spindle Unit A1
Machines 11 00586 i004
Spindle unit A2
Machines 11 00586 i005
Spindle unit A3
Machines 11 00586 i006
Table 5. Measured results of spindle type B (max. speed: 14,000 rpm).
Spindle Unit B1
Machines 11 00586 i007
Spindle unit B2
Machines 11 00586 i008
Spindle unit B3
Machines 11 00586 i009
Table 6. RUL and corrected of the A spindle units after last diagnostic measurement.
Spindle TypeSpindle Operation Hours (hrs) v R M S r e f ( mm / s ) L10h
(hrs)
LRUL,10h
(hrs)
LRUL,10%
(%)
LcRUL,10h
(hrs)
LcRUL,10%
(%)
A142560.833,99029,73487.511,62734%
A243581.134,01029,65287.114,53843%
A343681.1232,78028,41286.743710%
Table 7. Spindle condition of the A spindle units after last diagnostic measurement and relative RUL estimated by the expert based on this data.
TypeSpindle Operation Hours (hrs)VRMS
(mm/s)
Clamping Force (kN)Runout (mm)RUL Estimated by Expert
HollowL = 50 mmL = 300 mm
A142561.09438.10.0030.0060.01240%
A243581.39538.10.0060.0120.02040%
A343682.09140.50.0030.0060.00630%
Status: OKWarningDamage
Table 8. Condition of the evaluation of the RUL of the spindle units type B.
Spindle TypeSpindle Operation Hours (hrs) v R M S r e f ( mm / s ) L10h
(hrs)
LRUL,10h
(hrs)
LRUL,10%
(%)
LcRUL,10h
(hrs)
LcRUL,10%
(%)
B123,6671.1232,52111,85433.44951.4
B217,7051.1221,102339716.1110.05
B334580.434,72131,26390.031,26390.0
Table 9. Condition for evaluation of accuracy of spindle units type B.
TypeSpindle Operation Hours (hrs)VRMS
(mm/s)
Clamping Force (kN)Runout (mm)RUL Estimated by Expert
HollowL = 50 mmL = 300 mm
B123,6673.8059.20.0080.0400.1740%
B217,7058.86313.10.0080.0200.1300%
B334580.2739.20.0020.0020.00280%
Status: OKWarningDamage
Table 10. Results of RUL according to the method.
Type of SpindleDiagnostic
Evaluation (%)
RUL   L R U L , 10 %   Corrected   RUL   L c R U L , 10 %  
Front
(%)
Difference to Evaluation (%)Front
(%)
Difference to Evaluation (%)
A14088−48346
A24087−4743−3
A33087−37030
B1033331.41.4
B2016160.050.05
B38090−1090.0−10
Disclaimer/Publisher’s Note: The statements, opinions and data contained in all publications are solely those of the individual author(s) and contributor(s) and not of MDPI and/or the editor(s). MDPI and/or the editor(s) disclaim responsibility for any injury to people or property resulting from any ideas, methods, instructions or products referred to in the content.

