Article

Portable Instruments Based on NIR Sensors and Multivariate Statistical Methods for a Semiautomatic Quality Control of Textiles

1
Electrical Engineering Department, Universitat Politècnica de Catalunya, Rambla Sant Nebridi 22, 08222 Terrassa, Spain
2
Department of Computer Science and Industrial Engineering, Universitat de Lleida, Pla de la Massa 8, 08700 Igualada, Spain
*
Author to whom correspondence should be addressed.
Machines 2023, 11(5), 564; https://doi.org/10.3390/machines11050564
Submission received: 25 April 2023 / Revised: 10 May 2023 / Accepted: 16 May 2023 / Published: 18 May 2023

Abstract

:
Near-infrared (NIR) spectroscopy is a widely used technique for determining the composition of textile fibers. This paper analyzes the possibility of using low-cost portable NIR sensors based on InGaAs PIN photodiode array detectors to acquire the NIR spectra of textile samples. The NIR spectra are then processed by applying a sequential application of multivariate statistical methods (principal component analysis, canonical variate analysis, and the k-nearest neighbor classifier) to classify the textile samples based on their composition. This paper tries to solve a real problem faced by a knitwear manufacturer, which arose because different pieces of the same garment were made with “identical” acrylic yarns from two suppliers. The sweaters had a composition of 50% acrylic, 45% wool, and 5% viscose. The problem occurred after the garments were dyed, where different shades were observed due to the different origins of the acrylic yarns. This is a challenging real-world problem for two reasons. First, there is the need to differentiate between acrylic yarns of different origins, which experts say cannot be visually distinguished before garments are dyed. Second, measurements are made in the field using portable NIR sensors rather than in a controlled laboratory using sophisticated and expensive benchtop NIR spectrometers. The experimental results obtained with the portable sensors achieved a classification accuracy of 95%, slightly lower than the 100% obtained with the high-performance laboratory benchtop NIR spectrometer. The results presented in this paper show that portable NIR sensors combined with appropriate multivariate statistical classification methods can be effectively used for on-site textile quality control.

1. Introduction

Textile consumption in Europe has the largest impact on climate change and the environment after food, housing, and mobility, as Europeans throw away an average of 11 kg of textiles per person per year [1]. Europeans consume an average of 26 kg of textiles per person per year. The need to increase the share of reused and recycled textiles requires the development of more strictly controlled production processes to guarantee the expected quality of the final textile products.
Quality control approaches based on optical sensors are attractive due to their non-contact nature [2,3]. Infrared spectroscopy is often combined with multivariate chemometric methods for classification, sorting, material characterization, and quality control in various industrial sectors, including raw materials, pharmaceutical and chemical industries, or the food industry, among others [4,5]. Infrared spectroscopic techniques allow fast and non-intrusive acquisition of spectral data, so they can be applied to control various quality-related parameters in different industrial sectors [6].
The textile industry applies strict quality controls, which can be improved by using state-of-the-art spectroscopic sensors that provide fast and non-intrusive control without the use of chemical reagents or the need for expert technicians. Although most of the information in the infrared spectrum of textile samples comes from the main textile fibers, the presence of other products tends to mask this spectral information. Therefore, when designing a classification method, it is necessary to extract and select the relevant information from the textile spectrum while removing the background noise. This can be achieved by applying appropriate multivariate statistical methods, making their application essential.
NIR spectroscopy (wavelength range: 750 to 2500 nm) was chosen as the analytical tool for quality control in this study because of its ability to penetrate solid samples and obtain important information about them. In the NIR, the absorption of radiation is due to the combination of overtones and bands from the fundamental vibrations produced in the mid-infrared [7]. The most common bands in the NIR are due to bonds containing light atoms such as C-H, N-H, O-H, P-H, and S-H due to their greater harmonicity. The NIR bands are less intense, broader, and not as well defined as the mid-infrared bands. NIR spectroscopy is an analytical technique that has been widely applied in various fields, such as healthcare [8,9], medicine [10], agriculture [11], plastic pollution detection in soil [12], agrifood [13,14,15,16], the oil and fuel industry [17], or the textile industry [3,18,19,20,21], among others. Information can be obtained from the sample quickly, non-invasively, and non-destructively. These characteristics make NIR spectroscopy an efficient technique for solving quality control problems. However, NIR spectroscopy must be combined with powerful mathematical techniques because small differences in the spectra of different samples cannot be analyzed by the human eye alone.
This paper tries to solve a real problem faced by a knitwear manufacturer by using portable NIR sensor-based instruments combined with appropriate mathematical treatment of the raw spectral data. The problem arose because different parts of the same garment (sleeves, front, back, neck, etc.) were supposed to be made with “identical” yarns from two suppliers. The sweaters had a composition of 50% acrylic, 45% wool, and 5% viscose. After dyeing the garments, different shades were observed in the different parts, as shown in Figure 1. This problem was attributed to the different origins of the acrylic yarns, which, according to the company experts, did not show any visual differences before the garments were dyed. This information has been obtained directly from the company that has the quality problem in question. Therefore, the challenge is to be able to identify the fabrics obtained from the two types of acrylic origins (Dralon versus Aksa acrylics) in dyed garments in order to distinguish both types of origins in the raw pieces of the sweaters and to minimize problems during the manufacturing process. The goal is to identify the two origins using a portable NIR spectroscopic module combined with appropriate statistical processing methods so that the company can apply this quality control procedure routinely. The proposed solution should make it easier to control the quality of the final product by identifying the origin or composition of the acrylic yarns, preventing two pieces of the same garment from having acrylic yarns of different origins.
Most of the identification studies found in the technical literature are based on sophisticated and expensive benchtop NIR spectrometers, which have several limitations, especially when field analysis or on-site quality control are required. However, with the commercialization of miniaturized portable spectrometers, NIR spectral analysis has become feasible for field applications [22], and in some applications, low-cost portable NIR instruments are replacing benchtop spectrometers [23]. This paper evaluates the performance of three portable, low-cost spectrum analyzers for the classification of textile samples. These sensors include an InGaAs PIN photodiode array detector, a tunable filter, a built-in lamp, and a USB port for communication. This is a challenging real-world problem because of two different aspects that make this work innovative. The first is the need to solve a real-world problem in the shortest possible time and with a limited number of samples. The second point is that this problem was not clearly susceptible to being solved using NIR spectral data due to the same composition of the samples to be discriminated. Finally, we propose a methodology for solving similar challenges, i.e., first assessing whether a high-performance benchtop NIR spectrometer combined with appropriate mathematical methods is capable of solving the problem and then identifying the most convenient portable sensor to solve it on site at the company premises. This work aims to evaluate the performance of portable NIR sensors for textile quality control when combined with an appropriate multivariate statistical treatment of the spectral data. Such mathematical treatment first normalizes the spectral information, then reduces the number of independent variables by applying the principal components analysis (PCA) followed by the canonical variate analysis (CVA) algorithms. Finally, the k-nearest neighbor (kNN) algorithm is applied to classify the unknown input textile samples into one of the classes predefined in the problem. Although various machine learning approaches have been proposed to identify textile samples, including support vector machines, genetic algorithms, or deep learning neural networks [18,24,25], the mathematical tools proposed in this paper are easy to apply and require very little computational effort. This allows them to be embedded in portable instruments. The approach presented in this problem can be applied to many other areas requiring on-site spectroscopic measurements.
The paper is divided into four sections. Section 2 describes the NIR spectroscopy, details the analyzed NIR sensors, and describes the mathematical methods applied to the NIR spectra to classify the unknown input samples according to their origins. Section 3 describes the textile samples analyzed and describes and discusses the experimental results obtained with the different sensors. Finally, Section 4 concludes this paper.

2. Materials and Methods

This section proposes a new methodology to quickly solve a real-world problem that can be applied on site to discriminate between samples of the same composition. The method consists of first analyzing the feasibility of using a high-performance benchtop NIR spectrometer coupled with appropriate statistical methods to solve the problem. Next, if the problem can be solved using NIR technology, a screening of commercial portable NIR sensors must be carried out. Then, the performance of the selected sensor(s) has to be tested according to different constraints such as cost, accuracy, sensitivity, and rapid availability, among others, using the same statistical methods. Finally, the proposed solution will be implemented in the company.

2.1. Samples

The textile samples have a composition of 50% acrylic, 45% wool, and 5% viscose. The acrylic yarn had two different origins (suppliers), which were identified as “Aksa” and “Dralon”. Approximately 15,000 sweaters were woven and assembled prior to dyeing. The problem occurred after dyeing some of the sweaters, when parts of the same sweater appeared with different color intensities (see Figure 1). Defective sweaters could not be sold. Therefore, a classification method has to be prepared from dyed samples, whose colors reveal their origin (dark = “Dralon” and light = “Aksa”), in order to be able to correctly classify the raw sweaters before dyeing. The identification “in raw” of sweaters combining the two origins would allow the company to dye them with softer colors (less affected by the problem).
A set of 40 dyed samples was provided by the company (20 samples of each type, labeled A1 to A20 and D1 to D20 for the Aksa and Dralon samples, respectively).

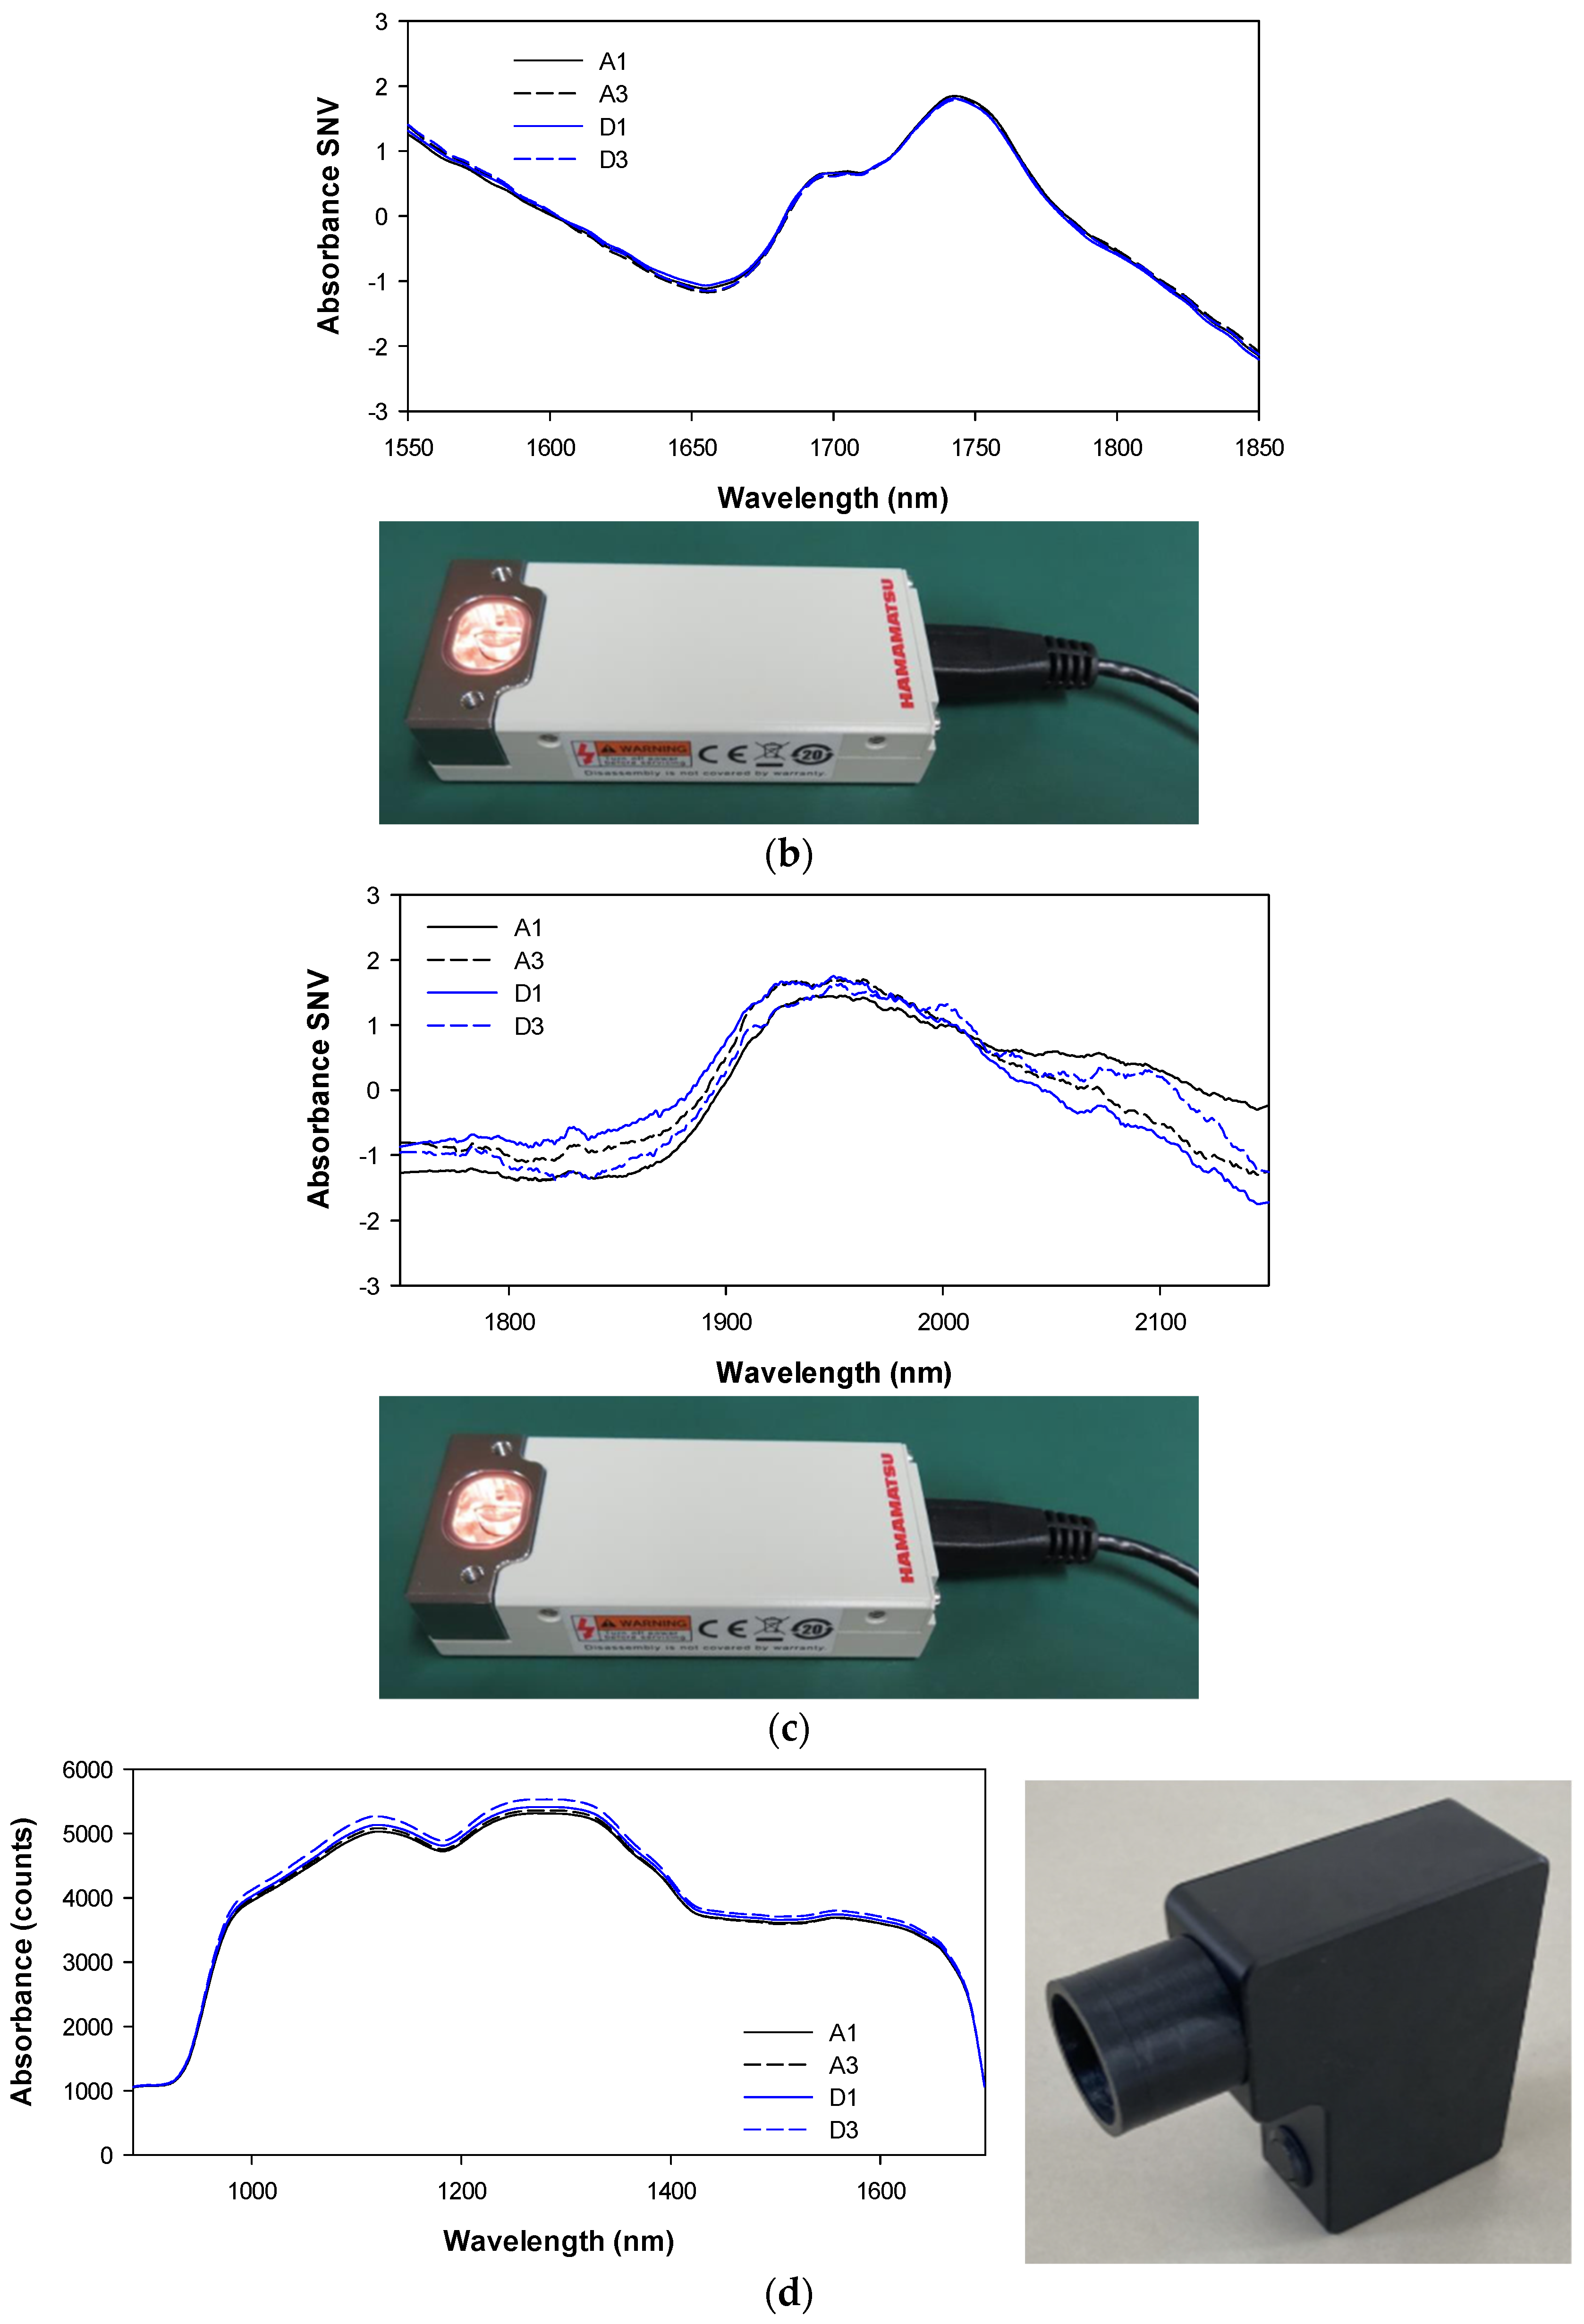
2.2. The Analyzed Sensors

Optical spectroscopy has been applied for decades to determine the chemical composition of different materials [26]. However, these analyses are typically performed using expensive benchtop spectrometers, which limits the possible applications. Recently, the need for in situ detection has forced the rapid development of portable spectral sensors with lower costs and a smaller footprint [23,27,28,29], which have expanded the areas of application. The fabrication of compact spectrometers is a major challenge, especially in the infrared region, where chemical information is most relevant [26]. Due to the maturity of silicon processing, significant progress has been made in the visible region and up to 1100 nm [23,28]. However, progress in integrating NIR spectrometers is more challenging. Due to its high sensitivity in the NIR spectrum [30], indium gallium arsenide (InGaAs) is one of the most promising candidates as a NIR sensor, among various semiconductor materials [31].
The portable spectroscopic modules C15713 and C15714 from Hamamatsu (Hamamatsu City, Japan) [32] are analyzed in this paper together with the NIR-Q device from Phase Photonics (Morpeth, UK). These spectroscopic modules are based on an InGaAs PIN photodiode array detector, a tunable filter, a built-in tungsten incandescent lamp for reflection measurement, and a USB port for communication. The analyzed spectroscopic modules include a MEMS-FPI (Fabry-Perot Interferometer) tunable filter that can vary its transmission wavelength by changing the applied voltage. Specific details of these modules are shown in Table 1. To maximize reproducibility and minimize noise, spectra are averaged over four scans.
In this paper, the measurements of the three portable instruments mentioned above are compared with the measurements of a FOSS spectrometer (XDSTM OptiProbe Analyzer from Foss NIRSystems, Hillerød, Denmark) equipped with a fiber optical probe for reflectance measurements. The instrument is controlled by Vision SoftwareTM. The measurement interval ranges from 400 nm to 2499.5 nm (including visible and NIR), with a resolution of 0.5 nm, using an average of 32 scans. The NIR ranges from 1100 nm to 2500 nm. However, we work in the 1100–2200 nm range because there is more noise beyond 2200 nm, so each spectrum consists of 2201 data points.

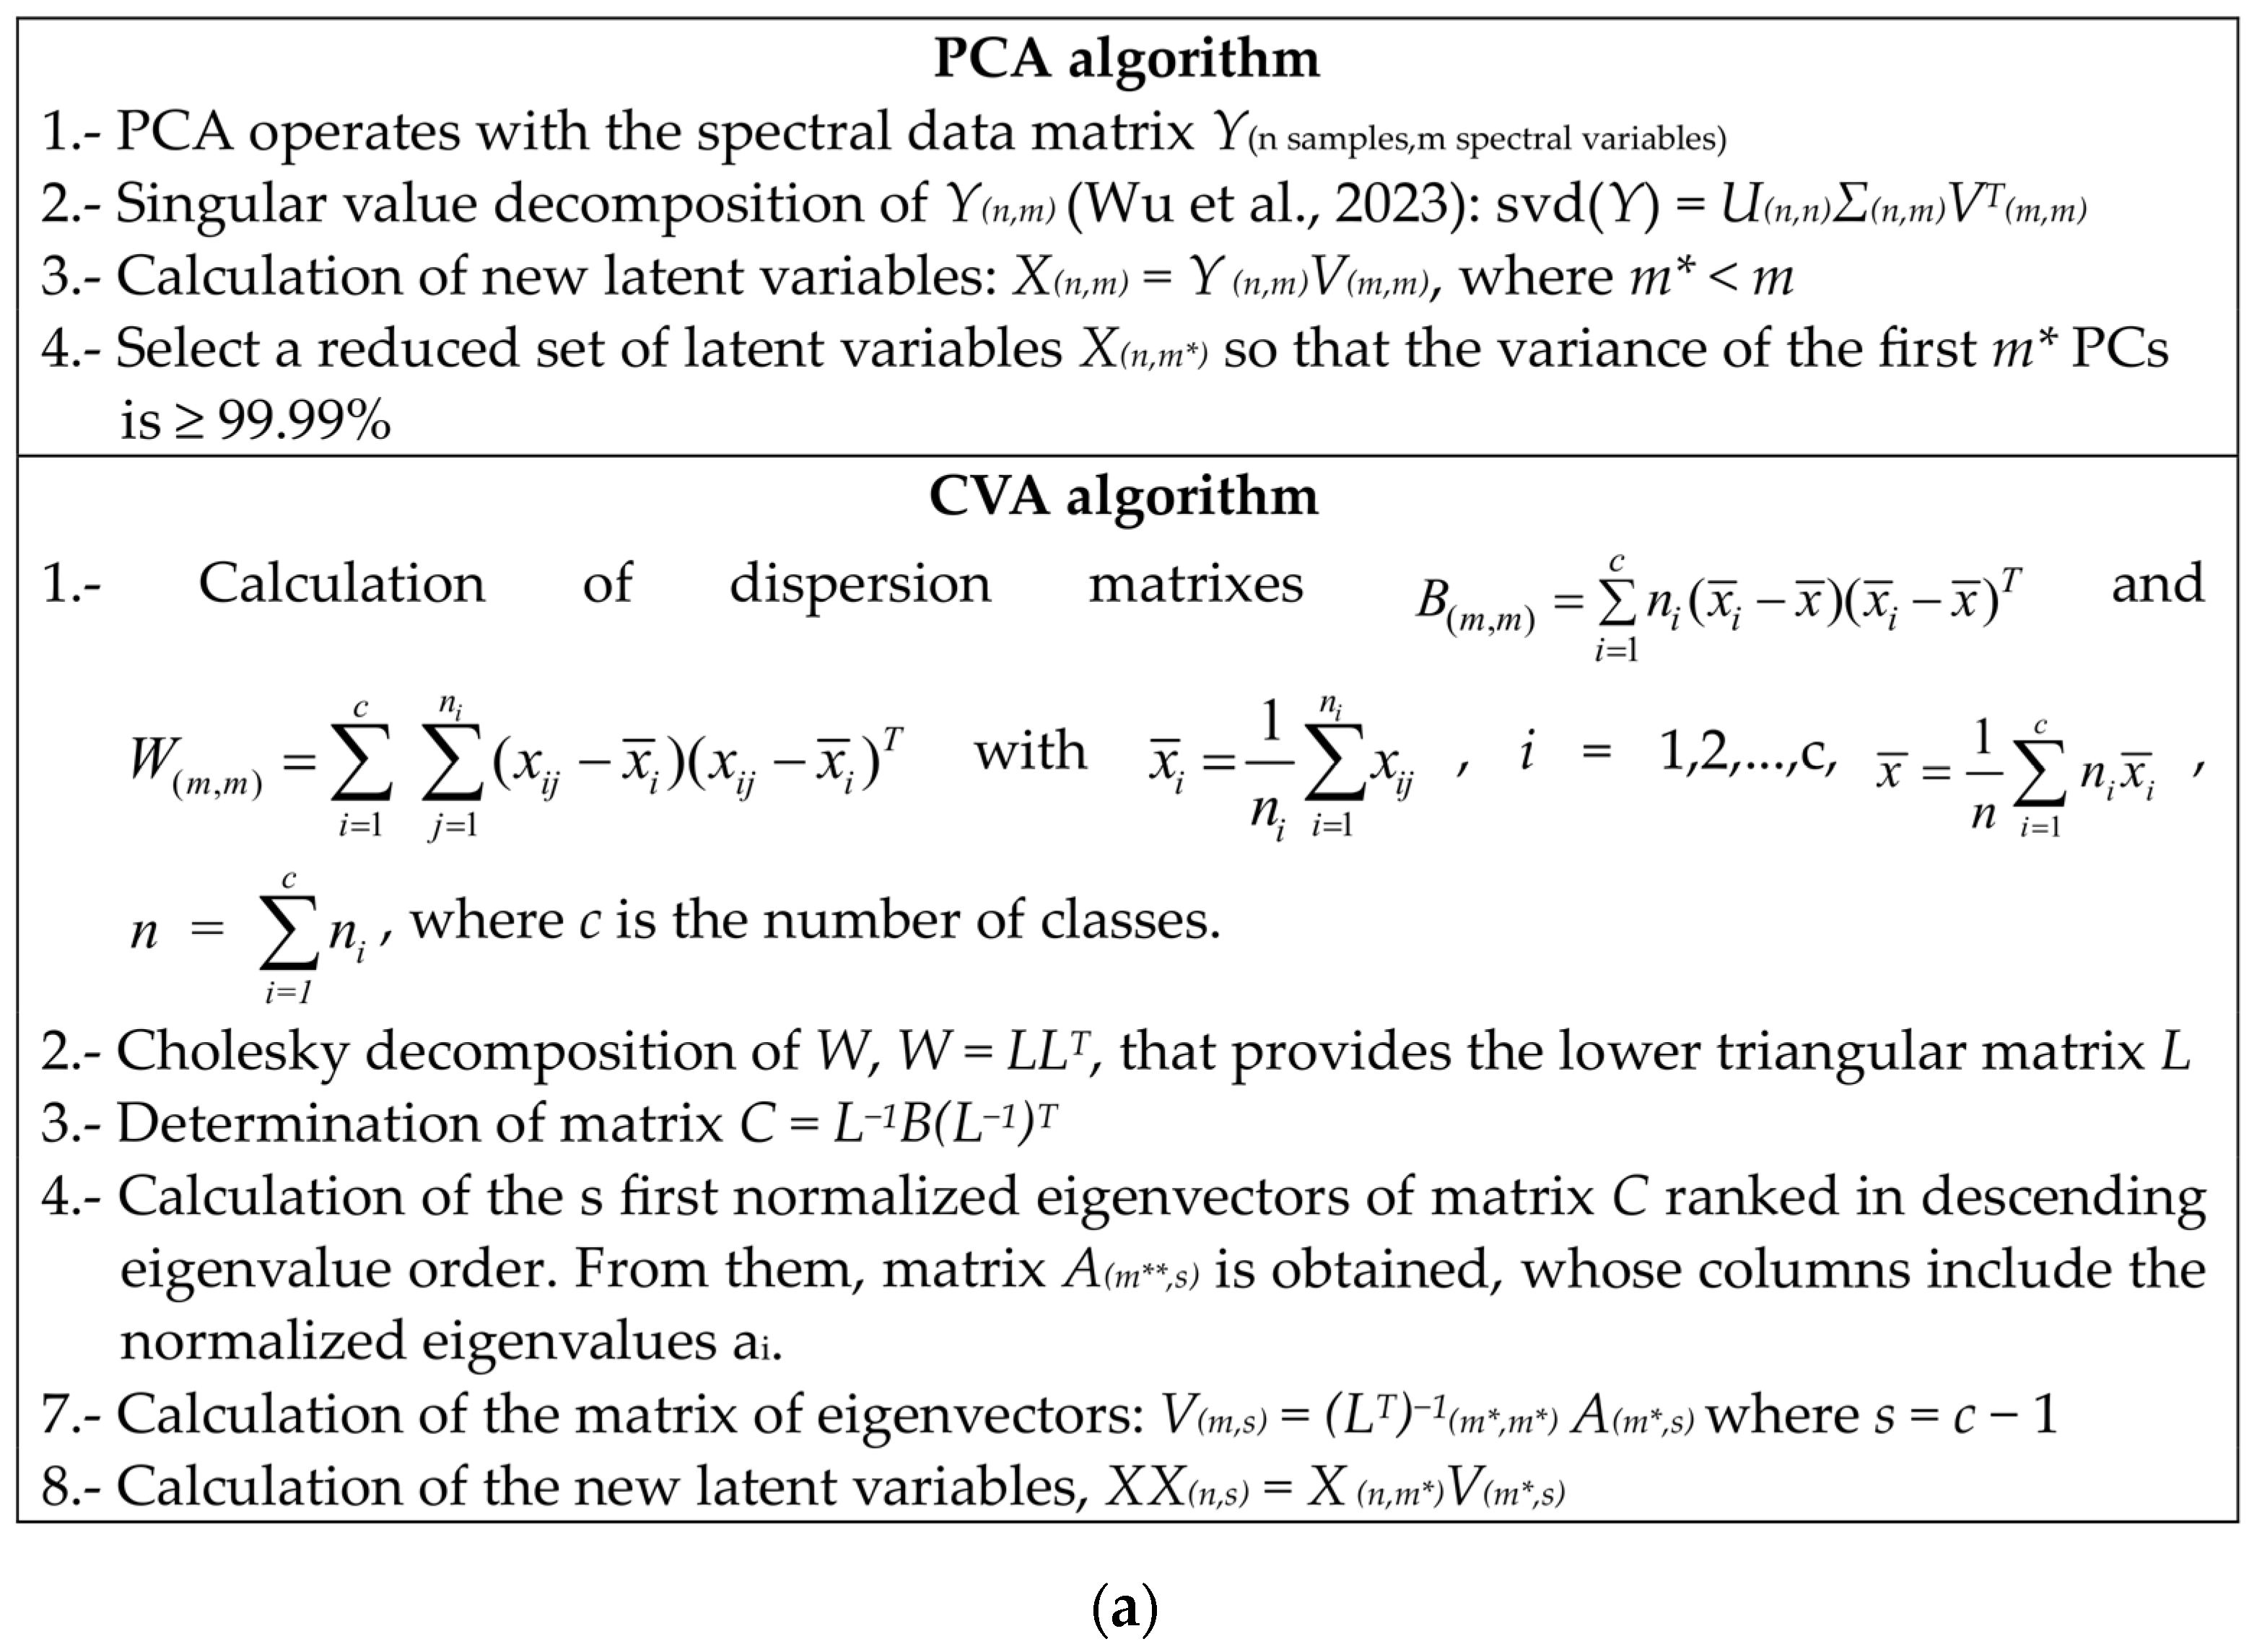
2.3. The Proposed Multivariate Statistical Approach

This section describes the mathematical processing of the NIR spectral data to build the classification model.
First, the spectra of the textile samples are registered in absorbance mode, so the raw spectral data are transformed to absorbance mode as
x a b s o r b a n c e = log 10 x x d a r k x w h i t e x d a r k
where x is a (1,m) vector with the data provided by the NIR sensor of an input textile sample, xdark and xwhite are the spectra of the dark and white references, respectively, and m is the number of data points corresponding to the wavelengths considered in the NIR spectrum.
Next, the raw spectral data is transformed using the standard normal variate (SNV) transform, which normalizes by subtracting each point of the spectrum by its own mean value (mean) and dividing it by its own standard deviation (std).
x a b s o r b a n c e , SNV = x a b s o r b a n c e m e a n ( x a b s o r b a n c e ) s t d ( x a b s o r b a n c e )
After applying the SNV transform, the SNV spectrum has a mean of 0 and a standard deviation of 1. Once the SNV absorbance of each sample is calculated, the next step is to divide the entire set of samples into two data sets, i.e., the calibration data set (also known as the training data set) and the prediction data set, which is completed randomly in a 50–50% ratio in this paper. This strategy allows the calibration of the classification model using the samples from the calibration set, while evaluating the performance of this model using the samples not used in the calibration step, i.e., the samples from the prediction set.
The model is then calibrated (or trained) using the samples from the calibration set. The classification models are based on a sequential application of three algorithms, i.e., principal component analysis (PCA), canonical variate analysis (CVA), and the k-nearest neighbors (kNN) algorithm.
Figure 2 outlines the multivariate statistical methods used to classify unknown textile samples, showing the calibration and prediction steps.
This paper proposes to apply a combined PCA + CVA + kNN dimensionality reduction and classification strategy. PCA and CVA are multivariate statistical methods that are applied to reduce the dimensionality of the problem, i.e., the number of independent variables considered, in order to facilitate the classification stage. In addition to reducing the noise contained in the original variables, the latent variables compress the analytically relevant spectral information into a reduced set of latent variables [4,33] obtained by linearly combining the original variables. Finally, the kNN algorithm is the classifier used in this problem; it classifies the unknown input samples into one of the classes predefined in the problem by assigning a score between 0 and 1 to the sample. This is a supervised process, as both CVA and kNN are supervised algorithms.
CVA is a powerful method for multiclass dimensionality reduction. It attempts to compute new latent variables called canonical variates (CVs) that maximize the distances between different datasets or classes and minimize the distances between samples belonging to the same class [34], so it is specifically designed for classification purposes. CVA computes a number of CVs equal to the number of classes defined in the problem minus one. Its main disadvantage is that it requires datasets with more samples than the original variables. However, this is not the case for most classification problems based on spectral data, where the spectrum is composed of hundreds or thousands of variables. This fact forces the application of the unsupervised PCA dimensionality reduction algorithm to reduce the dimensionality of the problem before applying CVA [35]. PCA attempts to concentrate the significant information found in the spectra into a set of uncorrelated and orthogonal latent variables known as principal components (PCs) [36]. The PCs are usually ranked in descending order by the amount of variance explained [37]. Although PCA calculates the same number of PCs as the number of original variables in the problem, it retains only a reduced number of PCs [38] that explain the greatest amount of variance (99.99% in this paper), so the remaining PCs are ignored. The application of the PCA + CVA algorithms greatly reduces the dimensionality of the problem and calculates new latent variables, the CVs that are optimal from a classification point of view, so that the classifier can be applied. In this case, the widely used kNN algorithm is proposed because of its simplicity and accurate results [34,39,40]. kNN is a supervised classifier, which means that it is guided by a previous training process in which an “expert” has classified the training samples into different classes, thus ensuring classification accuracy. kNN computes the same number of normalized class membership values in the interval [0,1] as the number of classes previously defined in the problem. A given input sample is assumed to belong to the class associated with a membership value greater than 0.5. kNN finds the k-nearest neighbors of the input sample in the space defined by the CVs among the different samples in the calibration set. Next, kNN assigns k votes to the nearest neighbor class, k-1 votes to the second nearest neighbor class, and so on, until one vote is assigned to the k-th most distant neighbor class. Finally, all the votes are summed, and kNN assigns the analyzed sample to the class with the most votes.
Figure 3 shows the mathematical details of the PCA, CVA, and kNN algorithms.
Full details of these methods can be found in [3]. All computer codes were programmed by the authors of this paper in the Matlab® environment.

3. Experimental Results and Discussion

In order to build a classification model to classify the samples according to the type of acrylic (Aksa versus Dralon), it is necessary to have enough samples of both types of acrylic. The company provided a total of 40 samples, 20 samples of each type, which were named A1 to A20 and D1 to D20 for the Aksa and Dralon samples, respectively.
The NIR spectra of these samples were recorded and then mathematically processed according to the procedure described in Section 2.3. The total set of samples was then randomly split 50–50% between the calibration and prediction sets.

3.1. Spectra Recorded by the Different NIR Instruments

The absorbance spectra of all the analyzed samples were transformed to the standard normal variable (SNV) mode by applying the transformation described by Equation (2).
Figure 4 shows the spectra of four samples from the calibration set recorded with the four NIR instruments.
Figure 4a shows a clear overlap of the NIR spectra of Aksa and Dralon samples, which were recorded with the high sensitivity FOSS spectrometer in the 1100–2200 nm wavelength range. It should be noted that the fibrous composition of these two types of samples is the same (50% acrylic, 45% wool, and 5% viscose), and the only difference between them is the origin of the acrylic fiber. In Figure 4b–d, where the NIR spectra presented were obtained with the portable sensors (Hamamatsu C15713, Hamamatsu C15714, and Phase-Photonics, respectively), a clear similarity between the spectra of the two types of samples is also observed (although their sensitivity is lower than that of the FOSS spectrometer).
The great similarity between the spectra of the Aksa and Dralon samples makes it very difficult to distinguish them. Therefore, it is absolutely necessary to develop a powerful and robust mathematical method to accurately and exhaustively analyze the spectral information obtained from the different sensors in order to accurately discriminate between the two types of samples.

3.2. Results Obtained with the Laboratory Spectrometer

Firstly, the 40 samples were recorded using the accurate and expensive laboratory XDSTM OptiProbe Analyzer from Foss NIRSystems, which is equipped with a fiber optic probe to perform reflectance measurements.
Figure 5 and Table 2 show the results obtained. Figure 5 shows the classification results in the space of the unique canonical variate (CV1) resulting from the PCA + CVA approach. It can be seen that all acrylic samples are clearly separated in the space defined by CV1. The results presented in Table 2 show that all the samples in the prediction set are correctly classified.

3.3. Results Obtained with the Portable NIR MEMS-FPI C15713

The 40 samples were then recorded with the Hamamatsu C15713 MEMS-FPI portable spectroscopic module, which is sensitive in the 1550–1850 nm spectral range.
Figure 6 shows the classification results in the space of the unique canonical variate (CV1) resulting from the PCA + CVA approach. It is clearly seen that some acrylic samples from Aksa and Dralon are not well separated in the space defined by CV1. The results presented in Table 3 show 7 misclassifications out of a total of 20 prediction samples, corresponding to a misclassification rate of 35%.

3.4. Results Obtained with the Portable NIR MEMS-FPI C15714

The 40 samples were then recorded with the portable MEMS-FPI C15714 spectroscopic module from Hamamatsu, which is sensitive in the 1750–2150 nm spectral range.
Figure 7 shows the classification results in the space of the unique canonical variate (CV1) resulting from the PCA + CVA approach. It is clearly seen that some acrylic samples from Aksa and Dralon are not well separated in the space defined by CV1. The results presented in Table 4 show 3 misclassifications out of a total of 20 prediction samples, corresponding to a misclassification rate of 15%.

3.5. Results Obtained by Combining the Spectra of the Devices C15713 and C15714

Finally, the spectra of each sample were recorded with the portable spectroscopic modules MEMS-FPI C15713 and C15714 from Hamamatsu, which were directly combined into a single spectrum. This data fusion approach was applied to see if further improvements could be achieved.
Figure 8 and Table 5 show the classification results in the space of the unique canonical variate (CV1) resulting from the PCA + CVA approach. The results obtained clearly show that there are still 3 misclassifications out of a total of 20 prediction samples, which corresponds to a misclassification rate of 15%.

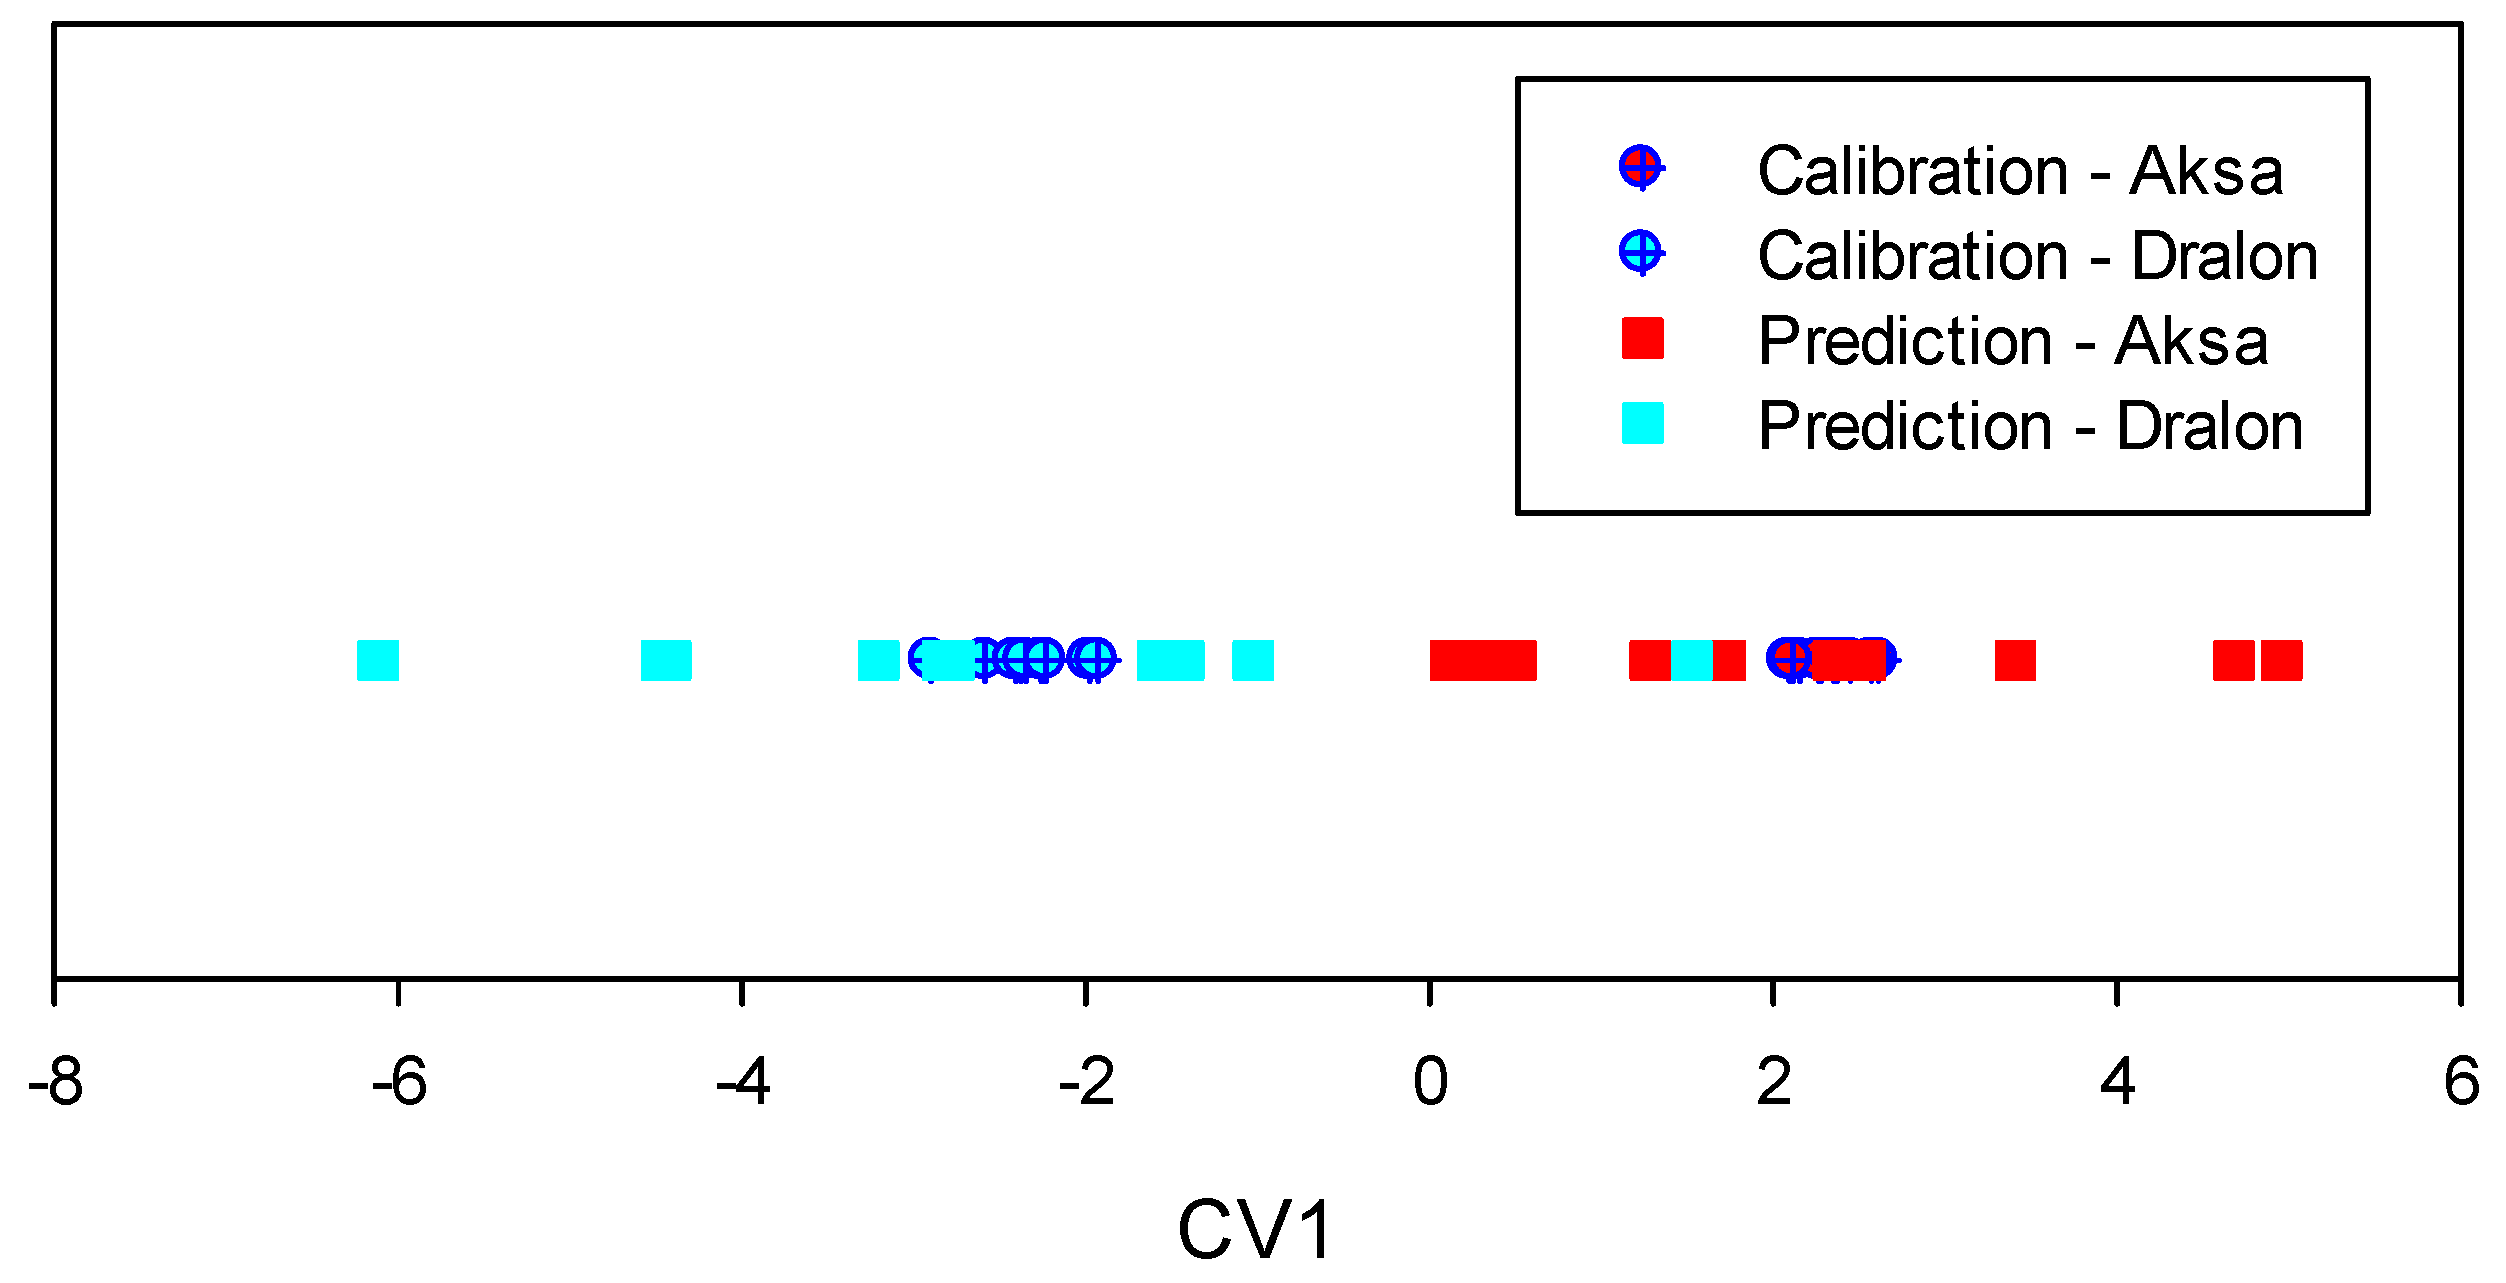
3.6. Results Obtained with the Portable NIR-Q Device from Phase Photonics

Finally, all 40 samples were recorded using the portable NIR-Q spectroscopic module from Phase Photonics, which is sensitive in the 900–1700 nm spectral range.
Figure 9 and Table 6 show the results obtained. Figure 9 shows the classification results in the space of the unique canonical variate (CV1) resulting from the PCA + CVA approach. It can be clearly seen that there is only one acrylic sample, which is not well separated in the space defined by CV1. The results presented in Table 6 also show only 1 misclassification out of a total of 20 prediction samples, which corresponds to a misclassification rate of 5%.

3.7. Summary of Results

Table 7 summarizes the classification results obtained with the different spectrometers in this challenging problem. It shows that although the best results are obtained, as expected, with the benchtop laboratory spectrometer, similar results can be obtained with the NIR-Q instrument. The NIR-Q sensor gives better results because it covers a wider range of wavelengths (900–1700 nm) and makes measurements with higher resolution (6 nm instead of the ≈ 20 nm of the other two commercial portable sensors studied), offering a more accurate spectra record. From these results, it is concluded that both spectral range and resolution are important to achieve accurate classification results.
The results summarized in Table 7 are based on the application of the PCA + CVA + kNN strategy, which has been shown in previous work to be close to optimal in terms of accuracy and complexity [4,39]. The accuracy of this approach is validated by the 100% identification accuracy achieved with the laboratory spectrometer and the 95% accuracy achieved with the NIR-Q sensor.
A further implication of these results is that if a specific problem can be solved with a high-sensitivity laboratory NIR spectrophotometer, it can be expected that a convenient portable NIR sensor will also be able to solve it. Portable NIR sensors add versatility to the technique, allowing quality control to be implemented directly on the production line using inexpensive, easy-to-use equipment. With the integration of portable NIR sensors and the appropriate software, an immediate interpretation of the result can be obtained.
The computational cost during the training phase is about 0.040 s, while during the classification phase it is about 0.015 s using an Intel(R) Core(TM) i7-6700 CPU @ 3.40 GHz 3.41 GHz.

4. Conclusions

In this paper, we have shown the versatility and adaptability of using NIR spectra with further statistical processing to solve the challenges of differentiating samples not only by composition but also by origin. Production systems usually have variables that are difficult to control and that could affect the final quality of the product, with consequent economic and environmental impacts. Therefore, the application of the proposed methodology will be of great value.
The real and complex problem to be solved by a knitwear manufacturer was to identify acrylic yarns of different origins using portable NIR sensors for on-site quality control. To this end, three portable NIR sensors based on InGaAs PIN photodiode array detectors were analyzed after verifying that the problem could be solved by combining NIR with appropriate statistical methods. The results show that one of the portable instruments analyzed can correctly classify acrylic yarns of different origins with an accuracy of 95%. This solution helped the company solve the problem and save time, money, and defective material. The results presented in this paper show that spectral range and resolution are important factors to consider when selecting sensors, as the sensors with the wider spectral range and finest resolution produce better classification results.
It is also concluded that each problem requires careful work in the development of the method. First, the spectrum of the samples to be classified needs to be acquired with the most sensible NIR spectrometer. Next, the most suitable portable sensor must be selected, since this type of sensor does not record the full NIR spectrum of the samples. Finally, it is necessary to apply robust classification methods that provide reproducible results and low misclassification rates.

Author Contributions

Conceptualization, J.-R.R., R.C. and R.P.; methodology, J.-R.R., R.C. and R.P.; validation, J.-R.R.; formal analysis, J.-R.R., R.C. and R.P.; investigation, R.C. and R.P.; writing—original draft preparation, J.-R.R., R.C. and R.P.; writing—review and editing, J.-R.R., R.C. and R.P. All authors have read and agreed to the published version of the manuscript.

Funding

This research was partially funded by Generalitat de Catalunya under grant numbers ACE033/21/000028, 2021 SGR 00392, and 2021 SGR 01501.

Data Availability Statement

Not applicable.

Acknowledgments

The authors are grateful to FITEX and MODACC (textile associations), coordinators of the above-mentioned project (ACE033/21/000028), for their technical support and providing the samples analyzed in this paper.

Conflicts of Interest

The authors declare no conflict of interest.

References

  1. European Environment Agency. Textiles in Europe’s Circular Economy; European Environment Agency: Copenhagen, Denmark, 2019. [Google Scholar]
  2. Cassanelli, D.; Lenzini, N.; Ferrari, L.; Rovati, L. Partial Least Squares Estimation of Crop Moisture and Density by Near-Infrared Spectroscopy. IEEE Trans. Instrum. Meas. 2021, 70, 1004510. [Google Scholar] [CrossRef]
  3. Riba, J.R.; Cantero, R.; Puig, R. Classification of Textile Samples Using Data Fusion Combining Near- and Mid-Infrared Spectral Information. Polymers 2022, 14, 3073. [Google Scholar] [CrossRef] [PubMed]
  4. Riba, J.-R.; Canals, T.; Cantero, R. Recovered Paperboard Samples Identification by Means of Mid-Infrared Sensors. IEEE Sens. J. 2013, 13, 2763–2770. [Google Scholar] [CrossRef]
  5. Bonifazi, G.; Gasbarrone, R.; Palmieri, R.; Serranti, S. End-of-Life Textile Recognition in a Circular Economy Perspective: A Methodological Approach Based on Near Infrared Spectroscopy. Sustainability 2022, 14, 10249. [Google Scholar] [CrossRef]
  6. Riba, J.-R.; Canals, T.; Cantero, R.; Iturriaga, H. Potential of infrared spectroscopy in combination with extended canonical variate analysis for identifying different paper types. Meas. Sci. Technol. 2011, 22, 025601. [Google Scholar] [CrossRef]
  7. Antónia Nunes, M.; Páscoa, R.N.M.J.; Alves, R.C.; Costa, A.S.G.; Bessada, S.; Oliveira, M.B.P.P. Fourier transform near infrared spectroscopy as a tool to discriminate olive wastes: The case of monocultivar pomaces. Waste Manag. 2020, 103, 378–387. [Google Scholar] [CrossRef]
  8. Roldán, M.; Kyriacou, P.A. Near-Infrared Spectroscopy (NIRS) in Traumatic Brain Injury (TBI). Sensors 2021, 21, 1586. [Google Scholar] [CrossRef]
  9. Pasquini, C. Near infrared spectroscopy: A mature analytical technique with new perspectives—A review. Anal. Chim. Acta 2018, 1026, 8–36. [Google Scholar] [CrossRef]
  10. Kranenburg, R.F.; Ramaker, H.J.; Sap, S.; van Asten, A.C. A calibration friendly approach to identify drugs of abuse mixtures with a portable near-infrared analyzer. Drug Test. Anal. 2022, 14, 1089–1101. [Google Scholar] [CrossRef]
  11. Serrano, J.; Shahidian, S.; Carapau, Â.; Rato, A.E. Near-Infrared Spectroscopy (NIRS) and Optical Sensors for Estimating Protein and Fiber in Dryland Mediterranean Pastures. AgriEngineering 2021, 3, 73–91. [Google Scholar] [CrossRef]
  12. Zhao, S.; Qiu, Z.; He, Y. Transfer learning strategy for plastic pollution detection in soil: Calibration transfer from high-throughput HSI system to NIR sensor. Chemosphere 2021, 272, 129908. [Google Scholar] [CrossRef] [PubMed]
  13. Osborne, B.G. Near-Infrared Spectroscopy in Food Analysis. In Encyclopedia of Analytical Chemistry: Applications, Theory, and Instrumentation; Wiley Online Library: Hoboken, NJ, USA, 2000. [Google Scholar] [CrossRef]
  14. Melendreras, C.; Forcada, S.; Fernández-Sánchez, M.L.; Fernández-Colomer, B.; Costa-Fernández, J.M.; López, A.; Ferrero, F.; Soldado, A. Near-Infrared Sensors for Onsite and Noninvasive Quantification of Macronutrients in Breast Milk. Sensors 2022, 22, 1311. [Google Scholar] [CrossRef] [PubMed]
  15. Anjos, O.; Caldeira, I.; Fernandes, T.A.; Pedro, S.I.; Vitória, C.; Oliveira-Alves, S.; Catarino, S.; Canas, S. PLS-R Calibration Models for Wine Spirit Volatile Phenols Prediction by Near-Infrared Spectroscopy. Sensors 2021, 22, 286. [Google Scholar] [CrossRef] [PubMed]
  16. Yuan, Z.; Ye, Y.; Wei, L.; Yang, X.; Huang, C. Study on the Optimization of Hyperspectral Characteristic Bands Combined with Monitoring and Visualization of Pepper Leaf SPAD Value. Sensors 2021, 22, 183. [Google Scholar] [CrossRef] [PubMed]
  17. Santos, F.D.; Santos, L.P.; Cunha, P.H.; Borghi, F.T.; Romao, W.; de Castro, E.V.; de Oliveira, E.C.; Filgueiras, P.R. Discrimination of oils and fuels using a portable NIR spectrometer. Fuel 2021, 283, 118854. [Google Scholar] [CrossRef]
  18. Riba, J.R.; Cantero, R.; Riba-Mosoll, P.; Puig, R. Post-Consumer Textile Waste Classification through Near-Infrared Spectroscopy, Using an Advanced Deep Learning Approach. Polymers 2022, 14, 2475. [Google Scholar] [CrossRef]
  19. Quintero Balbas, D.; Lanterna, G.; Cirrincione, C.; Fontana, R.; Striova, J. Non-invasive identification of textile fibres using near-infrared fibre optics reflectance spectroscopy and multivariate classification techniques. Eur. Phys. J. Plus 2022, 137, 85. [Google Scholar] [CrossRef]
  20. Cura, K.; Rintala, N.; Kamppuri, T.; Saarimäki, E.; Heikkilä, P. Textile Recognition and Sorting for Recycling at an Automated Line Using Near Infrared Spectroscopy. Recycling 2021, 6, 11. [Google Scholar] [CrossRef]
  21. Du, W.; Zheng, J.; Li, W.; Liu, Z.; Wang, H.; Han, X. Efficient Recognition and Automatic Sorting Technology of Waste Textiles Based on Online Near infrared Spectroscopy and Convolutional Neural Network. Resour. Conserv. Recycl. 2022, 180, 106157. [Google Scholar] [CrossRef]
  22. Escuredo, O.; Meno, L.; Rodríguez-Flores, M.S.; Seijo, M.C. Rapid Estimation of Potato Quality Parameters by a Portable Near-Infrared Spectroscopy Device. Sensors 2021, 21, 8222. [Google Scholar] [CrossRef]
  23. Crocombe, R.A. Portable Spectroscopy. Appl. Spectrosc. 2018, 72, 1701–1751. [Google Scholar] [CrossRef] [PubMed]
  24. Yildirim, P.; Birant, D.; Alpyildiz, T. Data mining and machine learning in textile industry. Wiley Interdiscip. Rev. Data Min. Knowl. Discov. 2018, 8, e1228. [Google Scholar] [CrossRef]
  25. Arora, S.; Majumdar, A. Machine learning and soft computing applications in textile and clothing supply chain: Bibliometric and network analyses to delineate future research agenda. Expert Syst. Appl. 2022, 200, 117000. [Google Scholar] [CrossRef]
  26. Hakkel, K.D.; Petruzzella, M.; Ou, F.; van Klinken, A.; Pagliano, F.; Liu, T.; van Veldhoven, R.P.J. Integrated near-infrared spectral sensing. Nat. Commun. 2022, 13, 103. [Google Scholar] [CrossRef] [PubMed]
  27. Bacon, C.P.; Mattley, Y.; DeFrece, R. Miniature spectroscopic instrumentation: Applications to biology and chemistry. Rev. Sci. Instrum. 2003, 75, 1. [Google Scholar] [CrossRef]
  28. Pügner, T.; Knobbe, J.; Grüger, H. Near-Infrared Grating Spectrometer for Mobile Phone Applications. Appl. Spectrosc. 2016, 70, 734–745. [Google Scholar] [CrossRef]
  29. Yang, Z.; Albrow-Owen, T.; Cai, W.; Hasan, T. Miniaturization of optical spectrometers. Science 2021, 371, eabe0722. [Google Scholar] [CrossRef]
  30. Bae, B.; Park, M.; Lee, D.; Sim, I.; Lee, K. Hetero-Integrated InGaAs Photodiode and Oxide Memristor-Based Artificial Optical Nerve for In-Sensor NIR Image Processing. Adv. Opt. Mater. 2022, 11, 2201905. [Google Scholar] [CrossRef]
  31. Fan, D.; Lee, K.; Forrest, S.R. Flexible Thin-Film InGaAs Photodiode Focal Plane Array. ACS Photonics 2016, 3, 670–676. [Google Scholar] [CrossRef]
  32. Hamamatsu. Spectroscopic Modules Compact Module with MEMS-FPI Spectrum Sensor and Light Source; Hamamatsu: Shizuoka, Japan, 2022; pp. 1–7. [Google Scholar]
  33. Pan, J.; Nguyen, K.L. Development of the Photoacoustic Rapid-Scan FT-IR-Based Method for Measurement of Ink Concentration on Printed Paper. Anal. Chem. 2007, 79, 2259–2265. [Google Scholar] [CrossRef]
  34. Riba, J.-R.; Cantero, R.; García-Masabet, V.; Cailloux, J.; Canals, T.; Maspoch, M.L. Multivariate identification of extruded PLA samples from the infrared spectrum. J. Mater. Sci. 2020, 55, 1269–1279. [Google Scholar] [CrossRef]
  35. Lai, W.; Zeng, X.; He, J.; Deng, Y. Aesthetic defect characterization of a polymeric polarizer via structured light illumination. Polym. Test. 2016, 53, 51–57. [Google Scholar] [CrossRef]
  36. Riba, J.-R.; Canals, T.; Cantero, R. Supervision of Ethylene Propylene Diene M-Class (EPDM) Rubber Vulcanization and Recovery Processes Using Attenuated Total Reflection Fourier Transform Infrared (ATR FT-IR) Spectroscopy and Multivariate Analysis. Appl. Spectrosc. 2017, 71, 141–151. [Google Scholar] [CrossRef] [PubMed]
  37. Bhattacharyya, N.; Bandyopadhyay, R.; Bhuyan, M.; Tudu, B.; Ghosh, D.; Jana, A. Electronic Nose for Black Tea Classification and Correlation of Measurements with “Tea Taster” Marks. IEEE Trans. Instrum. Meas. 2008, 57, 1313–1321. [Google Scholar] [CrossRef]
  38. Viale, L.; Daga, A.P.; Fasana, A.; Garibaldi, L. Dimensionality Reduction Methods of a Clustered Dataset for the Diagnosis of a SCADA-Equipped Complex Machine. Machines 2022, 11, 36. [Google Scholar] [CrossRef]
  39. Riba Ruiz, J.-R.; Canals, T.; Cantero Gomez, R. Comparative Study of Multivariate Methods to Identify Paper Finishes Using Infrared Spectroscopy. IEEE Trans. Instrum. Meas. 2012, 61, 1029–1036. [Google Scholar] [CrossRef]
  40. Riba, J.R.; Cantero, R.; Canals, T.; Puig, R. Circular economy of post-consumer textile waste: Classification through infrared spectroscopy. J. Clean. Prod. 2020, 272, 123011. [Google Scholar] [CrossRef]
  41. Johnson, R.A.; Wichern, D.W. Applied Multivariate Statistical Analysis, 6th ed.; Prentice-Hall: Englewood Cliffs, NJ, USA, 2007. [Google Scholar]
  42. Wu, Y.; Liu, X.; Zhou, Y. Deep PCA-Based Incipient Fault Diagnosis and Diagnosability Analysis of High-Speed Railway Traction System via FNR Enhancement. Machines 2023, 11, 475. [Google Scholar] [CrossRef]
  43. Nørgaard, L.; Bro, R.; Westad, F.; Engelsen, S.B. A modification of canonical variates analysis to handle highly collinear multivariate data. J. Chemom. 2006, 20, 425–435. [Google Scholar] [CrossRef]
Figure 1. Samples with acrylic yarns of different origins, where different shades can be observed (especially dark colors corresponding to Dralon samples) after dyeing.
Machines 11 00564 g001
Figure 2. Classification steps. (a) Calibration or training phase. (b) Classification of an unknown input textile sample.
Machines 11 00564 g002
Figure 3. (a) Details of the PCA [41] (Wu et al., 2023 [42]) and CVA [43] algorithms. (b) Details of the kNN classifier.
Machines 11 00564 g003aMachines 11 00564 g003b
Figure 4. Spectra of samples A1, A3, D1, and D3 of the calibration set recorded by each NIR instrument and the instruments. (a) Spectra obtained with the FOSS laboratory spectrometer. (b) Spectra obtained using the Hamamatsu C15713 spectroscopic module. (c) Spectra obtained using the Hamamatsu C15714 spectroscopic module. (d) Spectra obtained using the Phase-Photonics spectroscopic module.
Machines 11 00564 g004aMachines 11 00564 g004b
Figure 5. Prediction results obtained with the FOSS XDSTM OptiProbe Analyzer spectrometer.
Machines 11 00564 g005
Figure 6. Prediction results obtained with the MEMS-FPI C15713 spectroscopic module.
Machines 11 00564 g006
Figure 7. Prediction results obtained with the MEMS-FPI C15714 spectroscopic module.
Machines 11 00564 g007
Figure 8. Prediction results obtained with the combined spectra of the MEMS-FPI C15713 and C15714 spectroscopic modules.
Machines 11 00564 g008
Figure 9. Prediction results obtained with the NIR-Q spectroscopic module.
Machines 11 00564 g009
Table 1. Details of the portable spectroscopic modules analyzed.
ManufacturerDesignationSpectral RangeResolutionBuilt-In Lamp
HamamatsuC157131550–1850 nm20 nmTungsten
HamamatsuC157141750–2150 nm22 nmTungsten
Phase PhotonicsNIR-Q900–1700 nm6 nmTungsten
Table 2. Prediction results obtained with the FOSS XDSTM OptiProbe Analyzer spectrometer.
Prediction SamplesClassification Results
AksaDralon
A21.0000.000
A41.0000.000
A61.0000.000
A81.0000.000
A101.0000.000
A121.0000.000
A141.0000.000
A161.0000.000
A181.0000.000
A201.0000.000
D20.0001.000
D40.0001.000
D60.0001.000
D80.0001.000
D100.0001.000
D120.0001.000
D140.0001.000
D160.0001.000
D180.0001.000
D200.0001.000
Table 3. Prediction results obtained with the MEMS-FPI C15713 spectroscopic module.
Prediction SamplesClassification Results
AksaDralon
A21.0000.000
A40.0001.000
A60.0001.000
A81.0000.000
A100.0001.000
A120.0001.000
A141.0000.000
A161.0000.000
A181.0000.000
A201.0000.000
D20.0001.000
D40.0001.000
D61.0000.000
D81.0000.000
D100.0001.000
D120.0001.000
D140.0001.000
D160.0001.000
D180.0001.000
D201.0000.000
Table 4. Prediction results obtained with the MEMS-FPI C15714 spectroscopic module.
Prediction SamplesClassification Results
AksaDralon
A21.0000.000
A41.0000.000
A61.0000.000
A81.0000.000
A101.0000.000
A121.0000.000
A140.0001.000
A160.0001.000
A181.0000.000
A201.0000.000
D20.0001.000
D40.0001.000
D60.0001.000
D81.0000.000
D100.0001.000
D120.0001.000
D140.0001.000
D160.0001.000
D180.0001.000
D200.0001.000
Table 5. Prediction results obtained with the combined spectra of the MEMS-FPI C15713 and C15714 spectroscopic modules.
Prediction SamplesClassification Results
AksaDralon
A21.0000.000
A41.0000.000
A61.0000.000
A81.0000.000
A100.2000.800
A121.0000.000
A141.0000.000
A160.0001.000
A181.0000.000
A201.0000.000
D20.0001.000
D40.0001.000
D60.3000.700
D81.0000.000
D100.0001.000
D120.0001.000
D140.0001.000
D160.0001.000
D180.0001.000
D200.0001.000
Table 6. Prediction results obtained with the NIR-Q spectroscopic module.
Prediction SamplesClassification Results
AksaDralon
A21.0000.000
A41.0000.000
A61.0000.000
A81.0000.000
A101.0000.000
A121.0000.000
A141.0000.000
A161.0000.000
A181.0000.000
A201.0000.000
D20.0001.000
D40.0001.000
D60.0001.000
D81.0000.000
D100.0001.000
D120.0001.000
D140.0001.000
D160.0001.000
D180.0001.000
D200.0001.000
Table 7. Prediction results. Summary of the results obtained with the different spectrometers.
SpectrometerSpectral Range
[nm]
Resolution
[nm]
Misclassification Rate
Laboratory spectrometer1100–22000.50%
MEMS-FPI C157131550–18502035%
MEMS-FPI C157141750–21502215%
MEMS-FPI C15713 + C157141550–21502215%
NIR-Q900–170065%
Disclaimer/Publisher’s Note: The statements, opinions and data contained in all publications are solely those of the individual author(s) and contributor(s) and not of MDPI and/or the editor(s). MDPI and/or the editor(s) disclaim responsibility for any injury to people or property resulting from any ideas, methods, instructions or products referred to in the content.

