Abstract
With the development of intelligent tires, the tire pressure monitoring system (TPMS) has become a standard safety feature in cars. However, the existing TPMS has limited ability to monitor tire pressure in real time due to the passive power supply device’s low power output. This work presents a conceptual design for a novel energy harvester for TPMS (NEH-TPMS) based on a mechanical structure to recover energy. The motion of the mechanical structure is driven by the deformation of the tire in contact with the ground. The energy is recovered and released by a spiral spring to accomplish the functions of power generation and charging. Mathematical models are created based on the NEH-TPMS’s movements. The simulation results indicate that the NEH-TPMS’s power generation capacity is greater than that of existing energy harvesters and can satisfy the TPMS’s power supply requirements. This work uses finite element analysis and hierarchical analysis to optimize the shape of the NEH-TPMS. The parameters of the spiral spring are optimized using simulated annealing and genetic algorithms. NEH-TPMS has been enhanced to provide greater energy storage capacity. Finally, a prototype was built to verify the structure’s feasibility. The experimental results are consistent with the simulated results. This NEH-TPMS offers an efficient means of enhancing the power generation efficiency of the passive power supply device for TPMS.
1. Introduction
Based on the need for environmental protection and sustainable development, it is crucial to reduce the automotive industry’s energy consumption [1]. The main factors that affect the fuel consumption of automobiles include lightweight [2], engine thermal efficiency [3], hybrid technology [4], energy recovery systems [5], and coefficients of wind resistance [6]. Recovery of braking energy is an essential technology for energy recovery systems.
In addition to the braking energy recovery system, the intelligent tire also recovers energy from tire movement via the tire collector [7]. This technology not only decreases the energy waste of the vehicle and offers a green concept [8], but it also plays a crucial role in enhancing the vehicle’s road safety. The increase in the number of motor vehicles has led to a significant rise in traffic accidents. The tire is the only vehicle component that touches the road, and all road disturbances and forces act on the tire [9]. The utilization of tire sensors for instantaneous evaluation of tire pressure [10], temperature [11], and other characteristics can greatly improve the stability and safety of vehicles. The TPMS includes a monitoring module (used to collect and transmit pressure and temperature information), an energy emission device, and a central processing module. When the TPMS monitoring module is in sleep mode, the current consumption is approximately 0.21 mA. When it is in working mode, the current consumption is approximately 10 mA. The sleep mode lasts for approximately 2 s, and the working mode lasts for approximately 12 ms, during which the average current is 0.3 mA, the power supply voltage is 3 V, and the average power consumption is 0.9 mW. Each sensor has a battery that must be frequently updated or replenished [12]. Conventional active power supply technologies are inefficient, and the replacement procedure is tedious and harmful to the environment. This can be solved by employing the vibration and rotation of the tires to passively and automatically power the TPMS.
The primary principles of in-tire energy harvesting are piezoelectricity, electromagnetics, and electrostatics. The main principles involved in in-tire energy harvesting include piezoelectricity, electro-magnetics, and electrostatics. To incorporate piezoelectric materials into the tire, piezoelectric composites, piezoelectric ceramics, piezoelectric fibers, and similar materials are utilized [13,14,15,16]. According to the piezoelectric effect, when the tire is deformed, the piezoelectric material is distorted by the force to generate an electric field [17,18]. However, a significant reduction in material characteristics occurs concomitantly with the decrease in resonance frequency. In addition, fragile piezoelectric materials are poorly suited to their surroundings and are readily broken. Deng [19] et al. have proposed a triangular cantilever piezoelectric beam power production system utilizing the higher rotation and vibration frequencies of tires. The device obtains 42–437 μW of energy in the speed range of 40–120 km/h. It can handle the demand for low-power devices, but its reaction to low speeds is inadequate. Esmaeeli [20] et al. designed a rainbow-shaped piezoelectric energy harvester with a peak voltage of 9.7 V and a power of 5.85 W. Aliniagerdroudbari [21] et al. designed a new geometry of a strain-based piezoelectric energy harvester based on a cymbal-shaped piezoelectric energy harvester. The device was simulated and analyzed to have an output voltage of approximately 7 V and a power of approximately 5 mW. Electromagnetic energy recovery devices convert vibration energy into an induced voltage in a coil, which can be obtained by the relative movement of the coil, and the energy can be obtained by the relative movement between the coil and the magnet or by changing the magnetic field to produce a change in magnetic flux. Tornincasa et al. [22] proposed a cylindrical and compact electromagnetic collector that utilizes the moment of contact between the tire and the ground to generate a substantial acceleration, which in turn produces energy through the relative movement of the magnet and coil. Liu [23] et al. proposed, for the first time, a device that uses an iron-gallium alloy (magnetostrictive material) as the core material to harvest rotational vibration energy. The results showed that at an acceleration of 9.6 g and rotational speed of 90 r/min, the harvester can reach an output voltage of 1.22 V. Nonetheless, general electromagnetic energy recovery systems are huge and trending toward multi-energy compounding. Typically, electrostatic energy recovery systems necessitate an external bias voltage to function. Renaud [24] et al. presented a corrugated electret-based electrostatic energy harvester. When the tire turns, it causes the mass block to vibrate. This causes the electrical level charge to change, and the charge flows through a circuit to provide power. Experiments have shown that this device is capable of recovering between 10 and 50 µW under tire vibration excitation of energy. Naito [25] et al. developed an electrostatic energy harvester based on the inorganic insulator SiO2/Si3N4 thin film to be used as an electrostatic energy harvester for electret materials. The device has an output of 60 mW under the impact vibrations inside the tire tread.
Due to factors such as tire condition and air tightness environment, the monitoring module of a passive TPMS typically uses technologies such as magnetic induction, radio frequency coupling, or self-power supply for information transmission. RFID is the most common contactless power transmission technology. Ho [26] et.al utilized the RFID technique to achieve the power supplement and the data transmission. As the vehicle moves forward, the responder embedded in the tire rotates and connects with the tire. The responder embedded in the tire rotates and couples with the receiver coil. At the same time, power and data transmission also take place during this process. The simulation reveals that when running at a speed of 10 km per hour, the duration of VDD being greater than 3 V is longer. However, when running at 30 km per hour, VDD will never be greater than 3 V. It can be seen from this that the energy provided by this method is limited and inefficient. Moreover, its effective range is short, and it is susceptible to electromagnetic interference. It is worth noting that Marti [27] et al. designed a battery-free near field communication (NFC) tag, which integrates a pressure sensor placed between the bicycle tire and inner tube. The system does not use a battery as the energy comes from the magnetic field induced by the reader to establish communication. The experiments showed that the device maintains a stable 3 V output at a distance of 8 mm from the outer surface of the tire to the card reader. However, the device carries the risk of puncturing the bicycle tire. Additionally, the TPMS in cars requires a specific reader to transmit information to the vehicle’s control system, which is not applicable to this device.
In addition, mechanical energy can also be converted into electrical energy through nanoscale frictional generators, known as triboelectric nanogenerators (TENGs). Mao [28] et al. designed an innovative single-electrode TENG (S-TENG), and simulation results showed that it achieved a maximum instantaneous power of 1.79 milliwatts, with a load resistance of 10 MΩ. Tani [29] et al. developed a triboelectric nanogenerator (TENG) for smart tires, which generated a voltage of approximately 14 V after the tire rotated for 15 min at a speed of 16 km per hour. Friction-based nanogenerators are relatively environmentally friendly, and they can generate high voltages, but the current generated is very weak. Friction also generates heat, which causes a loss of energy and affects the efficiency of the nanogenerators. Moreover, the nanoscale mechanical components are prone to wear and tear, which can impact their lifespan and performance. Without addressing these issues, it is difficult for nanoscale frictional generators to serve as stable power sources for TPMS.
Compared to most other power generation devices and methods, the NEH-TPMS has a higher voltage and power output, ensuring enhanced safety on the road. It is mounted between the wheel hub and the inner tire surface. The tire’s deformation under pressure drives the mechanical structure, which collects and releases energy to power the generator. Moreover, the energy storage element is inserted to store electrical energy. The power supply target of NEH-TPMS is the sensors in the tire pressure monitoring system. The sensors in the tire pressure monitoring system typically require low voltage and current to operate due to their need for extended, reliable operation inside the wheel. Specifically, the voltage of the sensors is typically between 1.8 V and 5 V, while the current ranges from 1 mA to 10 mA. The NEH-TPMS has a high power generation capacity and efficiency, and the excess energy can be stored in a rechargeable battery. To evaluate the efficiency of the NEH-TPMS, a mathematical model is developed based on the NEH-TPMS’s movements. By simulation analysis, the effect of device parameters on power generation is explored, and tests are created to further validate the outcomes.
2. Mechanical Design
The NEH-TPMS’s design is made up of a mechanical structure design and an electrical circuit design. The mechanical structure is designed to convert the linear motion generated when the tire is pressed against the ground into rotational motion that generates torque. This results in the rotation of the generator, which generates electricity. The energy storage and release mechanism of the spiral spring is utilized. This design approach aims to generate electricity for a certain period of time, even when the tires are not under pressure, thereby increasing the efficiency of the unit’s power supply. The basic goal of circuit design is to convert voltage in both positive and negative directions into voltage in the same direction, and to charge the battery.
2.1. Structural Design
As illustrated in Figure 1, the primary components of the NEH-TPMS are an elastic steel pipe, tension rope, generator, protective housing, rotating cylinder, planetary gear, positioning cylinder, coupling, four-point contact ball bearings, shaft, and spiral spring. The NEH-TPMS is mounted between the wheel hub and the tire’s inner surface. Six sets of restraint plates are attached to the hub’s outer surface. As indicated in Figure 2, the protective housing is attached between two restraint plates. A dowel pin connects one end of the elastic steel pipe to the outer surface of the hub and the other end to the inner surface of the tire. The shaft is fixedly attached to the middle of the rotating cylinder, with tension ropes wound around the outside. The ends of the rope slide through the protective housing and are fixed to the ends of the elastic steel pipes. One end of the spiral spring is attached to the exterior of the rotating shaft, while the other end is attached to the interior of the rotating cylinder. The positioning cylinder is inserted into the inner ring of the four-point contact ball bearing. One end of the positioning cylinder is linked to the generator, while the other end is fastened to the central gear output shaft of the planetary gear.
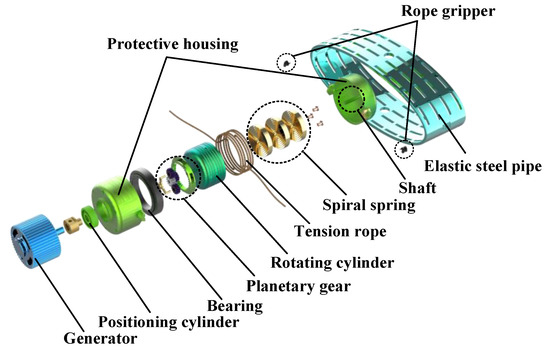
Figure 1.
Components of the NEH-TPMS.
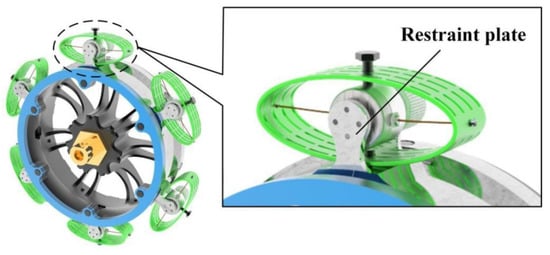
Figure 2.
Installation position of the NEH-TPMS.
2.2. Working Principle
As illustrated in Figure 3, when the tire contacts the ground, it compresses the elastic steel pipe, causing tension on both sides of the rope. This tension produces a pair of force couples that drive the rotating cylinder in a clockwise direction, which in turn drives the shaft. The spiral spring, attached to one end of the shaft, tightens as it is pulled. Once the tire is no longer in contact with the ground, the elastic steel pipe and spiral spring are returned to their initial positions, allowing the rotating cylinder to rotate counterclockwise. During repetitive tire rotation, the elastic steel pipe is continuously squeezed and then regains its deformation. The rope is repeatedly stretched and then relaxed. The repeated clockwise and counterclockwise rotations of the rotating cylinder cause the generator’s rotor to rotate continuously, cutting through magnetic lines of induction and generating electricity.
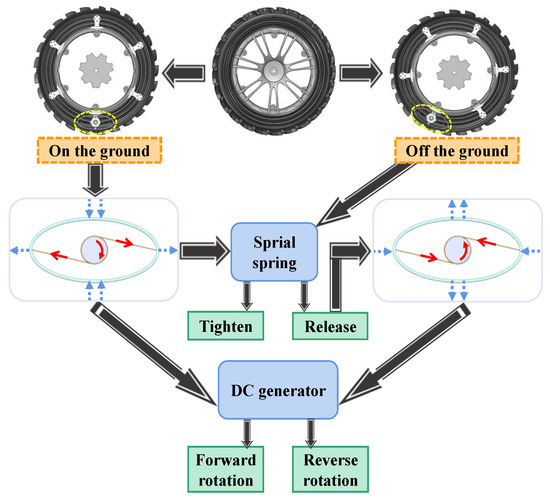
Figure 3.
Working principle of the NEH-TPMS.
The flexibility of the spiral spring increases the take-up and take-down effect of the tension rope, hence enhancing the energy collection efficiency. The generator’s sinusoidal electricity is rectified to produce a sinusoidal waveform in the same direction. After passing through an inductor and capacitor for filtering, a waveform with less voltage variation is obtained. The filtered signal is routed into the voltage regulator chip to generate direct current, which is then connected to the charging chip to charge the battery and store the power. This helps to meet the power requirements of the in-tire sensors for data transfer in real-time and provides real-time power to the sensor when the tire stops rotating. This prevents the sensor from being without power for extended periods, allowing it to continuously monitor the tire’s condition for longer periods. The circuit processing flow is shown in Figure 4.
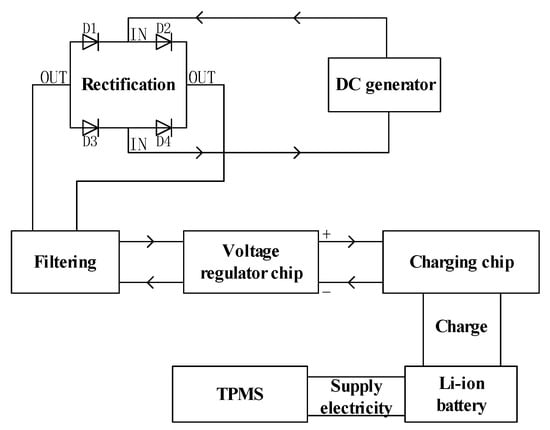
Figure 4.
Circuit processing flow.
3. Theoretical Models and Parameter Influence Laws
This section presents a detailed analysis of the device’s movement process, which comprises four key components. Mathematical models have been developed to facilitate quantitative analysis of each component. The first section focuses on the tire deformation model, which explains how the tire gets distorted immediately after it comes into contact with the ground. The second section deals with the process of converting the linear motion of the tire into the rotating motion of the transmission mechanism, involving the storage of energy by spiral springs. The generation of generators is discussed in the third section. The fourth section involves the regulation of the generator’s raw voltage to direct current, followed by the charging of the battery and storage of electrical energy. Through the construction of the mathematical models described above, it becomes possible to gather crucial evaluation data such as the device’s generation capacity and energy storage efficiency.
3.1. Tire Deformation Model
The models used to describe tire dynamics include the fixed imprint model and the finite element model [30]. If factors such as temperature, pressure, and velocity are taken into account, the tire deformation model becomes nonlinear. The focus of this section is to determine the rules for tire deformation size, deformation speed, and acceleration, which provide guidance for the lightweight design of the device and the selection of components. Therefore, numerical accuracy requirements are relatively low. The accurate value of the maximum displacement of tire deformation can also be obtained through measurement. Compared to energy harvesters such as piezoelectric devices, the NEH-TPMS is a mechanically structured energy harvester that is more reliable in motion and less affected by temperature and pressure. Nonlinear models, such as finite element models, have higher accuracy but require longer computing time and are mainly used for tire design rather than vehicle dynamics calculations. Therefore, the fixed imprint model [30], which is linear, is used in this section. This approach not only presents the changing rules of the target variables well but also reduces a large number of computations. The fixed imprint model assumes that the length of the ground contact patch remains constant during vehicle motion, and the tire is supported by uniform vertical stiffness and damping elements along the contact patch [31].
The maximum tire deformation variable can be expressed as Equation (1):
where denotes the maximum tire deformation variable, is the single tire load, and is the vertical stiffness of tire.
Using the geometric relationship depicted in Figure 5, the circumferential angle corresponding to the length of the tire’s contact surface with the ground can be expressed as follows:
where is the tire radius.
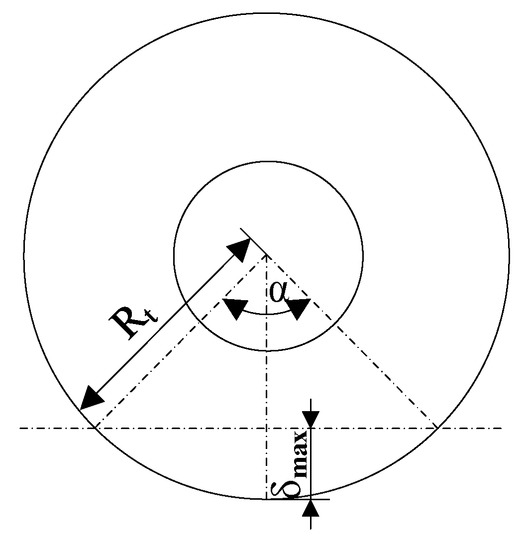
Figure 5.
Geometry of tire-ground contact.
The NEH-TPMS operates during the time period from the generation of deformation to the recovery of the tire back to its original shape. The NEH-TPMS does not function when the tire is not in touch with the ground, and the deformation recovers. Hence, a segmented representation of the tire’s variables is necessary. The relationship between the cycle time of wheel rotation, , the NEH-TPMS work time, , the vehicle speed, , and the tire deformation variable, (i.e., the elastic steel pipe deformation variable), is given:
The velocity, , and acceleration, , of the tire deformation can be obtained by differentiation:
The tire type selected for this work is , and its parameters are listed in Table 1. An individual tire load of 4500 N, a vertical tire stiffness of 225,000 Nm, and a vehicle speed of 50 km/h are assumed. As depicted in Figure 6a, the aforementioned equation was simulated in MATLAB to produce an image of tire deformation variable in relation to time. The maximum tire deformation variable is 0.02 mm, and the wheel rotation cycle time is 0.1357 s. As shown in Figure 6b,c, the peak velocity of the tire deformation (i.e., the device’s compression deformation) is . The maximum acceleration is , which varies with wheel rotation. Due to the heavy load on the wheels, the moment of contact between the tire and the ground results in a significant impact and a fast change in speed and acceleration. In ideal conditions, the gadget operates for approximately 0.02 s per cycle and intermittently with the rotation of the wheel. This places stringent requirements on the durability and portability of the NEH-TPMS’s components.

Table 1.
Tire parameters.
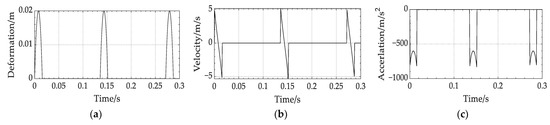
Figure 6.
Simulation results for tire deformation model: (a) Relationship between tire deformation variables and time; (b) Relationship between tire deformation speed and time; (c) Relationship between tire deformation acceleration and time.
3.2. Torque Transfer and Spiral Spring Energy Storage Model
The elastic steel pipe is compressed in the vertical radial direction and stretched in the horizontal radial direction when the tire makes contact with the ground. Therefore, the rope is under tension. Utilizing the ANSYS LS-DYNA module [32], the process of pulling the rope is simulated. Board 1 represents a pressurized tire in contact with the ground. The cylindrical body imitates the rotating cylinder and the structure of transmission. Board 2 simulates the hub of the wheel. It is assumed that the tire’s contact area with the ground is rectangular. The following equation describes the relationship between the tire’s radius, , the length of the rectangular contact, , and the tire deformation variable, :
because , Equation (9) can be obtained:
This yields an area of for Board 1 in contact with the elastic steel pipe when the tire deforms to a maximum of 2 cm.
Nylon is utilized for tension ropes, whereas structural steel is utilized for the elastic steel pipe. After dividing the meshes and setting the constraints, the step size, time, and downward load for Board 1 are adjusted according to the deformation and period variation laws derived from Equations (1)–(5). It should be noted that a displacement of 0.02 m relative to the elastic steel pipe of the NEH-TPMS constitutes a “large deformation”. This is a nonlinear problem. Therefore, it is necessary to turn on the “large deformation” switch in ANSYS. A new stiffness matrix is regenerated at each iteration to improve calculation accuracy. Figure 7 shows a portion of the process.
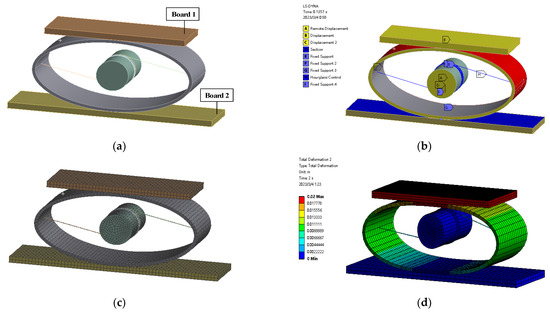
Figure 7.
Part of the finite element simulation processes: (a) Simplify the model; (b) Set constraints; (c) Divide grids; (d) Perform simulation.
The relationship between the tension of the rope and time is shown in Figure 8. In 0.008 s, the tire deformation reaches its maximum value. Thus, the rope’s pulling force grows first and reaches a maximum of 190.8 N. The following expression is given:
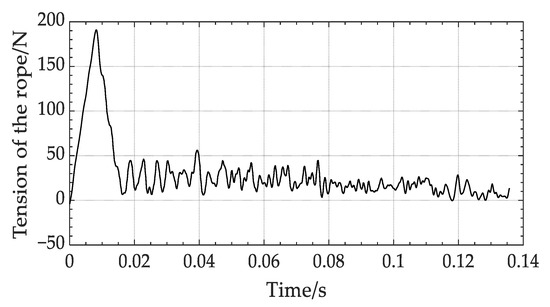
Figure 8.
Relationship between the tension of the rope and time.
At 0.008 s to 0.0169 s, the tire progressively separates from the ground. The tire deformation returns to zero, and the tension force reduces. During the remainder of a cycle, the motion performance of the wheel varies, and there are different impacts between the tire and the ground at different points. This causes the pull force to fluctuate, generating a certain resistance to the energy released from the spiral spring. Consequently, it is advantageous to reduce the tension value during the NEH-TPMS’s non-working time to improve the energy storage effect and power-generating efficiency. Each end of the rope’s pulling force corresponds to a pair of force couples. Torque is generated through the rotation of the cylinder and shaft. Momentum is numerically equal to torque. The shaft imparts torque to the spiral spring, causing it to contract and store energy. When the tire leaves the ground, the spiral spring is released and generates a torque in the opposite direction, satisfying the following relationship:
where presents the diameter of the rotating cylinder (i.e., the distance between the force couples), is the maximum output torque of the spiral spring, is the stiffness factor of the spiral spring, is the number of revolutions during spiral spring recovery, is the moment of inertia of the cross-sectional area of the spring, and is the angular displacement function of the rotation of the spiral spring:
where is the angular displacement.
The selected material for the spiral spring is 55 CrMnA, whose parameters are detailed in Table 2. The spiral spring’s end is secured to the shaft. An infinitesimally small spring unit, , is taken along the spring’s length, . The deformation energy of the spiral spring within the unitary body is . When the effective length of a spiral spring is equal to the entire length of the curve, , the spring’s deformation energy, , is derived by integrating it throughout the entire length of the curve. After achieving its maximum deformation, the spiral spring releases its stored energy and pushes the shaft in a counterclockwise direction [33]. The equation below describes the energy of a spiral spring:
Table 2.
Spiral spring parameters.
Figure 9a illustrates the simulation conducted in MATLAB using the aforementioned equation. In a single cycle, the torque grows, then falls, then increases in reverse, then decreases again, eventually reaching a maximum value of 9544 Nm. The spiral spring is subjected to torque, which causes it to tighten and store a peak energy of 29.15 J. At this point, the tension rope turns the cylinder and shaft, which are also revolving. When the spiral spring is twisted as tightly as possible, its speed gradually increases to a maximum of 2642 r/min. As the tire leaves the ground, the spiral spring begins to deplete its stored energy until it reaches zero, propelling the shaft in the other direction. At the present time, the maximum speed is 2027 r/min. The spiral spring has an energy storage capacity of 76.72%. Figure 9b,c illustrates the relationship between spiral spring energy, shaft speed, and time.
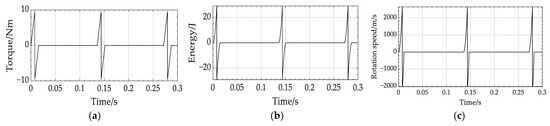
Figure 9.
Simulation results of the torque transfer and spiral spring energy storage model: (a) Relationship between torque and time; (b) Relationship between spiral spring energy and time; (c) Relationship between haft speed and time.
3.3. Micro-Generator Model
The above-described mechanical movement mechanism drives the micro-generator. The NEH-TPMS converts the kinetic energy of mechanical movement into electrical energy. The prime mover sets the rotor of the generator in motion, and the motion of the cutting magnetic field creates a counter potential in the copper wires of the armature winding. An armature current flows when an external circuit is connected to the ends of the motor winding. The mechanical motion equations are as follows:
where denotes the motor rotational inertia, is the torque output from the prime mover and the mechanical torque on the generator shaft, and is the motor electromagnetic torque, which is expressed as follows:
where is the motor torque constant and is the motor winding current. The voltage equation is as follows:
where represents the motor winding inductance, is the motor winding counter potential, is the motor winding resistance, and is the motor winding terminal voltage. The motor winding counter potential, , expression is:
where denotes the back electromotive force constant and is the mechanical speed of the motor rotor.
The selected device for this work is a miniature DC permanent magnet generator. The load resistor used in this work is 30 , which is approximately the same as the internal resistance of the micro-generator. The model of the micro-generator was simulated with MATLAB/Simulink. The relationship between the speed and time in Figure 9c was input to obtain an image of the micro-generator voltage with time, as shown in Figure 10. During the squeezing of the NEH-TPMS, the generator generates power in a positive direction. When the maximum deformation is reached, the voltage peaks at 13.28 V. The NEH-TPMS recovers from the deformation, and the spiral spring releases its stored energy, causing the shaft to rotate in the opposite direction and the generator to produce electricity in the opposite direction. Finally, the positive and negative voltage in both directions is rectified to convert the voltage to a single direction.
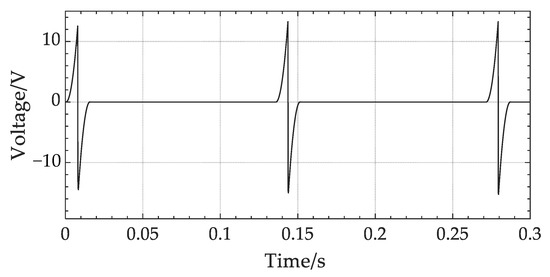
Figure 10.
Simulation result for generator voltage.
3.4. Steady-State Voltage and Li-Ion Battery Charging Model
It is assumed that the initial speed and current of the generator are zero. If the prime mover rotates the generator, the generator shaft accelerates and a counter potential is generated in the armature winding. If both ends of the winding are linked to a circuit, the armature winding produces current and the generator produces electromagnetic torque. Currently, the electromagnetic torque is less than the mechanical torque of the primary mover. The motor shaft continues to accelerate, while the armature winding counter-potential continues to rise. The winding terminal voltage and current continue to increase until the mechanical torque and generator electromagnetic torque are of equal magnitude. The generator operates at a constant speed and achieves steady-state operation. In steady-state operation, the counter potential, terminal voltage, and current of the armature windings are stable. With the mechanical movement, there are various frictional losses, iron consumption, and eddy current losses in the generator windings.
Because the mechanical torque of the input prime mover is not constant, the speed is variable, resulting in a variable counter potential and end voltage. The variable DC generator output voltage results in dangers and losses. To ensure consistent DC generator power, a large capacitor filter must be connected in parallel to both ends of the DC generator. With the inclusion of the capacitor filter circuit, the output waveform transforms smoothly, and the output voltage rises proportionally. When the load resistance is infinite, there is no discharge channel and the capacitor’s voltage does not decrease. The discharge time decreases as the load resistance decreases.
The capacitor is charging when the voltage at the generator end is greater than that at the capacitor end. When the generator’s voltage is less than the capacitor’s voltage, the capacitor is discharged through the load, releasing energy to the load. This is repeated to obtain a steady DC voltage at the load. The voltage of the generator is then adjusted, as depicted in Figure 11. Ten time cycles are selected, and the voltage is stabilized between 14 V and 16 V. The average power generation remains stable at around 0.6 W.
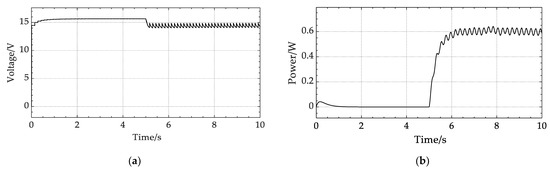
Figure 11.
Simulation results after voltage regulation: (a) The relationship between time voltage; (b) The relationship between power and time.
Changes in resistance value caused by temperature and internal chemical processes are ignored. A resistor with a constant value, , is employed to equalize the ohmic and polarization resistances. The resistor, , has dissipated all losses within the battery as heat. In other words, the battery is analogous to a huge capacitor and resistor connected in series. The expression for the state of charge, , is then as follows.
where is the battery current. Discharge is positive and charge is negative. is the battery capacity.
The NEH-TPMS generates more voltage than the lithium battery for constant voltage or constant current charging of the lithium battery; a Buck circuit [34], as depicted in Figure 12, is necessary.
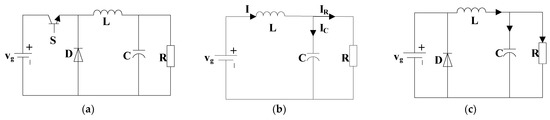
Figure 12.
Analysis of Buck converters and the operating states: (a) The Buck converters; (b) Switch in on state ; (c) Switch in off state .
The trigger pulse controls whether the switching tube is on or off. Varying switching times result in distinct duty cycles, which in turn give distinct output voltages. Simultaneously, the switching tube is on and a reverse voltage is applied to the diode, simulating a break. The power supply serves the load, while the inductor continually stores energy. The switching tube is turned off, and the inductor supplies the load with energy. The current is maintained by the diode. Due to capacitance’s role in the process, the voltage at both ends of the load produces a specific charging and discharging process. It is assumed that the inductor is sufficiently large, meaning that the current is continuous.
When the Buck converter reaches steady state, the expression is as follows:
where represents the inductor voltage and is the control time. This results in the following relational equation:
where denotes the duty cycle, is the input voltage, and is the output voltage. The steady-state voltage transfer ratio can be expressed as Equation (22):
If switching losses are omitted, the input and output power balance of the Buck converter has the following equation:
where represents the input current and is the output current. Thus, the following relationship is obtained:
The simulation results show that the battery starts charging from the fifth second. As demonstrated in Figure 13a, because the generating voltage is unstable, the battery voltage and current are likewise unstable following the Buck circuit. The charging battery voltage swings by approximately 1.4 V, which is detrimental to the battery. As shown in Figure 13b, a capacitor is therefore connected in parallel at both ends of the battery to absorb the ripple and obtain the charging voltage. The charging voltage is constant at approximately 11.82 V, and the ripple fluctuates within a range of 0.065 V up or down. At this moment, the battery is no longer harmed by the charging voltage, which has become more stable. The changes in charging current and SOC are depicted in Figure 13c,d.
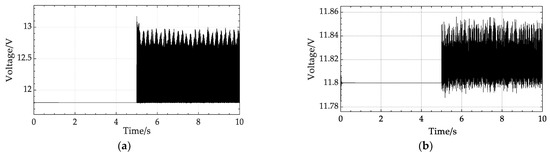
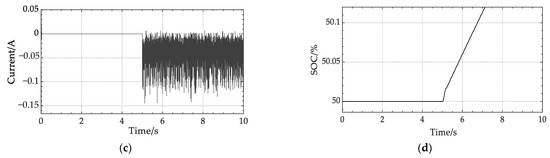
Figure 13.
Simulation results for steady-state voltage and li-ion battery charging model: (a) Relationship between battery voltage and time before parallel capacitors; (b) Relationship between battery voltage and time with capacitors connected in parallel; (c) Relationship between battery current and time; (d) Relationship between battery SOC and time.
Table 3 summarizes the values of voltage and average power for several different types of energy harvesters. NEH-TPMS has a similar or slightly larger mass and volume compared to the other harvesters. From the table, it can be seen that NEH-TPMS has higher peak voltage and average power. The average power has reached several hundred milliwatts. Although its peak voltage is not as high as that of TENG, it does not suffer from the same drawback of having too small a current, sometimes as low as a few milliamperes. As shown in Figure 13c, NEH-TPMS has a stable output voltage and a current that is not too small, even during the typical driving speeds of a car.
Table 3.
Comparison of power generation capacity for energy collectors.
4. Optimal Design of NEH-TPMS
The tension imposed by the elastic steel pipe on the tension rope when the NEH-TPMS is compressed in the tire is a crucial factor in determining the quantity of power generated by the generator. Consequently, the influence on power generation can be investigated by altering the shape of an elastic steel pipe subjected to the same pressure. The optimal shape of the elastic steel pipe is determined by combining multiple parameters, such as the NEH-TPMS’s lightweight and the subsequent mechanical transmission’s efficiency. When the generator is reversed, the energy storage capacity and storage efficiency of the spiral spring determine the size and efficiency of the power generation. This is mostly determined by the spiral spring’s composition and size. This chapter focuses on optimizing the size of the spiral spring to increase the energy storage efficiency of spiral springs, thus improving the efficiency of power generation.
4.1. Elastic Steel Pipe
Three types of flexible steel pipes that have uniform width, height, and downward pressure distance across their sections were designed. The steel pipes come in three different shapes, referred to as Shape 1, Shape 2, and Shape 3. The rounded corners of the three shapes of steel pipes gradually decrease in size at the connection with the pulling rope, as shown in Figure 14.
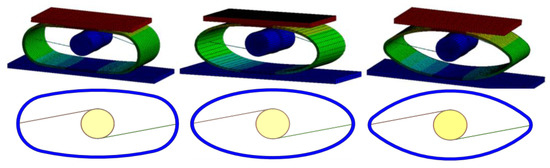
Figure 14.
Three different shapes of elastic steel pipes.
The graphics in Figure 15 were generated from simulations conducted using ANSYS. In the initial stage of tire deformation, the three shapes exert comparable pulling forces. However, at maximum deformation, Shape 1 exerts a pulling force of 196.4 N, while Shape 2 and Shape 3 exert pulling forces of 190.80 N and 172.8 N, respectively. The drawing force induced by the rope increases as the angle of rounding between the rope and the steel pipe increases. As the tire recovers its deformation, the pulling force of Shape 2 gradually returns to zero. However, Shape 1 and Shape 3 generate greater oscillation, which poses a greater barrier to the spiral spring’s release.
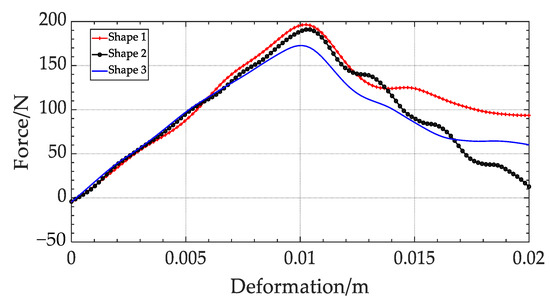
Figure 15.
Comparative results for rope tension.
The shape of the elastic steel pipe must be selected with consideration for the pipe’s quality. The tensile force on the rope after deformation under pressure and the quantity of resistance generated during the recovery of the deformation must also be considered. It is essential to ensure that the spiral spring can release energy in the opposite direction in a stable manner. As demonstrated by the above analysis, the greater the strain on the rope, the higher the shaft speed and the larger the power produced by the generator. However, a lower resistance is better for the spiral spring to release energy in the opposite direction, increasing the shaft speed and generating more power in the opposite direction. As demonstrated by the study in Section 3.1, the NEH-TPMS should be constructed as light as feasible while taking into account the first two parameters. This is a multi-factor, comprehensive, semi-qualitative, and semi-quantitative selection and ranking problem. Hence, a hierarchical analysis is used to analyze three shapes of flexible steel pipes and determine the best appropriate pipe shape. There is an assumption that the evaluation criteria outlined in the text are reasonable. The factors considered are, in order, the mass of the steel pipe, the resulting tension, and the resulting resistance, creating the hierarchy diagram shown in Figure 16. The first layer is the target layer, where the optimal shape of the flexible steel pipe is chosen. The second layer for the three factors evaluated is the criterion layer. The third layer is the solution layer, which consists of Shapes 1, 2, and 3.
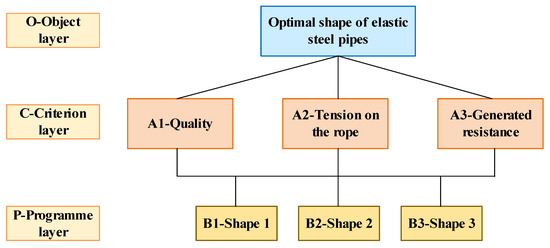
Figure 16.
Hierarchy diagram for selecting elastic steel pipe shapes.
4.1.1. Construction of the Comparison Matrix
Based on the assumptions, a two-by-two comparison matrix, , of the criterion layer C to the target layer O is constructed:
Comparison matrix is shown in Equation (25):
Comparison matrix is shown in Equation (26):
Comparison matrix is shown in Equation (27):
4.1.2. Calculation of the Weight Vector and Consistency Test for Hierarchical Single Ranking
The maximum eigenvalue, , of matrix is compared, which corresponds to the normalized eigenvector :
With the consistency indicator, , and the stochastic consistency indicator, , the consistency ratio, , can be obtained by Equation (30):
This indicates that passes the consistency test.
For the pairwise comparison matrix, , , , the weight vector of the total hierarchical ranking can be found and tested for consistency, as shown in Table 4.
Table 4.
Calculation results of the third level to the second level.
4.1.3. Calculation of the Hierarchical Total Ranking Weights and Consistency Tests
The weights assigned to the overall objectives are shown in Equation (31):
Similarly, the weights of and on the total objective are 0.609 and 0.232, respectively, so that the weight vector of the decision level on the total objective is as follows:
The result of the consistency test is shown in Equation (33):
The overall hierarchical ranking passes the consistency test and may be used as the final criterion. The weight ordering of the options is , so the final decision should be Shape 2.
4.2. Optimal Design of the Spiral Spring
4.2.1. Mathematical Model
The thickness, width, length, core diameter, and spring box diameter of the spiral spring are taken as the decision variables, which can be expressed as follows:
The NEH-TPMS’s motion parameters vary drastically, and its light weight is the primary optimization target. Likewise, the energy stored in the spiral spring determines the NEH-TPMS’s power generation efficiency. Based on a uniform energy storage density, a light mass, and a small volume, the objective function of the spiral spring is consequently to obtain the highest amount of stored energy. The volume of the spiral spring is divided into a solid volume and a space volume. The solid volume can be expressed as Equation (35):
The space volume can be expressed as Equation (36):
It follows that it is a multi-objective optimization problem. The three objective functions are , , and . The weighting factors are and . The objective function is given:
Constraint 1: The spiral spring is installed on the rotating cylinder. One end is attached to the rotating cylinder’s inner surface, while the other end is attached to the shaft. The size of the springs is listed in Table 5.
Table 5.
Range of dimensions for spiral springs.
The expression for Constraint 1 can be shown in Equation (38):
Constraint 2: The torque generated by the tension rope pulling the rotating cylinder and the shaft rotation shall be less than the limit torque of the spiral spring. As a result, the following relationship can be obtained:
The expression for Constraint 2 can be shown in Equation (39):
Constraint 3: The number of active working turns of the spiral spring is 5.
The expression for the inner diameter, , of the spring coil when the coil is loose is given as:
The expression for the outer diameter, , of a spring coil wound on an arbor is as follows:
The expression for the number of turns, , in the un-torqued state of the spiral spring is as follows:
The expression for the number of turns, , of the spiral spring wound on the mandrel is as follows:
The expression for the number of effective working turns, , of a spring is as follows:
where is the effective coefficient. The expression for Constraint 1 can be shown in Equation (46):
4.2.2. Intelligent Algorithmic Design
For optimizing the aforementioned models, both simulated annealing and genetic algorithms are employed [31]. The simulated annealing approach is founded on the resemblance between the solids annealing process and a broad combinatorial optimization problem. It extends the local search algorithm, and it can select with a certain probability the state in the domain where the objective function’s value is reasonably high to approximate the global optimal solution. The solution to a problem is represented by genetic algorithms as an evolutionary process of “chromosomal” survival of the fittest. By selection, crossover, and mutation, the development of this population from generation to generation converges on the ‘best-adapted’ individual. This results in the best possible solution to the problem. Table 6 displays the structure of the two algorithms.
Table 6.
Simulated annealing algorithm and genetic algorithm design process.
4.2.3. Solutions of the Model
MATLAB was used to program the answer for the aforesaid model and algorithm. Figure 17 depicts the goal function as a function of the number of iterations. The ideal solution of the procedure for simulated annealing is as shown below:
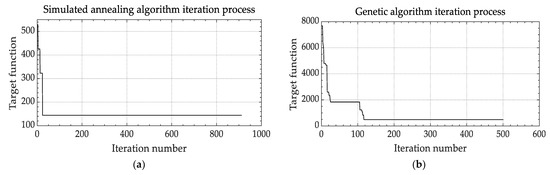
Figure 17.
Iteration results: (a) Simulated annealing algorithm iteration result; (b) Genetic algorithm iteration result.
The optimal solution of the genetic algorithm is as follows:
The optimal solutions of the two algorithms and the initially given parameters are brought into Equation (14). Figure 18 depicts the image of the energy storage of the spiral spring. The evolutionary algorithm-based optimal solution yields a peak energy storage of 73.66 J. The algorithm for simulated annealing yields a peak energy storage of 63.38 J for the ideal parameters of the spiral spring. This is a substantial increase in comparison to the energy storage before optimization. The ideal option found by the evolutionary algorithm enhances the energy storage capacity of the spiral spring by almost a factor of 2.5.
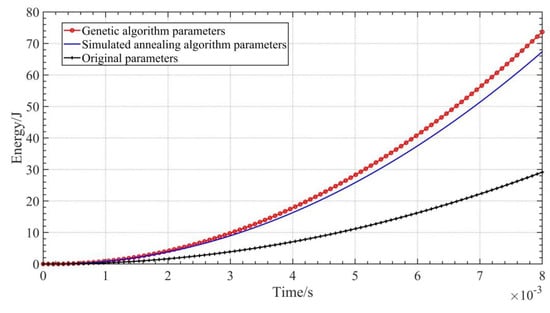
Figure 18.
Comparison of energy storage in spiral springs.
5. Experimental Verification
The purpose of this experiment is to verify the feasibility of the structural design principle and to investigate whether the power generation of the prototype can meet the simulation requirements. Therefore, under the premise of obtaining the rules of parameter changes, the experiment is designed with low cost and easy operation as much as possible. There are three simplified schemes for the experimental design, and the reasons are as follows:
- (1)
- In the concept design of NEH-TPMS, the elastic steel pipe will undergo deformation in both vertical and horizontal directions due to the load of the tire, and the load of the car is usually large. By placing weights to simulate the tire load, the experiment becomes more convenient and easier to operate.
- (2)
- As an important energy storage and transmission component in the concept design of NEH-TPMS, the coil spring is scaled up proportionally based on the optimized size in Section 4.2 for ease of production and replacement.
- (3)
- During the operation of the device, the material of the elastic steel pipe has high requirements and needs to be easy to deform while maintaining a certain stiffness and fatigue strength. Considering the cost, a lifting structure that can achieve both vertical and horizontal movements is used to replace the elastic steel pipe’s deformation process.
The experimental setup, as shown in Figure 19, mainly consists of the NEH-TPMS prototype, a voltage and current acquisition module, and a display module. The structure of the NEH-TPMS prototype is shown in Figure 20. Initially, the weight is placed on the load table. A force gauge is also supplied for recording the weight’s specific gravity. The object exerts downward pressure on the load table, simulating the process of a tire being compressed by the earth. At this stage, the lifting structure is compressed vertically and stretched horizontally, replicating the process of elastic steel pipe deformation under pressure. This pulls the rope, which turns the shaft. Simultaneously, the spiral spring is tightened to begin storing energy while the generator produces power. After the load is removed, the load table returns to its original location, restoring the length of the lifting structure to its original value. The energy released by the spiral spring propels the generator to produce electricity in reverse.
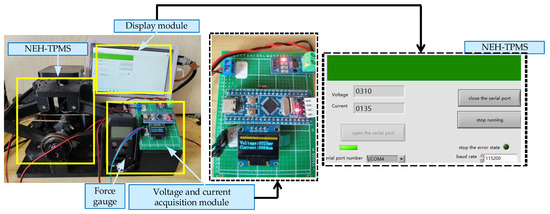
Figure 19.
Experimental device.
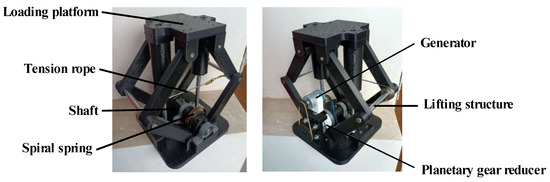
Figure 20.
NEH-TPMS prototype.
The voltage and current acquisition module mainly collects voltage through the ADC circuit and current through current sensors. Due to the opposite direction of motion during the lifting and lowering processes of the lifting mechanism, there are two voltage polarities. The acquisition module only collects the voltage generated during the descent process of the lifting mechanism. During this process, the generator rotates in the forward direction, generating positive voltage. Finally, the upper computer is designed to display the measured values of voltage and current on the computer screen.
The horizontal displacement distance of the lifting structure was adjusted, while all other variables were kept constant. This replicates the variation in horizontal displacement distance caused by the application of pressure to various geometries of elastic steel pipes. This results in variations in the resulting tension, shaft torque, and the amount of power generated by the generator. The process of positive power generation is chosen to evaluate the device’s power generation based on the voltage of the generator. The horizontal displacement ranges between 0 mm and 1.6 mm. Figure 21 displays the outcomes. More power is generated when the horizontal displacement of the lifting mechanism of the experimental gadget increases. When horizontal displacement reaches 1.6 mm, the generator voltage is 0.87 V. The simulation results correspond to the alteration of the experimental structure’s appearance, and the simulation value is marginally greater than the experimental value. The generator’s simulated voltage at 1.6 mm horizontal displacement is greater than 1 V.
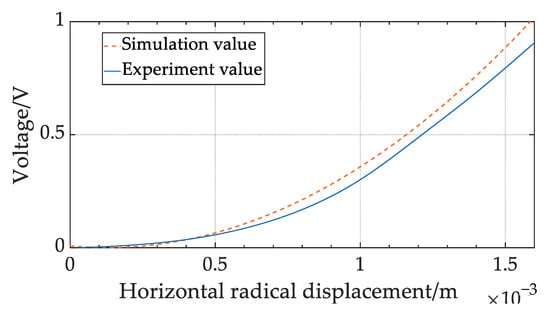
Figure 21.
Comparison of experimental results with simulation results.
However, this experiment also has certain limitations:
- (1)
- The loading of weights cannot simulate the instantaneous compression of the device by the tire, and the simulation of the tire’s movement speed is lacking.
- (2)
- There is a lack of research and validation on the material selection and processing technology of the elastic steel tube.
- (3)
- The prototype’s size and weight are larger than the ideal design and can only verify the numerical law. There is also some room for improvement in the accuracy of the data.
The above limitations will affect the adaptability of the device to the tire in practical use. For example, when facing different types of cars and tire models, the optimized size parameters of the device will also be different. The fixation method and tightness between the device and the hub and tread surface also need to be further analyzed and researched. At the same time, the effects of different driving speeds, loads, and road roughness on the predicted lifespan and wear rate of the components will also have some impact. In reality, the impact generated by the contact between the tire and the ground is constantly changing in magnitude, which poses a significant challenge for the use of components.
To address the above limitations, this work proposes the following improvements:
- (1)
- The NEH-TPMS will be further designed to be lightweight. Currently, the simulated annealing algorithm and genetic algorithm are used to optimize the helical spring to achieve the best energy storage effect in the smallest volume possible. This approach can reduce the weight of the device and improve its adaptability when installed in vehicles. However, other components also need to be optimized, and materials need to be carefully considered.
- (2)
- The dynamic balance of the device during tire movement will be considered. As the vehicle continues to move, additional mechanical loads are added to the transmission. Over time, this can cause wear and reduced efficiency. Therefore, further analysis of the dynamic balance of the device is necessary.
- (3)
- Real-world testing will be conducted. Long-term and extensive practical test data will be collected to better evaluate the practicality of the device.
Overall, the focus of this experiment was to verify the feasibility of the concept design in principle. The simplified approach used in the experiment makes it convenient to operate, the structure easy to produce, and the cost relatively low. However, there are also some limitations that require further research in future work.
6. Conclusions
This work proposes a novel energy harvester to achieve the passive and efficient power supply function for tire pressure monitoring systems. Under the continuous and repetitive operation of the tire, the elastic steel pipe is continuously compressed and returned to its former shape, and the rotor is driven to revolve following the forward and reverse rotation of the rotating cylinder to generate power from the generator. This assists in meeting the power needs of the tire sensors. The spiral spring is continuously stretched and contracted. After the elastic deformation happens and the force disappears, the spiral spring’s stored spring force is released, and the spring returns to its initial state. The flexibility of the spiral spring can be employed to increase the efficiency of energy collecting and power generation by enhancing the effect of pulling and releasing the rope. To explore the effect of numerous elements on the efficiency of power generation and energy storage, mathematical models were constructed to replicate the movement of the tires. After optimizing the design, it was verified by tests. The following conclusions were obtained.
- (1)
- At a tire load of 4500 N/m and a speed of 50 km/h, the original generator’s output voltage peaks at 13.28 V. The average power generation remains stable at approximately 0.6 W. The battery is charged and the voltage is stabilized at roughly 11.82 V after voltage stabilization. The spiral spring has a peak energy storage capacity of 29.15 J and an energy storage efficiency of 76.72%. Due to the enormous instantaneous impact of the tire’s contact with the ground, the device’s lightweight and durability are of more significance.
- (2)
- Using finite element analysis, the shape of the elastic steel pipe is optimized. The simulation reveals that the tension rope exerts a stronger pulling force the larger the rounded angle of the connection between the tension rope and the steel tube. There is no discernible correlation between the size of the fillet and the amount of resistance generated when the device operates in reverse. Using hierarchical analysis to compare the weights of the three sets of designs presented in this thesis, Shape 2 was determined to be the best option.
- (3)
- Using a simulated annealing technique and a genetic algorithm, the parameters of a spiral spring are tuned. The optimal solution of the genetic algorithm calculates a greater energy storage capacity than the simulated annealing approach and boosts the spiral spring’s energy storage capacity by a factor of approximately 2.5.
- (4)
- The experimental device simulates the elastic steel pipe through a lifting mechanism. As the horizontal displacement of the lifting mechanism increases, more power is generated. The simulation results are consistent with the experimental results. This experiment effectively verifies the feasibility of the NEH-TPMS conceptual design in principle.
- (5)
- Compared to other passive power supply devices, this NEH-TPMS generates significantly more energy. The energy storage efficiency is high and can support a real-time tire pressure monitoring system. NEH-TPMS requires high material properties for important components such as elastic steel pipes and tension ropes. During tire motion, the forward and backward power generation processes become more complicated. Resistance of the tension rope, the gravity of the rotating cylinder, and other components affect the generating efficiency.
- (6)
- In practice, the temperature and pressure of tires can change at any time. Compared with friction-based nanogenerators and piezoelectric energy harvesters, the mechanical structure-based energy harvester is more reliable and less affected by temperature and pressure. Under different road conditions and driving conditions of vehicles, instantaneous impact forces or long-term cyclic alternating forces will be generated, which will cause wear or damage to the components. Therefore, it is crucial to conduct dynamic balance analysis, stress analysis, fatigue strength analysis, and testing of the components. Compared with other forms of energy harvesters, NEH-TPMS is more prone to increase the rolling resistance of the tire to a certain extent, which affects the tire performance and service life. This is also the reason why lightweight design has been emphasized. In the future, NEH-TPMS will mainly face the following challenges: Firstly, to achieve lightweight design to the maximum extent while ensuring a certain service life and working efficiency. Secondly, to ensure that the device has good adaptability to different environments, road conditions, and vehicle motion processes.
- (7)
- The components of NEH-TPMS are relatively common. However, due to the special working environment, the material requirements for elastic steel tubes and torsion coil springs, as well as the processing technology requirements for the entire device, are high, making it difficult to use at a low cost. However, with the popularity of tire pressure monitoring systems, the demand for accessories related to passive tire pressure systems will increase. After continuous optimization and testing, when the technology is mature and widely used, the cost will gradually decrease. In this process, the combination sales strategy with TPMS sensors is also crucial.
- (8)
- NEH-TPMS uses the deformation of elastic steel pipes to convert the compression of the tire into the power transmitted by the device, rather than relying on mechanical transmission forms such as gears and racks. This is conducive to reducing wear and better adapting to sudden braking of the vehicle or instant impact on rough road conditions. This work optimizes the design of NEH-TPMS to minimize its weight and volume while ensuring maximum power generation. This makes it easier to install NEH-TPMS in the tire and reduces the resistance generated by additional mechanical structures.
This work offers a solution for increasing the efficiency of passive power supply units for tire pressure monitoring systems and the ability to significantly improve the current power supply problem for tire pressure monitoring systems.
Author Contributions
Conceptualization, Z.Q. and W.L.; methodology, W.L.; software, W.L.; validation, Z.Q. and W.L.; formal analysis, S.-K.L.; investigation, W.L.; resources, Z.Q.; data curation, Z.Q.; writing—original draft preparation, W.L.; writing—review and editing, Z.Q.; visualization, W.L.; supervision, Z.Q.; project administration, S.-K.L.; funding acquisition, Z.Q. and S.-K.L. All authors have read and agreed to the published version of the manuscript.
Funding
This work was supported by the Natural Science Foundation of Shandong Province under Grant ZR2022QE085, the Regional Leading Research Center of NRF and MOCIE (NRF-2019R1A5A8083201) & the Basic Science Research Program through the NRF of Korea funded by the MEST (NRF-2023R1A2C1003691).
Data Availability Statement
Not applicable.
Conflicts of Interest
The authors declare no conflict of interest.
References
- Zeng, X.N.; Sun, X.Q.; Zhao, F. Energy-saving intelligent manufacturing optimization scheme for new energy vehicles. Int. J. Emerg. Electr. Power Syst. 2022, 23, 913–926. [Google Scholar] [CrossRef]
- Lewis, A.M.; Kelly, J.C.; Keoleian, G.A. Vehicle lightweighting vs. electrification: Life cycle energy and GHG emissions results for diverse powertrain vehicles. Appl. Energy 2014, 126, 13–20. [Google Scholar] [CrossRef]
- Chung, I.C.; An, Y.K.; Park, J.; Lee, J.; Ji, Y. Analysis of Engine Efficiency of Diesel Vehicle in Transient Operating Conditions. Int. J. Automot. Technol. 2021, 22, 941–947. [Google Scholar] [CrossRef]
- De Pinto, S.; Mantriota, G. Power Flows in Compound Transmissions for Hybrid Vehicles. Machines 2019, 7, 19. [Google Scholar] [CrossRef]
- Wang, Y.L.; Zhang, H.T.; Sun, Y.T. Vibration Energy Recovery System of Vehicle Suspension Based on Ultrasonic Sensor. Therm. Sci. 2022, 26, 2335–2348. [Google Scholar] [CrossRef]
- Hu, W.Y.; E, J.Q.; Leng, E.W.; Zhang, F.; Chen, J.W.; Ma, Y.J. Investigation on harvesting characteristics of convective wind energy from vehicle driving on multi-lane highway. Energy 2023, 263, 62. [Google Scholar] [CrossRef]
- Seo, J.; Jhang, K.Y.; Lee, H.; Kim, Y.C. Vibration energy harvesting technology for smart tire monitoring. J. Mech. Sci. Technol. 2019, 33, 3725–3732. [Google Scholar] [CrossRef]
- Kuncoro, C.B.D.; Sung, M.F.; Adristi, C.; Permana, A.F.; Kuan, Y.D. Prospective Powering Strategy Development for Intelligent-Tire Sensor Power Charger Application. Electronics 2021, 10, 1424. [Google Scholar] [CrossRef]
- Breglio, G.; Irace, A.; Pugliese, L.; Riccio, M.; Russo, M.; Strano, S.; Terzo, M. Development and Testing of a Low-Cost Wireless Monitoring System for an Intelligent Tire. Machines 2019, 7, 49. [Google Scholar] [CrossRef]
- Wei, L.T.; Wang, X.Y.; Li, L.; Yu, L.; Liu, Z.J. A Low-Cost Tire Pressure Loss Detection Framework Using Machine Learning. IEEE Trans. Ind. Electron. 2021, 68, 12730–12738. [Google Scholar] [CrossRef]
- Zhang, J.H.; Wang, C.; Xie, X.L.; Li, M.; Li, L.; Mao, X.L. Development of MEMS composite sensor with temperature compensation for tire pressure monitoring system. J. Micromech. Microeng. 2021, 31, 125015. [Google Scholar] [CrossRef]
- Brancati, R.; Tufano, F. Indirect Estimation of Tire Pressure on Several Road Pavements via Interacting Multiple Model Approach. Machines 2022, 10, 1221. [Google Scholar] [CrossRef]
- Yi, Z.R.; Yang, B.; Zhang, W.M.; Wu, Y.D.; Liu, J.Q. Batteryless Tire Pressure Real-Time Monitoring System Driven by an Ultralow Frequency Piezoelectric Rotational Energy Harvester. IEEE Trans. Ind. Electron. 2021, 68, 3192–3201. [Google Scholar] [CrossRef]
- Jeon, D.H.; Cho, J.Y.; Jhun, J.P.; Ahn, J.H.; Jeong, S.; Jeong, S.Y.; Kumar, A.; Ryu, C.H.; Hwang, W.; Park, H.; et al. A lever-type piezoelectric energy harvester with deformation-guiding mechanism for electric vehicle charging station on smart road. Energy 2021, 218, 8. [Google Scholar] [CrossRef]
- Zhao, Z.; Zhang, B.F.; Li, Y.X.; Bao, C.J.; Wang, T. A novel piezoelectric energy harvester of noncontact magnetic force for a vehicle suspension system. Energy Sci. Eng. 2023, 11, 1133–1147. [Google Scholar] [CrossRef]
- Wang, Y.; Zhong, Z.Y.; Liu, Y.J.; Jin, X.L.; Peng, Y.; Luo, J.; Yang, J. Energy collection generator based on electrostatic conversion mechanism. J. Sci.-Adv. Mater. Devices 2022, 7, 100505. [Google Scholar] [CrossRef]
- Du, C.; Liu, P.F.; Yang, H.L.; Jiang, G.F.; Wang, L.B.; Oeser, M. Finite Element Modeling and Performance Evaluation of Piezoelectric Energy Harvesters with Various Piezoelectric Unit Distributions. Materials 2021, 14, 1405. [Google Scholar] [CrossRef]
- Wei, C.; Jing, X. A comprehensive review on vibration energy harvesting: Modelling and realization. Renew. Sustain. Energy Rev. 2017, 74, 1–18. [Google Scholar] [CrossRef]
- Deng, L.; Qi, J.; Fang, Y.; Wang, D.; Wu, B.; Wen, Z. Design and optimization of a trapezoidal beam array energy harvester with operating wide speed rang for TPMS application. Microsyst. Technol. 2019, 25, 2869–2879. [Google Scholar] [CrossRef]
- Esmaeeli, R.; Aliniagerdroudbari, H.; Hashemi, S.R.; Nazari, A.; Alhadri, M.; Zakri, W.; Mohammed, A.H.; Batur, C.; Farhad, S. A rainbow piezoelectric energy harvesting system for intelligent tire monitoring applications. J. Energy Resour. Technol. 2019, 141, 062007. [Google Scholar] [CrossRef]
- Aliniagerdroudbari, H.; Esmaeeli, R.; Hashemi, S.R.; Alhadri, M.; Zakri, W.; Farhad, S. A piezoelectric sandwich structure for harvesting energy from tire strain to power up intelligent tire sensors. In Proceedings of the 2019 IEEE Power and Energy Conference at Illinois (PECI), Champaign, IL, USA, 28 February–1 March 2019; pp. 1–7. [Google Scholar]
- Fu, H.; Mei, X.; Yurchenko, D.; Zhou, S.; Theodossiades, S.; Nakano, K.; Yeatman, E.M. Rotational energy harvesting for self-powered sensing. Joule 2021, 5, 1074–1118. [Google Scholar] [CrossRef]
- Liu, H.; Dong, W.; Chang, Y.; Gao, Y.; Li, W. Working characteristics of a magnetostrictive vibration energy harvester for rotating car wheels. Rev. Sci. Instrum. 2022, 93, 055001. [Google Scholar] [CrossRef]
- Jia, Y. Review of nonlinear vibration energy harvesting: Duffing, bistability, parametric, stochastic and others. J. Intell. Mater. Syst. Struct. 2020, 31, 921–944. [Google Scholar] [CrossRef]
- Naito, Y.; Uenishi, K. Electrostatic MEMS Vibration Energy Harvesters inside of Tire Treads. Sensors 2019, 19, 890. [Google Scholar] [CrossRef]
- Wu, L.J.; Zhang, X.M.; Yu, X.; Ding, X.Y.; Chi, C.J. A Battery-less Tire Pressure Monitoring System. In Proceedings of the 1st International Conference on Connected Vehicles and Expo, Beijing, China, 12–16 December 2012; pp. 222–225. [Google Scholar]
- Boada, M.; Lazaro, A.; Villarino, R.; Gil-Dolcet, E.; Girbau, D. Battery-Less NFC Bicycle Tire Pressure Sensor Based on a Force-Sensing Resistor. IEEE Access 2021, 9, 103975–103987. [Google Scholar] [CrossRef]
- Mao, Y.; Geng, D.; Liang, E.; Wang, X. Single-electrode triboelectric nanogenerator for scavenging friction energy from rolling tires. Nano Energy 2015, 15, 227–234. [Google Scholar] [CrossRef]
- Tani, H.; Sugimoto, M.; Fushihara, K.; Nakano, Y.; Lu, R.; Koganezawa, S.; Tagawa, N. Harvesting Energy Using Triboelectric Nanogenerator Mounted inside Rolling Tire. Sens. Mater. 2020, 32, 2539–2549. [Google Scholar] [CrossRef]
- Hamersma, H.A.; Els, P.S. Vehicle suspension force and road profile prediction on undulating roads. Veh. Syst. Dyn. 2021, 59, 1616–1642. [Google Scholar] [CrossRef]
- Liu, X.; Yu, L.; Zheng, S.; Chang, J. An Innovative Design of In-Tire Energy Harvester for the Power Supply of Tire Sensors; No. 0148-7191; SAE Technical Paper: Warrendale, PA, USA, 2018. [Google Scholar]
- Zhang, Y.Q.; Cui, Q.L.; Li, H.B.; Zhang, Z.Y.; He, Y.Q.; Sun, D. Simulation and test of cutting mechanical characteristics of millet stalk based on ANSYS/LS-DYNA. INMATEH-Agric. Eng. 2020, 61, 143–150. [Google Scholar] [CrossRef]
- Yu, Y.; Wang, M.Y.; Zhang, R.F.; Mi, Z.Q.; Zheng, X.M. Power Coordinated Control and Parameter Analysis for Spiral Spring Energy Storage Systems Based on Backstepping Control Under Current Vector Orientation. Front. Energy Res. 2022, 10, 11. [Google Scholar] [CrossRef]
- Jamshidpour, E.; Jovanovic, S.; Poure, P. Equivalent Two Switches and Single Switch Buck/Buck-Boost Circuits for Solar Energy Harvesting Systems. Energies 2020, 13, 16. [Google Scholar] [CrossRef]
- Elfrink, R.; Matova, S.; de Nooijer, C.; Jambunathan, M.; Goedbloed, M.; van de Molengraft, J.; Pop, V.; Vullers, R.J.M.; Renaud, M.; van Schaijk, R.; et al. Shock induced energy harvesting with a MEMS harvester for automotive applications. In Proceedings of the IEEE International Electron Devices Meeting (IEDM), Washington, DC, USA, 5–7 December 2011. [Google Scholar]
- Li, C.; You, F.; Yao, T.; Wang, J.; Shi, W.; Peng, J.; He, S. Simulated annealing particle swarm optimization for high-efficiency power amplifier design. IEEE Trans. Microw. Theory Tech. 2021, 69, 2494–2505. [Google Scholar] [CrossRef]


Disclaimer/Publisher’s Note: The statements, opinions and data contained in all publications are solely those of the individual author(s) and contributor(s) and not of MDPI and/or the editor(s). MDPI and/or the editor(s) disclaim responsibility for any injury to people or property resulting from any ideas, methods, instructions or products referred to in the content. |
© 2023 by the authors. Licensee MDPI, Basel, Switzerland. This article is an open access article distributed under the terms and conditions of the Creative Commons Attribution (CC BY) license (https://creativecommons.org/licenses/by/4.0/).