Abstract
To study the ability of shaped charges to penetrate typical ship targets, two shaped charges with the same diameter of 200 mm but different configurations are designed to generate two forms of jetting projectile charge (JPC). Based on the protective structure of typical ship targets, static penetration tests are performed using the two types of a shaped charge with copper liner and 10-layer spaced targets with a total span of 16 m which is made in 921A steel. Numerical simulations under the same working conditions are also carried out. It is found that the simulation results of the penetration depth and the number of layers of target perforated by the JPC are much greater than the experimental results. In fact, the JPC breaks up when moving to a certain distance, and the JPC segments after breakup have a transverse drift velocity, causing the segment to deviate from the original penetrating channel. The influence of drift velocity after JPC fracture cannot be considered in numerical simulation, resulting in significant differences between numerical simulation and experimental results. Thus, this paper proposed a segment-based numerical simulation method and analyzed the penetration process of JPC fragments after JPC fracture. Combined with experimental results, the radial motion after JPC fracture and the final distribution of penetration holes can be well revealed. It is found that the penetration depth and the number of layers of target perforated by the JPC depend on the tip velocity of each segment and the jet length.
1. Introduction
Spaced targets are common protective configurations in typical ship armor protection. The air layer between the target plates is called the target gap. During the penetration of a damaged element, because of the existence of the gap, the stress wave cannot be transmitted from the first target to the next one; cratering will occur many times accompanied by the loading and unloading of pressure in this process, greatly increasing the energy loss of the jet element and thus improving the anti-penetration capability of the spaced targets.
To achieve greater penetration depth and better hole enlargement effect for multi-layer targets with large spacing, the jetting projectile charge (JPC), which is also a rod-like jet or a rod penetrator, is usually employed for penetration. It is a kind of shaped charge between a shaped charge jet (SCJ) and an explosively formed projectile (EFP). Compared with the conventional SCJ, JPC has the advantages of insensitivity to stand-off distance and large aftereffect, while compared with EFP, it has faster flight velocity, longer length, and greater cross-sectional specific kinetic energy [1]; similar to SCJ, JPC will stretch and have a velocity gradient in the penetration process; jet breakup and transverse drift will occur, affecting the penetration results, and under large stand-off distances, their influence on the JPC’s damage effectiveness becomes more prominent.
Many scholars have studied the factors affecting jet breakup. To study the breakup modes of the shaped charge jet, CURTIS J.P. [2] developed an axisymmetric model of the growth of disturbances on the free surface of a shaped charge jet. L.A. Romero [3] presented a stability analysis of a rapidly stretching jet satisfying the equations of motion for a perfect plastic material. It was found that the stability of the jet depends on a dimensionless parameter that measures the importance of the inertial forces relative to the plastic forces. In addition, Hutchinson, J. W. studied the influence of material properties on the necking behavior during the rapid expansion of plane strain through a nonlinear analysis for long-wavelength nonuniformities [4]. Research efforts have been devoted to the stability of shaped charge jets of stretched plastic from different aspects. The theoretical model of shaped charge jet breakup and the basis for judging its stability are explored. Parameters, such as critical wavelength and the fragment shape index, were presented [5,6,7,8]. In the area of numerical simulation research, Petit, Jacques, and KARLSSON H.E.V. have carried out a computer simulation study of the stretching and breakup of a concentrated shape charge jet and investigated the effect of grid size on the dispersion of the jet’s microelements [9,10].
In the study of the transverse drift of the jet, a model for calculating the distribution of the angle by which the jet segments’ direction of movement deviates from the shaped charge axis of symmetry was presented by E. Hirsch. The tumbling frequency of the segments as a function of their velocity and final length was also predicted by the theory [11]. Rottenkolber et al. [12] found that drift velocities due to breakup are more than an order of magnitude smaller than transverse velocities caused by other imperfections and asymmetries. Kelly et al. [13] described an analytic model which predicts the jet velocity at the transition point between a coherent and incoherent state based on several test results using conventional shaped charge materials.
In terms of spaced targets, the interaction of the Whipple shields package against the shaped charge jet has been widely studied [14,15]. O. Svirskii et al. [16] discussed the penetration capability of shaped charges at stand-off distances up to 100 charge diameters which by far exceeded the standard area of their application (2 to 7 CD). Horsfall [17] used commercially available shaped charges of 33 mm charge diameter to assess the effects of spaced RHA armor on shaped charge wartip penetration in terms of penetration depth into a semi-infinite steel witness stack.
Furthermore, many researchers have studied the weakening effect of jet breakup on continuous penetration [18,19,20]. However, the phenomena of jet breakup and drift during SCJ penetration, especially in the case of penetrating multi-layer targets with large spacing have been rarely discussed, and the relevant penetration theories are yet to be enriched. Therefore, based on previous research, this paper analyzes the process of JPC penetrating multi-layer targets with large spacing using experimental and numerical simulations and discusses the influencing factors of the penetration process. The penetration test of a large-caliber-shaped charge is performed, and the experimental results of the penetration hole diameter and penetration depth are given. A new segment-based simulation method is proposed for the analysis of the breakup and drift of the JPC segments or rod penetrators. Then the simulation results are compared with the experimental results of JPC penetrating multi-layer targets with large spacing to verify the accuracy of the numerical method.
2. Numerical Simulation Model
To obtain two forms of JPCs, two different types of shaped charges are designed whose structural difference is with and without wave shaper. The wave shaper in a shaped charge can change the detonation wave shape and collapse angle, and its existence can improve the jet velocity and the velocity gradient from the jet tip and tail to some extent [21,22,23].
Composition JH-2 was used for explosives; it is described by the Jones–Wilkins–Lee state equation, and the parameters are shown in Table 1. OFHC Cu was used for the liner; 921A steel was used for targets; Both of them are described by the JOHNSON_COOK material model and GRUNEISEN state equation, and the parameters are shown in Table 2 and Table 3.

Table 1.
The parameters of JH-2.

Table 2.
The parameters of OFHC Cu.

Table 3.
The parameters of 921A Steel.
Figure 1 shows two shaped charges with different configurations. The charge diameter and height are both 200 mm, and the liners have a sub-hemispherical shape with variable wall thickness which is thick at the top and thin at the bottom, aiming to produce a rod-like jet with a velocity gradient.
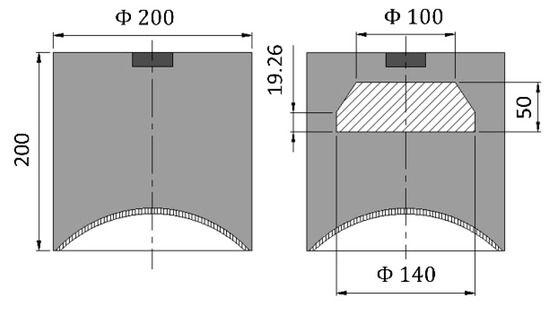
Figure 1.
Configuration of the Shape Charge.
To conveniently obtain the parameters of jet tip and tail velocities, velocity gradient, radius, and relative position during JPC stretching and penetration, the whole process is numerically simulated using finite element analysis code AUTODYNA-2D. Considering the geometric characteristics, loading, and boundary conditions of the calculation model, the axisymmetric model is adopted for calculation to improve computational efficiency. The typical JPC formation simulation model is presented in Figure 2. Since large deformation behavior exists in the process, the explosive, liner, and air are meshed by the Eulerian algorithm, whereas the Lagrangian mesh is used for the targets. The boundary condition for air is set to “Flow-out (ALL EQUAL)” to eliminate the influence of the boundary effect. The materials of the liner, explosive, target plate, and wave shaper are red copper, 8701 explosive, 921A steel, and phenolic resin, respectively.
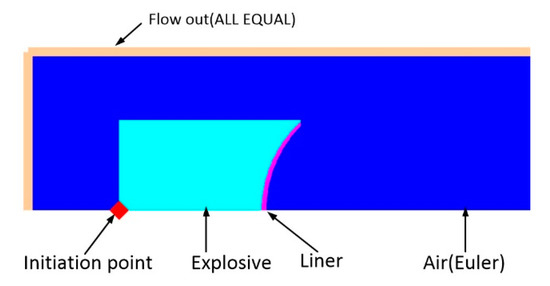
Figure 2.
Numerical models of JPC (1/2).
2.1. JPC Formation and Stretching
The jet is impacted and extruded at the axis, and the tip velocity increases to the maximum velocity. As the spherical detonation front reaches the liner top, the liner starts collapsing. The detonation pressure drives the liner to keep turning and deforming. The whole liner collapses on the axis, and the jet velocity reaches the peak. At this time, the inside of the metal at the liner top has been turned to the outside and became the jet tip. Later, due to the velocity difference between the tip and tail, the jet continues to stretch and becomes thinner. The two charges with different configurations generate two forms of JPC. JPC-1 comes from the shaped charge without a wave shaper and JPC-2 from the one with a wave shaper. The velocity contours of the two JPCs are shown in Figure 3.
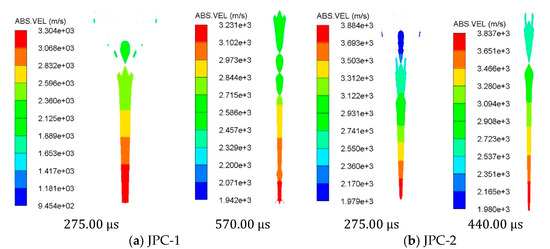
Figure 3.
Velocity contours of JPC formation.
It can be found that the JPC stops stretching at about 275.00 , and the tip velocity of the JPC from the charge without wave shaper is 3281.3 m/s and that of the JPC from the charge with wave shaper is 3882.1 m/s. Both the JPCs become two parts after stretching. The main penetrating part with high velocity at the front is the jet section, and the slug at the tail has a low velocity of about 2000 m/s which does not influence the subsequent penetration, so the velocity and penetrating power of the slug is not considered in this paper. The curve and velocity contours of the JPCs are shown in Figure 4. As illustrated, the velocity gradient of the JPC is remarkably smaller than that of the conventional SCJ; the jet can penetrate a large mass, and the slug mass accounts for about 10% of the whole JPC so that more jet micro-elements can participate in the penetration; moreover, the JPC is approximately linearly distributed along the axis; the velocity gradient between the tip and tail of the JPC formed by the charge without wave shaper is about 900 m/s, and the diameters of the jet head and tail are about 15 mm and 36 mm; at 275 , the length of the JPC is 298.2 mm; the velocity gradient between the tip and tail of the JPC formed by the charge with wave shaper is about 1574 m/s, the diameters of the jet tip and tail are about 7 mm and 34 mm, and at 275 , the JPC length is 379.1 mm.
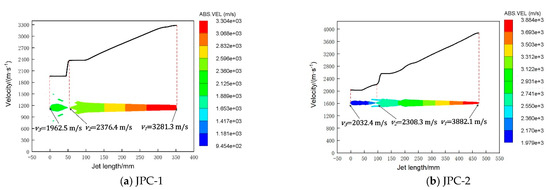
Figure 4.
Velocity distribution along the axis of JPCs at t = 275.00 .
Due to the different tip velocities and velocity gradients of the JPCs, their breakup time also differs. From the simulation results, the JPC-2 tip velocity is increased due to the existence of a wave shaper, its velocity gradient, and length are also increased, and its jet section is more slender compared with that of JPC-1 (without wave shaper), so JPC-2’s tensile breakup time is earlier, and its necking and breakup occurs at 440.00 ; JPC-1’s breakup time is about 590 .
2.2. Numerical Simulation Analysis of the Penetration of JPCs into Spaced Targets
To further examine the penetration capability of the JPCs into multi-layer targets with large spacing, 10 spaced targets with different thicknesses and a total span of 16 m (80 CD) are arranged in this study. The thicknesses of the spaced targets are 28 mm, 12 mm, 16 mm, 12 mm, 8 mm, 8 mm, 8 mm, 8 mm, 8 mm, and 100 mm successively. The total thickness of the first nine targets is 108 mm, and the 10th target is the aftereffect target with a thickness of 100 mm. The spacing between the targets is set to 1.5 m, 4.0 m, 1.5 m, 1.5 m, 1.5 m, 1.5 m, 1.5 m, 1.5 m, and 1.5 m in turn. The target material is 921A steel, and the stand-off distance of the shaped charge is 800 mm (4 CD). The penetration simulation is performed for the JPCs formed by the two charges with different configurations. The schematic drawing of the JPC penetrating multi-layer spaced targets is shown in Figure 5.

Figure 5.
Spaced targets arrangement.
The processes of the JPCs penetrating into the multi-layer spaced targets are shown in Figure 6. To reduce the calculation time, the targets are successively added to the test, and calculation is conducted to the overall penetration process. The targets are numbered according to their sequence of being perforated by the JPC.
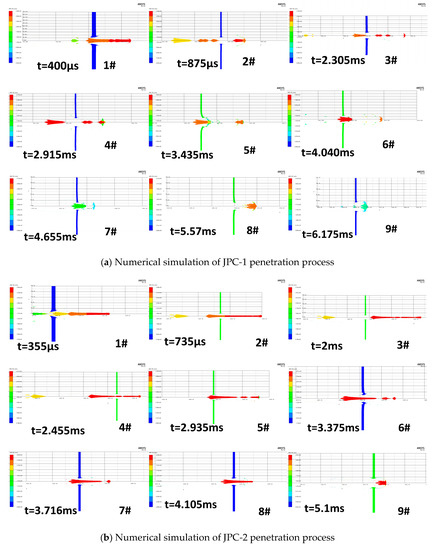
Figure 6.
Penetration process of the two JPCs.
As can be seen in Figure 6, the state of the JPC during penetration is stretching while penetrating. After breaking up at a certain time, the broken jet particles are not deflected and do not have any transverse velocity, so that all the broken jets can still penetrate in the same penetrating channel. In the numerical simulation, both the JPCs from the two charges with different configurations complete the penetration into the 9-layer spaced targets and then still have some residual penetration capabilities, so the calculation continues for the aftereffect target. The penetration results of the two JPCs are presented in Figure 7. Finally, on the aftereffect target, the penetration depth of the JPC-1 is 42 mm, and the penetration hole diameter is 90 mm; the penetration depth and hole diameter of the JPC-2 are 81 mm and 78 mm, respectively.
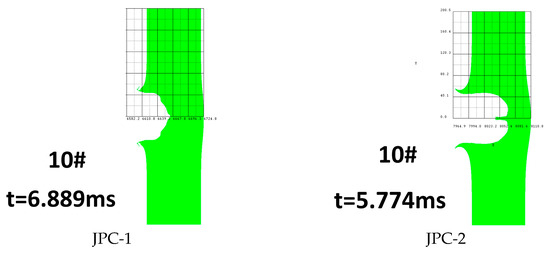
Figure 7.
Aftereffect target.
The penetration simulation results of the two shaped charges with different configurations are listed in Table 4. Both the two JPCs have penetrated into the 9-layer spaced targets, and then still have certain aftereffects. JPC-2 (with wave shaper) has higher tip velocity, and its penetration depth is greater than that of JPC-1, so the presence of wave shaper seems to be more conducive to the penetration process, but at the same time, the diameter of the JPC-2 is smaller, the hole diameter is smaller, and its velocity gradient is larger compared to the case of not using wave shaper. The larger tip-tail velocity difference leads to the earlier occurrence of jet necking and breakup. Therefore, it is necessary to verify the simulation results through experiments and do further analysis.

Table 4.
Comparison of simulation results of the JPCs formed by the two charges with different configurations.
3. Experimental Studies
3.1. Test Setup
To verify the simulation results, the experiments of the two shaped charges with different configurations penetrating into multi-layer spaced targets discussed in the previous section are carried out. The shaped charges, the thickness of the targets, and their spacing in the test are the same as those in the numerical simulation. The experimental setup is shown in Figure 8. In addition, for each round of projectile in the test, the first four targets are all equipped with velocity-measuring targets to measure the flight velocity of the JPCs and the behind-target residual velocities.
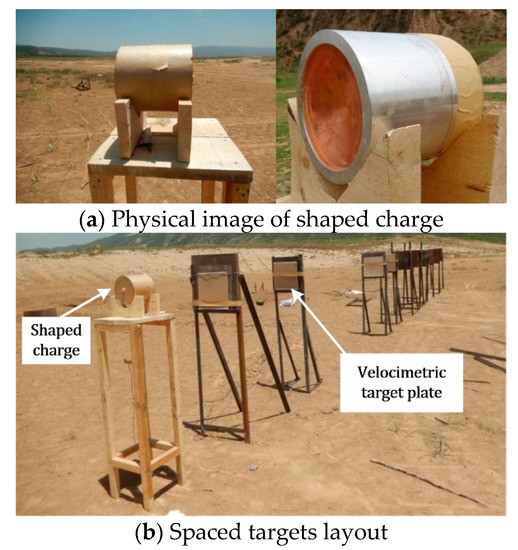
Figure 8.
Test site arrangement.
The test setup of JPCs penetrating spaced targets is illustrated in Figure 9. The selection and arrangement of the test items are in line with the test scheme. The shaped charge is placed on the shell holder and the target plate is on the target carrier. During the test, it shall be ensured the central axes of the shaped charge, target plates, and velocity measuring target are all located on the horizontal line 1500 mm above the ground, so before the test, a spirit level shall be used for this purpose.
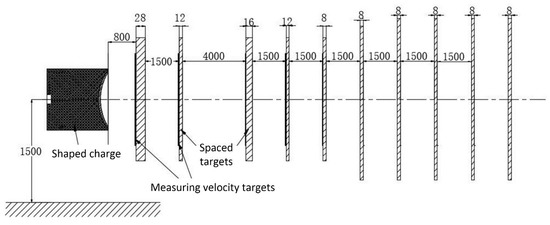
Figure 9.
Schematic diagram of the JPC penetrating spaced targets.
3.2. Experimental Results
The statistical analysis of the penetration hole diameter and distribution on the spaced targets after the two experiments are presented in Figure 10 and Figure 11 and Table 5. From the perforations, except for a small amount of collapsed jet, in the two cases, all the JPC passes through the same holes. In addition, the first three holes have good coaxials, the size of the main hole in each target is also large, and the jet has no obvious deviation. After the JPC exits the third target plate, its flight distance reaches 7.856 m. It is found that the holes in the fifth target are seriously dispersed, indicating that the JPC segments after breakup have deviated from the flight axis, and the hole diameters have been markedly reduced. To better illustrate the distribution of the broken jet particles on the spaced targets, the main hole in each target is numbered, and their sizes are listed in Table 5.

Figure 10.
Distribution of JPC-1’s perforation holes.

Figure 11.
Distribution of JPC-2’s perforation holes.

Table 5.
Data of penetration and hole formation.
4. Discussion
4.1. Influence of Spaced Target Effect on Penetration Power
To analyze the effect of spaced targets on the jet’s penetration power, the penetration capabilities of JPC-1 and JPC-2 into the homogeneous 921A steel targets at the same stand-off distance are calculated. The simulation results are shown in Figure 12.

Figure 12.
Simulation results of the two structural jets penetrating steel targets.
According to Table 6, in the simulation, the JPC-1 penetrates 421.4 mm into the homogeneous steel target, and 160 mm into the spaced targets; the JPC-2 penetrates 571.8 mm into the homogeneous steel target and 200 mm into the spaced targets. The penetration depth of the two JPCs into the homogeneous steel target is much greater than that into the spaced targets of the same material. This is because when the JPC penetrates the spaced targets, the stress wave is generated inside the target during the impact process, and then propagated to its back surface and reflected on the interface between air and the target. Due to total reflection, the stress wave can hardly propagate to the next target. Therefore, during penetration into the multi-layer spaced targets, each layer of the target needs to be cratered, and each cratering stage will dissipate some energy of the JPC. In addition, the jet breakup is also a factor that causes the significant reduction of penetration power which cannot be ignored. When penetrating a homogeneous target, the JPC does not break up during the whole penetration process which is a continuous penetration. However, in the case of spaced targets, the JPC breaks up when penetrating the second layer of the target, so the subsequent penetration is discontinuous. Many researchers have made detailed analyses and discussions on the problem of the penetration power decline of the broken jets, so it will not be further discussed in this work.

Table 6.
Comparison of penetration results under different conditions.
The comparison of the simulation and experimental results shows that the penetration depth in the experiment is much smaller than that in the simulation. From the experimental results, after the JPC penetrates into the second and third layers of a target, multiple holes are formed in the targets, indicating that the JPC has been seriously broken and drifted. In terms of the JPC’s breakup time, the simulation is in good agreement with the theory, but the transverse drift of the broken jets cannot be simulated. As the simulation process is based on ideal conditions, where the JPC keeps the same trajectory even after the breakup, meaning that after the front-end of the broken jets completed the penetration, the remaining jet can still move in the same penetrating channel.
The experimental results show that the transverse drift and dispersion of the broken jets are very apparent during the penetration process of the JPC at high stand-off distances. As a result, the jet deviates from the charge axis, part of the jet collides with the penetration hole wall, and even multiple jet segments penetrate along different paths, causing great losses and greatly reducing the subsequent penetration capability. Therefore, a jet breakup cannot be ignored in the case of penetrating the spaced targets. This can explain the large error between the simulation and experimental results. Figure 13 shows the transverse drift of the jet during penetration into the spaced targets.
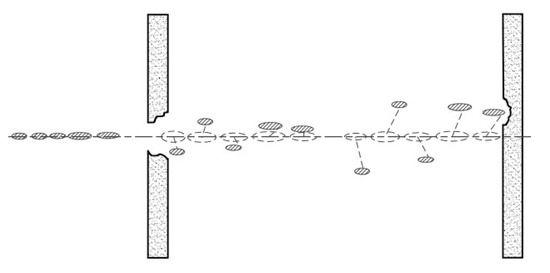
Figure 13.
Schematic diagram of the transverse drift of jet during penetration into spaced target plates.
4.2. Comparison between Experimental and Simulation Results
Figure 14 and Figure 15 give the comparison of the size and number of penetration holes in the experiment and simulation, and the comparison of the jet velocity during penetrating into the first three layers of a target. It can be seen that the impact velocity of the JPCs measured in the experiment and that in the simulation have a small difference. It can be considered that the calculation result of jet tip velocity is relatively accurate. However, the number and size of holes in the experiment are different from those in the simulation. In the test, the JPCs formed by the two charges with different configurations only penetrate six layers of spaced targets, which is far less than the simulation result that the JPCs still have residual penetration capability after penetrating nine layers of targets.
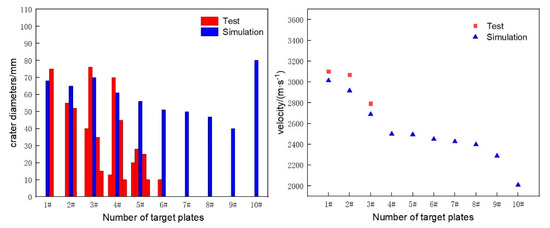
Figure 14.
Comparison of test and simulation results: hole comparison (left) and speed comparison (right)-JPC-1.
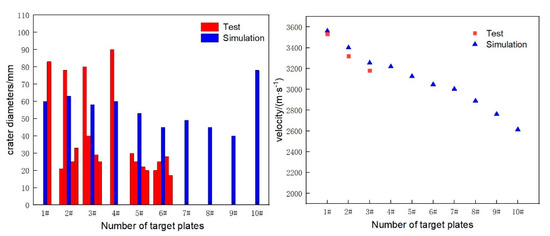
Figure 15.
Comparison of test and simulation results: hole comparison (left) and speed comparison (right)-JPC-2.
Taking the experimental results of JPC-1 as an example, the difference between the number and diameter of holes in the experiment and simulation is analyzed.
The hole diameter in the first target is 75 mm which differs a little from 68 mm in the simulation, so the simulation result is considered to be accurate. The small pits scattered on the surface of the target are generated by the discrete copper particles that collapsed during the JPC formation process. The measured residual tip velocity after the jet passing through the first target is about 3091 m/s, and its error with the simulation result is about 2.5%.
The hole in the second target is irregular. It is obvious from Figure 16 that this hole pattern is formed by two circular holes side by side, one of which has a diameter of 55 mm and the other 52 mm which is larger than the simulation results and smaller than the exit hole diameter of the first target. According to the simulation, at 570 , JPC necking and breaking occur, and the JPC stretches and breaks up into several segments. However, due to the short flight distance, when penetrating the second target, each jet segment has not deviated seriously from the charge axis, resulting in such an irregular hole pattern formed by two holes on the target. The remaining jet will penetrate the third target after passing through these two holes.
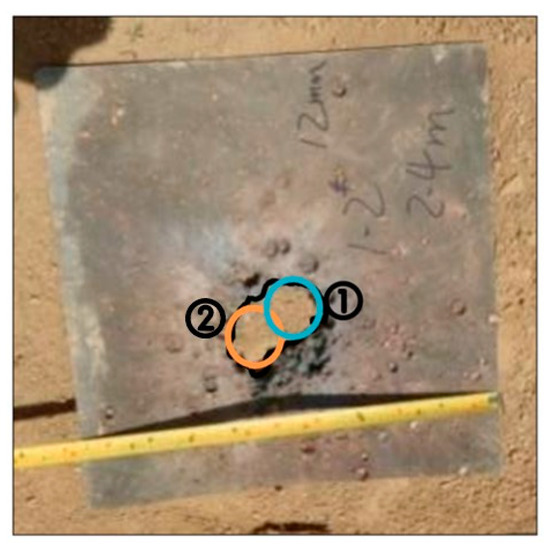
Figure 16.
Holes in the second target by penetration of JPC-1. (Diameter of hole ①: 55 mm; Diameter of hole ②: 52 mm).
The distance between the second and third targets is 4 m which is a long flight distance for the JPC, so the jet segments deviate from the charge axis seriously which is shown by the fact that after the JPC perforates the third target, a main hole and multiple minor holes are formed in the target. In the simulation, jet drift cannot be reflected, so all the jet segments pass through the same holes with small diameters. In the subsequent penetration process, the jet segments deviate from the charge axis continuously, resulting in a significant decline in the penetration capability of the JPC, and finally, only six targets are perforated. In the simulation, all the jet segments fly along the axis and cause deep penetration into the aftereffect target with a large diameter cater.
In the test, due to the transverse drift of the JPC, multiple penetration holes are formed in the same target, so the number of layers of target perforated by the JPC is much smaller than the simulation result.
The difference between the JPCs formed by the two charges with different configurations lies in the tip velocity and breakup time. According to the simulation result, the breakup time of the JPC-1 is 570 , and that of the JPC-2 is 440 . In the case of the charge with wave shaper, due to the large velocity gradient and small diameter of the JPC formed, its breakup time is earlier, so minor holes are formed in the second target which is far away from the main hole. In addition, from the front of the second to sixth targets with the presence of a wave shaper, JPC-2 creates larger pits in the target, indicating that the JPC microelements have been more seriously dispersed and drifted.
As the simulation ignores the drift of jet particles and the transverse movement of broken jet particles, adding a wave shaper to increase the JPC tip velocity will lead to increased penetration depth, but this will also increase the jet velocity gradient and jet length, resulting in more severe breakup and drift. That is why the penetration depth and the number of layers of target perforated by the JPC-2 differs little from those in the case of the charge without wave shaper. Therefore, it is difficult for numerical simulation to directly predict and correspond to the penetration results in the test. To improve the accuracy and reliability of numerical simulation, a new simulation method is needed.
4.3. Design Optimization of Simulation Method
The multiple jet segments formed after the JPC breakup in the test continuously deviate from the charge axis during flight, but this cannot be reflected in the simulation, resulting in a great difference between the measured penetration depth and the simulation result. Therefore, a new segment-based penetration simulation method is proposed in this work. After the JPC perforates the first target with continuous JPC stretching, it will break into several small rod penetrators after reaching their respective breakup times. Once the breakup occurs, the final penetration depth and the number of layers of the perforated target is considered to be caused by each separate JPC segment. Therefore, the JPC segments after a breakup are extracted again to simulate their penetration into the multi-layer spaced targets, respectively, and the simulation results are finally compared with the experimental result.
In the simulation, due to the short flight distance to the first target, an apparent breakup occurs to the JPC after it perforates the first target. Therefore, taking the penetration test results of the JPC-1 as an example, the JPC segments after the breakup (at 790 ) after the JPC perforates the first target is labeled as ①, ②, ③, ④, and ⑤ from right to left as shown in Figure 17. It is assumed that once the JPC breaks up into segments, they will deviate from the original trajectory. Therefore, each segment is extracted separately to calculate their respective penetration into each target. The simulation process of segment penetration is presented in Figure 18.

Figure 17.
JPC breakup.
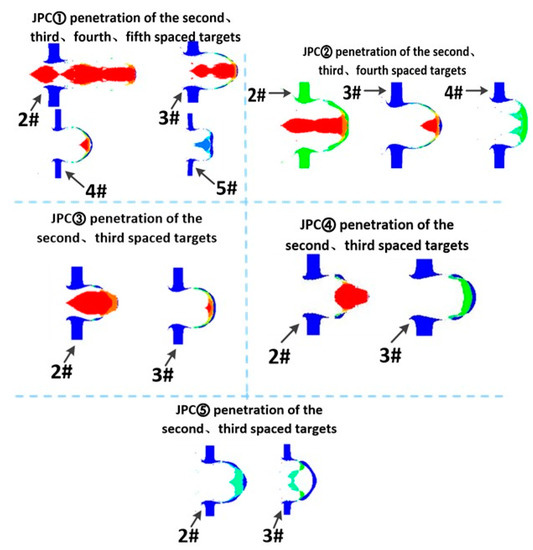
Figure 18.
Simulation process of JPC segment penetration.
The segment-based simulation results are listed in Table 7.

Table 7.
Results of segment-based simulation penetration.
By comparing the simulation analysis results of the 5-segment JPC with the experimental data, as can be seen from the second target, although each segment can perforate this target, the holes obtained from the experiment do not show obvious dispersion, indicating that due to the short flight time and the small influence of transverse velocity, each jet segment has not deviated seriously from the charge axis. According to Figure 17, the irregular hole pattern is formed by two circular holes with diameters of 55 mm and 52 mm side by side. Based on the penetration capability of each small segment in the simulation results, we know that the two holes are created by segments ① and ② and that the remaining JPC penetrates the third target after passing through these two holes.
For the third target, since each jet segment has traveled a distance of 4 m in the air when penetrating this target, the transverse velocity significantly influences the JPC, so the dispersion of holes in the third target is evident. Among the holes, the diameter of the main hole is up to 76 mm × 80 mm, and the diameters of the other holes are all less than Φ 70 mm, so it can be judged that: segments ① and ② pass through the main hole, the main hole is mainly caused by segment ①, and the remaining JPC continues to fly and enlarge the hole. By comparing the experimental data with the simulation results, the Φ 35 mm and Φ 40 mm holes in the target are formed by segments ③ and ⑤, respectively, and the Φ 10 mm small hole may be caused by the flying jet micro-elements.
For the fourth target, as segments ① and ② can perforate the fourth target separately, it is considered that their penetration capability is strong. They first perforate the fourth target and cause around Φ 54 mm holes, and then the other segments continue to fly and enlarge them, resulting in the two larger holes of 70 × 80 and 45 × 70 in the test results. However, we cannot judge which segments cause the Φ 10 mm and Φ 13 mm holes and other smaller ones.
According to the simulation results, segment ① creates a hole with a diameter of around 47 mm in the fifth target, so the 30 × 35 hole in this target in the test is caused by segment ①. Similarly, we cannot determine which segments cause the other smaller holes.
After perforating the fifth target, segment ① is almost completely consumed, and the perforation in the following targets is conducted by segments ②, ③, ④, and ⑤. The small holes in the target do not match with the perforations of the JPC segments, and there is no residual copper material on the internal surface of the holes, so it can be judged that such holes are caused by the behind-target fragments of the JPC. It can be found that the first two segments play the main role of penetration and perforation so increasing the jet tip velocity can enhance the penetration capability of the JPC into the spaced targets.
In this section, the segment-based simulation method is employed to extract the JPC segments after breakup, respectively. The penetration calculation is performed separately for each layer of the target, and the simulation and experimental results are analyzed and compared, showing that they are in good agreement. It has been proven that the deviation of the JPC segments after a breakup has a great impact on its penetration power so in the future design, JPC breakup should be avoided. At the same time, the tip of the jet completes penetration into more layers of the target than the remaining part in the numerical simulation, thus possessing the strongest penetration capability, and undertaking the main task of perforation. Therefore, increasing the JPC tip velocity can improve its penetration depth.
5. Conclusions
To investigate the penetration effect of shaped charge jet penetrating into typical ship targets, two shaped charges were designed to form different shapes of JPC for penetration analysis. Then 10-layer spaced targets with different thicknesses and a span of 16 m were arranged for the penetration capability test. The JPC generated by the shaped charge with a diameter of 200 mm could penetrate six layers of the target with a total spacing of 10 m. The conventional simulation method was also employed to analyze the performances under the same working conditions. It was found that the simulation results by the conventional method had a large error with the experimental result. This is mainly because the JPC will break up after flying to a certain time, and the JPC segments after a breakup will have a transverse velocity, so that they cannot penetrate and move along the hole formed by the precursor JPC, resulting in a significant reduction in penetration power.
After analyzing the hole pattern and the number of holes in each layer of the targets, a segment-based penetration simulation method was proposed to tackle the issue. By utilizing the accurate numerical simulation results of JPC penetration along the same axis the penetration process of JPC fragments after JPC fracture was simulated. The JPC segments after breakup were extracted separately, and the penetration calculation was performed separately for each target. By comparing the hole diameters of the spaced targets after the simulations and experiments, the penetration process of each fragment after JPC fracture can be well revealed, and the final distribution of penetration holes can be explained. Meanwhile, it was discovered that the tip of the jet completes penetration into more layers of the target than the remaining part in the numerical simulation, thus possessing the strongest penetration capability, and undertaking the main task of perforation. Therefore, increasing the JPC tip velocity can improve its penetration depth.
This method of evaluating the penetration ability of JPC elements after JPC fracture through numerical simulation can provide a reference for analyzing the radial velocity of JPC fragments. At the same time, it can also serve as a reference for the structural design and penetration capability evaluation of JPC in long standoff application scenarios.
Author Contributions
Writing—original draft, L.J.; Test technical support, X.J., Y.C. and Z.H.; Writing—review and editing, J.G.; Numerical simulation technical support, P.W. All authors have read and agreed to the published version of the manuscript.
Funding
This research received no external funding.
Data Availability Statement
No new data were created or analyzed in this study.
Conflicts of Interest
The authors declare no conflict of interest.
References
- Huang, Z.X. Mechanism Study on JPC Formation; Nanjing University of Science and Technology: Nanjing, China, 2003; Volume 2–3, p. 48. [Google Scholar]
- Curtis, J.P. Axisymmetric instability model for shaped charge jets. J. Appl. Phys. 1987, 61, 4978–4985. [Google Scholar] [CrossRef]
- Romero, L.A. The instability of rapidly stretching plastic jets. J. Appl. Phys. 1989, 65, 3006–3016. [Google Scholar] [CrossRef]
- Hutchinson, J.W.; Neale, K.W. Influence of strain-rate sensitivity on necking under uniaxial tension. Acta Metall. 1977, 25, 839–846. [Google Scholar] [CrossRef]
- Shenoy, V.B.; Freund, L.B. Necking bifurcations during high strain rate extension. J. Mech. Phys. Solids 1999, 47, 2209–2233. [Google Scholar] [CrossRef]
- Walsh, J.M. Plastic instability and particulation in stretching metal jets. J. Appl. Phys. 1984, 56, 1997–2006. [Google Scholar] [CrossRef]
- Chou, P.C.; Carleone, J. The stability of shaped-charge jets. J. Appl. Phys. 1977, 48, 4187–4195. [Google Scholar] [CrossRef]
- Hennequin, E. Modelling of the Shaped Charge Jet Break-Up. Propellants Explos. Pyrotech. 1996, 21, 181–185. [Google Scholar] [CrossRef]
- Petit, J.; Jeanclaude, V.; Fressengeas, C. Breakup of copper shaped-charge jets: Experiment, numerical simulations, and analytical modeling. J. Appl. Phys. 2005, 98, 123521. [Google Scholar] [CrossRef]
- Karlsson, H.E. Computer simulation of shaped charge jet fragmentation. In Proceedings of the 20th International Symposium on Ballistics, Orlando, FL, USA, 23–27 September 2022; pp. 557–564. [Google Scholar]
- Hirsch, E. The natural spread and tumbling of the shaped charge jet segments. Propellants Explos. Pyrotech. 1981, 6, 104–111. [Google Scholar] [CrossRef]
- Rottenkolber, E.; Arnold, W. Rotation rates and transverse velocities of shaped charge jet particles caused by breakup. In Proceedings of the 15th International Symposium on Ballistics, Singapore, 15–17 December 2004; pp. 845–852. [Google Scholar]
- Kelly, R.J.; Curtis, J.P.; Cowan, K.G. An analytic model for the prediction of incoherent shaped charge jets. J. Appl. Phys. 1999, 86, 1255–1265. [Google Scholar] [CrossRef]
- Hussain, G.; Hameed, A.; Horsfall, I.; Barton, P.; Malik, A.Q. Experimental and simulation optimization analysis of the Whipple shields against shaped charge. Acta Mech. Sin. 2012, 28, 877–884. [Google Scholar] [CrossRef]
- Taylor, E.A. Simulation of hollow shaped charge jet impacts onto aluminium whipple bumpers at 11 km/s. Int. J. Impact Eng. 2001, 26, 773–784. [Google Scholar] [CrossRef]
- Svirskii, O.; Vlasova, M.; Vasetsky, V.; Toropova, T.; Nechaev, A.; Krutyakov, V. Penetration of Shaped Charge Jets at Long Standoff Distances. In Proceedings of the 21th International Symposium on Ballistics, Adelaide, Australia, 19–23 April 2004; pp. 378–382. [Google Scholar]
- Horsfall, I. The effect of spaced armour on the penetration of shaped charge warheads. In Proceedings of the 22nd International Symposium on Ballistics, Vancouver, BC, Canada, 14–18 November 2005; pp. 941–947. [Google Scholar]
- Held, M. Theoretical optimum jet diameter profile for maximum penetration. In Proceedings of the 17th International Symposium on Ballistics, Midrand, South Africa, 23–27 March 1998. [Google Scholar]
- Held, M. Penetration cutoff velocities of shaped charge jets. Propellants Explos. Pyrotech. 1988, 13, 111–119. [Google Scholar] [CrossRef]
- Haugstad, B.S. Compressibility effects in shaped charge jet penetration. J. Appl. Phys. 1981, 52, 1243–1246. [Google Scholar] [CrossRef]
- Tan, D.W.; Sun, C.W.; Zhao, J.B.; Zhang, K.M.; Xie, P.H. Experimental investigation of shaped charge with large cone angle. Chin. J. High Press. Phys. 2003, 17, 204–208. [Google Scholar]
- Daniels, A.S.; Baker, E.L.; Vuong, T.H.; Chin, C.L.; Fuchs, B.F.; DeFisher, S.E. Selectable initiation shaped charges. In Proceedings of the 20th International Symposium on Ballistics, Orlando, FL, USA, 23–27 September 2002; pp. 23–27. [Google Scholar]
- Zhang, J.; Zhi-gang, C.H.; Xiao-jun, L.I. The variable wall thickness of hemispherical liner of rod like jet formation and penetration properties. Explos. Mater. 2016, 45, 39–42. [Google Scholar] [CrossRef]
Disclaimer/Publisher’s Note: The statements, opinions and data contained in all publications are solely those of the individual author(s) and contributor(s) and not of MDPI and/or the editor(s). MDPI and/or the editor(s) disclaim responsibility for any injury to people or property resulting from any ideas, methods, instructions or products referred to in the content. |
© 2023 by the authors. Licensee MDPI, Basel, Switzerland. This article is an open access article distributed under the terms and conditions of the Creative Commons Attribution (CC BY) license (https://creativecommons.org/licenses/by/4.0/).