1. Introduction
Manufacturers around the world are trying to adapt to the advancements of technologies that integrate the physical into virtual shop floors. Many researchers have proposed theoretical approaches to the integrated framework of digital technologies. These integrated technologies are often termed differently around the world, such as Industry 4.0 in Germany, Made in China 2025, and Industrial Internet in the US [
1]. These terms have propagated the application of digital technologies within complex manufacturing systems. Smart manufacturing is the framework or practice that has evolved by using the data acquired by machines on the physical shop floor. The data generated throughout a product’s lifecycle can be analyzed from the multiple perspectives of manufacturing [
2]. The data generated by these systems have unpredictable growth and are purely unrefined. Informed or precise decisions within manufacturing rely on these manufacturing data. Unfortunately, until now, the decision-making frameworks have not been that efficient [
3] due to manufacturing systems neglecting the data that have been generated. This negligence has resulted in the loss of production, cost-effectiveness, and flexibility in manufacturing. According to (3), roughly more than 100 EB of data are generated from manufacturing systems across the world annually. That is to say, data-centric manufacturing is missing in the current systems. The implementation of data-centric manufacturing systems has become a necessary aspect of smart manufacturing practices, and the reports generated from these have impressed manufacturers to consider this approach inevitably [
4]. Among all these complications, the collaboration of cloud empowerment in manufacturing systems should never be underestimated. Data-centric manufacturing seems promising, but the platform of data analytics is equally as important. The manufacturing industry has been going through a lot of improvements and advancements. One of these advancements is cloud computing or cloud-empowered manufacturing systems [
5]. The important contribution of cloud-empowered manufacturing is its unmatched on-demand computing, along with its undeniable availability, convenience, and highly reliable services.
2. Cloud-Empowered Data-Centric Systems
The invention of IoT and the resulting data accumulated from these sensors in manufacturing systems will be a continuous process. As a result, these data need methods to analyze, define, and understand the behaviors of the machine [
6]. If these data are left unanalyzed, then there would be no point in integrating these machines with the required sensors and communication protocols [
7]. The number of machines that are smart enough to provide data has been growing immensely, and this rapid growth cannot be left unattended. An estimated 3 exabytes of data are generated every day, an amount equal to the data produced by all the IBM systems in previous years [
8]. This amount of data cannot be stored in any personal computer or any locally generated database storage system, which would be hard to access. Solely for this reason, gigantic companies such as Microsoft, IBM, Google, AWS, and many more are providing on-demand cloud solutions [
9].
These data can be treated as an information source, and in turn, the same data will be treated as knowledge for the future. However, this transformation of data from information to knowledge cannot be handled by sensors or local analytical platforms [
10]. This is where cloud empowerment for data analytics takes prominence.
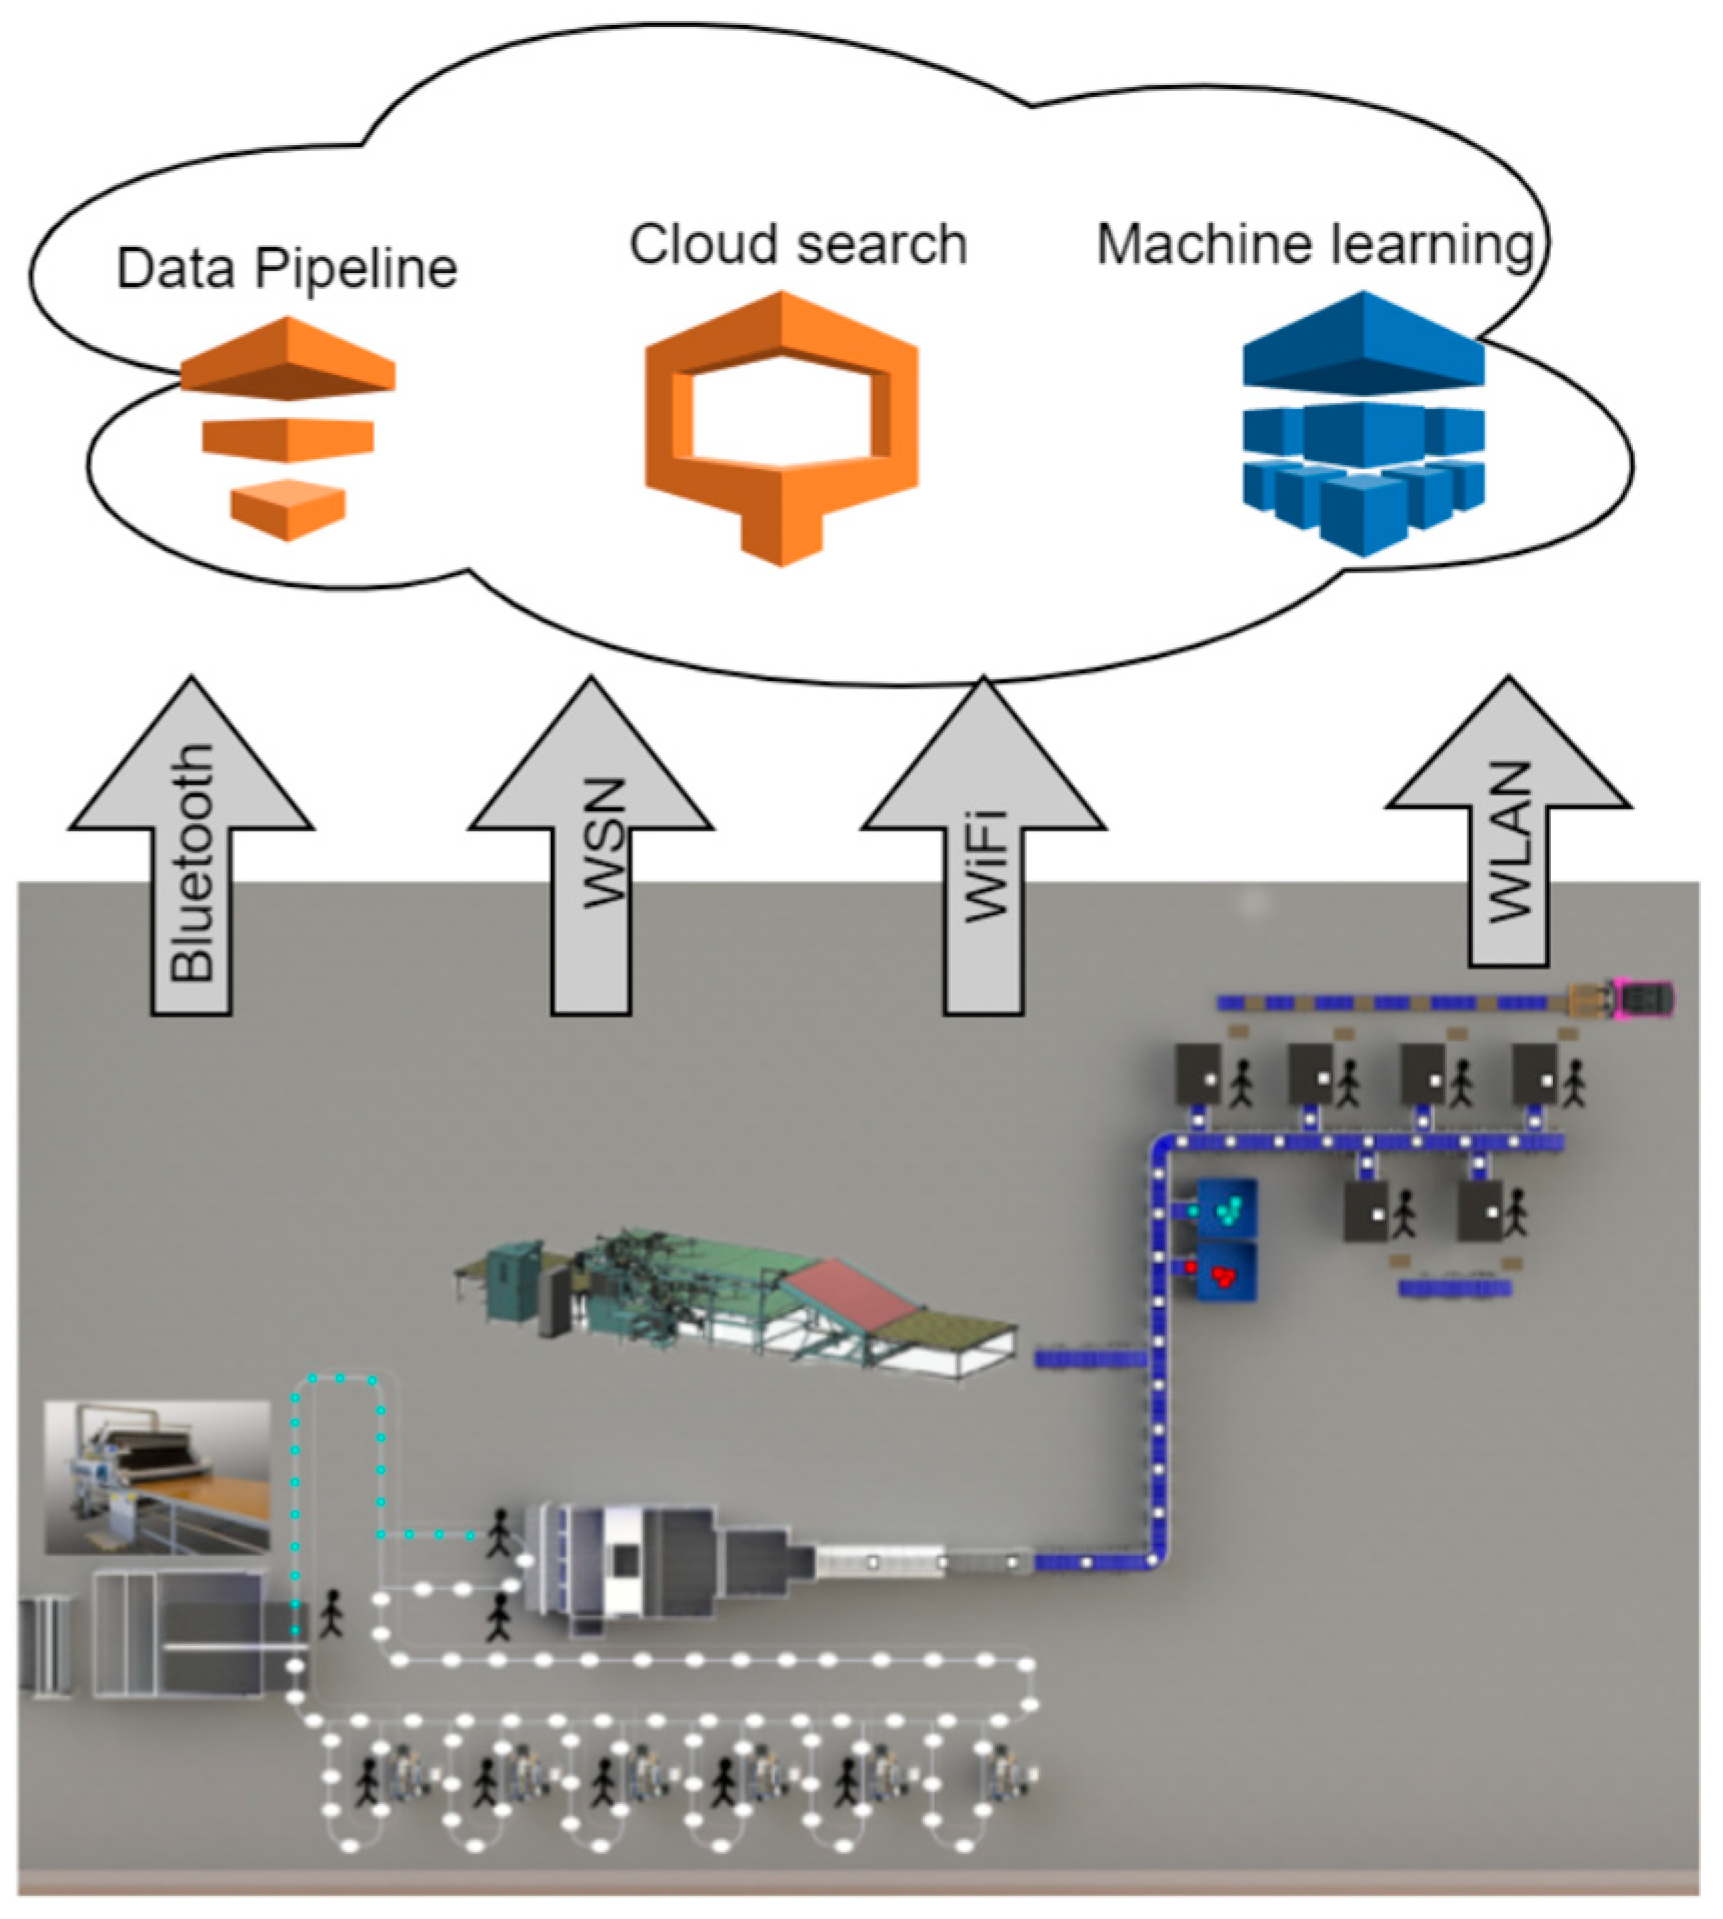
Figure 1 represents the general architecture of a cloud-empowered data-centric system where the manufacturing system data have been transferred to the cloud system. This data transfer has been achieved through multiple fast and reliable communication protocols such as WLAN, Bluetooth, WSN, Wi-Fi, and many others.
Integrated systems have been evolving with the incorporation of the reliable source: sensing technology [
11]. There are sensors for every possible expectation that can be incorporated into the machine. In the architecture that is presented in
Figure 1, the data from sensors were collected and accumulated in the cloud environment for processing. The aspects of the data such as scalability, elasticity, economic benefits, reliability, security on storage, and accessibility for prediction were justified using cloud empowerment. Efficient and effective computing of data that have been collected in cloud storage are important to extract useful and important features. The data generated from heterogenous machines are of very high volume, wide variety, and intense velocity. To understand these three V’s of Big Data concepts [
12], there are many providers around the world that have taken initiative in managing these databases. The topmost among them include Apache Hadoop, Oracle, Cassandra, and Vertica. These companies do the background job of storage and computing, which consumers will in turn use around the world to develop virtual scenarios.
3. Life Process of Smart Manufacturing Data
SM revolves around data that have been collected from the system. However, the collected data will not be useful unless they are processed for the desired structure or boundaries are defined for a particular data set. Typically, once the data are collected, they need to be processed through several important steps called the “life process of the data”. Once the data from sensors are collected, the following data life process will detail the steps that they undergo: (i) data collection, (ii) preprocessing, (iii) transmission, (iv) visualization, and (v) real-life application.
3.1. Data Collection from Sensors
Though technologies have taken the majority of use from the data that are collected in manufacturing systems, there are systems that help the user to visualize them as well [
13]. Such systems include manufacturing execution systems (MES) that handle data streams between manufacturing machines; enterprise resource planners (ERP), which is a platform that assists in planning the inventory of the organization; and product lifecycle management (PLM). Modeling software utilizes these data as well as computer-aided design (CAD) and computer-integrated manufacturing (CIM), which assist in realizing the manufacturing in the virtual world. Data from the machines need to be captured, and there are many methods possible to achieve this goal. In this article, the Raspberry Pi4 module was used for capturing the high-dimensional manufacturing data, as presented in
Figure 2. There are four main types of data that can be collected from this system, i.e., (i) machine data, (ii) management data, (iii) inventory data, and (iv) general data. As depicted in
Figure 2, the raspberry Pi 4 module has been used for the data generation techniques.
3.1.1. Machine Data
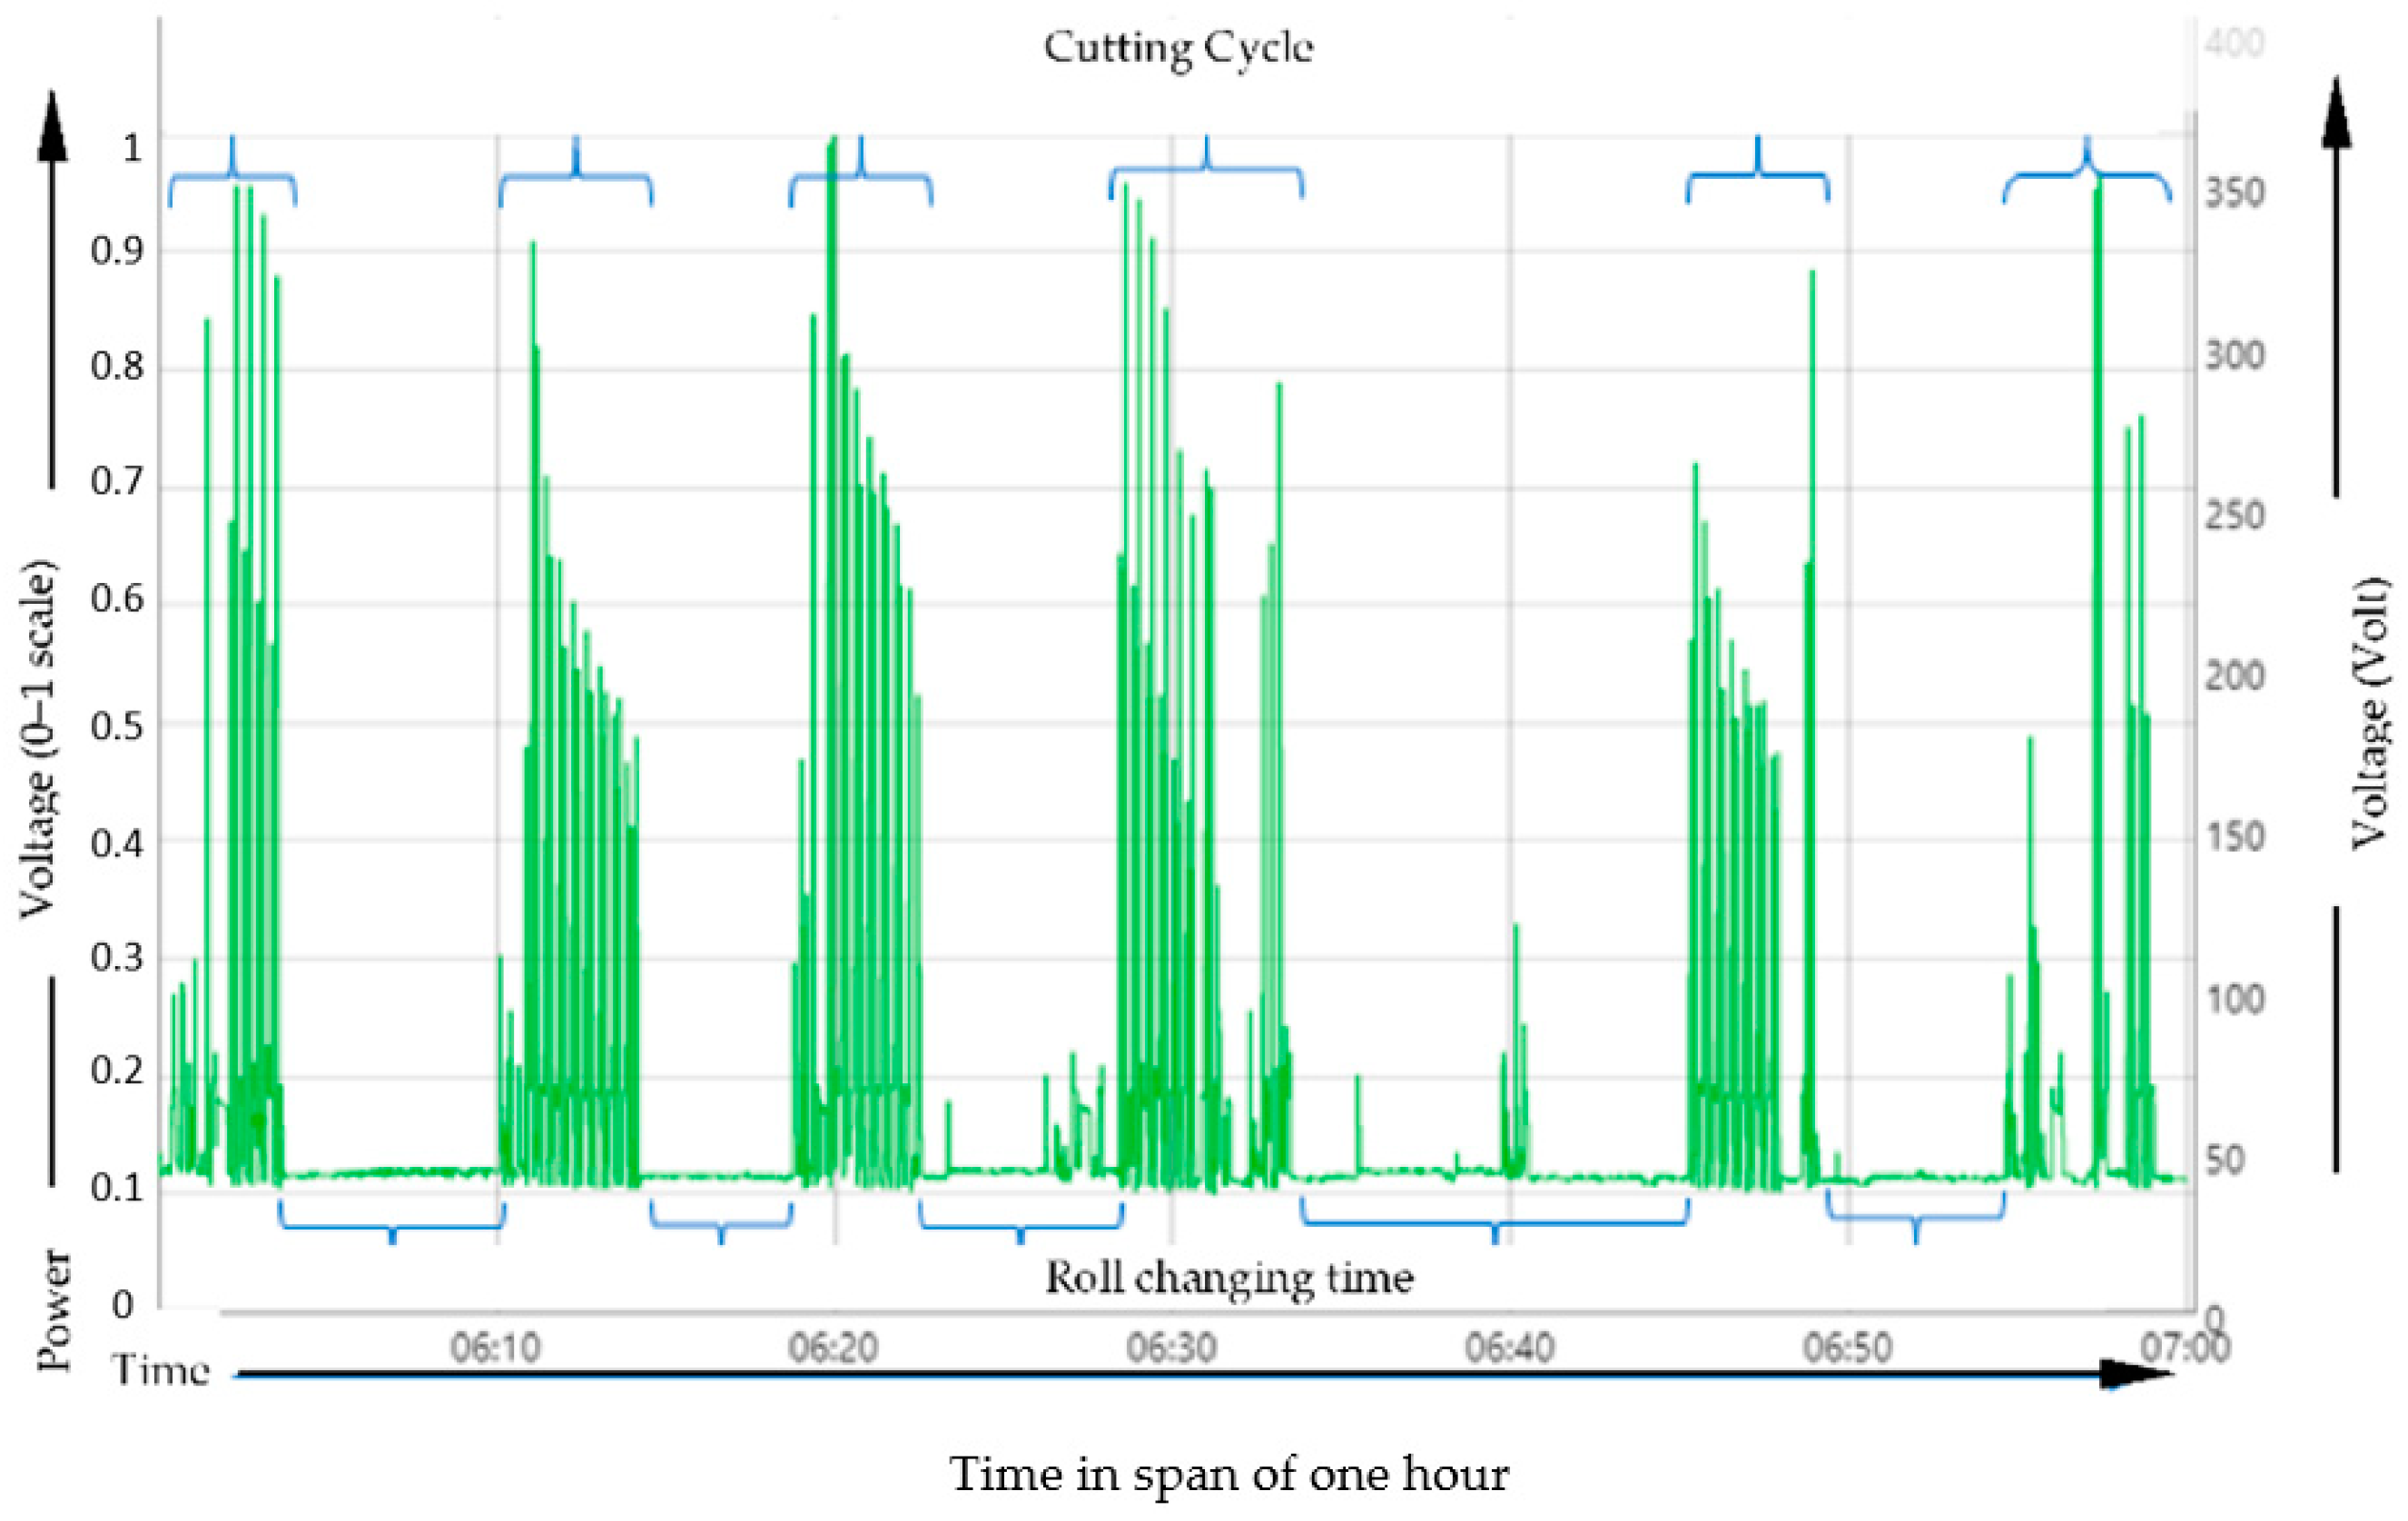
Figure 3 illustrates about the preliminary data analysis in manufacturing scenario. Machine data are collected from the sensors that are inbuilt within the equipment. These data include machine behavior, real-time execution, maintenance scheduling, history of equipment, and many others. Machine data are very crucial in deciding which of the collected data are useful so that they can be processed and analyzed for a concrete understanding of the operation.
3.1.2. Management Data
Management data are a type of data that is generated from the manufacturing management system. These data are often generated by the team that has been planning the execution of the production such as MES, ERP, and others. These data are often constituted of production planning, scheduling, inventory management, sales, distribution, warehousing, and forecasts.
3.1.3. Inventory Data
Inventory data are often collected from the sensors that have been integrated into the product itself. These data are often categorized into radio frequency identification (RFID), barcode, QR code system, and others. Inventory tracking data are useful when the manufacturing team is trying to integrate its system with customers or providers. These data assist the system to store, track, and manage data related to manufacturing date, batch of production, and warranty if applicable.
3.1.4. General Data
General data are usually generated from the research and development part of the team. These data are related to any development of technology, integration, or advanced protocols. In particular, this type of data allows manufacturers to guarantee the implementation of advanced technologies within their practices. In this Big Data era, with the help of information technology (IT), manufacturers can conveniently hold onto and process the necessary data to enhance production. This acquisition of manufacturing data has given opportunities for all sizes of manufacturers, including SMEs, to implement these technologies and enhance their productivity.
3.2. Data Storage and Management
According to IBM, the data generated from the manufacturing system cross 2.5 exabytes on a daily basis. To store and manage this information is a nightmare for any system that has been fully designed. Fortunately, there are cloud systems that make life easier for manufacturers to access their work fluently [
14]. These data can be often classified into three categories: (i) structured data sets, (ii) semi-structured data sets, and (iii) unstructured data sets.
3.2.1. Structured Data Sets
Structured data are often readily usable for any type of analysis with algorithms or basic modeling such as digits, tables, symbols, and many others. One drawback of this data type is that it is not very descriptive. Often, there is some analysis and reporting that needs to be performed on this data type to understand it.
3.2.2. Semi-Structured Data Sets
Semi-structured data are partially understood by the direct user but are again not self-descriptive. Types of this category include data trees, XML documents, or graphs generated by the system. A known practitioner is needed to handle and manage these dat3.2.3. Unstructured Data Sets
Unstructured data are visually easy to understand but are difficult to realize. Data sets such as images, videos, audio files, system logs, and many others are classified under this data set. Unstructured data realization comes under the special section of data engineering and image and pattern recognition to understand machine behavior. Initially, manufacturers often tended to use structured data sets, as they were easy to manage. With the introduction of object storage, data are stored in a designated object to store the storage system, which is far more convenient and easier to analyze compared to file systems or block storage. This is because file storage contains the data in one single file irrespective of the data type, and block storage stores the data in singular blocks of data, which further stores these data sets as separate pieces of data. The advantage of object storage over block and file storage is that data are easily accessible for analysis, retrieval, and optimization of resources while remaining at a competitive cost.
3.3. Data Preprocessing
Data that have been collected from the manufacturing system often need cleaning. Cleaning refers to a series of steps involved in processing and refining data. Collected data must be processed and converted for useful information so that they can be used to make critical decisions about manufacturing [
15]. The processing will filter null, misleading, inconsistent, and redundant values within the collected data set. Specifically, the data need to undergo cleaning to get rid of null entries and duplicates, as well as to find missing inputs. These three values are the major impurities within the data sets. Data preprocessing can be performed in six different stages depending on the type of data.
3.3.1. Batch Processing
Data from machines are collected in batches. These data are often used for later stages of analysis, but this type of processing does not help in manufacturing. Rather, this processing helps in payroll types of systems.
3.3.2. Real-Time Processing
Once data have been collected, they will be analyzed completely in seconds i.e., real-time. One drawback of this processing is that it has been performed on only a small amount of data, such as ATM machines, but in manufacturing, this is a real need.
3.3.3. Online Processing
Here, data will not be processed for null values or duplicates; rather, the data will be directly fed to the servers, where they will directly work on the analytical algorithms. However, often, this can be performed with only one system at a time.
3.3.4. Multi-Input Processing
Multi-input or parallel processing is a type of data processing that is often used when there is more than one data point, and multiple servers are needed to process the data. This type of processing is used when reporting about the weather or in the online streaming of live events and many others.
3.4. Data Realization
Once the data have been collected and preprocessed, they need to be visually realized, i.e., there is a presentation method that needs to be implemented on the data set collected. This realization can only be performed with the help of ML algorithms, data analytical formulas, graphs, tables, figures, and other such presentation forms. The realization will help manufacturers understand their standing when compared to similar data sets generated from virtual systems or CPS systems. The analytical reports can then be further compared, and effective measures of implementation can be taken.
Figure 3 represents preliminary data analysis from the data collected from one typical machine from the shop floor based on the number of sheets that were manufactured in a given set of time.
4. Cloud Empowerment in Smart Manufacturing Systems
As described in the data methods in the previous section, cloud empowerment within a system plays a similarly vital role. Everything is regarded as a service in CC, including software as a service (SaaS), platform as a service (PaaS), and infrastructure as a service (IaaS). A layered system is defined by these services.
Table 1 shows pivot outcomes for cloud computing from the gathered data. At the infrastructure layer, standardized network services are referred to as processing, storage, networks, and other crucial computer resources. The underlying infrastructures of clients of cloud providers can be configured and used with software and operating systems. For the purpose of building, testing, even deploying, hosting and supporting applications in an integrated development environment, PaaS, the intermediate layer, offers abstractions and services. The application layer provides the full suite of SaaS applications. Then there is the top user interface layer which enables smooth interaction with all of the underlying SaaS levels.
Table 1 represents the pivot table that was generated after integrating the basic modules of cloud computing. This was assumed to be the recipe holder for subsequent manufacturing processes.
Due to the development and convergence of multiple computing trends, including internet delivery, elasticity, “pay-as-you-go/use” utility computing, virtualization, distributed computing, content outsourcing, storage, Web 2.0, and cloud computing, grid computing is occasionally regarded as a multidisciplinary research field. In actuality, cloud computing may be seen as the commercial development of grid computing. A change in approach for business and IT architecture is required to implement cloud computing, where processing power, services and data storage are outsourced to outside parties and thus made available to businesses (along with customers) as commodities. Businesses such as NEC are using cloud computing more and more. Solutions provided by its cloud-based service platform play a significant part in the transformation of corporate systems, resulting in cost savings, agile service deployment, more flexibility, and increased productivity. Manufacturing companies have good reasons to embrace cloud computing and even to “steal” the idea in order to create a “cloud industry,” which is the manufacturing equivalent of cloud computing. As industrial organizations in the new millennium grow more IT-dependent, international, dispersed, and agile-demanding, such lateral thinking is seen as reasonable and natural.
4.1. Requirements for Cloud Computing
Before jumping into actual computing, there are basic requirements or checklists for cloud computing. These requirements are very crucial, and meeting these requirements is the primary aspect before jumping into selecting cloud services. The following sections are a list of requirements that seem necessary for the stated purpose of the paradigm.
4.1.1. Fault Tolerance
This aspect of cloud computing deals with the ability of the cloud system to tolerate the faults that occur while computing: tolerating faults or the performance of the system such as self-diagnosis, recovery, and app-particular recoveries when the system encounters faults. Even after the faults are detected, the system needs to recover and revise its version.
4.1.2. Cloud Security
A major reason manufacturers do not tend toward cloud integration is fear about the security of their data. They are worried about data leaks, operation failures, or remote handling of servers. Trusting third-party cloud providers to manage internal operations and activities is one of the largest risks that one could ask from manufacturers. In their databases, they have information related to customers, providers, sales reports, marketing strategies, and internal employee details. Earlier discussed topics such as SaaS, IaaS, or PaaS give different levels of security and flexibility of integration.
4.2. Cloud Deployment Challenges and Strategies
Deployment of the whole manufacturing in the cloud environment has become quite complex because of many reasons. Real-scale architecture needs to be obtained while the application is required to be handled. With the expansion of goods, cloud deployment has grown fairly complicated. To achieve real-scale architecture today, applications must be able to manage traffic surges. The process of deployment itself becomes challenging due to the growing demand for extra new features, and the release of updates multiple times a week, especially when transferring servers, is challenging [
6]. In the following section, some of the challenges are stated for instances where a cloud application is deployed using strategies that are outdated:
- (1)
Scaling difficulties;
- (2)
Manual replacement for server outages;
- (3)
Application release during maintenance window/time frame;
- (4)
Run-time faults through deployment;
- (5)
Unstable deployments;
- (6)
Deployment breakdown;
- (7)
Rare production deployments.
5. Data-Centric Cloud-Empowered Smart Manufacturing
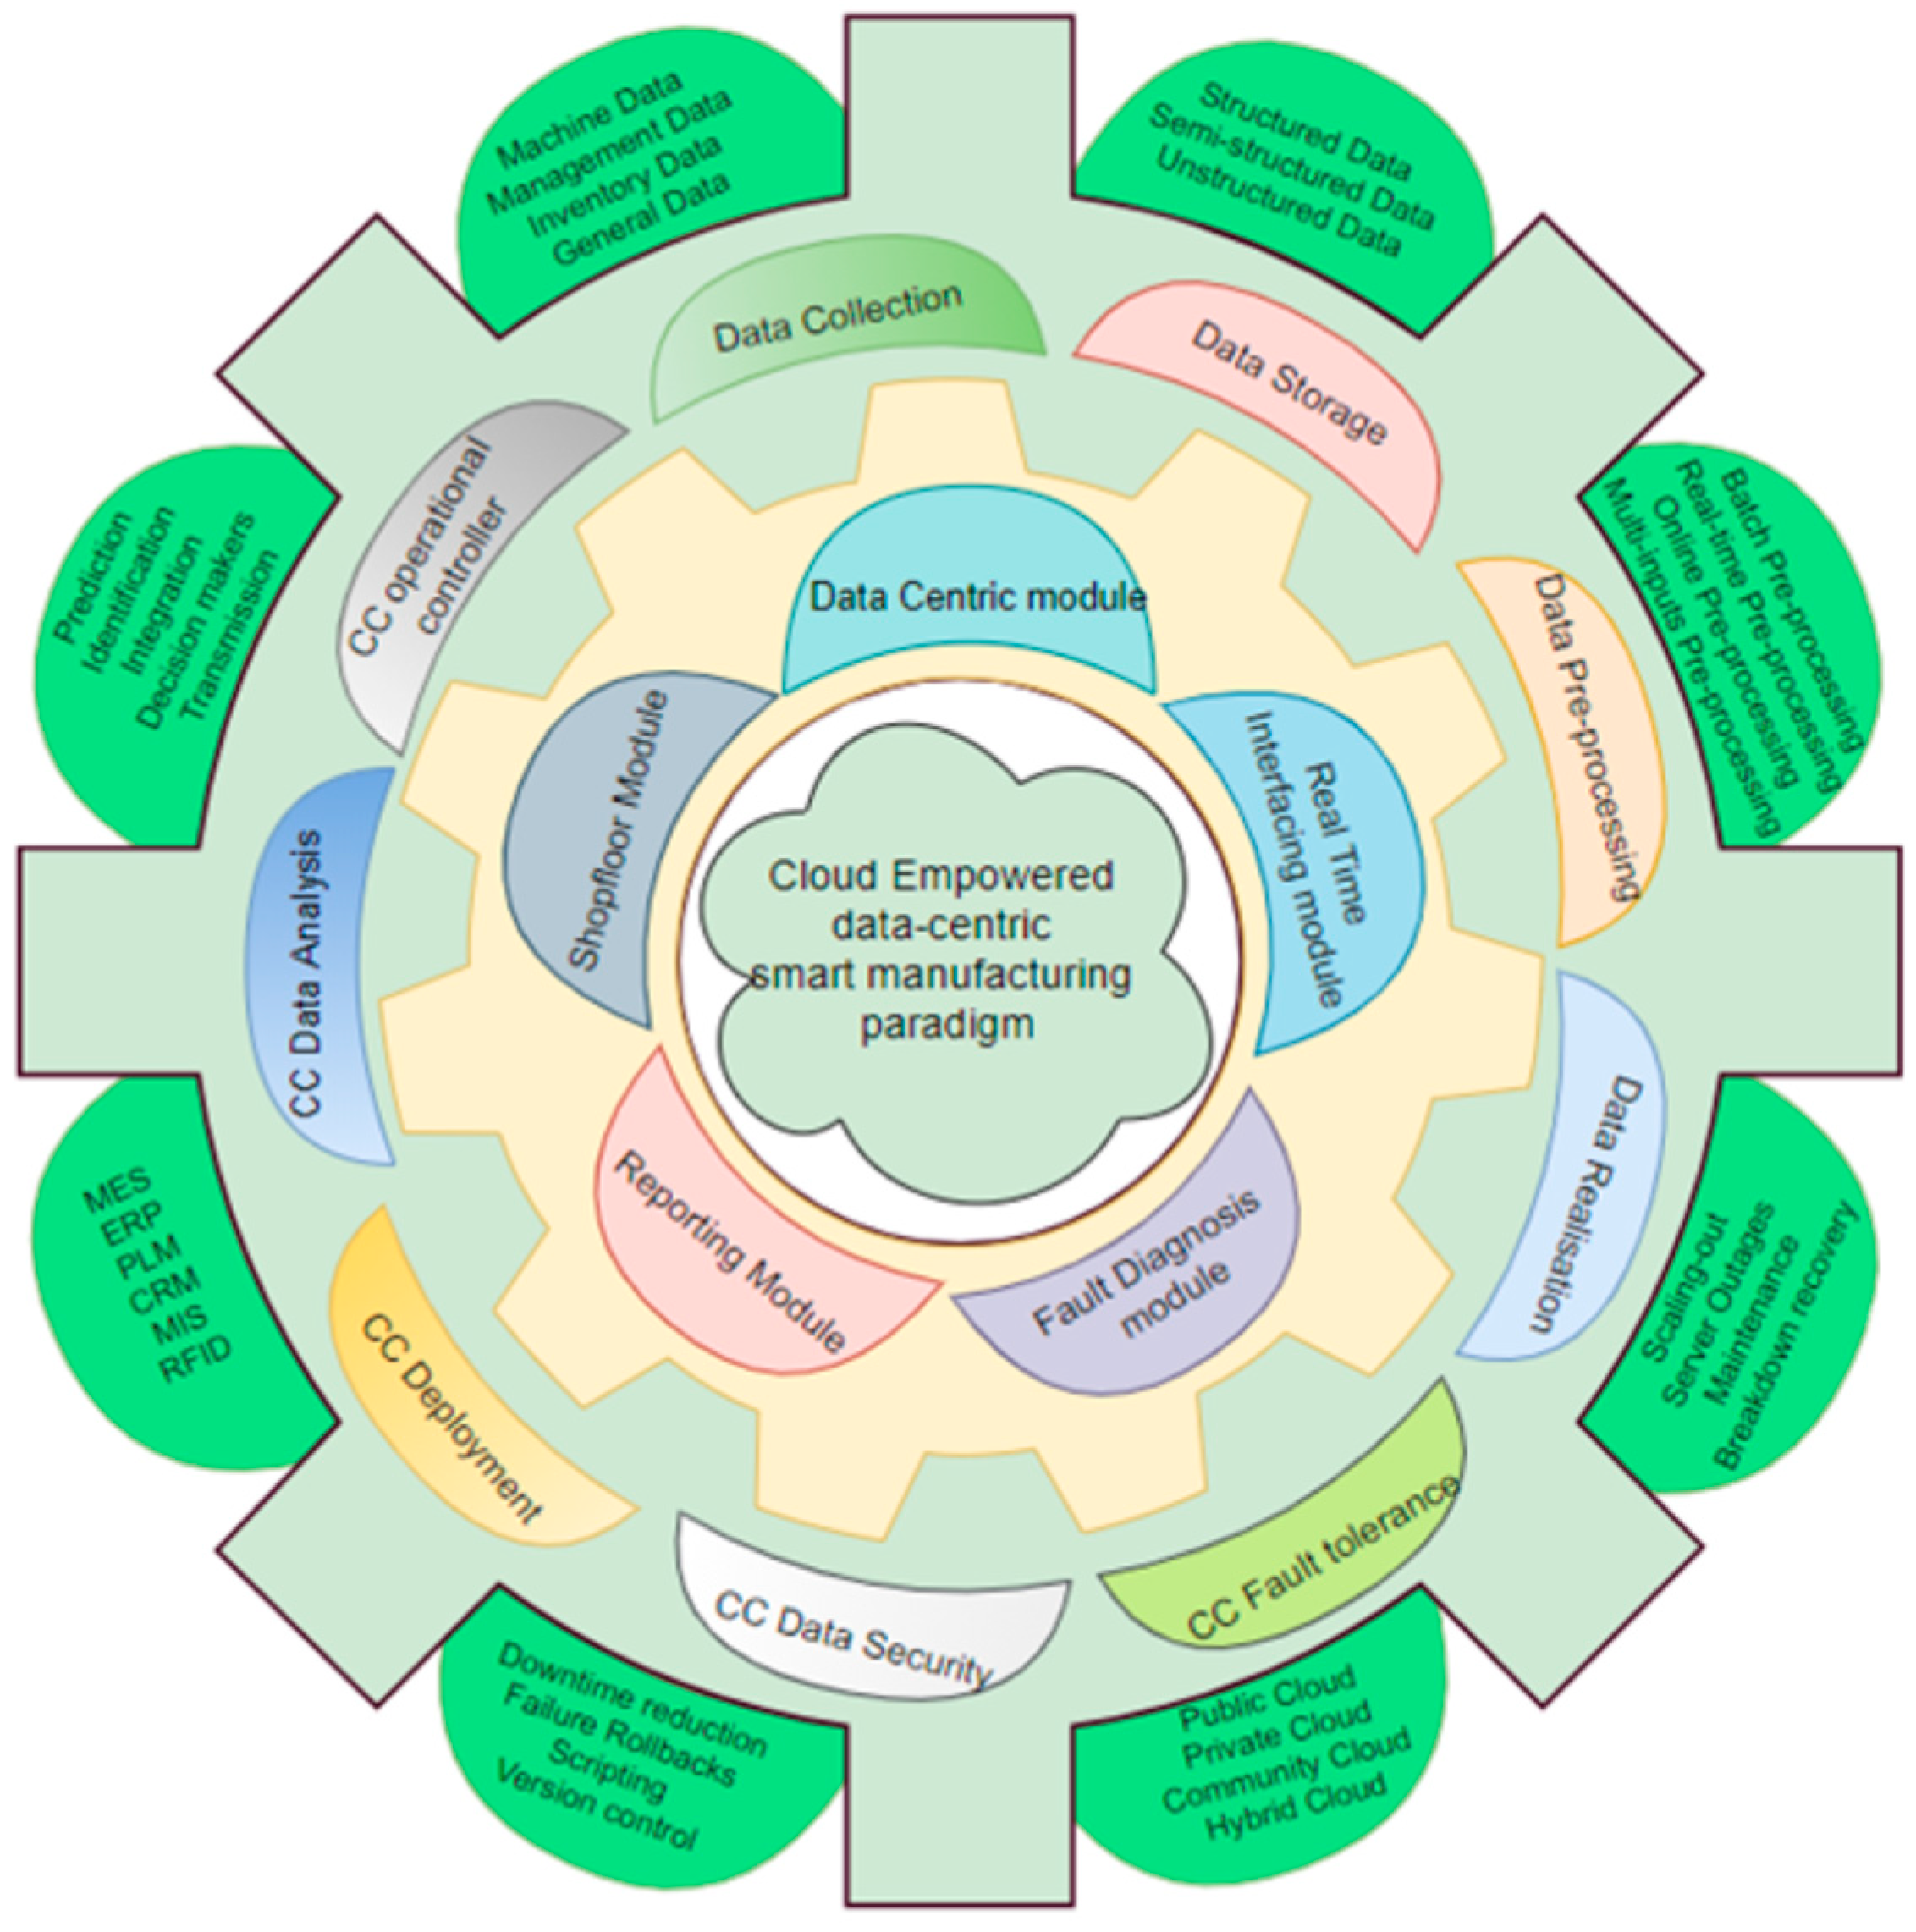
Figure 4 represents the cloud empowered data-centric system that comprises of multiple modules. Manufacturing model: Once the data from the manufacturing shop floor are collected, processed, and analyzed ML technology, one can implement the ML technology within the manufacturing to enhance the intelligence of the decision-making framework. The data-centric module that is powered by CC is a multicapable framework. This module, as presented in
Figure 4, explains the possibilities. The following sections of this article detail the different modules.
5.1. Shop Floor Module
The shop floor module can accommodate various manufacturing processes. It is made up of a range of manufacturing resources as well as the information systems, and it can be summarized as a “man–machine–material environment.” In this module, the inputs would be completely raw materials, whereas the outputs tend to be completed goods. A variety of dataset are collected throughout the input–output transformation process from sources such as human operators, the information systems, the production equipment and/or the industrial networks.
5.2. Data Principled Module
Throughout many phases of industrial data lifecycle, it is the data principled module that serves as the engine for smart manufacturing. The manufacturing module’s data are sent as inputs to the cloud-based data centers where further analysis can be conducted. After that, the manufacturing module’s operations (such as product design, manufacturing execution and production planning) are driven via explicit suggestions and information which is derived from the aforementioned raw sets of data. Even the problem-processing and real-time monitoring of the modules are supplied power by data driver module.
5.3. Real-Time Interfacing Module
The real-time interfacing module is involved in the real-time monitoring of the production process to guarantee product quality. This module, which is powered by the data driver module, can analyze the operational state of industrial facilities in real time. Manufacturers may then design the best operational control techniques by staying up to date with modifications to manufacturing process. A simple example is when the material is spread, and it follows a trajectory is for the instance when the machine sits idle. Specific product quality flaws can be addressed by adjusting the production process. The real-time monitoring of the module can thereby improve efficiency of the manufacturing process and facilities.
5.4. Fault Diagnosis Processing Module
The following tasks are carried out by the fault diagnosis processing module: recognizing and anticipating emerging faults (such as quality defects and/or equipment faults), diagnosing root causes, recommending potential solutions, calculating the efficacy of those solutions, and evaluating potential effects on other forms of manufacturing activities. With the collection of information/data in real-time and analysis of historically available data (merged with ongoing data which is supplied by the data driver module), it is now possible to make better informed decisions via Artificial intelligence programs or human operators. This also has the potential to not only to solve existing issues but also create a pathway to prevent problems of similar nature in the near future. This form of preventive maintenance is thus made possible by this module, which eventually enhances and streamline the complete industrial processes. The systematic process of data collection, storage, integration, analysis, visualization as well as application can often be advantageous to a wide range of diverse businesses. The suggested data-driven smart manufacturing system aims to benefit everyone in this way. SMEs, as opposed to large corporations, can implement data-driven smart manufacturing at varying scales based on the resources available. SMEs can use services of cloud computing (which are offered by different third parties like Alibaba or Amazon) on-demand. This is in contrast to larger enterprises that can afford to setup their own private cloud infrastructure for the purpose of storing and analyzing data. The essential value propositions of the aforementioned data-driven manufacturing approach end up being similar for both the major enterprises and SMEs, regardless of where and how data is maintained. Decision-makers use manufacturing data to predict changes as quickly as possible, evaluate them accurately, and provide quick fixes for problems. Because of this, smart manufacturing can be improved by carefully synchronizing production schedules, manufacturing processes, and resources.
5.5. Reporting Module
The reporting module is a very important aspect of the specified framework. This is because it reports all the modules that have been mentioned in this section. The reporting module has been programmed with multiple software and hardware aspects so that it concatenates all the possible faults, issues, and recoveries that have been taken. These faults are often important, and reporting them to the correct personnel is very crucial to making important decisions within the smart manufacturing scenario. Decision-making strategies depending on the reports that have been generated by these systems play a vital role because the changes are often unavoidable. In the instance when the a pattern of data is detected that don’t end up conforming to an ideal/expected type of behavior, it is then known/considered as an anomaly detection [
16]. The anomaly detection problem is, by definition, dependent on the data and/or application in question.
There are many overviews and comparisons of approaches towards the different types of anomaly detection, as presented in literature. This includes various examples, starting from the industrial damage detection towards all the way to medical anomaly detection. Think about the irregularity location issue using a multivariate time arrangement dataset collected from sensors installed on the fabricating gear of a production line processing line. The issue of inconsistency discovery is particularly challenging since the inconsistency information records are constrained, the anomaly designs are exceedingly sporadic, and the discovery must have precise timing. A few approaches have been proposed already as discussed in
Section 3. Traditionally, rule-based arrangements are connected for discovery. These rules are specified for the encounters and space knowledge advertisement hoc information examination. Subsequently, it is defenseless to an unseen anomaly and cannot be effectively generalized to other fields or situations. Machine learning procedures have to be more commonly seen with the rising worldview of enormous data [
17]. Some of these approaches are based on time arrangement analysis models, such as autoregressive coordinate moving.
5.6. Case Study of High-Dimensional Data Anomaly Detection
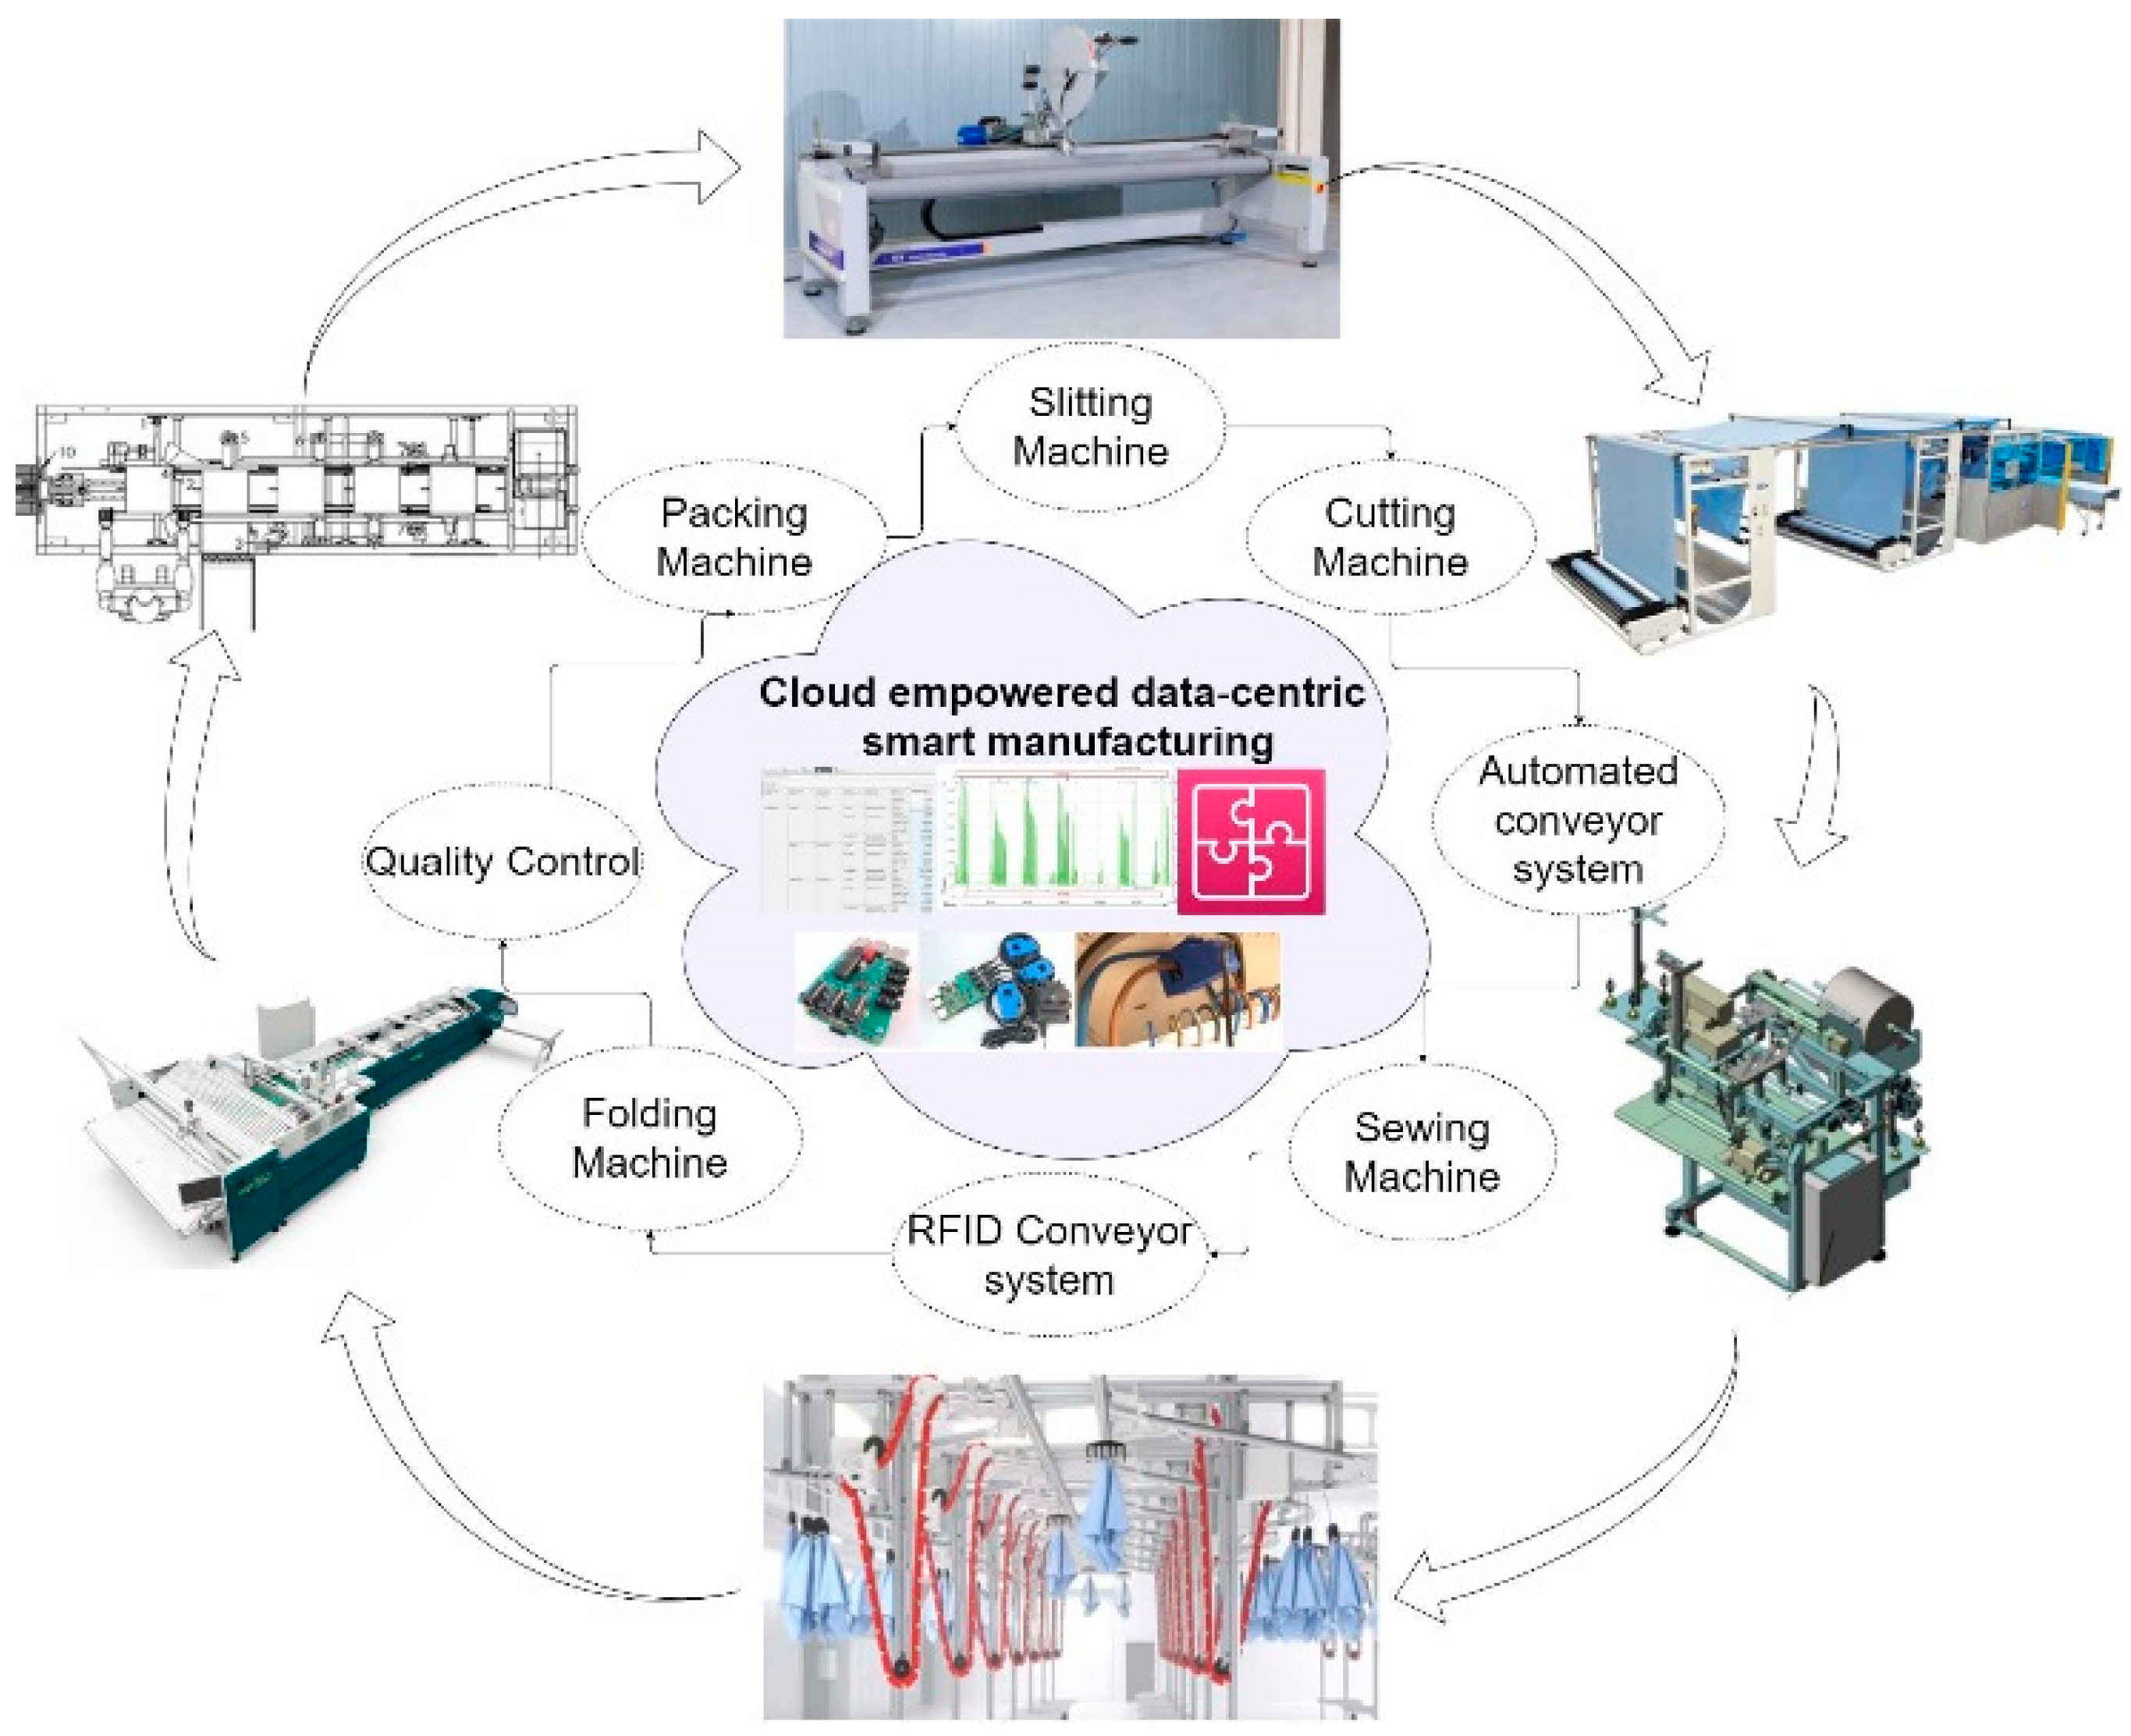
In this section, a case study is represented. This case study illustrates the implementation of technologies alongside physical machines to overcome traditional challenges. This case study is from one of the mattress protector manufacturers in Australia, as illustrated in
Figure 5.
Mattress protectors are one of the key components of human well-being. They protect humans from bed bugs and many other potential risks that spread from bedding. In addition, they protect mattresses from any tough stains such as coffee or oil spills. As depicted in
Figure 5, from input such as raw fabric from a slitting machine to output such as RFID-chip-enabled mattress protectors, the manufacturing involves a series of intrinsic production processes. These production processes are slitting, cutting, sewing, folding, packing, and warehousing. As the industry is completely craft oriented, operations are often intrinsic or heterogeneous in nature. Furthermore, these operations need human intervention at every stage to ensure the production process proceeds smoothly, as well as offer quality control. These operations can be made faster by introducing advanced machinery that is capable of self-diagnosing their faults, efficiently transferring data to perform analysis on their behavior, and possibly integrating with ERP and MES systems. As shown in
Figure 5, there are five major operations that have been continuously supported by RFID-enabled conveyor systems. All the machinery is capable of generating large amounts of complex data that make analysis a nightmare. Data generated from all the machinery collected will be further used in analysis, integration, validation, and visualization. These applications are only possible through integrated systems of advanced technologies such as ML and CC. For material allocation and diversion to the respective stations, raw fabrics are embedded with tracking technology such as RFID tags. The RFID-enabled conveyor system makes it feasible to deliver the raw materials to their respective locations. Material tracking is performed by mainly using three unique items: (i) product ID (generated from the ERP system), (ii) item code, and (iii) batch ID. These data will be validated by the MES system at every manufacturing operation. From the start, i.e., fabric rolls to sleeved and packed mattress protectors, an enormous amount of data will be generated. The data that are collected have to undergo several steps of data preprocessing, which were discussed in earlier sections of this article. Additionally, the data need definition, validation, and recognition, which will give a description of the collected data. In the collected data, there will be many instances where manufacturing stops because of unknown reasons. Out of these unknown reasons, one definite answer is anomalies within the data sets. The detection of these anomalies in these high-dimensional data is required to overcome inconsistencies within the manufacturing line. The results of anomaly detection and the correlation between the data individuals have been outlined.
6. Proposed Method and Solution
6.1. Proposed ML Methods
This section identifies current challenges and relevant methods used for anomaly detection. The following section discusses high-dimensional data analysis, precision of anomaly detection, and relevant performances of various methods. This section compares iForest and KNN methods used to address challenges.
6.1.1. Isolation Forest
The fundamental advantage of isolation forest (IF)-based anomaly detection is the unorthodox approach it takes to detect anomalies by profiling normal data sets [
18]. Rather than a conventional approach, IF directly focuses on detecting anomalies using the basic principle of decision trees. As part of this method, tree partitions are made by the feature definition of a user definition [
19]. Once the definition of the features is defined, the next step is to select the random split value between maximum and the minimum values of the aforementioned feature. To focus more on the principle of the algorithm, the target values or anomalies are achieved by using a smaller number of splits.
Anomalies occur less than in regular data and observation points, and they always lie in the furthermost space of the observation [
17]. The random splits or partitions will generate shorter paths to the anomalies than distinguishing them from normal data points. IF is dependent on the model base, the density of the data point base, and the data profiling base. Any changes to these require adjustment of IF properties. The IF properties that the govern aforementioned dependencies are:
a. Subsampling: As the name itself suggests, it does not have to isolate all the data points. IF can easily ignore normal data points or the majority of data points. This will increase the computing powers of the algorithm, as well as provide better predictions of the model.
b. Swamping: When the normal data points lie very close to anomalies, the model needs to separate the data points in multiple partitions. This iteration of separation is called swamping. To reduce the swamping process, IF often chooses subsampling as the reduction option.
c. Masking: Masking is a similar feature to swamping, but this property applies only when the number of anomalies is high in number. For instance, when there are a high number of anomalies present within a data set, the identification of anomalous data is very difficult. Because of this, IF chooses masking as an option where the set of data points within the given data set can be alleviated using subsampling
d. High-dimensional data: The reason behind choosing IF as the key solution to HD data is that the data points in HD are equally distributed all over the region. This makes traditional algorithms have difficulty identifying the anomalies. This does not mean that IF can easily detect anomalies within the data set, but it could be enhanced by adding feature selection properties to the data set. AD with IF is a method that consists of the following two important stages:
Training dataset is utilized in the initial stage to construct iTrees according to previous sections.
In the following stage, every instance that is in test set is run through iTrees which is constructed in the first stage. Additionally each instance is given an appropriate “anomaly score” using the technique detailed below: An “anomaly” point is labeled only when the score is larger than a predetermined threshold, which depends on the domain where the analysis is being performed on, once each occurrence in test set has been assigned the anomaly score.
e. Anomaly Score: The technique used to calculate the anomalous score of a data point is founded on the observation that binary search trees (BST) is equal to structure of iTrees. On the contrary, an unsuccessful attempt at searching in the BST is corresponded to the an exterior node of iTree that is terminated. Therefore, the calculation of average
H(x) for terminations of exterior nodes is identical to that of the failed BST search, presented as follows
In this case, n is known as the data size being tested, m is known as sample set size, H is identified as harmonic number, estimated by H(i) = ln(i) + Y where Y is 0.5772156649 is the Euler–Mascheroni constant.
6.1.2. K-Nearest Neighbor
The K-nearest neighbor (KNN) is an effective, simple, linear, and nonparametric supervised type of ML algorithm. However, when it comes to anomaly detection, KNN chooses the unsupervised method [
20]. This algorithm is used to build two different scenarios such as regression and classification models. The output is clearly dependent on input variables, but irrespective of inputs, KNN works on the basis of a simple strategy, i.e., the closest lying data points will be considered in the training set [
21]. Furthermore, the result of KNN classification will always be something that is highly voted by the neighboring data points. Comparatively, the regression model obtains a result from the average of the nearest lying neighbors. Thus, KNN assumes the nearest lying data points as the normal data sets and extracts the features of the neighbors [
22]. The model predicts the closest neighbors depending on the proximity of the data points. The KNN algorithm works in the following steps: (i) loading the data, (ii) initializing the nearest neighbors as chosen ones for the feature extraction, (iii) calculating the proximity distance between the training data set and test data set, (iv) extracting the proximity distance and index of the data points, (v) sorting the features or test data sets in ascending order, (vi) selecting the initial K elements from sorted data, (vii) labeling the data points for selected K elements, and, finally (viii) deciding whether to return classification or regression results depending on the mean or mode of the data points. The distance or proximity between two data points represents the similarity that completely originated from the denoted features. Thus, the Euclidean distance used in KNN can be derived from
The most important drawback of these distance-measuring equations is the similarity measure. The similarity measure is nothing but treating the nearest neighbors equally or extracting features of these data points equally. Equal extraction will result in a miscalculation of normal and anomalous data points. Due to this, deciding on the extraction of features of data points will create ambiguity within the different kinds of classifications. Thus, deciding which feature is more important is uncertain.
6.2. Results and Discussions
To outline the discussions of the results, there is a basic necessity to comprehend the correlation between the data points. The data points that were collected were from multiple industrial sensors, e.g., (i) temperature sensor, (ii) proximity sensor, (iii) accelerometer, (iv) pressure sensor, (v) infrared sensor (IR), (vi) tension sensor, (vii) ammeter, (viii) voltmeter, (ix) humidity sensor, and (x) light dependent sensor (LDR). These sensors are all independent in nature or are not directly related to each other. Any variation in any of these sensor inputs does not impact another sensor reading. To develop the correlation between the data points, the power consumption reading was recorded. Power consumption is the target variable, which was directly related to the aforementioned sensory data. This development of the relationship between the set of input variables and the set of target variable is called a correlation. The power data variation was the direct result of the target variable recorded from any of the operations’ failures. The failure data or event data can be traced back to the original cause of the interruption. To elaborate more on the relations of the data points, whenever there was an issue wit the temperature of the machine, the machine stopped. However, to detect the event cause, the power consumption was collinearly matched. To make a strong relationship between the data points, correlation analysis is very crucial. Once the analysis of correlation is performed, plotting or predicting the target variable in the given context will be easier. So, to define the correlation, when one of the data variables starts to increase or decrease, the other variable will also show behavioral changes. There might be a positive linear change, a negative linear change, or no change at all. Furthermore, there are many ways to calculate the correlation coefficients, such as: Spearman rank correlation measure, Pearson correlation measure, and Kendall correlation measure. Once the correlation coefficient has been identified, its next important job is to minimize the data dimensionality. Because of high-dimensional and high-volume data, the prediction of a target variable will be very problematic, such as high computational costs, model behavior changes from training data to test data, and the distance between two data points becoming equal because of the high distribution of the data sets. To overcome this basic challenge, the dimensions of the data points will be reduced to a greater extent; rather than focusing on every data point, it is easier to focus on major events and behavioral changes.
6.2.1. Synthetic Data Generation
Sensor data are not publicly accessible/available. To deal with this problem, we generated synthetic data of the sensor from publicly available limited data. In order to generate the synthetic data, we adopted the complete synthetic data vault (SDV) [
23]. The SDV helps to produce the synthetic data with the exact statistical properties and format as what was available in original set of data. We used four different models to generate synthetic data using SDV. They are CopulaGAN, CTGAN, GaussianCopula, and TVAE.
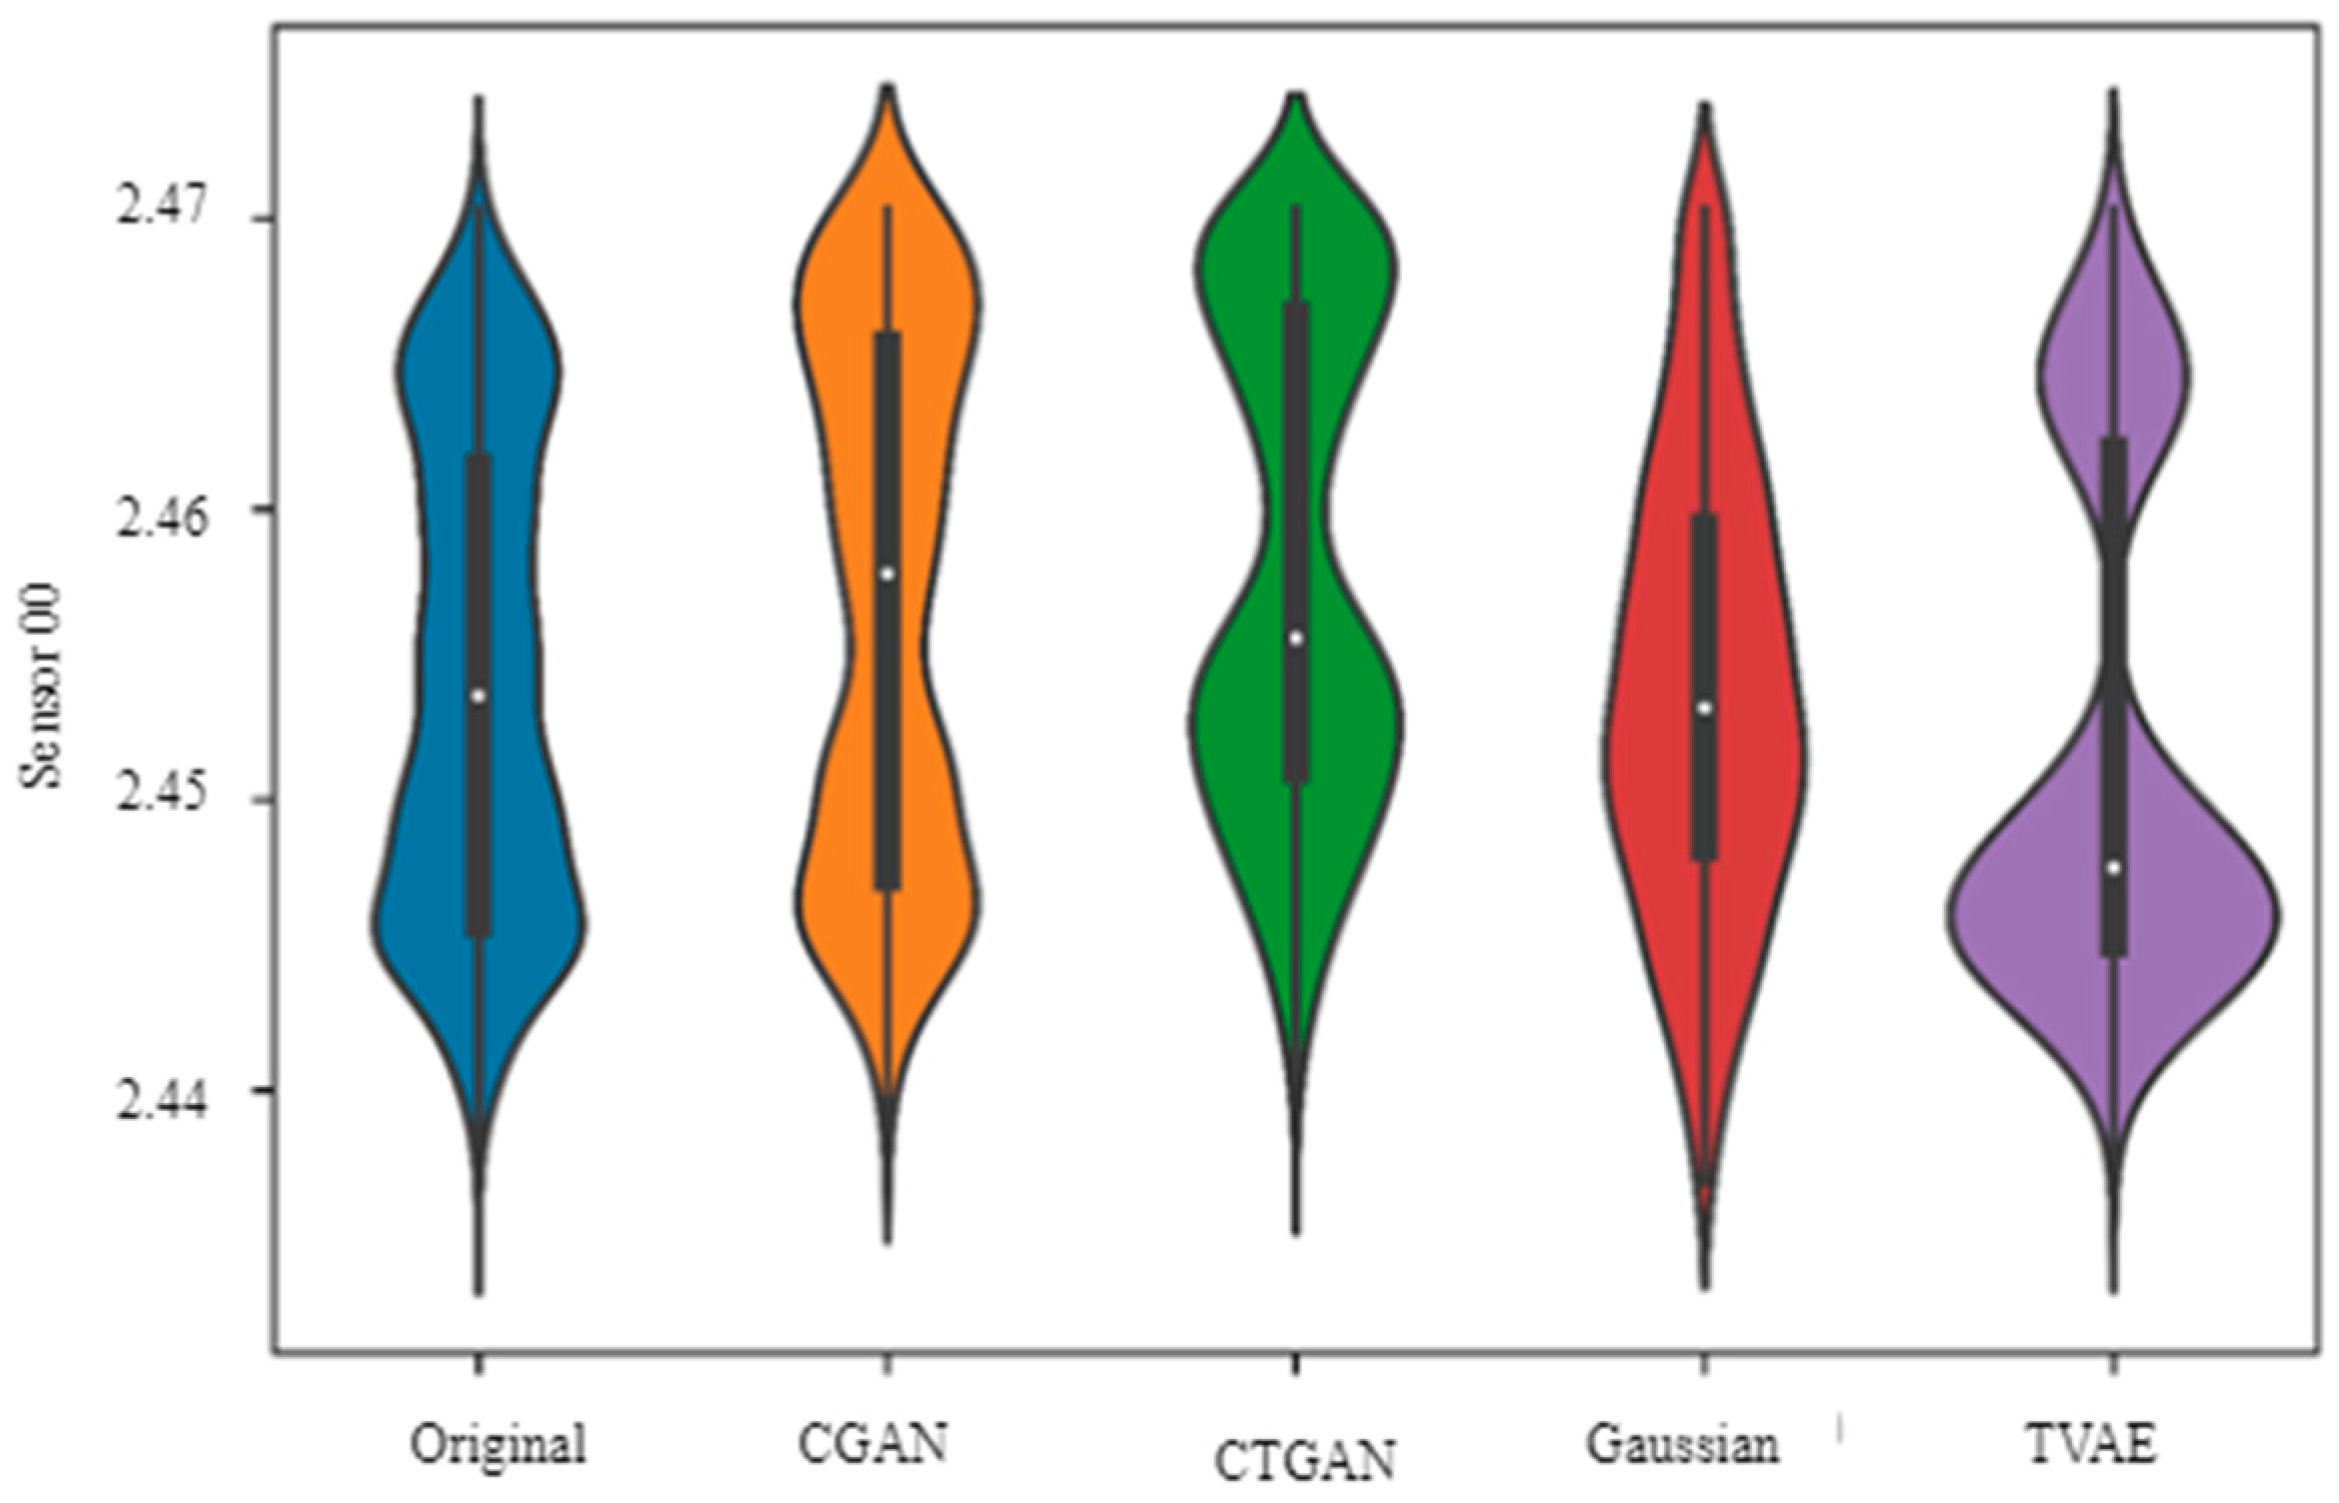
Figure 6 represents the violin plot of the synthetic data generated using four models of the SDV. The
x-axis highlights the various methods adopted, whereas the readings of the sensor are represented by the
y-axis. From
Figure 6, it is clear that the generated synthetic data have a similar distribution to the original data. Amongst the various methods compared in
Figure 6 (Sensor 00), the CGAN-method-generated synthetic data seem closest to the original data in the
y-axis.
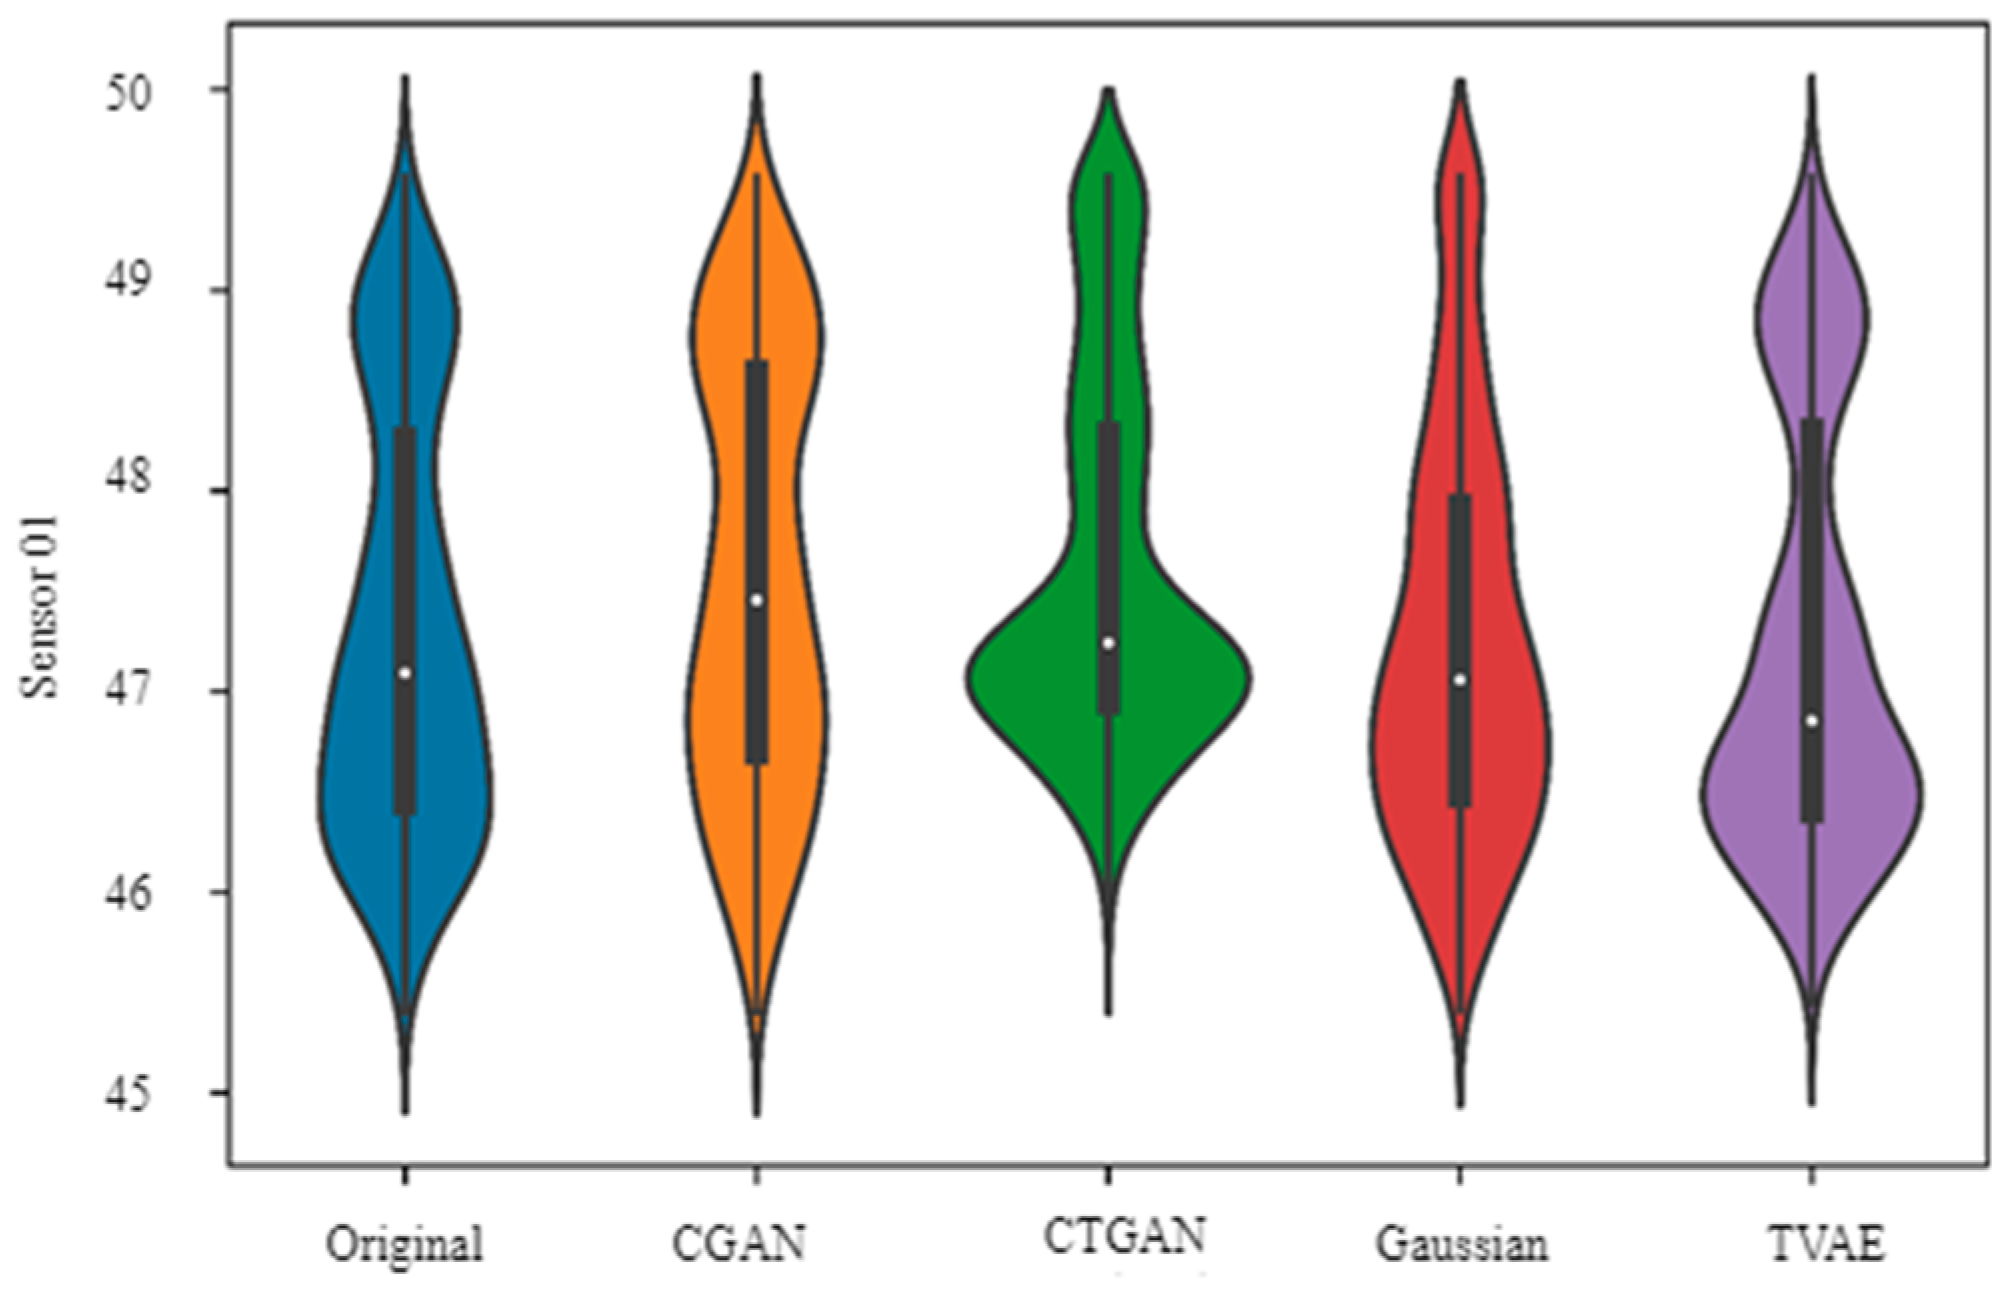
Similar to
Figure 6,
Figure 7 presents the distribution of the synthetic data generated from the original data for Sensor 01. Both
Figure 6 and
Figure 7 used synthetic data and accurately provided distribution plots comparable to original data. Thus, these figures establish that a synthetic data plot is useful despite lacking measurement data sets. Further, these synthetic methods enhanced accuracy of anomaly detection, thus improving algorithm performances.
6.2.2. Event/Anomaly Detection
In this part, we discuss the simulation results using isolation forest and the KNN algorithm. As discussed earlier, isolation forest and the KNN algorithm are applied to detect the event and anomalies in the first phase from the power consumption data, as shown in
Table 2.
Table 3 presents the classification report for event detection using iForest. These included precision, recall, F-score, and support of iForest with an overall accuracy of 97% while predicting anomalies.
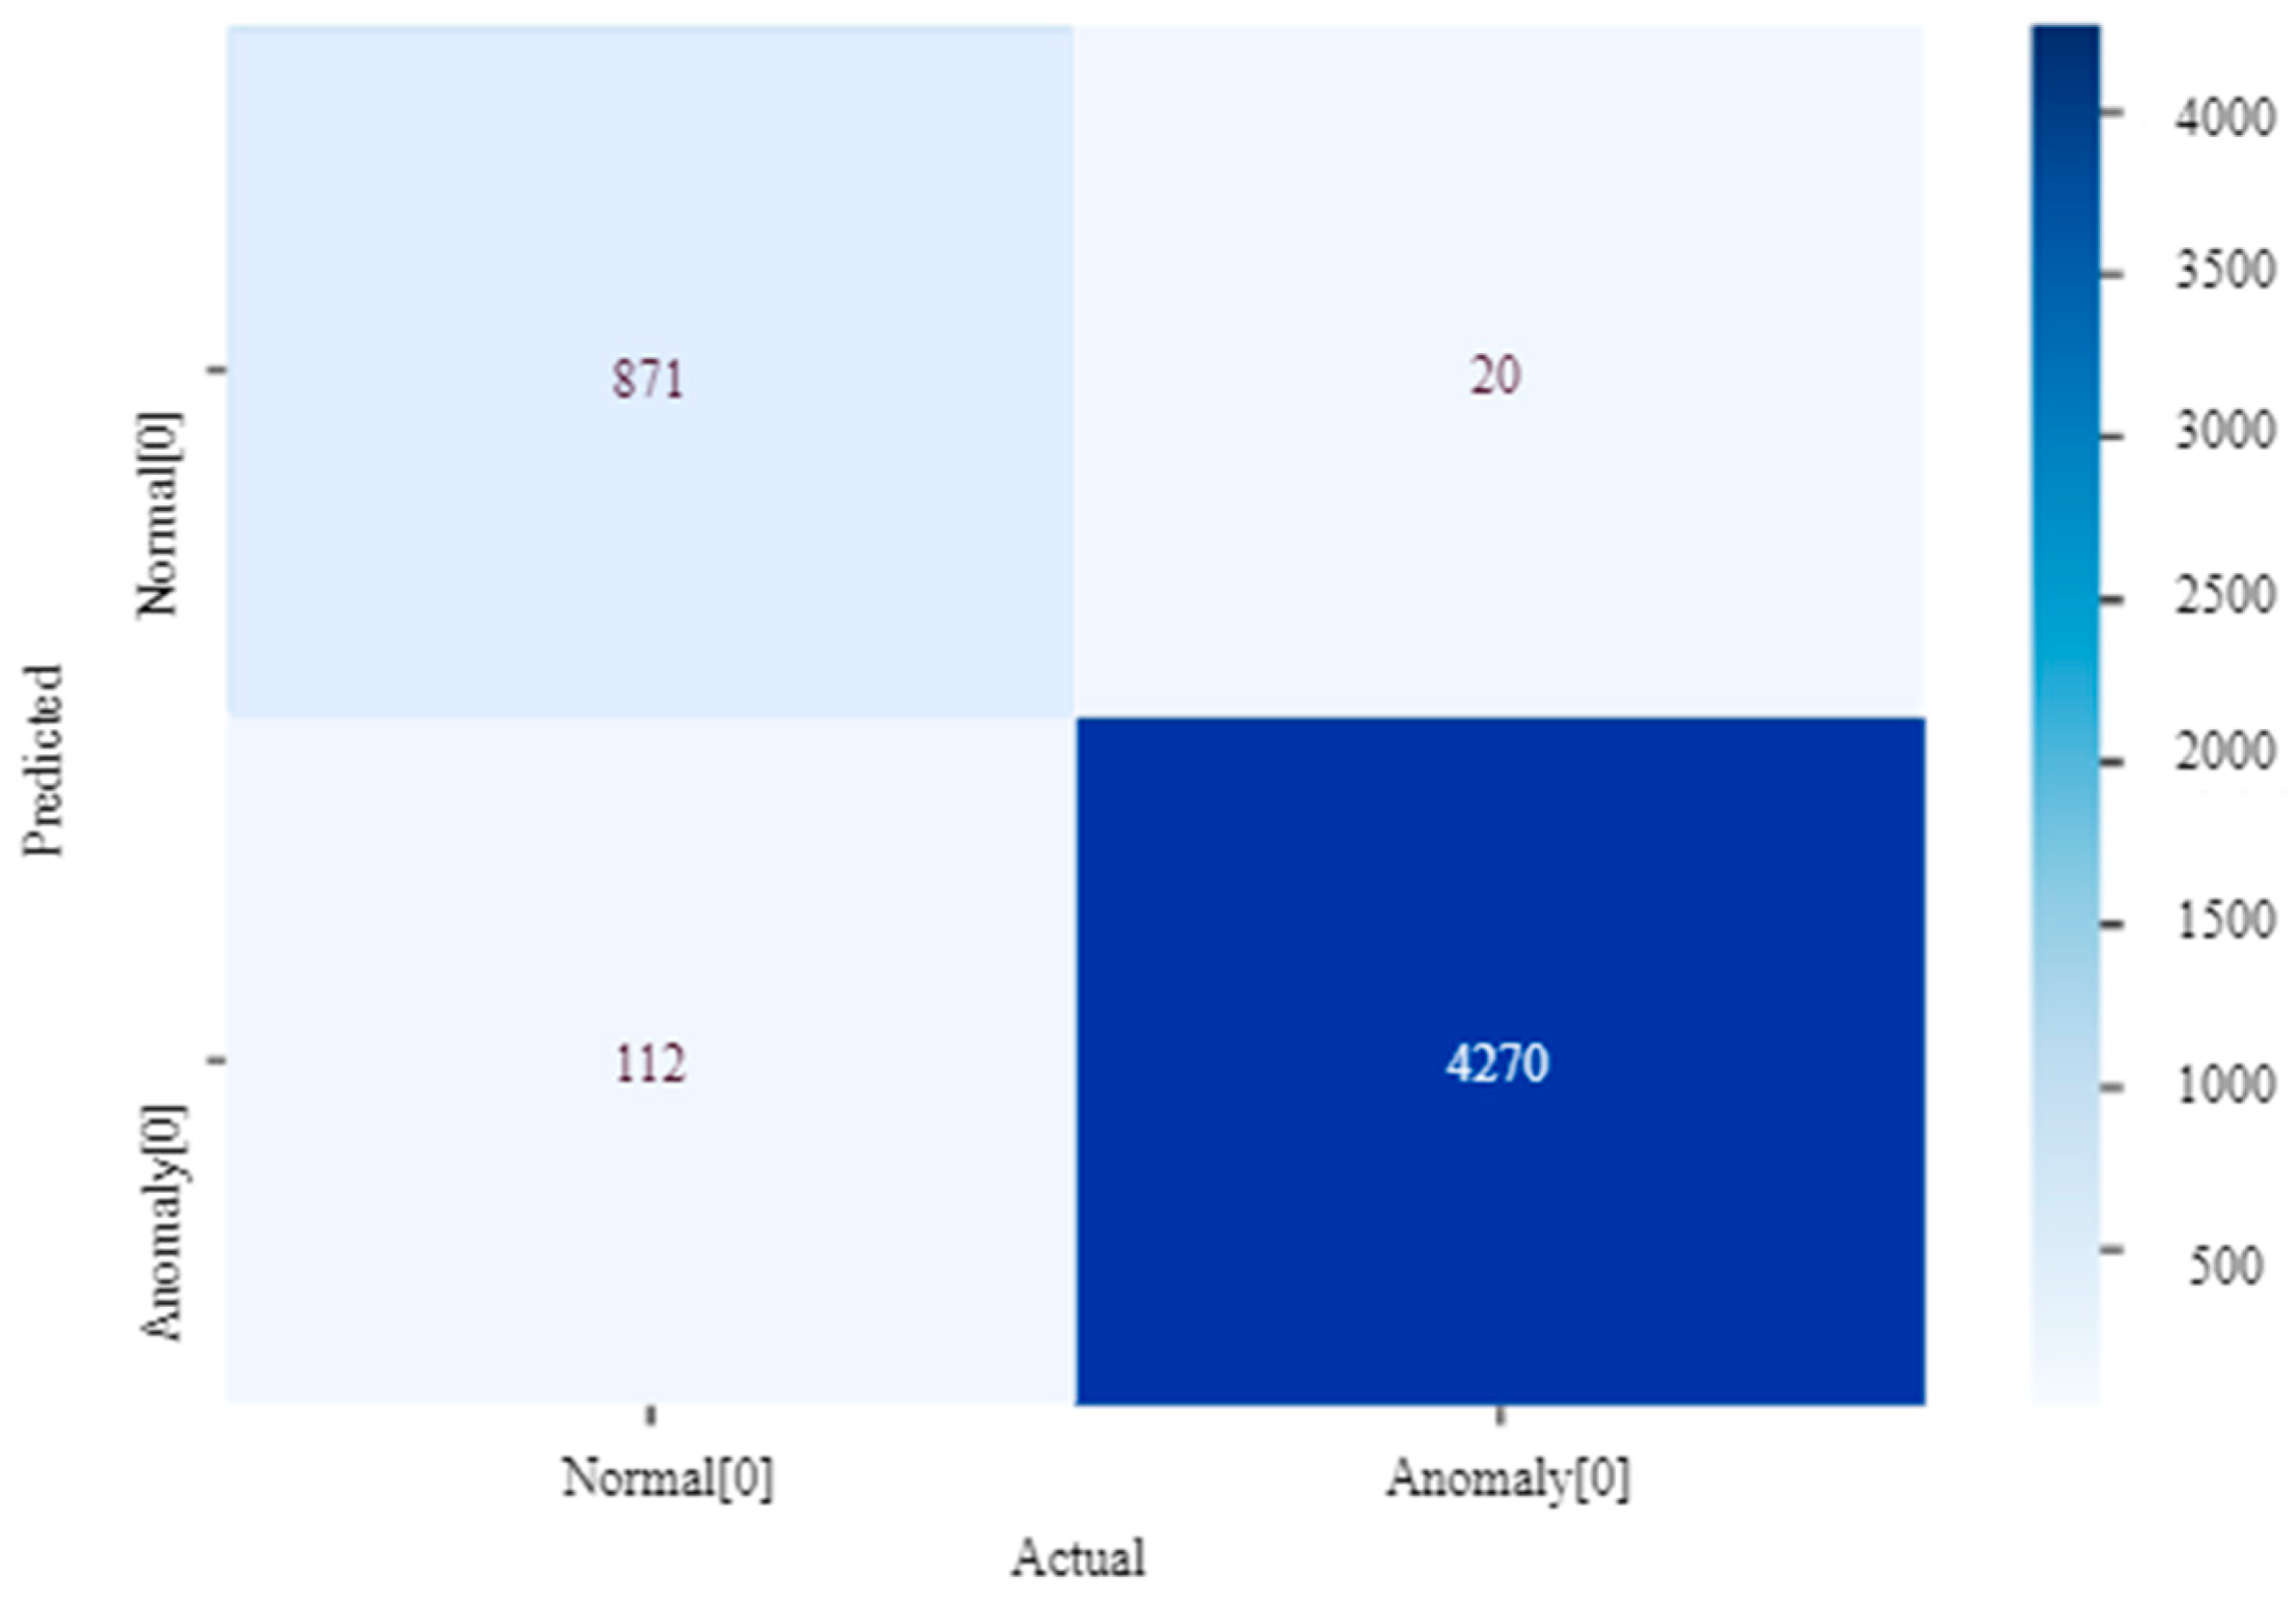
Figure 8 represents the confusion matrix calculated from the iForest algorithm, where the actual labels are represented by
x-axis, and the predicted labels with reading ranges are represented by the
y-axis represents. Out of 5000 data sets, 132 anomalies were not detected using iForest.
Further, the KNN algorithm is applied for anomaly detection in the same data set.
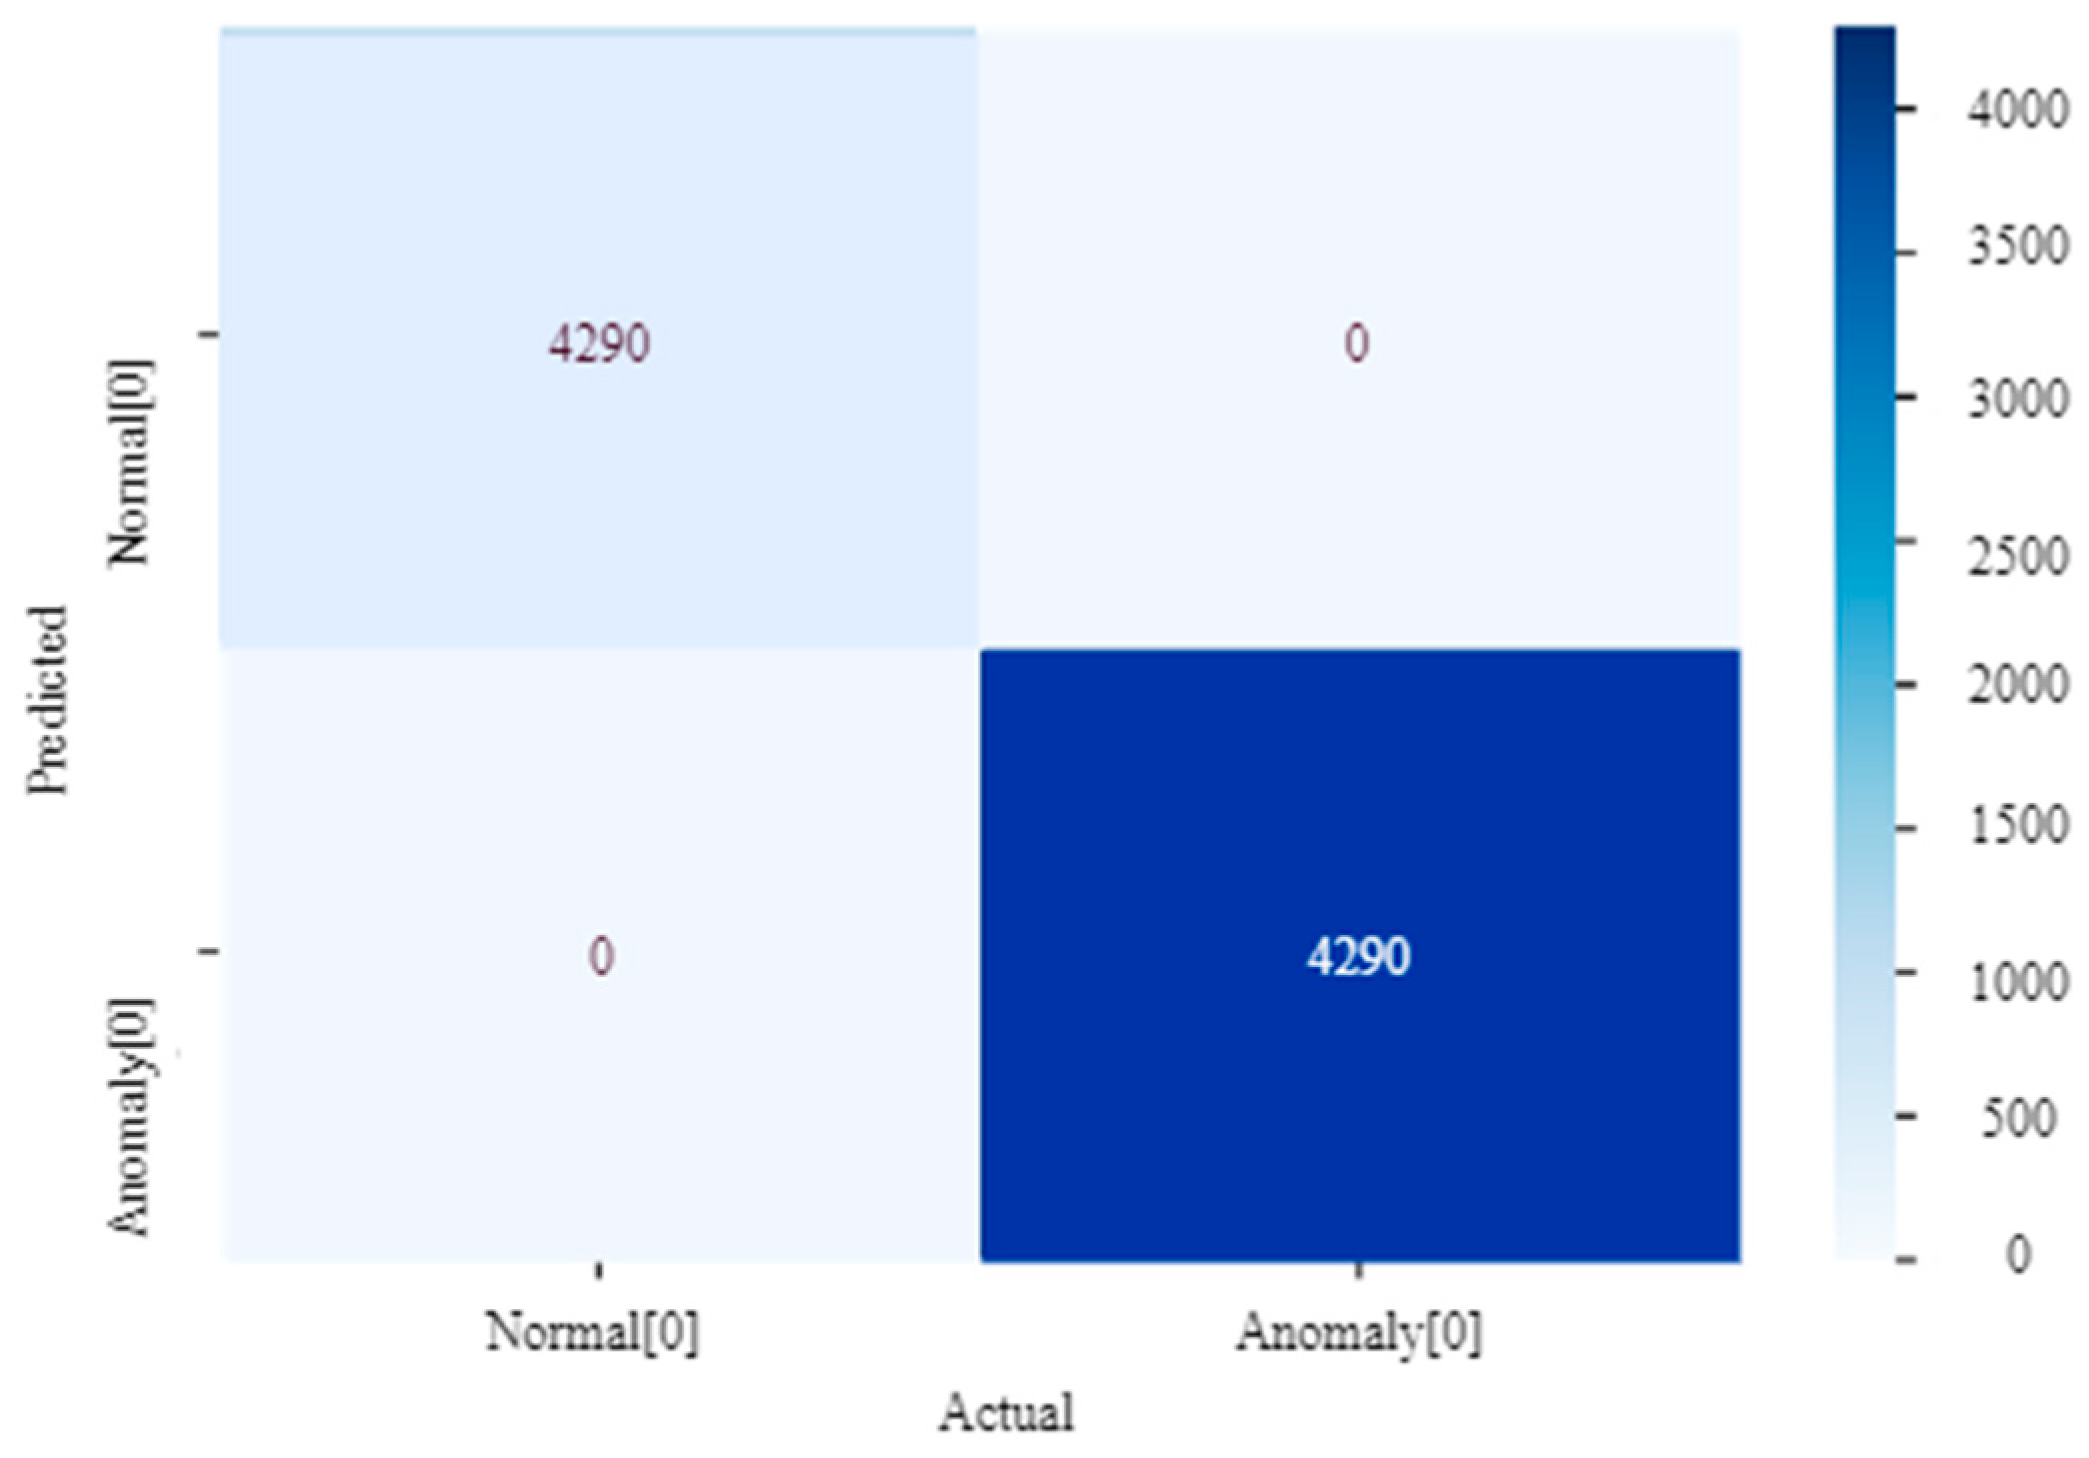
Table 4 presents the classification report for event detection using the KNN algorithm. KNN achieved an overall accuracy of 100% while predicting anomalies.
Figure 9 represents the confusion matrix for kNN classifying the anomalous and normal data. Normal data are classified as 0, and anomalous data are classified as 1. There were no inaccuracies with 4290 anomalies detected using this algorithm.
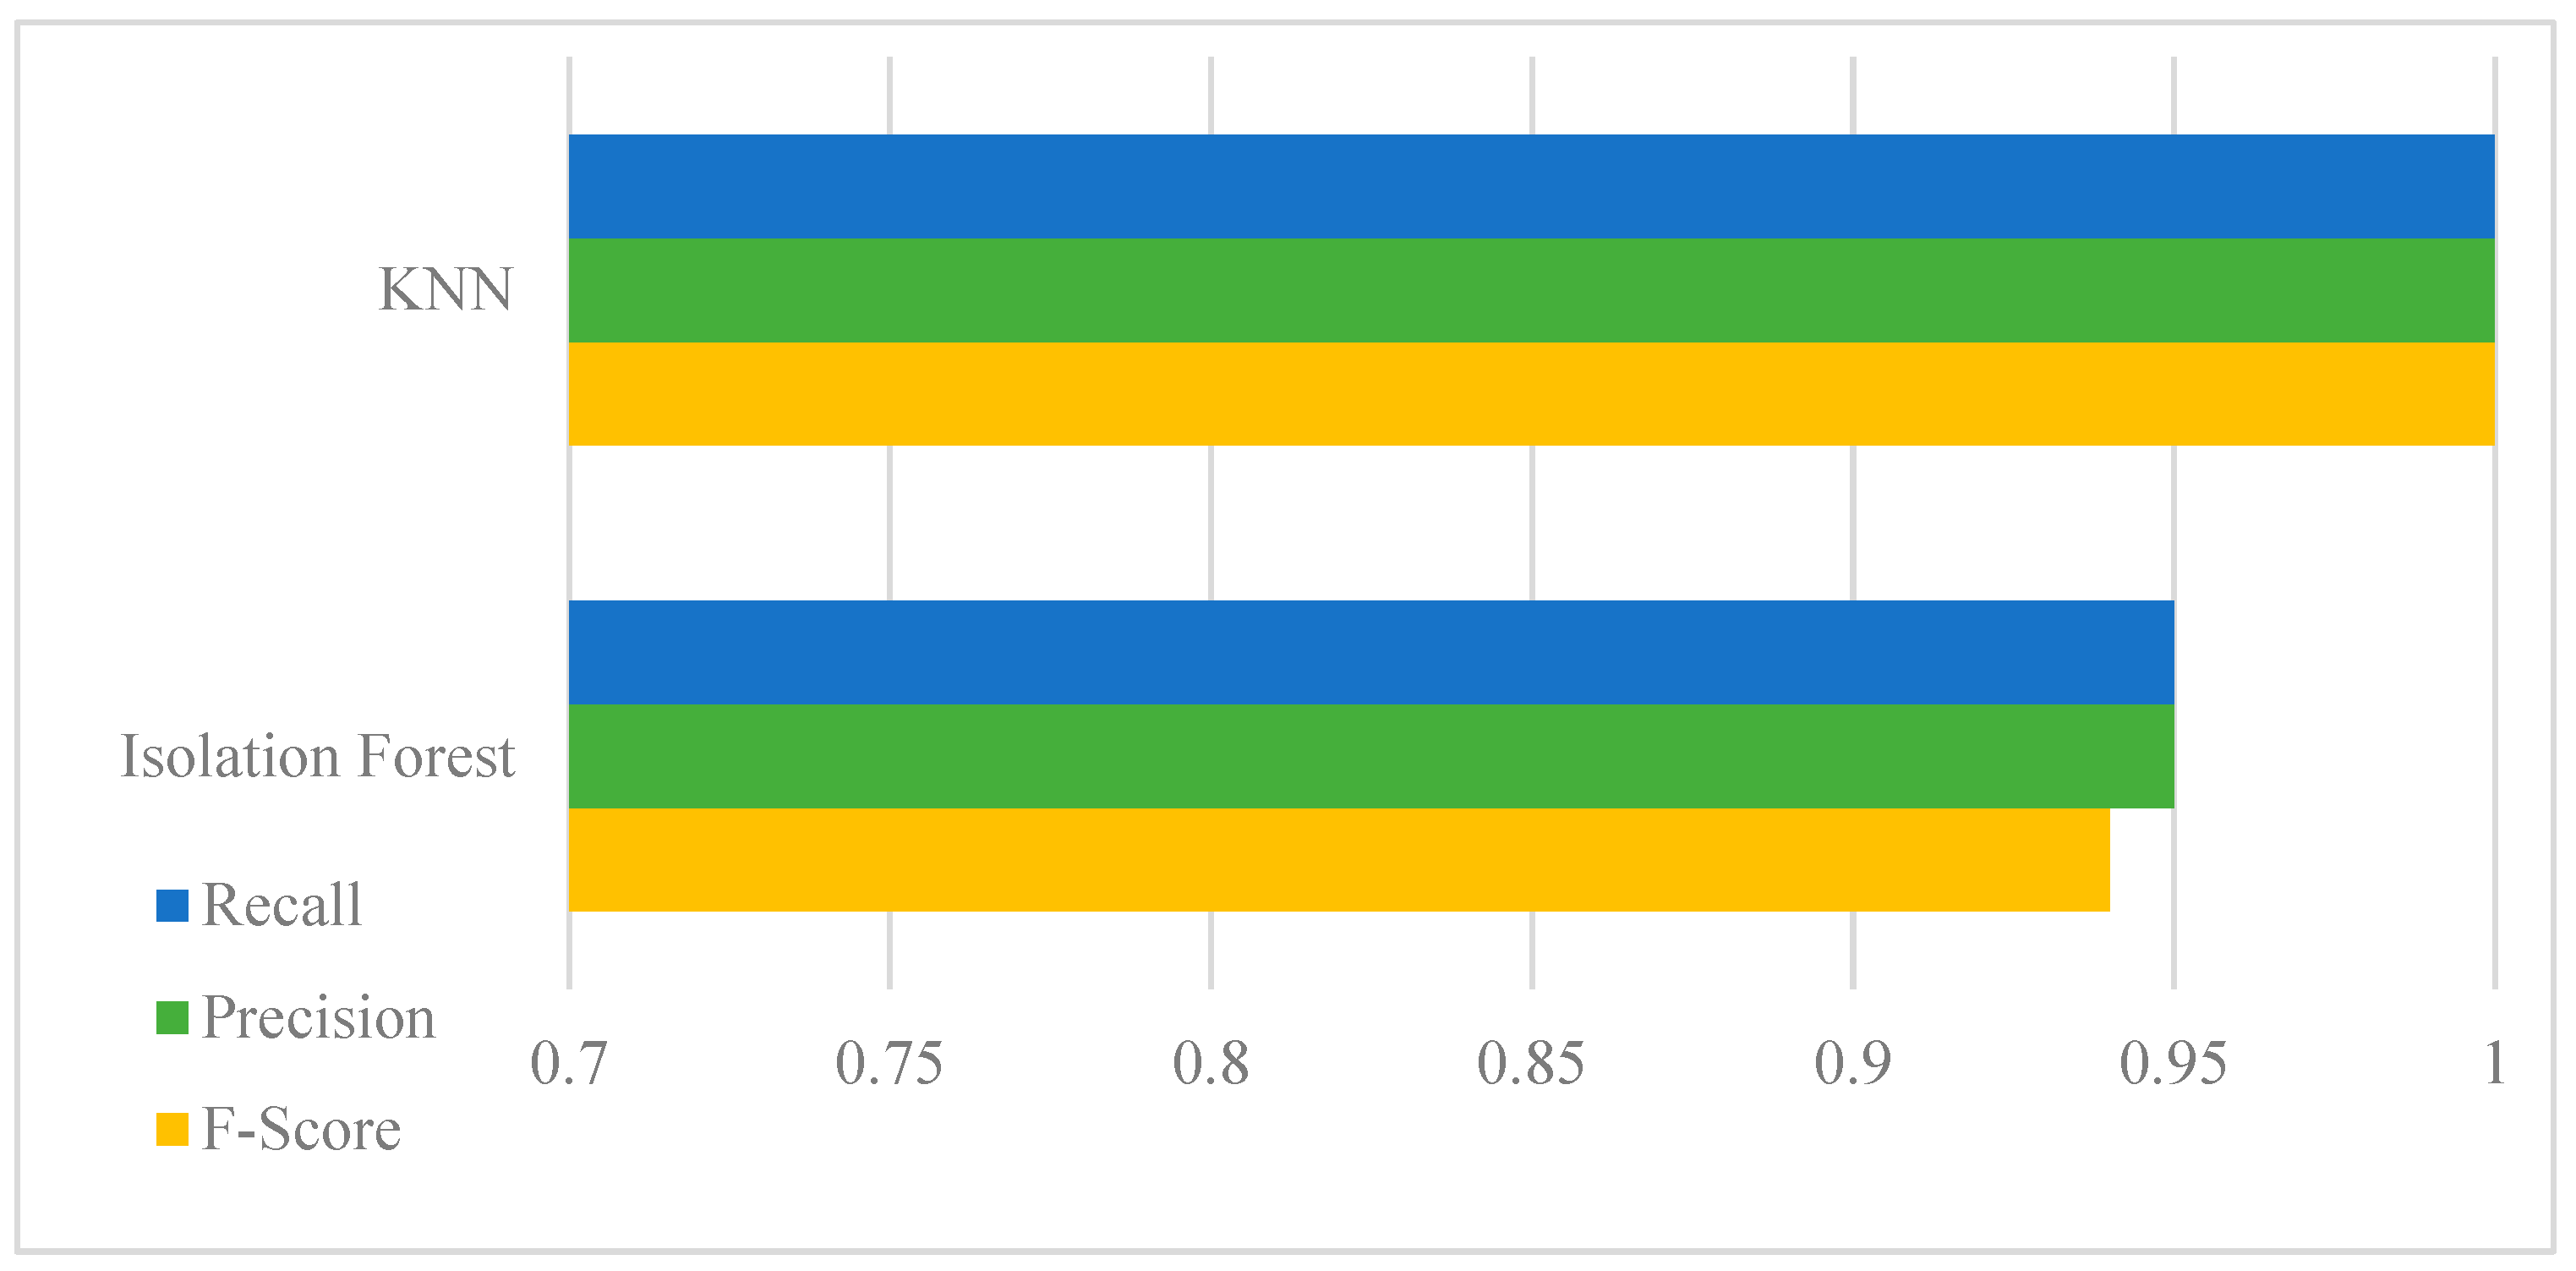
Table 5 compares the performances of the iForest and kNN algorithms in terms of F-score, precision, and recall.
Figure 10 visualizes the comparison of these two algorithms.
Although the KNN algorithm achieves a better performance than the iForest algorithm with 100, once we detect the anomalies from real power values, we then trace back the sensors’ dataset to identify which sensor is performing in an anomalous fashion. All the data points (all sensors’ measurements) for that specific timestamp (where the anomaly is detected in the real power value) are checked based on the upper threshold and lower threshold of each of the sensors’ measurements. The upper and lower thresholds are defined based on the measurements of the sensors.
Table 1 shows some of the sample tracings of the anomalous sensors from the detected anomalies in the power consumption data. For instance, an anomaly was detected in the eighth dataset sample for power consumption. The associated sensors’ readings are 15.849, 15.705, 15.654, 15.734, 15.612, and 52.91.
7. Conclusions and Recommendations
Currently, in all forms, manufacturing is complex in nature with convoluted manufacturing characteristics. Further, several controls and analytical capabilities are required to capture these convoluted characteristics. For example, sewing operations constitute more than one million multifocal datasets just captured from one sensor. Thus, integrating various sensory data and analyses to effectively arrive at a decision is a significant milestone. This paper presents a case study in the textile industry, capturing various convoluted characteristics (e.g., sensory data from machinery). Further, these data were analyzed to develop bespoke practices within manufacturing. Such an example is deriving the best anomaly detection method by comparing various anomaly detection techniques. In addition, this research further hosted analytical data on a cloud-centric platform with various access capabilities. This enabled minimizing data redundancy errors and significantly improving decision-making capabilities. Such an example is establishing significant time savings. The three V’s of data, i.e., volume, variety, and velocity, play an important role in determining the characteristics of the manufacturing sector. The amount of drastically and dynamically changing data that have been generated within the manufacturing industry is enormous and still growing. Data generated and analyzed can be used to increase efficiency within the production line. This article contributes to the cloud-centric smart manufacturing paradigm powered by data generated by manufacturing systems. This paradigm has multiple dimensions, which this article presented in a versatile manner. It covered historical aspects, data generation and maintenance aspects, and cloud empowerment in manufacturing systems. Out of all of these, the development stage of the model that constitutes data generation, transmission, processing, and realization plays an important role. Following the development stage, empowerment was achieved with cloud systems. Finally, real-time application was aided by anomaly detection in the cloud for uninterrupted smart manufacturing systems. While outlining the possibilities of the smart system, this article illustrated many challenges in every stage of development. Current trends in data collection, preprocessing, and realization, especially in high-dimensional data, are very limited. Additionally, cloud empowerment has powered the systems in data storage, processing, and analytical capabilities, but a feasible solution has not yet been proven in a practical scenario. Low latency, network unavailability, server issues, and other such problems are the top issues that can be detected in cloud empowerment.
Finally, the statement of SM claims that integration of physical and cyber systems is possible, but the data and research collected are all performed on physical data. There are no solid case studies that have taken consideration of parallel data accumulation of physical and cyber systems for a better future. Even though this article showed a promising framework of SM, it still asks important questions about data-centric smart manufacturing systems:
(1) Key feature extraction and processing of important data sets from the manufacturing system need promising improvements. IoT gateways and industrial internet of things-integrated systems need to capture more heterogeneous data from manufacturing systems.
(2) Though cloud empowerment seems fashionable and promising, issues related to fog computing, edge computing, and cloud usage instances need a better understanding. Advancements in this topic will surely decrease network latency, bandwidth issues, and server downtimes.
(3) The data analytical programs and anomaly detection strategies that were illustrated in this paper are some of the most feasible. However, the reason for the failures of other algorithms and techniques needs to be understood. Integration of these technologies into a real-time scenario is the biggest future prospect. Working in real time will enhance system efficacy in predictive measures, preventive methods, and adaptable systems.


