Abstract
In this article, a mathematical model has been developed for calculating the energy-power parameters of the drawing process in monolithic dies on straight-line drawing machines, and its adequacy has been validated in experimental wire drawing on a laboratory automated drawing machine. The program allows us to calculate drawing stress, drawing force, tensile strength and yield strength of the alloy after wire drawing, safety factor, and drawing power. The developed mathematical model differs in that it allows us to evaluate the uniformity of deformation over the wire section, depending on the technological parameters of the deformation zone, namely, the semi-angular die, the coefficient of friction and the degree of deformation. To select the technological parameters of the deformation zone, which ensure uniform deformation over the wire cross-section, a nomogram was compiled. The equations of hardening during nickel NP2 wire drawing are obtained. The calculation of energy-power parameters of drawing nickel NP2 (Ni 99.6) wire ∅1.8 mm from ∅4.94 mm wire rod is given. Experimental studies have been carried out to determine the energy-power parameters of nickel wire drawing on a laboratory drawing machine with an installed ring strain gauge to determine the drawing force. A change in the friction coefficient by 0.02 when drawing nickel wire leads to an increase in stress and drawing force by 20%. To improve the accuracy of the developed mathematical model, it is shown that in the future, it would be necessary to conduct experimental studies on a laboratory drawing machine to determine the effect on the energy-power parameters of the drawing process of the values of technological parameters entered into the program as constant real values, such as the friction coefficient, die half-angle, drawing speed, and back tension.
Keywords:
wire; nickel; cold work; tensile strength; yield strength; elongation; drawing machine; drawing force 1. Introduction
The wire is produced by such metal-forming processes as rolling [1,2,3], extrusion [4,5,6,7,8], drawing [9,10,11,12] and their combination [13,14,15]. Drawing is the most common method of making wire. Drawing can be carried out through monolithic [16,17], and roller [18] dies. Alloys such as stainless steels and titanium alloys, which are difficult to work with monolithic drawings, are plastically deformed in roller dies. This makes it possible to replace sliding friction with rolling friction between the tool and the wire, which reduces the drag force and allows large single strains to be applied per pass [19,20]. However, monolithic drawing remains the most common and frequently used method of wire production. The transition from the pulley-type continuous wire drawing machine to the straight-line wire drawing machine has led to a change in the technical and technological parameters of the drawing process in a monolithic die [21]. Significant changes with the introduction of straight-line drawing machines are associated with an increase in drawing speed. The high level of automation of modern drawing equipment has made it possible to increase the drawing speed in dry wire drawing from 8 m/s to 40 m/s, which in turn entails a change in requirements for lubricants, the quality of preparation of the wire surface and drawing tools [22]. The straight-line principle of high-speed wire drawing introduces its own characteristics into the methods for constructing drawing routes and estimating the energy-power parameters of the process [23].
The energy-power parameters of the wire drawing process depend on such technological factors as the mechanical properties of the material being processed, its tendency to harden during cold deformation, a single degree of deformation, the friction coefficient at the metal-wire contact, the design parameters of the die, and the drawing speed [24,25,26]. The stability (non-break) of the process, the efficient and trouble-free workload of the drawing machine, and the validity of the choice of drawing equipment when designing production lines depend on the accuracy of determining the energy-power parameters.
To determine the energy-power parameters of the drawing process, mathematical modeling can be applied [27,28,29], including simulation in such well-proven packages as QForm, ABAQUS, and DEFORM [30,31]. It is possible to determine the drawing force and the power consumed during drawing experimentally. To do this, it is necessary to install strain gauges on the drawing machine [32] and provide for the recording and subsequent processing of electrical signals by the automation system in the readings of the drawing force and the power consumed by the electric motor [33].
Simulation in specialized programs such as QForm or Deform is a highly skilled and time-consuming process. The validity of its application is obvious in theoretical studies of the drawing process [34]. For practical and production tasks that require a fast response, it is inefficient. For such purposes, an effective tool is the traditional estimation method for calculating power parameters, which is used in many basic studies of the wire drawing process [35,36]. At the same time, it must be said that the calculation method for determining the energy-power parameters requires adaptation to modern conditions of a straight-line high-speed drawing.
The purpose of this work is to develop a mathematical model for calculating the energy-power parameters of the drawing process in monolithic dies on straight-line drawing machines and to assess its adequacy when conducting experimental wire drawing on a laboratory automated drawing machine. The verified mathematical model and program will make it possible to determine the values of the friction coefficient depending on technological lubricants, die angles, drawing speed, and type of drawn alloy after experimental studies of the drawing process. New knowledge about the drawing process will make it possible to improve it and develop more effective technological lubricants, die designs, and drawing routes.
2. Materials and Methods
The wire rod Ø4.94 mm from nickel NP2 (Table 1) was drawn on a laboratory drawing machine (Figure 1) equipped with sensors for measuring the drawing force, speed, and the ability to save the measured parameters for their subsequent statistical processing.

Table 1.
Chemical composition (wt %) of the NP2 nickel (analogue of Ni 99.6).
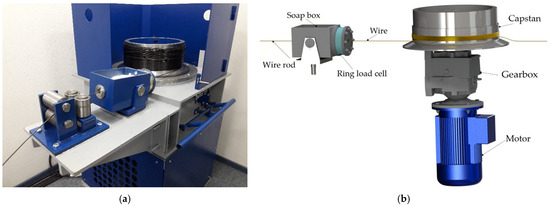
Figure 1.
Laboratory Drawing Machine with Force Sensor: (a) photo; (b) scheme.
The drawing machine was designed by us for conducting research on the drawing process in laboratory conditions. The pulling drum with a diameter of 400 mm is driven by an electric motor with a power of 2.2 kW through a gearbox with a gear ratio of 25.23. A monolithic die (Figure 2a) is installed in the soap dish for supplying lubricant, which, when drawing, presses on the ring load cell (Figure 2b). Maximum allowable drawing force (Figure 2b) for measurement 9800 N. The drawing parameters are controlled from the control panel, which also shows the measured values in the form of tables and graphs. The software for controlling the drawing machine and recording the measured values was also developed by us.
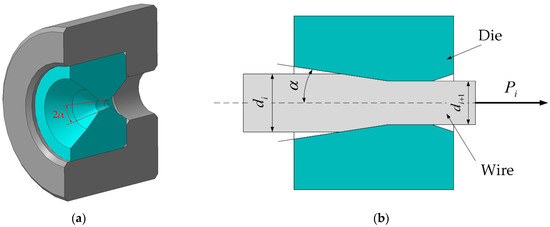
Figure 2.
Wire drawing in a monolithic die: (a) monolithic die; (b) deformation zone scheme.
Wire drawing was done in monolithic dies with a half-angle (Figure 2). When drawing, a lubricant that provides a friction coefficient of 0.05 [37] was used. The wire drawing route is shown in Table 2.
Table 2.
Drawing route for Ø1.8 mm wire from Ø4.94 mm wire rod.
The mechanical properties of the wire, namely, tensile strength, yield strength, and residual elongation, were determined by the static tension method according to GOST 1497-84 on an Instron 5882 tensile testing machine (Figure 3) [38].
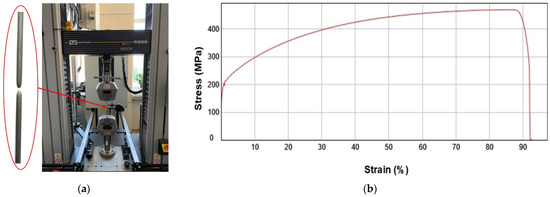
Figure 3.
Wire testing on an Instron 5882: (a) foto; (b) the tensile diagram wire rod Ø 4.94 mm.
3. Results and Discussion
3.1. Effects of Cold Working on the Mechanical Properties of the NP2 Nickel
Wire drawing in monolithic dies is carried out without heating the metal. In this regard, during cold working, the metal is riveted, i.e., its strength properties (tensile strength and yield strength) increase. Simultaneously with this, plastic properties decrease.
The dependences on which these indicators change for each alloy are individual. Also, the change in strength properties during the drawing process is influenced by such technological parameters of the process as drawing speed, drawing route, and die angle [39].
Therefore, to build an accurate energy-power mathematical model of the drawing process, it is necessary to know the equations for changing the tensile strength and yield strength of the alloy under study from cold work.
Based on the results of tensile tests in the Excel mathematical package, the dependences of tensile strength and yield strength (Figure 4) on the cold working of nickel wire were constructed. There are various methods for assessing the hardening of a material [38,40]. We used built-in Excel functions and determined trend lines and approximation equations for the resulting dependencies.
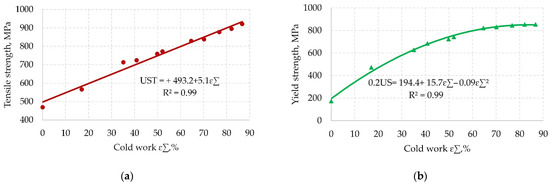
Figure 4.
Tensile strength (a) and Yield strength (b) dependence on cold work of NP2 nickel.
Evaluation of plastic properties, namely relative elongation, is also important for the drawing process. To evaluate the change in plastic properties during cold work, the equation shown in Figure 5 was obtained from the results of tensile tests.
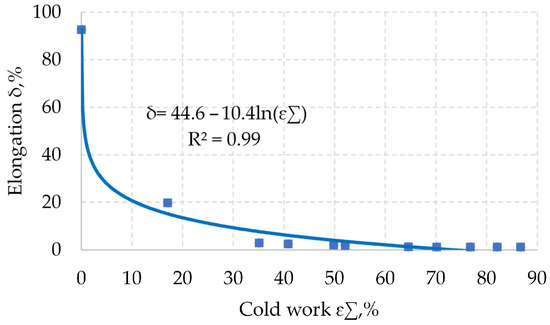
Figure 5.
Elongation dependence on cold work of NP2 nickel.
The construction of hardening curves for various alloys is very laborious work, but the presence of equations describing changes in the tensile strength and yield strength on cold work makes it possible to significantly improve the accuracy of mathematical modeling of the drawing process and to know the limiting values of the drawing force at which the wire will break.
3.2. Mathematical Modeling for the Wire Drawing Process
The energy and power parameters of the drawing process are the drawing power and force [41,42]. The power expended on the drawing process is determined by the force and drawing speed .
When drawing on industrial multiple straight-line drawing machines, the drawing speed from the first to the next pull drum increases by the amount of deformation in the die between them (Figure 6).
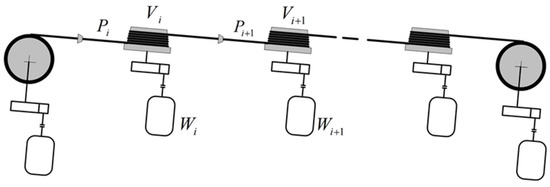
Figure 6.
Multiple wire drawing scheme.
The drawing speed on a straight-line drawing machine by passes is calculated as
where is the drawing speed at the entrance to the -th die;
is the drawing ratio in the -th die when drawing a round wire (Figure 2b);
is the cross-sectional area of the wire at the entrance to the -th die;
is the cross-sectional area of the wire at the exit from the -th die;
is the wire diameter at the entrance to the -th die;
is the wire diameter at the exit from the -th die.
Along with the drawing ratio during drawing, the degree of deformation is also used to assess the deformation, which can be calculated as
The value of a single degree of deformation in the design of the drawing route is set from various considerations [42]. This can be the power of the drives and the multiplicity of the existing drawing bench [43], the features of the wire being processed [44], the quality of the wire surface preparation before drawing [40], etc.
However, when choosing a drawing route, it is necessary to remember the non-uniformity of deformation over the wire cross section during drawing in a monolithic die [30].
In studies [24,39], it was found that in order to reduce the unevenness of deformation, the degree of deformation should be calculated taking into account the die half-angle and the friction coefficient .
If the half-angle of the die is set constructively during the manufacture of the die and can be from 3 to 9°, then the value of the friction coefficient is difficult to determine and is not constant. Sliding friction during the drawing process is determined by the quality of the surface preparation of the wire and die, the grade of the alloy being drawn, the type of technological lubricant used, and the drawing speed. It is rather problematic to determine the friction coefficient in industrial conditions; however, in studies [37,39], it was experimentally established that its value can take values from 0.01 to 0.15.
The nomogram of calculated values of the degree of deformation from the die half-angle and the friction coefficient is shown in Figure 7.
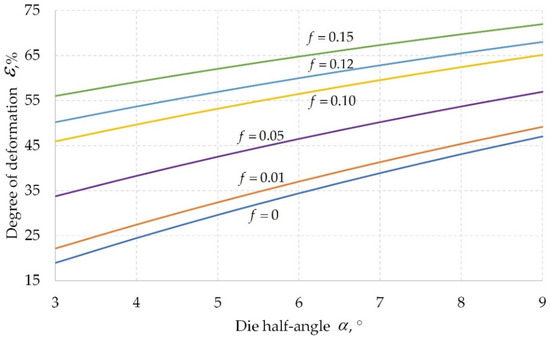
Figure 7.
Degree of deformation of providing uniform deformation over the wire cross section, depending on die half-angel and friction coefficient (nomogram).
The deformation zone parameters and the mechanical properties alloy of the wire determine the drawing stress that will occur when the wire is pulled through the die. There are several formulas to determine the drawing stress [39]. However, only some of them take into account such an important indicator for energy-power parameters as the die half-angle.
In our experience, the most suitable formula to determine the drawing stress is the Körber and Eichinger formula [40]
where is the average yield strength of the alloy in the deformation zone.
The formulas for the change in tensile strength and yield strength from cold work for the NP2 nickel obtained experimentally are shown in Figure 4. For other common alloys, similar relationships are shown in Table 3 [45].
Table 3.
Equations for the change in tensile strength and yield strength when drawing alloys.
The drawing tension is an indicator that not only determines the drawing force and power but also allows the evaluation of the stability of the process, i.e., the probability of breaking the front pulling end of the wire by pulling it through the tapering hole of the die.
The safety factor is estimated by the ratio of the temporary resistance to rupture of the wire at the exit from the -th drawing die to the drawing stress arising in it.
The safety factor for continuous wire drawing should be more than 1.5 [35,36].
To determine the drawing force, it is necessary to know the drawing stress and the cross-sectional area of the wire at the exit of the die
The results of the calculation of the energy-power parameters of the drawing process must satisfy three main conditions
where is the allowable margin of safety for a given wire size;
is the allowable drawing force according to the drawing machine passport; and
is the motor power installed on the drawing machine.
Based on the described methodology for designing wire drawing routes and calculating the power parameters of the drawing process, a computer program has been compiled. The results of the calculation of the energy-power parameters of drawing for the experimental drawing route (Table 2) are shown in Table 4.
Table 4.
Energy-power parameters calculation of drawing wire 1.8 mm from wire rod 4.94 mm from NP2 alloy.
3.3. Verification of the Convergence of the Calculated and Experimental Drawing Forces of Nickel NP2
A comparative analysis of the drawing forces obtained experimentally during the drawing on a drawing machine (Figure 1) and the calculated values (Table 4) was carried out to verify the developed mathematical model. Measured on a laboratory drawing machine and obtained by drawing the wire in pass 3 (wire diameter 3.20 mm), the drawing force data are shown in Figure 8. As can be seen on the curve (Figure 8), the value of the drawing forces changes from the maximum value of 3650 to the minimum value of 2750 N. This is due to a change in the friction conditions in the deformation zone, the cause of which may be a different quality of the wire surface preparation along the length and an unsettled flow of technological lubricant into the deformation zone. The presence of a large number of measurements of the drag force per second, which is more than 600 points per second, allows the calculation of the average value. In this experiment, the average value of the drag force is 3050 N. The experimental values of the drawing forces along the entire drawing route are shown in Table 5. A comparison of the calculated and experimental drawing forces is shown in Figure 9.
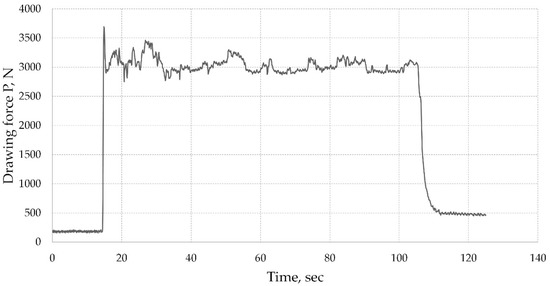
Figure 8.
Experimental time diagram of the wire drawing force in pass 3.
Table 5.
Experimental drawing force of nickel wire NP2.
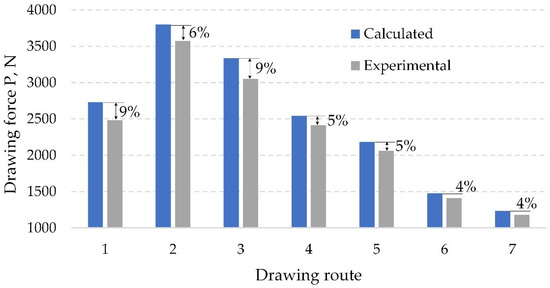
Figure 9.
Comparison of experimental and calculated nickel drawing forces NP2.
Figure 9 shows that the calculated drawing forces are greater than the experimental ones by 4–9%. This may be due to the fact that in the calculations, we took the friction coefficient equal to 0.05. In real conditions, its value could be lower. However, for carrying out analytical studies of the influence of technological parameters on energy and power parameters in the design of drawing routes, the adequacy of the developed mathematical model is very good. The calculation error does not exceed 10%. In turn, it would be useful to evaluate the effect of the friction coefficient and the die half-angle on the energy-power parameters by the calculation method.
3.4. Analytical Studies of the Influence of the Coefficient of Friction and Die Half-Angle on the Energy-Power Parameters of Drawing Wire from Nickel NP2
The mathematical model of the drawing process implemented in the form of a program allows us to quickly and fairly accurately estimate the energy-power parameters of the process of drawing wire from different alloys. It is necessary to change the formula for the dependence of hardening on cold work to change from one type of material for drawing to another.
Also, the developed mathematical model makes it possible to evaluate the influence of technological parameters on energy and power parameters. As an example, we present the results of calculations that show how the drawing stress and drawing force change with a change in the die half-angle (Figure 10) and friction coefficient (Figure 11). As you can see, a decrease in the half-angle of the die leads to an increase in the drawing stress (Figure 10a) and the drawing force (Figure 10b). This is due to the fact that, at a constant degree of deformation, a decrease in the half-angle of the die leads to a decrease in the contact zone between the wire and the die. A decrease in the contact area should lead to a decrease in the drawing force, which is confirmed by calculation results. However, with an increase in the half-angle of the drawing die, the conditions for injecting technological lubricant into the deformation zone worsen. The deterioration of the efficiency of the lubricant leads to an increase in the coefficient of friction. Calculated results of the effect of the friction coefficient on the drawing stress and the drawing force are shown in Figure 11. As we can see, in Figure 11, a change in the friction coefficient by 0.02 leads to an increase in the drawing stress and drawing force by 20%.
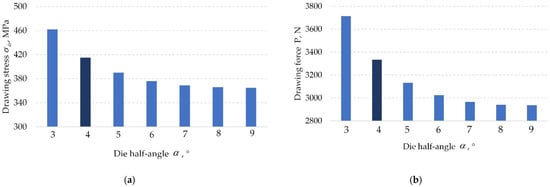
Figure 10.
Calculation results of drawing stress (a) and drawing force (b) of nickel NP2 depending on die half-angle.
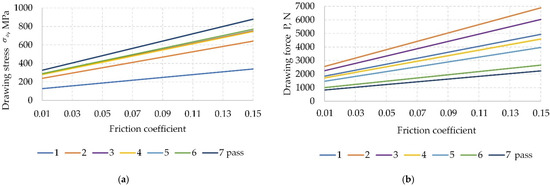
Figure 11.
Calculation results of drawing stress (a) and drawing force (b) of nickel NP2 depending on the friction coefficient.
The analysis shows that the influence of the die half-angle and the friction coefficient on the energy-power parameters of the drawing process is very significant. The accuracy of specifying these values in mathematical modeling will determine the adequacy of the obtained calculation results. These indicators also significantly depend on the types of lubricants used and the quality of the surface preparation of the die and wire rod.
In connection with the foregoing, it becomes relevant to conduct experimental studies to study the effect of technological parameters of drawing, namely lubricants, dies half-angle, drawing speed, and back tension by an experimental method on a laboratory drawing machine designed and manufactured by us. This will make it possible to clarify the values of technological parameters and bring the results of mathematical modeling closer to real values when designing energy-efficient wire drawing routes.
4. Conclusions
In this article, a mathematical model was developed for calculating the energy-power parameters of the drawing process in monolithic dies on straight-line drawing machines, and its adequacy has been tested in experimental wire drawing on a laboratory automated drawing machine.
The developed mathematical model differs in that:
- -
- Allows us to evaluate the uniformity of deformation over the wire section, depending on the technological parameters of the deformation zone, namely, the die half-angle, the friction coefficient, and the degree of deformation. To select the technological parameters of the deformation zone, which ensure uniform deformation over the wire cross-section, a nomogram was compiled;
- -
- The calculation of the drawing stress is carried out for multiple straight-line drawing machines, taking into account the hardening of the alloy, depending on the cold work. For nickel NP2, the equations of hardening during wire drawing are obtained. Using nickel NP2 as an example, a method for obtaining dependences of tensile strength and yield strength on cold work is shown, using which equations can be obtained for other alloys;
- -
- When checking the adequacy of the mathematical model, it was revealed that in the calculations, it is necessary to more accurately indicate the values of the friction coefficient. The influence of the friction coefficient on the drawing stress and the drawing force is significant. A change in the friction coefficient by 0.02 leads to an increase in the drawing stress and drawing force by 20%;
- -
- The program compiled on the basis of the presented mathematical model is a very convenient and efficient assistant in the calculation and design of wire drawing routes on multiple straight drawing machines. The program allows us to calculate the drawing stress, drawing force, tensile strength and yield strength of the alloy after wire drawing, safety factor, and drawing power;
- -
- In the future, experimental studies should be carried out on a laboratory drawing machine to determine the effect on the energy-power parameters of the drawing process of the values of technological parameters entered into the program as constant real values, such as the friction coefficient, the die half-angle, drawing speed and back tension. This will improve the accuracy of the developed mathematical model.
Author Contributions
Conceptualization, L.V.R. and I.N.E.; methodology, L.V.R. and D.V.G.; software, R.A.L.; validation, R.A.L. and D.V.G.; formal analysis, I.N.E.; investigation, R.A.L.; data curation, R.A.L.; writing—original draft preparation, L.V.R.; writing—review and editing, L.V.R. and I.N.E.; visualization, L.V.R. All authors have read and agreed to the published version of the manuscript.
Funding
This research received no external funding.
Institutional Review Board Statement
Not applicable.
Informed Consent Statement
Not applicable.
Data Availability Statement
Data sharing is not applicable.
Conflicts of Interest
The authors declare no conflict of interest.
References
- Sheu, J.-J.; Ho, C.-J.; Yu, C.-H.; Kao, C.-Y. High-Order Groove-Shape Curve Roll Design for Aluminum Alloy 7075 Wire Rolling. Metals 2022, 12, 1071. [Google Scholar] [CrossRef]
- Radionov, A.A.; Petukhova, O.I.; Erdakov, I.N.; Karandaev, A.S.; Loginov, B.M.; Khramshin, V.R. Developing an Automated System to Control the Rolled Product Section for a Wire Rod Mill with Multi-Roll Passes. J. Manuf. Mater. Process. 2022, 6, 88. [Google Scholar] [CrossRef]
- Hwang, J.-K. Effect of Cambered and Oval-Grooved Roll on the Strain Distribution During the Flat Rolling Process of a Wire. Processes 2020, 8, 876. [Google Scholar] [CrossRef]
- Čapek, J.; Kadeřávek, L.; Pinc, J.; Kopeček, J.; Klimša, L. Influence of the Microstructure of the Initial Material on the Zn Wires Prepared by Direct Extrusion with a Huge Extrusion Ratio. Metals 2021, 11, 787. [Google Scholar] [CrossRef]
- Langelandsvik, G.; Grandcolas, M.; Skorpen, K.G.; Furu, T.; Akselsen, O.M.; Roven, H.J. Development of Al-TiC Wire Feedstock for Additive Manufacturing by Metal Screw Extrusion. Metals 2020, 10, 1485. [Google Scholar] [CrossRef]
- Nienaber, M.; Yi, S.; Kainer, K.U.; Letzig, D.; Bohlen, J. On the Direct Extrusion of Magnesium Wires from Mg-Al-Zn Series Alloys. Metals 2020, 10, 1208. [Google Scholar] [CrossRef]
- Rodríguez-González, P.; Ruiz-Navas, E.M.; Gordo, E. Effect of Heat Treatment Prior to Direct Hot-Extrusion Processing of Al–Cu–Li Alloy. Metals 2022, 12, 1046. [Google Scholar] [CrossRef]
- Faizov, S.; Sarafanov, A.; Erdakov, I.; Gromov, D.; Svistun, A.; Glebov, L.; Bykov, V.; Bryk, A.; Radionova, L. On the Direct Extrusion of Solder Wire from 52In-48Sn Alloy. Machines 2021, 9, 93. [Google Scholar] [CrossRef]
- Kucharska, M.; Wiewiórowska, S.; Michalczyk, J.; Gontarz, A. The Influence of the Drawing Process on the Mechanical Properties of TRIP Steel Wires with 0.4% C Content. Materials 2020, 13, 5769. [Google Scholar] [CrossRef]
- Suliga, M.; Wartacz, R.; Hawryluk, M.; Kostrzewa, J. The Effect of Drawing in Conventional and Hydrodynamic Dies on Structure and Corrosion Resistance of Hot-Dip Galvanized Zinc Coatings on Medium-Carbon Steel Wire. Materials 2022, 15, 6728. [Google Scholar] [CrossRef]
- Wang, L.; Yu, Y.; Zhang, P.; Yang, J. Influence of Lanthanum-Doped Tungsten Wire Drawing Process on Microstructure and Properties. Materials 2022, 15, 4979. [Google Scholar] [CrossRef]
- Toribio, J.; González, B.; Matos, J.-C. Analysis of Fatigue Crack Paths in Cold Drawn Pearlitic Steel. Materials 2015, 8, 7439–7446. [Google Scholar] [CrossRef]
- Lezhnev, S.; Panin, E.; Volokitina, I. Research of Combined Process ‘Rolling-Pressing’ Influence on the Microstructure and Mechanical Properties of Aluminium. In Advanced Materials Research; Trans Tech Publications, Ltd.: Bäch, Switzerland, 2013; Volume 814, pp. 68–75. [Google Scholar] [CrossRef]
- Naizabekov, A.; Volokitina, I.; Volokitin, A.; Panin, E. Structure and Mechanical Properties of Steel in the Process “Pressing–Drawing”. J. Mater. Eng. Perform. 2019, 28, 1762–1771. [Google Scholar] [CrossRef]
- Volokitina, I.; Vasilyeva, N.; Fediuk, R.; Kolesnikov, A. Hardening of Bimetallic Wires from Secondary Materials Used in the Construction of Power Lines. Materials 2022, 15, 3975. [Google Scholar] [CrossRef]
- Jung, J.Y.; An, K.S.; Park, P.Y.; Nam, W.J. Correlation between Microstructures and Ductility Parameters of Cold Drawn Hyper-Eutectoid Steel Wires with Different Drawing Strains and Post-Deformation Annealing Conditions. Metals 2021, 11, 178. [Google Scholar] [CrossRef]
- Stolyarov, A.; Polyakova, M.; Atangulova, G.; Alexandrov, S. Effect of Die Angle and Frictional Conditions on Fine Grain Layer Generation in Multipass Drawing of High Carbon Steel Wire. Metals 2020, 10, 1462. [Google Scholar] [CrossRef]
- Radionova, L.V.; Sarafanov, A.E.; Siverin, O.O. Roller Drawing of Simple Profiles from Hard-to-Form Alloys. Mater. Sci. Forum 2022, 1052, 364–369. [Google Scholar] [CrossRef]
- Santana Martinez, G.A.; Qian, W.-L.; Kabayama, L.K.; Prisco, U. Effect of Process Parameters in Copper-Wire Drawing. Metals 2020, 10, 105. [Google Scholar] [CrossRef]
- Pilarczyk, J.W.; Nitkiewicz, Z.; Kucharska, B.; Małecki, T. Analysis of Textures of Wires Drawn in Pressure and Roller Dies with ODF. In Materials Science Forum; Trans Tech Publications, Ltd.: Bäch, Switzerland, 2005; Volume 495–497, pp. 865–870. [Google Scholar] [CrossRef]
- Radionova, L.V.; Gromov, D.V.; Svistun, A.S.; Lisovskiy, R.A.; Faizov, S.R.; Glebov, L.A.; Zaramenskikh, S.E.; Bykov, V.A.; Erdakov, I.N. Mathematical Modeling of Heating and Strain Aging of Steel during High-Speed Wire Drawing. Metals 2022, 12, 1472. [Google Scholar] [CrossRef]
- Jung, J.Y.; An, K.S.; Park, P.Y.; Nam, W.J. Effects of Wire Drawing and Annealing Conditions on Torsional Ductility of Cold Drawn and Annealed Hyper-Eutectoid Steel Wires. Metals 2020, 10, 1043. [Google Scholar] [CrossRef]
- Rodríguez-Alabanda, Ó.; Romero, P.E.; Molero, E.; Guerrero-Vaca, G. Analysis, Validation and Optimization of the Multi-Stage Sequential Wiredrawing Process of EN AW-1370 Aluminium. Metals 2019, 9, 1021. [Google Scholar] [CrossRef]
- Radionova, L.V.; Lisovsky, R.A.; Lezin, V.D. Theory of Energy Conservation as the Basis for the Design of Wire Drawing. In Lecture Notes in Mechanical Engineering, Proceedings of the 6th International Conference on Industrial Engineering (ICIE 2020), ICIE 2021, Sochi, Russia, 18–20 May 2020; Radionov, A.A., Gasiyarov, V.R., Eds.; Springer: Cham, Switzerland, 2021. [Google Scholar] [CrossRef]
- Ioana Monica Sas-Boca, Marius Tintelecan, Mariana Pop, Dana-Adriana Iluţiu-Varvara, Adriana Maria Mihu, The Wire Drawing Process Simulation and the Optimization of Geometry Dies. Procedia Eng. 2017, 181, 187–192. [CrossRef]
- Larsson, J.; Karlsson, P.; Ekengren, J.; Pejryd, L. Enhanced Cooling Design in Wire Drawing Tooling Using Additive Manufacturing. In Industrializing Additive Manufacturing: AMPA 2020; Meboldt, M., Klahn, C., Eds.; Springer: Cham, Switzerland, 2021. [Google Scholar] [CrossRef]
- Karandaev, A.S.; Gasiyarov, V.R.; Radionov, A.A.; Loginov, B.M. Development of Digital Models of Interconnected Electrical Profiles for Rolling–Drawing Wire Mills. Machines 2021, 9, 54. [Google Scholar] [CrossRef]
- Radionova, L.V.; Shirokov, V.V.; Faizov, S.R.; Zhludov, M.A. Studies of Influence of Process Parameters on the Strain Rate at High-Speed Wire Drawing. Mater. Sci. Forum 2019, 946, 832–838. [Google Scholar] [CrossRef]
- Li, L.; Huang, H.; Zhao, F.; Zou, X.; Mendis, G.P.; Luan, X.; Liu, Z.; Sutherland, J.W. Modeling and Analysis of the Process Energy for Cylindrical Drawing. ASME J. Manuf. Sci. Eng. 2019, 141, 021001. [Google Scholar] [CrossRef]
- Radionova, L.V.; Lisovskiy, R.A.; Svistun, A.S.; Gromov, D.V.; Erdakov, I.N. FEM Simulation Analysis of Wire Drawing Process at Different Angles Dies on Straight-Line Drawing Machines. In Lecture Notes in Mechanical Engineering, Proceedings of the 8th International Conference on Industrial Engineering, ICIE 2022, Sochi, Russia, 16–20 May 2022; Radionov, A.A., Gasiyarov, V.R., Eds.; Springer: Cham, Switzerland, 2023. [Google Scholar] [CrossRef]
- Kharitonov, V.A.; Usanov, M.Y. Evaluation of Efficiency of Methods for Drawing Round Wire with Large Diameters. Chernye Met. 2021, 3, 28–33. [Google Scholar] [CrossRef]
- Tasevski, G.; Angjushev, K.; Petereski, Z.; Shishkovski, D. Experimental measurement of system dynamics between two stages of wire drawing machine. Arch. Mech. Eng. 2015, 62, 61–72. [Google Scholar] [CrossRef]
- Hemeda, S.G.; Aboukarima, A.M.; Minyawi, M. Developing a logging unit for measuring and recording power data using Arduino board. Misr. J. Agric. Eng. 2017, 34, 2053–2072. [Google Scholar] [CrossRef]
- Hwang, J.-K. Impact of Die Radius in a Streamlined Die during Wire Drawing. Appl. Sci. 2021, 11, 3922. [Google Scholar] [CrossRef]
- Perlin, I.L.; Ermanok, M.Z. Theory of Drawing; Metallurgy: Moscow, Russia, 1971; 447p. [Google Scholar]
- Lange, K. (Ed.) Drawing and Ironing. In Handbook of Metalforming; McGraw-Hill Book Company: New York, NY, USA, 1985; pp. 14–27. [Google Scholar]
- Kharitonov, V.A.; Zyuzin, V.I.; Radionova, L.V.; Rol’shchikov, L.D. New technological lubricants for steel wire drawing. Cmaль 2001, 12, 49–50. [Google Scholar]
- Radionova, L.V.; Lisovskiy, R.; Svistun, A.; Erdakov, I. Change in Mechanical Properties During Drawing of Wire from Ni 99.6. In Materials Science Forum; Trans Tech Publications, Ltd.: Bäch, Switzerland, 2022. [Google Scholar] [CrossRef]
- Radionova, L.V. Kharitonov VA Designing resource-saving technologies for the production of high-strength carbon wire based on modeling. In Monograph/V; MSTU: Magnitogorsk, Russia, 2008; 171p. [Google Scholar]
- Shetty, S.; Nilsson, L. An evaluation of simple techniques to model the variation in strain hardening behavior of steel. Struct. Multidisc. Optim. 2017, 55, 945–957. [Google Scholar] [CrossRef]
- Radionov, A.A. Automated Electric Drive of Mills for the Production of Steel Wire; Magnitogorsk State Technical University: Magnitogorsk, Russia, 2007; 311p. [Google Scholar]
- Martinez, G.A.S.; Santos, E.F.D.; Kabayama, L.K.; Guidi, E.S.; Silva, F.D.A. Influences of Different Die Bearing Geometries on the Wire-Drawing Process. Metals 2019, 9, 1089. [Google Scholar] [CrossRef]
- Tintelecan, M.; Sas-Boca, I.M.; Iluţiu-Varvara, D.-A. The Influence of the Dies Geometry on the Drawing Force for Steel Wires. Procedia Eng. 2017, 181, 193–199. [Google Scholar] [CrossRef]
- Majzoobi, G.; Saniee, F.F.; Aghili, A. An investigation into the effect of redundant shear deformation in bar drawing. J. Mater. Process. Technol. 2008, 201, 133–137. [Google Scholar] [CrossRef]
- Radionova, L.V.; Lisovskii, R.A. Study of deformation and contact heating of wire during the high-speed drawing process in a monolithic die. Ferrous Metallurgy. Bull. Sci. Tech. Econ. Inf. 2022, 78, 784–792. (In Russian) [Google Scholar] [CrossRef]


Disclaimer/Publisher’s Note: The statements, opinions and data contained in all publications are solely those of the individual author(s) and contributor(s) and not of MDPI and/or the editor(s). MDPI and/or the editor(s) disclaim responsibility for any injury to people or property resulting from any ideas, methods, instructions or products referred to in the content. |
© 2023 by the authors. Licensee MDPI, Basel, Switzerland. This article is an open access article distributed under the terms and conditions of the Creative Commons Attribution (CC BY) license (https://creativecommons.org/licenses/by/4.0/).