Abstract
An improved chimpanzee optimization algorithm incorporating multiple strategies (IMSChoA) is proposed to address the problems of initialized population boundary aggregation distribution, slow convergence speed, low precision, and proneness to fall into local optimality of the chimpanzee search algorithm. Firstly, the improved sine chaotic mapping is used to initialize the population to solve the population boundary aggregation distribution problem. Secondly, a linear weighting factor and an adaptive acceleration factor are added to join the particle swarm idea and cooperate with the improved nonlinear convergence factor to balance the global search ability of the algorithm, accelerate the convergence of the algorithm, and improve the convergence accuracy. Finally, the sparrow elite mutation and Bernoulli chaos mapping strategy improved by adaptive change water wave factor are added to improve the ability of individuals to jump out of the local optimum. Through the comparative analysis of benchmark functions seeking optimization and the comparison of Wilcoxon rank sum statistical test seeking results, it can be seen that the IMSChoA optimization algorithm has stronger robustness and applicability. Further, the IMSChoA optimization algorithm is applied to two engineering examples to verify the superiority of the IMSChoA optimization algorithm in dealing with mechanical structure optimization design problems.
1. Introduction
Meta-heuristic algorithms are widely used in path planning [1], image detection [2], system control [3], and shop floor scheduling [4] due to their excellent flexibility, practicality, and robustness. Common meta-heuristic algorithms include the genetic algorithm (GA) [5,6], the particle swarm optimization algorithm (PSO) [7,8], the gray wolf optimization algorithm (GWO) [9,10], the chicken flock optimization algorithm (CSO) [11], the sparrow optimization algorithm (CSA) [12], the whale optimization algorithm (WOA) [13], etc.
Different intelligent optimization algorithms exist with different search approaches, but most of them aim at the balance between population diversity and search ability and avoid premature maturity while ensuring convergence accuracy and speed [14]. In response to the above ideas, numerous scholars have proposed improvements to the intelligent algorithms they studied. For example, Zhi-jun Teng et al. [15] introduced the idea of PSO on the basis of the gray wolf optimization algorithm, which preserved the individual optimum while improving the ability of the algorithm to jump out of the local optimum; Hussien A. G. et al. [16] proposed two transfer functions (S-shaped and V-shaped) to map the continuous search space to the binary space, which improved the search accuracy and speed of the whale optimization algorithm; Wang et al. [17] introduced a fuzzy system in the process of chicken flock optimization algorithm, which adaptively adjusted the number of individuals in the algorithm, as well as random factors to balance the local exploitation performance and global search ability of the algorithm; Tian et al. [18] used logistic chaotic mapping to improve the initial population quality of the particle swarm algorithm while applying the auxiliary speed mechanism to the global optimal particles, which effectively improved the convergence of the algorithm; Li et al. [19] integrated two strategies, Levy flight and dimension-by-dimension evaluation, in the mothballing algorithm to improve the global search capability and to enhance the effectiveness of the algorithm.
The chimpanzee optimization algorithm (ChoA) is a heuristic optimization algorithm based on the social behavior of chimpanzee populations proposed by Khishe et al. [20] in 2020. Compared with traditional algorithms, ChoA has the advantages of fewer parameters, being prone to understand, and high stability. However, it also has the problems of initialized population boundary aggregation distribution, slow convergence speed, low accuracy, and being prone to fall into the local optimum. To address these problems, many researchers have proposed different improvement methods. Du et al. [21] introduced a somersault foraging strategy in ChoA to avoid the algorithmic population from easily falling into the local optimum, as well as to improve the diversity of the pre-population. However, this relatively single improvement leads to its less obvious improvement effect; Kumari et al. [22] combined the SHO algorithm with the ChoA algorithm, which improved the convergence accuracy of the ChoA algorithm itself and enhanced its local exploitation ability to deal with high-dimensional problems; Houssein et al. [23] proposed to extend the population diversity in the search space of the ChoA algorithm in relation to the algorithm initialization phase by applying opposition-based learning (OBL).
In summary, there are numerous improvements to the chimpanzee optimization algorithm, and the improved algorithms are suitable for the optimization of some single problems but reveal shortcomings for others. Therefore, in order to improve the performance of ChoA optimization, an improved chimpanzee optimization algorithm incorporating multiple strategies (IMSChoA) is proposed in this paper. Firstly, an improved sine chaotic mapping is used to initialize the population and solve the phenomenon of population boundary aggregation distribution. Secondly, a linear weight factor and an adaptive acceleration factor are introduced to add to the particle swarm algorithm and cooperate with the improved nonlinear convergence factor to balance the search ability of the algorithm, accelerate the convergence of the algorithm, and improve the convergence accuracy. Finally, the sparrow elite mutation and Bernoulli chaos mapping strategy improved by adaptive change water wave factor are introduced to improve the ability of individuals to jump out of the local optimum. After 21 standard test functions for the optimization search test, and with the help of the Wilcoxon rank sum statistical test for the optimization results, the robustness and applicability of the improved algorithm are verified. Finally, the IMSChoA optimization algorithm is applied to two engineering examples to further verify the superiority of the IMSChoA optimization algorithm in dealing with mechanical structure optimization design problems.
The other sections of the article are organized as follows: in Section 2, the mathematical model of the traditional ChoA algorithm is presented. Section 3 presents the specific improvement strategies incorporated on top of the ChoA algorithm. Section 4 shows the comparison and analysis of the results of IMSChoA with the other four optimization algorithms after 21 standard test function search tests. Section 5 applies the IMSChoA algorithm to two engineering examples and analyzes their optimization results accordingly. Finally, the full text is summarized in Section 6 for discussion.
2. Basic Chimpanzee Algorithm
The ChoA algorithm is an intelligent algorithm proposed by simulating the prey-hunting behavior of chimpanzee groups. According to the abilities shown in the chimpanzee hunting process, individual chimpanzees are classified into driver, barrier, chaser, and attacker. The chimpanzee group hunting process is mainly divided into exploratory phases, i.e., repelling, blocking, and chasing prey. The development stage involves attacking the prey. Each type of chimpanzee has the ability to think independently and search for the location of prey in its own way, while chimpanzees are also affected by sexual behavior, making them appear to confuse individual hunting behavior in the final stage. It is assumed that the first driver, barrier, chaser, and attacker are able to predict the location of prey and the others update their position according to the closest chimpanzee to the prey. The equation model for chimpanzee repelling and chasing prey is shown in Equations (1) and (2).
where XP is the position of the prey, XE is the position of the chimpanzee, m is the chaotic vector, t is the number of iterations, d(t) is the distance of the chimpanzee from the prey, and a and c are the coefficient vectors. a and c are calculated by Equations (3) and (4), respectively. When |a| < 1, the chimpanzee individual tends to the prey, and when |a| > 1, it means the chimpanzee has deviated from the prey position and expanded the search range.
where r1 and r2 are random numbers taking values of [0, 1], a is a random variable between [−2f, 2f], f is a linear convergence factor, and the calculation of the f formula is Equation (5).
During the iterations, f decays linearly from 2 to 0, and tmax is the maximum number of iterations.
The position of chimpanzees in the population is co-determined by the position of the driver, barrier, chaser, and attacker. The mathematical model of chimpanzee attack on prey is shown in Equations (6)–(8).
From Equations (6)–(8), the position of the prey is estimated from the position of the driver, barrier, chaser, and attacker. Other chimpanzees update their position in the direction of the prey.
In the final stages of a population’s predation, when individuals obtain food satisfaction, chimpanzees unleash their natural instinct to force chaotic access to food. The chaotic behavior of chimpanzees in the final stage helps to further alleviate the two problems of local optimal traps and slow convergence when the problem is high-dimensional. To simulate the chimpanzee’s chaotic behavior, it is assumed that there is a 50% probability of choosing one of the update positions in either the normal update position mechanism or the chaotic model, and the model formulation is shown in Equation (9) [24].
where μ takes the value of [0, 1] random number, and Chaotic is the chaotic mapping used to update the position.
3. Improving the Chimpanzee Algorithm
Firstly, for ChoA, the population initialization is performed by the random distribution method. This approach leads to population diversity, poor uniformity, easy boundary aggregation phenomenon, and large blindness of individual search for the best result. Secondly, the convergence factor of linear decay of the algorithm balancing local search and global search does not conform to the nonlinear merit-seeking characteristics of the algorithm, and finally, the algorithm jumps out of the local optimum with low chaotic perturbation trigger probability, which has great instability.
In summary, the corresponding improvement strategies are introduced for the problems of the ChoA algorithm, as follows.
3.1. Improved Sine Chaotic Mapping for Initializing Populations
Because the size of each dimension of chimpanzee individuals is randomly generated in the initialization stage, which leads to poor population diversity, serious boundary aggregation, and low individual variability. Chaotic searches are based on non-repetition and ergodicity, which are different from stochastic search methods, which are based on probabilities [25]. The common chaotic mappings include circle chaotic mapping, tent chaotic mapping, iteration chaotic mapping, logistic chaotic mapping, and sine chaotic mapping. Among them, sine mapping has good stability and high coverage, but it still has uneven distribution and boundary aggregation phenomena.
The expression of the original sine chaos mapping is:
Therefore, the sine mapping is improved by introducing the Chebyshev mapping for the above problem. At the same time, a high-dimensional chaotic mapping is established to make it better represent the chaotic property based on the original one.
The expression of the improved sine chaos mapping is:
where λ and μ are random numbers between [0, 1] and satisfy the sum of λ and μ as 1.
The dimensional distribution map and dimensional distribution histograms of both initial solutions before and after the improvement are shown in Figure 1. Here, Figure 1a,c is the original sine mapping, and Figure 1b,d is the improved sine mapping. Comparing Figure 1a,b and Figure 1c,d, it was found that the value distribution of the improved sine mapping chaos is more uniform, and the boundary aggregation problem is effectively solved.
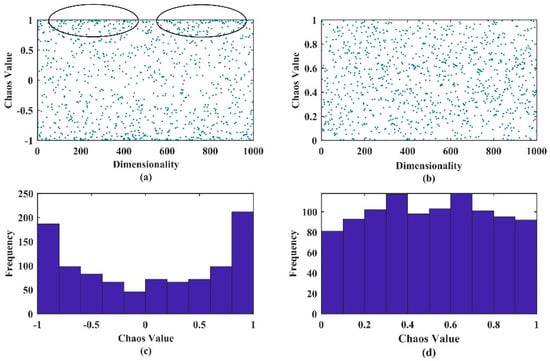
Figure 1.
(a) Dimensional distribution map of the solutions generated by the original sine mapping. The circle in (a) is the focused observation area, demonstrating the boundary aggregation phenomenon; (b) dimensional distribution map of the solutions generated by the improved sine mapping; (c) dimensional distribution histogram of the solutions generated by the original sine mapping; (d) dimensional distribution histogram of the solutions generated by the improved Sine mapping.
3.2. PSO Idea and Nonlinear Convergence Factor
3.2.1. PSO Idea
In order to regulate the balance of global and local search ability in the early and late stages of the ChoA algorithm, the particle swarm idea is introduced to improve the position updating method of the ChoA algorithm. The best position information experienced by the particle itself and the best position information of the population are used to update the current position of the particle and realize the information exchange between individual chimpanzees and the population [26]. The position update formula is Equation (13).
where w is the inertia weight coefficient and C is the acceleration factor. The inertia weight w and acceleration factor C take values related to the influence of the past motion state of the particle on the present motion state, when w and C become large, the search space of the particle will be expanded, and, when w and C become small, the direction of particle motion produces many changes, and the search space is relatively small, which will lead the algorithm to fall into the local optimum. The convergence speed of the algorithm is accelerated by adjusting the size of w, C to regulate the ability of local search and global search of the algorithm [27].
In order to improve the global search ability of the algorithm in the early stage while strengthening the local optimization ability of the particle swarm in the later stage, this paper introduces an adaptive linear acceleration factor: at the beginning of the algorithm iteration, a larger value of C is given to complete a wide range of search, which is conducive to the algorithm to quickly search for the global optimal position, and, as the number of iterations increases, the algorithm gradually converges, and individuals search for the optimal solution locally, and, at this time, a smaller C value is given to achieve accurate exploration of the optimal position in small steps size so as to improve the convergence accuracy of the algorithm. At the same time, in order to prevent the algorithm from falling into the local optimum during the iteration process, the cosine function is introduced to correct the acceleration factor and to keep the acceleration factor fluctuating at all times. The adaptive acceleration factor mathematical model is shown in Equation (14), and the variation of C with the number of iterations is shown in Figure 2.
where g is the adjustment trade-off factor, and tmax is the maximum number of iterations.
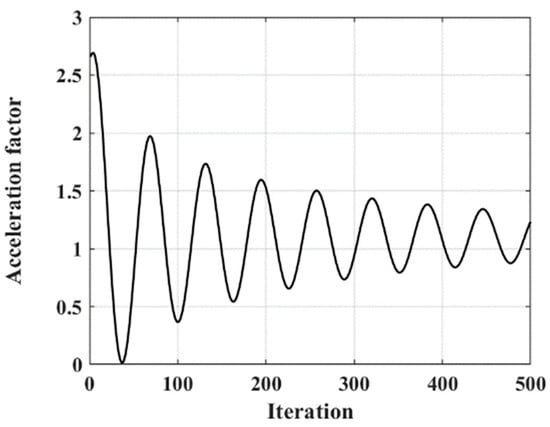
Figure 2.
Change curve of acceleration factor.
At the same time, in order to accelerate the convergence of the algorithm and improve the convergence accuracy, the linear inertia weight model is introduced. At the beginning of the algorithm iteration, a large weight is given to make the population search the solution space extensively in large steps and to search the global optimal position quickly. With an increase in iteration number, the algorithm converges gradually at this time. At this time, the inertia weight coefficient gradually becomes smaller to facilitate the fine search of the optimal position in small steps and to improve the convergence accuracy of the algorithm. The linear inertia weight mathematical model is shown in Equation (15), and w varies with the number of iterations, as in Figure 3.
where wmax and wmin are the maximum weight coefficient and minimum weight coefficient, respectively, t is the number of iterations, and tmax is the maximum number of iterations.
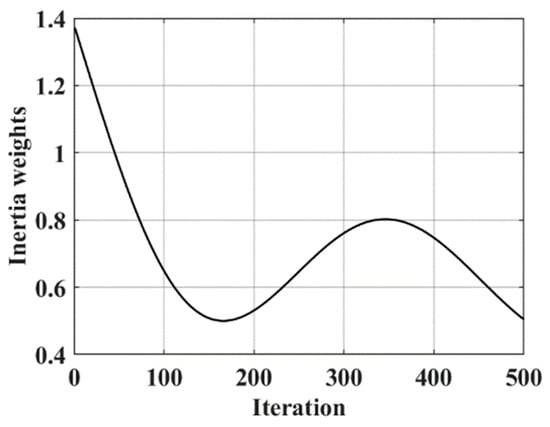
Figure 3.
Curve of inertia weight change.
3.2.2. Nonlinear Decay Convergence Factor
One of the important factors in evaluating the performance of heuristic algorithms is the ability to balance the algorithm’s global search ability and local search ability. From the analysis of the chimpanzee algorithm, it is known that, when |a| < 1, the chimpanzee individual converges to the prey, and, when |a| > 1, this means that the chimpanzee has deviated from the prey position and expanded the search range. Therefore, the change in the convergence factor determines the global and local search ability of the algorithm. According to the above description, this paper introduces a nonlinear decay variation model, which cooperates with the adaptive acceleration factor in the particle swarm idea to jointly balance the global search ability and local search ability of the algorithm. Meanwhile, a control factor б is introduced to control the decay amplitude. The nonlinear decay convergence factor mathematical model is described as Equation (16).
where t is the number of iterations, tmax is the maximum number of iterations, and fg is the initial convergence factor. б∈[1, 10], and, the larger the б, the slower the decay rate, as shown in Figure 4.
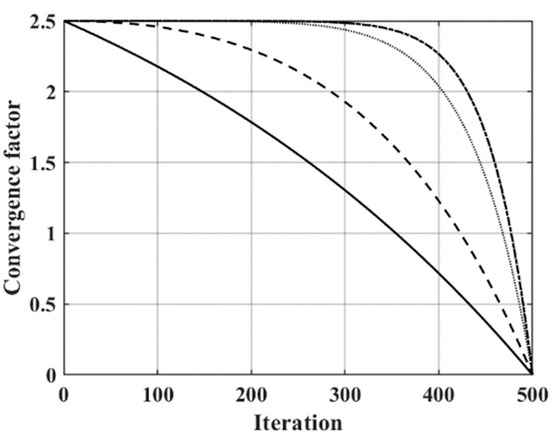
Figure 4.
Comparison curve of convergence factors.
3.3. Improved Sparrow Elite Variation and Logistic Chaos Mapping
In the ChoA algorithm, the individual update is affected by the last optimal individual in each iteration, so the ChoA algorithm is easy to converge to the local optimum during the iterative process. To address the above problems, an optimization strategy combining adaptive water wave factor improved sparrow elite mutation and Bernoulli chaotic mapping is proposed.
3.3.1. Improved Sparrow Elite Variation and Logistic Chaos Mapping
The sparrow search algorithm is an efficient population intelligence optimization algorithm, which divides the search population into three parts: explorers, followers, and early warners, whose work is divided among themselves to find the optimal value [28]. Sparrow elite mutation is used to assign the capabilities of individuals with higher search performance to the current optimal individual. At each ChoA iteration, the individuals with the top 40% of the current fitness value are given a stronger optimization ability, and an adaptive water wave factor is added to the mutant individual update formula [29] to further improve the optimization ability of mutant individuals. The sparrow elite mutation mathematical description is shown in Equation (17).
where X(t)0.4 is for the top 40% of the current fitness value of the individual, Q is a random number obeying a normal distribution of [0, 1], L is a 1 × d matrix with all elements of 1, ST is the warning value, taken as 0.6, and v is the water wave factor, which varies adaptively with the number of iterations. The mathematical model of the adaptive water wave factor is shown in Equation (18).
As the iterations increase, the uncertainty in the iterative process and the dramatic abrupt changes in the water wave factor enhance the ability of individuals to jump out of the local optimum. The water wave factor changes are shown in Figure 5.
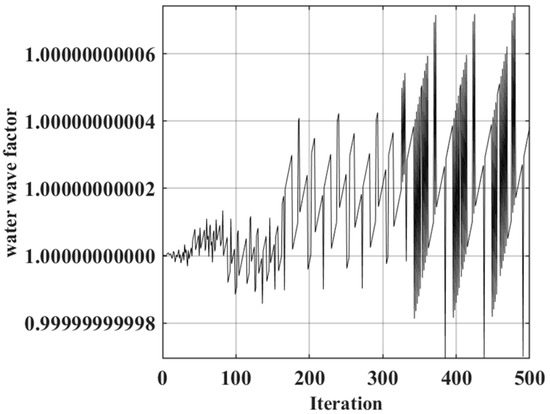
Figure 5.
Adaptive water wave factor distribution with 500 iterations.
3.3.2. Bernoulli Chaotic Mappings
Bernoulli chaotic mapping is a classical representative of chaotic mapping and is more widely used [30]. Its mathematical expression is shown in Equation (19).
where t is the number of chaotic iterations and λ is the conditioning factor, generally taken as 0.4. The resulting new chaotic sequence roots are mapped into the search space of the solution as follows.
where Xtd is the position of the tth element in d dimensions, XU and XL are analyzed as the upper and lower bounds of the search space, and Ztd is the chaotic value generated by Equation (19).
3.4. IMSChoA Algorithm Flow
The specific implementation steps of the IMSChoA algorithm are as follows.
- Step 1: Initialize the population using the improved sine chaotic mapping, including the number of population individuals N, the maximum number of iterations tmax, the dimension d, the search boundary ub, and lb, the maximum and minimum weight factors, and the adjustment trade-off factor g, and set the relevant parameters.
- Step 2: Update the acceleration factor, inertia weight, convergence factor, and water wave factor.
- Step 3: Calculate the position of each chimpanzee.
- Step 4: Update the positions of repellers, blockers, pursuers, and attackers.
- Step 5: Calculate the adaptation degree value and the average value of the adaptation degree to find the global optimum and individual optimum.
- Step 6: Compare the individual adaptation degree value f with the average value of adaptation degree favg. If f < favg, perform Brenoylli perturbation to determine whether the perturbed individual is better than the original individual, and update if better. Otherwise, keep the original individual unchanged; if f > favg, perform sparrow elite variation, and replace it if it is better than the original individual, otherwise keep it.
- Step 7: Update the global optimal value of the population and the individual optimal value.
- Step 8: Determine whether the condition is satisfied, and output the result if satisfied, otherwise return to step 2 for execution.
The flow chart is shown in Figure 6.
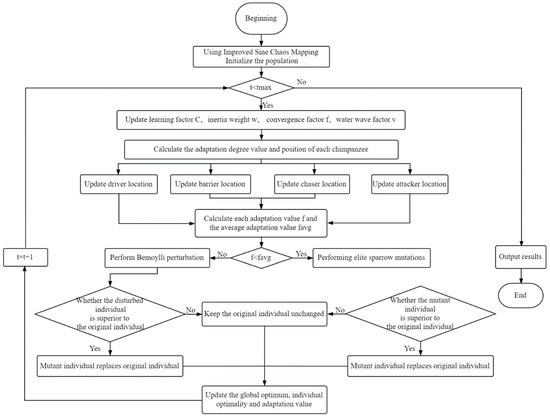
Figure 6.
Flow chart of IMSChoA algorithm optimization.
3.5. Time Complexity Analysis
Time complexity is an important index reflecting the performance of the algorithm [31]. Assuming that the chimpanzee population size is N, the search space dimension is n, the initialization time is t1, the update time of individual chimpanzee positions is t2, and the time to solve for the value of the target fitness function is f(n), the time complexity of the ChoA algorithm is:
In the IMSChoA algorithm, the time required to initialize the parameters is kept consistent with the standard ChoA. The time used to initialize the population using the modified sine is t3, which is employed in the loop phase, assuming that the time required to introduce the particle swarm idea, the nonlinear convergence factor, the modified sparrow elite variation, and the logistic chaos mapping are t4, t5, and t6, respectively. Then, the time complexity of IMSChoA is:
The time complexity of SPWChoA and ChoA is the same by Equations (21) and (22). It is shown in Equation (23).
In summary, the improvement strategy proposed in this paper for the ChoA defect does not increase the time complexity.
4. Algorithm Performance Testing
4.1. Experimental Parameter Settings
In this paper, the PSO algorithm, GWO algorithm, IMSChoA algorithm, ChoA algorithm, and MFO algorithm are selected for the optimization search comparison. The basic parameters were uniformly set as follows: population size N = 30, the maximum number of iterations tmax = 500, and the internal parameters of the algorithm are shown in Table 1.

Table 1.
Parameter table of the algorithm.
4.2. Benchmark Test Functions
To verify the effectiveness of the improved chimpanzee algorithm (IMSChoA), 21 benchmark test functions used in the literature [32] were experimentally selected for the optimization test, as shown in Table 2. F1~F7 are continuous unimodal test functions, F8~F12 are continuous multimodal test functions, and F13~F21 are fixed multimodal test functions. Figure 7, Figure 8 and Figure 9 show some of the several continuous unimodal test functions, continuous multimodal test functions, and fixed multimodal test functions function value distributions, respectively.

Table 2.
Benchmark functions.
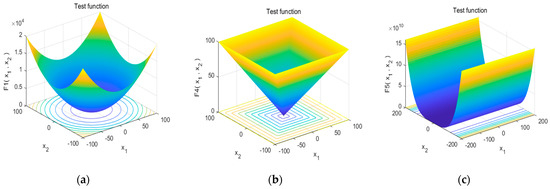
Figure 7.
Distribution diagram of different continuous unimodal test function values. (a) F1 function; (b) F4 function; (c) F5 function.

Figure 8.
Distribution diagram of different continuous multimodal test function values. (a) F8 function; (b) F9 function; (c) F12 function.
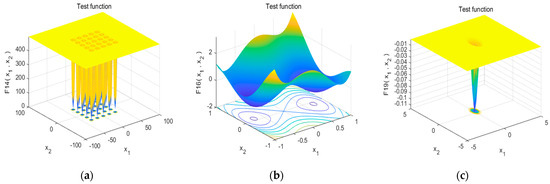
Figure 9.
Distribution diagram of different fixed multimodal test function values. (a) F14 function; (b) F16 function; (c) F19 function.
4.3. Comparison of the IMSChoA Algorithm with Other Algorithms
Twenty-one basic test functions are selected to perform the optimization search test for the algorithm mentioned in the summary of 4.1, and the iteration curves are shown in Figure 10. Among them, F1~F7 are continuous unimodal test functions with only one global optimum and no local optimum, which are used to test the global search ability and convergence speed of the algorithm. From Figure 10a–g, it can be seen that the IMSChoA optimization algorithm has a fast convergence speed and strong global search capability, which is faster and stronger than other group intelligence optimization algorithms in terms of iteration speed and preliminary global search capability. F8~F13 are continuous multimodal test functions with multiple local optima, which are used to test the ability of the algorithm to jump out of the local optimum. From Figure 10h–l, it can be seen that the IMSChoA optimization algorithm falls into the local optimum when calculating F8, F9, F11, and F12 functions, but it quickly jumps out of the current state and continues to search for the optimal iteration, which proves that the IMSChoA optimization algorithm has a strong ability to jump out of the local optimum, which is further improved compared with the ChoA optimization algorithm. F13~F21 are fixed multimodal test functions, which are used to test the equilibrium development capability and stability of the system. As can be seen from Figure 10m–u, the IMSChoA optimization algorithm can well balance the iterative ability of the algorithm and quickly complete the optimization search test, and the algorithm has significantly improved in terms of convergence accuracy and stability. However, it can be seen in Figure 10t,u that there are still some functions that still fall into the local optimum in the iterative process, and although the final completion jumps out of the local optimum in relation to finding the optimal solution, the iteration time is longer. For the overall function iteration graph, we can conclude that the algorithm is better for the high-dimensional, large range of optimal function search, while for the low-dimensional one, a small range of optimal search still has a certain disadvantage, although compared with the other optimization algorithms, they still have some inadequacies regarding the iteration speed and jumping out of the local optimum problem. There is still room for improvement.
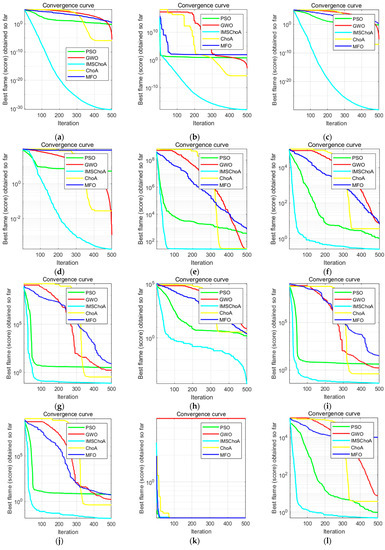
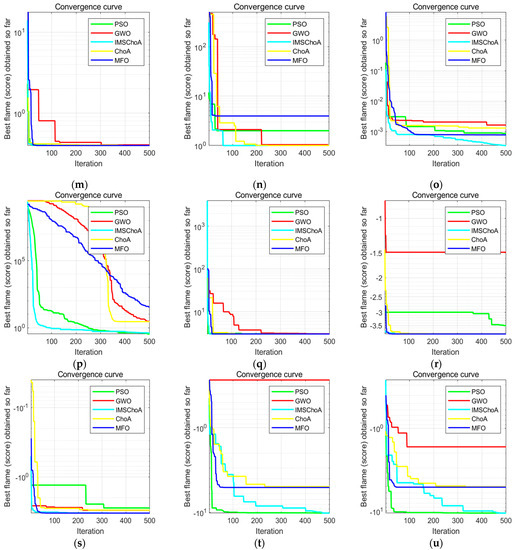
Figure 10.
Convergence curves of different functions. (a) F1 function; (b) F2 function; (c) F3 function; (d) F4 function; (e) F5 function; (f) F6 function; (g) F7 function; (h) F8 function; (i) F9 function; (j) F10 function; (k) F11 function; (l) F12 function; (m) F13 function; (n) F14 function; (o) F15 function; (p) F16 function; (q) F17 function; (r) F18 function; (s) F19 function; (t) F20 function; (u) F21 function.
In order to maintain the fairness of the test environment, twenty-one basic test functions are selected, and each algorithm is run 50 times independently, and the test results are shown in Table 3. The optimal value, mean value, and standard deviation reflect the convergence accuracy, convergence speed, and optimality-seeking stability of the algorithms, respectively. Compared with other algorithms, the IMSChoA algorithm can find a fixed optimal value in each function, and the computational performance of all functions is better than that of the PSO algorithm, except for F20 and F21, which are slightly worse than the PSO algorithm in terms of finding speed. Compared with the MFO algorithm, IMSChoA outperforms the MFO algorithm in terms of computational performance for all functions, except for the F18 function, which is slightly less stable than the MFO algorithm. Compared with the ChoA algorithm and the GWO algorithm, IMSChoA outperforms both of them in all aspects. This proves that the IMSChoA optimization algorithm has certain advantages in convergence accuracy, convergence speed, and stability of the optimization search.

Table 3.
Experimental results of function test (30 dimensions).
4.4. Wilcoxon Rank Sum Test
In order to reflect the effectiveness of the improved algorithm, the literature suggests that a statistical test should be performed for the evaluation of the performance of the improved algorithm, and the effectiveness of the improved algorithm should be proved by the results of the statistical test. In this paper, the Wilcoxon rank sum test is used at the 5% significance level to determine whether the results of each iteration of IMSChoA are significantly different from PSO, GWO, ChoA, and MFO. The Wilcoxon rank sum test is a nonparametric statistical test that can detect more complex data distributions, and the general data analysis is only for the current data mean and standard deviation and does not compare with the data from multiple runs of the algorithm, so this data comparison analysis is not scientific. To demonstrate the superiority of the IMSChoA optimization algorithm, the results of the 12 runs of the test function were selected, and the results of the PSO, GWO, ChoA, and MFO algorithm runs were subjected to then Wilcoxon rank sum test, and the p-value was calculated, and, when p < 5%, they can be considered as a strong verification of the rejection of the null hypothesis [33]. The results of the Wilcoxon rank sum test are shown in Table 4. The symbols “+”, “−”, and “=“ indicate that IMSChoA outperforms, underperforms, and cannot make significant judgments of other algorithms, respectively. From the results in Table 4, the p-values of the Wilcoxon rank sum test for IMSChoA are basically less than 5%, indicating that, statistically speaking, IMSChoA has a significant advantage in the performance of the basic function search, which further reflects the robustness of IMSChoA.

Table 4.
Wilcoxon rank-sum test results.
5. Application Analysis of IMSChoA Algorithm Engineering Calculations
5.1. Spring Optimization Design Case Study
The optimization goal of the extension and compression spring design problem is to reduce the weight of the spring. The spring mechanism design is shown in Figure 11. The constraints of this design are shear stress, vibration frequency, and minimum vibration deflection. The variables y1, y2, and y3 represent the coil diameter d, spring coil diameter D, and the number of coils N, respectively, and f(x) is the minimum spring weight. The spring stretching mathematical model is described as follows.
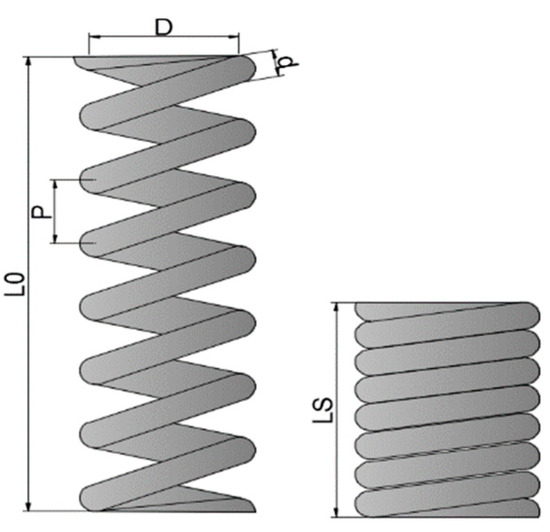
Figure 11.
Schematic diagram of spring extension/compression structure.
Objective function:
Constraints:
Among them: 0.05 ≤ y1 ≤ 2, 0.05 ≤ y2 ≤ 2, 0.05 ≤ y3 ≤ 2, 0.05 ≤ y4 ≤ 2.
The PSO algorithm, GWO algorithm, IMSChoA algorithm, ChoA algorithm, and MFO algorithm proposed in this paper were compared experimentally, where the data of the compared algorithms were obtained from the literature [24,34]. The experiments were selected with a population size of 50 and a maximum number of iterations of 500, and each algorithm was run 100 times independently to take the average value. The optimization results are shown in Table 5.

Table 5.
The optimal solutions of each algorithm in the stretching/compression spring design problem.
As shown in Table 5, the IMSChoA algorithm obtains the optimal solution of the function [y1, y2, y3] = [0.0615, 0.7215, 5.5122] and the optimal solution f(x) = 0.0124. IMSChoA has good optimization results for the extension/compression spring design problem, and the optimization results for the spring coil diameter, spring coil diameter, and spring coil number are better than other algorithms. This shows that IMSChoA obtains the best solution for reducing the weight of the spring.
5.2. Optimization Experiments of the Fully Automatic Piston Manometer Control System
The ultimate goal of the optimization of the manometer control system is to check that the piston quickly and stably reaches the equilibrium position and achieves pressure measurement. The PID controller optimized by a group intelligence algorithm is generally used in engineering for regulation to achieve fast, stable, and accurate control. the PID control expression is shown in Equation (26), where kp is a proportional coefficient; ki is an integral coefficient; and kd is a differential coefficient. The structure of the manometer control system is shown in Figure 12.

Figure 12.
Structure of PID control system.
The experiment uses a 500 Mpa fully automatic piston manometer, as shown in Figure 13. The device uses STM32F429IGT6 as the control core, equipped with a series of control circuits. By controlling the pneumatic solenoid valve to control the weight configuration, the servo motor carries out pressure to make the piston float to the balance position to complete the pressure check. The range of piston movement is set from −2 mm to 2 mm, and 0 mm is the equilibrium position.
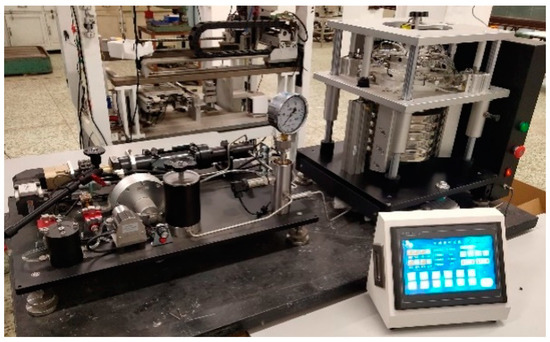
Figure 13.
500 Mpa automatic piston manometer.
The experiment uses a 500 Mpa fully automatic piston manometer, as shown in Figure 13. The device uses STM32F429IGT6 as the control core, equipped with a series of control circuits. By controlling the pneumatic solenoid valve to control the weight configuration, the servo motor carries out pressure to make the piston float to the balance position to complete the pressure check. The range of piston movement is set from −2 mm to 2 mm, and 0 mm is the equilibrium position.
The PSO algorithm, GWO algorithm, IMSChoA algorithm, ChoA algorithm, and MFO algorithm were used to adjust the parameters of the PID controller and to compare the results of the manometer operation, respectively. The initial conditions of each algorithm are the same. Each algorithm is run 50 times independently, and the average value is taken. The results of PID parameter adjustment were obtained in Table 6, and the displacement curve and velocity curve of the check piston movement are shown in Figure 14 and Figure 15.

Table 6.
Tuning parameters of PID controller optimized by different algorithms.
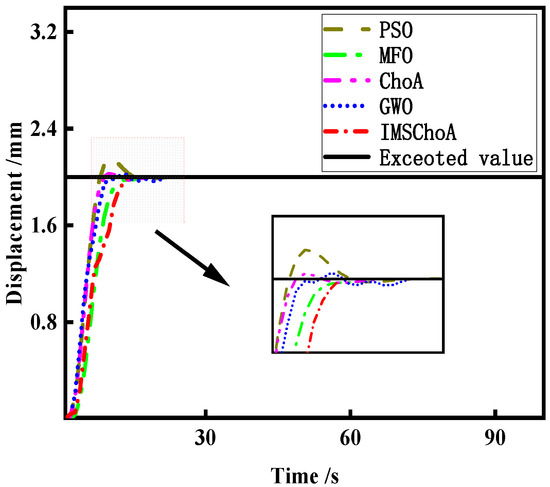
Figure 14.
Displacement curve.
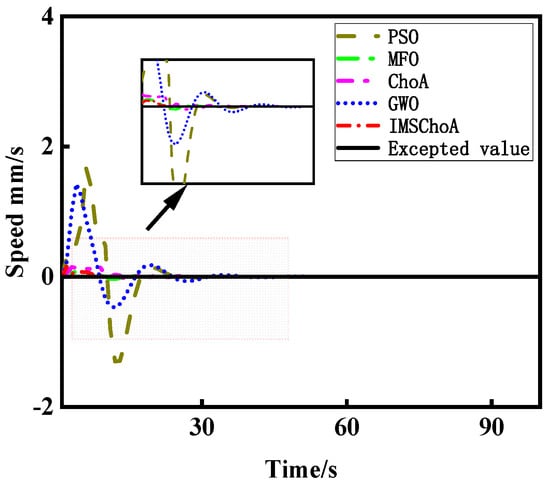
Figure 15.
Speed curve.
As shown in Figure 14 and Figure 15, the PID controller optimized by the IMSChoA algorithm has the best control effect on the manometer system, and the check piston can reach the balance position quickly and stably to complete the pressure detection. This further proves the feasibility of IMSChoA in practical engineering applications for the optimal design of mechanical structures.
6. Conclusions
In this paper, we propose an improved chimpanzee search algorithm with multi-strategy fusion, namely, IMSChoA, to address the problems of the ChoA optimization algorithm, such as low convergence accuracy and being prone to fall into local optimality. Firstly, we use improved sine chaotic mapping to initialize the population and solve the phenomenon of population boundary aggregation distribution. Secondly, the particle swarm algorithm idea was added, cooperating with the improved nonlinear convergence factor to balance the searchability of the algorithm, to accelerate the convergence of the algorithm, and to improve the convergence accuracy. Finally, the adaptive water wave factor improved sparrow elite mutation, and the Bernoulli chaos mapping strategy was added to improve the ability of individuals to jump out of the local optimum. After 21 standard test functions for the optimization search test and analysis with the help of Wilcoxon rank sum statistical test results, the robustness and applicability of the algorithm were verified. Finally, the IMSChoA optimization algorithm was applied to the spring design case study and the optimization analysis of the fully automatic piston manometer control system, and the experimental results showed that the IMSChoA optimization algorithm also has good applicability to mechanical structure optimization design problems, but it has to be said that the comprehensive performance of the algorithm for low-dimensional, small-range high-precision search is still inadequate. Therefore, the next step will be to consider combining the IMSChoA algorithm with deep learning to eliminate the limitations of the algorithm in optimizing high-precision, as well as complex, problems, as well as to use it to solve more practical engineering problems.
Author Contributions
T.G. designed the project and coordinated the work. H.W. checked and discussed the results and the whole manuscript. F.Z. contributed to the discussion of this study. All authors have read and agreed to the published version of the manuscript.
Funding
This research was funded by the Scientifific Research Fund Project of the Education Department of Liaoning Province, grant number No. LJKZ0510.
Data Availability Statement
Not applicable.
Conflicts of Interest
The authors declare no conflict of interest.
References
- Tharwat, A.; Elhoseny, M.; Hassanien, A.E.; Gabel, T.; Kumar, A. Intelligent Bézier curve-based path planning model using Chaotic Particle Swarm Optimization algorithm. Cluster Comput. 2019, 22 (Suppl. S2), 4745–4766. [Google Scholar] [CrossRef]
- Cinsdikici, M.G.; Aydın, D. Detection of blood vessels in ophthalmoscope images using MF/ant (matched filter/ant colony) algorithm. Comput. Methods Programs Biomed. 2009, 96, 85–95. [Google Scholar] [CrossRef] [PubMed]
- Ghanamijaber, M. A hybrid fuzzy-PID controller based on gray wolf optimization algorithm in power system. Evol. Syst. 2019, 10, 273–284. [Google Scholar] [CrossRef]
- Maharana, D.; Kotecha, P. Optimization of Job Shop Scheduling Problem with Grey Wolf Optimizer and JAYA Algorithm. In Smart Innovations in Communication and Computational Sciences; Springer: Singapore, 2019; pp. 47–58. [Google Scholar] [CrossRef]
- Ebrahimi, B.; Rahmani, M.; Ghodsypour, S.H. A new simulation-based genetic algorithm to efficiency measure in IDEA with weight restrictions. Measurement 2017, 108, 26–33. [Google Scholar] [CrossRef]
- Bu, S.J.; Kang, H.B.; Cho, S.B. Ensemble of Deep Convolutional Learning Classifier System Based on Genetic Algorithm for Database Intrusion Detection. Electronics 2022, 11, 745. [Google Scholar] [CrossRef]
- Afzal, A.; Ramis, M.K. Multi-objective optimization of thermal performance in battery system using genetic and particle swarm algorithm combined with fuzzy logics. J. Energy Storage 2020, 32, 101815. [Google Scholar] [CrossRef]
- Xin-gang, Z.; Ji, L.; Jin, M.; Ying, Z. An improved quantum particle swarm optimization algorithm for environmental economic dispatch. Expert Syst. Appl. 2020, 152, 113370. [Google Scholar] [CrossRef]
- Sun, X.; Hu, C.; Lei, G.; Guo, Y.; Zhu, J. State Feedback Control for a PM Hub Motor Based on Gray Wolf Optimization Algorithm. IEEE Trans. Power Electron. 2020, 35, 1136–1146. [Google Scholar] [CrossRef]
- Meidani, K.; Hemmasian, A.; Mirjalili, S.; Farimani, A.B. Adaptive grey wolf optimizer. Neural Comput. Appl. 2022, 34, 7711–7731. [Google Scholar] [CrossRef]
- Meng, X.; Liu, Y.; Gao, X.; Zhang, H. A new bio-inspired algorithm: Chicken swarm optimization. In International Conference in Swarm Intelligence; Springer: Cham, Switzerland, 2014; pp. 86–94. [Google Scholar] [CrossRef]
- Xue, J.; Shen, B. A novel swarm intelligence optimization approach: Sparrow search algorithm. Syst. Sci. Control. Eng. 2020, 8, 22–34. [Google Scholar] [CrossRef]
- Mirjalili, S.; Lewis, A. The whale optimization algorithm. Adv. Eng. Softw. 2016, 95, 51–67. [Google Scholar] [CrossRef]
- Lu, C.; Gao, L.; Yi, J. Grey wolf optimizer with cellular topological structure. Expert Syst. Appl. 2018, 107, 89–114. [Google Scholar] [CrossRef]
- Teng, Z.; Lv, J.; Guo, L. An improved hybrid grey wolf optimization algorithm. Soft Comput. 2019, 23, 6617–6631. [Google Scholar] [CrossRef]
- Hussien, A.G.; Hassanien, A.E.; Houssein, E.H.; Amin, M.; Azar, A.T. New binary whale optimization algorithm for discrete optimization problems. Eng. Optim. 2020, 52, 945–959. [Google Scholar] [CrossRef]
- Wang, Z.; Qin, C.; Wan, B.; Song, W.W.; Yang, G. An Adaptive Fuzzy Chicken Swarm Optimization Algorithm. Math. Probl. Eng. 2021, 2021, 8896794. [Google Scholar] [CrossRef]
- Tian, D.; Shi, Z. MPSO: Modified particle swarm optimization and its applications. Swarm Evol. Comput. 2018, 41, 49–68. [Google Scholar] [CrossRef]
- Li, Y.; Zhu, X.; Liu, J. An improved moth-flame optimization algorithm for engineering problems. Symmetry 2020, 12, 1234. [Google Scholar] [CrossRef]
- Khishe, M.; Mosavi, M.R. Chimp optimization algorithm. Expert Syst. Appl. 2020, 149, 113338. [Google Scholar] [CrossRef]
- Du, N.; Zhou, Y.; Deng, W.; Luo, Q. Improved chimp optimization algorithm for three-dimensional path planning problem. Multimed. Tools Appl. 2022, 81, 27397–27422. [Google Scholar] [CrossRef]
- Kumari, C.L.; Kamboj, V.K.; Bath, S.K.; Tripathi, S.L.; Khatri, M.; Sehgal, S. A boosted chimp optimizer for numerical and engineering design optimization challenges. Eng. Comput. 2022, 1–52. [Google Scholar] [CrossRef]
- Houssein, E.H.; Emam, M.M.; Ali, A.A. An efficient multilevel thresholding segmentation method for thermography breast cancer imaging based on improved chimp optimization algorithm. Expert Syst. Appl. 2021, 185, 115651. [Google Scholar] [CrossRef]
- Liu, C.; He, Q. Golden sine chimpanzee optimization algorithm integrating multiple strategies. J. Autom. 2022, 47, 1–14. [Google Scholar]
- Hekmatmanesh, A.; Wu, H.; Handroos, H. Largest Lyapunov Exponent Optimization for Control of a Bionic-Hand: A Brain Computer Interface Study. Front. Rehabil. Sci. 2022, 2, 802070. [Google Scholar] [CrossRef] [PubMed]
- Li, Y.; Han, M.; Guo, Q. Modified Whale Optimization Algorithm Based on Tent Chaotic Mapping and Its Application in Structural Optimization. KSCE J. Civ. Eng. 2020, 24, 3703–3713. [Google Scholar] [CrossRef]
- Xiong, X.; Wan, Z. The simulation of double inverted pendulum control based on particle swarm optimization LQR algorithm. In Proceedings of the 2010 IEEE International Conference on Software Engineering and Service Sciences, Beijing, China, 16–18 July 2009; IEEE: Piscataway, NJ, USA, 2010; pp. 253–256. [Google Scholar] [CrossRef]
- Liu, X.; Bai, Y.; Yu, C.; Yang, H.; Gao, H.; Wang, J.; Chang, Q.; Wen, X. Multi-Strategy Improved Sparrow Search Algorithm and Application. Math. Comput. Appl. 2022, 27, 96. [Google Scholar] [CrossRef]
- Liu, Z.; Li, M.; Pang, G.; Song, H.; Yu, Q.; Zhang, H. A Multi-Strategy Improved Arithmetic Optimization Algorithm. Symmetry 2022, 14, 1011. [Google Scholar] [CrossRef]
- Wang, P.; Zhang, Y.; Yang, H. Research on economic optimization of microgrid cluster based on chaos sparrow search algorithm. Comput. Intell. Neurosci. 2021, 2021, 5556780. [Google Scholar] [CrossRef]
- Mareli, M.; Twala, B. An adaptive Cuckoo search algorithm for optimisation. Appl. Comput. Inform. 2018, 14, 107–115. [Google Scholar] [CrossRef]
- Derrac, J.; García, S.; Molina, D.; Herrera, F. A practical tutorial on the use of nonparametric statistical tests as a methodology for comparing evolutionary and swarm intelligence algorithms. Swarm Evol. Comput. 2011, 1, 3–18. [Google Scholar] [CrossRef]
- Xinming, Z.; Xia, W.; Qiang, K. Improved grey wolf optimizer and its application to high-dimensional function and FCM optimization. Control. Decis. 2019, 34, 2073–2084. [Google Scholar]
- He, Q.; Luo, S.H.H. Hybrid improvement strategy of chimpanzee optimization algorithm and its mechanical application. Control. Decis. Mak. 2022, 1–11. [Google Scholar]
Disclaimer/Publisher’s Note: The statements, opinions and data contained in all publications are solely those of the individual author(s) and contributor(s) and not of MDPI and/or the editor(s). MDPI and/or the editor(s) disclaim responsibility for any injury to people or property resulting from any ideas, methods, instructions or products referred to in the content. |
© 2023 by the authors. Licensee MDPI, Basel, Switzerland. This article is an open access article distributed under the terms and conditions of the Creative Commons Attribution (CC BY) license (https://creativecommons.org/licenses/by/4.0/).