Author Contributions
Conceptualization, D.V., T.I., A.K., M.D. and J.-A.A.-D.; methodology, D.V., T.I., A.K., M.D. and J.-A.A.-D.; software, D.V. and T.I.; validation, D.V., T.I., A.K., M.D. and J.-A.A.-D.; formal analysis, D.V., T.I., A.K., M.D. and J.-A.A.-D.; investigation, D.V., T.I., A.K., M.D. and J.-A.A.-D.; resources, D.V., T.I., A.K. and M.D.; data curation, D.V. and T.I.; writing—original draft preparation, D.V., T.I., A.K., M.D. and J.-A.A.-D.; writing—review and editing, D.V., T.I., A.K., M.D. and J.-A.A.-D.; visualization, D.V., T.I., A.K., M.D. and J.-A.A.-D.; supervision, A.K., M.D. and J.-A.A.-D.; project administration, D.V., T.I., A.K., M.D. and J.-A.A.-D. All authors have read and agreed to the published version of the manuscript.
Figure 1.
Results from PD activity and electrical stress.
Figure 1.
Results from PD activity and electrical stress.
Figure 2.
Capacitive model.
Figure 2.
Capacitive model.
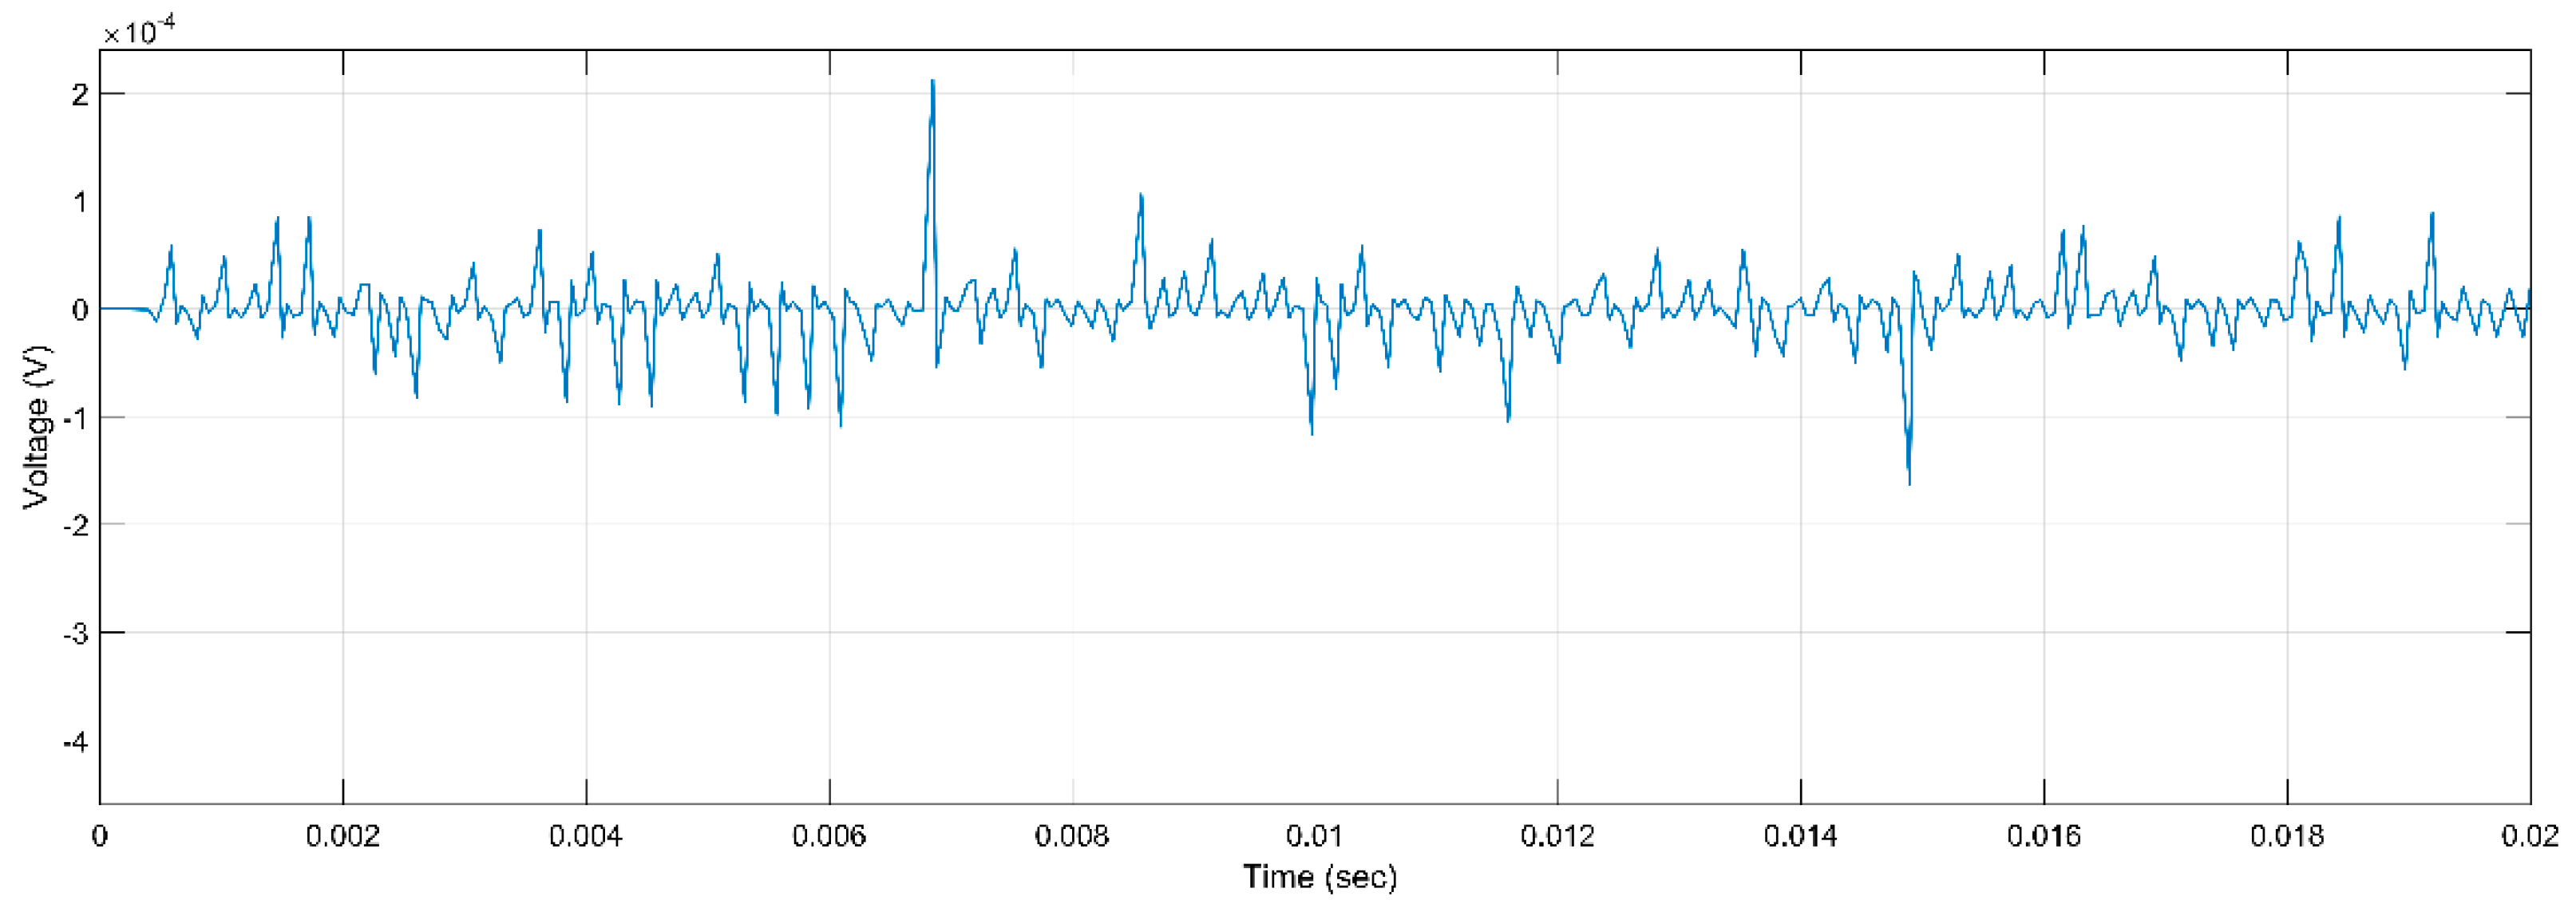
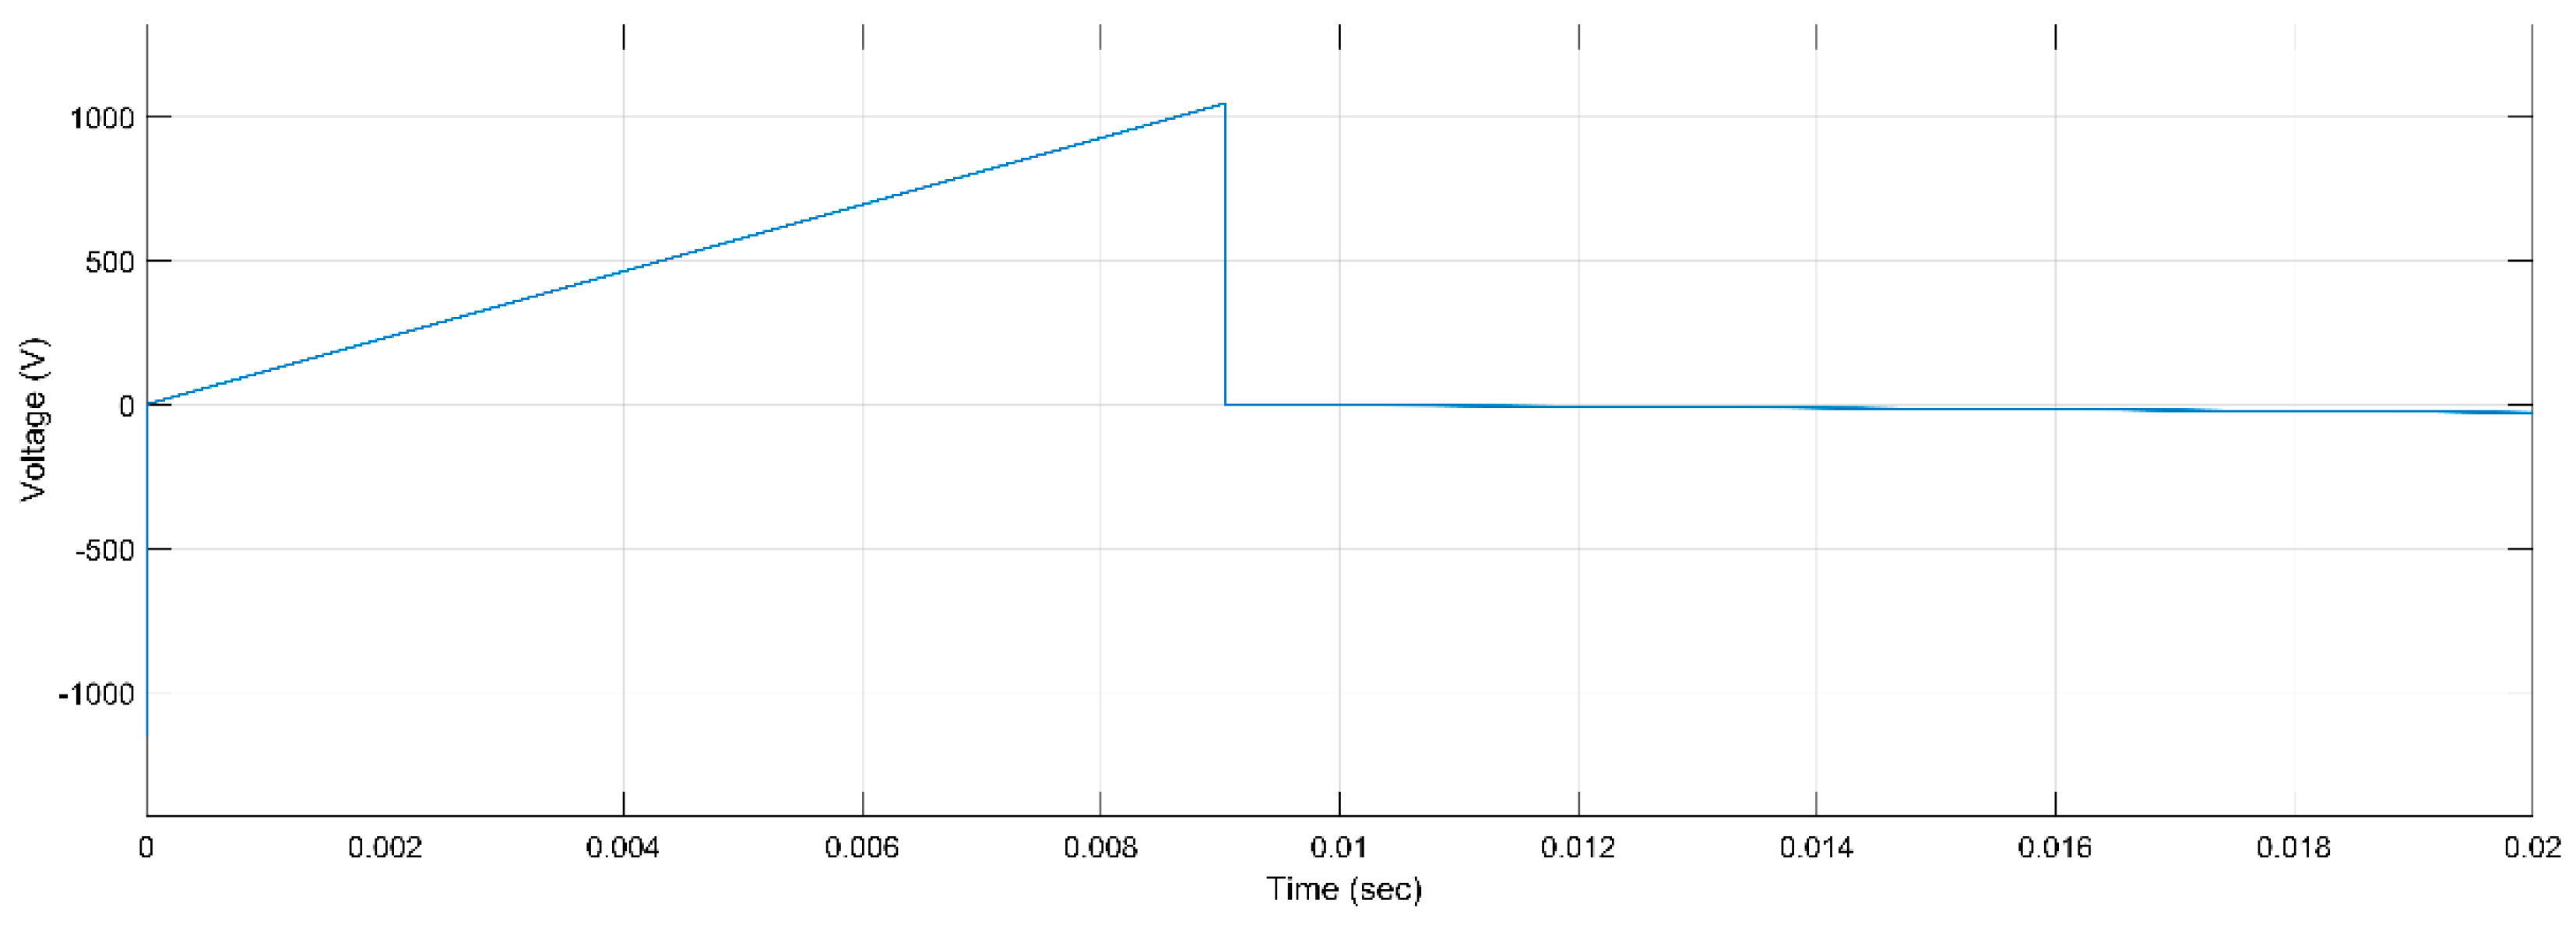
Figure 3.
PD Activity for ER, 5 kV, h, r.
Figure 3.
PD Activity for ER, 5 kV, h, r.
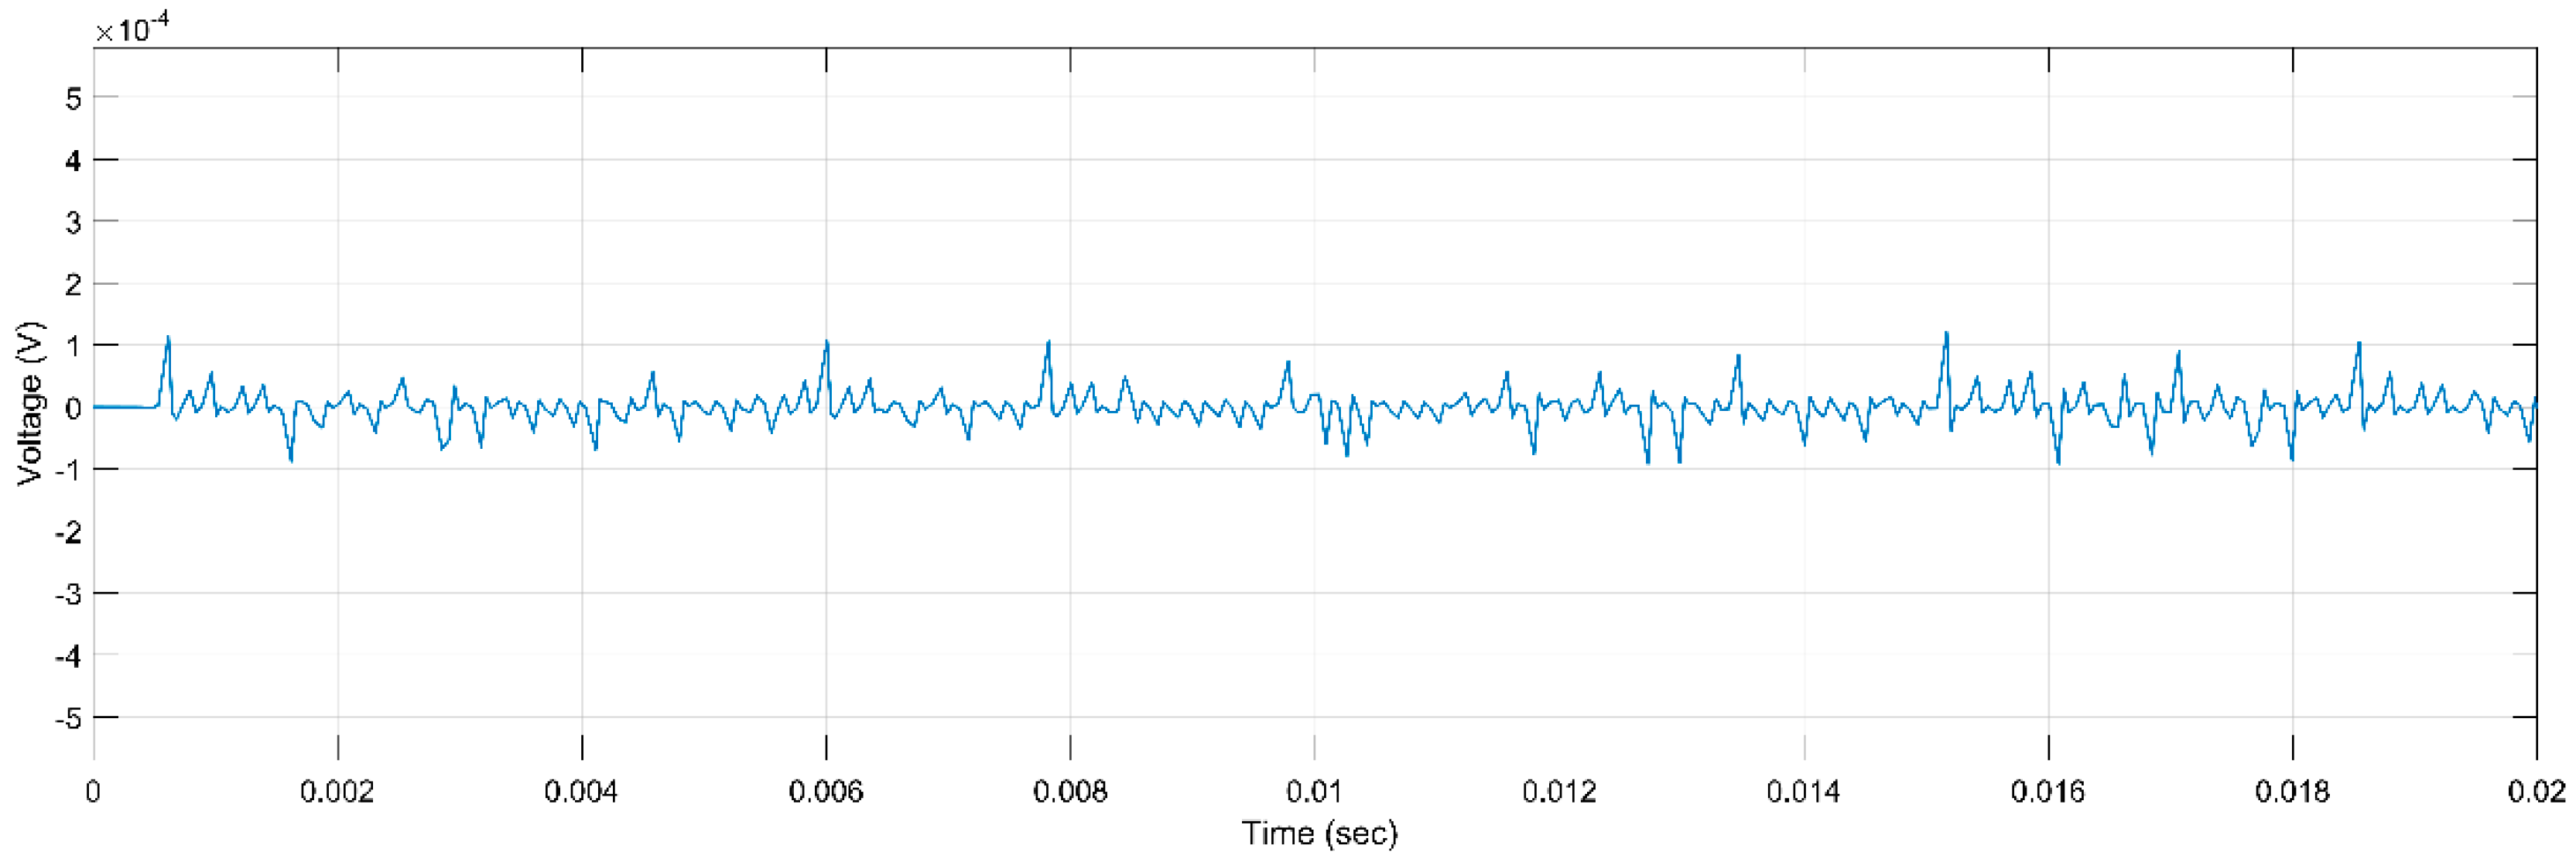
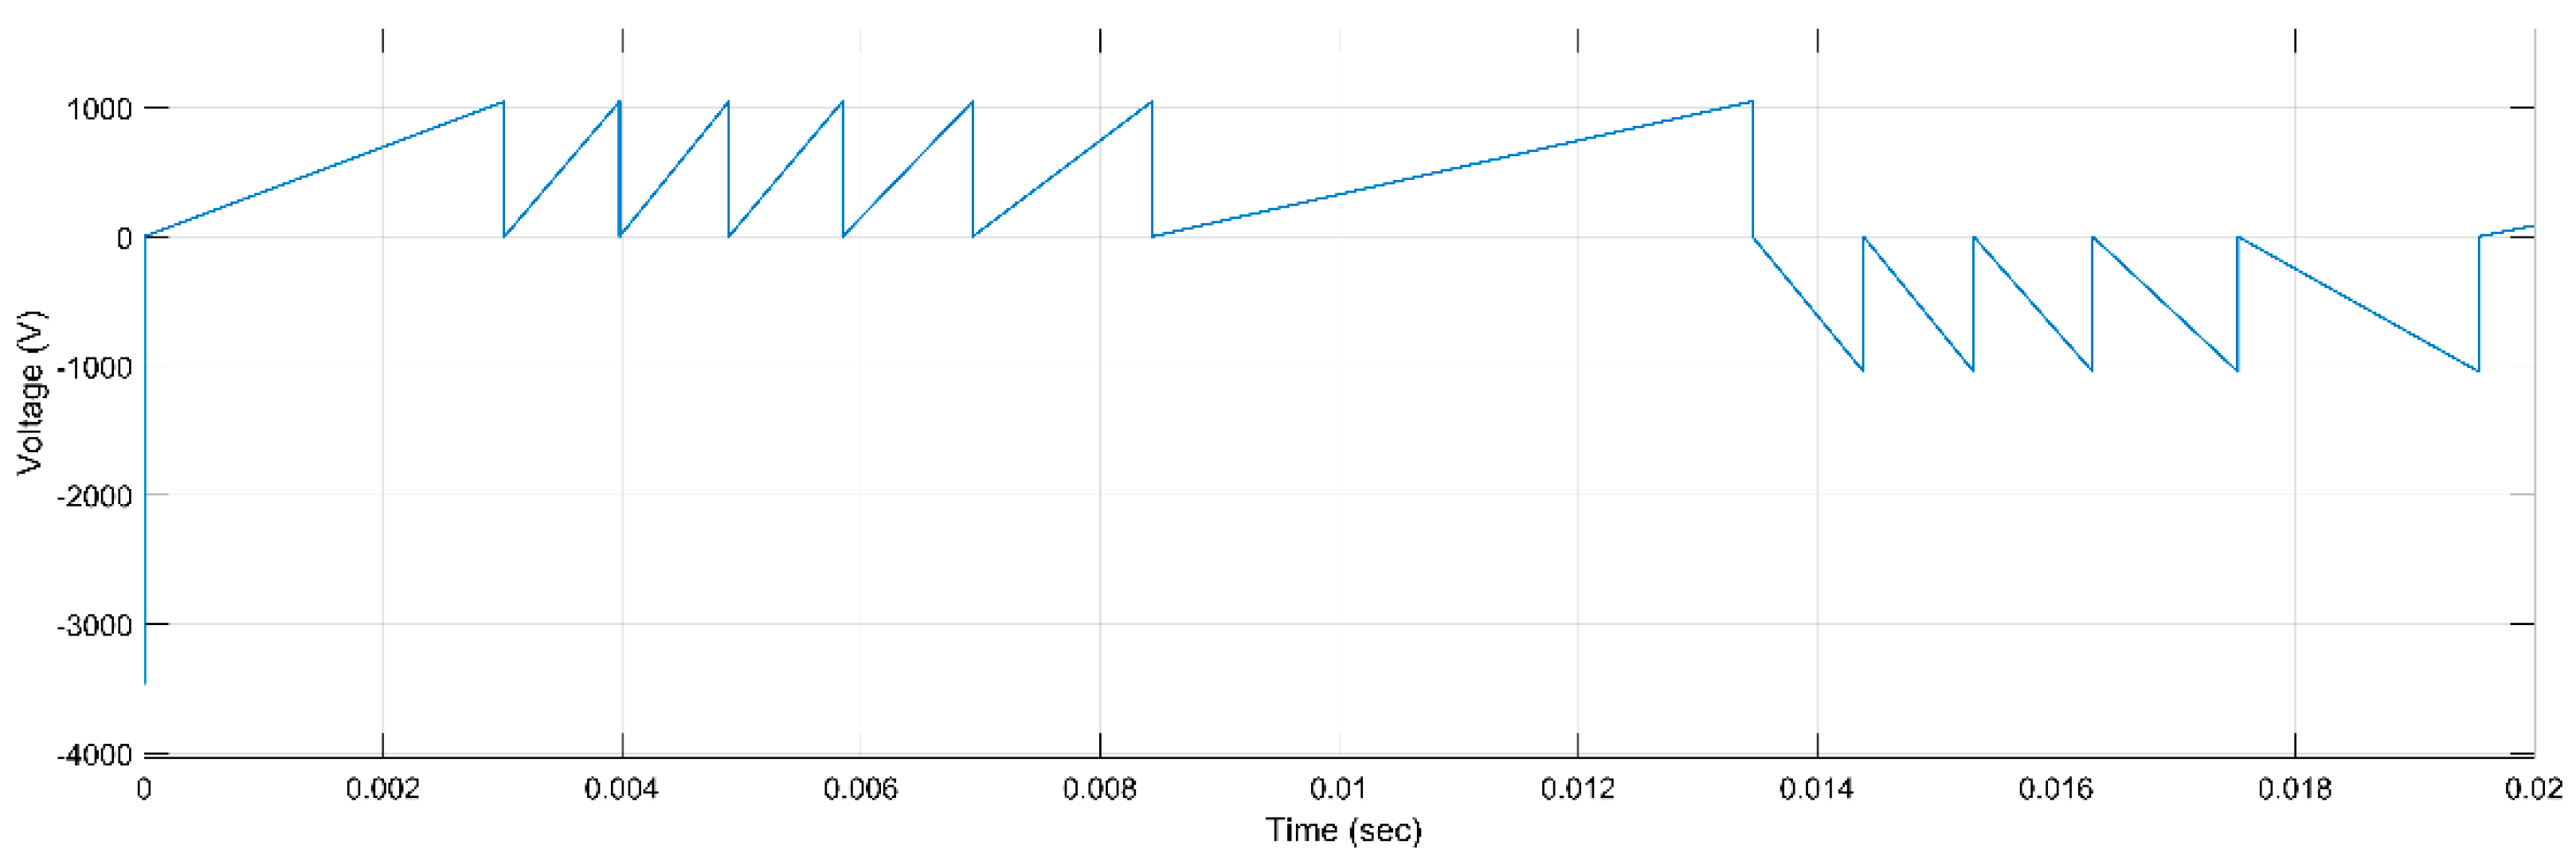
Figure 4.
PD Activity for ER, 5 kV, h, 2 r.
Figure 4.
PD Activity for ER, 5 kV, h, 2 r.
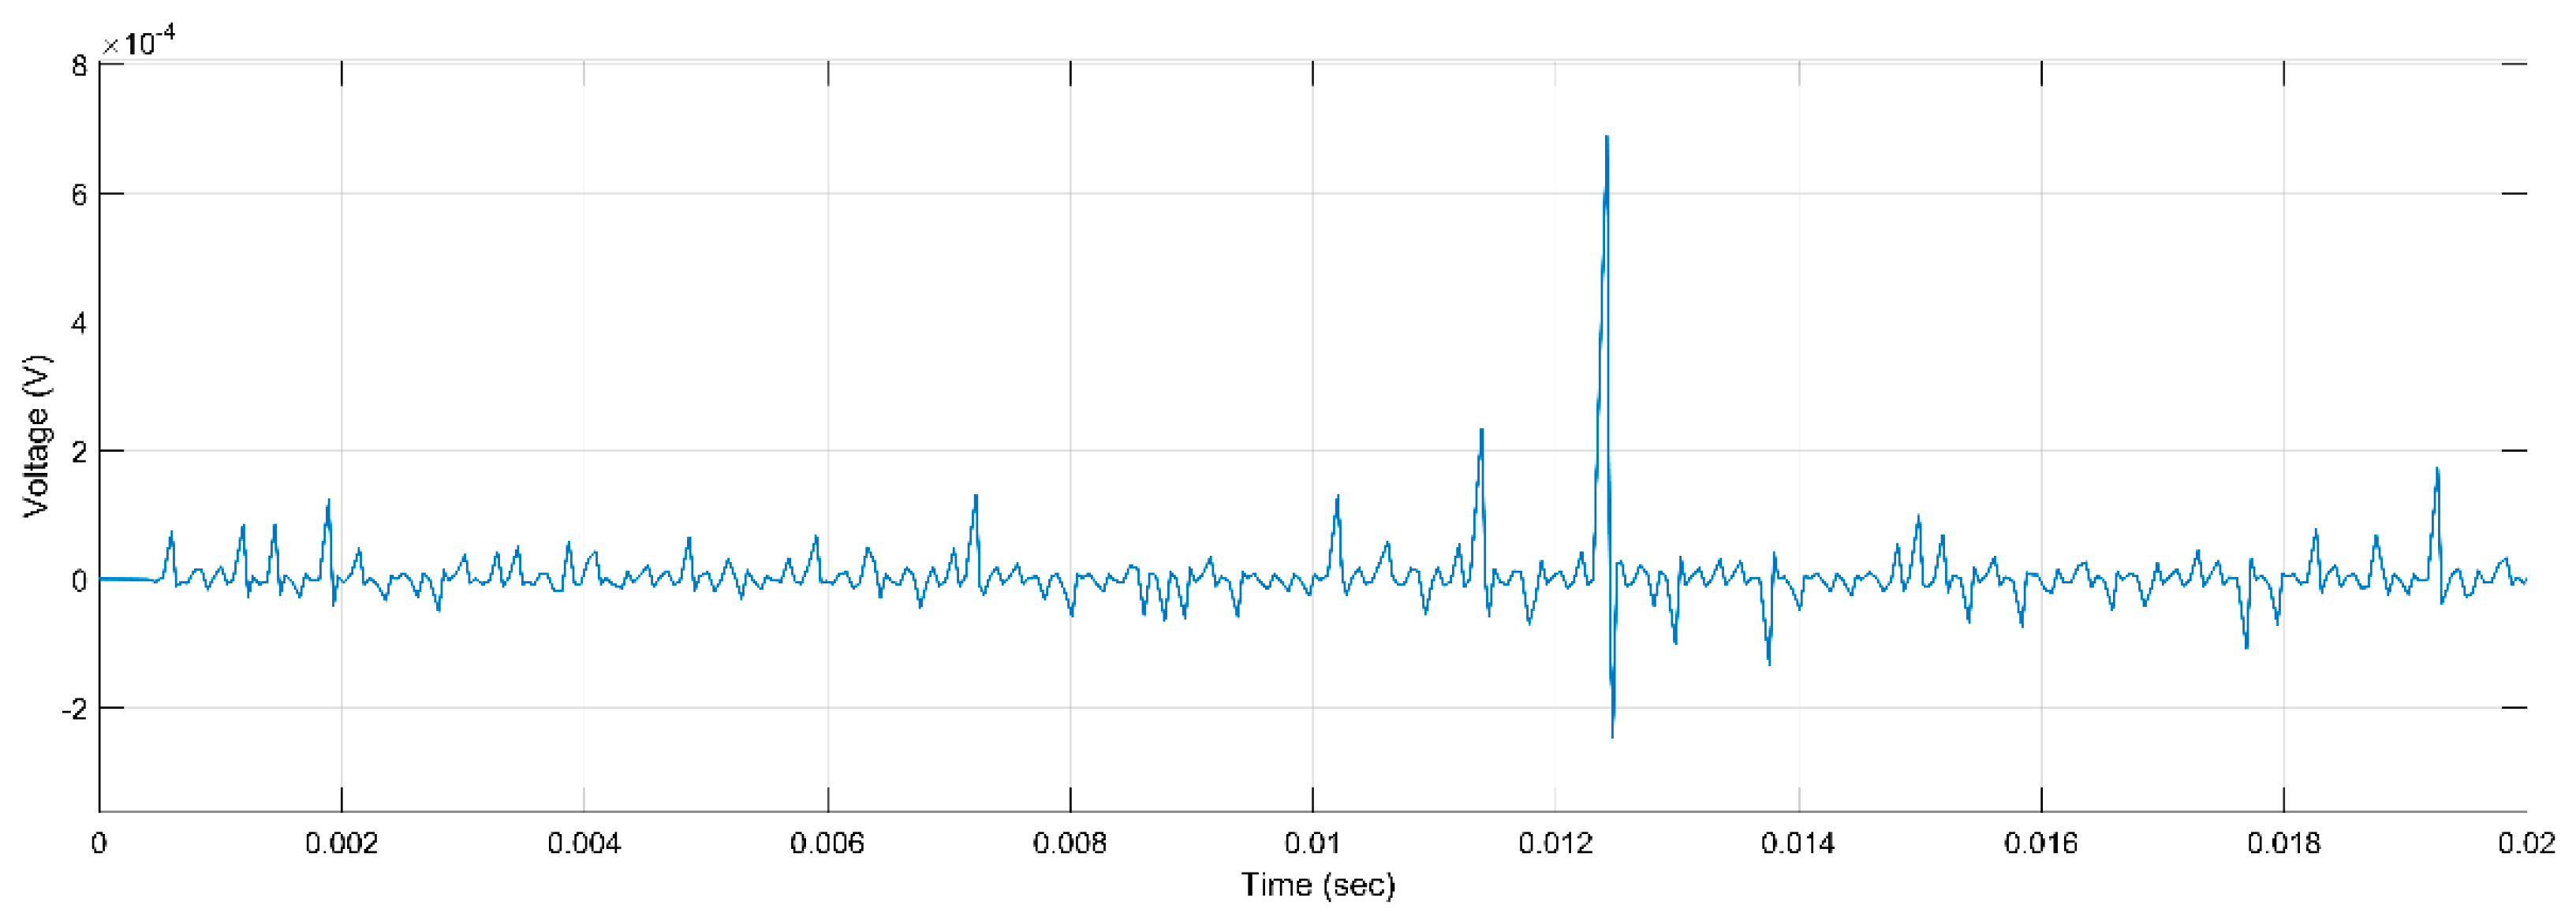
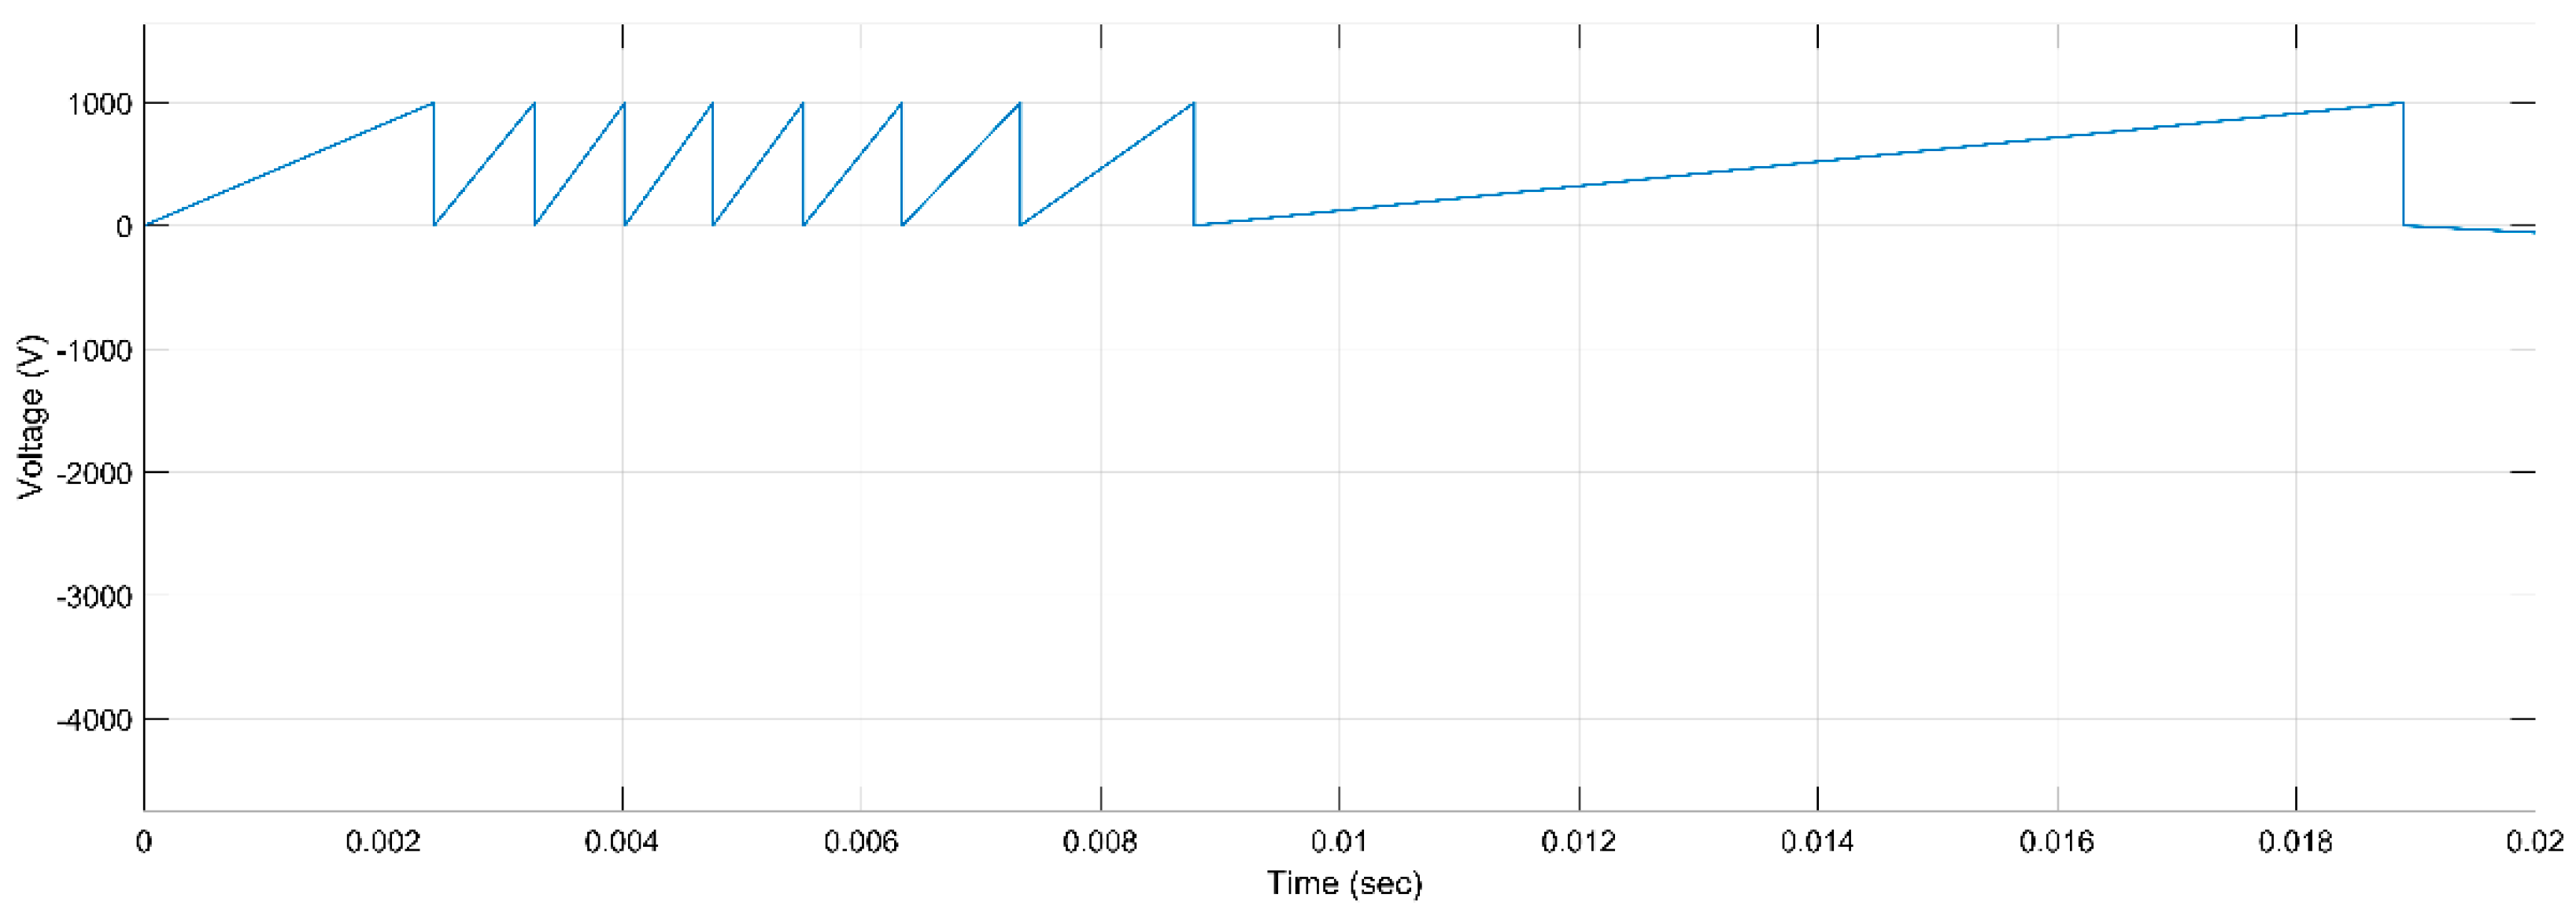
Figure 5.
PD Activity for ER, 5 kV, 2 h, r.
Figure 5.
PD Activity for ER, 5 kV, 2 h, r.
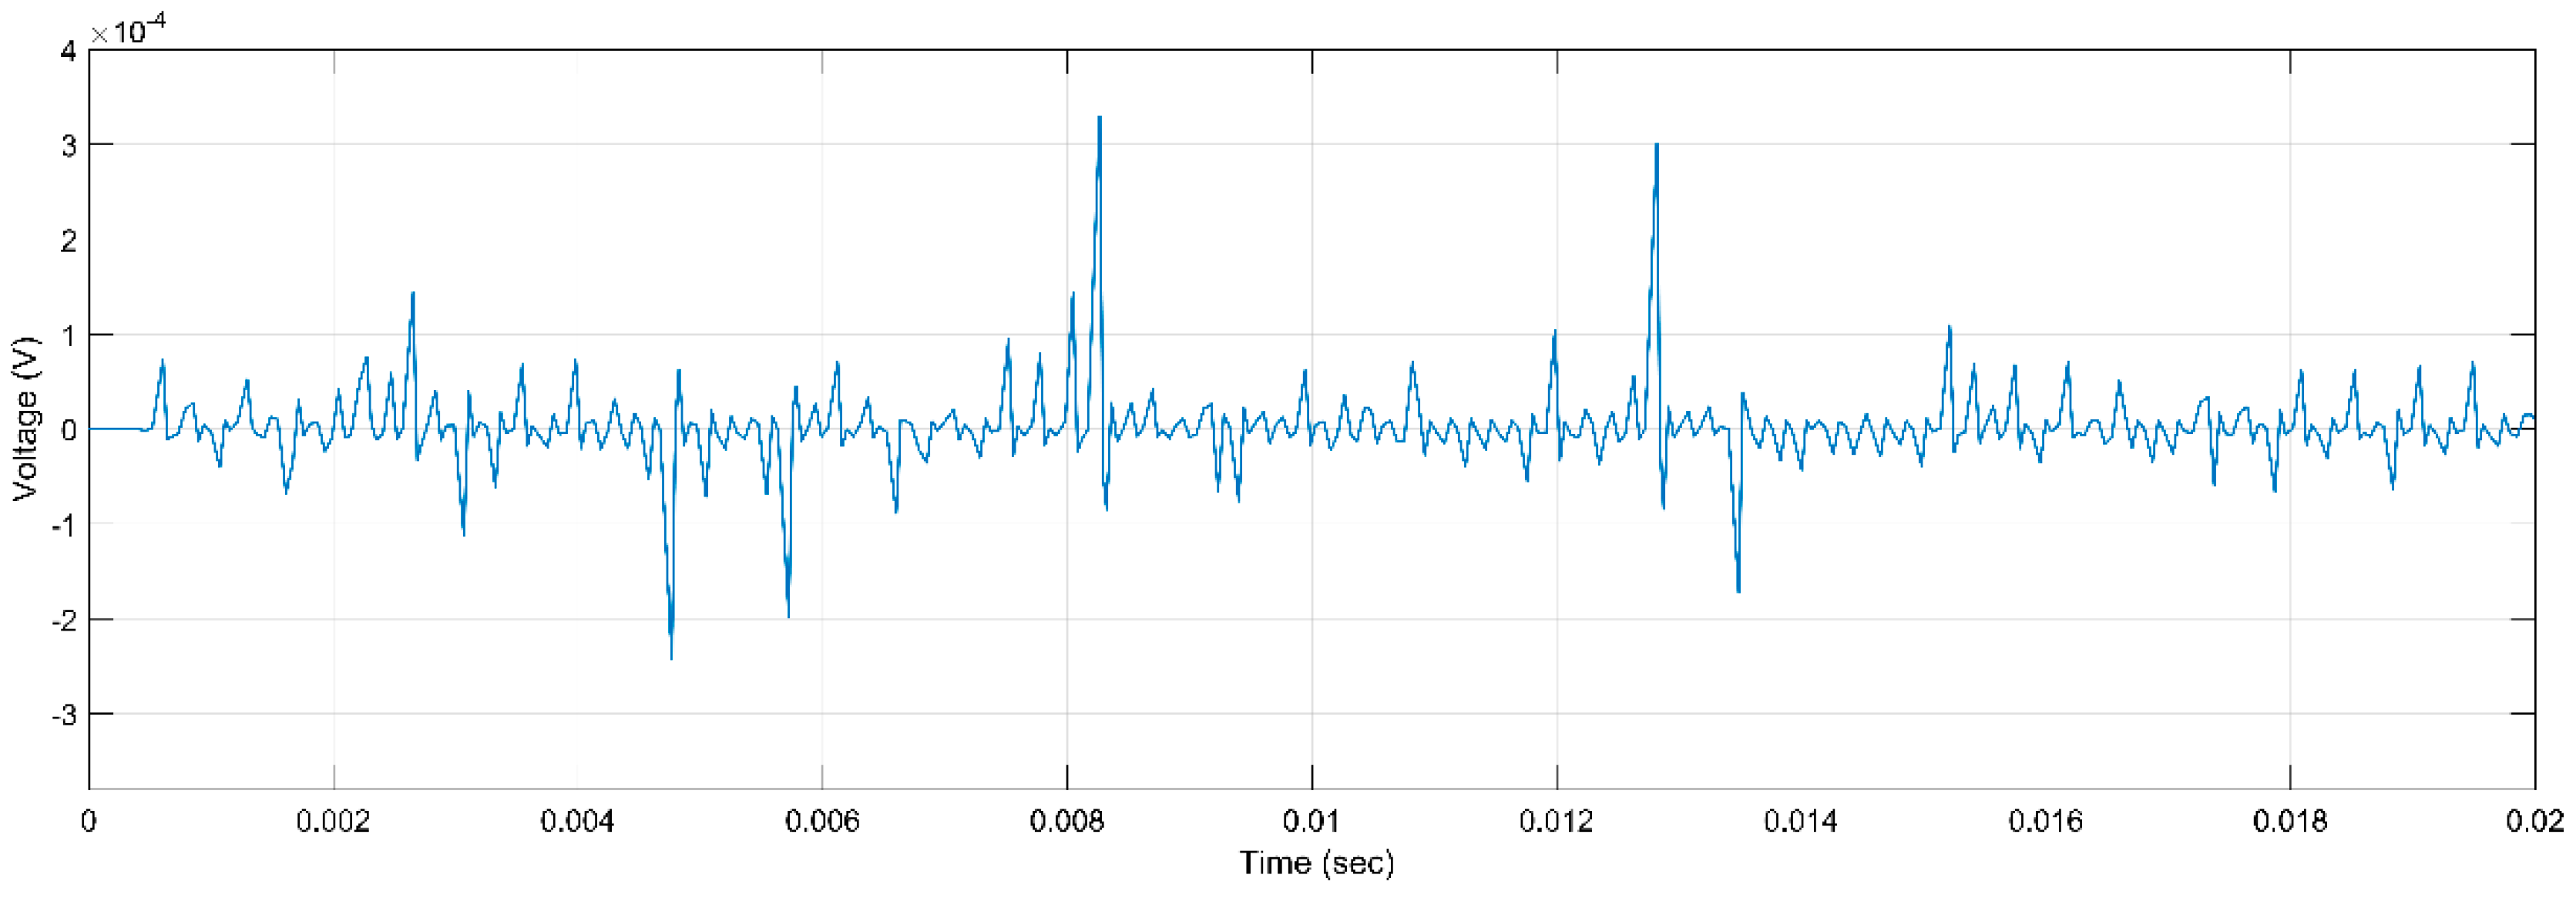
Figure 6.
PD Activity for Mica, 5 kV, h, r.
Figure 6.
PD Activity for Mica, 5 kV, h, r.
Figure 7.
PD Activity for Mica, 10 kV, h, r.
Figure 7.
PD Activity for Mica, 10 kV, h, r.
Figure 8.
PD Activity for Mica, 15 kV, h, r.
Figure 8.
PD Activity for Mica, 15 kV, h, r.
Figure 9.
PD Activity for Combination, 5 kV, h, r.
Figure 9.
PD Activity for Combination, 5 kV, h, r.
Figure 10.
PD Activity for Combination, 10 kV, h, 2 r.
Figure 10.
PD Activity for Combination, 10 kV, h, 2 r.
Figure 11.
PD Activity for Combination, 15 kV, 2 h, r.
Figure 11.
PD Activity for Combination, 15 kV, 2 h, r.
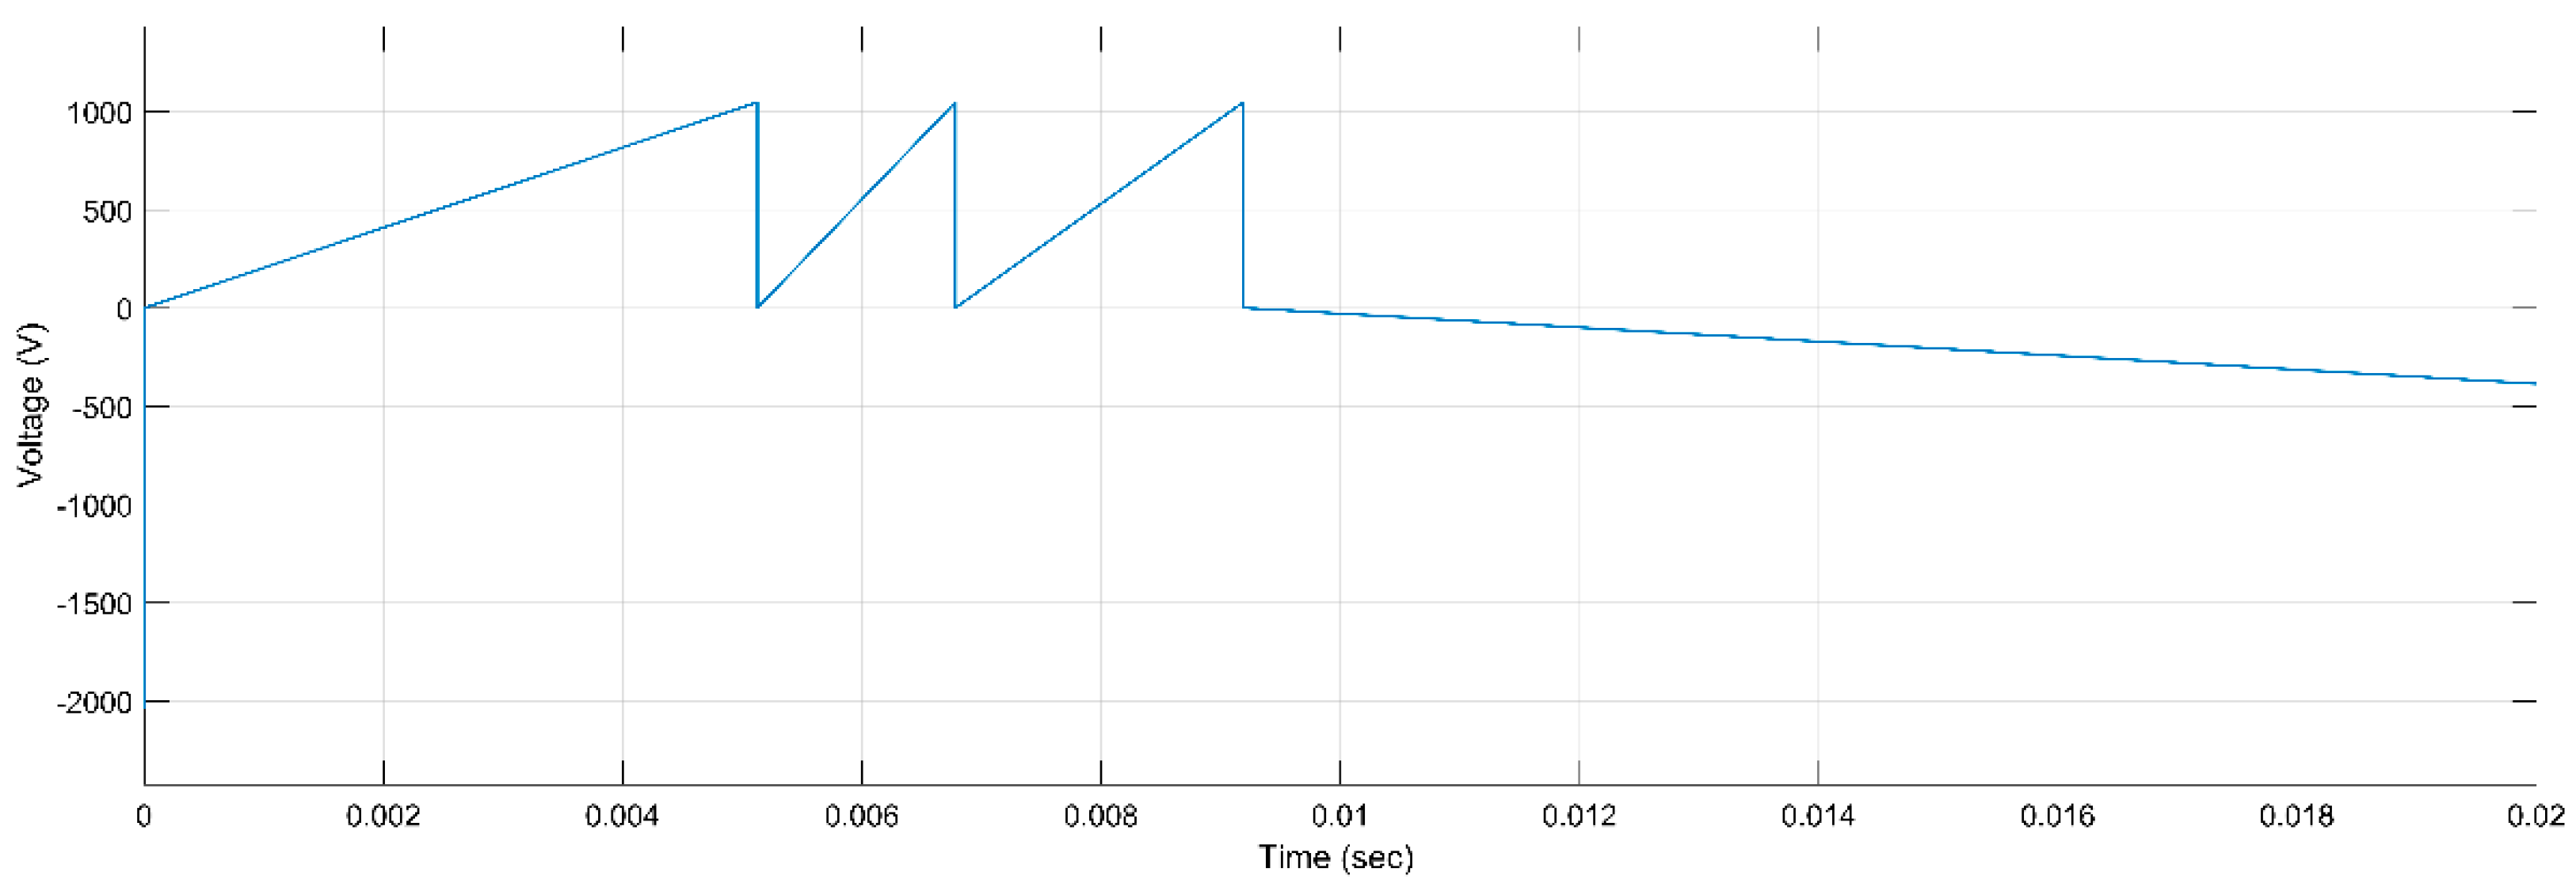
Figure 12.
Capacitive resistance PD model.
Figure 12.
Capacitive resistance PD model.
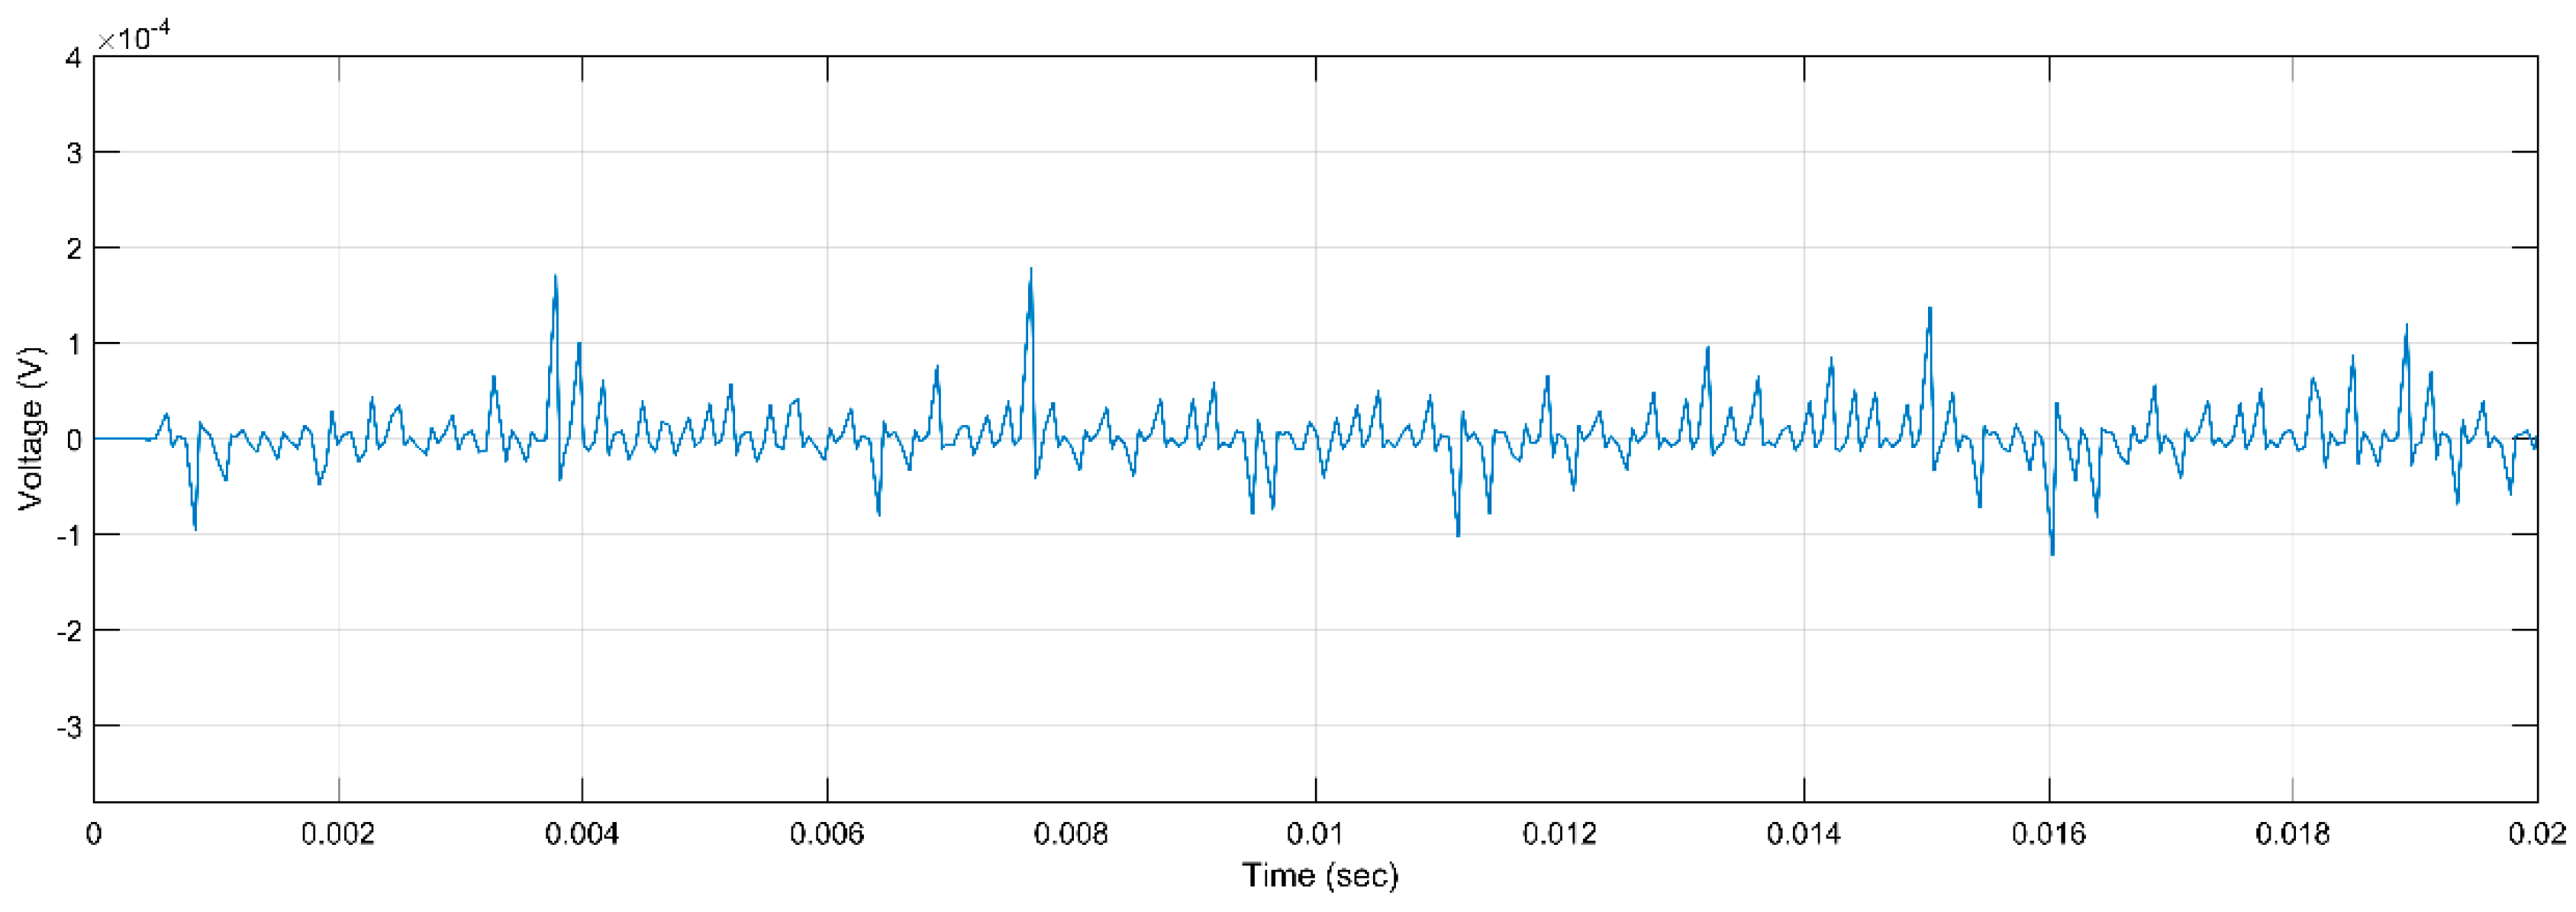
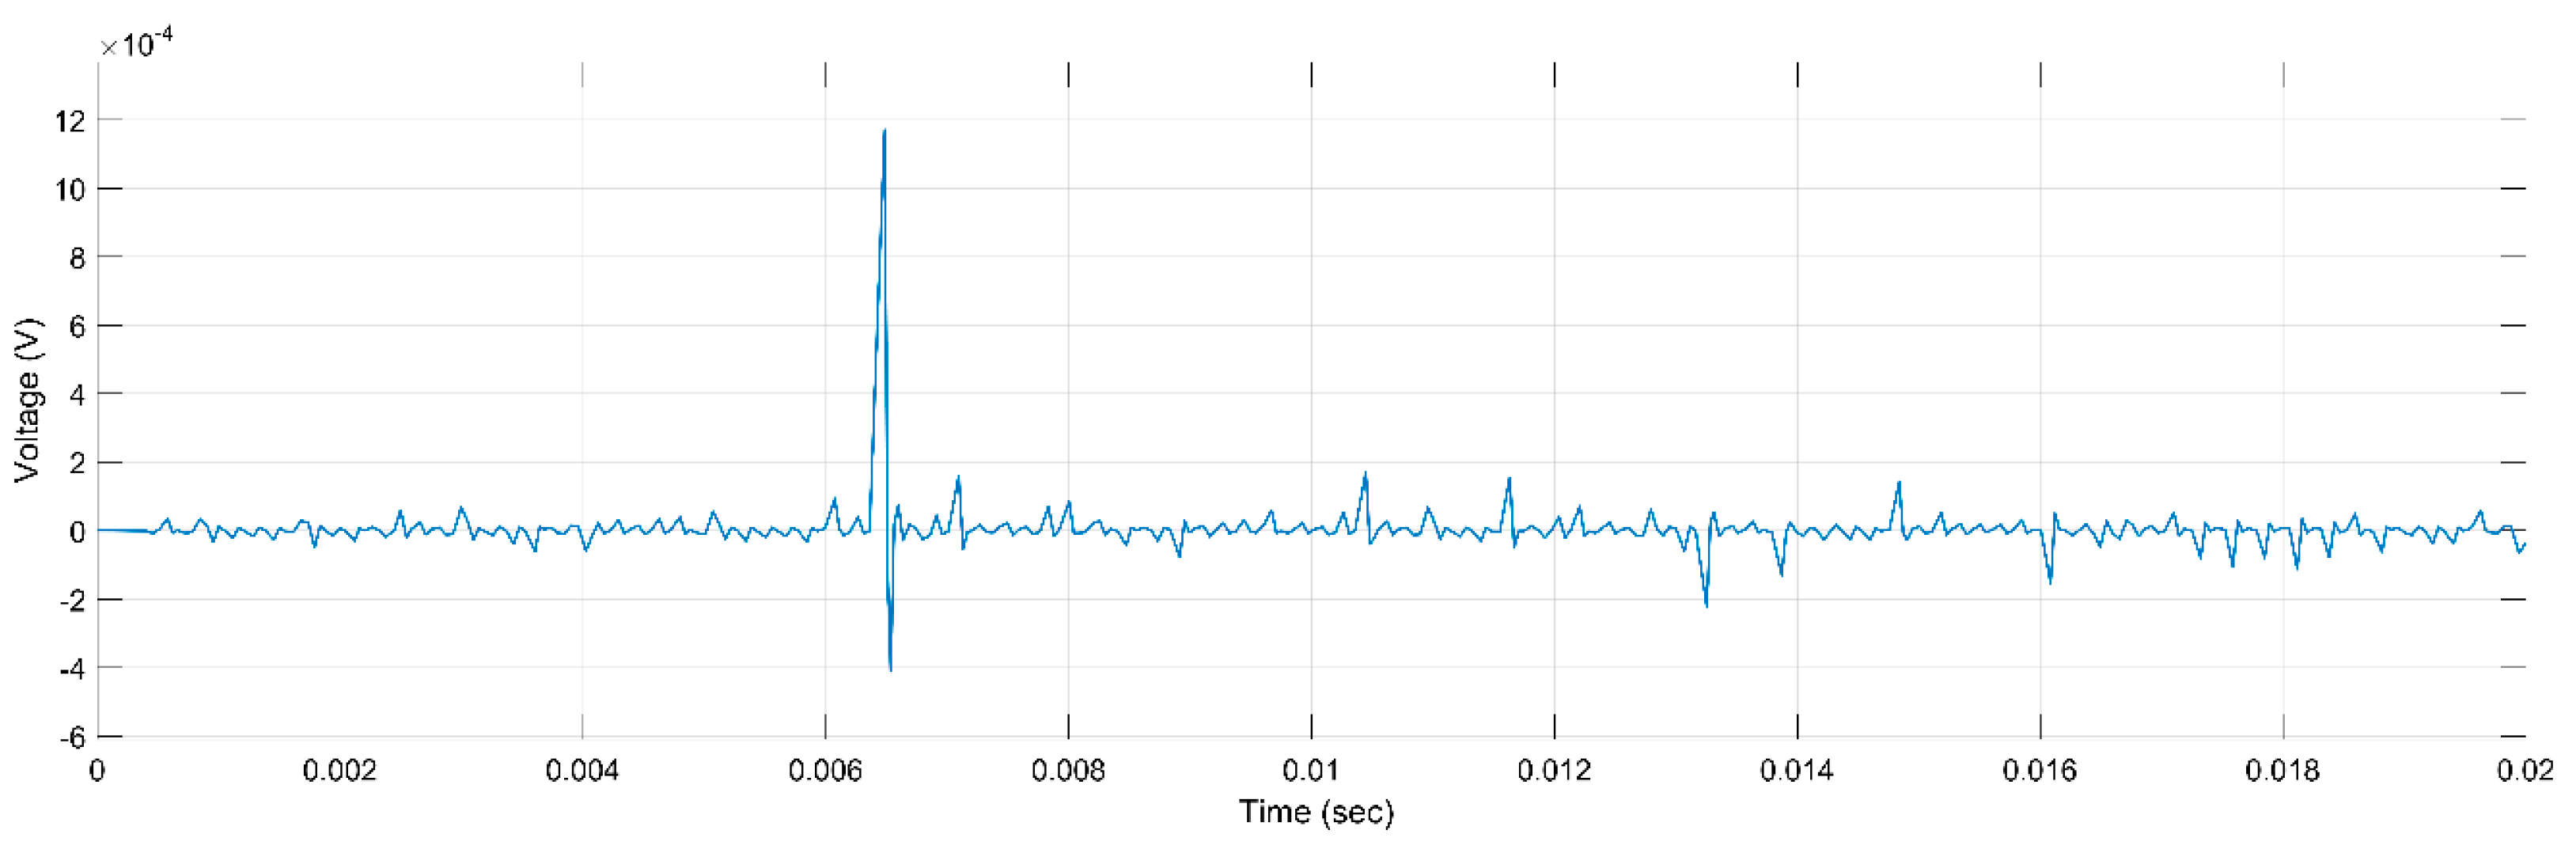
Figure 13.
PD Activity for ER, 5 kV, h, r.
Figure 13.
PD Activity for ER, 5 kV, h, r.
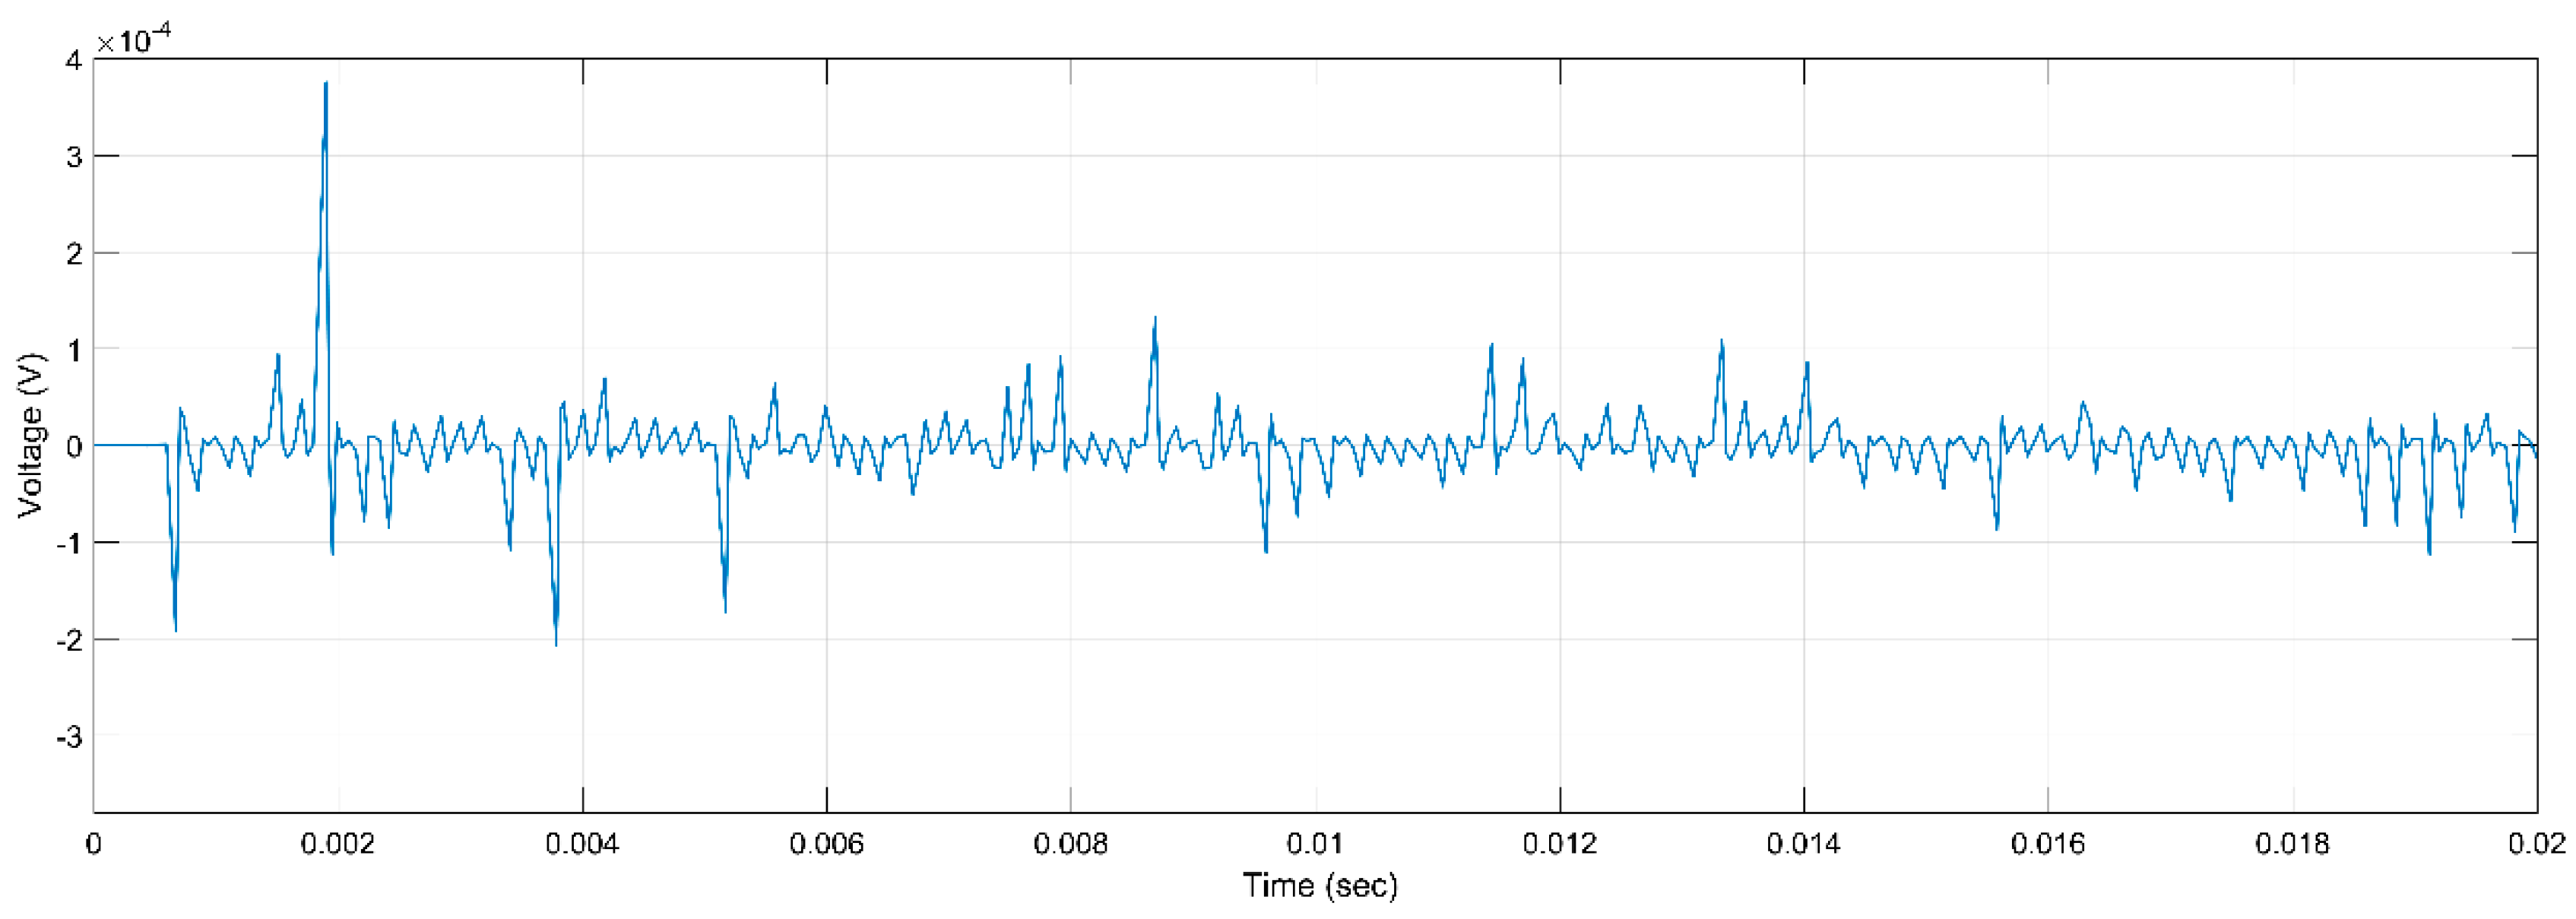
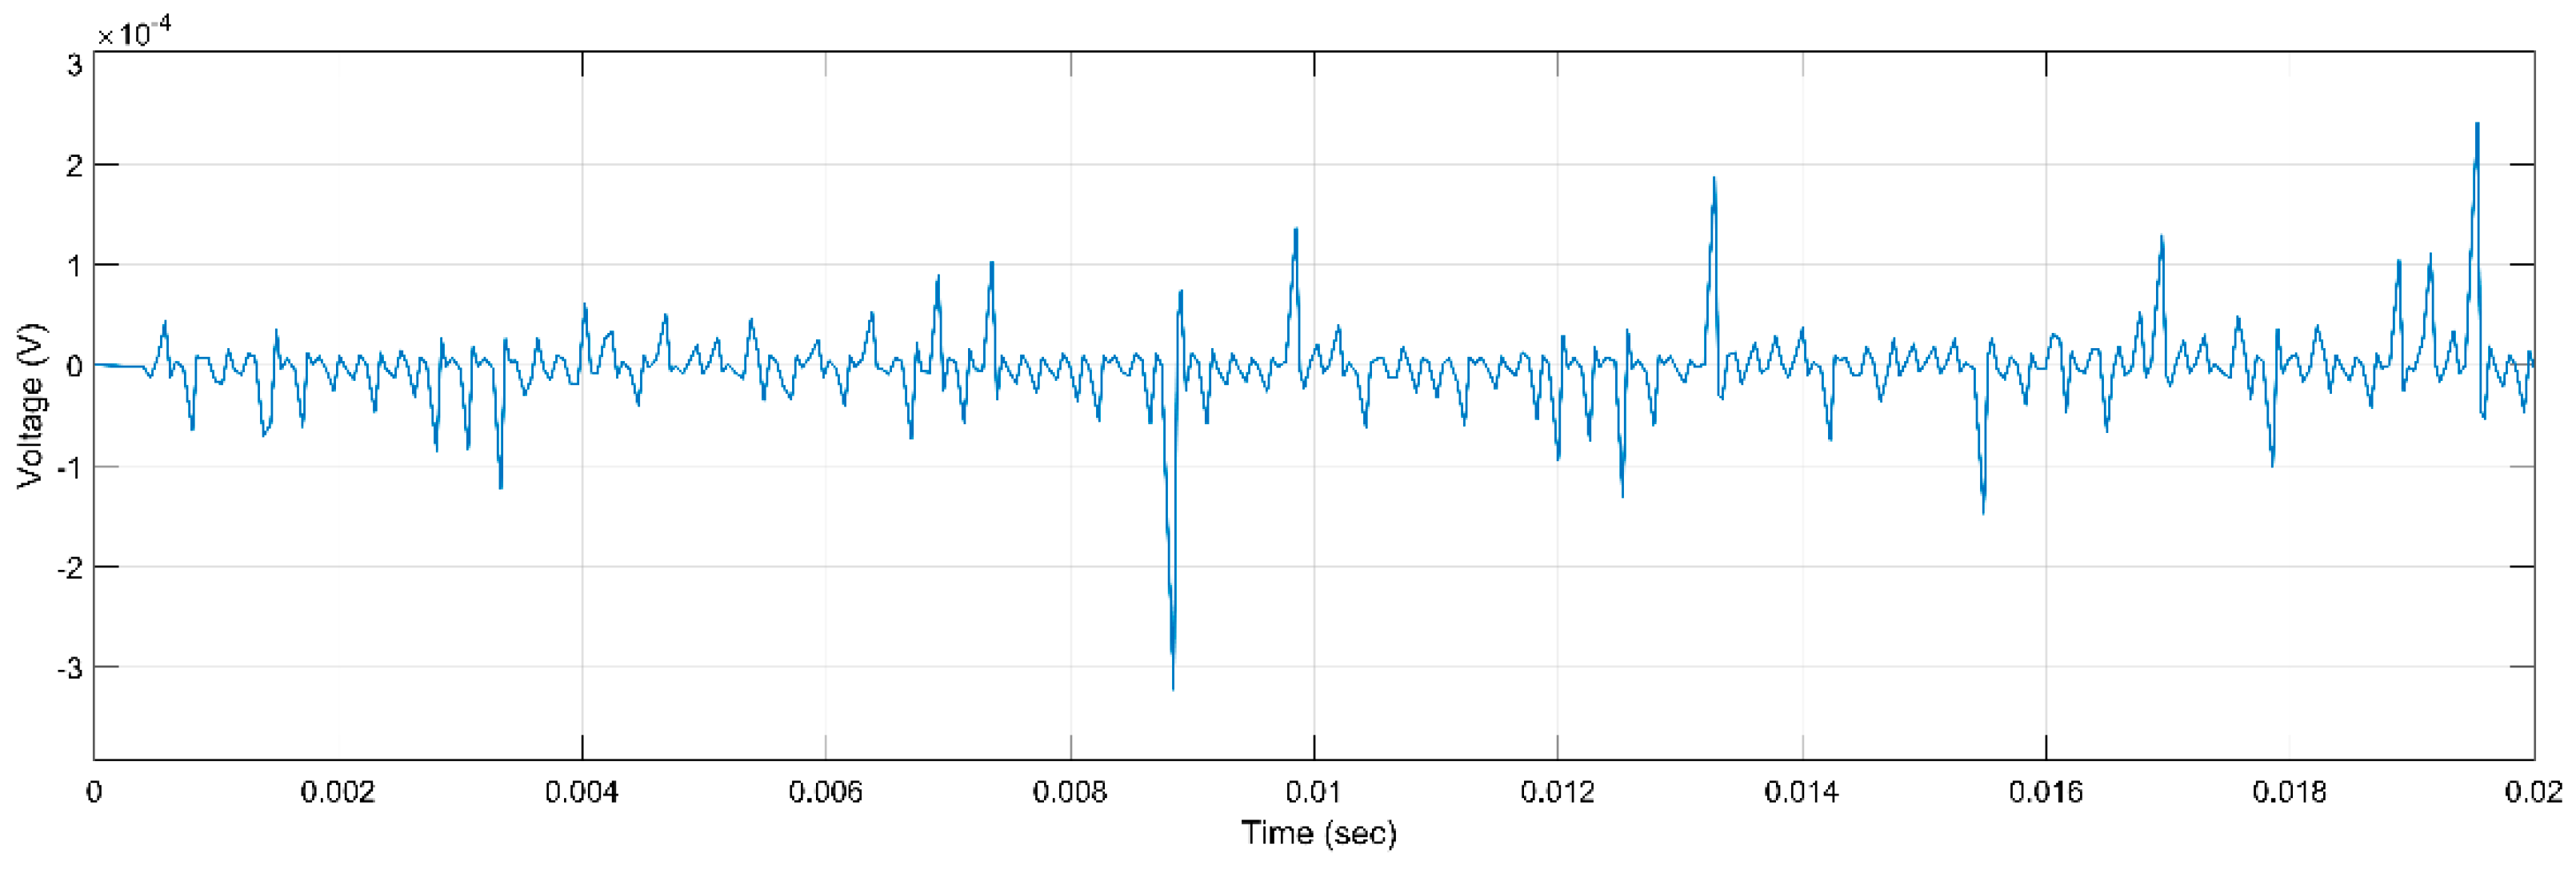
Figure 14.
PD Activity for ER, 5 kV, h, 2 r.
Figure 14.
PD Activity for ER, 5 kV, h, 2 r.
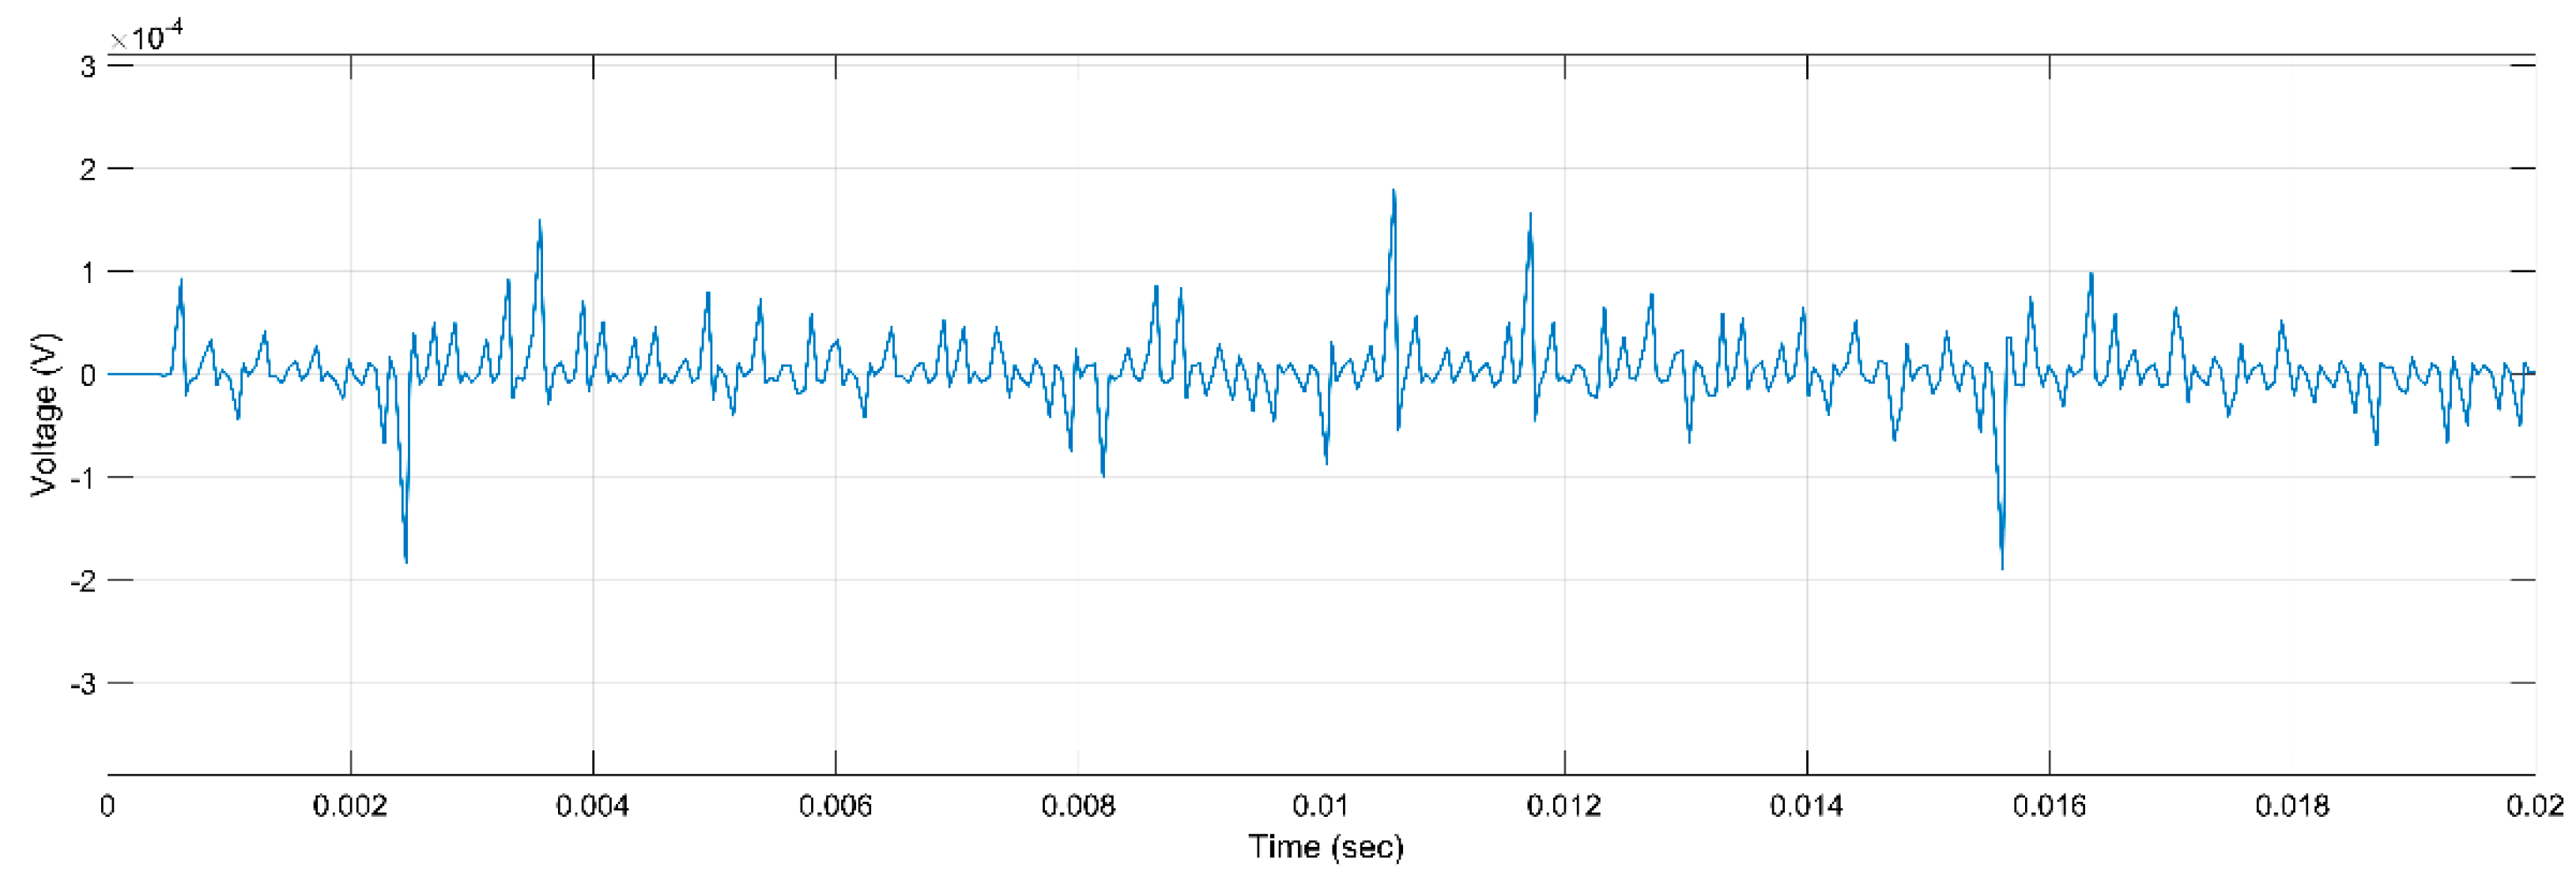
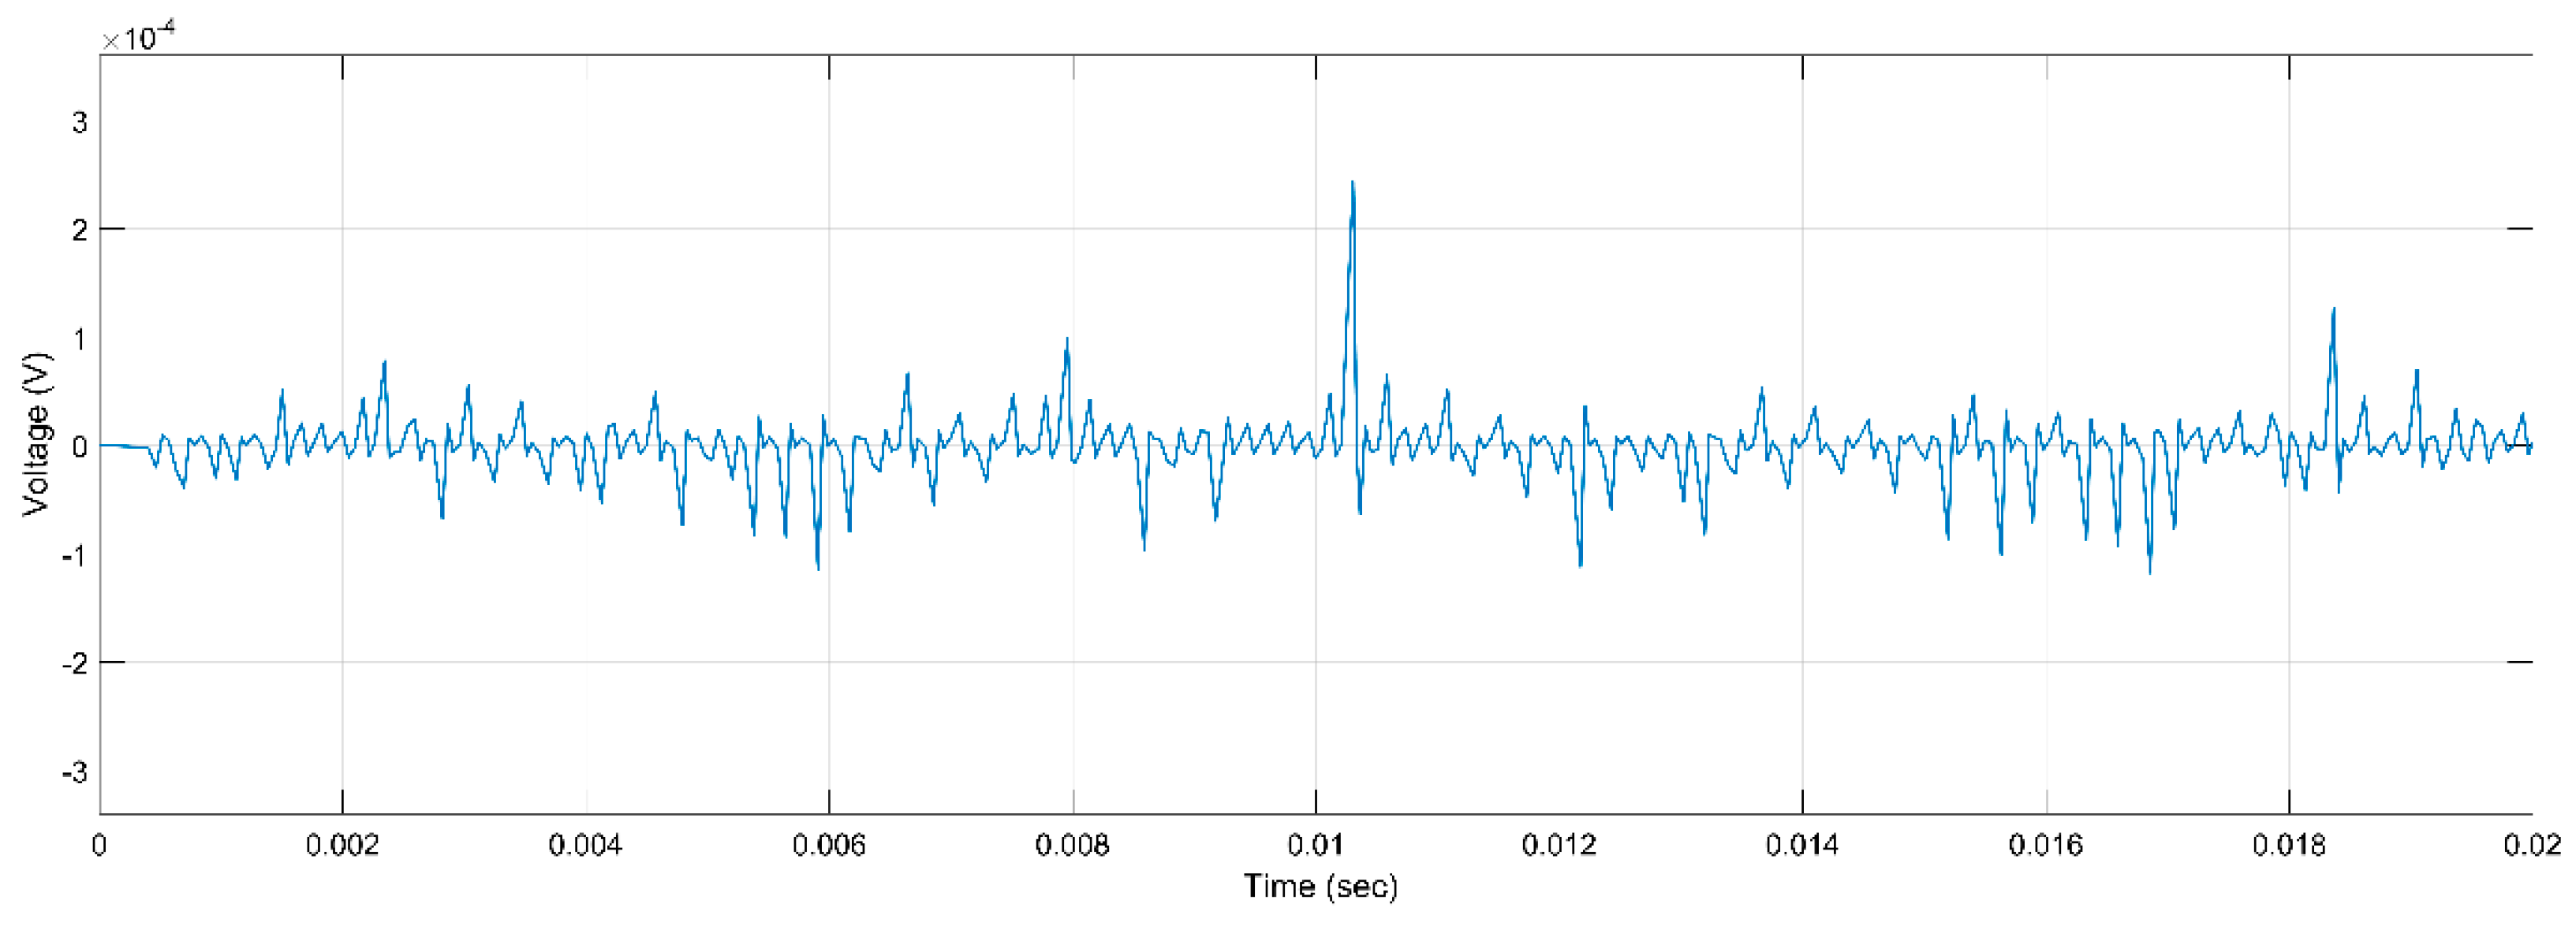
Figure 15.
PD Activity for ER, 5 kV, 2 h, r.
Figure 15.
PD Activity for ER, 5 kV, 2 h, r.
Figure 16.
PD Activity for Mica, 5 kV, h, r.
Figure 16.
PD Activity for Mica, 5 kV, h, r.
Figure 17.
PD Activity for Mica, 10 kV, h, r.
Figure 17.
PD Activity for Mica, 10 kV, h, r.
Figure 18.
PD Activity for Mica, 15 kV, h, r.
Figure 18.
PD Activity for Mica, 15 kV, h, r.
Figure 19.
PD Activity for Combination, 5 kV, h, r.
Figure 19.
PD Activity for Combination, 5 kV, h, r.
Figure 20.
PD Activity for Combination, 10 kV, h, 2 r.
Figure 20.
PD Activity for Combination, 10 kV, h, 2 r.
Figure 21.
PD Activity for Combination, 15 kV, 2 h, r.
Figure 21.
PD Activity for Combination, 15 kV, 2 h, r.
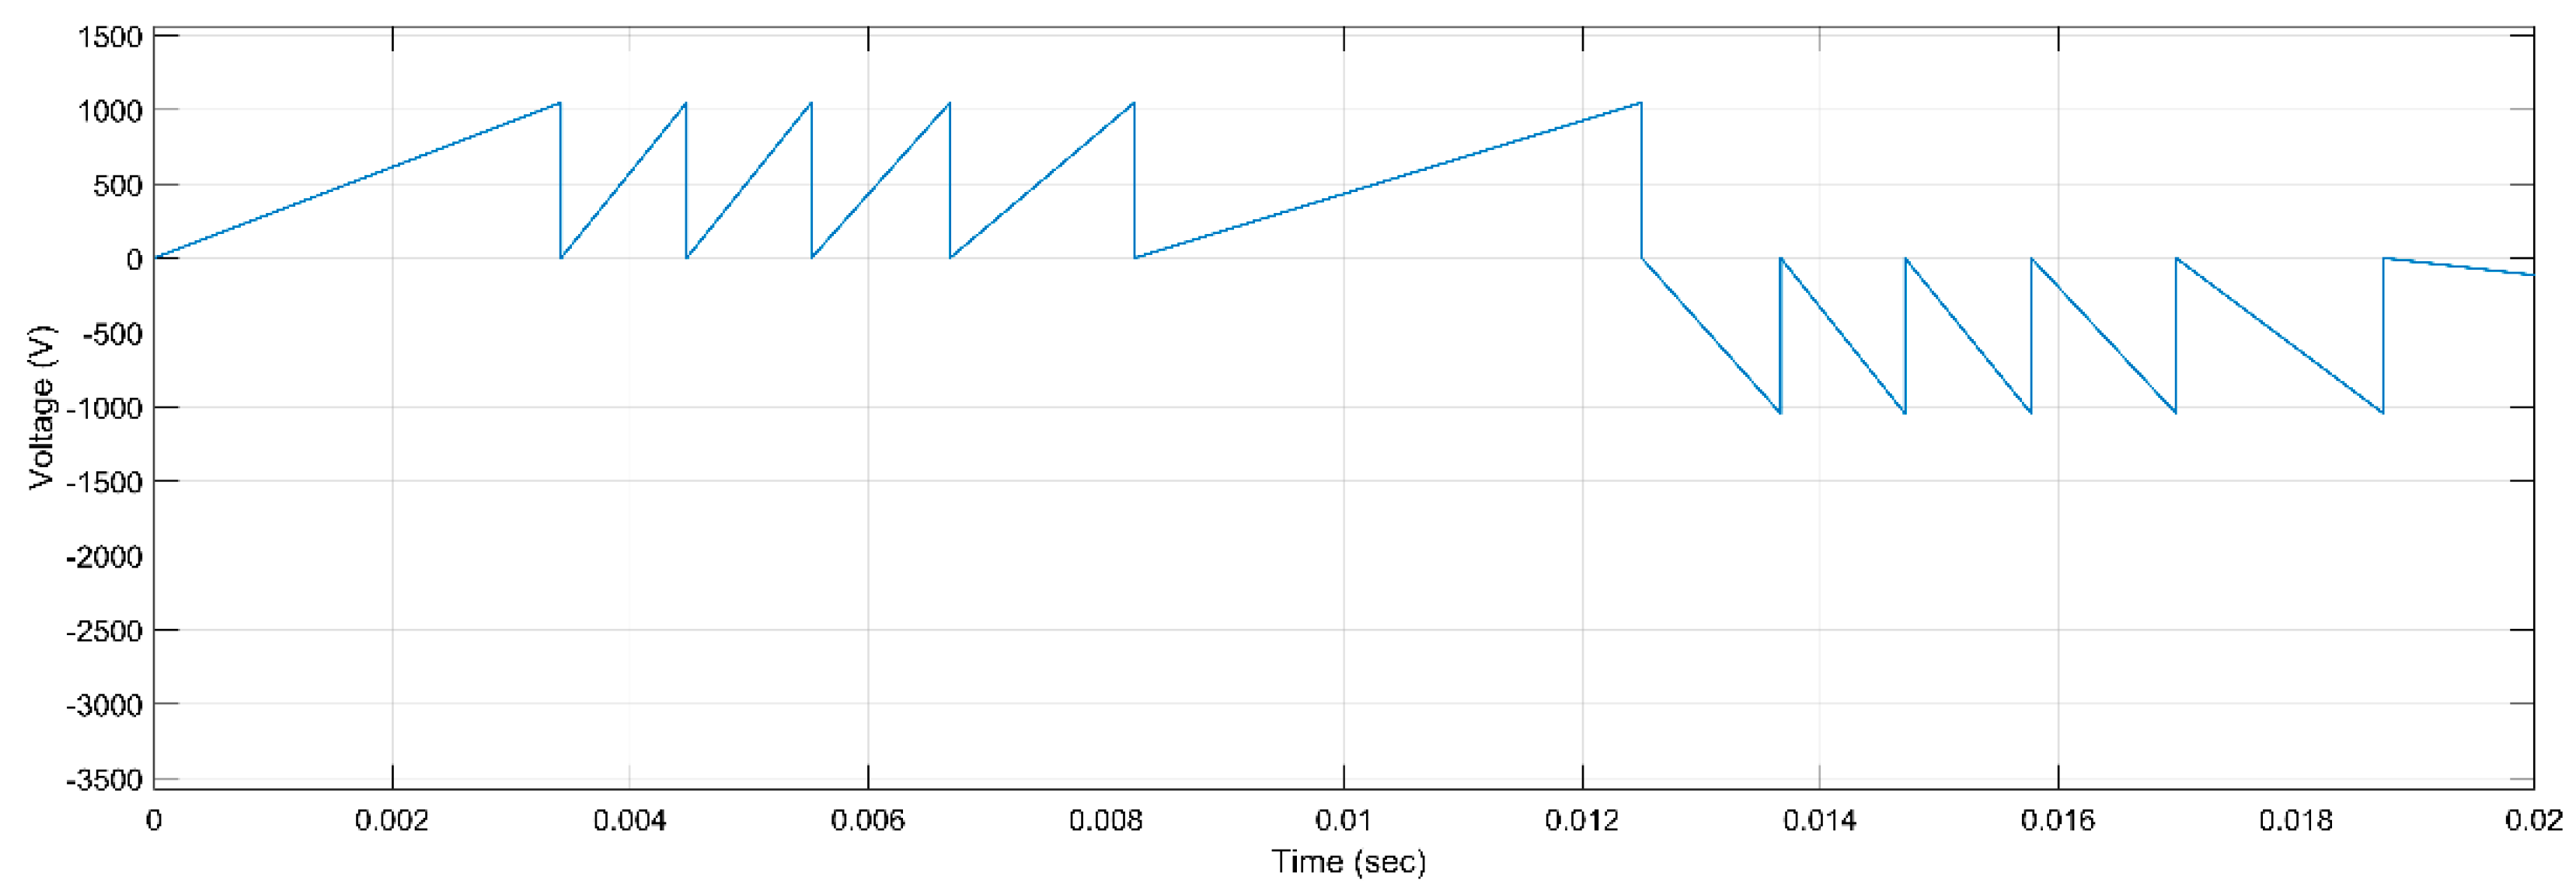
Figure 22.
Advanced capacitive resistance PD model.
Figure 22.
Advanced capacitive resistance PD model.
Figure 23.
PD Activity for ER, 5 kV, h, r.
Figure 23.
PD Activity for ER, 5 kV, h, r.
Figure 24.
PD Activity for ER, 5 kV, h, 2 r.
Figure 24.
PD Activity for ER, 5 kV, h, 2 r.
Figure 25.
PD Activity for ER, 5 kV, 2 h, r.
Figure 25.
PD Activity for ER, 5 kV, 2 h, r.
Figure 26.
PD Activity for Mica, 5 kV, h, r.
Figure 26.
PD Activity for Mica, 5 kV, h, r.
Figure 27.
PD Activity for Mica, 10 kV, h, r.
Figure 27.
PD Activity for Mica, 10 kV, h, r.
Figure 28.
PD Activity for Mica, 15 kV, h, r.
Figure 28.
PD Activity for Mica, 15 kV, h, r.
Figure 29.
PD Activity for Combination, 5 kV, h, r.
Figure 29.
PD Activity for Combination, 5 kV, h, r.
Figure 30.
PD Activity for Combination, 10 kV, h, 2 r.
Figure 30.
PD Activity for Combination, 10 kV, h, 2 r.
Figure 31.
PD Activity for Combination, 15 kV, 2 h, r.
Figure 31.
PD Activity for Combination, 15 kV, 2 h, r.
Figure 32.
Number of PDs for the different insulation materials.
Figure 32.
Number of PDs for the different insulation materials.
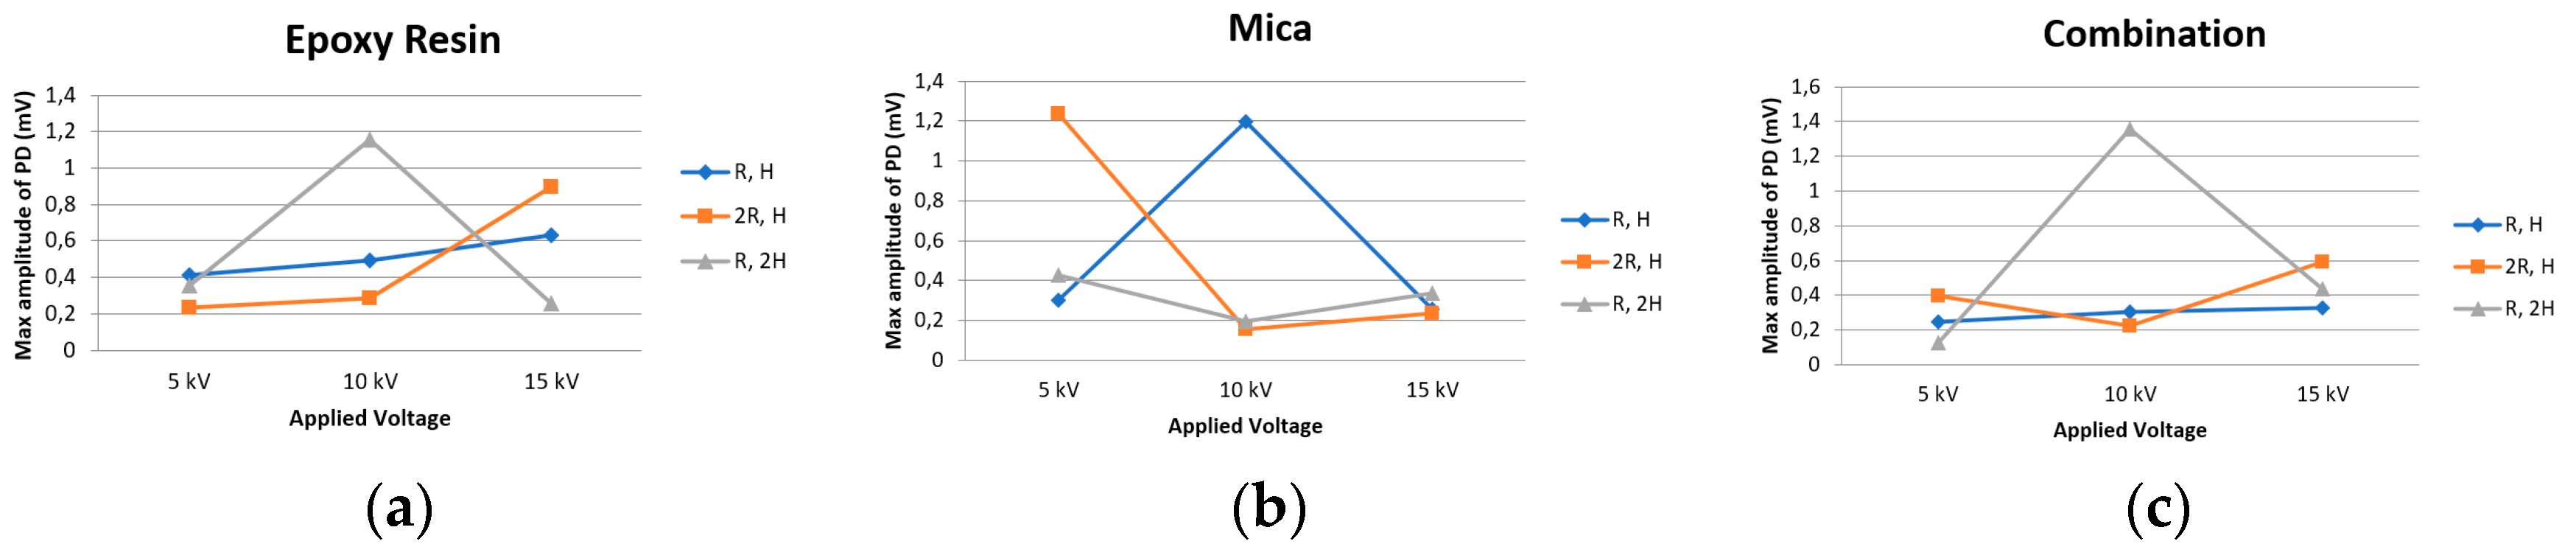
Figure 33.
Maximum amplitude of PD for the 1st model for ER (a), mica (b), and combination (c).
Figure 33.
Maximum amplitude of PD for the 1st model for ER (a), mica (b), and combination (c).
Figure 34.
Maximum amplitude of PD for the 2nd model for ER (a), mica (b), and combination (c).
Figure 34.
Maximum amplitude of PD for the 2nd model for ER (a), mica (b), and combination (c).
Figure 35.
Apparent Charge for the Different Insulation Materials.
Figure 35.
Apparent Charge for the Different Insulation Materials.
Table 1.
Capacitive Model’s Parameters.
Table 1.
Capacitive Model’s Parameters.
| Parameter | Value |
|---|
| Ac High-Voltage (HV) Source | 5 kV, 10 kV, 15 kV |
| Resistor () | 1000 Ω |
| HV Measuring Capacitor () | 1000 pF |
| Coupling Capacitor () | 10 μF |
| 50 Ω |
| 0.45 μF |
| 0.6 mH |
Table 2.
Capacitive Model’s Parameters (h, r).
Table 2.
Capacitive Model’s Parameters (h, r).
| Parameter | Value—ER | Value—Mica | Value—C |
|---|
| F | F | F |
| F | F | F |
| F | F | F |
Table 3.
Capacitive Model’s Parameters (h, 2 r).
Table 3.
Capacitive Model’s Parameters (h, 2 r).
| Parameter | Value—ER | Value—Mica | Value—C |
|---|
| F | F | F |
| F | F | F |
| F | F | F |
Table 4.
Capacitive Model’s Parameters (2 h, r).
Table 4.
Capacitive Model’s Parameters (2 h, r).
| Parameter | Value—ER | Value—Mica | Value—C |
|---|
| F | F | F |
| F | F | F |
| F | F | F |
Table 5.
Capacitive–Resistor Model’s Parameters (h, r).
Table 5.
Capacitive–Resistor Model’s Parameters (h, r).
| Parameter | Value |
|---|
| Ω |
| Ω |
| Ω |
Table 6.
Capacitive–Resistor Model’s Parameters (h, 2 r).
Table 6.
Capacitive–Resistor Model’s Parameters (h, 2 r).
| Parameter | Value |
|---|
| Ω |
| Ω |
| Ω |
Table 7.
Capacitive–Resistor Model’s Parameters (2 h, r).
Table 7.
Capacitive–Resistor Model’s Parameters (2 h, r).
| Parameter | Value |
|---|
| Ω |
| Ω |
| Ω |
Table 8.
Advanced Capacitive Model’s Parameters.
Table 8.
Advanced Capacitive Model’s Parameters.
| Parameter | Value—r, h | Value—2 r, h | Value—r, 2 h |
|---|
| kV | kV | kV |
| A | A | A |
| kΩ |


 ,
, 


