Abstract
The quality of the diagnostic information obtained in the course of laboratory studies depends on the accuracy of compliance with the regulations for the necessary work. The process of aliquoting blood serum requires immersing the pipette to different depths depending on the boundary level between blood phases. A vision system can be used to determine this depth during automated aliquoting using various algorithms. As part of the work, two recognition algorithms are synthesized, one of which is based on the use of the HSV color palette, the other is based on the convolutional neural network. In the Python language, software systems have been developed that implement the ability of a vision system to recognize blood in test tubes. The developed methods are supposed to be used for aliquoting biosamples using a delta robot in a multirobotic system, which will increase the productivity of ongoing biomedical research through the use of new technical solutions and principles of intelligent robotics. The visualized results of the work of the considered programs are presented and a comparative analysis of the quality of recognition is carried out.
1. Introduction
Laboratory studies of venous blood samples aim to provide the customer with reliable and accurate information about the concentration or activity of the analyte. Reducing the quality of information significantly increases the likelihood of making the wrong clinical decision.
Aliquoting is the process of manipulating an accurately measured fraction of a sample (volume of solution) taken for analysis that retains the properties of the main sample. The process of aliquoting the blood of various patients involves the excavation of biological material from a tube with a separated fraction into tubes of small volume. To do this, it is necessary to move the tube from the rack to the dirty area (workspace) where the dosing into aliquots takes place. The quality of sample preparation is ensured at all stages, including aliquoting [1].
Factors that reduce the quality of diagnostic information include laboratory errors that occur at different stages of the investigation [2,3,4,5].
The collection of blood samples from the patient is the least controlled by laboratory management. Often, the choice of materials for blood sampling is carried out by the staff of health facilities without taking into account the requirements of laboratories, which causes a significant part of the samples to be rejected. Thus, the use of disposable syringes significantly increases the incidence of hemolysis, the formation of microclots in a venous blood sample as a result of two passages of blood through the syringe needle under pressure.
Other factors affecting the quality of the information received are implemented directly in the laboratory. The main mistake is the use of centrifuge speed in sample preparation protocols instead of relative centrifugal force. Another source of error during sample preparation is sample aliquoting, during which serum is dispensed from a primary tube into one or more secondary tubes.
The work in [6] shows the efficiency of automated aliquoting in comparison with the use of manual labor. Research in the field of the application of robotic systems for dosing liquids and the automation of laboratory processes for sample preparation is being carried out by many scientists. Thus, in [7], technology for determining the level of liquid in a given volume based on a pressure sensor is proposed, which makes it possible to ensure the stability of the platform for processing liquid and the accuracy of its dosing. The papers [8,9] propose the use of a cognitive two-armed robot that works together with an operator and is remotely controlled. The possibility of using robots and machine vision is also being considered in other areas of medicine. Thus, in [10], the full automation of a surgical robot is considered by combining advanced recognition and control capabilities developed in accordance with a strict assessment of surgical requirements, a formal specification of the behavior of a robotic system, and requirements for the development and implementation of software. The implementation of the proposed architecture was tested on a pilot plant, including a new robot specifically designed for surgical applications, but adaptable to various tasks chosen (e.g., insertion of a needle, suturing wounds). It is also possible to use neural networks, for example, to detect and identify gauze in a laparoscopic video during surgical operations [11], which will increase the autonomy of surgical robots during gauze manipulation in real time.
The structure of the known automated aliquoting systems is designed to separate a large number of aliquots of a single biological fluid, which is most often used in microbiology and virology laboratories. There is a problem in searching for new technical solutions in the field of robotic aliquoting, as well as new approaches to the organization of a vision system, with the possibility of effective image segmentation, taking into account the heterogeneity of biosamples. To solve this problem, it is proposed to use machine vision algorithms that can be used to determine the fluid contour with the subsequent interpretation of the received information [12,13].
In the field of border and contour recognition in an image, research has been ongoing for quite some time. In the article [14], aimed at analyzing the topological structure of digital binary images, two edge tracking algorithms are proposed. The results of the work obtained in the article formed the basis of the algorithm for determining the contours, which are used in the OpenCV library.
Technical vision can be used in various areas, for example, in the article [15], an investigation is made of the possibility of using technical vision for segmenting abnormal skin layers in computer image analysis. In this work, the process of extracting asymmetric patterns from dermoscopic images is separated using HSV segmentation to find the contour image. Automatic RGB-HSV separation is used, which segments the skin lesion. The proposed automatic segmentation can be useful for a dermatologist in identifying affected areas.
The article [16] considers the possibility of detecting human skin using the RGB (red, green, blue), HSV (hue, saturation, luminosity) and YCbCr (brightness, chroma) color models. This article proposes a new algorithm for detecting human skin. The purpose of the proposed algorithm is to improve the recognition of skin pixels in given images. The algorithm takes into account not only individual ranges of three color parameters, but also combination ranges, which provide greater accuracy in recognizing a skin area in a given image. The article [17] proposes two automatic methods for detecting bleeding in videos of wireless capsule endoscopy of the small intestine, using different color spaces: the first method works pixel by pixel and only uses color information and the second method uses a more sophisticated approach that not only relies on pixel colors, but also assumes that the blood in the frame forms a continuous area (or several such areas), which gives an idea of the shape and size of the blood spot.
In addition, in [18], a detection algorithm is proposed that takes advantage of the camera and the downloaded data to determine the color based on the RGB values. The algorithm included calls to a function that runs loops to adjust the distance based on the closest match. This makes it easy to determine the color based on the RGB color space, with maximum accuracy.
Articles [19,20] propose color estimation methods based on the HSV model. These methods convert the RGB values of video pixels to HSV values and use the HSV values for color recognition. The developed software for real-time video object recognition based on color features is presented, which has achieved the goal of real-time video motion detection and object color recognition. It can be said that the algorithms are accurate and similar to the human recognition of moving objects on video, which demonstrates the good performance in target identification and color estimation by the program.
Thus, various color models and methods are used for colored objects detection based on technical vision, and they have both advantages and disadvantages. The disadvantages of the considered methods include the difficulty of determining the boundary between two different colored objects. In particular, these methods do not give accurate results for solving the problem of determining the interface of blood fractions in the process of aliquoting biosamples. To solve this problem, it is proposed to use an algorithm based on the HSV color model for blood recognition during the technological process of biosamples aliquoting using the proposed multirobotic system. This method simplifies the training process and has a more understandable structure than the methods based on neural networks. In addition, the HSV color model is more in line with the traditional human perception of color and is easier to understand than other color models.
It is also proposed to use a method for recognizing blood phases based on a neural network. For this, the U-Net neural network was chosen, as it was originally created for the segmentation of biomedical images [21] and has the ability to work with a small amount of training data in comparison with other neural networks and can perform segmentation more accurately and quickly.
New approaches are used to solve the indicated problems; two algorithms for determining the levels of blood fraction interfaces in a test tube were synthesized, one of which is based on the HSV color model, and the other is based on the U-Net neural network. The results of the contour recognition of various blood fractions in test tubes were compared using both algorithms. Section 2 presents the structure control systems for the aliquoting process using a robotic system. Section 2 and Section 3 present a description of, and the simulation results for, each of the developed algorithms. Section 4 compares the algorithms.
2. The Structure of the Control System for the Process of Aliquoting
A pipette is used to take the serum from the test tube (Figure 1). The need for, as far as possible, the full use of the available volume of serum forces the laboratory assistant to carry out manipulations in the region of its lower border. As a result, erythrocytes from the surface of the clot can be drawn into the pipette, resulting in sample contamination. Particular care must be taken if a lump of fibrin threads is found at the bound between blood phases (Figure 1b). One of the tasks of the laboratory assistant in such a situation is to prevent the threads from being drawn into the pipette.
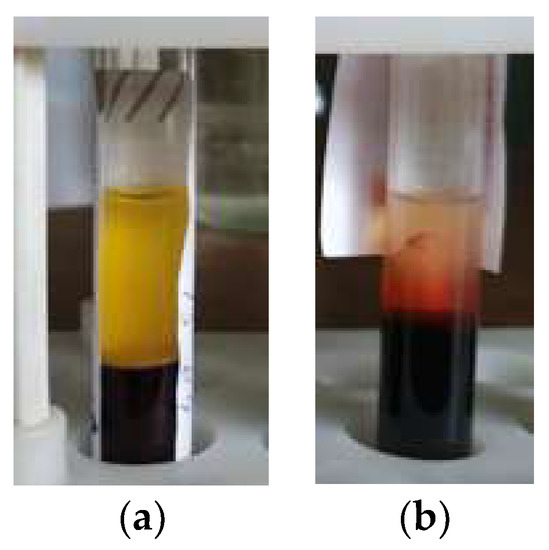
Figure 1.
Test tube with a centrifuged sample in a rack: (a) Horizontal bound between blood phases; (b) Fibrin strands are visible.
In automated aliquoting systems [22,23], determining the height of the upper and lower serum boundaries within the test tube, as well as the nature of the lower boundary, is, therefore, an urgent research task, the solution of which determines the quality of the obtained diagnostic information. The papers [23,24] propose the design of a robotic system (RS) consisting of two robots: a parallel delta robot with a dosing head for aliquoting and a collaborative serial robot with a gripping device for transporting racks with test tubes. The mutual arrangement of the robots ensures the intersection of the workspaces for the access of both robots to the required objects [22]. The RS (Figure 2a,b) includes: a body 1, in which a parallel delta manipulator 2 is located, moving the dosing head 3, fixed in the center of the robot’s movable platform and performing aliquoting. The replaceable tip 4 on the dosing head is fixed with a rubber sealing ring. The serial collaborative robot 5 is installed on a fixed base 6 and ensures the movement of the test tubes 8 using a gripper within the workspace 7.
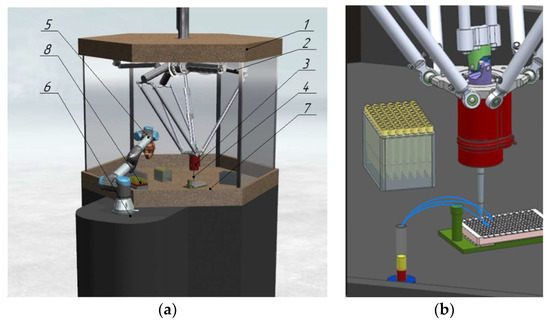
Figure 2.
(a) 3D model of RS for aliquoting; (b) End-effector with a dosing head.
The functional diagram of the aliquoting process control system is shown in Figure 3.
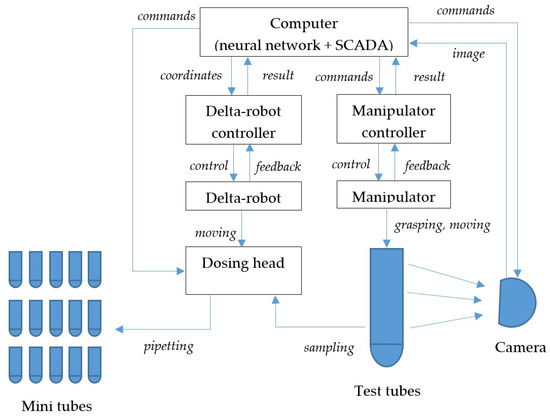
Figure 3.
Functional diagram of the aliquoting control system.
The control system operation algorithm includes the following steps according to Figure 3:
- The controller of the manipulator, in accordance with the task, moves the grasping to the test tube to capture it and transport it to the workspace.
- The controller of the manipulator, having received information about the successful completion of the transportation, transfers it to the computer.
- The video camera, on command from the computer, takes an image of the test tube and transfers the image to the computer.
- Segmentation of the image and determination of the level of separation of fractions in the test tube.
- The levels are recalculated into the delta robot coordinate system, the coordinates are transferred to the delta robot controller.
- The delta robot controller moves the dosing head towards the tube.
- The controller of the delta robot, having received information about the successful completion of the movement, transfers it to the computer.
- The dosing head, at the command of the computer, draws liquid from the test tube.
- In a loop whose number of iterations is determined by the calculated number of aliquots:
- (a)
- the computer sends the coordinates of the next mini-tube to the controller of the delta robot;
- (b)
- the delta robot controller moves the dosing head towards the mini tube;
- (c)
- the controller of the delta robot, having received information about the successful completion of the movement, transmits it to the computer;
- (d)
- The dosing head, at the command of the computer, disperses the liquid into a mini-tube.
- The computer issues a command to the manipulator controller to unload the test tube.
- The controller controls the manipulator in order to transport the test tube from the workspace.
Steps 10–11 can be performed in parallel with the dosing process of step 9 (after the completion of the first iteration of the loop).
We synthesize vision algorithms to perform step 4.
3. Vision Algorithm Using the HSV Color Model
3.1. Algorithm Synthesis
As the first algorithm, it is proposed to use an algorithm based on the identification of objects based on their colors. The color palette is presented in the form of a HSV color model, which has a cylindrical shape (Figure 4); however, it can be represented as intervals of H, S, and V values in the ranges between 0 and 1.0.
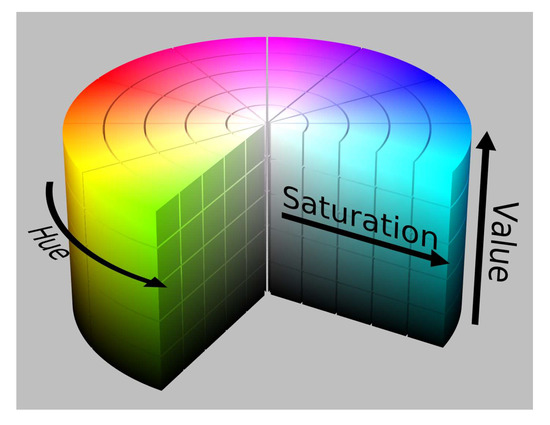
Figure 4.
HSV color model.
The synthesized algorithm (Algorithm 1) is based on using I recognition training data to form an array A describing the distribution of the HSV values on the training data. The first part of the algorithm is to form an array A. The set of all possible combinations of HSV values is grouped into blocks. In the course of the enumeration of the image pixels in height and width, the values are determined H, S and V for each of the pixels. Next, the value of the cell i, j, k of the array A corresponding to the block containing the value of H, S and V for the given pixel is incremented. The condition that allows the exclusion of the pixels that have values corresponding to the background on the image used as training data is as follows:
Thus, pixels with values and , corresponding to the background of the training image, are not taken into account. In the second part of the algorithm, the pixels of the image are enumerated D, on which it is required to determine the fluid boundary. If the value of H, S and V pixel corresponds to an i, j, k array cell A that has a sufficient repeat value r, then the counter c whose value corresponds to showing the number of matching pixels in the horizontal line is incremented. If the value of the counter reaches the value p, then this horizontal line is the fluid boundary.
| Algorithm 1 Liquid Level Detection Using Training Dataset |
| Input: I, D, N, r, p, HB, SB, VB , …, HeightI do , …, WidthI do then 8: end if 9: end for 10: end for WidthD and Finish = false do HeightD and Finish = false do then then , Finish = true 21: end if 22: end if 24: end while 26: end while |
The number of pixels p in the recognizable image D corresponding to the upper border of the blood in the tube must be selected based on the number of horizontal pixels corresponding to the width of the tube in the image. Let us perform a software implementation of the developed algorithm for determining the liquid level.
3.2. Simulation Results
The synthesized algorithm is implemented in the Python programming language. The determination of the HSV values for the image pixels and rendering was performed using the OpenCV library. In addition to determining the blood level, the software module implements the acquisition of a binary image, the selection of a contour, and the marking of a recognized object. The investigation was carried out for two scenarios. As part of the first scenario, images of test tubes with blood were used for training and recognition. In the second scenario, training and recognition were performed on the data received from the webcam. At the same time, the test tube contained a liquid simulating blood.
3.2.1. First Scenario
In the first scenario, an image with fragments of images of real blood in test tubes was used as the training data (Figure 5). The fragments were placed on a black background. In this case, .
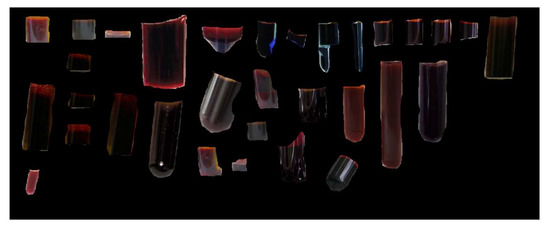
Figure 5.
Training data for the first scenario.
The following initial data were used for blood recognition: N = 32, r = 40, p = 35. The recognition results are shown in Figure 6a–d. Figure 6a shows the result of highlighting the boundary between the blood and another medium; Figure 6b shows the recognition as a binary image, where blood is highlighted in white; Figure 6c demonstrates the possibility of recognition by highlighting the blood contour, and Figure 6d by marking the found volume of blood by a dot. As can be seen from Figure 6, the algorithm made it possible to identify both the level of blood in the tube and its contour.
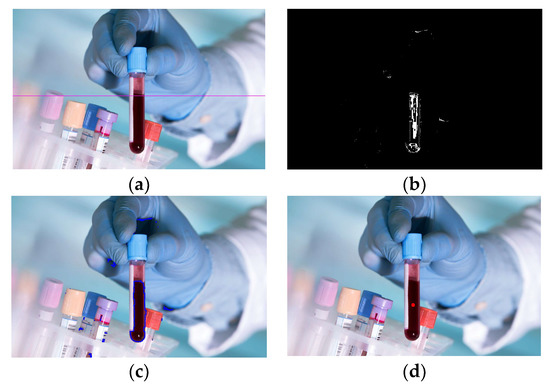
Figure 6.
Recognition results: (a) Selection of the upper border of the blood by a line; (b) Binary image of blood; (c) Bleeding by the circuit; (d) Marking the blood volume with a dot.
3.2.2. Second Scenario
A webcam with a resolution of 1920 × 1080 pixels was used to obtain the fragments used as training data (Figure 7), as well as the images for recognition.
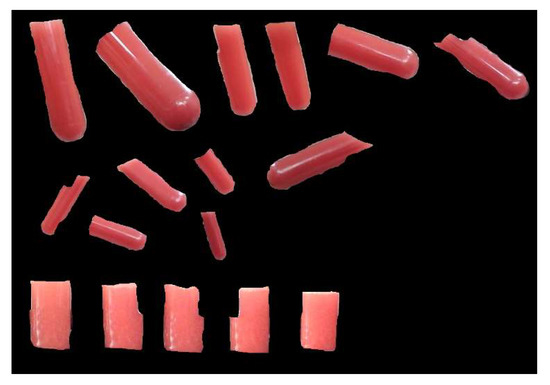
Figure 7.
Training data for the second scenario.
A test tube with a liquid simulating blood is located at a distance of approximately 185 mm from the webcam during recognition, the test tube diameter is 15 mm. In this case, the width of the test tube in the image received from the webcam is 119 pixels. The following initial data were used for blood recognition: N = 32, r = 500, p = 35. The recognition results are shown in Figure 8.
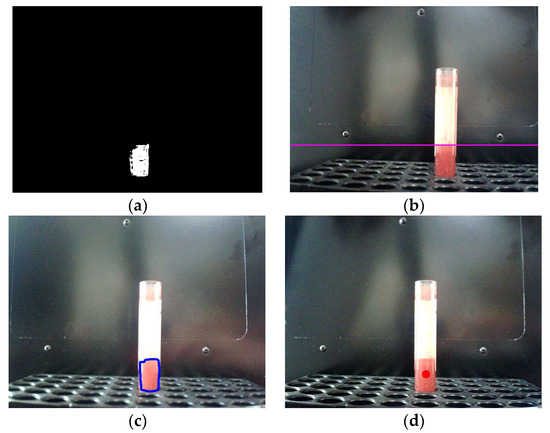
Figure 8.
Results of the recognition of a sample of tinted water: (a) Binary image of the sample; (b) Highlighting the upper border of the sample with a line; (c) Highlighting the sample with a contour; (d) Marking the volume of tinted water with a dot.
As can be seen from the figure, in this case, the algorithm similarly made it possible to identify both the liquid level in the test tube and its contour, despite the presence of glare in the image. A quantitative analysis of the quality of recognition was carried out for six real images of tubes with blood (Figure 9). Figure 10a shows the ratio of the recognized blood area versus the repeatability value r for six images. Figure 10b shows the ratio of the number of erroneously recognized pixels (pixels of other objects) to the total number of recognized pixels, depending on the repeatability value. As can be seen from the figures, with an increase in the repeatability value, the proportion of erroneously recognized pixels decreases. The proportion of the recognized blood area reaches 87% (at a repeatability value of 60) with 20% of erroneously recognized pixels of other objects for the image of the blood sample shown in Figure 9c).

Figure 9.
Images for recognition: (a–f) real images of blood tubes.
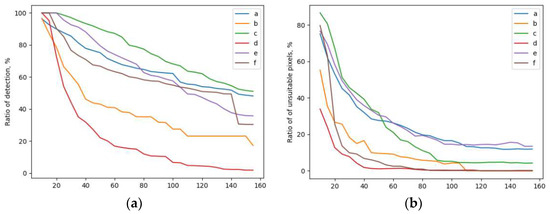
Figure 10.
Recognition results: (a) Dependence of the share of the recognizable area on the repeatability value; (b) The ratio of the number of erroneously recognized pixels to the total number of recognized pixels.
4. Vision Algorithm Using Convolutional Neural Network
As an alternative to the algorithm based on the HSV model, it is proposed to use an algorithm based on the use of the convolutional neural network U-Net.
4.1. Image Segmentation Methods
The basis of the proposed algorithm is segmentation, which is one of the important stages in the processing of medical images. Segmentation is the division of a data set into contiguous regions, the elements of which (for example, pixels) have common features. There are many different approaches and methods for extracting a structure from a set of images, from manual segmentation to fully automated one. The effectiveness of a particular method depends on the properties of the data set, as well as on the complexity and features of the structure that needs to be segmented. The methods can be used independently or in combination to achieve the desired result.
- With manual segmentation, the selection of the area of interest is performed manually. This is a very time-consuming method that is not applicable to automated systems, but is actively used to form the training samples necessary for training a neural network in intelligent segmentation methods.
- The segmentation methods based on pixel intensity are very simple and sometimes give good results, but they do not take spatial information into account, and are also sensitive to noise and homogeneities in intensity. Among the methods of segmentation based on intensity, there are:
- 2.1
- Threshold methods [25] that divide images into two or more parts based on some intensity thresholds. The threshold is a value on the image histogram that divides it into two parts: the first part is all of the pixels that have an intensity value, for example, greater than or equal to the threshold, and the second part is all other pixels:where is the intensity value at the point (x, y), T is the threshold value.Multiple thresholds are used to select multiple objects.
- 2.2
- Region-spreading methods [26] are interactive methods that require setting some starting points to then divide the image into regions, according to a predetermined law based on intensity. The disadvantage of such methods is the need to determine the starting points and the dependence of the result of the algorithm on the human factor.
- It is convenient to show clustering methods using the most widely used k-means method as an example. K-means iteratively recalculates the average intensity for each class and segments the image, assigning each pixel to the class with the closest average value.Although the clustering methods do not require labeled data, their results depend on the setting of the input parameters. These methods are good in that they are able to generalize to different data sets and usually do not require much time for calculations, but they are sensitive to noise and therefore do not always give the desired result [27].
- Neural network methods are currently successfully used to solve many problems related to image processing. Such methods are resistant to noise and take into account spatial information. In most cases, convolutional neural networks (CNN) are used to solve segmentation problems.
In a normal neural network, each neuron is connected to all the neurons of the previous layer, and each connection has its own weight coefficient. In a convolutional neural network, convolution operations use a small weight matrix, which is “moved” over the entire layer being processed (at the network input, directly over the input image). The convolution layer sums up the results of the element-wise product of each image fragment by a matrix (the convolution kernel). The weight coefficients of the convolution kernel are not known in advance and are set in the learning process [21]. A feature of convolutional layers is the separation of parameters, which means that each filter corresponds to one set of weights, which allows using one filter to detect a certain feature in different parts of the image [26].
4.2. Description U-Net
U-Net (Figure 11) is considered one of the standard CNN architectures for image segmentation tasks.
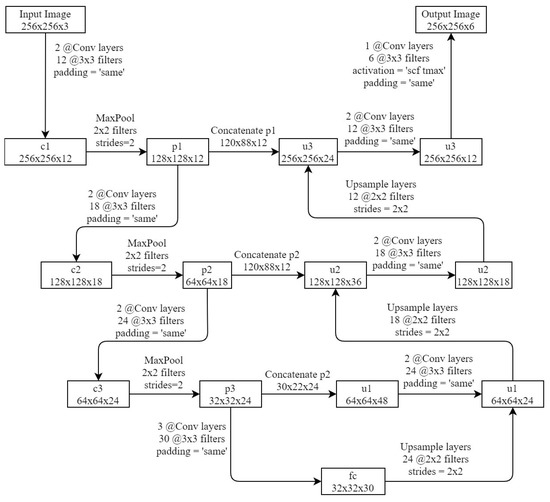
Figure 11.
U-Net network architecture.
It consists of a narrowing (left) and widening (right) paths. A narrowing path is a typical convolutional neural network architecture. It is a multiple application of two (2@) 3 × 3 convolutions, followed by a maximum union (2 × 2 power of 2) operation to down sample. The expanding path restores the information about the exact location of the object (fine localization), gradually increasing the detail [21]. Layer Max Polling reduces the image size by a factor of two on each axis by combining neighboring pixels in 2 × 2 areas into one pixel. As the value of the resulting pixel, the average value of the combined pixels or their maximum can be used. The input image transforms after passing several series of convolutions and Max Polling layers from a specific high resolution pixel grid to more abstract feature maps.
Further, in the decoding part of the network, a series of layers are used, similar to the layers of the coding part, only instead of the Max Polling layer that reduces the size of the image, the layer Upsample is applied, which increases the size of the image by two times on both axes. In addition, the feature maps from the encoding part are concatenated in the decoding part. At the last level, the 1 × 1 convolution is used to generate the output segmented image.
U-Net is characterized by achieving high results in various real-world problems (including biomedical applications), even when using a relatively small amount of data.
4.3. Formation of the Training Sample
The neural network was trained on the basis of several samples (training, test, control), each of which contained the original image supplied to the network input and the correct answer that should be generated by the network (a labeled image of the same size, on which all the desired objects are painted in different colors).
In the problem under consideration, objects of four classes are of greatest interest (Figure 12):
- Serum: the upper fraction of the contents of the test tube. It is important to define the top and bottom boundaries of the object.
- Fibrin threads: first, the fact of their presence in the image is important, which makes it possible to correctly determine the required distance from the end-effector of the pipette to the lower boundary of the upper fraction.
- Clot: the lower fraction of the contents of the test tube.
- Upper empty (air-filled) part of the tube.
The identification of objects of the last two classes will help to correctly determine the scale of the image.

Figure 12.
Examples of labeling images from the training sample.
At least several hundred images are needed to train a neural network. Each of them must satisfy a number of requirements (the presence of the desired object, a sufficient level of illumination, sharpness, etc.).
Collecting and preparing such a volume of data takes a long time. You can significantly save it (and increase the size of the training sample) using the artificial generation of training data. Each of the initial (original) examples can serve as the basis for obtaining, with the help of various distortions (augmentations), several secondary examples used for learning. In the course of the work, geometric (rotation, scaling, image cropping), brightness/color distortions, background replacement, noise and blur were used.
4.4. Neural Network Training and Results
The network was trained using the stochastic gradient descent method based on the input images from the training set and their corresponding segmentation maps. The initial training set consisted of 2520 images.
As a result of network training for 60 epochs, an accuracy of 88% was achieved on the control sample. The analysis of the segmented images showed that the network successfully recognizes all objects in the images; however, working with images containing fibrin strands causes the greatest difficulties for it. Most of the segmentation faults are associated with this object.
In addition to the objective difficulties in the visual recognition of the boundary between serum and fibrin threads, which are also characteristic of humans, this is obviously due to the insufficient number of images of the training set containing this object. After it was supplemented with appropriate images (original and augmented), the size of the training set was increased to 3600 images. The neural network was retrained on the new sample for another 150 epochs.
As a result, the quality of the segmentation was significantly improved; the accuracy on the control (validation) sample was 98%. Graphs of the accuracy and error share during the second stage of network training are shown in Figure 13.
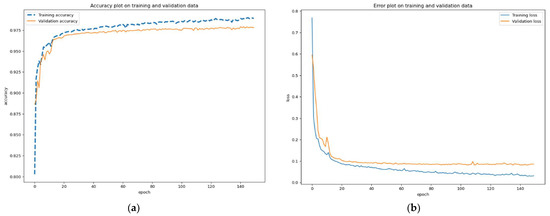
Figure 13.
Graphs of the second stage of network training: (a) accuracy plot on training and validation data, (b) error plot on training and validation data.
4.5. Algorithm for Determining the Boundary Level between Blood Phases
The main purpose of the image segmentation is to determine the boundary levels. The upper level is between the air and serum and the lower is between the serum and blood clot (or between serum and fibrin strands).
The calculation of these levels and the corresponding pipette immersion depth using the prepared segmentation map is performed in accordance with the following algorithm:
 Figure 14. Determining the boundary level between blood phases and the depth of pipette immersion.
- The height c of the visible part of the tube is calculated (in pixels).
- Including height information h tripod in mm determines the scale of the image (the ratio between the dimensions of objects in pixels and their linear dimensions in mm is established) m = h/c.
- The lowest point A of the empty part of the tube and the vertical distance a from it to point D (in pixels) are determined.
- The initial immersion depth of the pipette l1 = l − h + m + e1 is calculated, where l is the length of the test tube, e1 is the margin on the upper limit.
- Depending on the presence of fibrin threads on the image, the value of e2 of the reserve is set along the lower border.
- The highest point B of the clot or fibrin strands and the vertical distance are determined b from it to point D (in pixels).
- The final immersion depth of the pipette is calculated asl2 = l − h + b · m − e2.
- The number of aliquots is determined n = [(l2 − l1)S/V0], where is the area of the inner section of the test tube, V0 is the volume of the aliquot, square brackets mean taking the integer part of the number (rounding down to the nearest integer).
If n < 1, automated aliquoting is not allowed and the algorithm terminates.
The final immersion depth of the pipette l2 = l1 + n · V0/S is adjusted to improve the safety of manipulation.
5. Comparative Analysis of Algorithms
The net convolutional neural network, trained on manually labeled images of a tube with a centrifuged sample of venous blood, provides a high accuracy of image segmentation of the order of 97–98%. This takes into account the nature of the fractional interface, which ensures that the maximum number of aliquots is obtained while maintaining a high quality of the diagnostic investigation. The results of the recognition using the algorithm based on the U-Net neural network are shown in Figure 15.
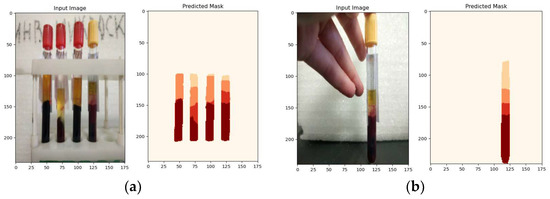
Figure 15.
The result of the neural network algorithm: (a) experiment 1: original image and recognition result; (b) experiment 2: original image and recognition result.
The algorithm for determining the level and contour of blood in images based on the HSV color model and its software implementation also showed good results when tested with pre-selected pixel repeatability level parameters. The same images were processed as with the U-Net neural network using the algorithm based on the HSV color model. For clarity, the operation of isolating blood serum with a blue outline and highlighting on a binary image was also performed. The results of the algorithm are shown in Figure 16. The original image (Figure 16a) was divided into four separate images, so that each image had only one tube with a biosample (Figure 16c) to recognize the boundary between blood fractions.
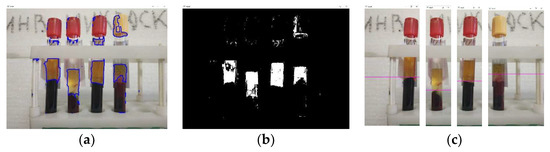
Figure 16.
The result of the algorithm based on the HSV color model (experiment 1): (a) selection of the blood serum contour; (b) binary image of the recognized blood serum; (c) recognition of the border between blood fractions.
Based on the conducted studies of the operation of the algorithm based on the HSV color model, it can be concluded that this algorithm can recognize the border between blood fractions only under certain parameters of the repeatability of an array block with the required pixels, and the parameters of horizontal repeating pixels that need to be adjusted to certain operating conditions. At the same time, optimally selected parameters may not exclude the recognition of foreign objects that have a similar color (Figure 16a,b and Figure 17a,b). In addition, the algorithm based on the HSV color model does not take into account the possible presence of fibrin strands, which also affects the accuracy of the interface recognition and, consequently, the quality of the aliquoting process.
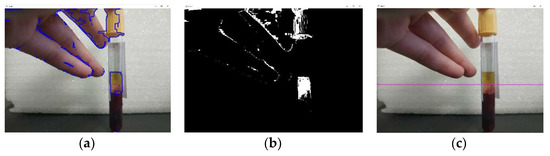
Figure 17.
The result of the algorithm based on the HSV color model (experiment 2): (a) selection of the blood serum contour; (b) binary image of the recognized blood serum; (c) recognition of the border between blood fractions.
The accuracy of the algorithm based on the HSV color model is estimated by the following ratio:
where is the number of correctly recognized suitable pixels, is the number of correctly recognized false pixels, is the total number of suitable pixels, N is the total number of false pixels.
The accuracy of the algorithm based on a neural network is estimated in a similar way. When assessing the accuracy of the HSV algorithm, there are a number of false regions (highlighted by a red rectangle in Figure 18a); therefore, when calculating according to formula (3), the segmentation accuracy index for blood serum is about 80%, and for the red blood fraction (erythrocytes), it is about 91%. The neural network method also has false areas. Figure 18b shows the raw image fed into the neural network and Figure 18c, highlighted in red, is the area that was erroneously identified by the neural network as blood serum. The calculation by formula (3) showed that the segmentation accuracy using the algorithm based on the U-Net neural network was 98%.
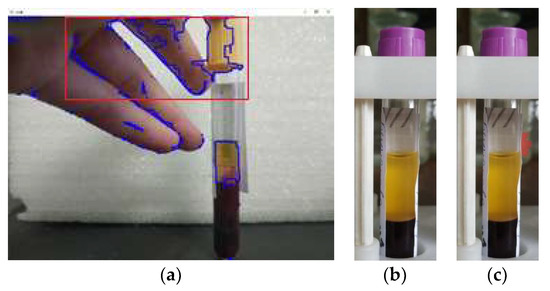
Figure 18.
Examples of highlighting false areas in images: (a) processed image using the HSV model; (b) original image fed into the U-Net neural network; (c) false areas selected by the U-Net neural network.
In the course of comparing the two algorithms, it can be concluded that the algorithm based on the U-Net neural network has an advantage in terms of the ability to recognize the interface between fractions, regardless of the operating conditions, due to the adaptive structure that takes into account the nature of the interface between fractions. The improvement in the recognition accuracy using a neural network algorithm compared to an algorithm based on the HSV color model is 18%.
6. Experimental Results and Analysis
An experimental sample for aliquoting was developed based on a parallel structure delta robot with a dummy dispensing head. Tubes with biosamples that have been centrifuged and divided into two fractions are placed in a special rack located on a rotating table in the working chamber of the delta robot (Figure 19a). The end-effector with a dosing head moves to the test tube and collects the blood serum, while descending to a depth calculated using the algorithm for determining the level of the interface between fractions. Next, the end-effector of the delta robot moves to a rack with empty test tubes and places the collected blood serum samples into them (Figure 19b). The complex includes an information system (database) that records the result of the aliquoting process and makes it possible to evaluate its success. The results of the experiments on taking biosamples from each tube are displayed in the last column of the upper table in the interface of the information system (Figure 20).
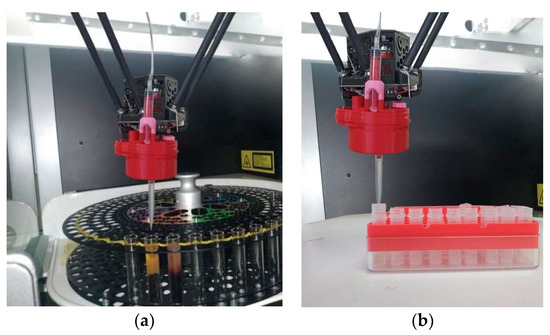
Figure 19.
Experimental sample based on the delta robot: (a) collecting biomaterial, (b) aliquoting.
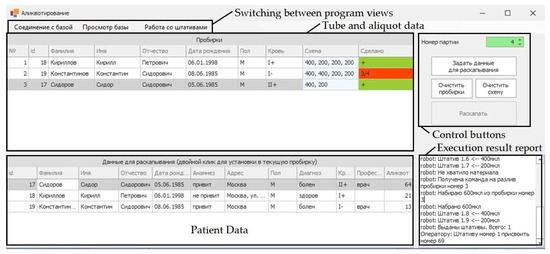
Figure 20.
Information system for evaluating the result of the aliquoting process (with explanations in English for each of the blocks, patient data for the image is not real).
The operations that could not be performed (could not be completed) due to errors that have occurred are highlighted in red. Figure 20 shows an example in which only three of the four required aliquots could be taken. Errors in the aliquoting process can occur due to a clot of blood cells entering the blood serum (Figure 21a), or due to glare on the surface (Figure 21b), which can occur when an unexpected change in the illumination occurs.
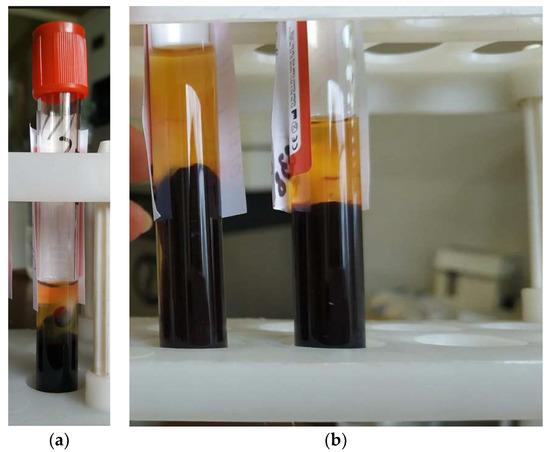
Figure 21.
Examples of test tubes with biosamples, the aliquoting of which causes errors: (a) a clot of blood cells entering the blood serum; (b) reflections on the surface of the tubes.
7. Conclusions
As part of the investigation, two algorithms were developed and compared to determine the boundary level between blood phases in a test tube. The first algorithm, based on the HSV model, requires multiple images to train. The second algorithm, based on the U-Net convolutional neural network, requires a test tube with a centrifuged venous blood sample trained on a large number of manually labeled images. The neural network provides high accuracy in image segmentation, and the developed algorithm based on it calculates the depth to which it is necessary to immerse the pipette to take serum aliquots. This takes into account the nature of the fractional interface, which ensures that the maximum number of aliquots is obtained, while maintaining the high quality of the diagnostic investigation. The algorithm based on the HSV model is inferior in accuracy to the U-Net convolutional network; however, in the absence of foreign objects of the same color, it can provide an acceptable recognition accuracy for blood, which is 91%, and has a low labor intensity of preliminary training.
Author Contributions
Conceptualization, L.R., A.N. and T.S.; methodology, S.K. and D.M.; software, S.K., V.N. and D.M.; validation, A.N.; investigation, S.K., V.N. and D.M.; resources, L.R., A.N. and T.S.; writing—original draft preparation, S.K., V.N. and D.G.; writing—review and editing, L.R., D.M., A.N. and T.S.; supervision, L.R. and T.S.; project administration, L.R.; funding acquisition, L.R. All authors have read and agreed to the published version of the manuscript.
Funding
This work was supported by the state assignment of Ministry of Science and Higher Education of the Russian Federation under Grant FZWN-2020-0017.
Institutional Review Board Statement
The investigation was conducted as part of the work approved by the local ethics committee (Protocol No. 31 of 25 November 2022). At the same time, the biomaterial used in the work was a “residual material” previously used for laboratory diagnostics from donor patients who gave voluntary informed consent in a medical and preventive organization. For the current investigation, only anonymous blood samples were used (there were no personal data such as full name, residential address, passport details, etc.). Identification of the persons from whom the biosamples were obtained is impossible, therefore their use cannot cause harm to the subjects of the investigation, including a violation of confidentiality. This ensures that the organization and conduct of the investigation comply with the provisions of the Guide for research ethics committee members, Council of Europe, 2010.
Conflicts of Interest
The authors declare no conflict of interest.
References
- Malm, J.; Fehniger, T.E.; Danmyr, P.; Végvári, A.; Welinder, C.; Lindberg, H.; Appelqvist, R.; Sjödin, K.; Wieslander, E.; Laurell, T.; et al. Developments in biobanking workflow standardization providing sample integrity and stability. J. Pro-Teomics 2013, 95, 38–45. [Google Scholar] [CrossRef] [PubMed]
- Plebani, M.; Carraro, P. Mistakes in a stat laboratory: Types and frequency. Clin. Chem. 1997, 43, 1348–1351. [Google Scholar] [CrossRef] [PubMed]
- Plebani, M. Laboratory errors: How to improve pre- and post- analytical phases? Biochem. Med. 2007, 17, 5–9. [Google Scholar] [CrossRef]
- Ross, J.; Boone, D. Assessing the effect of mistakes in the total testing process on the quality of patient care. In 1989 Institute of Critical Issues in Health Laboratory Practice; Martin, L., Wagner, W., Essien, J.D.K., Eds.; DuPont Press: Minneapolis, MN, USA, 1991. [Google Scholar]
- Sivakova, O.V.; Pokrovskaya, M.S.; Efimova, I.A.; Meshkov, A.N.; Metelskaya, V.A.; Drapkina, O.M. Quality control of serum and plasma samples for scientific research. Profil. Med. 2019, 22, 91–97. [Google Scholar] [CrossRef]
- Malm, J.; Végvári, A.; Rezeli, M.; Upton, P.; Danmyr, P.; Nilsson, R.; Steinfelder, E.; Marko-Varga, G.J. Large scale biobanking of blood—The importance of high density sample processing procedures. J. Proteom. 2012, 76, 116–124. [Google Scholar] [CrossRef] [PubMed]
- Zhang, C.; Huang, Y.; Fang, Y.; Liao, P.; Wu, Y.; Chen, H.; Chen, Z.; Deng, Y.; Li, S.; Liu, H.; et al. The Liquid Level Detection System Based on Pressure Sensor. J. Nanosci. Nanotechnol. 2019, 19, 2049–2053. [Google Scholar] [CrossRef]
- Fleischer, H.; Baumann, D.; Joshi, S.; Chu, X.; Roddelkopf, T.; Klos, M.; Thurow, K. Analytical Measurements and Efficient Process Generation Using a Dual–Arm Robot Equipped with Electronic Pipettes. Energies 2018, 11, 2567. [Google Scholar] [CrossRef]
- Fleischer, H.; Drews, R.R.; Janson, J.; Chinna Patlolla, B.R.; Chu, X.; Klos, M.; Thurow, K. Application of a Dual-Arm Robot in Complex Sample Preparation and Measurement Processes. J. Assoc. Lab. Autom. 2016, 21, 671–681. [Google Scholar] [CrossRef]
- Preda, N.; Ferraguti, F.; De Rossi, G.; Secchi, C.; Muradore, R.; Fiorini, P.; Bonfé, M. A Cognitive Robot Control Architecture for Autonomous Execution of Surgical Tasks. J. Med. Robot. Res. 2016, 01, 1650008. [Google Scholar] [CrossRef]
- Sánchez-Brizuela, G.; Santos-Criado, F.-J.; Sanz-Gobernado, D.; Fuente-Lopez, E.; Fraile, J.-C.; Pérez-Turiel, J.; Cisnal, A. Gauze Detection and Segmentation in Minimally Invasive Surgery Video Using Convolutional Neural Networks. Sensors 2022, 22, 5180. [Google Scholar] [CrossRef]
- Eppel, S.; Xu, H.; Wang, Y.; Aspuru-Guzik, A. Predicting 3D shapes, masks, and properties of materials, liquids, and objects inside transparent containers, using the TransProteus CGI dataset. arXiv 2021, arXiv:2109.07577. [Google Scholar] [CrossRef]
- Eppel, S. Computer vision for liquid samples in hospitals and medical labs using hierarchical image segmentation and relations prediction. arXiv 2021, arXiv:2105.01456. [Google Scholar] [CrossRef]
- Suzuki, S.; Keiichi, A. Topological structural analysis of digitized binary images by border following. Comput. Vis. Graph. Image Process. 1985, 30, 32–46. [Google Scholar] [CrossRef]
- Prabhu, C.A.; Chandrasekar, A. An Automatic Threshold Segmentation and Mining Optimum Credential Features by Using HSV Model. 3D Res. 2019, 10, 18. [Google Scholar] [CrossRef]
- Kolkur, S.; Kalbande, D.; Shimpi, P.; Bapat, C.; Jatakia, J. Human Skin Detection Using RGB, HSV and YCbCr Color Models. In Proceedings of the International Conference on Communication and Signal Processing, ICCASP, Shanghai, China, 20–25 March 2016. [Google Scholar]
- Novozamsky, A.; Flusser, J.; Tacheci, I.; Sulik, L.; Krejcar, O. Automatic blood detection in capsule endoscopy video. J. Biomed. Opt. 2016, 21, 126007. [Google Scholar] [CrossRef]
- Joy, D.T.; Kaur, G.; Chugh, A.; Bajaj, S.B. Computer Vision for Color Detection. Int. J. Innov. Res. Comput. Sci. Technol. 2021, 9, 53–59. [Google Scholar] [CrossRef]
- Noreen, U.; Jamil, M.; Ahmad, N. Hand Detection Using HSV Model. Int. J. Sci. Technol. Res. 2016, 5, 195–197. [Google Scholar]
- Cai, Z.; Luo, W.; Ren, Z.; Huang, H. Color Recognition of Video Object Based on HSV Model. Appl. Mech. Mater. 2011, 143–144, 721–725. [Google Scholar] [CrossRef]
- Ronneberger, O.; Fischer, P.; Brox, T. U-Net: Convolutional Networks for Biomedical Image Segmentation. In Proceedings of the Medical Image Computing and Computer-Assisted Intervention–MICCAI 2015: 18th International Conference, Munich, Germany, 5–9 October 2015. [Google Scholar]
- Malyshev, D.; Rybak, L.; Carbone, G.; Semenenko, T.; Nozdracheva, A. Optimal design of a parallel manipulator for aliquoting of biomaterials considering workspace and singularity zones. Appl. Sci. 2022, 12, 2070. [Google Scholar] [CrossRef]
- Voloshkin, A.; Rybak, L.; Cherkasov, V.; Carbone, G. Design of gripping devices based on a globoid transmission for a robotic biomaterial aliquoting system. Robotica 2022, 40, 4570–4585. [Google Scholar] [CrossRef]
- Voloshkin, A.; Rybak, L.; Carbone, G.; Cherkasov, V. Novel Gripper Design for Transporting of Biosample Tubes. In ROMANSY 24-Robot Design, Dynamics and Control: Proceedings of the 24th CISM IFToMM Symposium, Udine, Italy, 4–7 July 2022; Springer International Publishing: Cham, Switzerland, 2022; pp. 255–262. [Google Scholar]
- Niu, Z.; Li, H. Research and analysis of threshold segmentation algorithms in image processing. J. Phys. Conf. Ser. 2019, 1237, 022122. [Google Scholar] [CrossRef]
- Angelina, S.; Suresh, L.; Veni, S. Image segmentation based on genetic algorithm for region growth and region merging. In Proceedings of the 2012 International Conference on Computing, Electronics and Electrical Technologies, Nagercoil, India, 21–22 March 2012; IEEE: Piscataway, NJ, USA, 2012; pp. 970–974. [Google Scholar]
- Sarmah, S. A grid-density based technique for finding clusters in satellite image. Pattern. Recognit. Lett. 2012, 33, 589–604. [Google Scholar] [CrossRef]
Disclaimer/Publisher’s Note: The statements, opinions and data contained in all publications are solely those of the individual author(s) and contributor(s) and not of MDPI and/or the editor(s). MDPI and/or the editor(s) disclaim responsibility for any injury to people or property resulting from any ideas, methods, instructions or products referred to in the content. |
© 2023 by the authors. Licensee MDPI, Basel, Switzerland. This article is an open access article distributed under the terms and conditions of the Creative Commons Attribution (CC BY) license (https://creativecommons.org/licenses/by/4.0/).