Abstract
Modern direct-driven and high-speed rotary tables with torque motor are optimally suited for all handling and assembly applications that require the shortest indexing times and flexible positioning. The following paper is devoted to the study, the design, and the optimization of an innovative table clamping system (brake for accurate positioning) actuated by pneumatic energy, working at a maximum clamping pressure of 6 bar. The challenge for the aforementioned application is related to developing a solution able to provide a maximum tangential torque (with clamping actuated) in the range of thousands of Nm without leveraging the use of high-pressure hydraulic energy. The optimization of the proposed solution is based on the precise calculation of the stresses in order to perform a fatigue assessment and on the elastic deformation of the clamps in order to set the correct tolerances between the mating parts. Eventually, an experimental campaign is carried out in order to tune the numerical model, which is then used to validate the proposed design solution.
1. Introduction
Machining operations are among the most widespread industrial manufacturing processes due to their extreme flexibility and achievable quality [1]. This wide spread makes the reduction of impacts of these processes a crucial research goal in order to enhance the sustainability of future industries [2,3]. Numerous studies pointed out the role of energy consumption on the overall environmental impact of these processes [4]. Accordingly, finding new design solutions able to increase energy efficiency at the machine level is a primary research aim [5,6].
Rotary Transfer Machines (RTM) are advanced reconfigurable systems consisting of numerous stations where multiple parts are machined simultaneously. Once the operations on all the stations are completed, the RTM rotates one angular step so as to transfer each working part to the next station [7]. Since RTMs are intended to achieve maximum production efficiency [8], the rotary table undergoes high values of angular acceleration used to rotate the table. These systems are of great interest in the modern industry due to their high flexibility and efficiency [9].
Previous studies highlighted how the adoption of proper design strategies can radically improve the environmental sustainability of these machines. Particularly, the design of RTMs should aim at replacing hydraulic systems, which are responsible for high energy consumption [10]. It is also worth mentioning that hydraulic systems are characterized by elevated production and maintenance costs. Moreover, the high working pressure of these systems determines a safety risk for operators. For these reasons, replacing hydraulic systems with alternative solutions can lead to significant environmental, economic and social benefits.
During machining operations, a clamping system is used to restrain the RTM disk against rotation. The role of this system is to prevent angular movements of the rotary table under the application of machining forces to workpieces. This role makes the clamping system a fundamental element of the RTM since it contributes to ensure the proper positioning of the part by suitably restraining it [11].This is a crucial aspect since it directly affects the accuracy of the machining process [12,13,14]. For this reason, the clamping system must guarantee high values of clamping torque so as to block the stations in the right position.
In the traditional design of RTMs, clamping systems are actuated by means of hydraulic power [10]. The present study investigates the feasibility to adopt a pneumatic solution for the clamping system of a large-scale RTM in order to reduce its environmental, economic and social impacts [4]. As mentioned above, hydraulic systems are characterized by higher working pressure than pneumatic ones. This means that, when moving from a hydraulic to a pneumatic clamping system, less input energy is available. A considerable design effort is thus necessary in order to guarantee sufficient clamping torque on the rotary table.
Previous studies investigated the design of pneumatic clamping systems for fixtures [15,16,17]. These systems are intended to anchor the workpiece to the turret during working [18,19,20]. A Finite Element Analysis (FEA) of a clamping system for turning has been carried out by Chavan et al. [21]. Nascimento et al. investigated the fatigue life of a pneumatic brake actuator [22].
To date, clamping systems for RTM have not been yet formally investigated and no standards are available for their design. These systems profoundly differ from those used for fixtures due to the different dimension, shape, degrees of freedom and forces of the rotary table. Thus, ad hoc design procedures must be defined. The present study proposes a systematic approach which starts with the definition of working pressure. This pressure has been imposed complying with the hypothesis of adopting a pneumatic system on the basis of sustainability motivations exposed above.
The clamping system is characterized by several geometrical parameters which could potentially affect its effectiveness. This study focuses on the design of the piston identifying the dimensions which are supposed to mostly affect its mechanical behaviour. Sensitivity analyses are then performed to quantify the influence of these parameters on the clamping torque and internal stresses. A sequential decision-making process is used to determine the main design parameters. As a result, two pseudo-optimal solutions are proposed. A fatigue verification of these solutions is presented. An experimental campaign is then carried out to assess the accuracy of the finite element model used in the preliminary design phase and tune on the basis of experimental data. Eventually, the refined model is used to verify the validity of the proposed design solution.
2. Materials and Methods
2.1. Architecture of the Clamping System
Figure 1 provides a schematic representation of the clamping system. Three main elements can be observed, namely the piston, the rotating disk and the base plate.
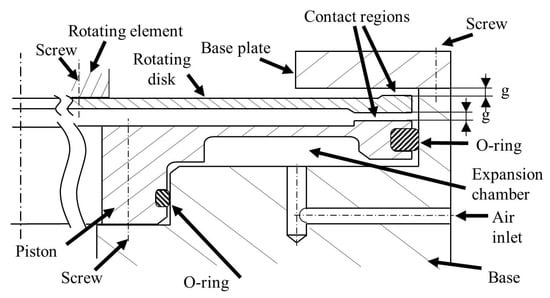
Figure 1.
Schematic representation of the clamping system.
Figure 2 shows a detailed sketch of the piston highlighting the most relevant dimensions, namely the average contact diameter , the width of the expansion chamber 2a, the membrane thickness t and the two fillet radii and . For the scope of this study, the geometrical parameters shown in Figure 1 and Figure 2 have been varied in the ranges summarized in Table 1. Table 1 also reports the initial values of these parameters used for preliminary investigations.
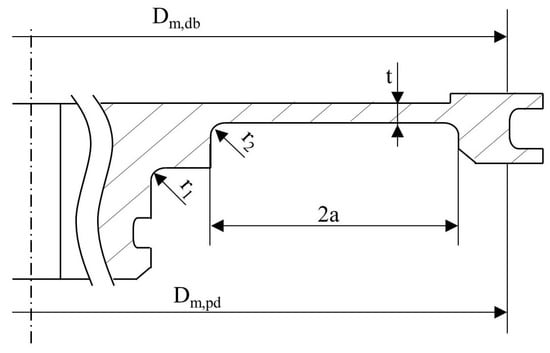
Figure 2.
Schematic representation of the most relevant dimensions of the piston.

Table 1.
Investigated ranges of geometrical parameters (dimensions in mm).
To actuate the clamping, the pressurized air is pumped into the expansion chamber through an inlet. Two O-rings are used to prevent fluid leakage. As can be observed in Figure 1, the piston is fixed to the basement by the screws shown in Figure 2. These screws prevent piston scrolling. Clamping is achieved through piston deformation: Air pressure leads to the elastic deformation of the piston, which bends until it touches the peripheral region of the rotating disk. The force applied by the piston’s upper surface determines a deflection of the disk, which goes in contact with the fixed plate. It is worth remarking that clamping takes place when the rotating disk is stationary, i.e., there is no relative angular sliding contact between the parts. The friction generated between the piston and the disk and between the disk and the base plate determines a clamping torque , which can be estimated as in Equation (1)
where:
- is the coefficient of static friction, assumed equal to 0.15 in the case of steel-on-steel non-lubricated contact [23];
- is the force applied by the piston on the disk;
- is the force applied by the disk on the base plate;
- is the average diameter of the contact region between the piston and the disk, equal to 1130 mm.
- is the average diameter of the contact region between the disk and the base plate, as shown in Figure 1, equal to 1134.5 mm.
All the elements of the system are made of 40CrMnMoS86 steel that is quenched and tempered at 600 °C. In order to limit wearing phenomena, the base plate matching the disk surface is made of structural steel S355J2. Surface hardening is used to achieve hardness between 48 and 50 HRC on the contact surface.
2.2. Finite Element Model
A FEA has been carried out using the Ansys simulation suite. The axisymmetric two-dimensional model shown in Figure 3 was used for the scope of this study.
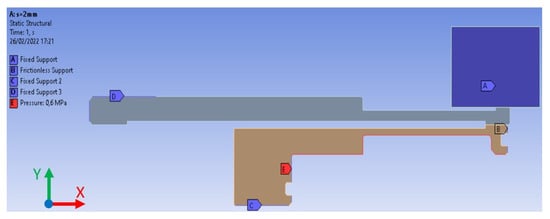
Figure 3.
Axisymmetric finite element model of the clamping system.
As shown in Figure 3, a fixed support is imposed on the bottom surface of the piston, that is the surface joined by bolts. As a preliminary hypothesis, the external gasket ring only allows the piston to slide along the axial direction. Accordingly, a frictionless support is applied to the external surface of the piston. A resistant force directed downward is applied in correspondence with this support to simulate the friction of the O-ring. The magnitude of this force is assessed by assuming that the gasket is pushed against the machine base with a pressure equal to p. is thus calculated as in Equation (2):
where and are, respectively, the external diameter and height of the gasket, whereas is the coefficient of friction between the O-ring and the cylindrical wall. An O-ring with = 1138 mm and = 3.2 mm is investigated. The value of is assumed to be equal to 0.8, which leads to a maximum value kN at p = 6 bar. This value has been considered in all the simulations for the sake of safety.
The disk is constrained near the axis by a fixed support on the top surface, indicated by the letter D in Figure 3. This is consistent with the real assembly since this region of the disk is coupled to the rotating element by means of bolts, as shown in the scheme of Figure 1. Finally, a fixed support is imposed on the plate.
As can be observed in Figure 2, the disk is modeled in contact with the piston and the fixed plate. A frictionless contact is imposed in these regions to represent the gaps of the actual assembly shown in Figure 1. This unilateral contact means that the normal pressure between the two elements is null until the deformation of the elements is less than the initial gap, while varies according to the contact surface elsewhere. Since no friction is considered, the pairing surfaces are free to slide. Different values of the initial gap have been explored in this study, as detailed in the following.
The external load acting on the system consists in a uniform pressure p acting on the expansion chamber of the piston. For the scope of this study, an internal pressure p varying between 4 bar and 6 bar was considered. Specifically, the minimum value was used to verify the minimum clamping torque, while the maximum value was used to calculate the peak stress for fatigue verification. In fact, higher values of pressure determine more stress acting on the piston. On the other hand, the lower the pressure, the lower the deformation of the piston and, as a result, the clamping torque on the disk.
Different meshing strategies have been used on the elements of the assembly. Specifically, the base plate is represented by a single rigid quadrilateral element. A body sizing rule has been applied to the disk and piston to govern the maximum element size, which is set equal to 1 mm.
The mesh of the disk is locally refined nearby the two fillets highlighted in Figure 2 so as to capture the effects of localized stress concentrations. These become significantly relevant since the high clamping cycles determine fatigue stress on the disk. An iterative procedure has been adopted in order to establish the mesh size in these regions. Specifically, the maximum element dimension is halved until convergence on the second decimal digit of the peak stress (expressed in MPa) is observed.
2.3. Design Optimisation
The FEA presented in Section 2.2 has been used to optimize the design of the clamping system. Firstly, a sensitivity analysis has been carried out by varying the gaps (g) between the piston and the disk, and between the disk and the fixed plate have been varied between 0.01 mm and 0.1 mm with steps of 0.01. As a simplification, the values of the two gaps are assumed to be always equal in all the tested configurations. As will be shown in the following, these distances play a crucial role in the performance and cost of the system. On one hand, small gaps are expected to determine a quick response of the system and higher clamping torques. On the other hand, ensuring such small distances requires strict geometrical and dimensional tolerances in the manufacturing and assembly of components, which in turn determines an increase in costs. This is especially true if considering the relevant diameter of the disk.
Then, different geometries of the disk have been explored. Specifically, the study investigated three different values of the membrane thickness t (see Figure 1), namely 2 mm, 3 mm and 4 mm. For each combination of gaps g and thickness t, a simulation is run to determine the clamping torque acting on the disk.
As mentioned in Section 2.1, the piston undergoes cyclic stress due to repeated braking. Therefore, an analysis of the stress concentration on the two fillets depending on their radii is performed. The fatigue limit of the system is thus verified by means of Haigh’s diagram [24]. The stress gradient beneath the surface is also analysed to estimate the coefficient of stress gradient .
Finally, a further modification of the geometry is performed by varying the width of the expansion chamber. The effects of this change on the clamping torque and peak stresses are analysed.
2.4. Experimental Validation
An experimental activity was eventually set up in order to validate the results of the finite element calculation. Specifically, the deformation of the piston under the effect of air pressure has been investigated. In fact, based on the working principle of the clamping system described in Section 2.1, this is the most relevant factor to determine the effectiveness of the clamping system. Future studies will be devoted to validating the response of the other elements.
The axial displacement of the piston is evaluated by means of a dial gauge fixed to the machine base. A schematic representation of the experimental setup is shown in Figure 4a, while Figure 4b shows a picture of the real tests.
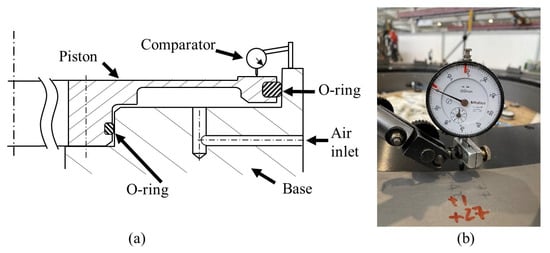
Figure 4.
(a) Scheme of the experimental setup and (b) picture of the real experiment.
As shown in Figure 4, tests have been performed on an incomplete assembly of the final clamping system. The maximum test pressure has been thus limited to 2 bar in order to guarantee the safety of the experiment and prevent damages to other machine components. In more detail, the system has been tested under a pressure of 1 bar, 1.5 bar and 2 bar. Numerical simulations have been run with these values of pressure in order to compare the measured and calculated displacements. The finite element model has been finally refined to match the results of tests and used to verify the design solution obtained as discussed in the previous sections.
3. Results and Discussion
3.1. Effect of Gaps between Fixed and Rotating Elements
Table 2 summarizes the values of force calculated at the two interfaces, namely piston-disk and disk-plate, for different values of the initial gap g.
Table 2.
Forces at the interfaces as a function of the gap (p = 4 bar).
When increasing the gap, the force applied to the piston-disk interface decreases since more energy is spent on the elastic deformation of the piston. As can be highlighted in Table 2, even small variations in the gap determine a sharp drop in the force applied to the disk. This finding is particularly significant since, as introduced in the previous section, the real system may suffer from even small variations in the actual gap between elements due to geometrical, dimensional and assembly uncertainties. Such an issue becomes even more relevant in the case of large disks, where tight dimensional tolerances can be hardly obtained.
As previously described, the role of the piston is to deform the disk and put it in contact with the base plate. The force generated between the disk and the base plate is then responsible for the clamping torque acting on the system. Therefore, the difference between the force applied by the piston on the disk and that applied by the disk on the base plate consists in the force necessary to deform the disk. To better understand the effect of the gap on this dissipation, Figure 5 plots the percentage of the piston-disk force used for braking and deforming the disk. As it can be seen, in the case of a 0.01 mm gap the force applied to the disk by the piston is almost entirely transmitted to the plate, with a loss of around 2.6%. On the other hand, in the case of a 0.1 mm gap, 77% of the force is spent to deform the disk before touching the base plate.
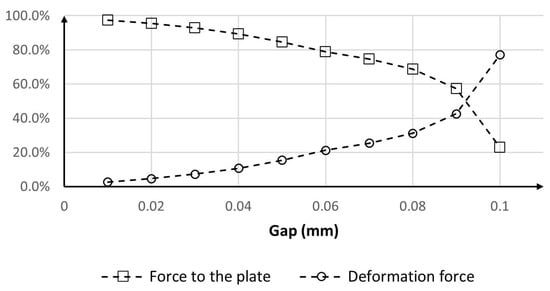
Figure 5.
Percent force spent for braking and for piston deformation.
As mentioned in Section 2.2, the finite element model is used to calculate the maximum stress on the piston considering an internal pressure of 6 bar. Specifically, the equivalent von Mises stress is investigated. Figure 6 plots the peak values of equivalent stress and acting on the first and second fillets, respectively, at p = 6 bar. The maximum equivalent stress on the piston membrane, namely the region of the piston with thickness t (see Figure 2), is also reported. It is possible to notice that the stresses on the two fillets increase linearly with the gap but with different slopes. Particularly, a more severe effect of the gap on the peak stress on fillet 2 can be observed. The maximum stress on the membrane presents a non-linear dependency on the gap. It is possible to observe that this value is always lower than those calculated on the fillets due to the effect of stress concentration.
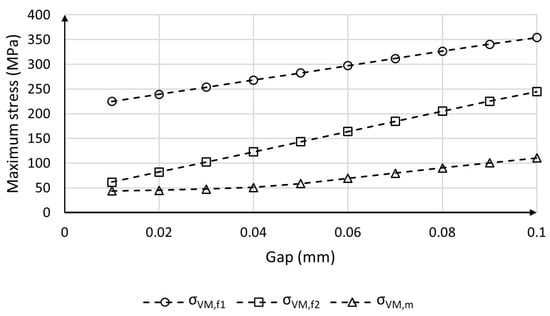
Figure 6.
Maximum stress on fillets and membrane as a function of the gap (@p = 6 bar).
3.2. Effect of Membrane Thickness
The plots in Figure 7 show the variation of peak stress on the two fillets with the gap for different values of thickness t. In the case of the first fillet, increasing the thickness of the disk determines a more severe growth in stresses when the gap increases. Particularly, Figure 7a shows that, for gaps higher than 0.03 mm, thicker disks suffer from more relevant peak stresses. On the contrary, the maximum stress calculated on the second fillet is always lower for higher values of t (see Figure 7b).
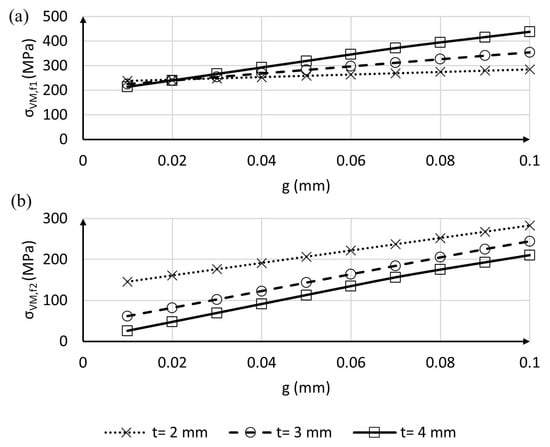
Figure 7.
Peak stresses on (a) fillet 1 and (b) fillet 2 for different thicknesses of the membrane (p = 6 bar).
Table 3 reports the values of clamping torque for all the investigated combinations of thickness and gaps. It is worth mentioning that in the case of t = 4 mm and g ≥ 0.07 mm the force is null, i.e., there is no contact between the disk and the base plate. In other words, the pressure applied by the incoming air is not sufficient to deform the disk enough to put it in contact with the fixed element of the system. This value of thickness has been thus excluded from the following analyses. Further, as mentioned in the previous sections, the manufacturing and assembly of the clamping system are affected by errors which make it hard to achieve tolerances below 0.05 mm. For this reason, the following analyses will be focused on the range from 0.05 mm to 0.1 mm.
Table 3.
Clamping torque (in Nm) for different combinations of gap (g) and membrane thickness (t) (p = 4 bar).
3.3. Effect of Fillet Radius
In the original design, the radii and of the first and second fillets are equal to 0.5 mm and 1 mm, respectively. As well known, the concentration of stresses is strongly affected by the fillet radius, becoming more severe for small values. Therefore, a sensitivity analysis has been carried out by increasing the radius of each fillet separately and monitoring the corresponding variation in peak stress and clamping torque. The geometry with t = 3 mm has been considered. As mentioned in Section 2.2, the peak of equivalent von Mises stress and the clamping torque have been calculated at p = 6 bar and p = 4 bar, respectively, which are the most critical working conditions.
For the scope of this study, the radii have been augmented up to 2 mm with steps of 0.5 mm. Figure 8 shows the corresponding decrease in stresses calculated at g = 0.1 mm. As can be seen, an abrupt drop of the peak stress can be observed moving from 0.5 mm to 1 mm on fillet 1. For higher dimensions, both fillets show a linear reduction of the maximum stress.
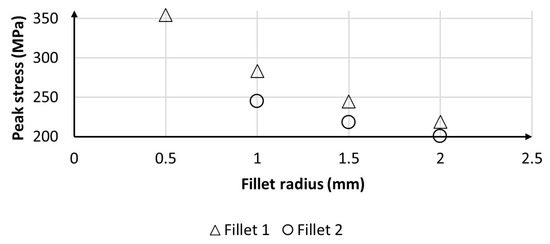
Figure 8.
Peak stresses on the fillets designed with different radii (results at p = 6 bar, t = 3 mm and g = 0.1 mm).
The maximum value of the radius, namely 2 mm, has been considered for the following analysis in order to reduce the concentration of stresses and enhance the fatigue resistance of the part. This modification of the geometry determines also a drop in the clamping torque due to the increased piston stiffness against deflection. Therefore, the values in Table 3 have been recalculated. As demonstrated in the previous sections, the most critical conditions, namely lower clamping torque and higher peak stress, are observed for higher gap values. Therefore, only gaps higher or equal to 0.05 mm are considered in the following for the sake of safety. The values of clamping torque calculated under these assumptions are reported in Table 4. Interestingly, the increase in fillet radii yields to the outcome that the clamping torque drops in the case of t = 3 mm and g = 0.1 mm, i.e., no contact between the disk and the base plate is achieved in this case. Table 4 also reports the maximum stress , namely the highest value among , and .
Table 4.
Clamping torque and thickness for fillet radii of 2 mm.
3.4. Effect of the Expansion Chamber Width
The findings presented in Section 3.3 show that the clamping torque dramatically decreases while increasing the gap between parts. Particularly, no contact is observed in the case of g = 0.1 mm and t = 3 mm. To compensate for this effect, a redesign of the disk is proposed in the case of t = 3 mm by varying the radial size of the expansion chamber 2a represented in Figure 1, which was originally set equal to 43.5 mm. Specifically, the width of the chamber has been varied between 45 mm and 55 mm with a step of 1 mm. The results in terms of clamping torque and maximum stress in the case of g = 0.1 mm are summarized in Table 5.
Table 5.
Clamping torque and maximum stress for different values of 2a (t = 3 mm, g = 0.1 mm).
As can be highlighted in Table 5, the increase in 2a determines a considerable increase in the clamping torque but a moderate increase in the maximum stress. This result was expected since a wider expansion chamber leads to a larger surface on which the air pressure can transmit the force. Furthermore, this design solution increases the portion of the radius where the thickness is equal to the minimum value, thus increasing the displacement of the piston’s upper surface under loads. Results in Table 5 show that in the case of t = 3 mm and 2a = 55 mm the clamping torque becomes approximately equal to that of the case of t = 2 mm and g = 0.1 reported in Table 4 (2964 Nm vs. 2957 Nm). This design solution is thus considered suitable in order to ensure a proper clamping torque also in the case of the largest investigated assembly gap.
3.5. Fatigue Verification of the Design Solutions
Table 6 summarizes the geometrical parameters of the two designs proposed in the previous sections, named Design Solution 1 (DS1) and Design Solution 2 (DS2) in the following. These design are manufacturable and maximise the clamping torque on the disk. The fatigue resistance of these solutions is verified at p = 6 bar and g = 0.1 mm, which have been demonstrated to be the most critical working conditions.
Table 6.
Summary of the geometrical parameters of the optimal design solutions.
During its lifecycle, the piston undergoes cyclic loads between 0 and the maximum value of stress. Therefore, the values of stress amplitude () and medium stress () are both equal to . These values are compared to the fatigue resistance of the material Sn, obtained as in Equation (3):
where is the Ultimate Tensile Stress (UTS) and the coefficients , and account for the effects of load, stress gradient and surface finishing, respectively [24].
For the scope of this study, is set equal to 1 since the equivalent stress is compared to bending stress. is equal to 0.7, which corresponds to the surface quality of a machining operation for = 1000 MPa [24].
As shown in Figure 9, the value of equivalent stress rapidly decreases immediately beneath the surface. Accordingly, it was decided to assume a stress gradient coefficient .
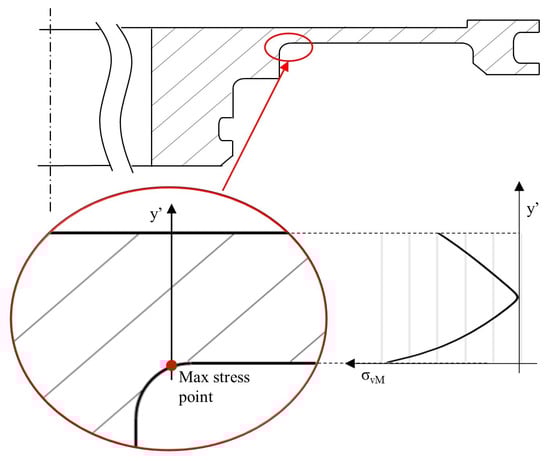
Figure 9.
Schematic representation of stress gradient beneath the maximum stress point.
Considering that the UTS of the 40CrMnMoS86 is equal to 1000 MPa, Equation (3) leads to = 315 MPa. The load varies between 0 and the peak value, so the fatigue limit on the stress amplitude () and medium stress () can be calculated as in Equation (4):
which is equal to 240 MPa.
Due to the complexity of geometry and stress distribution, it is not possible to define a fatigue stress concentration factor according to traditional calculation methods [24]. The corrected stress is thus estimated starting from the results of the static FEA [25,26]. Specifically, the Support Factor method is used [27]. This approach requires the calculation of the equivalent stress distribution in the direction normal to the maximum stress point (i.e., the direction shown in Figure 9). The gradient of the stress function at the maximum stress point, named , is thus expressed by Equation (5):
For the scope of this study, the value of is approximated by the secant to the equivalent stress curve shown in Figure 9 nearby the point of maximum stress. This can be expressed as in Equation (6):
where is the distance to the first element along the normal direction y’, which varies between 0.04 and 0.06 mm in the investigated meshes.
The normalized stress ratio is then calculated as in Equation (5):
The support factor can be thus obtained by means of Equation (8):
where is the characteristic length of the material [28]. According to [23], is supposed to equal to 0.01 mm for steel with = 1000 MPa.
Finally, the effective stress can be calculated as shown in Equation (9):
Table 7 summarises the values of , , and calculated for the two designs at p = 6 bar and g = 0.1 mm, which has been demonstrated to be the most critical working condition.
Table 7.
Measured and calculated values of axial displacement at different pressure levels.
The amplitude and medium value of stress and are thus equal to . Figure 10 shows Haigh’s diagram. The working points corresponding to the two design solutions are represented.
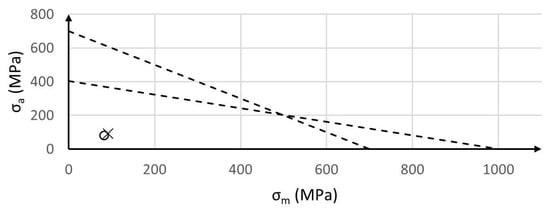
Figure 10.
Haigh’s diagram for the two proposed design solutions.
SF is equal to 2.6 in the case of DS1 and equal to 2.9 in the case of DS2. These values demonstrate that both the proposed design solutions allow for resisting infinite braking cycles.
3.6. Operating Characteristic Curves
As mentioned, the actual gaps between rotating and fixed elements suffer from uncertainties due to manufacturing and assembly errors. Therefore, it is useful to report here the operating points of the system at different values of g. Figure 11 plots the clamping torque as a function of the gap g. As discussed in the previous sections, the two designs lead to similar values of when g = 0.1 mm and p = 6 bar. Nonetheless, different trends can be observed when varying g. Particularly, design 2 allows for achieving higher torque in the case of small gaps. The difference between the two designs becomes more evident in the case of higher pressure, i.e., p = 6 bar.
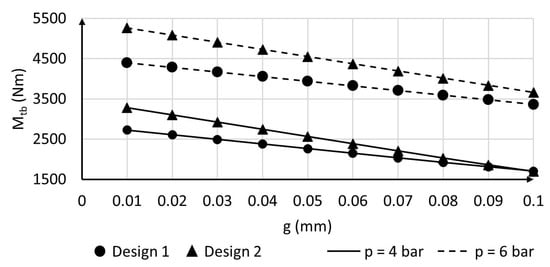
Figure 11.
Clamping torque as a function of the gap g for different designs and pressure values.
Figure 12 shows the effects of gaps and pressures on the safety factor calculated as in Equation (10). As in the case of clamping torque, the difference between the two solutions is more evident for smaller gaps. Interestingly, DS2 is characterised by higher values of SF, especially in the case of p = 4 bar. This finding, together with the considerations on clamping torques made above, allows for concluding that DS2 is preferable to DS1.
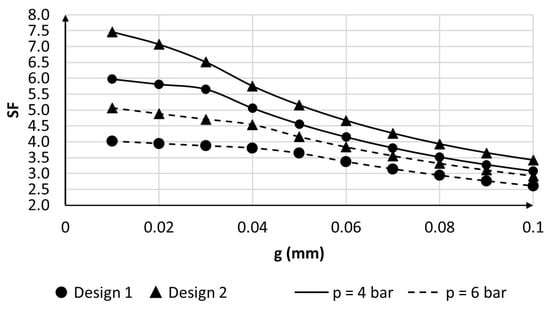
Figure 12.
Safety factor as a function of the gap g for different designs and pressure values.
3.7. Experimental Results
DS2 was manufactured and tested according to methods presented in Section 2.4. Table 8 summarizes the measured values of vertical displacement () at different pressure.
Table 8.
Measured and calculated values of axial displacement at different pressure levels.
It can be highlighted that the measured displacement varies linearly with the incoming pressure p.
The results of FEA () are also reported for comparison. These values have been calculated by varying the resistance force of the O-ring according to Equation (2); the corresponding values of are also included in Table 8.
The values in Table 8 show that the trend of displacement while increasing pressure is consistent with the results of the numerical simulation. Nevertheless, the value of actual displacement is approximately twice that calculated by means of FEA in all the testing conditions. As a first hypothesis, this effect had been supposed to be due to the compliance of the bolted connection between the piston and the base. Nevertheless, measuring the displacement by means of a second comparator it was observed that this region is fixed during piston expansion. Therefore, it is reasonable to think that the difference between theoretical and real deformation derives from the hypothesis used to model the contact between the piston and the external O-ring. In fact, the real contacts between the O-ring, the piston and the machine are characterised by a non-uniform pressure distribution which in turn determines complex phenomena at the interface [29,30]. A fine-tuning of the finite element model is thus carried out in the next section to find the equivalent interface force matching experimental results.
3.8. Fine-Tuning of the Finite Element Model
Firstly, simulations have been replicated excluding the resistant force acting on the support, i.e., assuming a frictionless contact between the O-ring and the structure. The results showed that the increase in vertical displacement is negligible and does not fill the gap with experimental observations. On the other hand, if the effect of the O-ring is ignored, i.e., the frictionless support is removed, and no resistant force is applied the results of FEA exceed the experimental observations, as shown in Figure 13.
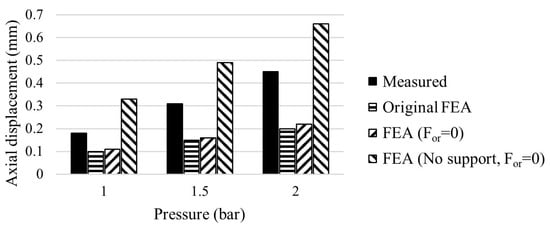
Figure 13.
Vertical displacement of the piston by experimental tests and different FEAs.
A fine-tuning of the resistant force is thus carried out on the finite element model. Specifically, the direct optimisation tool of Ansys is used to the resistant force leading to the measured values of vertical displacement reported in Section 3.7. The values of calculated at different pressures and the corresponding vertical displacement () are reported in Table 9. It can be highlighted that the value of linearly increases with the pressure p. Specifically, the values reported in Table 9 can be interpolated by means of Equation (11) (where p is in bar) with a coefficient of determination .
Table 9.
Measured and calculated values of axial displacement at different pressure levels.
In order to verify the proposed solution, a new simulation is performed with the new finite element model. Specifically, the frictionless support shown in Figure 3 is removed and the resistant force is calculated as in Equation (11), being equal to 10,194 N and 14,221 N at, respectively, p = 4 bar and p = 6 bar.
The fatigue verification at p = 6 bar returns a safety factor equal to 2.6. This value is lower than the one calculated during the preliminary design phase (SF = 2.9) but allows for ensuring the infinite fatigue resistance of the component with an adequate margin.
The calculation at p = 4 bar reveals a decrease in the clamping torque from 2957 Nm to 2659 Nm. This value is still sufficient to firmly anchor the rotary table during machining operation. Consequently, the design solution proposed is considered valid.
4. Conclusions
Pneumatic clamping systems represent a more sustainable alternative to hydraulic solutions, allowing for significant savings on energy consumption. Moreover, these systems determine less risk for operators as well as lower initial and maintenance costs. The main limit to their adoption derives from the difficulty to ensure adequate clamping torques with low pressure. This study demonstrates that high performances can be achieved by minimising the gap between rotating and fixed elements of the clamping system. However, this is practically impossible in many real applications due to the manufacturing and assembly tolerances. Results of the finite element analyses pointed out that small differences in the gap between elements result in enormous variations of the clamping torque acting on the disk. The clamping torque is also largely influenced by the thickness of the disk, decreasing for higher values of it. On the other hand, small values of thickness determine an increase in the peak stress acting on the fillet. The systematic design optimisation presented in this paper allowed for achieving two design solutions with different combinations of membrane thickness and expansion chamber width. Both these solutions ensure clamping torques up to 2960 Nm even with assembly gaps of 0.1 mm between fixed and rotating elements. Moreover, the safety factor to fatigue limit is equal to or higher than 2.6, ensuring the long-term resistance of the component under cyclic loads. Future studies will be devoted to exploring the effects of other design parameters on the torque and stresses of the clamping system.
Experimental tests revealed that the FEA model used in the preliminary design phase underestimates the vertical displacement of the piston. Therefore, the model has been modified to match the observed values of displacement and used to verify the model. The results show a slight decrease in braking torque and safety factor, which are nevertheless suitable for the application.
The findings presented in this study are of great relevance since they demonstrate that it is feasible to substitute a hydraulic brake by a pneumatic one. This allows for a sharp reduction of energy consumption, complexity and cost in large rotary transfer machines, which in turn positively affects the overall sustainability of machining operations.
Author Contributions
Conceptualization, D.C. and N.V.; methodology, D.C. and N.V.; software, M.M. and C.G.; validation, N.V. and C.G.; formal analysis, M.M., N.V., G.O. and D.C.; investigation, C.G. and G.C.; resources, N.V.; data curation, M.D.A., S.F., G.O. and M.M.; writing—original draft preparation, M.M. and C.G.; writing—review and editing, M.M.; visualization, M.M., M.D.A., S.F. and G.O.; supervision, D.C. and N.V.; funding acquisition, D.C. All authors have read and agreed to the published version of the manuscript.
Funding
Project funded under the National Recovery and Resilience Plan (NRRP), Mission 04 Component 2 Investment 1.5 – NextGenerationEU, Call for tender n. 3277 dated 30 December 2021 Award Number: 0001052 dated 23 June 2022.
Data Availability Statement
The raw data can be shared on request to the authors.
Conflicts of Interest
The authors declare no conflict of interest.
Abbreviations
The following abbreviations are used in this manuscript:
| DS1 | Design Solution 1 |
| DS2 | Design Solution 2 |
| FEA | Finite Element Analysis |
| RTM | Rotary Transfer Machining |
| SF | Safety Factor |
References
- Kalpakjian, S.; Schmid, S.R. Manufacturing Engineering and Technology; Pearson: Upper Saddle River, NJ, USA, 2014. [Google Scholar]
- Pusavec, F.; Kopac, J. Achieving and Implementation of Sustainability Principles in Machining Processes. Adv. Prod. Eng. Manag. 2009, 4, 151–160. [Google Scholar]
- Pimenov, D.Y.; Mia, M.; Gupta, M.K.; Machado, Á.R.; Pintaude, G.; Unune, D.R.; Khanna, N.; Khan, A.M.; Tomaz, Í.; Wojciechowski, S.; et al. Resource saving by optimization and machining environments for sustainable manufacturing: A review and future prospects. Renew. Sustain. Energy Rev. 2022, 166, 112660. [Google Scholar] [CrossRef]
- Sarıkaya, M.; Gupta, M.K.; Tomaz, I.; Krolczyk, G.M.; Khanna, N.; Karabulut, A.; Prakash, C.; Buddhi, D. Resource savings by sustainability assessment and energy modelling methods in mechanical machining process: A critical review. J. Clean. Prod. 2022, 370, 133403. [Google Scholar] [CrossRef]
- Apostolos, F.; Alexios, P.; Georgios, P.; Panagiotis, S.; George, C. Energy efficiency of manufacturing processes: A critical review. Procedia CIRP 2013, 7, 628–633. [Google Scholar] [CrossRef]
- Kshitij, G.; Khanna, N.; Yıldırım, Ç.V.; Dağlı, S.; Sarıkaya, M. Resource conservation and sustainable development in the metal cutting industry within the framework of the green economy concept: An overview and case study. Sustain. Mater. Technol. 2022, 34, e00507. [Google Scholar] [CrossRef]
- Dolgui, A.; Guschinsky, N.N.; Levin, G.M. Graph approach for optimal design of transfer machine with rotary table. Int. J. Prod. Res. 2009, 47, 321–341. [Google Scholar] [CrossRef]
- Battaia, O.; Dolgui, A.; Guschinsky, N.; Levin, G. Optimal Design of Rotary Transfer Machines with Turrets; IFAC: New York, NY, USA, 2012; Volume 14, pp. 407–412. [Google Scholar] [CrossRef]
- Battaïa, O.; Dolgui, A.; Guschinsky, N. Heuristics for Batch Machining at Reconfigurable Rotary Transfer Machines. IFAC-PapersOnLine 2016, 49, 491–496. [Google Scholar] [CrossRef]
- Croccolo, D.; Cavalli, O.; De Agostinis, M.; Fini, S.; Olmi, G.; Robusto, F.; Vincenzi, N. A methodology for the lightweight design of modern transfer machine tools. Machines 2018, 6, 2. [Google Scholar] [CrossRef]
- Józwik, J.; Zawada-Michałowska, M.; Moń, D. Dynamics Analysis of the Starting and Braking of the Table of CNC Machine Tool. Adv. Sci. Technol. Res. J. 2022, 16, 34–46. [Google Scholar] [CrossRef]
- Zhao, G.; Jiang, S.; Dong, K.; Xu, Q.; Zhang, Z.; Lu, L. Influence Analysis of Geometric Error and Compensation Method for Four-Axis Machining Tools with Two Rotary Axes. Machines 2022, 10, 586. [Google Scholar] [CrossRef]
- Robusto, F.; Croccolo, D.; De Agostinis, M.; Fini, S.; Olmi, G.; Rizzitelli, M.; Vincenzi, N. Numerical and Experimental Modeling of the Thermal Flow in a Modern Rotary Transfer Machine. J. Therm. Sci. Eng. Appl. 2021, 13, 051022. [Google Scholar] [CrossRef]
- Cao, H.; Li, D.; Yue, Y. Root cause identification of machining error based on statistical process control and fault diagnosis of machine tools. Machines 2017, 5, 20. [Google Scholar] [CrossRef]
- Císar, M.; Kuric, I.; Čuboňová, N.; Kandera, M. Design of the clamping system for the CNC machine tool. MATEC Web Conf. 2017, 137, 01003. [Google Scholar] [CrossRef]
- Tocut, P.D.; Stanasel, I.; Avram, F.T. Study of the clamping force in a pneumatic wedge device. In Proceedings of the IOP Conference Series: Materials Science and Engineering; IOP Publishing: Bristol, UK, 2021; Volume 1169, p. 12022. [Google Scholar]
- Kumar, S.; Singla, R. An Intelligent Clamping System for Drilling Operation—A Review. SSRG Int. J. Mech. Eng. 2015, 39–42. [Google Scholar]
- Li, B.; Melkote, S.N. Fixture clamping force optimisation and its impact on workpiece location accuracy. Int. J. Adv. Manuf. Technol. 2001, 17, 104–113. [Google Scholar] [CrossRef]
- Klotz, S.; Zanger, F.; Schulze, V. Influence of clamping systems during milling of carbon fiber reinforced composites. Procedia CIRP 2014, 24, 38–43. [Google Scholar] [CrossRef]
- Ye, L. Structure Design and Clamping Force Analysis Based on the End Clamping System of Polishing Industrial Robot. In Proceedings of the 2021 6th International Conference on Control, Robotics and Cybernetics, CRC 2021, Zhanjiang, China, 15–17 December 2021; pp. 32–35. [Google Scholar] [CrossRef]
- Chavan, C.; Raju, G.U.; Patil, S. Design and Analysis of Pneumatic Clamp for Turn Mill Application. Int. J. Recent Adv. Sci. Technol. 2018, 5, 49–55. [Google Scholar]
- Nascimento, V.; Teixeira, G.; Clarke, T. Structural validation of a pneumatic brake actuator using method for fatigue life calculation. Eng. Fail. Anal. 2020, 118, 104837. [Google Scholar] [CrossRef]
- Niemann, G. Machine Elements: Design and Calculation in Mechanical Engineering; Springer: Berlin/Heidelberg, Germany, 1978. [Google Scholar]
- Juvinall, R.C.; Marshek, K.M. Fundamentals of Machine Component Design; John Wiley & Sons: Hoboken, NJ, USA, 2020. [Google Scholar]
- Susmel, L. The theory of critical distances: A review of its applications in fatigue. Eng. Fract. Mech. 2008, 75, 1706–1724. [Google Scholar] [CrossRef]
- Eichlseder, W. Fatigue analysis by local stress concept based on finite element results. Comput. Struct. 2002, 80, 2109–2113. [Google Scholar] [CrossRef]
- Spaggiari, A.; Castagnetti, D.; Dragoni, E.; Bulleri, S. Fatigue life prediction of notched components: A comparison between the theory of critical distance and the classical stressgradient approach. Procedia Eng. 2011, 10, 2755–2767. [Google Scholar] [CrossRef]
- Peterson, R.E. Notch sensitivity. In Metal Fatigue; Sines, G., Waissman, J.L., Eds.; McGraw Hill: New York, NY, USA, 1959; pp. 293–306. [Google Scholar]
- Al-Ghathian, F. Friction Forces in O-ring Sealing. Am. J. Appl. Sci. 2005, 2, 626–632. [Google Scholar] [CrossRef]
- Yanes, E.; Pugno, N.M.; Ramier, J.; Berryhill, B.; Busfield, J.J. Characterising the friction coefficient between rubber O-rings and a rigid surface under extreme pressures. Polym. Test. 2021, 104, 107378. [Google Scholar] [CrossRef]
Disclaimer/Publisher’s Note: The statements, opinions and data contained in all publications are solely those of the individual author(s) and contributor(s) and not of MDPI and/or the editor(s). MDPI and/or the editor(s) disclaim responsibility for any injury to people or property resulting from any ideas, methods, instructions or products referred to in the content. |
© 2023 by the authors. Licensee MDPI, Basel, Switzerland. This article is an open access article distributed under the terms and conditions of the Creative Commons Attribution (CC BY) license (https://creativecommons.org/licenses/by/4.0/).