Abstract
This paper addresses the impact of mechanical vibrations of different frequencies on a particular type of valve. It has been shown that a neural network can be used to compress measurement data and determine the frequency range that is most important in describing the impact of mechanical vibrations on a micro-hydraulic overflow valve. Later, induction decision trees were used for the generated areas, determining key measurement points. The most important areas of dependence are determined using inductive decision trees in induction. The entropy measure is used to determine the most significant attribute. A modified induction algorithm was used for the comprehensive analyses. The analysis carried out in the paper identified the intervals in which the flow rate plays a decisive role for the entire amplitude and frequency spectrum. An analysis was performed for the 200…900 [Hz] frequency interval of the external driving force, with a harmonic step of 10 [Hz]. The analysis was performed while considering these main valve parameters: the pressure of the overflow valve opening p = 10 [MPa]; flow rate in the valve: 0.6, 0.8 and 1 [dm3/min]; stiffness of valve spring c = 7.49 [N/mm]. Plots were presented and for each plot, the most important four intervals were determined. They are hierarchically ordered in the interval range of the whole frequency spectrum range: (coefficient IV)—the most important; (coefficient III)—important; (coefficient II)—less important; (coefficient I)—least important. A test rig and the results of a study on the effect of mechanical vibration on changes in the amplitude-frequency spectrum of pressure pulsations of a micro-hydraulic system, in which a micro-hydraulic relief valve was subjected to mechanical vibration, are presented.
1. Introduction
In the real-world conditions of operating micro-hydraulic systems, external mechanical vibrations with a wide spectrum of frequencies act on them [1,2]. Vibration sources can be classified according to their nature and origin as determined, random, external or internal. Internal vibration sources are operating machinery and equipment mounted on floor slabs and foundations. Therefore, it is a good idea for such a vibration source to have its own foundations isolated from the foundations of the building or room in which other machines are working. Mechanical and especially hydraulic systems also generate this type of vibration with accompanying acoustic effects.
External vibrations are transmitted through the ground and the distance over which they propagate depends on the dissipative properties of the ground and the frequency of the propagated vibrations. Their sources can be:
- Traffic, where the vibration frequency depends on the speed of the moving vehicle (car, bus, tram, etc.); for a moving tram, the ground vibration frequency range is typically between 3 Hz and 40 Hz [3,4,5];
- railway traffic [6,7,8];
- machines working in the vicinity of buildings, and factories [9];
- blow-ups (e.g., when extracting rock material from quarry walls), explosions, and implosions.
In many practical situations, the forces that cause vibrations act directly on machine components or may be the result of a force from other machine components or equipment [10]. In addition to periodically fluctuating forces, vibrations can also originate from forces whose values are constant in time, but whose directions and points of application do change (e.g., for centrifugal forces). In machines and devices, vibrations are often caused by kinematic driving forces (e.g., when a mobile machine travels over uneven ground).
The coincidence of mechanical vibrations and pressure pulsation in micro-hydraulic systems can be addressed in two ways. In the first approach, the vibrations of the components of a micro-hydraulic system are induced by the pulsation flow (e.g., vibrations of micro-lines or micro-valves); in the second approach, the pressure pulsation is induced by the vibrating components of a micro-hydraulic system and the micro-valve controls are actuated (e.g., micro-distributor slides or lifts micro-valve poppets). In a micro-hydraulic system, the variable fluid pressure is caused, among other things, by the pulsation of the performance of the working fluid [11] resulting from the kinematics of the displacement elements of the micro-pump. The pulsation of the micro-pump performance causes the micro-hydraulic system to experience pressure that varies periodically as a harmonic function. The frequency of the pressure pulsation corresponds to the frequency of the performance pulsation [12,13]. In addition, it induces mechanical vibration in, among other things, micro-hydraulic lines. An example of the induction of such vibrations is shown in Figure 1 based on literature measurements.
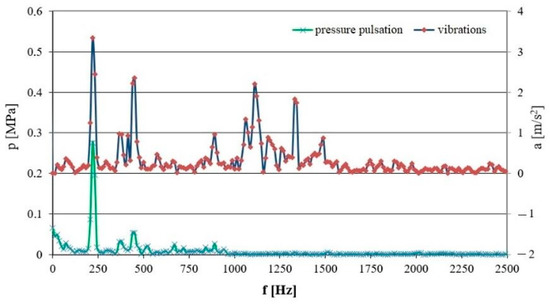
Figure 1.
The amplitude-and-frequency spectrum of pressure pulsation and mechanical vibrations of a micro-hydraulic line; pavrage = 5 [MPa], Q = 1.83 × 10⁻⁵ [m3/s] (1.1 [dm3/min]), according to [1].
In the spectrum shown in Figure 1, harmonic components of mechanical vibrations corresponding to the pressure pulsation can be observed, indicating that the pressure pulsation of the flowing fluid excited the mechanical vibrations of the hydraulic line.
In recent years, there has been a great deal of research interest in the problem of valve retrofitting and the vibrations that occur in valves.
In the paper [14], the authors attempt to optimize a ball valve for weight reduction and manufacturing cost reduction. For optimization, they use value engineering to optimize costs and raw materials while meeting customer requirements. The weight reduction of the valve focuses on reducing the weight of the valve body. The new, lighter valve body was subjected to strength analysis using FEM in the paper [14].
The authors of the paper [15] address the problem of optimizing the pilot stage of a jet pipe servo valve using the finite volume method in CFD analyses. The paper assumes a two-phase flow with cavitation occurring. Based on numerical methods, the authors discuss the influence of four structural parameters on the efficiency gain of the jet amplifier. The authors focused on optimization by changing selected parameters: distance between nozzle and receiving hole, the diameter of the receiving pipeline, the inclination of the receiving pipeline, and spacing between receiving holes.
In the paper [16], the authors address the problem of safety valve optimization using a surrogate model. Attention was focused on surrogate valve modeling methods, global sensitivity analysis of valve parameters and the optimization of valve performance. Analyses were performed using CFD methods and a set of surrogate models built to predict valve blowdown and stability.
Pressure pulsation and vibration of hydraulic valve components are the subject of research presented in the paper [17]. The paper presents a study of the pressure pulsation characteristics of the front stage flow field of the deflector jet servo valve. A large eddy simulation was used to analyze the pressure distribution and flow velocity of the working medium. Numerical considerations were carried out for changing selected valve parameters: deflector inlet width, deflector nozzle length, supply nozzle length, and outlet pressure. An additional objective of the analyses carried out in this paper was to determine the possibility of excitation of self-excited deflect of jet vibrations.
Hydrodynamic self-excited oscillations are the subject of analyses presented in the paper [18]. The authors aim to develop a simplified model that can explain the excitation mechanism and estimate the behavior of the hydromechanical system depending on geometrical and physical parameters.
In the presented paper, a modified induction algorithm for machine learning was used to analyze the effect of the vibration on the overflow micro-valve.
2. Research Problem
There is a relationship between design and operating parameters in the context of the effect of vibrations on the operation of micro-hydraulic components. The analysis of various research works carried out, e.g., [1], shows that the effects of design parameters—valve seat diameter, type and stiffness of the spring, the design of the lateral surface of the closing element’s cone, and operating parameters, i.e., the flow rate and operating pressures—on the frequency of external mechanical vibrations acting on a micro-valve should be investigated. The analysis will be carried out using the method of multi-valued logic trees and induction trees, which the applicant has previously used to analyze overflow valves and hydraulic distributors.
Preliminary experimental tests were conducted to determine the effects of external mechanical vibrations on changes in the amplitude-and-frequency spectrum of pressure pulsations in the system with the overflow micro-valve tested (Figure 2).

Figure 2.
The graphs of hydraulic system parameters, when pavrage = 5 [MPa], Q = 0.8 [dm3/min], according to [19]: (a) Cumulative graph of pressure pulsation amplitude as a function of frequency; (b) Relative change in pressure pulsation amplitude as a function of frequency of action on the external micro-valve.
In order to assess the influence of external mechanical vibration on pressure pulsation in a micro-hydraulic relief valve system, the relative ratio of pressure pulsation amplitude related to mechanical vibration intensity was used, Figure 2b. The mechanical vibration intensity was defined as follows:
where: a—mechanical vibration acceleration amplitude [m/s2], f—mechanical vibration frequency [1/s].
The effect of external mechanical vibrations on pressure pulsation in a micro-hydraulic system is mainly observed in the frequency range of 550–600 [Hz]. This can lead to irregular operation of the hydraulic devices, deterioration of their positioning accuracy, induction of vibrations in the hydraulic micro-lines and noise generation. Therefore, a multi-parametric sensitivity analysis of valve operation is needed to determine the optimal valve design. To obtain the first published results, one of the approaches used was parametric dependency graphs [20].
Areas were identified where flow rate plays a decisive role for the entire amplitude-and-frequency spectrum (intensity ranging from 200 to 900 [Hz] with a step of 10 [Hz], Q =0.6; 0.8; 1 [dm3/min], p = 10 [Mpa]). Only one valve design was analyzed (spring stiffness c = 7.49 [N/mm], angle of the element of cone 60°).
Further analysis is needed for: coil and wave springs with different stiffness 0.76 [N/mm] and 3.44 [N/mm]; different seat diameters d and different designs of the lateral surface of the closing element’s cone (change in angle and length of the element of cone l of the valve seat); hydraulic oils with different viscosities.
The design of the poppet-seat system affects the character of flow (turbulent or laminar) in the throttling gap of the valve, which may significantly influence the operation of the micro-hydraulic valve during mechanical vibration. The transition from laminar to turbulent flow takes place under certain conditions, which are characterized by the Reynolds number (Figure 3). The critical value of the Reynolds number is determined experimentally, e.g., by visualization studies [21]. Visualization studies consist of observing a contrasting fluid stream. For a fixed valve geometry and valve poppet lift, a contrast liquid (e.g., titanium oxide solution in glycerin) is added to the flowing fluid (hydraulic oil). At the beginning of the test, the jet of contrast fluid is clearly visible against the hydraulic oil—this is a laminar flow. By gradually increasing the flow rate, a blurring of the contrast fluid stream in the hydraulic oil is observed—this is turbulent flow. Figure 3b shows a blurring of the contrast liquid jet just behind the valve plug, while in Figure 3a it is clearly visible at all times. For single-stage relief valves, the critical Reynolds number value is approximately 120.

Figure 3.
Throttling gap of the valve (own measurement, not published before): (a) Laminar flow α = 60°, Re = 63; (b) Turbulent flow α = 45°, Re = 180.
Figure 3a,b show the fluid flow through the structural node of the seat plug in a single-stage relief valve. Taking into account the geometry of the valve, the relationship was used to calculate the Reynolds number:
where: Qz—liquid flow rate through the valve, d—seat diameter, z—valve poppet lift, α—half of the opening angle of the poppet, ν—kinematic viscosity of the liquid.
The authors analyzed the influence of design and operating parameters to determine the highest rank of importance of such parameters in the analysis of valve operation (and their values) to optimize the operation of the micro-hydraulic valve.
In the overall study, the authors considered changes in the following design parameters:
- ▪
- Springs with the following stiffnesses: c = 3.44 [N/mm], c = 7.49 [N/mm] and c = 0.76 [N/mm]. The aim is also to take into account other springs of different types with different stiffnesses. Changes in springs mean that other design parameters must also be changed: Insert with selected seat diameter, insert pressure, bolts for wave springs locking elements and pressure plate for springs, seals, washers, and safety bolts (all these elements are counted as design parameters).
- ▪
- Various diameters of the microvalve “d”. In the article, the tests were carried out for a fixed value of d = 3 [mm], but the overall study also provides for other appropriate changes in the dimensions of valve seat diameters, such as for d = 2.8 [mm], 3.1 [mm,] and 3.3 [mm], taking into account the relevant technological manufacturing accuracy.
- ▪
- Different designs of the side of the cone of the closing element (changing the angle and length of the formation “l” of the valve seat). Currently, the article assumes a value equal to half the cone opening angle: 45[°], but the overall study also provides structural changes in the side inclination of the cone of the closing element by different analyzed values of angles.
Changes in the following operating parameters:
- ▪
- Flow rate: The tests were carried out for the following flow rates: Q = 0.6 [dm3/min]; Q = 0.8 [dm3/min] and Q = 1 [dm3/min]. As described in the article. The authors also anticipate other changes in the values of flow rates in their study.
- ▪
- Different pressure values for opening the overflow valve p: 50 [MPa], 80 [Mpa] and 100 [Mpa]
- ▪
- Changes in the amplitude-frequency spectrum of pressure pulsations in the system.
The study analyzed the range for f = 0 [Hz] to 1000 [Hz].
All performance tests were performed for different external forcing for f = 0 [Hz] to 1000 [Hz].
There is a relationship between design and operational parameters in the context of the effect of vibration on the operation of micro-hydraulic components. The analysis of various research works carried out, for example, in papers: [1,22].
The analysis of the literature indicates the need to carry out research related to determining the influence of design parameters, i.e., the diameter of the valve seat, the type and stiffness of the spring, the different designs of the side slope of the cone of the closing element, and operational parameters, i.e., flow rates, operating pressures, on the frequency of external mechanical vibrations acting on the microvalve.
A working hydraulic element, such as a valve controlling the flow direction or pressure, is constantly subjected to complex forcing of various origins, including external vibrations from the ground, performance and pressure pulsations, which from the point of view of the hydraulic element, can be called internal. To date, a comprehensive analysis of the influence of design and operating parameters on the vibration of micro-hydraulic valves has not been undertaken despite the fact that the issues of vibration in hydraulic systems are taken up more than once. Several areas of research work can be distinguished. There is very rich literature on the vibration of flow-induced lines or pipelines [22,23,24].
In addition, there are few works that have analyzed the influence of design and operating parameters in micro-hydraulic systems, such as [25,26].
However, there is little work directly analyzing vibrations in microvalves.
The novelty of the work is an attempt to carry out a comprehensive analysis of hydraulic microvalves, which will make it possible to develop an optimal microhydraulic valve design, which should be effective, especially in the resonant frequency range of the microvalve’s control element. This frequency depends on, among other things, the design parameters of the valve, the operational parameters of the hydraulic system, as well as the configuration of the valve itself.
The measurement results will lead to generating amplitude and frequency spectra for (i) different values of the flow rate through the valve [dm3/min], valve opening pressures [Mpa] and external driving forces [Hz]; (ii) a set of combinations of design parameter changes (iii) for specific combinations of design parameter changes,
In the future, on the basis of the research results, the optimum design of a micro-hydraulic valve (hydraulic sensor) subjected to external mechanical vibrations will be developed.
3. Experimental Part of Research on Micro-Hydraulic Valve (Sensor)
3.1. Measurement Test Bench
In order to test the effect of external mechanical vibrations on the hydraulic micro-valve, a test bench was constructed, as shown in Figure 4a and a schematic diagram in Figure 4b.

Figure 4.
Test bench: (a) Micro-hydraulic system; (b) Diagram of the hydraulic system for testing the effect of external mechanical vibration on hydraulic micro-valves: 1—oil filter, 2—geared pump WPH PZ3A1G, 3—pressure gauge Parker ServiceJunior SCJN-400-01, 4—micro-valve tested, 5—flowmeter Parker KSCVF-002-10-07X, 6—thermometer Elmetron PT-217, 7—oil tank, 8—control cabinet, 9—three-phase electric motor, 10—flexible coupling, 11—electrodynamic mechanical vibration exciter TiraVib, 12—oil cooler with a controller,13—piezoelectric acceleration sensor PCB Piezotronics 340A16, 14—piezoelectric pressure sensor PCB Piezotronics 105C23.
The test stand contains an external gear micro-pump. The pump is driven by a three-phase electric motor controlled by a frequency converter, which enables the speed value on the pump shaft to be continuously adjusted. In this case, the pressure pulsation is a result of the pulsation of the capacity and impedance of the hydraulic system. The frequency of this pressure pulsation depends on the number of pump teeth and the pump shaft speed. A pressure gauge was placed behind the pump to measure the average pressure. In front of the micro-valve under test, a pressure sensor was placed to measure the pressure pulsation in the hydraulic system. Behind the micro-valve under the test, a flow meter was placed to measure the flow rate. A heat exchanger was used to stabilize the hydraulic system temperature. The first measurements on the test bench for the vibration resistance of hydraulic micro-valves were initiated by calibrating the system components. For this reason, the single-axis accelerometer to be tested was mechanically mounted on a calibrator with a known vibration frequency and amplitude. The accelerometer provided measurements that were recorded via the measuring amplifier. When the values generated by the calibrator were confirmed, the next stage of measurements was initiated. A single-axis accelerometer was mounted in the line of the vibrations generated by the exciter. A series of measurements were made for a constant power supply to the vibration exciter for driving force frequencies in the range 200–900 [Hz] with a step of 10 [Hz]. The oil used in testing was Azolla 22AF, ρ = 865 [kg/m3], υ (40 °C) = 22.5 [mm2/s]. The vibration generation system also included a TiraVib measurement amplifier and a computer with specialized software to form the control signal. The vibration amplifier makes it possible to amplify the signal coming from the generator, thereby achieving the desired amplitude. The amplifier’s display allows operating parameters to be controlled, and a stepless adjustable current limiter protects the system from unwanted current increases (Figure 5).
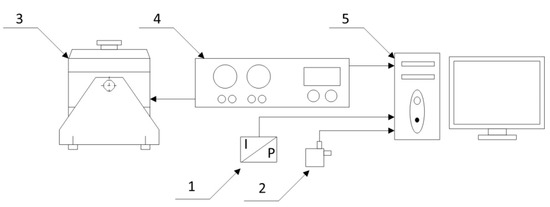
Figure 5.
Measuring system: 1—piezoelectric pressure sensor: PCB Piezotronics 105C23; 2—piezoelectric acceleration sensor: PCB Piezotronics 340A16; 3—electrodynamic inductor of mechanical vibration: TiraVib; 4—measuring amplifier: BA 1000 TiraVib; 5—PC.
As shown in Figure 5, the accelerometer and pressure sensors were used for acceleration and pressure measurement, respectively. The sensors’ uncertainties are presented in Table 1. Signal form sensors were gained by signal conditioner with gain factor K1 and error of gain . The signal was then passed to an oscilloscope which further amplified it. Oscilloscopes have a gain factor K2 with gain error . From the above, the measured acceleration a and pressure p can be described by the following equation:

Table 1.
Uncertainties of measuring devices.
As measurement uncertainty for each device is different, the acceleration and pressure are a function of three variables. The total measurement uncertainty can be presented as follows:
The relative uncertainty δa will be described by equation:
For the measuring apparatus used for the experiment, relative uncertainty of acceleration and pressure are equal to 5% and 4.9%, respectively.
Using the test stand, it is possible to measure vibrations and their effects on the operation of micro-hydraulic elements. The electrical signal from the piezoelectric pressure sensor (1) and the accelerometer was transmitted to a computer equipped with a measuring card. The data were further processed in OriginPro 9.0 and Microsoft EXCEL.
The exciter generated mechanical vibrations with a fixed amplitude and frequency: w(t) = w0·sin(2π·f·t). The overflow micro-valve shown in Figure 6a was used during the measurements. On the other hand, Figure 6b shows the overflow micro-valve with the sensors installed.
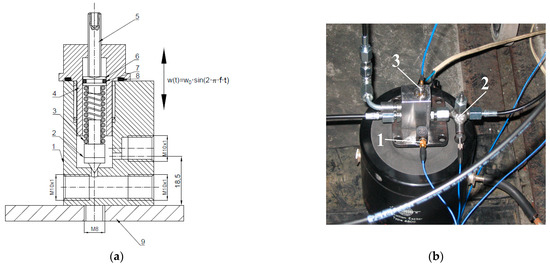
Figure 6.
Hydraulic system valve-sensor: (a) Axial section of the maximum micro-valve: 1—body, 2—poppet, 3—spring, 4—main spring, 5—adjusting screw, 6—piston, 7—piston seal, 8—screw seal, 9—holder; (b) Overflow micro-valve with sensors installed:1—three-axis accelerometer, 2—pressure sensor, 3—single-axis accelerometer.
The mass of the presented micro-valve with lines is 700 [g]. Its construction is based on an overflow valve used in conventional hydraulics. It is a classic miniaturized design with a sharp-edged socket and a cone-shaped closing element, the so-called poppet. This design is used for maximum or throttling micro-valves. This is due to the high tightness in the closing phase and the geometric shapes, which are simple to manufacture, and thus inexpensive. In addition, the use of a conical poppet in the overflow valve makes it resistant to contamination.
The poppet, which is supported from above by a spring, is the main element closing the valve. The poppet angle is 30°. The spring is pre-tensioned using an adjusting screw so that the valve’s opening pressure can be changed. A piston is used to stabilize the spring and to maintain the tightness between the spring and the adjustment screw. In order to maintain tightness between the adjustment screw and the piston body, a circular o-ring was inserted into the piston. A special clamp was bolted to the valve to attach it to the vibration exciter.
3.2. Selected Results of Experimental Tests
A total of about 900 measurement data were obtained for various combinations of changes in design and operating parameters. The application was developed in the calculation program Matlab. In turn, a measurement database was created in Excel using the partitioning guidelines for multi-valued logic trees and induction trees; a combinatorial table of all measurements is shown in Table 2:
Table 2.
Combinatorial representation of the scope of all studies.
The Supplementary Materials shows measurement results, for example, combinations of design and performance parameter values from the table above. In particular, for three springs with stiffnesses: c = 3.44 [N/mm], c = 7.49 [N/mm] and c = 0.76 [N/mm].
Measurements were carried out for flow rates through the valve equal to 1, 0.8, and 0.6 [dm3/min] at the overflow valve opening pressure of 10 [MPa]. Due to limited space, only selected measurement results are presented below. Figure 7 shows the results for an external driving force frequency of 220 [Hz] and 670 [Hz] as well as a flow rate of 1 [dm3/min]. Figure 8 shows the results for a frequency of 220 [Hz] and flow rates of 0.8 [dm3/min] and 0.6 [dm3/min].
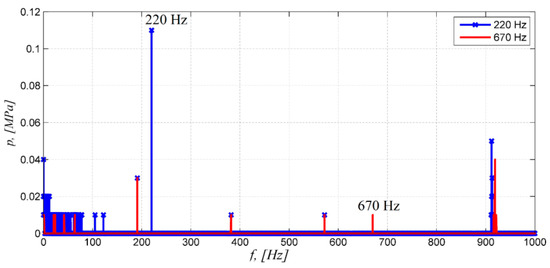
Figure 7.
Amplitude-and-frequency spectrum for a flow rate of 1 [dm3/min], with a mean pressure of 10 [MPa] and external driving force frequency of 220 and 670 [Hz].

Figure 8.
Amplitude-and-frequency spectrum for a flow rate of 0.6 and 0.8 [dm3/min], with a mean pressure of 10 [MPa] and external driving force frequency of 220 [Hz].
4. Analysis Using Neural Networks of Induction Decision Trees and Entropy as a Measure of Information
The literature provides experimental studies with technical objects, according to which there is no single type of information classification in decision support methods. Artificial neural networks are often used in technical problems for classification and contextual recognition. Common applications of neural networks are in robotics, automation, as well as control theory, and issues of optimization, motion perception, and planning [27,28]. In problems of identification and control of dynamic processes, a neural network usually performs several functions. It provides a non-linear model of the process, allowing the development of an appropriate control signal. An important role, especially in robot control, is played by the function of the classifier used in deciding how the process should continue [29,30]. For example, a study [31] applied a modular decision-making system based on neural networks to the acoustic diagnosis of an internal combustion engine.
In the technical problems under consideration, one of the classification methods is induction-based rule generation using decision trees. In the generation of induction decision trees, a series of tests performed in a specific order is carried out [32,33,34]. The criterion for selecting the most important attribute is entropy. Inductive decision trees can be compared with multi-valued logic trees in the classification, prediction, and rank ordering of decision variables [35,36].
The criterion for the selection of the attribute used to expand the tree is entropy, a certain measure of information existing in a phenomenon that can take on n states at random:
where: pi—the probability of the i-th element of the set appearing.
In decision tree induction problems, entropy determines the most significant attribute. The information in the set of training examples is equal to:
where: E—the set of training examples; |Ei|—the number of examples of the i-th item; |E|—the number of examples in the training set E.
The expected value of information after dividing the set of examples E into subsets E(m) (m = 1,…|Va|), in which attribute a has value Vm, is defined as [32,33,34]:
where: |E(m)|—the number of examples after the division of the set E with respect to an attribute value m; |E|—the number of examples in the training set E.
Entropy can be used in the grouping process as a measure of the similarity between the parameter properties of the intervals defined. For the partitioning based on the construction of classes (intervals), a hierarchical-partitioning category can be distinguished.
One of the methods used in finite state machines for the initialization of a network is the inductive tree that is built on the framework created separately for each interval [37]. If a dimension is divided into k intervals, the number of vectors is counted in each interval and the intervals’ importance rank is taken into account (Figure 9).
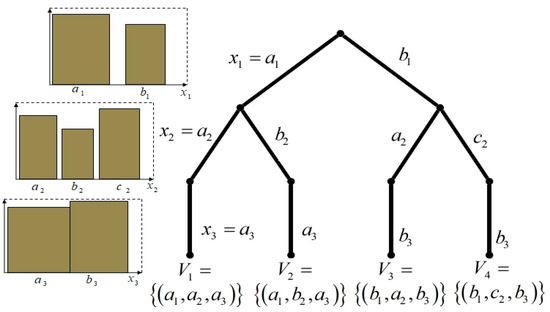
Figure 9.
Stages of a decision tree induction.
The approach proposed in Figure 9 can be used if the problem has the property of optimal substructure. This property means that the optimal solution of the problem is a function of the optimal solutions of the subproblem, and consequently, the objective function can be described by a recursive equation. When solving a problem using dynamic structure search, each subproblem only needs to be solved once. Dynamic programming can be used to solve some numerical NP-complete problems.
The computational complexity function of an algorithm based on a modified inductive algorithm is polynomial depending on at least two variables—the size of the problem N(I) and the maximum value of some parameter of the problem Max(I). Thus, the algorithm can be divided iteratively into a bar graph and will perform a whole series of calculations implementing successive division steps for the induction tree.
5. Application of a Modified Induction Algorithm in the Analysis of the Vibration Effects on a Micro-Hydraulic Valve
This paper considers the classification of multi-category objects [38,39,40], which is usually carried out using specialized classifiers that recognize more than two classes. Binary classification is understood as the ability to use the information about the values of an object’s attributes to assign one of the two permissible classes (labels) to an object being classified. The operation consists of an elementary application of the mechanism of constructive attribute induction to a standard information system in the sense of entropy.
The widespread use of decision trees began with the development of the CART (Classification And Regression Tree) algorithm [41]. This is the basic algorithm with which a decision tree can be built and is the basis of the various algorithms for building different decision trees. A classification tree is built recursively from the root to the leaves, with the internal nodes describing how the division into homogeneous classes is made. Classification tree algorithms differ in, among other things, the criteria for creating the next node or leaf, and the choice of test for a node, which determines the complexity of the decision tree. An important advance was the introduction of entropy to measure diversity in trees. The first algorithm using entropy to build decision trees is Quinlan’s ID3. However, it has some drawbacks: unnecessary tree growth and lack of mechanisms to counteract overfitting, and consequently high error rates for the evaluation sets.
Over time, the C4.5 algorithm was developed, which is an extension of ID3 and solves the problems of its predecessor [42]. Later, a further version of the algorithm, C5.0, was presented [43].
The splitting criterion (splitting rule) is used to find the best test that will divide the data set at a node into two (or more, depending on the type of decision tree) subsets of data. The test is defined by a condition for splitting the data. This condition is closely related to the attributes and all possible values of these attributes. The choice of data splitting at each node is by far the most difficult and complex step in the construction of decision trees. The use of a particular criterion depends on the algorithm used or even specific applications of the algorithm. For example, in the case of the CART algorithm, the impurity measure i(t) (impurity function), which determines the maximum homogeneity of descendant nodes, is mostly determined in order to evaluate the test. Since the impurity measure of the parent node mp is constant for each possible division aj ≤ aj R, j = 1, …, M (where M is the number of attributes and aj R is the best division for attribute aj), the maximum homogeneity of the left and right descendants will be determined by the maximum difference of the impurity measure Δi(t) [44]:
where: p(k/m)—probability of occurrence of decision class k at node m, p(o/m)—probability of occurrence of decision class o at node m, o and k—decision classes.
For the aforementioned algorithms, evaluating entire subsets is computationally more expensive; one solution is to randomly (or otherwise) select a family of multiple subsets of attributes and systematically search through them to find the subset leading to an effective classifier.
However, the above conditions were unsuitable for use in vibration analysis due to the amplitude-frequency spectrum of pressure pulsations. Therefore, it was decided to use a modified induction algorithm.
The modified inductive algorithm takes into account the discretization of numerical attributes.
The modified induction algorithm (MIA) starts with the generation (in the background) of induction trees for the information set being analyzed (measurements). In the next step, the algorithm determines the values of the weights Wn (multipliers for the individual descriptive attributes), using the qualitative component of the network, i.e., the structure of the induction tree. In the modified induction algorithm, the decision to modify the original attribute set is primarily based on a statistical analysis of the training set [45,46].
The distribution of attribute and category values is examined to detect and remove irrelevant attributes (e.g., using the statistical measure v2 that allows the detection of first-order correlations, i.e., relationships in a pair of attributes, excluding the higher-order relationships), to detect functional relationships between attributes (using a correlation coefficient) and to replace these attributes with a single, appropriately constructed attribute. In this type of strategy, the search for the suitable construct of a new attribute may start with a one-element subset of attributes and then may be iteratively extended by one or more attributes (the so-called ascending approach, Figure 10).
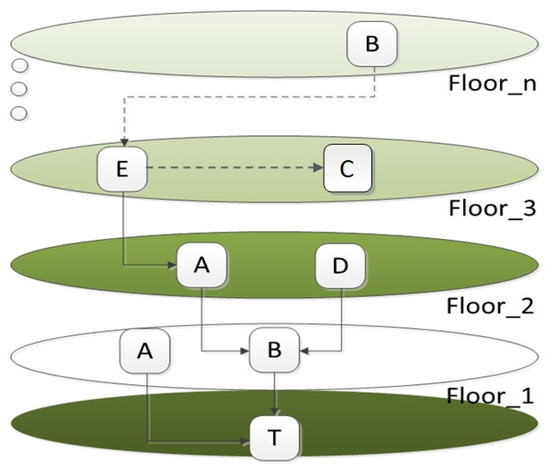
Figure 10.
The diagram of tree induction—A, B, …, E denote descriptive attributes, T—is a decision.
This process depends on the location of the attribute in the belief network being created; for descriptive attributes that have a direct influence on the decision (in Figure 10, attributes A and C), the value of the multiplier Wn is 1. For attributes that indirectly affect a decision, the multiplier is halved.
The final value of the new attribute cell based on MIA for a given set can be calculated from:
where: Wn—is the multiplier value for the n-th tree level; am—is the original value of the attribute, and Floorn is the level in the entire tree.
For measurements including numeric attributes with high data dynamics, multiplier values can be normalized to shorten the interval for the new attribute values [47,48] as for amplitude and frequency spectra analyzed in this study.
The standard optimization algorithm (Algorithms 1) is presented as follows [49]:
| Algorithms 1 Classification part: (input: N set of examples; E set of attributes; output: local coverage P of set N); begin G := K; {set of objects not yet covered by elements from P} P := ∅; while G ≠∅ for begin P := ∅; {execute conditional rule} S := G; {set of objects covered by P} while (P = ∅) or not ([P] ⊆ K) for begin w := ∅; {best candidate for elementary condition} w_eval := ∞ ; {estimation of elementary condition according to selected measure} for each attribute a ∈ C for begin if eval_new_p<w_eval then {check if condition new_p is better than w} begin w := new_p; w_eval := new_eval_p; end; end;{for} P := P ∪ {w}; {include best condition in conjunction P} S := S ∩ [w]; {limit set of objects} end; {while not ([P] ⊆ K)} for each elementary condition w ∈ P for if [P − {w}] ⊆ K then P := P − {w}; P := P ∪ {P}; G := K—∪ P∈P[P]; end; {while G ≠∅} Calculation part: for i : = 1 to length (H) − 1 for begin v := (H(i) + H(i + 1))/2; {consider as limit points only if the points divide examples belonging to different classes} S1 := {x ∈ S | f(a,x) < v}; {divide objects from S according to threshold v} S2 := {x ∈ S | f(a,x) ≥ v}; eval_t := (|S1|/|S1 ∪ S2|)⋅Ent(S1) + (|S2|/|S1 ∪ S2|)⋅Ent(S2); {calculate conditional entropy} if eval_t<eval_best_ then begin if |G ∩ S2| ≥ |G ∩ S1| then best_t := (f(a,x) ≥ v) else best_t := (f(a,x) < v); eval_best_t := eval_t end {if} |
5.1. Modified Induction Algorithm
MIA begins by determining the set of starting attributes (starting family (block 1), which consists of multipliers that are identical at the beginning for all descriptive attributes, where the number of multipliers is equal to the number of the elements of the vector) that describe the objects of the given information base (Figure 11).
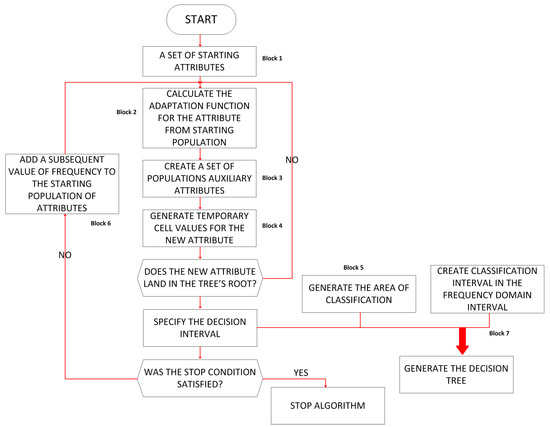
Figure 11.
The diagram of the modified induction algorithm, MIA.
For a given set, the final value of the new attribute is calculated based on MIA using formula (13), where Wn is the vector of multipliers derived from the presented algorithm.
The subsequent steps of this algorithm use a modified induction formula (µ + λ). The adaptation function is calculated for the original attributes (block 2). The adaptation function Wit (Equation (5)) is calculated from the information entropy I(SL,a) for the new attribute added to the decision table and the average amount of data from the inductive algorithm E(SK) (Equation (6)) for the decision tree created.
where: SK—the number of questions asked in the tree branch, from root to leaf; xi—the number of cases recognized by the branch; pi—the probability of a given case occurring in the set (assuming that all cases analyzed are equally likely, pi = 1/SL).
In the next step of the algorithm (block 3), “peaks” of the frequency area are calculated several times.
This population is linked to the population formed in the previous loop of the algorithm, resulting in µ + λ individuals.
Now an individual is selected to create a new attribute (block 4). A decision tree is generated for the decision table, to which the additional attribute was added (block 5). If the added attribute is not correctly positioned in the decision tree, further computation is aborted and the combination of multipliers is removed from the population µ + λ of individuals (the algorithm returns to step (2)). Otherwise, all components of the adaptation function are calculated (block 6). In the next step (block 7), after building the decision tree, the condition of performing a certain number of iterations or reaching a certain value of the adaptation function is checked. If this condition is not met, the current individual (vector of multipliers) replaces the weakest individual (inferior to the current one) in the population µ+λ. If the algorithm stops after a certain number of iterations, the vector of multipliers Wn with the smallest value of the function Wit is selected, and when the adaptation function Wit has reached its preset value, the current vector of multipliers Wn is selected.
Later on, an expert system can be used for a wide class of overflow valves.
5.2. Determination of the Most Important Design Parameters for the Analysis of Vibration Effects on a Micro-Hydraulic Valve
Figure 12 shows an example of measurement data divided into 44 frames (intervals) for the amplitude and frequency spectrum at a flow rate of 0.6 [dm3/min], a pressure of 10 [MPa], and an external driving force for a frequency of 670 [Hz].
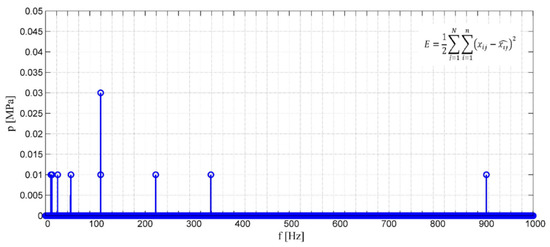
Figure 12.
Frame intervals for the amplitude-and-frequency spectrum of pressure pulsations at a flow rate of 0.6 [dm3/min], an average pressure of 10 [MPa], and an external driving force for a frequency of 670 [Hz].
In a further step, the most important areas of dependence are determined using inductive decision trees. In a decision tree, the tests used to check the values of the attributes of the examples are stored in the nodes, and the categories assigned to them are stored in the leaves [50,51]. For each possible test result, a corresponding branch leads from one node to the next subtree.
An analysis was performed for the 200–900 [Hz] frequency interval of the external driving force, with a harmonic step of 10 [Hz]. The analysis was performed while considering these main valve parameters: the pressure of the overflow valve opening p = 10 [MPa]; flow rate in the valve: 0.6, 0.8 and 1 [dm3/min]; stiffness of valve spring c = 7.49 [N/mm].
A total of 213 plots were generated (71 plots for each flow rate through the valve). For each plot, the most important four intervals were determined. They are hierarchically ordered in the interval range of the whole frequency spectrum range: (coefficient IV)—the most important; (coefficient III)—important; (coefficient II)—less important; (coefficient I)—least important.
The plots (Figure 13, Figure 14, Figure 15, Figure 16, Figure 17 and Figure 18) show examples of plots with specific intervals for flow rates: 0.6 (Figure 13 and Figure 14), 0.8 (Figure 15 and Figure 16), and 1 [dm3/min] (Figure 17 and Figure 18), respectively.
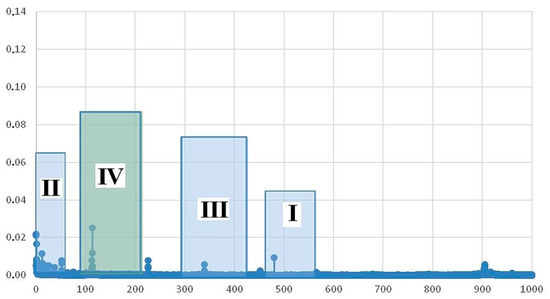
Figure 13.
The most important framework intervals for the amplitude-and-frequency spectrum for a flow rate of 0.6 [dm3/min], pressure of 10 [MPa], and external driving force frequency of 490 [Hz].
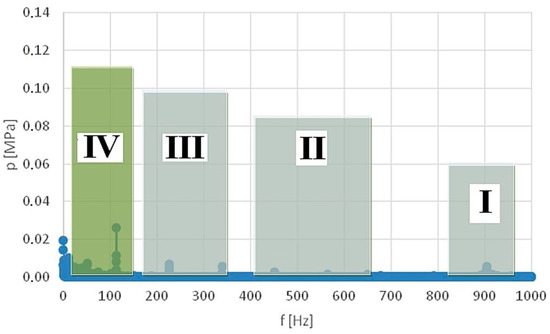
Figure 14.
The most important framework intervals for the amplitude-and-frequency spectrum for a flow rate of 0.6 [dm3/min] and external driving force frequency of 650 [Hz].
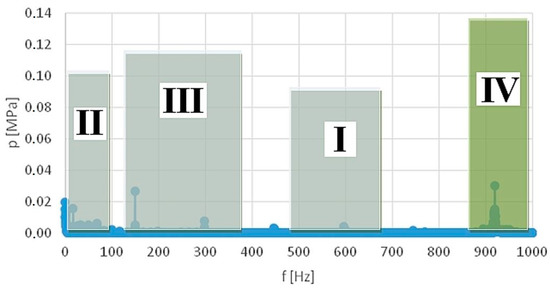
Figure 15.
The most important framework intervals for the amplitude-and-frequency spectrum for a flow rate of 0.8 [dm3/min] and external driving force frequency of 600 [Hz].
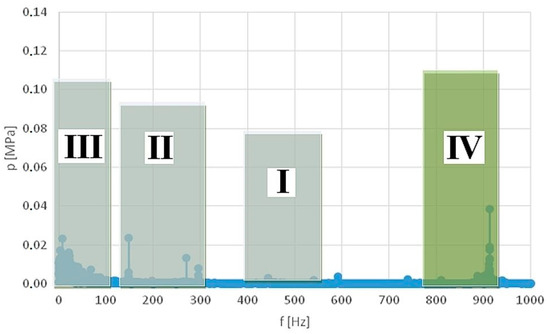
Figure 16.
The most important framework intervals for the amplitude-and-frequency spectrum for a flow rate of 0.8 [dm3/min] and external driving force frequency of 270 [Hz].

Figure 17.
The most important framework intervals for the amplitude-and-frequency spectrum for a flow rate of 1 [dm3/min] and external driving force frequency of 200 [Hz].
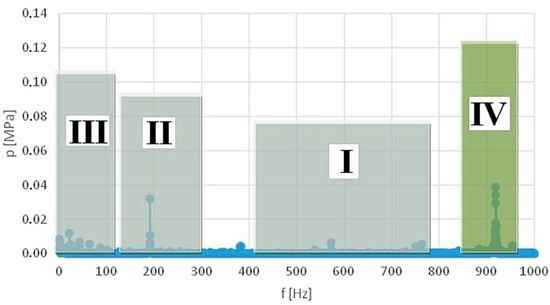
Figure 18.
The most important framework intervals for the amplitude-and-frequency spectrum for a flow rate of 1 [dm3/min] and external driving force frequency of 750 [Hz].
The error analysis during the calculation can be shown as follows Figure 19.

Figure 19.
Analysis of the summed squared error (SSE) of learning an inductive algorithm.
Analysis of network learning errors has shown that the best results are obtained by using as large a learning set as possible.
Where SET1, SET2…SET14 are the selected and specified combinations of changes in the analyzed parameters.
Figure 20 shows a statistical analysis of the distribution of true and false classification values.

Figure 20.
Statistical analysis of the distribution of true and false classification values.
A number of data grouping (classification) algorithms can be used for hierarchical classification in the domain of principal components or a reduced set of statistical features of the analyzed signals. In the case of decision trees, classification is performed by recursively partitioning the data into categories at successive nodes of the decision tree. At each node of the tree, the remaining variables with the highest entropy reduction or the highest information coefficient are selected and used to categorize the data as the next partitioning step in the next node of the decision tree. At the last node, the data are assigned to one of several data categories, which, in the case of the grinding process, correspond to the different states of the process.
We briefly discuss the computational complexity of the modified inductive algorithm. Let us assume that the basic operation is the evaluation of a single elementary condition (built using a threshold v). In the worst case, a single rule covers one object and uses all attributes to build elementary conditions. If n is the number of examples, W—is the average number of values in the attribute domain, and m—is the number of attributes, then nWm(m + 1)/2 operations are needed in the worst case. The complexity function of the modified inductive algorithm is a polynomial, of order O(nWm2).
In general, the algorithm also considers nominal attributes. For these attributes, the conditions are presented in the form of (f(a,x) = Va). Each condition generates a division of the set S into a subset and its complement, which are used to evaluate the condition in a similar way as for numerical attributes. The modified induction algorithm can, therefore, be applied to data containing nominal-type attributes. Each candidate condition generates a division of the set S into a subset of
And its complement
which are used to evaluate the condition in a similar way as numerical articulations.
The final product of the classification is a set of classification accuracy tables. The first element of the post-classification procedure is to analyze the results obtained, generated as an additional file in which the area of analysis is defined into compartments. If they are satisfactory, further analysis of the importance rank of the parameters should be performed.
If each design and/or operating parameter taking numerical values from a specific interval is labeled with a fixed binary or multivalued logical variable, such numeric intervals can be discretized.
The method presented in this paper allows the original set of variables observed during the testing of the hydraulic microvalve to be reduced to a minimum set of mutually uncorrelated variables and the relationship between the design and operating parameters to be clarified. Table 3 presents the encoding of changes for only one flow rate Q and frequency f at a given pressure p.
Table 3.
Logical encoding of a fixed flow rate Q = 0.8 [dm3/min] and frequency variation ranges <200–900> and arithmetic encoding for bar graphs from highest to lowest >>4*, 3*, 2*, 1*<< specifying the range of importance ranks of intervals.
The values for the flow rates Q = 0.6 and 1 [dm3/min] were encoded over the entire frequency range at a given pressure p. Based on the calculation model, the frequency of occurrence of frames (bars) is counted using the specified weights: >>4*, 3*, 2*, 1* << in the five subintervals of the frequency variation range f [Hz] for the three set rates Q (Table 4).
Table 4.
Frequency of occurrence of intervals (frames) with given weights 4 *, 3 *, 2 *, 1 * in the five subintervals of the frequency variation range f [Hz] for the three set flow rates Q.
The influence of flow rate Q is decisive for its second and third ranges of variability. In classifying the membership of the intervals (frames) describing the importance rank: the interval with the highest rank (weight IV) occurs 10 times in the fourth range of variability, and the interval with a lower rank (weight III) occurs nine times in the third range of variability. The next hierarchically lower ranked interval (weight II) occurs seven times in the second range of variability. The interval with the lowest rank of importance (weight I) occurs eight times in the first range of variability.
In this interpretation, the framework interval (height of the bar) indicates the larger or smaller frequency range analyzed.
It follows from theoretical considerations and experimental tests for various changes in design and operating parameters that the control element of a hydraulic valve (spool, conical plug or ball) is excited by external mechanical vibrations. This phenomenon increases in intensity in the vicinity of the mechanical resonance of the valve control element and when the direction of external excitation is in line with the direction of movement of the valve spool. Using a machine learning algorithm, the adverse effects of this phenomenon—the formation of pressure pulsations—were identified. Therefore, it is important in the first step to analyze the importance rank of the design parameters (such as spring stiffness, mass of the closing element, seat size diameter, etc.) and operational parameters (valve opening pressure, flow rate through the valve, etc.) affecting this phenomenon and ultimately, to perform optimization in order to reduce the influence of external mechanical vibrations over as wide a frequency range as possible.
The influence of Q intensity plays a decisive role in its second and third range of variation, which corresponds to Q = 0.8 [dm3/min]. The most important influence of the spring stiffness with a stiffness of c = 7.49 [N/mm] was also determined for the initially assumed diameter d = 4 [mm].
In order to evaluate the effect of external mechanical vibration on pressure pulsation in a hydraulic system with an overflow microvalve, the relative ratio of the amplitude of pressure pulsation related to the intensity of vibration was used. Such an assessment of the effect of mechanical vibration on pressure pulsation is justified by the fact that the relative change in the amplitude of pressure pulsation is related to the intensity of mechanical vibration, and also includes information about the source of vibration, i.e., its amplitude and frequency The study was carried out for plugs with an apex angle of 2α = 60°, 90°, 120°. It turned out that the optimal value is the angle α = 90°.
Experimental studies to determine the onset of cavitation formation were carried out on the example of an orifice with a conical inlet with α = 120° and d = 2.5 mm. The geometric parameters of the orifice were selected so that the shape and dimensions corresponded to the designed plug-socket system of the maximum microvalve.
In the current study, the different forming l of the seat was not taken into account.
It is worth noting that reducing the diameter of the seat, increasing the stiffness of the spring, or using a fluid with higher viscosity worsens the static characteristics of the valve.
Thus, the most effective way to improve stability seems to be to increase the system’s capacitance, which increases the time required to open the valve. However, this issue is not so important, since time is measured in thousandths of a second. The research being carried out is aimed at selecting optimal values for all parameters in order not to deteriorate the static characteristics of the system.
6. Summary and Conclusions
In this paper, the vibration effects on a micro-hydraulic valve (sensor) were preliminarily analyzed by considering the method of a modified decision tree induction algorithm. Performed analysis should be given special attention since it places high demands on the systems and their components. Additionally, it was pointed out that valve disturbance forces sometimes deviate from the control forces’ magnitude. In the experimental part of the research, the valve was subjected to external mechanical vibrations by a certain frequency and amplitude. In the system where the valve (sensor) was supposed to vibrate, the pressure pulsation was also measured and recorded.
Analysis of the plots shows that external mechanical vibrations acting on the overflow valve lead to the appearance of a component with a frequency corresponding to these vibrations and a dominant amplitude in the amplitude and frequency spectrum of the pressure pulsation. In a hydraulic microcircuit, this can lead to irregular operation of the hydraulic devices, deterioration in their positioning accuracy, excitation of vibrations in the hydraulic microcircuit and the generation of noise.
Therefore, as a first step, it is important to analyze the importance rank of design parameters (such as spring stiffness, mass of the closing element, seat diameter, etc.) and operating parameters (opening pressure of the valve, flow rate through the valve, etc.) responsible for this phenomenon and finally, to perform an optimization to reduce the effects of external mechanical vibrations over the widest possible frequency range.
A preliminary analysis has made it possible to divide the range into intervals, in which the flow rate plays a decisive role for the entire amplitude and frequency spectrum (for its second and third ranges of variation). Further analysis will consider how induction tree generation with the most important ranges of the frequency spectrum of the intervals (including all intensities) could be applied to determine the most important single points or interval ranges. The effect of external mechanical vibration on pressure pulsation in the hydraulic microcircuit is mainly observed in the frequency range of 550–600 Hz. This can lead to, among other things: erratic operation of hydraulic receivers, deterioration of their positioning accuracy, excitation of vibrations of hydraulic micropipes and noise generation. Therefore, a multi-parametric analysis of the sensitivity of the valve’s operation is necessary to determine its optimal design.
Ultimately, the analysis should be carried out for the following points, different changes in design parameters: analysis of springs with different stiffnesses and/or changes in the shape of the micro-valve (sensor) poppet; different changes in pressure, and an operating parameter.
Logic decision trees will be used for the comprehensive analysis. The properties of logical decision trees are of combinatorial importance for the systematic review of the subintervals of variation of a fixed set of independent variables, and the subsequent determination of the importance rank of those variables. The main limitations during vibration testing of micro-hydraulic valves:
- Technological limitations
It is difficult to carry out research on an actual micro-hydraulic component or a 1:1 scale model of it. This is primarily due to the difficulty of measuring physical quantities, the most important of which are fluid flow and pressure. Measuring these quantities at specific points in the system or the distribution of these parameters at some specific location involves purchasing very expensive microsensors and performing difficult technological operations to place them in the microcircuit.
- Computational limitations
To properly model micro-elements or micro-hydraulic systems with larger-scale elements or systems and correctly interpret the obtained results, it is necessary to follow the similarity theory. This theory allows the quantitative and qualitative descriptions of the real phenomenon on the basis of measurements. It is worth noting that the methods for obtaining similarity criteria between real and model elements are the same. The basis of the first method is the equations of the theory and the conditions that must be met so that the mathematical equations of the model can be transformed into equations identical to the mathematical equations of the real process (most often it is ordinary or partial differential equations). The second method takes advantage of the possibility of converting the dimensional variables, which are assumed to be those affecting the process, into a smaller number of dimensionless variables by taking into account the dimensional relationships between quantities.
- The problem of similarity
Suppose the similarity theory is to be used to study the dynamic properties of the valve. However, the time course of pressure is studied, which is the response to a step forced by the flow rate. This waveform will depend on such parameters as the density of the fluid ρ, kg/m3, the dynamic viscosity coefficient η, kg/ms, the spring stiffness k, N/m, the characteristic dimension of the valve d [m] the mass of the plug m, kg, the resistance coefficient of the movement of the plug b, [Ns/m], the flow rate directed to the valve Q [m3/s], the capacitance of the fluid and the elements in front of the valve c [m5/N], and the time t [s]. The use of a modified induction algorithm, in this case, is extremely difficult since among the listed parameters only three can be selected, the scale of which is chosen arbitrarily. To ensure the similarity of the phenomena occurring in the model and the real valve, the scales of the remaining parameters will have to be strictly dependent on the selected three scales of the base parameters, which may not even be feasible.
Further research should focus on using a diagnostic decision support system to:
- -
- determine the nature of the flow in the valve gap,
- -
- determining the dependence of the coefficient µ on the shape and Reynolds number,
- -
- determination of the value of the angle β of the jet outflow from the throttle gap,
- -
- determination of all equilibrium conditions of forces acting on the plug.
In addition, future research work will make it possible to make predictions about the effects of using materials with non-linear characteristics on the transmission of external vibrations to the valve body or its control element and to determine the characteristics that a material designed for vibration isolation should have in order to achieve the desired level of vibration isolation efficiency. At the same time, they will contribute to the development of a whole range of isolators for various industries. In particular, the research will enable the development of hydraulic components made of composite materials, which will be characterized by lighter weight. They will be used in the aerospace industry and in mobile devices to reduce energy consumption.
Supplementary Materials
The following supporting information can be downloaded at: https://www.mdpi.com/article/10.3390/machines11020184/s1, measurement results for three springs with stiffnesses: c = 3.44 [N/mm], c = 7.49 [N/mm] and c = 0.76 [N/mm].
Author Contributions
Conceptualization, A.D., M.K. and M.S.; methodology, A.D. and P.S.; software, A.D. and Ż.G.; validation, A.M.D., M.K. and K.U.; formal analysis, A.D., K.P., M.S., M.K., K.U., M.Ł. and P.S.; investigation, A.D., M.S., M.K., K.T., M.Ł. and A.M.D.; resources, M.K. and A.M.D.; data curation, A.D., K.P., M.S., M.K., K.U. and P.S.; writing—original draft preparation, A.D., Ż.G., M.S., M.K., K.U. and P.S.; writing—review and editing, A.D., M.S., M.K., K.U. and A.M.D.; visualization, A.D., K.P., M.S., M.K. and K.U.; supervision, A.D. and M.K.; All authors have read and agreed to the published version of the manuscript.
Funding
This research received no external funding.
Institutional Review Board Statement
Not applicable.
Informed Consent Statement
Not applicable.
Data Availability Statement
Not applicable.
Conflicts of Interest
The authors declare no conflict of interest.
References
- Stosiak, M. Identification of Vibration Effects and Methods for their Reduction in Selected Hydraulic Valves; Publishing house of Wrocław University of Science and Technology: Wrocław, Poland, 2015; p. 168. ISBN 9788374938884. (In Polish) [Google Scholar]
- Manish, V.; Rajesh, P.; Harshlata, V.; Rajput, P. Vibration Analysis & Condition Monitoring for Rotating Machines: A Review. Mater. Today Proc. 2017, 4, 2659–2664. [Google Scholar] [CrossRef]
- Peplow, A.; Persson, P.; Andersen, L. Evaluating annoyance mitigation in the screening of train-induced noise and ground vibrations using a single-leaf traffic barrier. Sci. Total Environ. 2021, 790, 147877. [Google Scholar] [CrossRef] [PubMed]
- Liang, R.; Liu, W.; Li, W.; Wu, Z. A traffic noise source identification method for buildings adjacent to multiple transport infrastructures based on deep learning. Build. Environ. 2022, 211, 108764. [Google Scholar] [CrossRef]
- Ye, Z.; Xiong, H.; Wang, L. Collecting comprehensive traffic information using pavement vibration monitoring data. Comput. Aided Civ. Infrastruct. Eng. 2020, 35, 134–149. [Google Scholar] [CrossRef]
- Zhang, M.; Xie, H.; Hu, W.; Li, J.; Huang, Q.; Zhou, R. A vibration reduction method based on smooth voltage PWM control of switched reluctance machines. Energy Rep. 2022, 8 (Suppl. 5), 1398–1405. [Google Scholar] [CrossRef]
- Colaço, A.; Castanheira-Pinto, A.; Alves Costa, P.; Fernández, R. Combination of experimental measurements and numerical modelling for prediction of ground-borne vibrations induced by railway traffic. Constr. Build. Mater. 2022, 343, 127928. [Google Scholar] [CrossRef]
- Shi, Y.; Shen, J.; Guo, W.; Li, C.; Zheng, Y.; Zhao, Z.; Zhou, J.; Zhang, Y. The nonlinear dynamic characteristics analysis and vibration reduction control of the shafting system of a hydropower unit. Int. J. Non-Linear Mech. 2022, 146, 104166. [Google Scholar] [CrossRef]
- Olhoff, N.; Niu, B. Minimizing the vibrational response of a lightweight building by topology and volume optimization of a base plate for excitatory machinery. Struct. Multidiscip. Optim. 2015, 53, 567–588. [Google Scholar] [CrossRef]
- Skliros, C. A case study of vibration fault diagnosis applied at Rolls-Royce T-56 turboprop engine. Aviation 2019, 23, 78–82. [Google Scholar] [CrossRef]
- Pourjafar-Chelikdani, M.; Lavaf, A.; Taghilou, B.; Almasi, S.; Kowsar, S.; Najafi-Astmal, H.; Mahdavi Nejad, A.; Sadeghy, K. On the use of viscous micropumps for the transport of yield-stress liquids in microfluidic systems. J. Non-Newton. Fluid Mech. 2022, 308, 104894. [Google Scholar] [CrossRef]
- Zhang, Z.; Cao, S.; Wang, H.; Luo, X.; Deng, J.; Zhu, Y. The approach on reducing the pressure pulsation and vibration of seawater piston pump through integrating a group of accumulators. Ocean. Eng. 2019, 173, 319–330. [Google Scholar] [CrossRef]
- Shi, L.; Yuan, Y.; Jiao, H.; Tang, F.; Li, C.; Fan, Y.; Yan, J.; Jun, Z. Numerical investigation and experiment on pressure pulsation characteristics in a full tubular pump. Renew. Energy 2021, 163, 987–1000. [Google Scholar] [CrossRef]
- Satish, M.S.; Vilas, B.S. Weight optimization of valve for cost effectivities: Using Value Analysis. In Proceedings of the 2nd International Conference on Materials Manu-facturing and Design Engineering, Procedia Manufacturing 20, Aurangabad, India, 11–12 December 2017; Volume 20, pp. 329–337. [Google Scholar] [CrossRef]
- Zhang, Y.; Xia, Y. Analysis and optimization of the pilot stage of jet pipe servo valve. Alex. Eng. J. 2022, 61, 41–50. [Google Scholar] [CrossRef]
- Zong, C.; Shi, M.; Li, Q.; Liu, F.; Zhou, W.; Song, X. Design optimization of a nuclear main steam safety valve based on an E-AHF ensemble surrogate model. Nucl. Eng. Technol. 2022, 54, 4181–4194. [Google Scholar] [CrossRef]
- Hazem, K.A.; Jinghui, P.; Songjing, L. Analysis of pressure oscillation and structural parameters on the performance of deflector jet servo valve. Alex. Eng. J. 2023, 63, 675–692. [Google Scholar] [CrossRef]
- Hesham, A.; Jorge, P. Hydrodynamic self-excited vibrations in leaking spherical valves with annular seal. Alex. Eng. J. 2020, 59, 1515–1524. [Google Scholar] [CrossRef]
- Kollek, W. Fundamentals of Design, Modelling, Operation of Micro-Hydraulic Components and Systems; Publishing house of Wrocław University of Science and Technology: Wrocław, Poland, 2011; p. 249. ISBN 9788374936170. (In Polish) [Google Scholar]
- Stosiak, M.; Towarnicki, K.; Partyka, M.; Deptuła, A. Analysis of the Impact of Vibrations on a Micro-Hydraulic Valve by Sequence Graph Method. In Structural Integrity and Fatigue Failure Analysis. VCMF 2020. Structural Integrity; Lesiuk, G., Szata, M., Blazejewski, W., Jesus, A.M.D., Correia, J.A., Eds.; Springer: Cham, Switzerland, 2022; Volume 25, pp. 357–367. [Google Scholar] [CrossRef]
- Kudźma, Z.; Stosiak, M. Studies of flow and cavitation in hydraulic lift valve. Arch. Civ. Mech. Eng. 2015, 15, 951–961. [Google Scholar] [CrossRef]
- Kudźma, Z.; Stosiak, M. Experimental determination of the influence of mechanical vibrations on pressure courses in selected microhydraulic systems. In Basics of Design, Modeling and Operation of Microhydraulic Elements and Systems; Publishing house of Wrocław University of Science and Technology: Wrocław, Poland, 2011; pp. 156–187. (In Polish) [Google Scholar]
- Finnveden, S. Spectral finite element analysis of the vibration of straight fluid-filled pipes with flanges. J. Sound Vib. 1997, 199, 125–154. [Google Scholar] [CrossRef]
- Evans, P.R.; Blotter, D.J.; Spehens, G.A. Flow Rate Measurements Using Flow-Induced Pipe Vibration. J. Fluids Eng. 2004, 126, 280–285. [Google Scholar] [CrossRef]
- Dinardo, G.; Fabbiano, L.; Vacca, G.; Ekuakille, A.L. Vibrational signal processing for characterization of fluid flows in pipes. Measurement 2018, 113, 196–204. [Google Scholar] [CrossRef]
- Zhou, Y.; Liu, J.; Yan, J.; Zhu, T.; Guo, S.; Li, S.; Li, T. Standing Air Bubble-Based Mi-cro-Hydraulic Capacitors for Flow Stabilization in Syringe Pump-Driven Systems. Micromachines 2020, 11, 396. [Google Scholar] [CrossRef]
- Fu, J.; Che, G. Fusion fault diagnosis model for six-rotor UAVs based on conformal Fourier transform and improved self-organizing feature map. IEEE Access 2021, 9, 14422–14436. [Google Scholar] [CrossRef]
- Liu, M.; Wang, P.; Zhou, Q.; Kang, C. Remote fault diagnosis system for power transformer insulation based on RIA model. In Proceedings of the 2016 IEEE International Conference on High Voltage Engineering and Application (ICHVE), Chengdu, China, 19–22 September 2016; pp. 1–4. [Google Scholar] [CrossRef]
- Xia, D.; Wang, G.; Yang, J.; Zhang, Q.; Li, S. Local knowledge distance for rough approximation measure in multi-granularity spaces. Inf. Sci. 2022, 605, 413–432. [Google Scholar] [CrossRef]
- Dogan, A.; Birant, D. Machine learning and data mining in manufacturing. Expert Syst. Appl. 2021, 166, 114060. [Google Scholar] [CrossRef]
- Firmino, J.; Neto, J.; Oliveira, A. Misfire detection of an internal combustion engine based on vibration and acoustic analysis. J. Braz. Soc. Mech. Sci. Eng. 2021, 43, 1–12. [Google Scholar] [CrossRef]
- Rivera-Lopez, R.; Canul-Reich, J.; Mezura-Montes, E.; Cruz-Chávez, M.A. Induction of decision trees as classification models through metaheuristics. Swarm Evol. Comput. 2022, 69, 101006. [Google Scholar] [CrossRef]
- Deisenroth, M.; Aldo Faisal, A.; Soon Ong, C. Mathematics for Machine Learning; Cambridge University Press: Cambridge, MA, USA, 2020; p. 412. ISBN -10110845514X. [Google Scholar]
- Singh, N.; Jena, S.; Panigrahi, C. A novel application of Decision Tree classifier in solar irradiance prediction. Mater. Today Proc. 2022, 58, 316–323. [Google Scholar] [CrossRef]
- Cui, Y.; Shi, J.; Wang, Z. Analog circuit fault diagnosis based on Quantum Clustering based Multi-valued Quantum Fuzzification Decision Tree (QC-MQFDT). Measurement 2016, 93, 421–434. [Google Scholar] [CrossRef]
- Cui, Y.; Shi, J.; Wang, Z. Analog circuits fault diagnosis using multi-valued Fisher’s fuzzy decision tree (MFFDT). Int. J. Circuit Theory Appl. 2016, 44, 240–260. [Google Scholar] [CrossRef]
- Laghari, R.; Li, J.; Laghari, A. A Review on application of soft computing techniques in machining of particle reinforcement metal matrix composites. Arch. Comput. Methods Eng. 2020, 27, 1363–1377. [Google Scholar] [CrossRef]
- Liping, Z.; Na, G.; Zhibin, J.; Xiuxian, W. Multi-objective capacity allocation of hospital wards combining revenue and equity. Omega 2018, 81, 220–233. [Google Scholar] [CrossRef]
- Kothari, D.; Patel, M.; Sharma, A. Implementation of grey scale normalization in machine learning & artificial intelligence for bioinformatics using convolutional neural networks. In Proceedings of the 2021 6th International Conference on Inventive Computation Technologies (ICICT), Coimbatore, India, 20–22 January 2021; pp. 1071–1074. [Google Scholar] [CrossRef]
- Yan, M.; Fu, Y.; Zhang, X.; Yang, D.; Xu, L.; Kymer, J. Automatically classifying software changes via discriminative topic model: Supporting multi-category and cross-project. J. Syst. Softw. 2016, 113, 296–308. [Google Scholar] [CrossRef]
- Breiman, L.; Friedman, J.H.; Olshen, R.A.; Stone, C.J. Classification and Regression Trees; Wadsworth International Group: Fairview, TN, USA, 1984; p. 368. [Google Scholar] [CrossRef]
- Quinlan, R. C4.5: Programs for Machine Learning; Morgan Kaufmann Publishers: Burlington, MA, USA, 1993; p. 302. [Google Scholar] [CrossRef]
- Freund, Y.; Mason, L. The alternating decision tree learning algorithm. In Proceedings of the ICML ‘99: Proceedings of the Sixteenth International Conference on Machine Learning, Bled, Slovenia, 27–30 June 1999; pp. 124–133. [Google Scholar]
- Timofeev, R. Classification and Regression Trees (CART) Theory and Applications; CASE Humboldt University: Berlin, Germany, 2004; p. 40. [Google Scholar]
- Premarathne, P.; Premaratne, S. Using data mining techniques for investigating of performance in ICT subject at G.C.E Advanced Level. In Proceedings of the 18th International Conference on Advances in ICT for Emerging Regions (ICTer), Sri Lanka, Colombo, 26–29 September 2018; pp. 376–383. [Google Scholar] [CrossRef]
- Long, Y.; Zhu, F.; Shao, L.; Han, J. Face recognition with a small occluded training set using spatial and statistical pooling. Inf. Sci. 2018, 430–431, 634–644. [Google Scholar] [CrossRef]
- Tervonen, T.; Sepehr, A.; Kadziński, M. A multi-criteria inference approach for anti-desertification management. J. Environ. Manag. 2015, 162, 9–19. [Google Scholar] [CrossRef] [PubMed]
- Doumpos, M.; Zopounidis, C. Disaggregation Approaches for Multicriteria Classification: An Overview. In Preference Disaggregation in Multiple Criteria Decision Analysis. Multiple Criteria Decision Making; Matsatsinis, N., Grigoroudis, E., Eds.; Springer: Cham, Switzerland, 2018. [Google Scholar] [CrossRef]
- Osiński, P.; Deptuła, A.; Partyka, M.A. Hydraulic tests of the PZ0 gear micropump and the importance rank of its design and operating parameters. Energies 2022, 15, 3068. [Google Scholar] [CrossRef]
- Borgwardt, S.; Peñaloza, R. Reasoning in fuzzy description logics using automata. Fuzzy Sets Syst. 2016, 298, 22–43. [Google Scholar] [CrossRef]
- Chen, J.; Yu, W.; Zhang, Y.; Du, C. Design and implementation of universal configurable digital emulators. In Proceedings of the 2019 IEEE 8th Joint International Information Technology and Artificial Intelligence Conference (ITAIC), Chongqing, China, 24–26 May 2019; pp. 943–947. [Google Scholar] [CrossRef]
Disclaimer/Publisher’s Note: The statements, opinions and data contained in all publications are solely those of the individual author(s) and contributor(s) and not of MDPI and/or the editor(s). MDPI and/or the editor(s) disclaim responsibility for any injury to people or property resulting from any ideas, methods, instructions or products referred to in the content. |
© 2023 by the authors. Licensee MDPI, Basel, Switzerland. This article is an open access article distributed under the terms and conditions of the Creative Commons Attribution (CC BY) license (https://creativecommons.org/licenses/by/4.0/).